Temi dell’intervento Innovazione - arti.puglia.it · RETI DI LABORATORI PUBBLICI DELLA REGIONE...
22
12/3/12 1 Alessandro Muscio - Università degli Studi di Foggia [email protected] RETI DI LABORATORI PUBBLICI DELLA REGIONE PUGLIA Attività di accompagnamento e seminariali rivolte ai ricercatori delle Reti Bari e Lecce 29 Febbraio – 1 Marzo 2012 Innovazione universitaria e valorizzazione economica della ricerca e proprietà intellettuale 1 Temi dell’intervento 2 1. Valorizzazione economica della ricerca 1. L’appropriabilità 1. best practice e casistica 2. Proprietà intellettuale e brevetti 1. caratteristiche del brevetto e casistica 3. Riflessioni sull’innovazione universitaria 1. Innovazione e proprietà intellettuale nelle università I cambiamenti dell’innovazione Forte aumento della loro rilevanza (investimenti?) Come fattore di crescita Come oggetto di policy Nuove sfide nel comportamento strategico dei ricercatori Linear model vs. chain- linked model Radical vs. incremental innovations Technology push vs. demand-pull 3 Ricerca e innovazione L’ economia dell’innovazione Modelli di innovazione 4 Linear model Chain-Linked model Quale modello per la valorizzazione della ricerca? World War II - US Vision: “science, the endless frontier” vision for government- funded science and engineering that would unite academia-industry- army “Out of the dusty labs” Vanishing separation between R&D Less vertical integration, networks Researchers are not isolated any longer
Transcript of Temi dell’intervento Innovazione - arti.puglia.it · RETI DI LABORATORI PUBBLICI DELLA REGIONE...

12/3/12
1
Alessandro Muscio - Università degli Studi di Foggia [email protected] RETI DI LABORATORI PUBBLICI DELLA REGIONE PUGLIA Attività di accompagnamento e seminariali rivolte ai ricercatori delle Reti Bari e Lecce
29 Febbraio – 1 Marzo 2012
Innovazione universitaria e valorizzazione
economica della ricerca e proprietà
intellettuale
1
Temi dell’intervento 2
1. Valorizzazione economica della ricerca
1. L’appropriabilità 1. best practice e casistica
2. Proprietà intellettuale e brevetti 1. caratteristiche del brevetto e casistica
3. Riflessioni sull’innovazione universitaria 1. Innovazione e proprietà intellettuale
nelle università
I cambiamenti dell’innovazione
¨ Forte aumento della loro rilevanza ¤ (investimenti?) ¤ Come fattore di
crescita ¤ Come oggetto di
policy
¨ Nuove sfide nel comportamento strategico dei ricercatori ¤ Linear model vs. chain-
linked model ¤ Radical vs. incremental
innovations ¤ Technology push vs.
demand-pull
3
Ricerca e innovazione L’ economia dell’innovazione
Modelli di innovazione 4
¨ Linear model
¨ Chain-Linked model
Quale modello per la valorizzazione della ricerca?
World War II - US Vision: “science, the endless frontier” vision for government-funded science and engineering that would unite academia-industry-army
“Out of the dusty labs” Vanishing separation between R&D Less vertical integration, networks Researchers are not isolated any longer

12/3/12
2
Radical vs. incremental innovations
¤ Improvements of a product/process/service with respect to actual models
¤ Focused on new technologies/business models n Completely new with
respect to actual models ¤ They create new sectors/
segments ¤ They are recorded better
n They overshadow the magnitude of incremental innovations
5
Incremental innovations Radical innovations
Come appropriarsi dei risultati?
Esempi di innovazioni radicali dall’appropriabilità limitata
6
¨ Lattina ¤ RC Cola vs. Coca Cola e Pepsi Cola
¨ Calcolatrice ¤ Bowmar vs. Texas Instruments
¨ PC ¤ Texas Instruments vs. IBM
Technology push vs. demand pull
¨ Technology push innovations ¤ generated by
advancements in telecommunications, medical sciences, etc.
¨ Demand pull innovations ¤ developed to respond
to explicit requests of the consumers
¨ Not many innovations are purely TP or DP ¤ Penicillin (Alexander Fleming) – TP
n Discovered accidentally leaving open a petri dish containing Staphylococcus plate culture, which was contaminated by blue-green mould
n The development of penicillin for use as a medicine is attributed to H.W. Florey, E. Chain and N. Heatley
¤ DDT (Paul Muller) – TP n Discovered accidentally searching for a means of protecting wool clothes against moths
¤ MP3 (Fraunhofer Institute) – TP o DP? n However, online music stores are born because of the creation of the MP3 format
7
Come capire le opportunità di mercato?
Innovazioni indotte e demand pull
n BABBAGE n Science and technology n Feb 10th 2012
¨ MP3: at the time it was born, most people downloaded data at dial-up speeds ¤ Using such telephone modems, downloading the uncompressed contents of a CD and converting them in
MP3 format took the best part of a day n The trade off—a more muffled sound with limited dynamic range—was considered acceptable
¤ But things have changed n Three out of four American households now have broadband connections to the internet n Storage space is no longer a precious commodity
¤ Why bother compressing music files with a lossy codec like MP3? n “masterizzato per iTunes”!
8

12/3/12
3
9
¨ Alcune innovazioni sono intrinsicamente appropriabili ¤ Dipendono da processi di learning-by-doing molto
lunghi e da conoscenza non codificata n Es. Artigianato (I vetri di Murano…)
¨ Altre non lo sono ¤ Dipendono da conoscenza codificata ed esplicita ¤ La loro proprietà intellettuale va protetta ¤ Va garantita l’appropriabilità dei risultati
L’appropriabilità 10
a. The appropriability problem b. Strategic appropriation tools
a. Secrecy b. Lead-time c. Complementary assets
c. The Technological Posture: First-mover or follower?
Fonte: Aldo Geuna - Università di Torino (course material)
a) The appropriability problem 11
¨ Key problem of strategic management: ¤ due to imitation threat, how to reap (appropriate) the economic
returns from innovation? ¨ Key policy problem:
¤ how to avoid that firms will refrain from innovating, because of fear of imitation? (market failure)
¨ 3 classes of solutions (they are complementary …..partially) 1. Mechanisms of strategic appropriation 2. Norms on the intellectual property: patents, copyrights, marks /
direct attack to the problem of the appropriability 3. Government intervention for the production of public goods:
benefits to firms R&D, public research, government orders…
Fonte: Aldo Geuna - Università di Torino (course material)
b) I meccanismi di appropriazione strategica
12
1. Secrecy 2. Lead-time 3. Complementary assets
¤ Continuous innovation ¤ Provision of additional services ¤ Productive capacity ¤ etc...
¨ Più facile per beni basati sulla conoscenza tacita…
Fonte: Aldo Geuna - Università di Torino (course material)

12/3/12
4
- Secrecy: Mansfield’s findings on leak-outs
13
Fonte: Mansfield E. (1985), How Rapidly Does New Industrial Technology Leak Out? The Journal of Industrial Economics 34, 217.
The CEOs of 100 US firms were asked to provide an estimate of the average length of time before technological information is in the hands of at least some of its rivals.
- Lead-time 14
¨ It exploits the existence of “natural delays of imitation”, due to: ¨ Lack of attention
¤ recent innovations go unnoticed and early attempts of acquisition of information on them tend to fail → necessity of visible/acclaimed success
¤ It is especially true for smaller, yet-to-be-known firms (large, successful ones are monitored by press and rivals)
¨ Scale of imitation ¤ full imitation is unlikely (profit for the first on the market) because of
n knowledge necessary to the innovative process is lost when the innovation is reached → the imitator has to rebuild it (reverse engineering allow one to know what are the component not why they have been designed in that way)
n imitation requires costly research (less costly than research-for-innovation, but still increasing with sophistication of innovation to be imitated)
Fonte: Aldo Geuna - Università di Torino (course material)
- Lead-time 15
¨ Know-how ¤ tacit knowledge for achieving the innovative idea (limits
to the disclosure also through the patent) and tacit knowledge for the realization of the innovative idea n the importance of the market for specialists (contractual
regulation not to accept offers from competitors)
Fonte: Aldo Geuna - Università di Torino (course material)
c) Complementary assets 16
¨ LEADERSHIP ¤ Reputation: effects on consumers/users/financiers
n Can be turned into “brand” by trademark claims ¤ Continuous innovation: flow of incremental innovation; it
exploits cumulativeness of the knowledge ¤ Learning curve
¨ STATIC BARRIERS TO ENTRY ¤ Indivisibilities and economies of scale (minimum best scale) in
manufacturing ¤ Managerial know-how and knowledge of the market ¤ Channels of distribution
Fonte: Aldo Geuna - Università di Torino (course material)

12/3/12
5
3) The Technological Posture First-mover or follower?
17
inno
vativ
enes
s (tim
e at
whi
ch u
ser a
dopt
s)
number of standard deviations from average adoption time
innovators (2.5%)
early adopters (13.5%)
early majority (34%)
late majority (34%) laggards
(16%)
First-Mover Advantages and Disadvantages 18
¨ Being a first mover can confer the advantages of: ¤ Brand loyalty and technological leadership (i.e. IPOD) ¤ Preemption of scarce assets (i.e. ……) ¤ Exploiting buyer switching costs (i.e. Lock-in - QWERTY) ¤ Reaping increasing returns advantages (i.e. Intel-IBM)
¨ However, first movers often bear disadvantages also: ¤ High R&D expenses ¤ Immature enabling technologies and complements (i.e. fuel cell vehicles)
¤ Uncertainty of customer requirements ¤ Undeveloped supply and distribution channels
Fonte: Aldo Geuna - Università di Torino (course material)
Factors Influencing Optimal Timing of Entry 19
1. How certain are customer preferences? n If customer needs are well understood, it is more feasible to enter
the market earlier
2. How much improvement does the innovation provide over previous solutions?
n An innovation that offers a dramatic improvement over previous generations will accrue more rapid customer acceptance (i.e. combinatorial chemistry)
3. Does the innovation require enabling technologies, and are these technologies sufficiently mature?
n If the innovation requires enabling technologies (such as long-lasting batteries for cell phones), the maturity of these technologies will influence optimal timing of entry.
Fonte: Aldo Geuna - Università di Torino (course material)
Factors Influencing Optimal Timing of Entry 20
4. Do complementary goods influence the value of the innovation, and are they sufficiently available?
n Not all innovations require complementary goods, but for those that do (e.g., games for video consoles, widgets for cell phones), availability of complements will influence customer acceptance
5. How high is the threat of competitive entry? n If there are significant entry barriers, then may be less need to rush
to market to build increasing returns ahead of others
6. Are there increasing returns to adoption? n e.g. operative systems, videogame consoles n If so, allowing competitors to get a head start can be very risky
Fonte: Aldo Geuna - Università di Torino (course material)

12/3/12
6
Factors Influencing Optimal Timing of Entry 21
7. Can the firm withstand early losses? n The first mover bears the bulk of R&D expenses and may endure a
significant period without revenues; the earlier a firm enters, the more capital resources it may need
8. Does the firm have resources to accelerate market acceptance?
n Firms with significant capital resources can invest in aggressive marketing and supplier and distributor development, increasing the rate of early adoption.
9. Is the firm’s reputation likely to reduce the uncertainty of customers, suppliers, and distributors?
n Innovations from well-respected firms may be adopted more rapidly, enabling earlier successful entry.
Fonte: Aldo Geuna - Università di Torino (course material)
Do great ideas generate pots of money? 22
Value captured
Value created (through “raw” invention)
Nylon
Xerox (early)
Xerox (late) Apple 1
Coca Cola
Wal Mart Virgin mobile
RC Cola
Apple 2
Apple iPhone
Dell
Le fusioni fra HD makers
¨ Over 200 companies were hard disk drive manufacturers at one timeesides competing on features such as data density and latencies
¨ Most of that industry has been reduced to five strong vendors through bankruptcy and acquisition
¨ These vendors are: ¤ WD 30% ¤ Seagate 20% ¤ Hitachi 19%
n (acquired by WD)
¤ Toshiba 17% ¤ Samsung 14%
n (acquired by Seagate)
23
Fonte: http://en.wikipedia.org/wiki/List_of_defunct_hard_disk_manufacturers
First-Mover disadvantages 24
¨ Il caso del PDA: grandi prospettive ¤ Star trek (1966)
¨ Forrester research (1993) n vendite record annunciate
n 298.000 unità in 1 anno n 4m in 3 anni
¤ Ingresso di grandi player nel mercato n PSION, Amstrad, Sharp, Apple, HP, Motorola, Palm
¤ 1994: decretato l’anno della “penna elettronica”!
Fonte foto: http://myapplenewton.blogspot.com/2009/11/computer-chronicles-1993-pda-review.html
12/3/12
7
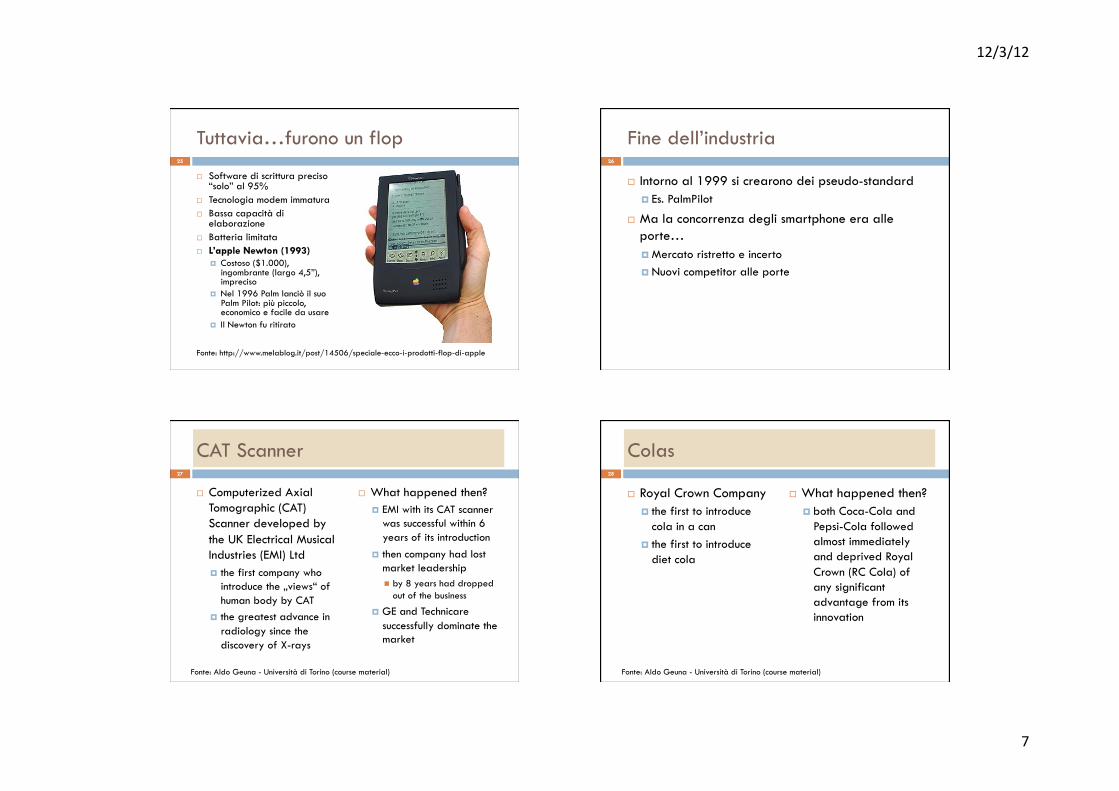
Tuttavia…furono un flop
¨ Software di scrittura preciso “solo” al 95%
¨ Tecnologia modem immatura ¨ Bassa capacità di
elaborazione ¨ Batteria limitata ¨ L’apple Newton (1993)
¤ Costoso ($1.000), ingombrante (largo 4,5”), impreciso
¤ Nel 1996 Palm lanciò il suo Palm Pilot: più piccolo, economico e facile da usare
¤ Il Newton fu ritirato
25
Fonte: http://www.melablog.it/post/14506/speciale-ecco-i-prodotti-flop-di-apple
Fine dell’industria 26
¨ Intorno al 1999 si crearono dei pseudo-standard ¤ Es. PalmPilot
¨ Ma la concorrenza degli smartphone era alle porte… ¤ Mercato ristretto e incerto ¤ Nuovi competitor alle porte
CAT Scanner
¨ Computerized Axial Tomographic (CAT) Scanner developed by the UK Electrical Musical Industries (EMI) Ltd ¤ the first company who
introduce the „views“ of human body by CAT
¤ the greatest advance in radiology since the discovery of X-rays
¨ What happened then? ¤ EMI with its CAT scanner
was successful within 6 years of its introduction
¤ then company had lost market leadership n by 8 years had dropped
out of the business
¤ GE and Technicare successfully dominate the market
27
Fonte: Aldo Geuna - Università di Torino (course material)
Colas
¨ Royal Crown Company ¤ the first to introduce
cola in a can ¤ the first to introduce
diet cola
¨ What happened then? ¤ both Coca-Cola and
Pepsi-Cola followed almost immediately and deprived Royal Crown (RC Cola) of any significant advantage from its innovation
28
Fonte: Aldo Geuna - Università di Torino (course material)
12/3/12
8
Stylos
¨ Reynolds and Eversharp ¤ The first to introduce
the ballpoint pen in the US in 1945 and 1946, respectively
¨ What happened then ? ¤ The pioneers
disappeared when the fad first ended in the late 1940s
¤ Parker entered 8 years later
¤ Bic entered last and sold pens as cheap disposables
29
Fonte: Aldo Geuna - Università di Torino (course material)
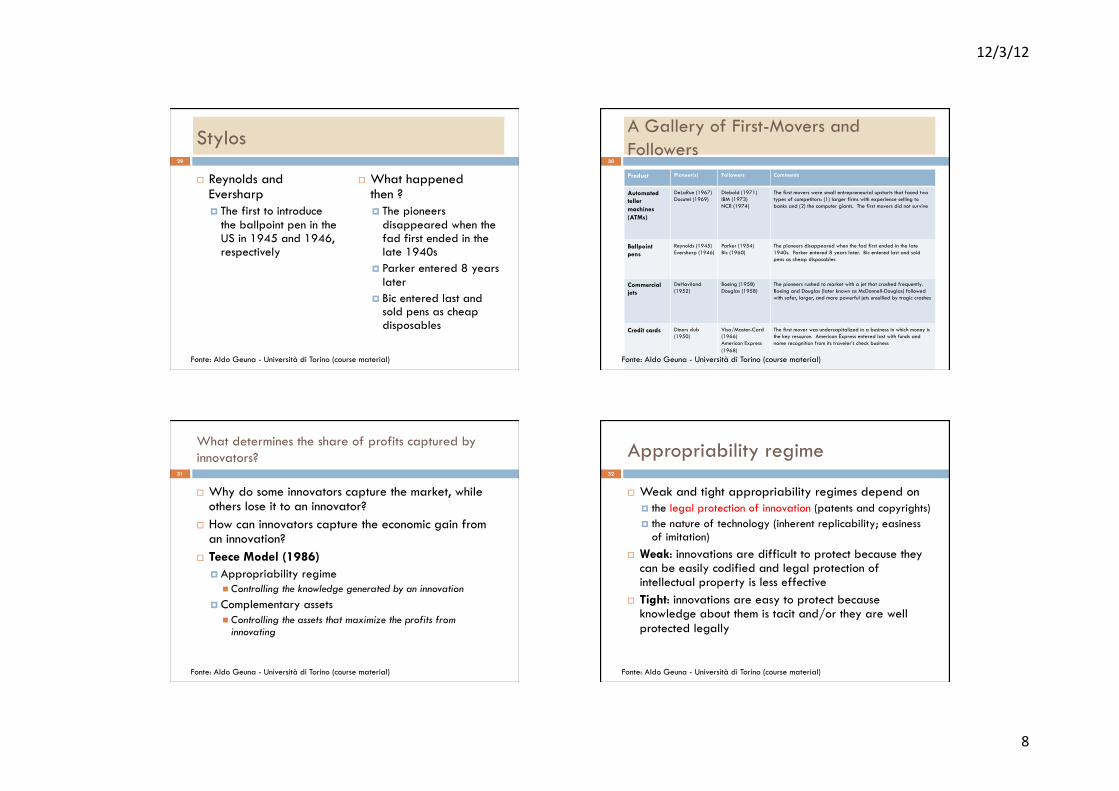
A Gallery of First-Movers and Followers
30
Product Pioneer(s) Followers Comments
Automated teller machines (ATMs)
DeLaRue (1967) Docutel (1969)
Diebold (1971) IBM (1973) NCR (1974)
The first movers were small entrepreneurial upstarts that faced two types of competitors: (1) larger firms with experience selling to banks and (2) the computer giants. The first movers did not survive
Ballpoint pens
Reynolds (1945) Eversharp (1946)
Parker (1954) Bic (1960)
The pioneers disappeared when the fad first ended in the late 1940s. Parker entered 8 years later. Bic entered last and sold pens as cheap disposables
Commercial jets
DeHaviland (1952)
Boeing (1958) Douglas (1958)
The pioneers rushed to market with a jet that crashed frequently. Boeing and Douglas (later known as McDonnell-Douglas) followed with safer, larger, and more powerful jets unsullied by tragic crashes
Credit cards
Diners club (1950)
Visa/Master-Card (1966) American Express (1968)
The first mover was undercapitalized in a business in which money is the key resource. American Express entered last with funds and name recognition from its traveler’s check business
Light beer
Rheingold’s and Gablinger’s (1968) Meister Brau Lite (1967)
Miller Lite (1975) Coors light (1978) Bud light (1982)
The first movers entered 9 years before Miller and 16 years before Budweiser, but financial problems drove both out of business. Marketing and distribution determined the outcome. Costly legal battles, again requiring access to capital, were commonplace
Fonte: Aldo Geuna - Università di Torino (course material)
What determines the share of profits captured by innovators?
31
¨ Why do some innovators capture the market, while others lose it to an innovator?
¨ How can innovators capture the economic gain from an innovation?
¨ Teece Model (1986) ¤ Appropriability regime
n Controlling the knowledge generated by an innovation ¤ Complementary assets
n Controlling the assets that maximize the profits from innovating
Fonte: Aldo Geuna - Università di Torino (course material)
Appropriability regime 32
¨ Weak and tight appropriability regimes depend on ¤ the legal protection of innovation (patents and copyrights) ¤ the nature of technology (inherent replicability; easiness
of imitation) ¨ Weak: innovations are difficult to protect because they
can be easily codified and legal protection of intellectual property is less effective
¨ Tight: innovations are easy to protect because knowledge about them is tacit and/or they are well protected legally
Fonte: Aldo Geuna - Università di Torino (course material)

12/3/12
9
33
¨ Gillette ‘Mach 3’ razor is a first-to market product developed at a very high cost
¨ A UK supermarket chain was quickly able to produce a good copy at a fraction of the original cost
¨ Gillette have been more dependent therefore on expensive television advertising to protect sales of their product
¨ When products are easy to copy, competitors can ‘leapfrog’ original features and Wilkinson Sword Company have now introduced a 4 blade razor
Gilette
Fonte: Aldo Geuna - Università di Torino (course material)
34
¨ Tetley is a market leader and the originator of the round teabag
¨ Advertising was based around a better cup of tea that would result from bags where the tea could circulate better
¨ Knew that competitors would try and copy
¨ Hired consultants to develop a new manufacturing line for round teabags
¨ When new product was introduced competitors were unable to obtain similar manufacturing equipment and Tetley maintained its lead
Tetley’s teabags
Fonte: Aldo Geuna - Università di Torino (course material)
Effectiveness of appropriability mechanisms in four industries
35
Fonte: Aldo Geuna - Università di Torino (course material)
Effectiveness of Product Patents by Industry
36

12/3/12
10
Teece Model 37
Weak
Tight
Freely available or unimportant
Tightly held and important
Complementary assets
App
ropr
iabi
lity Difficult to make
money
Holder of complementary
assets
Inventor Inventor or party with bargaining
power
I II
IV III
Coca Cola and Pepsi were able to profit from RC Cola’s innovations because they had brand name reputation and distribution channels that RC did not.
Pixar’s interaction with Disney. The imitability of some of its digital studio technology is low, given the copyrights it holds on its software. BUT….
The owner of the Stradivarius profited since no one could imitate it and complementary assets for it were neither difficult to acquire nor important.
EMI invented and first commercialized the CAT scan but it was easy to imitate and the firm did not have complementary assets (distribution channels and relations with U.S. hospital, ecc.).
Fonte: Aldo Geuna - Università di Torino (course material)
I BREVETTI: PERFORMANCE INNOVATIVA E “PATENT EXPLOSION”
Advantages of patent indicators (at firm level)
39
¨ Data collected in a regular way and available for long time series (for the US since mid 1800)
¨ Very detailed technological classification
¨ Very detailed set of information available (technologies, date, companies, inventors etc.)
¨ Measure innovative activity of SMEs (innovation by production, design and not formalized research – NO LAB)
¨ World coverage and international comparability
¨ Data regularly updated
¨ “Easy” to handled once name standardization is done (BUT see also large number of service providers now available)
Fonte: Aldo Geuna - Università di Torino (course material)
Limitations of patent indicators (at firm level)
40
¨ Record of invention and not innovation ¨ Different values, with large number without very
little value ¨ Difficulty in classifying them according with
industrial classification ¤ This could also be a plus: by relating technologies with
industrial activities we could get information of the synergy, which could explain patterns of diversification to achieve technologies of scope
Fonte: Aldo Geuna - Università di Torino (course material)

12/3/12
11
Limitations of patent indicators (at firm level)
41
¨ Different propensities to patent across sectors, firms, technologies and countries (Limited patent activity in Developing Countries)
¨ Country differences in IPR regulation ¤ First to invent (USPTO) versus first to file (EPO)
¨ Strategic patenting (40% not used for industrial or commercial purposed e.g. 19 % blocking patents)
Fonte: Aldo Geuna - Università di Torino (course material)
L’attività brevettuale: trend e livelli 42
7
1. Introduction
Patenting experienced a sizeable boom in the last decade. More than 850 000 patent applications were filed in Europe, Japan and the United States in 2002, against about 600 000 in 1992. These figures reflect the growing importance of patents in the economy. Business and public research increasingly use patents to protect their inventions, and fostering this trend has been the objective of patent policy in OECD countries over the past two decades, with a view to encouraging investments in innovation and fostering the dissemination of knowledge. To what extent has this been the case? What particular aspects of patent policy in OECD countries can be seen as successful in this regard, or have there been mainly failures? These questions are central to this report.
Figure 1. Patent filings at EPO, USPTO and JPO1 Filing years: 1982-2002
0
50,000
100,000
150,000
200,000
250,000
300,000
350,000
400,000
1982 1983 1984 1985 1986 1987 1988 1989 1990 1991 1992 1993 1994 1995 1996 1997 1998 1999 2000 2001 20020
500,000
1,000,000
1,500,000
2,000,000
2,500,000
3,000,000
3,500,000
4,000,000
EPO filings
USPTO filings
JPO filings
EPO and USPTO filings: Total number of applications JPO filings: Total number of claims
1. EPO and USPTO filings correspond to total number of applications. JPO filings correspond to total number of claims (number of claims per application multiplied by total number of applications) to account for the effect of the 1988 law reform allowing more than one claim per patent application at JPO. Source: OECD Patent Database and USPTO, EPO and JPO Annual reports. JPO figures for 2001 and 2002 are OECD estimates.
Growth in patenting corresponds to a new organisation of research that is less centred on the individual firm and more based on knowledge networks and markets: innovation processes throughout the OECD area have become increasingly competitive, co-operative, globalised, and more reliant on new entrants and technology-based firms. Market mechanisms play a more central role in technology diffusion. Businesses have been demanding more and more patents to accommodate these new conditions.
At the same time, patent regimes themselves have experienced major changes that have encouraged an increase in patenting. Not only have new types of inventions – software, genetic, and business methods – been deemed patentable by some patent offices, but the ability of patent holders to protect and enforce their rights has also increased, leading many to call the past two decades a pro-patent policy era. There is little doubt that many of these policy changes have helped the patent system to cope with changes in innovation systems by attracting more private-sector funding for R&D and supporting the development of markets for technology to help diffuse patented knowledge. In that
Fonte: OECD (2004), Patents and innovation: trends and policy challenges, Paris.
“Patent explosion”!
Ragioni della patent explosion: 1) aumento dei brevetti universitari
43
percentage of USPTO patents) as listed in the yearly reports of the Association of
University Technology Managers (AUTM, 2008); the diamonds (Ƈ) indicate this
percentage as measured by searching with the word “university” in the field of the
assignees among the patents issued during the period 1977-2007. Wong & Singh (2007)
provided numbers for university patenting in the USPTO database (Ɣ ; all universities).
0.0
0.5
1.0
1.5
2.0
2.5
1978 1983 1988 1993 1998 2003 2008
Percentage
Figure 1: University patenting (1978-2008) as a percentage of patenting in the USPTO database. (Sources: Ŷ AUTM, 2008; Ƈ online search at http://www.uspto.gov, 15 January 2009; Ɣ Wong & Singh (2007).)
The three lines match in terms of the trends. As noted, our searches with “university” as
word in the names of the applicants underestimate the total numbers and the line is
therefore the lowest one. Wong & Singh (2007), however, excluded the University of
California from their data because it is not possible to distinguish between the eleven
campuses of this university in terms of the patent registrations. The AUTM data is
7
Fonte: Leydesdorff L. & Meyer M. (2010). The decline of university patenting and the end of the Bayh–Dole effect. Scientometrics 83(2) 355-362
Non solo negli USA…
44
¨ The variety of things that can be patented has increased and now includes: ¤ Genetically-engineered organisms
n 1980 - Diamond v. Chakrabarty
¤ Computer software n 1981 - Diamond v. Diehr
¤ Business methods n 1998 - State Street Bank & Trust Cie v. Signature
Fonte: Aldo Geuna - Università di Torino (course material)
Ragioni della patent explosion: 2) “Subject matter expansion”

12/3/12
12
Ragioni della patent explosion: 2) “Subject matter expansion”
45
Biotech patents
Business methods and software patents
Fonte: Aldo Geuna - Università di Torino (course material)
Ragioni della patent explosion: 3) cause di patent infringment
¨ USA, 1982: abolizione della Court of Customs and Patent Appeals (CCPA) e attribuzione dei suoi poteri alla Court of Appeals for the Federal Circuit (CAFC) ¤ Maggior difesa da
patent infringments n Maggior ricorso alla
protezione… n Patent trolls…
46
Ragioni della patent explosion: 4) diminuzione dello “inventive step”
47
¨ Particularly true in “software and process patents” where record of prior art is minimal ¤ E.g. Amazon's 1-Click Patent (US Patent 5,960,411)
n In 1999, Amazon was granted a patent entitled Method and System for Placing a Purchase Order Via a Communications Network.
n Just 23 days later, it filed a lawsuit against Barnesandnoble.com
n In 2007, however, USPTO examiner rejected 1-Click claims as "Obvious"
Fonte: Aldo Geuna - Università di Torino (course material)
¨ Evergreening–when patent owners attempt to extend the patent monopoly by seeking a new patent that “updates” the first one before its expiration ¤ E.g. AstraZeneca's Nexium is a slight chemical variant of
Prilosec
¨ 40% not used for industrial or commercial purposed ¤ E.g. 19 % blocking patents
48
Why such increase? 5) aumento del loro uso strategico
Fonte: Aldo Geuna - Università di Torino (course material)

12/3/12
13
I BREVETTI: DEFINIZIONE E CARATTERISTICHE
Ho un’innovazione: come la proteggo dal mercato?
50
¨ La proprietà intellettuale ¤ Oggetto: tutte le creazioni intellettuali ¤ Strumenti di protezione: patent e copyright
Definizione di brevetto 51
¨ Titolo giuridico in forza al quale viene conferito un monopolio temporaneo di sfruttamento dell'invenzione in un territorio e per un periodo determinato al fine di impedire ad altri di produrre, vendere o utilizzare la propria invenzione senza autorizzazione ¤ Per invenzioni si intende una soluzione nuova ed
originale di un problema tecnico ¤ Essa può riguardare un prodotto o un processo
(metodo, procedimento)
Invention Innovation Diffusion
52
¨ L'esistenza dei brevetti viene giustificata dal fatto che, grazie ai diritti di sfruttamento economico esclusivo, viene stimolata la produzione di nuove invenzioni, che diventeranno poi di pubblico dominio allo scadere del brevetto ¤ Risolve un problema di fallimento di mercato
¨ Primato europeo nella legislazione sul brevetto: ¤ In una parte del Senato veneziano del 19 marzo 1474 ¤ La legislazione fu promulgata per attirare scienziati a
Venezia

12/3/12
14
Diritto di sfruttamento 53
¨ Diritto di sfruttamento in esclusiva limitato: ¤ PORTATA (scope)
n Ampiezza (breadth): impiego limitato alle applicazioni per cui è stata rivendicata l’idea
n Larghezza (width): estensione limitata ai paesi per cui è espressamente richiesta
n Altezza (height): grado di innovatività minimo richiesto n Durata (duration): durata massima e rinnovi periodici
54
¨ Cessione: il titolare si spoglia del diritto di brevetto a favore di un altro soggetto ¨ I diritti possono essere ceduti a terzi, nel caso per esempio
l'inventore non abbia le capacità industriali per poter sfruttare adeguatamente la sua invenzione
¨ Licenza: il titolare del brevetto autorizza un terzo ad utilizzare l’innovazione
Fonti 55
¨ Database gratuiti accessibili online: ¤ http://ep.espacenet.com ¤ www.uspto.gov ¤ http://www.wipo.int/pctdb/en/index.jsp
¨ Strumenti di ricerca avanzati a pagamento: ¤ www.delphion.com
Fonte: Franzoni & Scellato, DISPEA – Politecnico di Torino
Proprietà intellettuale e diritto d’autore 56
¨ Proprietà intellettuale e diritto d’autore offrono forme di tutela distinte ¤ Questa distinzione è valida solo in principio ¤ Vistose eccezioni
n Software: inizialmente protetto solo da diritti d’autore (direttiva 91/250/CEE 14 Maggio 1991)
n Basati su idee astratte che non offrono soluzioni concrete a problemi di natura tecnica
n In realtà fu protetto dai diritti d’autore perché al tempo non se ne sapeva molto del loro funzionamento
n Il diritto d’autore non tutelava la funzionalità ma solo il modo in cui l’algoritmo era scritto (piccole variazioni dell’algoritmo => nuovo prodotto soggetto a diritto!)

12/3/12
15
Proprietà intellettuale e diritto d’autore
¨ Build a better mouse trap and the world will beat a path to your door! ¤ Here is a better mouse trap,
at least according to the disclosure contained in the patent
¤ The last patent issued with the words “mouse trap” in the title issued in May of 2007
¤ A search of the USPTO online database shows that since 1976 some 44 patents have been granted with the term “mouse trap” in the title
57
Fonte: http://www.ipwatchdog.com/2008/03/28/obscure-patent-mouse-trap/id=139/
Trap for a mouse US Patent No. 6,655,077 Issued December 2, 2003 (!!!)
Le caratteristiche “notevoli” del brevetti
58
¨ È concesso solo alla prima innovazione ¤ riduce il ritardo nella divulgazione
¨ Può essere richiesto solo con il consenso dell’inventore, che in ogni caso mantiene la paternità dell’invenzione
¨ Non attribuisce un premio alla scoperta, se non la concessione dell’esclusiva temporanea ¤ il premio è condizionale al gradimento del mercato: scoraggia innovazioni inutili
¨ Il titolare del brevetto può utilizzarlo direttamente, venderlo o concederlo in licenza con o senza esclusiva ¤ (consente il trasferimento a soggetti più efficienti e agevola la diffusione prima della
scadenza ¨ È concesso solo a condizione di fornire una spiegazione dettagliata dell’innovazione
(disclosure), tale da consentire ad un esperto la replica ¤ minimizza i tempi/costi di duplicazione alla scadenza
¨ Non è gratuito e richiede il pagamento di tasse annuali ¤ (scoraggia la protezione di innovazioni senza valore
Fonte: Franzoni & Scellato, DISPEA – Politecnico di Torino
59
Termine Significato
Inventor colui che rivendica la paternità dell’idea innovativa
Applicant è il soggetto che richiede il rilascio del brevetto. Se la richiesta viene accolta, diventa, l’assignee (assegnatario)
Attorney procuratore
Patent application richiesta di brevetto (non necessariamente concesso) data e paese di domanda
Priority application diritto di anteriorità garantito alla prima invenzione - nasce al momento dell’invenzione (priority date) data e paese di priorità
Patent (Granted) brevetto (concesso)
Publication data e paese di pubblicazione
Grant of patent data e paese di assegnazione
Technological classification Sistema di classificazione
Infringment violazione del diritto di esclusiva dell’assegnatario durante il periodo di validità del brevetto
Search report citazioni
Classificazione tecnologica EPO 60
¨ International Patent Classification (IPC) ¤ The IPC divides technology into 8 sections with approx.
70,000 subdivisions n Each subdivision has a symbol consisting of Arabic numerals
and letters of the Latin alphabet
¤ Hierarchical Structure: Sections – 1st level (A-H), Classes – 2nd level Subclasses (A01-…) – 3rd level Main groups – 4th level Subgroups – 5th and lower levels
Fonte: http://www.wipo.int/classifications/ipc/en/general/preface.html

12/3/12
16
International patent classification 61
Fonte: http://www.wipo.int/ipcpub/#refresh=page
Il brevetto EPO 62
¨ Durata: ¤ 20 anni al massimo, a decorrere dalla data di deposito dell’application
(include il periodo della procedura) ¨ Rinnovo:
¤ annuale, dal momento dell’assegnazione del brevetto per ciascuno stato indicato inizialmente
¨ Costo dell’application: ¤ 1.800 € circa (base) + 150 € circa nel paese d’origine (equivale più o
meno al costo di 3 brevetti in altrettanti paesi membri). Coprire 8 paesi per 10 anni costa circa 30.000 €
¨ Validità: ¤ consente l’opposizione all’infringment (incluso importazioni parallele) in
tutti i paesi che aderiscono all’EPO indicati nell’application (al massimo 27 stati membri + altri stati che riconoscono la convenzione)
Fonte: Franzoni & Scellato, DISPEA – Politecnico di Torino
Tempistica 63
20 anni
Termine per estensione internazionale
18 mesi
Pubblicazione della domanda
N mesi
Esame della domanda
Concessione del brevetto
Annual fee
3 mesi
Domanda di opposizione
12 mesi
Durata massima del brevetto
Procedure di opposizione
Requisiti 64
¨ La protezione brevettuale è consentita solo a ciò che soddisfa 3 requisiti: ¤ 1) Invenzione (include il requisito di industrialità) ¤ 2) Novità ¤ 3) Inventive Step (non-banalità)
¨ Il difetto di uno solo dei requisiti è motivo di rigetto della richiesta di brevetto
Fonte: Franzoni & Scellato, DISPEA – Politecnico di Torino

12/3/12
17
1) Invenzione 65
¨ Un’invenzione può essere sia un prodotto che un metodo o una procedura ¤ La “European Patent Convention” non fornisce una definizione di invenzione, ma un elenco
di ciò che non può essere considerato tale ¨ Non sono in alcun caso invenzioni:
¤ Tutte le applicazioni non “industriali”, cioè per le quali non è chiaro un impiego diretto (es. principi scientifici)
¤ I metodi matematici e programmi per computer (software) n per poter ottemperare ai requisiti di brevettabilità vi deve necessariamente essere un Ulteriore
Effetto Tecnico che va oltre la normale interazione del software con gli elementi e i dispositivi hardware
¤ le creazioni estetiche (arte) ¤ I trattamenti chirurgici o le terapie su corpo umano o animale
n non riguarda i macchinari o i composti utilizzati per i trattamenti n non riguarda i trattamenti operati su organi, parti o tessuti rimossi definitivamente dal corpo
dell’uomo o animale
¤ Le varietà di piante o animali n Non riguarda I processi microbiologici e i microrganismi, ad esempio quelli creati con l’ingegneria
genetica
Fonte: Franzoni & Scellato, DISPEA – Politecnico di Torino
2) Novità 66
¨ Un’invenzione è “nuova” se non costituisce lo stato dell’arte ¤ ossia se riguarda qualsiasi cosa non disponibile alla
generalità degli individui in forma d’uso o in qualsiasi forma di descrizione scritta o orale alla data della priority
¨ 2 eccezioni (non prejudicial disclosure) ¤ Abusi della divulgazione, contrari alla volontà del titolare,
se sono avvenuti nei 6 mesi precedenti la data di priority ¤ Divulgazioni avvenute ad un evento autorizzato
¨ Grace period (12 mesi USA; 6 mesi Giappone) ¤ L’inventore che divulga (e lui/lei solo/a) può brevettare
entro i 12 mesi dalla divulgazione
Fonte: Franzoni & Scellato, DISPEA – Politecnico di Torino
3) Inventive step 67
¨ L’invenzione deve costituire un avanzamento rispetto allo Stato dell’Arte che risulta non ovvio ad una persona esperta nella materia
¨ Non è consentito brevettare le invenzioni che costituiscono semplici miglioramenti di routine rispetto a quanto esistente
Fonte: Franzoni & Scellato, DISPEA – Politecnico di Torino
Opzioni concesse all’inventore
¨ Sfruttare in proprio la proprietà intellettuale ¨ Assegnare ad altri la proprietà intellettuale dietro
adeguato compenso ¨ Concedere in licenza la proprietà intellettuale
stipulando accordi mutualmente benefici
¨ Come si stima il valore degli asset? ¤ È necessario un audit strutturato
n Può essere necessario investire nella “comunicazione” del valore delle invenzioni
68
12/3/12
18
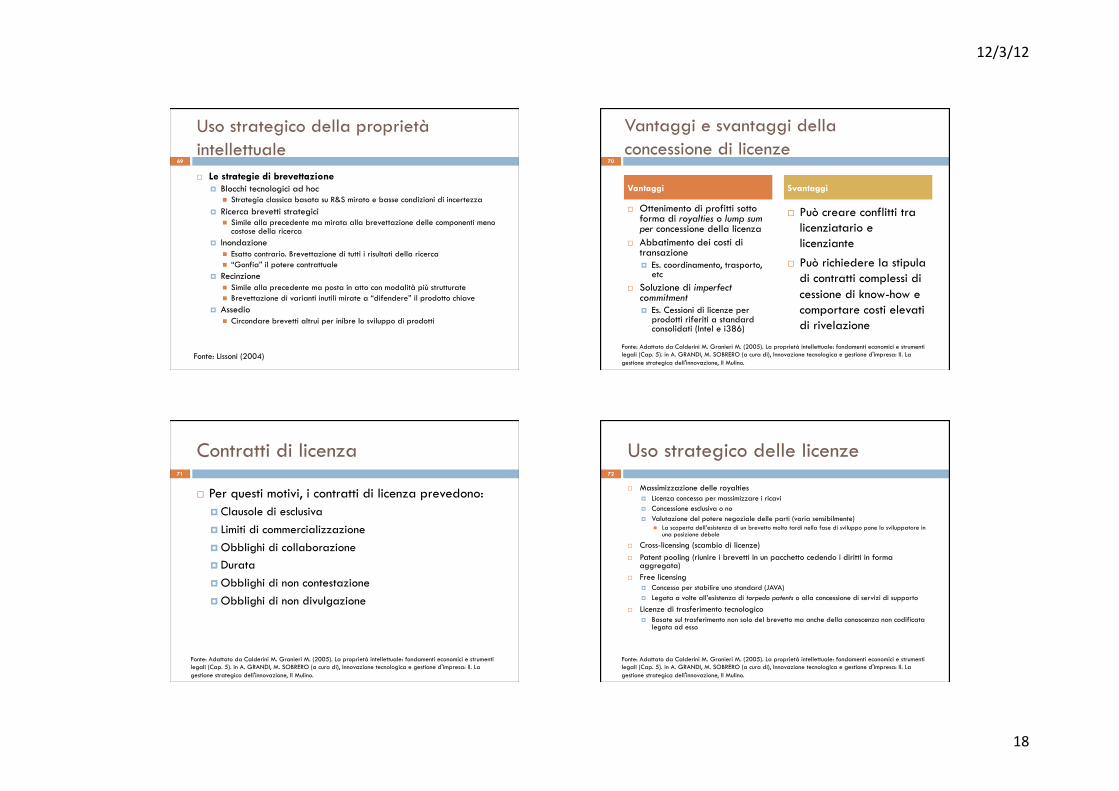
Uso strategico della proprietà intellettuale
69
¨ Le strategie di brevettazione ¤ Blocchi tecnologici ad hoc
n Strategia classica basata su R&S mirato e basse condizioni di incertezza ¤ Ricerca brevetti strategici
n Simile alla precedente ma mirata alla brevettazione delle componenti meno costose della ricerca
¤ Inondazione n Esatto contrario. Brevettazione di tutti i risultati della ricerca n “Gonfia” il potere contrattuale
¤ Recinzione n Simile alla precedente ma posta in atto con modalità più strutturate n Brevettazione di varianti inutili mirate a “difendere” il prodotto chiave
¤ Assedio n Circondare brevetti altrui per inibre lo sviluppo di prodotti
Fonte: Lissoni (2004)
Vantaggi e svantaggi della concessione di licenze
¨ Ottenimento di profitti sotto forma di royalties o lump sum per concessione della licenza
¨ Abbatimento dei costi di transazione ¤ Es. coordinamento, trasporto,
etc ¨ Soluzione di imperfect
commitment ¤ Es. Cessioni di licenze per
prodotti riferiti a standard consolidati (Intel e i386)
¨ Può creare conflitti tra licenziatario e licenziante
¨ Può richiedere la stipula di contratti complessi di cessione di know-how e comportare costi elevati di rivelazione
70
Vantaggi Svantaggi
Fonte: Adattato da Calderini M. Granieri M. (2005). La proprietà intellettuale: fondamenti economici e strumenti legali (Cap. 5). in A. GRANDI, M. SOBRERO (a cura di), Innovazione tecnologica e gestione d'impresa: II. La gestione strategica dell'innovazione, Il Mulino.
Contratti di licenza 71
¨ Per questi motivi, i contratti di licenza prevedono: ¤ Clausole di esclusiva ¤ Limiti di commercializzazione ¤ Obblighi di collaborazione ¤ Durata ¤ Obblighi di non contestazione ¤ Obblighi di non divulgazione
Fonte: Adattato da Calderini M. Granieri M. (2005). La proprietà intellettuale: fondamenti economici e strumenti legali (Cap. 5). in A. GRANDI, M. SOBRERO (a cura di), Innovazione tecnologica e gestione d'impresa: II. La gestione strategica dell'innovazione, Il Mulino.
Uso strategico delle licenze 72
¨ Massimizzazione delle royalties ¤ Licenza concessa per massimizzare i ricavi ¤ Concessione esclusiva o no ¤ Valutazione del potere negoziale delle parti (varia sensibilmente)
n La scoperta dell’esistenza di un brevetto molto tardi nella fase di sviluppo pone lo sviluppatore in una posizione debole
¨ Cross-licensing (scambio di licenze) ¨ Patent pooling (riunire i brevetti in un pacchetto cedendo i diritti in forma
aggregata) ¨ Free licensing
¤ Concesso per stabilire uno standard (JAVA) ¤ Legata a volte all’esistenza di torpedo patents o alla concessione di servizi di supporto
¨ Licenze di trasferimento tecnologico ¤ Basate sul trasferimento non solo del brevetto ma anche della conoscenza non codificata
legata ad esso
Fonte: Adattato da Calderini M. Granieri M. (2005). La proprietà intellettuale: fondamenti economici e strumenti legali (Cap. 5). in A. GRANDI, M. SOBRERO (a cura di), Innovazione tecnologica e gestione d'impresa: II. La gestione strategica dell'innovazione, Il Mulino.

12/3/12
19
INNOVAZIONE E PROPRIETÀ INTELLETTUALE NELLE UNIVERSITÀ: ALCUNE RIFLESSIONI
Il ruolo delle università nei SIN 74
¨ Universities have come under increasing pressure to become more commercially oriented and “entrepreneurial” in their research activities ¤ The role of universities in the governance of technology
transfer has evolved n Emergence of the “3rd mission”
¨ Promotion of university-industry interactions and technology transfer initiatives in Europe ¤ Need to raise additional resources for universities ¤ Universities are seen as key drivers of business innovation ¤ Failure of local development policies: new hope for the
creation of knowledge pools
Fonte: Geuna A., A. Muscio, (2009), The Governance of University Knowledge Transfer: A Critical Review of the Literature, Minerva: a Review of Science, Learning and Policy 47: 93-114.
Policy approach 75
¨ Aumento della rilevanza della proprietà intellettuale ¨ Tentativi di replicare il successo(?) del Bayh-Dole Act
(1980) ¤ No liberal disclosure of publicly-funded research
n Restrictions on dissemination will enhance commercialisation ¤ Accompagnato da un aumento dell’interesse per gli high-
tech cluster ¨ Iniziative basate su una cattiva interpretazione
dell’evidenza empirica ¤ University share of patenting: 0.3% in 1963 => 4% in
1999 ¤ L’accelerazione era cominciata prima!
Fonte: Mowery DC, Sampat BN (2005), Universities and Innovation, in Fagerberg J, Mowery DC, Nelson R (eds), The Oxford Handbook on Innovation, Oxford University Press.
Quota dei brevetti universitari 76
Fonte: Mowery DC, Sampat BN (2005), Universities and Innovation, in Fagerberg J, Mowery DC, Nelson R (eds), The Oxford Handbook on Innovation, Oxford University Press.

12/3/12
20
Budget 2012 della EC
Fonte: http://ec.europa.eu/budget/figures/2012/2012_en.cfm
77
Finanziamento della ricerca di base…
Approx. 20% of total Structural Funds 2007-2013 (65 BN euro) is devoted to RTDI policy initiatives
78
• Creation of an innovation friendly environment
• Knowledge transfer and Technology diffusion
• Innovation poles and clusters
• Boosting applied research
• Support to creation and growth of innovative enterprises
• Improving governance
Distribution of Structural Funds allocated to RTDI per policy area (2000-06)
Fonte: Ismeri Europa
IPR in Europa 79
¨ Dilatazione della proprietà intellettuale ¨ Armonizzazione
¤ Nascita del brevetto comunitario n Estensione della validità di un brevetto nei Paesi Europei
aderenti all’accordo (25), senza dover sostenere ulteriori costi per le successive fasi nazionali
n Avrà validità in tutti i Paesi dell’Unione Europea aderenti al suddetto accordo
n Domanda in Inglese, Francese e Tedesco (Italia e Spagna fuori) n Sarà necessaria l’approvazione del Parlamento Europeo e del
Consiglio Europeo
Fonte: http://ufficiomarchibrevetti.it/2012/02/brevetto-comunitario-2/
Tuttavia… 80
¨ There is no theoretical background nor any strong empirical evidence suggesting that tuning up or down appropriability mechanisms of innovations (IPR in particular) has any robust effect upon: ¤ Resources devoted to innovative search ¤ the rates at which they discover new products and new
production processes ¨ There is little empirical evidence that the significant
strengthening of IP protection had significant impact on the innovation process (Jaffe, 2000)
Fonte: Dosi, G., Marengo L., Pasquali C. (2006), How much should society fuel the greed of innovators? On the Relations Between Appropriability, Opportunities and Rates of Innovation Research Policy 35:1110 – 1121.

12/3/12
21
Tuttavia… 81
¨ If not IPR, what are the main determinants of the rates and directions of innovation? ¤ Nested in levels of opportunities which each industry faces
n Generated by research institutions outside the business sector n Stemming from the very search efforts undertaken by incumbent
firms in the past n Flowing through the economic system via suppliers/users
relationships
¤ Patent litigation begun in 1991 led to total legal expenditures by US firms that were at least 25% of the amount of basic research by these firms in that year
Fonte: Dosi, G., Marengo L., Pasquali C. (2006), How much should society fuel the greed of innovators? On the Relations Between Appropriability, Opportunities and Rates of Innovation Research Policy 35:1110 – 1121.
Evidenza empirica nelle università italiane
82
¨ Public funding for basic research enhances a department’s capability to collect external resources ¤ Private funds are not crowded out by public funding ¤ Cutting public funding to universities is inconsistent with
the objective of increasing private funding and knowledge transfer
¤ Complementarities between public and private funding with an estimated private/public funding elasticity (both EU and domestic) of 6%
Fonte: Muscio A., D. Quaglione, G. Vallanti (2010), Does Government Research Funding to Universities Substitute, Complement or Leverage Industry Funding? CeLEGWP06-10, LUISS.
Dopotutto… 83
directly by a professor (82.7%), a department (43.5%) or a company representative(48.2%). University TTOs were responsible for only 9.5% of collaborations and in only avery few cases were collaborations based on contacts provided by other TTOs.
Table 3 Collaborations withindustry signed in 2004–2007ranked by typology (%)
a Adapted from D’Este et al.(2005)
Types of collaboration agreementsa Frequency Percent
Creation of new physical facilities 31 0.8
University spinoffs 63 1.5
Collaborative research agreements(research by both)
471 11.5
Contract research agreement(research by university)
1,635 39.9
Consultancy agreement (no research involved) 909 22.2
Training of company employees 102 2.5
Hosting industrial researchers in the university 31 0.8
Postgraduate training in industry 196 4.8
Secondments of university researchersto industry
45 1.1
Joint attendance at conferences 305 7.4
Attendance at industry sponsored events 248 6.0
Creation of electronic networks 23 0.6
Other 41 1.0
Total 4,100 100.0
Table 4 Localization and size of firms involved into collaborations
Same province Same region Italy EU Other country Total (n = 169)
Micro enterprises 3.1 18.5 14.8 6.2 1.9 23.7
Small enterprises 5.6 30.9 34.6 9.9 2.5 47.9
Medium enterprises 6.8 27.2 40.7 14.8 4.3 53.8
Large enterprises 3.1 14.8 29.6 15.4 5.6 36.7
Industry association 2.5 8.0 11.1 3.7 0.6 13.0
Total (n = 162) 9.3 51.2 66.0 23.5 8.0
Table 5 Promoters of collabo-rations (n = 168)
Promoter Frequency Percentage
University TTO 16 9.5
Other TTO 4 2.4
This department 73 43.5
Other department/university 18 10.7
Professor 139 82.7
Firm 81 48.2
Industry association 16 9.5
Other 2 1.2
What drives the university use of technology transfer offices? 189
123
Fonte: Muscio A. (2010), What Drives University Access to Technology Transfer Offices? Evidence from Italy, Journal of Technology Transfer, 35(2): 181-202.
Evidenza empirica nel CNR 84
¨ Dinamiche confermate anche nel caso del CNR
13.27% of the total. Tables 3 and 4 present the so-calledscientific crowding-out effect between production of basicresearch and applied activity of research units withinItalian CNR: i.e. concentration index of applied activity ofresearch units increases, whereas the same index of basicresearch has been reducing.
5. Lessons learned and discussion
The economic literature (Calderini and Franzoni, 2004;Van Looy et al., 2005) shows that the applied researchmeasured by patents has a positive impact on publications(basic research), but whether this scientific activity ofresearch units is measured by revenues deriving fromtechnology transfer, the result changes. In fact, thisresearch shows a general crowding-out effect betweenproduction of basic research and applied activity ofresearch units (Tables 1 and 2), in other words withinresearch units there is the tendency to increase theproduction of applied activity, which causes a reductionin basic research production.
! Why scientific crowding-out effect has been increasingover time and which are the causes?! Why crowding-out effect is present in Natural Sciences
(basic, life, earth and environmental, technological,engineering and information sciences; the abbreviationused is NES) and absent in Social and Human Sciences(abbreviation used is SHS)?
To answer these important economic questions, it isnecessary to analyse the research policies carried on byItalian Government.
Since last 1990s until now the Italian research policychanged according to governments’ changes. The firstreform of CNR (1999) was inspired by the idea to gainmore efficiency through the increasing size of research units(consolidation) and to offer the results of research activity
to the economic system: larger institutes, with largerautonomy, could better cooperate with Italian firms. Whilethis reform, was still under way, the government Berlusconiin 2003 decided to launch a new reorganization based onproject management, with an explicit aim to transform theCNR in consulting body operating at the service of firms:the strong cuts to the autonomy of the institutes (groupedinto 11 departments) caused an increase of bureaucracyand in fact represents a contradiction towards technologytransfer that requires a flexible organization to meet theSmall and Medium Enterprises’ technological needs(Coccia, 2007). Common features of these two reformswere the decreasing budgets of CNR (see Fig. 1) with twomain consequences: now the public funds are no moresufficient to cover current expenses and since 2001 staffrecruitment is stopped in public research institutes. Inparticular the strategy of Italian Government behind thisbudgets cuts and this research policy is due to severalcauses operating jointly:
1. The amount of Italian public deficit obliges all ItalianGovernments to reduce the public expenses in alladministrations and departments and then also in publicresearch institutions.
2. There is a trend in all developed economies of decreasingfunding level by Government to research systems(measured by government expenditures for R&D/GDP, i.e. GERD; OECD, 2003). In fact in the USAas well as in Japan, Germany, France, Canada, and theUK, the government intervention has been reduced,thus favouring the action of market forces, which havebecome more and more important in allocatingresources (Steil et al., 2002).
3. The requirements for increased accountability of publicfunds, increased flexibility of research institutions toadapt to changing environments, and a better inclusionof socio-industrial objectives have led most countries,included Italy, to include changes in their research
ARTICLE IN PRESS
75
100
125
150
175
2003200220012000
Public Funds
Applied activity (Revenue from technology transfer)
Basic research- International Publications
NES- Natural Sciences
Fig. 1. Dynamics of scientific research in NES over time.
M. Coccia, S. Rolfo / Technovation 28 (2008) 485–494490
- Più brevetti - Meno pubblicazioni - Meno ricerca di base
Fonte: Coccia M., Rolfo S. (2008), “Strategic change of public research units in their scientific activity”, Technovation 28(8): 485-494.

12/3/12
22
Il trasferimento tecnologico in Italia 85
¨ No key policy actors ¨ MiSE, MIUR, Regional Gov. Bodies, etc.
¨ Many research institutions ¨ Universities, research centres, etc.
¨ Many small TT organisations (>300!) ¨ Not specialised and understaffed (IPI, 2005)
¨ Inadequate policy initiatives in support of TT (Trendchart, 2008; ProInno-Europe) ¨ Few initiatives in support of entrepreneurship/start-up/spin-off (EC,
2007; Mallone, 2008) ¨ Focus on research funding ¨ Adoption of a ‘diffusion oriented’ approach (Colombo et al., 2006)
Fonte: Muscio A. (2010), What Drives University Access to Technology Transfer Offices? Evidence from Italy, Journal of Technology Transfer, 35(2): 181-202.
86
¨ The interest for technology transfer in Italy has increased in the last decade ¤ Recent implementation of Bayh-Dole act-”unlike” regulation
n Tremonti bis - L. 383/01 n Nuovo codice di proprietà industriale - D. Lgs. 30/05
¤ Initiatives encouraging and regulating academic initiatives n Regolamenti conto-terzi
¤ Creation of TT intermediaries (TTOs, ILOs, etc.)
¨ However, government funding to research has been cut ¤ Clear rationale: increase efficiency, promote private funding
Fonte: Muscio A. (2010), What Drives University Access to Technology Transfer Offices? Evidence from Italy, Journal of Technology Transfer, 35(2): 181-202.
Finanziamento della ricerca dei dipartimenti 2005-08 (aree 1-9)
87
Fonte: Muscio A., D. Quaglione, G. Vallanti (2010), Does Government Research Funding to Universities Substitute, Complement or Leverage Industry Funding? CeLEGWP06-10, LUISS.
88
GRAZIE PER L’ATTENZIONE! Alessandro Muscio [email protected]