Sincope e Cambiamenti Climatici - Tigullio Cardio · Sincope e Cambiamenti Climatici Prof....
23
Sincope e Cambiamenti Climatici Prof. Raffaello Furlan Unità Sincopi e Disturbi della Postura Medicina Generale, Istituto Clinico Humanitas, Rozzano (MI), Università di Milano “Dichiaro di non aver legami di tipo economico o professionale con industrie o organizzazioni, per i quali può configurarsi un conflitto di interesse riguardante l’argomento discusso in questa presentazione.”
Transcript of Sincope e Cambiamenti Climatici - Tigullio Cardio · Sincope e Cambiamenti Climatici Prof....
Sincope e Cambiamenti Climatici
Prof. Raffaello FurlanUnità Sincopi e Disturbi della Postura
Medicina Generale, Istituto Clinico Humanitas, Rozzano (MI), Università di Milano
“Dichiaro di non aver legami di tipo economico o professionale con industrie oorganizzazioni, per i quali può configurarsi un conflitto di interesse riguardante
l’argomento discusso in questa presentazione.”

• Human pathophysiology suggests that heat exposure may facilitate syncope during standing
Background

Cui et al Clin Auton Res 2011;21:381

Cui et al Clin Auton Res 2011;21:381

Cui et al Clin Auton Res 2011;21:381
• Human pathophysiology suggests that heat mayfacilitate syncope during standing
• Studies designed for pubblic health surveillance,analyzing the changes in heat-related morbidityassociated with seasonal high temperatures (or heat waves), inconsistently corroborate thehypothesis that high environmental temperaturesmay promote syncope.
Background
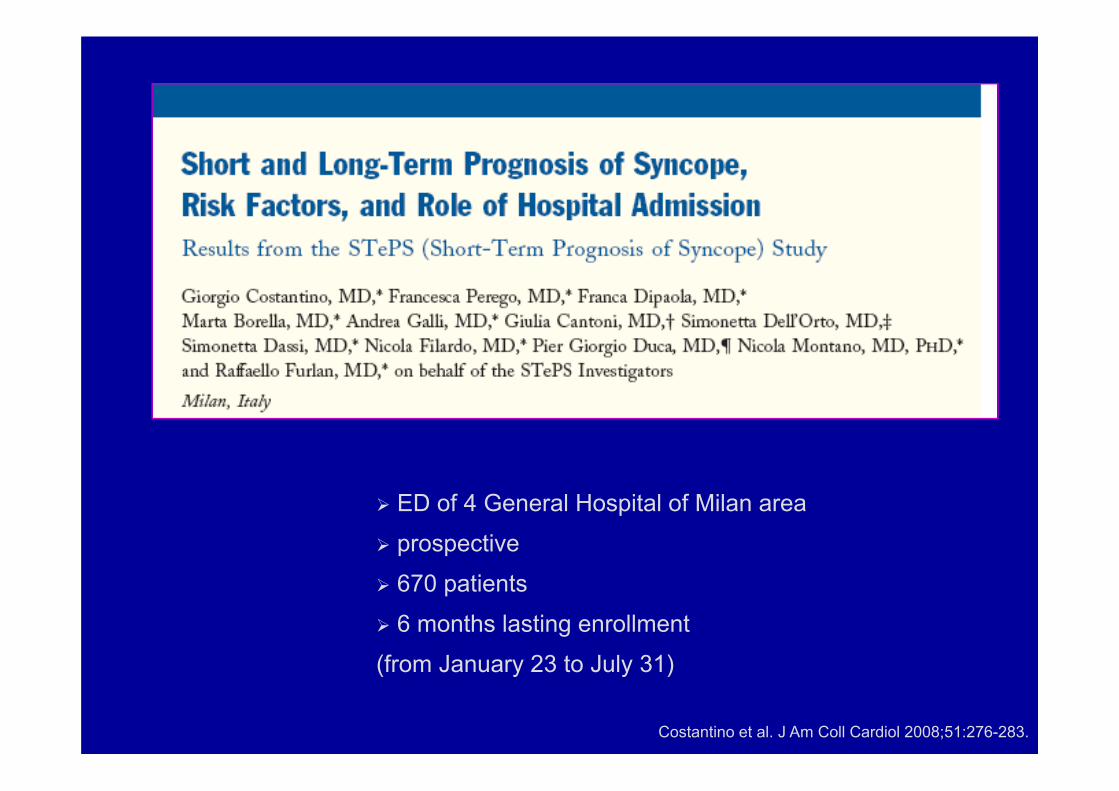
Costantino et al. J Am Coll Cardiol 2008;51:276-283.
ED of 4 General Hospital of Milan area
prospective
670 patients
6 months lasting enrollment
(from January 23 to July 31)
-505
10152025303540
-505
10152025303540
Hea
t Ind
exM
ax (°
C)
Tem
pera
ture
Max
(°C
)
-505
10152025303540
23 J
an1
Feb
1 M
ar
1 Ap
r
1 M
ay
1 Ju
n
1 Ju
l
31 J
ul
Tem
pera
ture
Min
(°C
)
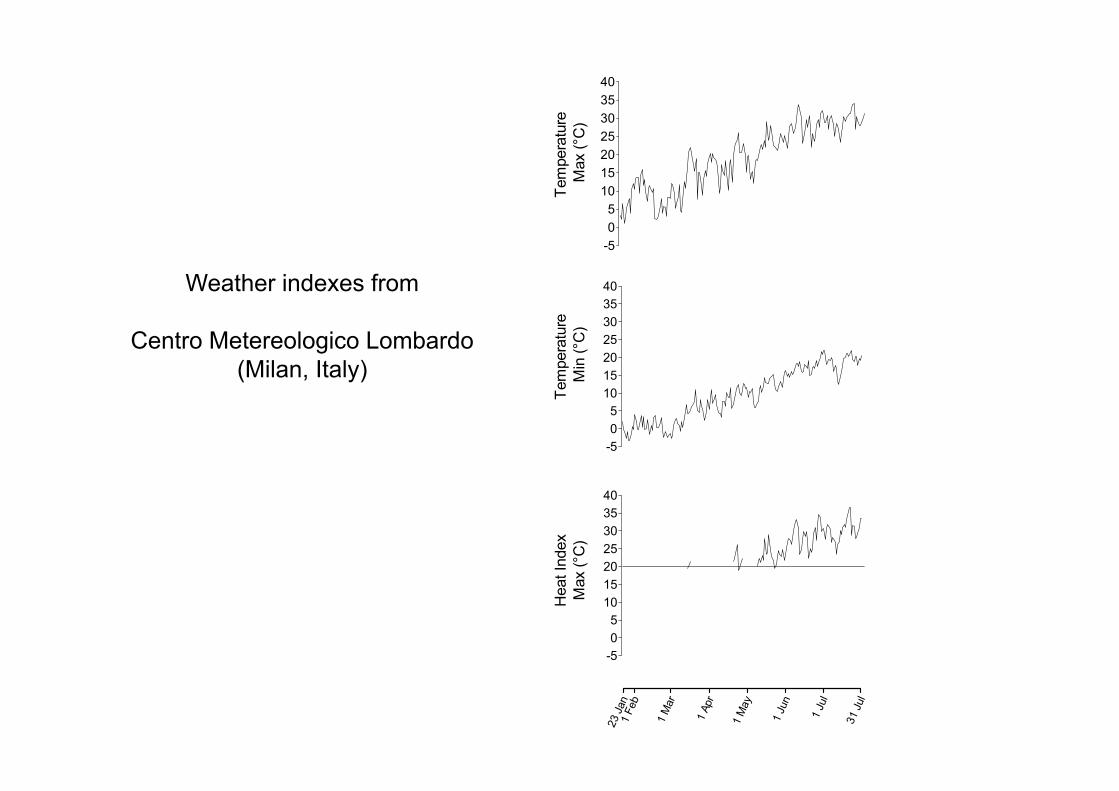
Weather indexes from
Centro Metereologico Lombardo(Milan, Italy)

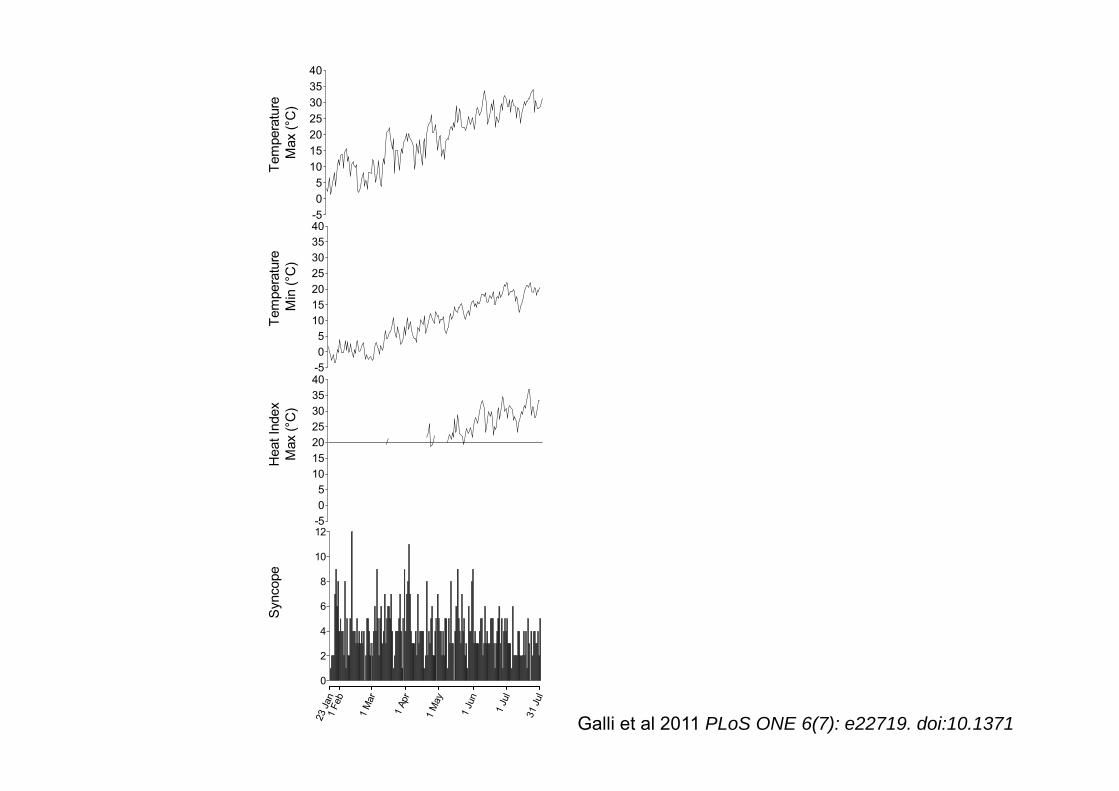
AIMS
• To assess the relationship between the increase of maximalair temperature from January to July and the potential increasein the rate of ED visits for syncope
-505
10152025303540
-505
10152025303540
0
2
4
6
8
10
12
Hea
t Ind
exM
ax (°
C)
Tem
pera
ture
Max
(°C
)S
ynco
pe
-505
10152025303540
23 J
an1
Feb
1 M
ar
1 Ap
r
1 M
ay
1 Ju
n
1 Ju
l
31 J
ul
Tem
pera
ture
Min
(°C
)
Galli et al 2011 PLoS ONE 6(7): e22719. doi:10.1371

-5 5 15 25 35
0
6
12
Max Temperature (°C)
Syn
cope
(N)
r 2 = 0.009073
Galli et al 2011 PLoS ONE 6(7): e22719. doi:10.1371

23 J
an1
Feb
1 M
ar
1 Ap
r
1 M
ay
1 Ju
n
1 Ju
l
31 J
ul
epoch # 1(69 days)
epoch # 2(61 days)
epoch # 3(61 days)
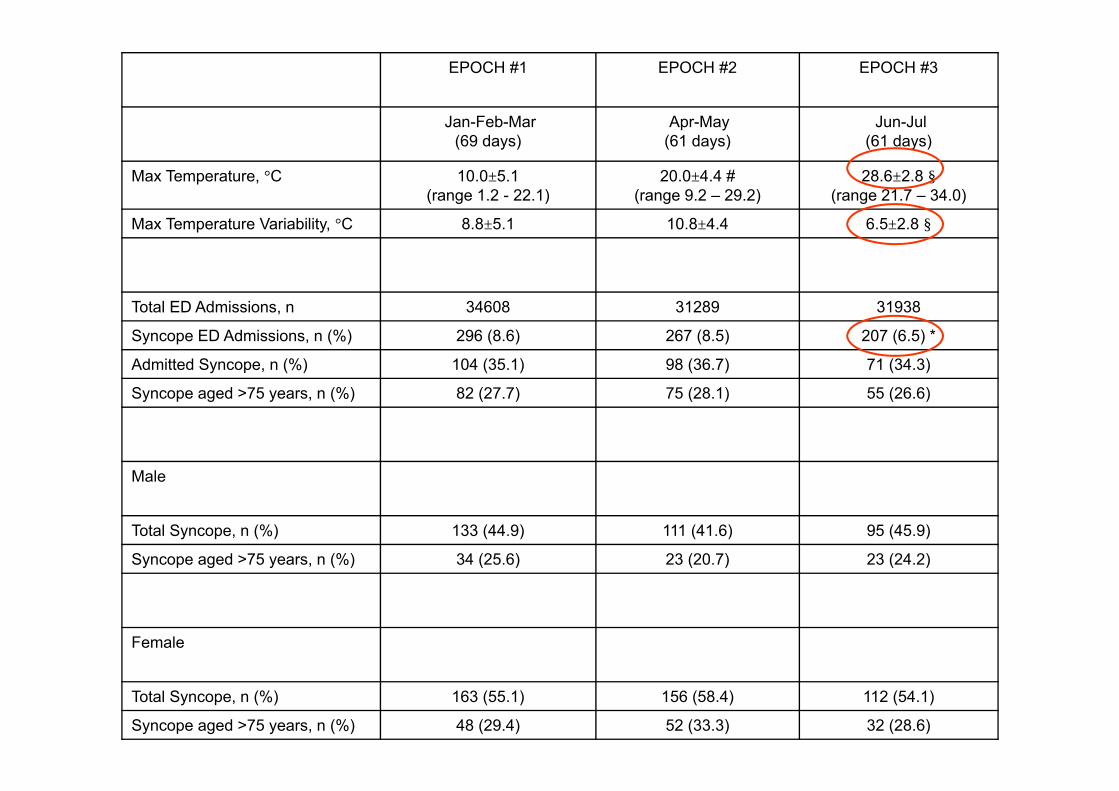
EPOCH #1 EPOCH #2 EPOCH #3
Jan-Feb-Mar(69 days)
Apr-May(61 days)
Jun-Jul(61 days)
Max Temperature, °C 10.0±5.1(range 1.2 - 22.1)
20.0±4.4 #(range 9.2 – 29.2)
28.6±2.8 §(range 21.7 – 34.0)
Max Temperature Variability, °C 8.8±5.1 10.8±4.4 6.5±2.8 §
Total ED Admissions, n 34608 31289 31938
Syncope ED Admissions, n (%) 296 (8.6) 267 (8.5) 207 (6.5) *
Admitted Syncope, n (%) 104 (35.1) 98 (36.7) 71 (34.3)
Syncope aged >75 years, n (%) 82 (27.7) 75 (28.1) 55 (26.6)
Male
Total Syncope, n (%) 133 (44.9) 111 (41.6) 95 (45.9)
Syncope aged >75 years, n (%) 34 (25.6) 23 (20.7) 23 (24.2)
Female
Total Syncope, n (%) 163 (55.1) 156 (58.4) 112 (54.1)
Syncope aged >75 years, n (%) 48 (29.4) 52 (33.3) 32 (28.6)
• No relationship between values of maximal temperature and the number of ED visits for syncope.
• June and July, characterized by the highest temperatures but the lowest maximal temperature variability, were associated with a lower rate of ED vists for syncope.
Summary

AIM
• To address the relationship between maximal temperature variability and the pattern of ED visits for syncope
Is there any cross talking between temperature variability and the pattern of ED presentation for syncope?
Is there any hidden code between temperature oscillations and the pattern of ED presentation for syncope that might be uncovered by a frequency domain approach?

0
2
4
6
8
10
12
Tem
pera
ture
Max
(°C
)S
ynco
pe
23 J
an1
Feb
1 M
ar
1 Ap
r
1 M
ay
1 Ju
n
1 Ju
l
31 J
ul
-505
10152025303540
Daily maximal temperature values and numberof syncope sampled once per day series.
Frequency domain analyses by autoregressivespectral methods
Surrogate data approach to assess the deterministicnature of the oscillations
Squared coherence function to assess their linear correlation
T= 23.2 days
T= 7.1 days
T= 7.1 - 5.0 days
T= 7.1 days T= 3.0 days
0.0 0.1 0.2 0.3 0.40
130
0.0 0.1 0.2 0.3 0.40
7
0.0 0.1 0.2 0.3 0.40.0
0.2
0.4
0.6
0.8
1.0
PSD
(°C
2*
cycl
es-1
* d
ay-1
)PS
D(N
2 * c
ycle
s-1 *
day
-1)
Coh
eren
ce
cycles*day-1(Galli et al 2011 PLoS ONE 6(7): e22719. doi:10.1371)

• Presence of similar and related oscillatory patterns in maximaltemperature and ED presentation for syncope characterized by a ≈7-day period.
Summary

• No relationship between maximal temperature values and the number of ED visits for syncope. (van Dijk et al, Europace 2007;9:823) and (Anderson and Reed, Eur. J. Emerg. Med. 2010;17:240 )
• June and July, characterized by the highest temperatures but the lowest maximal temperature variability, were associated with a lower rate of ED vists for syncope.We hypothesize that a reduced heat stress, as it is the case when maximal temperature variability is lower, may play a role in lowering the rate of ED presentation for syncope.
• Temperature variability and the pattern of ED presentation for syncope seem “to talk” by means of a frequency domain code characterized by a ≈ 7-day period.This suggests a potential influence of rhythmic changes in temperature (temperature variability ) on the pattern of syncopeED presentation.
Conclusions


23 J
an1
Feb
1 M
ar
1 Ap
r
1 M
ay
1 Ju
n
1 Ju
l
31 J
ul
e p o c h # 1(6 9 d a y s )
e p o c h # 2(6 1 d a y s )
e p o c h # 3(6 1 d a y s )
Tem
pera
ture
Max
(°C
)
-505
10152025303540

0
2
4
6
8
10
12
Tem
pera
ture
Max
(°C
)S
ynco
pe
23 J
an1
Feb
1 M
ar
1 Ap
r
1 M
ay
1 Ju
n
1 Ju
l
31 J
ul
-505
10152025303540
Daily maximal temperature values and numberof syncope sampled once per day series.
Frequency domain analyses by autoregressivespectral methods
Squared coherence function to assess their linear correlation
T= 23.2 days
T= 7.1 days
T= 7.1 - 5.0 days
T= 7.1 days T= 3.0 days
0.0 0.1 0.2 0.3 0.40
130
0.0 0.1 0.2 0.3 0.40
7
0.0 0.1 0.2 0.3 0.40.0
0.2
0.4
0.6
0.8
1.0
PS
D(°
C2
* cy
cles
-1 *
day
-1)
PS
D(N
2 * c
ycle
s-1 *
day
-1)
Coh
eren
ce

0.0 0.1 0.2 0.3 0.40
130
0.0 0.1 0.2 0.3 0.40
7
0.0 0.1 0.2 0.3 0.40.0
0.2
0.4
0.6
0.8
1.0
PSD
(°C
2*
cycl
es-1
* d
ay-1
)PS
D(N
2 * c
ycle
s-1 *
day
-1)
Coh
eren
ce
cycles*day-1
0
2
4
6
8
10
12
Tem
pera
ture
Max
(°C
)S
ynco
pe
23 J
an1
Feb
1 M
ar
1 Ap
r
1 M
ay
1 Ju
n
1 Ju
l
31 J
ul
-505
10152025303540
Daily maximal temperature values and numberof syncope sampled once per day series.
Frequency domain analyses by autoregressivespectral methods
Surrogate data approach to assess the deterministicnature of the oscillations
Squared coherence function to assess their linear correlation
T= 23.2 days
T= 7.1 days
T= 7.1 - 5.0 days
T= 7.1 days T= 3.0 days

Saturd
aySundayMondayTues
dayWed
nesday
Thursday
Friday
0
25
50
75
100
125
7-day period oscillation
num
ber
of p
atie
nts
with
syn
cope
Saturd
ay
Friday
Friday
Friday
0
25
50
75
100
125
7-day period