Psychomed - crpdownload.com 2010 1-2.pdf · Editoriale Caro lettore/lettrice, chi ha seguito le...
35
Psychomed Periodico quadrimestrale Rivista telematica di psicoterapia, medicina psicosociale, psicologia della salute e preventiva Anno V n. 1-2 Aprile 2010 ISSN: 1828-1516 AUTORIZZAZIONE DEL TRIBUNALE DI ROMA N.243 DEL 12.6.2008 Direttore responsabile: Stefania Borgo Condirettore: Lucio Sibilia www.crpitalia.eu/psychomed.html
Transcript of Psychomed - crpdownload.com 2010 1-2.pdf · Editoriale Caro lettore/lettrice, chi ha seguito le...

Psychomed Periodico quadrimestrale
Rivista telematica di psicoterapia, medicina psicosociale, psicologia della salute e preventiva
Anno V n. 1-2 Aprile 2010
ISSN: 1828-1516 AUTORIZZAZIONE DEL TRIBUNALE DI ROMA N.243 DEL 12.6.2008
Direttore responsabile: Stefania Borgo
Condirettore: Lucio Sibilia
www.crpitalia.eu/psychomed.html

Indice dei Poster
Annie Taillon, Kieron O’Connor, Gilles Dupuis & Anick Laverdure 1. Evaluation of an Inference-based approach to treating body dysmorphic disorder: preliminary results Isaac Marks, Lucio Sibilia, Stefania Borgo 2. Project for a Common Language for Psychotherapy (CLP) Procedures Yudai Iijima, Yoshihiko Tanno 3. Realtion between negative beliefs about worry and thought suppression Mingming Lin, Yoshihiko Tanno 4. Individual differences in the effect of acute stress on words memory: Temporal stability Masanori Kobayashi, Yoshihiko Tanno 5. Temporal stability and strategies for memory suppression Rossano Bisciglia, Erika Gordovani, Igor Dodig, Luka Filipponi, Gaetana Pascuzzo, Susanna Pizzo, Aldo Galeazzi 6. Body checking and avoidance in overweight subjects with and without binge eating disorder Rohani S.S., Field A.P., and Hutton S. 7. Acquisition of fear and attentional bias in children, an Eye Tracking Study Montserrat Montano, Elena M. Ruiz, Ana Calero, Manuel Alpanes & M. Xesus Frojan 8. A functional analytic X-Ray of the therapeutic process Ruiz E.M., Montano M., Calero A., Frojan M.X. 9. Therapist client interaction analysis by a single case study Calero-Elvira A., Montano-Fidalgo M., Vargas de la Cruz I., Alpanes Freitag M., Frojan Praga M.X. 10. Coding System for the study of client-therapist interaction: application to the cognitive restructuring technique Carlo Chiorri, Valeria Battini & Antonella Arata 11. Development and initial validation of an adolescent version of Tylka’s Intuitive Eating Scale

Dave Pasalich, Mark Dadds, David Hawes, John Brennan and Anthony kokin 12. Does parenting matter for conduct problems in children with Callous-Unemotional traits? Paula Saraiva Carvalho & Maria Cristina Canavarro 13. Psychological adaptations to the adolescent pregnacy: influence contexts Gyongyi Ajtay and Dora Perczel Forintos 14. The role of general practitioner in suicide prevention using the Hopelessness Scale in primary care Ljiljana Mihic, Zdenka Novovic, Veljko Jovanovic, Boris Popov 15. Emotion regulation, negative affectivity and dysphoria: moderated mediation Zdenka Novovic, Ljiljana Mihic, Veljko Jovanovic, Miklos Biro 16. Relation between cognitive and psychiatric constructs of vulnerability to depression Boris Popov, Miklos Biro, Zdenka Novovic 17. Irrational beliefs and goal importance in predicting dysfunctional mood states: an experimental study Morija Lebedina – Manzoni, Martina Lotar 18. Relation between depression symptoms, perfectionism and self-concept Zhivko Juzevski, Tanja Atanasova, Vera Jovanovska, Biljiana Gagachovska, Emilijia Jovanovska – Trajkovska 19. Monitoring group cohesion in CBT educational groups. A prospective study Irem Motan 20. A new technique, cinematherapy: clinical practice Yilmaz Esin A., Motan Irem 21. The preliminary psychometric properties of the Center for Epidemiologic Studies – Depression Scale (CES-D) in a Turkish sample Barbora Bulikova, Jan Prasko, Michal Raszka, Andrea Cinculova, Jana Vyskocilova, katarina Adamcova, Jana Koprivova, Hana Kudmovska 22. Prediction of therapeutic responce to CBT in patients sufering with obsessive compulsive disorder resistant to the treatment with psychopharmacs
Andrea Cinculova, Barbora Bulikova, Jan Prasko, Michal Raszka, Jana Vyskocilova, katarina Adamcova, Jana Koprivova 23. Stigmatization in OCD and delay of treatment Jan Prasko, Jana Vyskocilova, Libuse Pohlova, Barbora Bulikova, Andrea Cinculova, Tomas Novak, katarina Adamcova 24. Personality disorder influence the treatment of social phobia Andrea Cinculova, Jan Prasko, Barbora Bulikova, Petra Houbova, Jana Vyskocilova, Tomas Novak, Richard Zalesky, katerina Espa- Cervena, Beata Paskova 25. Influence of personalità disorder on the treatment of panic disorder comparison study. Direttore responsabile: Stefania Borgo mail: [email protected] Condirettore: Lucio Sibilia mail: [email protected] Comitato Scientifico: Mario Becciu, Paola Borgo, Stefania Borgo, Mauro Ceccanti, Silvana Cilia, Anna Rita Colasanti, Federico Colombo, Adele de Pascale, Carlo Di Berardino, Gian Franco Goldwurm, Caterina Lombardo, Spiridione Masaraki, Roberto Picozzi, Carla Rafanelli, Giuseppe Sacco, Ezio Sanavio, Tullio Scrimali, Lucio Sibilia, Claudio Sica Comitato Redazionale: Massimo Ambrosi, Dimitra Kakaraki, Adriano Martello Sito Internet: http://www.crpitalia.eu/psychomed.html Email: [email protected]

Editoriale Caro lettore/lettrice,
chi ha seguito le pubblicazioni della nostra rivista fin dall'inizio, saprà che una componente
della politica editoriale di Psychomed, nonché una delle sua finalità fondanti, è quello di
rendere disponibile in modo sintetico la letteratura scientifica nel nostro campo. Ad esem-
pio, è in base a questo elemento che ci siamo ispirati per proporre il nostro concetto di
"sintesi" nella comunicazione scientifica, non nel senso di aver inventato la sintesi, ovvia-
mente, ma indicando con questo termine un documento intermedio tra il riassunto (ab-
stract per chi ama l'inglese), di solito di 2-300 parole, e l'articolo su rivista scientifica (il pa-
per), abitualmente tra un minimo di 5-6 e massimo di 12-20 cartelle.
Un esempio di comunicazione di sintesi è invece il poster, il lavoro scientifico che viene
comunicato sotto forma di manifesto, esposto in verticale, per lo più durante i congressi, e
perciò da leggere di solito in piedi e quindi con meno agio della lettura di una rivista scien-
tifica, che si può sfogliare alla scrivania o scorrere sullo schermo di un computer comoda-
mente seduti. Per questo, i poster ben fatti contengono mediamente una quantità di testo
senz'altro inferiore a quella degli articoli, e contengono invece una quantità maggiore di
grafica, che attira l'occhio (e stimola la curiosità) molto più del testo. Forse proprio per la
sua fruizione effimera, però, il poster ha purtroppo finito per essere percepito come una
forma di comunicazione scientifica di second'ordine, da relegare in un angolo dei congres-
si e atta ad accogliere meglio i lavori dei colleghi più giovani e quindi meno adusi a parlare
in pubblico; sembra confermare questa percezione il fatto che i poster normalmente non
vengono pubblicati.
Questa concezione dei poster come lavori di serie B, tuttavia, contrasta con l'esperienza
mia e di molti colleghi che proprio nei poster si trovano spesso lavori più originali, idee più
innovative, studi condotti molto meglio di quelli delle presentazioni orali (spesso concorda-
te da colleghi più titolati con gli organizzatori dei convegni). E' per questo motivo quindi
che ci chiedemmo già due anni fa se Psychomed non potesse ospitare proprio dei poster:
così si fece, chiedendo ai relatori del 6° Congresso Internazionale di Psicoterapia Cogniti-
va tenutosi a Roma dal 19 al 22 giugno 2008 di spedirci i poster presentati a quel Conve-
gno. La risposta fu molto positiva: ricevemmo molte proposte, per cui potemmo pubblicare
25 poster sul 2° numero del 2008.
Anche in questo numero di Psychomed troverai un buon numero di poster, presentati in un
convegno internazionale. I poster inclusi in questo numero della rivista provengono dal
Congresso della Associazione Europea di Terapia Comportamentale e Cognitiva (EABCT)
tenutosi a Dubrovnik (Croazia) nel settembre 2009, proposti da ricercatori di numerosi
paesi sia europei che extraeuropei. Questi poster sono stati da noi sollecitati e selezionati,
in qualche caso "curati" in modo che gli Autori potessero renderli più leggibili e ridurli al
formato di una pagina. Altri poster sono stati invece scartati, quando ritenuti
insoddisfacenti per contenuto (rilevanza, accuratezza o altro), leggibilità o impostazione
grafica.
Vi troverete senz'altro argomenti originali, quali metodiche di analisi innovative del proces-
so psicoterapico, nuove proposte di metodi psicoterapici o un uso originale in psicoterapia
di tecniche già note, nuovi strumenti di assessment, nuove proposte di modelli psicopato-
logici; tutto ciò in una gamma di condizioni psicopatologiche che vanno dagli OCD alla de-
pressione, dai disturbi attenzionali a quelli alimentari, senza dimenticare ambiti di ricerca
specificamente psicologica, quali l'adattamento dell'adolescente alla gravidanza, la soddi-
sfazione nel rapporto di coppia, le strategie di soppressione dei ricordi, effetti dello stress
sulla memoria di parole, etc.
Date le finalità che ho ricordato, quindi, è più che naturale che Psyhomed ospiti dei poster,
ma vorrei lasciarvi con una ultima notazione: la tecnologia che ci consente ora di leggere
anche i poster con lo stesso agio di un articolo non dovrebbe farci dimenticare che in ogni
poster c'è mediamente molto più lavoro di quanto non ci sia in una pagina di rivista.
Quindi, buona lettura e visione.
Lucio Sibilia
TEMPLATE DESIGN © 2008
www.PosterPresentations.com
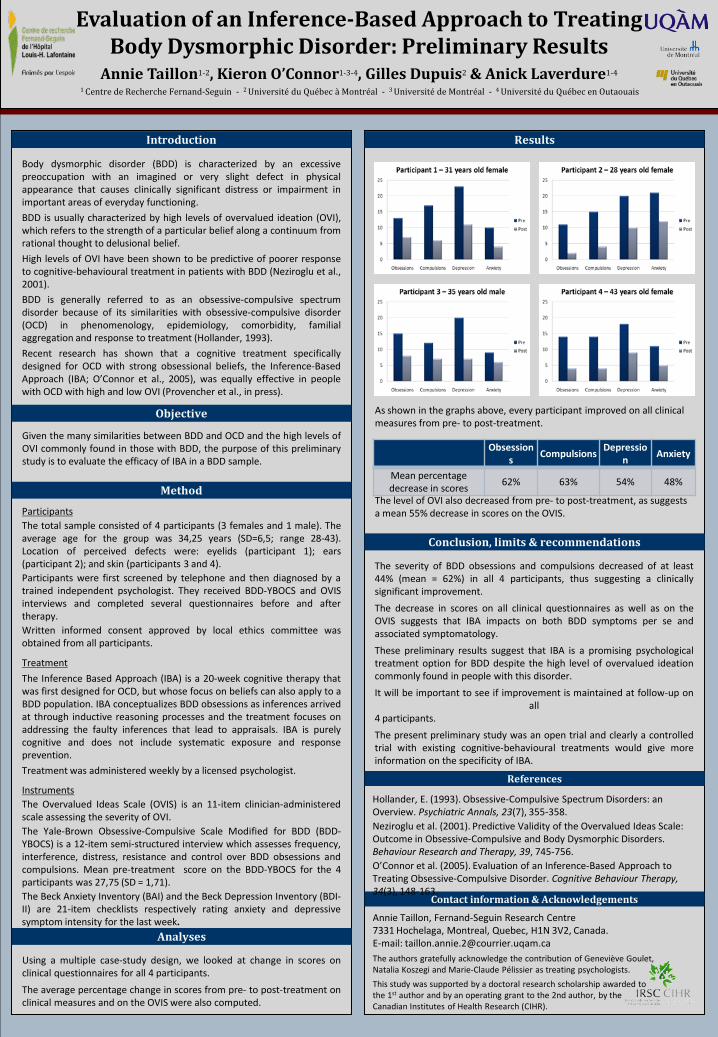
Evaluation of an Inference-Based Approach to Treating Body Dysmorphic Disorder: Preliminary Results
Annie Taillon1-2, Kieron O’Connor1-3-4, Gilles Dupuis2 & Anick Laverdure1-4
1 Centre de Recherche Fernand-Seguin - 2 Université du Québec à Montréal - 3 Université de Montréal - 4 Université du Québec en Outaouais
Introduction
Body dysmorphic disorder (BDD) is characterized by an excessivepreoccupation with an imagined or very slight defect in physicalappearance that causes clinically significant distress or impairment inimportant areas of everyday functioning.
BDD is usually characterized by high levels of overvalued ideation (OVI),which refers to the strength of a particular belief along a continuum fromrational thought to delusional belief.
High levels of OVI have been shown to be predictive of poorer responseto cognitive-behavioural treatment in patients with BDD (Neziroglu et al.,2001).
BDD is generally referred to as an obsessive-compulsive spectrumdisorder because of its similarities with obsessive-compulsive disorder(OCD) in phenomenology, epidemiology, comorbidity, familialaggregation and response to treatment (Hollander, 1993).
Recent research has shown that a cognitive treatment specificallydesigned for OCD with strong obsessional beliefs, the Inference-BasedApproach (IBA; O’Connor et al., 2005), was equally effective in peoplewith OCD with high and low OVI (Provencher et al., in press).
Results
As shown in the graphs above, every participant improved on all clinical measures from pre- to post-treatment.
The level of OVI also decreased from pre- to post-treatment, as suggests a mean 55% decrease in scores on the OVIS.
Method
ParticipantsThe total sample consisted of 4 participants (3 females and 1 male). Theaverage age for the group was 34,25 years (SD=6,5; range 28-43).Location of perceived defects were: eyelids (participant 1); ears(participant 2); and skin (participants 3 and 4).Participants were first screened by telephone and then diagnosed by atrained independent psychologist. They received BDD-YBOCS and OVISinterviews and completed several questionnaires before and aftertherapy.Written informed consent approved by local ethics committee wasobtained from all participants.
Treatment
The Inference Based Approach (IBA) is a 20-week cognitive therapy thatwas first designed for OCD, but whose focus on beliefs can also apply to aBDD population. IBA conceptualizes BDD obsessions as inferences arrivedat through inductive reasoning processes and the treatment focuses onaddressing the faulty inferences that lead to appraisals. IBA is purelycognitive and does not include systematic exposure and responseprevention.
Treatment was administered weekly by a licensed psychologist.
InstrumentsThe Overvalued Ideas Scale (OVIS) is an 11-item clinician-administeredscale assessing the severity of OVI.The Yale-Brown Obsessive-Compulsive Scale Modified for BDD (BDD-YBOCS) is a 12-item semi-structured interview which assesses frequency,interference, distress, resistance and control over BDD obsessions andcompulsions. Mean pre-treatment score on the BDD-YBOCS for the 4participants was 27,75 (SD = 1,71).The Beck Anxiety Inventory (BAI) and the Beck Depression Inventory (BDI-II) are 21-item checklists respectively rating anxiety and depressivesymptom intensity for the last week.
Contact information & Acknowledgements
Annie Taillon, Fernand-Seguin Research Centre7331 Hochelaga, Montreal, Quebec, H1N 3V2, Canada.E-mail: [email protected] authors gratefully acknowledge the contribution of Geneviève Goulet, Natalia Koszegi and Marie-Claude Pélissier as treating psychologists.
This study was supported by a doctoral research scholarship awarded tothe 1st author and by an operating grant to the 2nd author, by theCanadian Institutes of Health Research (CIHR).
Analyses
Using a multiple case-study design, we looked at change in scores onclinical questionnaires for all 4 participants.
The average percentage change in scores from pre- to post-treatment onclinical measures and on the OVIS were also computed.
References
Hollander, E. (1993). Obsessive-Compulsive Spectrum Disorders: an Overview. Psychiatric Annals, 23(7), 355-358.Neziroglu et al. (2001). Predictive Validity of the Overvalued Ideas Scale: Outcome in Obsessive-Compulsive and Body Dysmorphic Disorders. Behaviour Research and Therapy, 39, 745-756. O’Connor et al. (2005). Evaluation of an Inference-Based Approach to Treating Obsessive-Compulsive Disorder. Cognitive Behaviour Therapy, 34(3), 148-163.
Objective
Given the many similarities between BDD and OCD and the high levels ofOVI commonly found in those with BDD, the purpose of this preliminarystudy is to evaluate the efficacy of IBA in a BDD sample.
Conclusion, limits & recommendations
The severity of BDD obsessions and compulsions decreased of at least44% (mean = 62%) in all 4 participants, thus suggesting a clinicallysignificant improvement.
The decrease in scores on all clinical questionnaires as well as on theOVIS suggests that IBA impacts on both BDD symptoms per se andassociated symptomatology.
These preliminary results suggest that IBA is a promising psychologicaltreatment option for BDD despite the high level of overvalued ideationcommonly found in people with this disorder.
It will be important to see if improvement is maintained at follow-up onall
4 participants.
The present preliminary study was an open trial and clearly a controlledtrial with existing cognitive-behavioural treatments would give moreinformation on the specificity of IBA.
Obsessions
CompulsionsDepressio
nAnxiety
Mean percentage decrease in scores
62% 63% 54% 48%

Project for a Common Language for Psychotherapy (CLP) Procedures
Common Language for Psychotherapy procedures: Update
www.commonlanguagepsychotherapy.org
just one approach
a few approaches
many approaches
Procedures used in:
CLP Task Force
Set up by EABCT & ABCT to develop a Common Language for Psychotherapy Procedures toencourage therapists to use the same terms for similar clinical procedures
Entries describe procedures, not theory –what therapists do (fly on the wall), not why they do it
Task Force membersEABCT: StefaniaBORGO, Pim CUIJPERS, Miquel Angel
FULLANA (deputy co-ordinator), Isaac MARKS (co-ordinator), LucioSIBILIA, Mehmet SUNGUR
ABCT: Marvin GOLDFRIED, Michelle NEWMAN, GeorgeSTRICKER
Australian Psychological Society: Kate MOORE
Psychodynamic Editor: Jeremy HOLMES
Website: www.commonlanguagepsychotherapy.orgDesigner:Marco BENARDManager: Lorena FERNÁNDEZ DE LA CRUZ
The Problem: therapists often
1. give similar therapy procedures different names e.g. to ↓ grief: a. guided mourning, b. exposure, and c. working through are done similarly
2. give different therapy procedures similar namese.g. diary keeping may be of: relaxation exercises
without exposure, particular thoughts, or live-exposure homework tasks
Lack of a common language for therapy procedures leads to:
-misunderstandings among therapists, clients & researchers
-slowing of psychotherapy’s maturinginto a science
CLP aims to:
-have therapists across the world from diverse orientations describe therapy procedure/s in aplain common language, each entry with abrief real Case Illustration
-get international use of a common language for allprocedures by a broad range of therapists
CLP work so far
Steadily-growing CLP website now has 68 accepted entries for procedures from diverse orientations (ACT, behavioural, buddhist, cognitive, gestalt, interpersonal, psychodynamic, other)
entries highlight author’s name84 authors from 13 countries (Australia, Canada,
France, Germany, Greece, Israel, Italy, Japan,Netherlands, Sweden, Switzerland, UK, USA)
Classification of procedures in progress
68 entries for procedures accepted so far-acceptance; -anger management; -applied relaxation; -assertiveness training; -attention training; -behavioral activation; -CAVE (computer-aided vicarious exposure); -cognitive defusion; -cognitive restructuring; community reinforcement approach; -coping cat; -countertransference, use of; -danger ideation reduction therapy (DIRT); -decisional balance; -dialectical behaviour therapy (DBT); -dream interpretation; -evoked response arousal plus sensitization; -experiment; -exposure, interoceptive (to internal cues); -exposure, live (in-vivo, live desensitization); -expressive writing therapy; -family work for schizophrenia; -fixed-role therapy; -guided mourning; -habit reversal; -harm reduction; -imago relationship therapy; -internalized other interviewing; -inflated responsibility, reduction of; -internet-based therapy; -interpersonal therapy (IPT); -life review therapy (integrative reminiscence therapy); -linking current, past and transference relationships (triangle of person); -mentalizing, promoting; -metacognitive therapy; -metaphor, use of; -method of levels; -mindfulness training; -morita therapy; -motivational enhancement therapy; -motivational interviewing; -narrative exposure; -nidotherapy; -problem solving therapy; -prolonged exposure counterconditioning; -prolonged-grief therapy; -promoting resilience (social/ emotional competence) in children; -puppet play to prepare children for surgery; -reciprocal role procedures, describing and changing; -repairing rupture; -repertory grid technique; -ritual (response) prevention; -schema-focusedemotivebehaviourtherapy; -selfas context; -self-praisetraining; -siblingfighting-reductiontraining; -skills-directedtherapy; -solution-focusedquestioning/brief therapy; -speechrestructuringtherapy; -stimuluscontrol of worry; -taskconcentrationtraining; -time-boundarysettingand interpreting; -time-in management; -tokeneconomy; -transferenceinterpretation; -Triple-P parentingprogram; two-chairdialogue; -validationof feelings; -valuesexplorationand construction; -well-beingtherapy
Classifying therapy procedures 1
-500 years ago Europe’s voyages of discovery collected a host of new species for scientific attention and led to great advances with better classification of species
-today’s clptoo is a voyage of discovery: collecting and comparing entries reveals abundant ingenious practices hidden under diverse names and often known to only a minority of therapists.
-therapists from diverse orientations often use similar procedures
-as entries increase, website visitors need a signposting index to see procedures they’re interested in and domains grouping those
i.e. an empirical classification
Classifying therapy procedures 2some (overlapping) domains & procedures in them
activity/homework tasks encouraged e.g. do things usually avoided, practise skills, challenge beliefs by experiments
behavioralactivation; community reinforcement approach; diary keeping; experiment; exposure (most forms); expressive writing therapy;goal setting; homework; imago relationship therapy; interpersonal therapy; moritatherapy; programmed practice; rehearsal
attention focussing breathing control; compassionate mind training; danger ideation reduction therapy; mindfulness & other meditation; relaxation;task concentration
nidotherapy environmental change to alter behaviour, initiated externally or by selfcommunity reinforcement approach;contingency management; family work for schizophrenia; evoked response arousal plus sensitization;
skills traininganger management; assertiveness, communication & social skillstraining; interpersonal therapy; psychodrama; rehearsal; role play
ANY THERAPIST CAN CONTRIBUTE TOwww.commonlanguagepsychotherapy.org
1. suggest a term for a new procedure-entry [email protected] & [email protected]
2. if term is still open for a clp entry, therapist submits a 1st draft in the clp format
3. draft entry is edited into clp format until author & editor agree final entry
4. accepted entry for the procedure is published on the clp website with author’s name highlighted
CLP now sponsored by 10 organisations

Relation between negative beliefs about worry and thought suppression
Yudai IIJIMA, Yoshihiko TANNOThe University of Tokyo, Japan.E-mail: [email protected]
Keywords: Negative beliefs about worry, Thought suppression, Meta-cognition
AbstractThis study examine whether negative beliefs about worry predict thought suppression and thought suppression predict negative
beliefs. Such a reciprocal relation between negative beliefs about worry and thought suppression was investigated. A two-time pointassessment was conducted with an interval of four weeks. Sixty-nine university students completed two-time point assessment. Theycompleted White Beer Suppression Inventory (WBSI) and Metacognitive Beliefs about Worry Questionnaire. Synchronous effectsmodel was used in analysis. This model showed that thought suppression predicted negative beliefs about worry. This result indicatedthat there may not be reciprocal relation between negative beliefs and thought suppression but only thought suppression mayreinforce negative beliefs.
IntroductionWorry has been determined to be a central factor in generalized anxiety disorder (GAD) and has been associated with other several psychopathological conditions. Negative metacognitive beliefs about worry (like ‘worry is uncontrollable) is one of the core factor in the metacognitive model of GAD. People may often attempt not to think unpleasant thoughts that may trigger worrying. Unfortunately, a simple attempt to suppress a certain thought is often counterproductive; this is considered to be the paradoxical effect of thought suppression. Moreover, the failure of thought suppression may reinforce the belief in uncontrollability. Wells (1995) suggested the relation between negative meta-cognition and thought control in GAD.In the present study, the relation between negative metacognitive beliefs and thought suppression in normal subjects was investigated.
DiscussionThis result indicated that there may not be reciprocal
relation between negative beliefs and thought suppressionbut only thought suppression may reinforce negativebeliefs.Wells(1995) suggested negative meta-cognition (meta-
worry) and thought control reinforce each other. But, inthis study it wasn’t maintained.
MethodInstruments1.Metacognitive Beliefs about Worry Questionnaire(Kanetsuki, Ito, & Nedate,2007).This instrument consists of two subscales: positive meta-
beliefs, negative meta-beliefs. In this study, negativemeta-beliefs only was used (In the resent study(Kanetsuki et al., 2007), the α level for negative meta-beliefs was taken at .95)
2.White Bear Suppression Inventory (WBSI) (Wegner & Zanakos, 1994). The WBSI is a self-report measure of thought suppression. This measure is a widely used instrument and has proven to be a reliable and valid measure in a series of studies.ParticipantsA total of 113 university students (88 men and 25
women) completed a two time-point assessment after aninterval of four weeks. Their mean age was 19.22 years.
Model ConstructionSynchronous effects model (Finkel, 1995)This model shows contemporary reciprocal effects between two variables at a given time point.
ResultsThe path from thought suppression to negative beliefs=.31(p<.001)The path from negative beliefs to thought suppression=.06(n.s)
T2 Thought Suppression
T2 Negative Beliefs
.33*** .06
.72***
.68***
***p<.001
Figure. Synchronous effects model
.55***
T1 Thought Suppression
T1 Negative Beliefs
Worry
Negative meta-beliefs
Thought suppression
χ2(1)=.35,p=.56, GFI=.99, AGFI=.97, RMSEA=.00
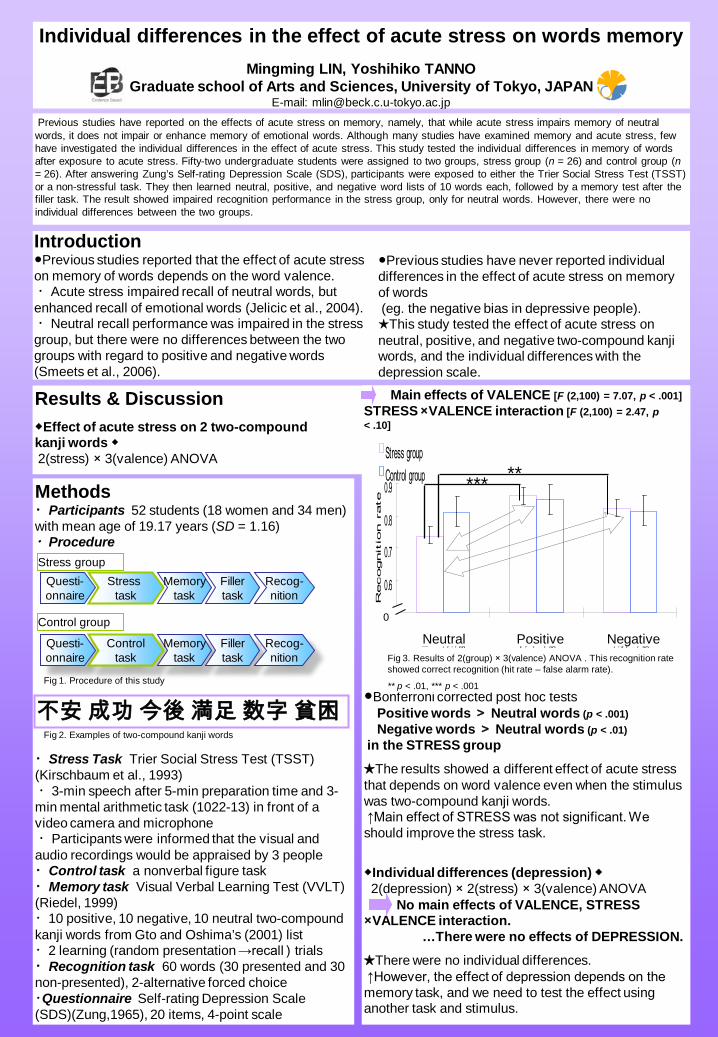
Results & Discussion◆Effect of acute stress on 2 two-compound kanji words ◆2(stress) × 3(valence) ANOVA
Methods・Participants 52 students (18 women and 34 men) with mean age of 19.17 years (SD = 1.16)・Procedure
・Stress Task Trier Social Stress Test (TSST) (Kirschbaum et al., 1993)・3-min speech after 5-min preparation time and 3-min mental arithmetic task (1022-13) in front of a video camera and microphone ・Participants were informed that the visual and audio recordings would be appraised by 3 people・Control task a nonverbal figure task・Memory task Visual Verbal Learning Test (VVLT) (Riedel, 1999) ・10 positive, 10 negative, 10 neutral two-compound kanji words from Gto and Oshima’s (2001) list ・2 learning (random presentation →recall)trials ・Recognition task 60 words (30 presented and 30 non-presented), 2-alternative forced choice・Questionnaire Self-rating Depression Scale (SDS)(Zung,1965), 20 items, 4-point scale
●Previous studies have never reported individual differences in the effect of acute stress on memory of words(eg. the negative bias in depressive people).★This study tested the effect of acute stress on neutral, positive, and negative two-compound kanji words, and the individual differences with the depression scale.
Individual differences in the effect of acute stress on words memoryMingming LIN, Yoshihiko TANNO
Graduate school of Arts and Sciences, University of Tokyo, JAPANE-mail: [email protected]
Previous studies have reported on the effects of acute stress on memory, namely, that while acute stress impairs memory of neutral words, it does not impair or enhance memory of emotional words. Although many studies have examined memory and acute stress, fewhave investigated the individual differences in the effect of acute stress. This study tested the individual differences in memory of words after exposure to acute stress. Fifty-two undergraduate students were assigned to two groups, stress group (n = 26) and control group (n = 26). After answering Zung’s Self-rating Depression Scale (SDS), participants were exposed to either the Trier Social Stress Test (TSST) or a non-stressful task. They then learned neutral, positive, and negative word lists of 10 words each, followed by a memory test after the filler task. The result showed impaired recognition performance in the stress group, only for neutral words. However, there were no individual differences between the two groups.
Introduction●Previous studies reported that the effect of acute stress on memory of words depends on the word valence.・Acute stress impaired recall of neutral words, but enhanced recall of emotional words (Jelicic et al., 2004).・Neutral recall performance was impaired in the stress group, but there were no differences between the two groups with regard to positive and negative words (Smeets et al., 2006).
Main effects of VALENCE [F (2,100) = 7.07, p < .001]STRESS ×VALENCE interaction [F (2,100) = 2.47, p < .10]
●Bonferroni corrected post hoc tests Positive words > Neutral words (p < .001)Negative words > Neutral words (p < .01)
in the STRESS group
★The results showed a different effect of acute stress that depends on word valence even when the stimulus was two-compound kanji words.↑Main effect of STRESS was not significant. We should improve the stress task.
◆Individual differences (depression) ◆2(depression) × 2(stress) × 3(valence) ANOVA
No main effects of VALENCE, STRESS ×VALENCE interaction.
…There were no effects of DEPRESSION.
★There were no individual differences.↑However, the effect of depression depends on the memory task, and we need to test the effect using another task and stimulus.
Questi-onnaire
Stress task
Memorytask
Fillertask
Questi-onnaire
Controltask
Memorytask
Fillertask
Recog-nition
Recog-nition
Stress group
Control group
Fig 1. Procedure of this study
Fig 3. Results of 2(group) × 3(valence) ANOVA . This recognition rate showed correct recognition (hit rate – false alarm rate).
** p < .01, *** p < .001
0.5
0.6
0.7
0.8
0.9
ニュートラル語 ポジティブ語 ネガティブ語
Recognit
ion rate
Stress groupControl group
0
*** **
Neutral Positive Negative
不安成功今後満足数字貧困Fig 2. Examples of two-compound kanji words
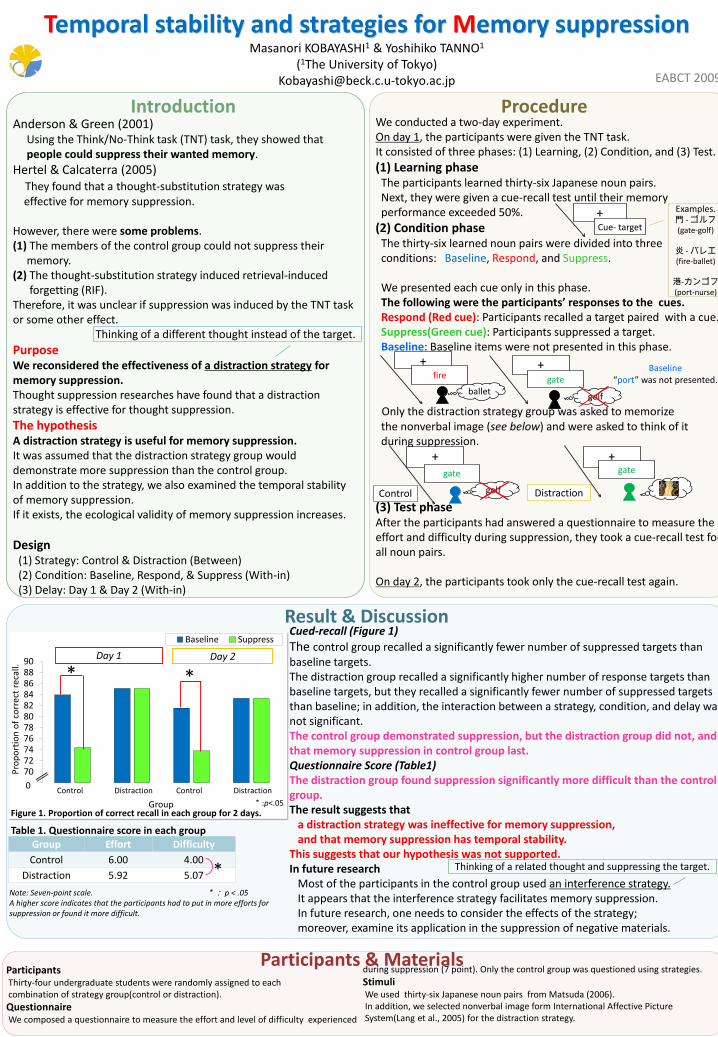
Temporal stability and strategies for Memory suppressionMasanori KOBAYASHI1 & Yoshihiko TANNO1
(1The University of Tokyo)[email protected]
Anderson & Green (2001)Using the Think/No-Think task (TNT) task, they showed that people could suppress their wanted memory.
Hertel & Calcaterra (2005)They found that a thought-substitution strategy waseffective for memory suppression.
However, there were some problems.(1) The members of the control group could not suppress their
memory.(2) The thought-substitution strategy induced retrieval-induced
forgetting (RIF).Therefore, it was unclear if suppression was induced by the TNT task or some other effect.
Purpose We reconsidered the effectiveness of a distraction strategy for memory suppression.Thought suppression researches have found that a distraction strategy is effective for thought suppression.The hypothesisA distraction strategy is useful for memory suppression.It was assumed that the distraction strategy group would demonstrate more suppression than the control group.In addition to the strategy, we also examined the temporal stability of memory suppression.If it exists, the ecological validity of memory suppression increases.
Design(1) Strategy: Control & Distraction (Between)(2) Condition: Baseline, Respond, & Suppress (With-in)(3) Delay: Day 1 & Day 2 (With-in)
Introduction
ParticipantsThirty-four undergraduate students were randomly assigned to each combination of strategy group(control or distraction).QuestionnaireWe composed a questionnaire to measure the effort and level of difficulty experienced
during suppression (7 point). Only the control group was questioned using strategies.StimuliWe used thirty-six Japanese noun pairs from Matsuda (2006).In addition, we selected nonverbal image form International Affective Picture System(Lang et al., 2005) for the distraction strategy.
Participants & Materials
We conducted a two-day experiment. On day 1, the participants were given the TNT task.It consisted of three phases: (1) Learning, (2) Condition, and (3) Test.(1) Learning phaseThe participants learned thirty-six Japanese noun pairs.Next, they were given a cue-recall test until their memory performance exceeded 50%.
(2) Condition phaseThe thirty-six learned noun pairs were divided into three conditions: Baseline, Respond, and Suppress.
We presented each cue only in this phase.The following were the participants’ responses to the cues.Respond (Red cue): Participants recalled a target paired with a cue. Suppress(Green cue): Participants suppressed a target.Baseline: Baseline items were not presented in this phase.
Only the distraction strategy group was asked to memorize the nonverbal image (see below) and were asked to think of it during suppression.
(3) Test phaseAfter the participants had answered a questionnaire to measure the effort and difficulty during suppression, they took a cue-recall test for all noun pairs.
On day 2, the participants took only the cue-recall test again.
+Cue- target
Procedure
Thinking of a different thought instead of the target.
+fire
ballet
+gate
golf
+gate
golf
+gate
Control Distraction
Result & Discussion
Group Effort DifficultyControl 6.00 4.00
Distraction 5.92 5.07
Table 1. Questionnaire score in each group
*
Cued-recall (Figure 1)The control group recalled a significantly fewer number of suppressed targets than baseline targets.The distraction group recalled a significantly higher number of response targets than baseline targets, but they recalled a significantly fewer number of suppressed targets than baseline; in addition, the interaction between a strategy, condition, and delay was not significant.The control group demonstrated suppression, but the distraction group did not, and that memory suppression in control group last.Questionnaire Score (Table1)The distraction group found suppression significantly more difficult than the control group.The result suggests that
a distraction strategy was ineffective for memory suppression, and that memory suppression has temporal stability.
This suggests that our hypothesis was not supported.In future research
Most of the participants in the control group used an interference strategy. It appears that the interference strategy facilitates memory suppression.In future research, one needs to consider the effects of the strategy; moreover, examine its application in the suppression of negative materials.
Examples.門 - ゴルフ(gate-golf)
炎 - バレエ(fire-ballet)
港-カンゴフ(port-nurse)
Baseline“port” was not presented.
Thinking of a related thought and suppressing the target.
Note: Seven-point scale. *: p < .05A higher score indicates that the participants had to put in more efforts for suppression or found it more difficult.
EABCT 2009
687072747678808284868890
Prop
ortio
n of
cor
rect
rec
all.
Group
Baseline Suppress
Control Distraction Control Distraction
Figure 1. Proportion of correct recall in each group for 2 days.
Day 2
* *
0
Day 1
*:p<.05

Istituto di Psicologia e Psicoterapia Cognitivo-Comportamentale
BODY CHECKING AND AVOIDANCE IN OVERWEIGHT SUBJECTSWITH AND WITHOUT BINGE EATING DISORDER
Rossano Bisciglia1, Erika Cordovani1, Igor Dodig1, Luca Filipponi3, Gaetana Pascuzzo1, Susanna Pizzo1, Aldo Galeazzi1,2
(1) Miller Institute, Genoa, (2) Faculty of Psychology Padua University, (3) Department of Biomedical Sciences Chieti University,
Diagnostic criteria for Binge Eating Disorder (BED) in the Diagnostic and Statistical Manual of Mental Disorders (DSM-IV TR; APA, 2000) do not include "self evaluation unduly influenced by body shape and weight" as a central diagnostic feature. However, research has documented the importance of this
feature among overweight individuals diagnosed with BED (Masheb & Grilo, 2000; Wilfley, Schwartz, Spurrell, & Fairburn, 2000; Reas, Grilo, Masheb & Wilson, 2005). This overvaluation of shape and weight, used in determining self-worth, has been conceptualized in cognitive-behavioral models as the core
aspect of eating disorder psychopathology, from which various hallmark eating disorder symptoms stem (Fairbum, Cooper, & .Shafran, 2003).Recently, repetitive body checking and body avoidance have been shown to be behavioral manifestation of the overvaluation of shape and weight among
under-weight and normal-weight eating disorder patients (Shafran, Fairburn, Robinson & Lask, 2003)Clinical lore holds that overweight patients with BED frequently engage in avoidance behaviors, but are believed to do less checking than normal-weight
eating disorder patients. Reas, Grilo, Masheb & Wilson (2005), documented clinically significant levels of checking and avoidance behaviors in overweight men and women diagnosed with Binge Eating Disorder.
Method
The purpose of the current study was twofold. First, our goal was to examine the presence of select body checking
and avoidance behaviors in an overweight sample of Italian men and women diagnosed with and without Binge
Eating Disorder (DSM-IV TR; American Psychiatric Association, 2000).
Second, we examined the relationship between checking and avoidance behaviors in association with the following variables: age, Body Mass Index (BMI), Binge Eating and
dietary restraint.Such an examination would improve the understanding of the roles of checking and avoidance in the maintenance of eating disorders, and extend our understanding of these concepts to overweight subjects with and without BED.
Background
Tabl
e 1.
Aim
Results
The current study examined aspects of body checking and body avoidance in overweight patients diagnosed with and without BED.Our findings indicate that clinically significant levels of checking and avoidance behaviors occur in the group with BED. Consistent with findings by
Shafran et al. (2003), our results support the view that Body Checking and Body Avoidance represent behavioral manifestations of the core eating disorder pathology. These findings also provide preliminary support for the potential role of checking and avoidance in the maintenance of this eating disorder
category.Consistent with earlier findings, with normal weight eating disorder samples, the positive association between checking and avoiding indicated these
behaviors are not mutually exclusive; they may co-occur or alternate in the time (Shafran et al., 2003).Consistent with earlier studies (Wilfley et al., 2000; Reas, Grilo, Masheb e Wilson, 2005), in subjects with BED we note the absence of a significant
correlation between weight status and frequency of body checking and avoidance.This finding echoes previous reports that shape and weight concerns in patients with BED do not vary significantly across levels of BMI (Wilfley et al.,
2000).Thus, it appears that degree of overweight does not substantially impact eating disorder pathology within treatment-seeking patients with BED.
In overweight subjects without BED we observe the presence of a significant correlation between weight status and frequency of Avoidance Behaviours, but not for Body Checking
PARTICIPANTSParticipants were a consecutively evaluated series of 32 treatment seeking overweight italian
adults and 12 no treatment seeking, BMI ≥ 25. 30 subjects met DSM IV-TR (APA, 2000) criteria for Binge Eating Disorder, 14 subjects were not BED. Participants’ mean age was 44,14 years (SD =
12,40). Mean BMI (Kg/m2) was 38,10 (SD = 8,66; range 25,2 – 61,0).Written informed consent was obtained.
PROCEDURES AND MEASURESParticipants completed a battery of self-report measures described below.
The Body Checking Questionnaire (BCQ). The BCQ (Reas, Whisenohunt, Netemeyer & Williamson, 2002) is a 23-item self-report measure of the global construct of body checking, with
3 correlated subfactors related to overall appearance, specific body parts, and idiosyncratic checking behaviors.
The Three-Factor Eating Questionnaire (TFEQ). The TFEQ (Stunkard & Messik, 1985) is a 51 item self-report questionnaire with three subscales reflecting three eating-related domains: Cognitive
Restraint, Disinhibition and HungerThe Body Image Avoidance Questionnaire (BIAQ). The BIAQ (Rosen, Srebnik, Saltzberg &
Wendt, 1991) is a 19 item self-report measure of the avoiding behaviours of situations that might increase the preoccupation about body shape and weight.
Opinions
As shown in Table 1, in overweight subjects Body Checking and Avoidance are both positively and significantly correlated with Eating Restraint. In the group with BED the Eating Restraint is significantly
correlated with Body Checking and Avoidance Behavior; in the group without BED Eating Restraint is significantly correlated with
Avoidance Behavior but not with Body Checking.The subscales correlated with BMI indicating – in the subjects
without BED - the presence of a significant association between weight status and some Body Avoidance behaviors frequency, like
body clothing and social activities; otherwise, there is not any significant association between weight status and Body Checking.The t-Test analysis, that compares the group of subjects with BED
with the group Not BED, shows the statistically significant differences about two variables: Body Clothing and Grooming and
Weighing.
Ref
eren
ces
Total OverweightSubjects (n=44) AGE BMI
OverallAppearanc
e
SpecificBody Parts
Idiosyncratic
Checking
BCQTotal Score
BodyClothing
Social Activities
Eating Restraint
Grooming and
Weighing
BIAQ
TotalScore
AGE 1 .253 -.164 -.025 .275 -.014 .172 .010 -.186 -.035 .076BMI .253 1 -.106 .035 .106 .014 .473** .345* -.078 -.357 .361*BCQ Total Score -.014 .014 .841** .916** .643** 1 .230 .130 .420** .322* .352*BIAQ Total Score .076 .361* .260 .314* .363* .352* .932** .774** .496** -.072 1
Overweight SubjectsWith BED (n=30)
AGE BMIOverall
Appearance
SpecificBody Parts
Idiosyncratic
Checking
BCQTotal Score
BodyClothing
Social Activities
Eating Restraint
Grooming and
Weighing
BIAQ Total Score
AGE 1 .197 -.213 -.032 .170 -.081 .060 -.019 -.254 .146 .004BMI .197 1 -.203 -.151 -.592 -.190 .268 .166 -.248 -.455* .111BCQ Total Score -.081 -.190 .855** .898** .717 1 .166 .161 .512** .357 .350BIAQ Total Score .004 .111 .315 .293 .264 .350 .925** .838** .445* -.239 1
Overweight SubjectsWithout BED (n=14)
AGE BMIOverall
Appearance
SpecificBody Parts
Idiosyncratic
Checking
BCQTotal Score
BodyClothing
Social Activities
Eating Restraint
Grooming and
Weighing
BIAQ Total Score
AGE 1 .192 -.097 .018 .470 .111 .246 -.080 -.051 -.100 .096BMI .192 1 .055 .458 .465 .432 .754** .585* .293 .260 .743**BCQ Total Score .111 .432 .835** .962** .535* 1 .409 .050 .192 .413 .368BIAQ Total Score .096 .743** .079 .409 .563* .368 .960** .594* .651* .625* 1
Table 1. Pearson Correlation Matrix for the variables AGE, BMI, BCQ total score, BIAQ total score (* p< 0.05; ** p< 0.01)
American Psychiatric Association (2000). Diagnostic and Statistical Manual of Mental Disorders, Fourth Edition, Text Revision. Washington D.C.: American Psychiatric Association. Trad. It.. Andreoli, V., Cassano, G.B., & Rossi, R. (2002). DSM-IV-TR. Manuale diagnostico e statistico dei disturbi mentali – Text Revision. Milano: Masson, 2002
Dalle Grave, R., Ghisi, M., Calugi, S. (2006). Body checking in eating disorders: Italian validation of the Body Checking Questionnaire (BCQ). Psicoterapia Cognitiva e Comportamentale, 12(1), 27-39.Grilo, C.M., Reas, D.L., Brody, M.L., Burke-Martindale, C.H., Rothschild, B.S., Masheb, R.M. (2005). Body checking and avoidance and the core features of eating disorders among obese men and women seeking bariatric surgery. Behaviour Research and Therapy, 43,
629–637.Reas, D.L., Grilo, C.M., Masheb, R.M., Wilson, G.T. (2005). Body Checking and Avoidance in Overweight Patients with Binge Eating Disorder. International Journal of Eating Disorders, 37, 342-346.
Reas, D.L.,White, M.A., Grilo, C.M. (2006). Body Checking Questionnaire: Psychometric Properties and Clinical Correlates in Obese Men and Women with Binge Eating Disorder. International Journal of Eating Disorders, 39, 326-331.Riva, G. & Molinari, E. (1998). Replicated factor analysis of the Italian version of the Body Image Avoidance Questionnaire. Perceptual Motor Skill, 86, 1071-1074.
Shafran, R., Fairburn, C., Robinson, P., & Lask, B. (2003). Body checking and its avoidance in eating disorders. International Journal of Eating Disorders, 35, 93–101.Stunkard, A.J. & Messik, S. (1985). The Three Factor Eating Questionnaire to measure dietary restraint, disinhibition and hunger. Journal of Psychosomatic Research, 29, 71-83
Wilfley, D., Schwartz, M., Spurrell, E., & Fairburn, C. (2000). Using the Eating Disorder Examination to identify the specific psychopathology of binge eating disorder. International Journal of Eating Disorders, 27, 259–269.
Mean SD t42 p
Body ClothingSubject with BED 21.73 8.86
-2.12 .04Subject without BED 15.86 7.81
Grooming and Weighing
Subject with BED 5.27 2.193.28 .002Subject without
BED 7.57 2.10
Indipendent Samples t-test
Table 2. Indipendent Samples t-test

Acquisition of Fear and Attention Bias in Children, an Eye Tracking Study
Rohani, S. S., Field, A. P., and Hutton S.School of Psychology, University of Sussex, Brighton, UK
Aim
• In Rachman’s theory (Rachman, 1977) information is one of the pathways to fear: one can learn fear of a stimulus by
receiving negative information about it.• Information can indeed induce fear of a neutral stimulus:
children acquire fear of a novel animal by listening to some negative information about it (e.g., Field, A. P., & Lawson, J.
2003).• Such a fear induction leads to acquiring attention bias: in a dot-probe task, children detect a dot-probe behind the newly
feared animal faster than the dot-probe behind an animal about which they have received no negative information (Field, 2006).• Eye tracking methodology can yield worthwhile information
about the visual attention patterns involved in anxiety, fear and phobia.
• As an example, a pattern of fast orientation-fast avoidance has been found in spider phobics when attending to images of
spiders using this methodology (e.g., Pflugshaupt et al, 2005).
Introduction
Do you think this animal would hurt you?a. No, not at all b. No, not really c. Don’t know/neither d. Yes, probably e. Yes,
definitely
49 primary school children aged between 6-10 (M=7.38, SD=1.34) participated in the study.
Fear Belief Paradigm. In this part of the experiment, first, children’s baseline fear of two Australian marsupials, cuscus and quokka, was measured by Fear Belief Questionnaire (FBQ) which
consists of 8 questions about each animal, such as:
Method
To examine whether attention bias which is resulted from fear induction is reflected in visual scan-paths, when searching actively
in a naturalistic scene.
or
Figure 1. examples of visual scan-paths and RT button response in a target present image
Then, they listened to some negative information about one of the animals, and at the end, their fear of both animals was post-tested.
Visual Search Task. In this part, participants were asked to search in jungle images (two blocks of 54 images) for a cuscus or a quokka, and indicate by pressing a button whether they see the animal. Their
eye movements ware recorded throughout the task.
Results
Visual Search Task
Reaction Time Data. Multilevel regression analysis using bootstrap method revealed a significant effect of receiving negative information on detecting the threat-related animal. In target present trials, participants’ RT when detecting the threat related animal (M=3569.03ms SD=3265.73) comparing with the neutral animal
(M=3999.86, SD=3471.24) was significantly faster (Beta= -560.05,
SE= 183.45, Chi. sq (1)=9.32, p<.01).
Fear Belief Paradigm. After listening to negative information,
children’s fear beliefs scores significantly increased from pre-test (M=1.85, SD=0.76) to post-
test (M=3.255, SD=0.80), t (48)= -10.89, p<.001.
For no information condition, no significant difference between baseline (M=1.90, SD=0.83) and
post-test fear belief scores (M=2.07, SD=0.82) was found, t
(48)= -1.74. p>.05
Figure3. Mean FBQ scores for negative information and no information animals in the baseline and post-test measurements.
Eye Movement Data. A summary of means and multilevel regression results for some of the eye movement indices:
Figure 4. Mean reaction times for negative information and no information animals in
target present and target absent conditions.
Eye Movement Index Type of animal Mean SD Beta SE Chi sq. Sig.
Interest Area (IA) Dwell Time
Threat 1104.07 1278.07-167.05 78.86 8.814 p<.01
Neutral 1235.97 939.77
IA Fixation CountThreat 2.38 1.76
-0.35 .156 5.158 p<.05Neutral 2.67 2.41
Trial Dwell TimeThreat 3172.85 2790.20
-393.21 149.8 6.89 p<.01Neutral 3466.63 2748.59
Trial Fixation CountThreat 10.4 9.16
-1.39 0.493 7.91 p<.01Neutral 11.46 8.93
References:Field, A. P. (2006). Watch out for the beast: Fear information and attention bias in children.
Journal of Clinical Child and Adolescent Psychology, 35(2), 337-345.Field, A. P., & Lawson, J. (2003). Fear information and the development of fears during childhood: effects on implicit fear responses and behavioural avoidance. Behaviour
Research and Therapy, 41, 1277-1293.Rachman, S. J. (1977). The conditioning theory of fear acquisition: A critical examination.
Behaviour Research and Therapy, 15, 375-387.Pflugshaupt, T., Mosimann, U. P., von Wartburg, R., Schmitt, W., Nyffeler, T., & Muri, R. M.
(2005) Hypervigilance-Avoidance Pattern in Spider Phobia. Anxiety Disorders, 19, 105-116.
Conclusion • In accordance with reaction time results, IA dwell time, IA fixation count, trial dwell time and trial fixation count, are significantly lower for threat
stimulus as compared to neutral stimulus. These data indicate that making a decision about whether a stimulus is present in the scene is significantly
quicker if the stimulus is related to threat.
• Since trials terminate after button press response, lower IA dwell time and fixation count on threat stimuli can not be concluded as a fear- avoidance
pattern.
• The difference between IA first fixation time in feared and neutral animals is not significant, therefore an overt attention hyper-vigilance is not supported.
Correspondence should be addressed to Saeid S. Rohani, email: [email protected]
In the table above, all chi squares have a d.f. =1, and Beta represents share of the type of the animal being searched (i.e. whether it is a threat or neutral) in the eye movement
measure.No significant effect was found for other important IA indices, such as First Fixation
Time, First Fixation Duration, Run Count, and Pupil Size.
A FUNCTIONAL ANALYTIC X-RAY OF THE THERAPEUTIC PROCESS
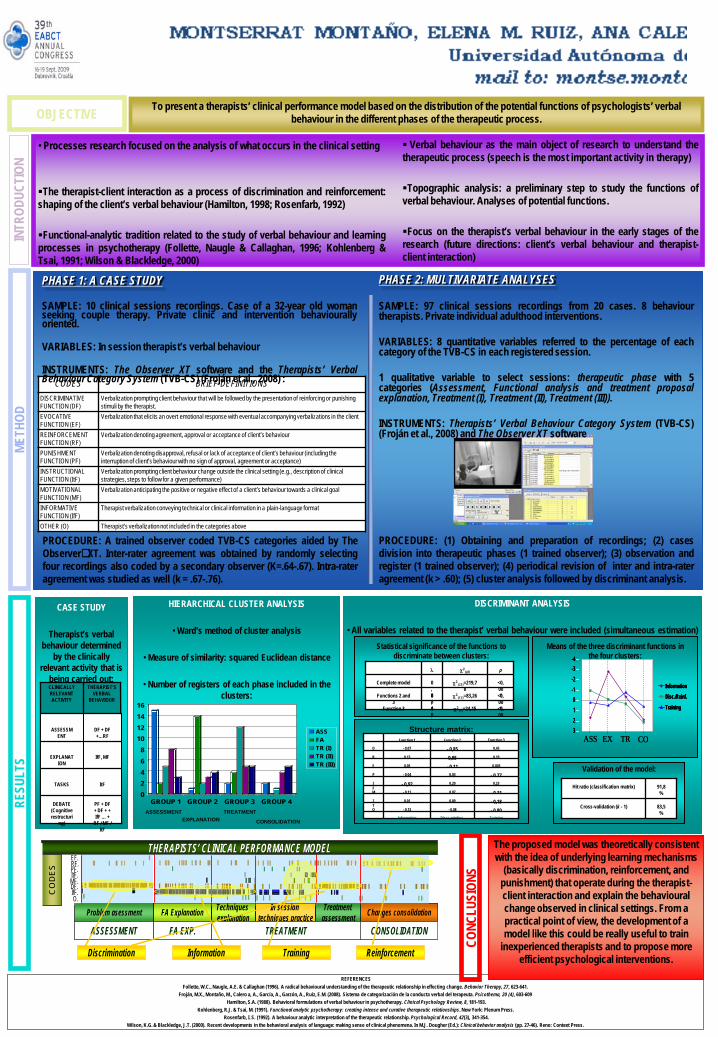
MONTSERRAT MONTAÑO, ELENA M. RUIZ, ANA CALERO, MANUEL ALPAÑÉS & M. XESÚS FROJÁNUniversidad Autónoma de Madrid (Spain)
mail to: [email protected]
REFERENCESFollette, W.C., Naugle, A.E. & Callaghan (1996). A radical behavioural understanding of the therapeutic relationship in effecting change. Behavior Therapy, 27, 623-641.
Froján, M.X., Montaño, M., Calero a, A., García, A., Garzón, A., Ruiz, E.M. (2008). Sistema de categorización de la conducta verbal del terapeuta. Psicothema, 20 (4), 603-609Hamilton, S.A. (1988). Behavioral formulations of verbal behaviour in psychotherapy. Clinical Psychology Review, 8, 181-193.
Kohlenberg, R.J. & Tsai, M. (1991). Functional analytic psychotherapy: creating intense and curative therapeutic relationships. New York: Plenum Press.Rosenfarb, I. S. (1992). A behaviour analytic interpretation of the therapeutic relationship. Psychological Record, 42(3), 341-354.
Wilson, K.G. & Blackledge, J.T. (2000). Recent developments in the behavioral analysis of language: making sense of clinical phenomena. In M.J. Dougher (Ed.): Clinical behavior analysis (pp. 27-46). Reno: Context Press.
INTR
ODUC
TION
• Processes research focused on the analysis of what occurs in the clinical setting
The therapist-client interaction as a process of discrimination and reinforcement:shaping of the client’s verbal behaviour (Hamilton, 1998; Rosenfarb, 1992)
Functional-analytic tradition related to the study of verbal behaviour and learningprocesses in psychotherapy (Follette, Naugle & Callaghan, 1996; Kohlenberg &Tsai, 1991; Wilson & Blackledge, 2000)
Verbal behaviour as the main object of research to understand thetherapeutic process (speech is the most important activity in therapy)
Topographic analysis: a preliminary step to study the functions ofverbal behaviour. Analyses of potential functions.
Focus on the therapist’s verbal behaviour in the early stages of theresearch (future directions: client’s verbal behaviour and therapist-client interaction)
OBJECTIVE To present a therapists’ clinical performance model based on the distribution of the potential functions of psychologists’ verbal behaviour in the different phases of the therapeutic process.
CODES BRIEF DEFINITIONSDISCRIMINATIVE FUNCTION (DF)
Verbalization prompting client behaviour that will be followed by the presentation of reinforcing or punishing stimuli by the therapist.
EVOCATIVE FUNCTION (EF)
Verbalization that elicits an overt emotional response with eventual accompanying verbalizations in the client
REINFORCEMENT FUNCTION (RF)
Verbalization denoting agreement, approval or acceptance of client’s behaviour
PUNISHMENT FUNCTION (PF)
Verbalization denoting disapproval, refusal or lack of acceptance of client’s behaviour (including the interruption of client’s behaviour with no sign of approval, agreement or acceptance)
INSTRUCTIONAL FUNCTION (ItF)
Verbalization prompting client behaviour change outside the clinical setting (e.g., description of clinical strategies, steps to follow for a given performance)
MOTIVATIONAL FUNCTION (MF)
Verbalization anticipating the positive or negative effect of a client’s behaviour towards a clinical goal
INFORMATIVE FUNCTION (IfF)
Therapist verbalization conveying technical or clinical information in a plain-language format
OTHER (O) Therapist’s verbalization not included in the categories above
CONC
LUSI
ONS
METH
OD
PHASE 1: A CASE STUDY
SAMPLE: 10 clinical sessions recordings. Case of a 32-year old womanseeking couple therapy. Private clinic and intervention behaviourallyoriented.
VARIABLES: In session therapist’s verbal behaviour
INSTRUMENTS: The Observer XT software and the Therapists’ VerbalBehaviour Category System (TVB-CS) (Froján et al., 2008) :
PROCEDURE: A trained observer coded TVB-CS categories aided by TheObserverXT. Inter-rater agreement was obtained by randomly selectingfour recordings also coded by a secondary observer (K=.64-.67). Intra-rateragreement was studied as well (k = .67-.76).
PHASE 2: MULTIVARIATE ANALYSES
SAMPLE: 97 clinical sessions recordings from 20 cases. 8 behaviourtherapists. Private individual adulthood interventions.
VARIABLES: 8 quantitative variables referred to the percentage of eachcategory of the TVB-CS in each registered session.
1 qualitative variable to select sessions: therapeutic phase with 5categories (Assessment, Functional analysis and treatment proposalexplanation, Treatment (I), Treatment (II), Treatment (III)).
INSTRUMENTS: Therapists’ Verbal Behaviour Category System (TVB-CS)(Froján et al., 2008) and The Observer XT software
PROCEDURE: (1) Obtaining and preparation of recordings; (2) casesdivision into therapeutic phases (1 trained observer); (3) observation andregister (1 trained observer); (4) periodical revision of inter and intra-rateragreement (k > .60); (5) cluster analysis followed by discriminant analysis.
THERAPISTS’ CLINICAL PERFORMANCE MODELTHERAPISTS’ CLINICAL PERFORMANCE MODELRF.PF.ItF.MF.DF.IfF.O.
EF.
Problem asessment FA Explanation Techniquesexplanation
In sessiontechniques practice
Treatmentassessment Changes consolidation
ASSESSMENT FA EXP. TREATMENT CONSOLIDATION
CO
DES
ReinforcementDiscrimination Information Training
HIERARCHICAL CLUSTER ANALYSIS
• Ward’s method of cluster analysis
• Measure of similarity: squared Euclidean distance
• Number of registers of each phase included in the clusters:
02468
10121416
GROUP 1 GROUP 2 GROUP 3 GROUP 4
ASSFATR (I)TR (II)TR (III)
ASSESSMENTEXPLANATION
TREATMENT
CONSOLIDATION
DISCRIMINANT ANALYSIS
• All variables related to the therapist’ verbal behaviour were included (simultaneous estimation)Statistical significance of the functions to
discriminate between clusters:
<0,001
χ2(5)=24,150
,77
Function 3
<0,001
χ2(12)=83,260
,40
Functions 2 and 3
<0,001
χ2(21)=219,7
80,88
Complete model
pχ2(gl)λ
Validation of the model:
83,5%
Cross-validation (k - 1)
91,8%
Hit ratio (classification matrix)
Structure matrix:
- 0,80- 0,08- 0,13O
- 0,310,07- 0,11M
- 0,180,090,01IT
0,003- 0,110,05E
- 0,770,03- 0,04P
0,230,20- 0,92IF
TrainingDiscr.-reinforc.Information
0,190,950,13R
0,43- 0,85- 0,07D
Function 3Function 2Function 1
Means of the three discriminant functions in the four clusters:
Information
Disc./Reinf.
Training
-4
0123
-1-2-3
TR COEXASS
Information
Disc./Reinf.
Training
Information
Disc./Reinf.
Training
-4-4
00112233
-1-1-2-2-3-3
TR COEXASS
CASE STUDY
Therapist’s verbal behaviour determined
by the clinically relevant activity that is
being carried out:THERAPIST’S
VERBAL BEHAVIOUR
CLINICALLY RELEVANT ACTIVITY
ItFTASKS
IfF, MFEXPLANATION
DF + DF +…RF
ASSESSMENT
PF + DF + DF + + IfF … +
RF / MF / ItF
DEBATE (Cognitive restructuri
ng)
RESU
LTS
The proposed model was theoretically consistent with the idea of underlying learning mechanisms
(basically discrimination, reinforcement, and punishment) that operate during the therapist-client interaction and explain the behavioural change observed in clinical settings. From a practical point of view, the development of a model like this could be really useful to train
inexperienced therapists and to propose more efficient psychological interventions.
privato
Stamp

THERAPIST- CLIENT INTERACTION ANALYSIS BY A SINGLE CASE STUDY
E. M. Ruiz, M. Montaño, A. Calero and M. X. Froján Universidad Autónoma de Madrid (Spain)
Mail to: [email protected]
TO FULLY UNDERSTAND THE THERAPEUTIC PHENOMENON, IT IS NECESARY TO STUDY NOT ONLY
WHAT IS DONE; BUT ALSO WHAT IS SAID IN SESSION WHEN THERAPIST- CLIENT INTERACTION OCCURS.
INTRODUCTION
THROUGH THE STUDY OF A SINGLE CASE WE TRY TO MAKE A FIRST INTENSIVE ANALYSIS
OF THE THERAPEUTIC PROCESS AND TO FORMULATE
HYPOTHESIS IN ORDER TO GUIDE FUTURE CLINICAL
STUDIES.
O B J ET I V E
OUR PROPOSAL
•FUNCTIONAL-ANALYTIC APPROACH FOCUSED ON VERBAL BEHAVIOUR AND LEARNING RESEARCH IN CLINICAL
SETTINGS
•RESEARCH FOCUSED ON THE ANALYSIS OF WHAT OCCURRES IN SESSION: Therapist-client relationship
constitutes a social context where problematic behaviours can be evoked and modified.
•TOPOGRAPHIC ANALYSIS: THE PRELIMINARY STEP TO STUDY FUNCTIONS OF VERBAL BEHAVIOUR
•SINGLE CASE IS A FUNDAMENTAL METHODOLOGY IN CLINICAL RESEARCH. It makes possible an individualistic analysis. Moreover, it allows to plan hypothesis in order
to carry out future and more complex research.
SAM
PLE
10 clinical sessionsrecordings from 1 case
treated in a private centre.
1 behavioural therapist with 15 years of clinical
experience.
The client was a 32 years old woman
attending for relationship problems with partner.
METHOD
INST
RU
ME
NT
S
VARIABLES
•Therapist's verbal behaviour, comprised of 8 levels based on the basic behavioural operations. Registering was made using
an observational code elaborated by the authors (Froján et al., 2008).
•Client's verbal behaviour:Category Brief descriptionProviding with information Verbalization used by the client to try to provide the therapist with
information for the assessment and/or the treatment.Asking for information Client’s question, comment and/or information request to the
therapist.Showing acceptance Client’s verbalization showing agreement, acceptance and/or
admiration in relation to the therapist’s verbalizations.Showing disapproval Client’s verbalization showing disagreement, disapproval and/or
rejection in relation to the therapist’s verbalizations.Verbalizing negative emotion
Expression of negative emotions as a complaint related to the client’ssuffering as a consequence of his problematic behaviors.
Verbalizing positive emotions
Expression of positive emotions as a related to the client's well- being.
Verbalizing achievement Expression of positive emotions related to the achievement of thetherapeutic goals
Verbalizing failure Expression of negative emotions related to the failure of thetherapeutic goals
Following instructions Client’s verbal behavior involving a partial or total following ofinstructions.
No following instructions Client´s verbal behaviour involving a partial or total don´t following ofinstructions.
Showing emotions Expression of reaction emotional or client´s verbal behaviour involvinga reaction emotional
Others Any client’s verbalization that could not be included in the previouscategories.
Software to code, register and analyse observational
data: The Observer XT
PRELIMINARY RESULTS
PHASE OF CLINICAL CHANGES AND CONSOLIDATION- SESSION 10
0
0,05
0,1
0,15
0,2
0,25
0,3
1 2 3 4 5 6 7 8 9 10
Session
Prop
orti
on o
f app
eara
nce Showing
acceptanceShowingdisapproval
0
0,005
0,01
0,015
0,02
0,025
1 2 3 4 5 6 7 8 9 10
Session
Pro
port
ion
of
appa
rean
ce VerbalizingachievementVerbalizingfailure
PHASE OF ASSESSMENT- SESSION 3
0
0,01
0,02
0,03
0,04
0,05
0,06
0,07
1 2 3 4 5 6 7 8 9 10
Session
Pro
port
ion
of
appar
ean
ce
Verbalizingpositiveemotions
Verbalizingnegativeemotions
Showingemotions
0
0,1
0,2
0,3
0,4
0,5
0,6
0,7
0,8
0,9
1 2 3 4 5 6 7 8 9 10
Session
Pro
rtio
n o
f ap
par
ean
ce
Providinginformation
Asking forinformation
PHASE OF FUNCTIONAL ANALYSIS EXPLANATION- SESSION 4
Client´s verbal behaviour
Therapist´s verbal behaviour
PHASE OF TREATMENT- SESSION 6
CONCLUSIONSThis new methodology has been demostrated to be useful toanalyze the therapist- client interaction.
Client´s verbal behaviour changes as psychoterapy progresses.As the therapist´s behaviour changes, the client´s also does andher behaviour gets more adaptative as sessions more forwars.
To describe possible patterns of the therapist-clientinteraction is a first step to identify the learning mechanismsunderlying clinical change.
The study of the therapist- client interaction must be completed with the analysis of non verbal behaviour and
quantitative analysis in order to get a fully comprehension of psychoterapeutic phenomenon
We must to refine the initial observational code system. We expect to develop a more systematic and effective instrument.
FUTURE IMPROVEMENTS
References
•Froján, M. X., Montaño, M., Calero, A., García, A., Garzón, A. y Ruiz, E. (2008). Therapist´s verbal behaviour category system: theorical bases, development and
realiabity analysis. Psicothema, 20, 603-609.

A.Calero-Elvira, M. Montaño-Fidalgo, I. Vargas de la Cruz, M. Alpañés-Freitag, & M. X. Froján-Parga
UNIVERSIDAD AUTÓNOMA DE MADRID
CODING SYSTEM FOR THE STUDY OF CLIENT-THERAPIST INTERACTION: APPLICATION TO THE COGNITIVE RESTRUCTURING TECHNIQUE
• Is it possible to develop a scientifically acceptable coding system to analyzetherapist’s and client’s verbal behaviour during the application of the cognitiverestructuring technique as a complement of previously developed generaltherapist’s coding system (SISC-CVT; Froján et al., 2008)?
• Would it be possible to study interaction between therapist and client in orderto understand the processes that explain change during the application of thistechnique?
To present a coding system for the study of therapist’s and client’s verbal behaviour during the application of the cognitive restructuring technique.
METHOD
SAMPLE28 recordings of
fragments of cognitive-restructuring technique from 11 different cases
4 behavioural therapistsfrom private clinical
centres in Madrid (Spain)
3 PHASES:
Categories’ initial proposal:5 psychologists expert in Behavior Modification proposed some initial
categories for the therapist’s and the client’s verbal behaviour (16
categories for the therapist and 8 for the client)
Pilot observations: 4 independent judges analized 3 transcripts of
sessions with cognitive restructuring tecnique to test the initial categories and to propose some preliminary coding criteria.
Refinement and definitive proposal of the category system: 4 judges observed and registered new 25
clinical sessions with The Observer XT 6.0 and their registers were
compared. Inter-rater agreement was periodically obtained.
PROCEDUREClosed-circuit video camera
system to capture the sessions.
Software to code, register and analyze observational data: The
Observer XT (Noldus Information Technology ®) versions 6.0 and 7.0
INSTRUMENTS
RESULTS
THERAPIST’S CATEGORY SUBSYSTEM (SISC-CVT-RC)
CLIENT’S CATEGORY SUBSYSTEM (SISC-CVC-RC)
• PROVIDING WITH INFORMATION: Verbalization used bythe client to try to provide the therapist with information for theassessment and/or the treatment.
• ASKING FOR INFORMATION: Client’s question, commentand/or information request to the therapist.
• SHOWING ACCEPTANCE: Client’s verbalization showingagreement, acceptance and/or admiration in relation to thetherapist’s verbalizations.
• SHOWING DISAPPROVAL: Client’s verbalization showingdisagreement, disapproval and/or rejection in relation to thetherapist’s verbalizations.
• VERBALIZING NEGATIVE EMOTIONS: Expression ofnegative emotions as a complaint related to the client’s suffering asa consequence of his problematic behaviours. Also verbalizationsby means of which the client shows he is reluctant to accomplishthe proposed home tasks as they would make him suffer.
• VERBALIZING POSITIVE EMOTIONS: Expression ofpositive emotions related to the achievement of the therapeuticgoals or to the situation that the client is living or will live as aconsequence of the achievement of the therapeutic goals or anyother circumstance.
• FOLLOWING INSTRUCTIONS: Client’s verbal behaviourinvolving a partial or total following of instructions givenimmediately before by the therapist.
• OTHERS: Any client’s verbalization that could not be included inthe previous categories.
Observer 1 and 2
PA k p
Fragment 1 70% 0,64 < 0,01
Fragment 2 59% 0,51 < 0,01
Fragment 3 78% 0,74 < 0,01
Observer 1 and 2
PA k p
Fragment 1 70% 0,64 < 0,01
Fragment 2 59% 0,51 < 0,01
Fragment 3 78% 0,74 < 0,01
INTER-RATER AGREEMENT
Observer 1 and 2PA k p
Fragment 1 70% 0,64 < 0,01Fragment 2 59% 0,51 < 0,01Fragment 3 78% 0,74 < 0,01
PA = Percentage ofagreement; k = Cohen’skappa coefficient
SISC-CVC-RC
SISC-CVT-RC
• DISCRIMINATIVE FUNCTION: Therapist’s verbalization thatoccasions a client’s behaviour (verbal or non verbal) that is usuallyfollowed by reinforcement or punishment.
POSSIBLE VARIANTS: without showing the desired direction of theresponse, showing the desired direction of the response,conversational discriminative function, unsuccessful discriminativefunction, “others” discriminative function.
• ELICITATION FUNCTION: Verbalization by the therapist thatelicits an observable emotional response with a verbalizationreferring to its appearance by the client or only this verbalization.
• REINFORCEMENT FUNCTION: Therapist’s verbalization thatshows agreement with, acceptance of and/or approval with thebehaviour shown by the client.
POSSIBLE VARIANTS: conversational reinforcement function, low,medium, high.
• PUNISHMENT FUNCTION: Therapist’s verbalization thatindicate disagreement with, disapproval of and/or rejection of thebehaviour shown by the client.
POSSIBLE VARIANTS: low, medium, high.
• PREPARATION FUNCTION: Therapist’s verbalization thatfacilitates the emission of a certain response by the client.
POSSIBLE VARIANTS: preparation of discriminative, informative,motivational.
• INSTRUCTIONAL FUNCTION: Verbalization by the therapistto promote a given behaviour in the client inside or outside theclinical context. The consequences do not have to be explicitlymentioned, but the steps to be followed by the client must bedescribed.
•OTHERS: Any therapist’s verbalization that could not be includedin any of the above categories.
The obtained levels of inter-rater agreement were at least reasonable (Bakeman, 2000). As for the study of validity, two studies were carried out (Calero-Elvira, 2009) so we can conclude that thecategories cover the range of issues to observe and there were differences in verbal behaviour betweensessions and groups that were theoretically and clinically coherent.It is possible to study interaction with this system to try to understand the underlying processes.Future lines of research: trying to improve inter-rater agreement, more studies on validity, studies toidentify the factors related with a higher effectiveness in the application of the technique.
RESEARCH QUESTIONS
OBJECTIVE
DISCUSSION
REFERENCESBakeman, R. (2000). Behavioural observation and coding. In H. T.Reis & C. M. Judd (Eds.), Handbook of research methods in socialand personality psychology (pp. 138-159). Cambridge: CambridgeUniversity Press.
Calero-Elvira, A. (2009). Analysis of interaction between therapistand client during the application of the cognitive restructuringtechnique. Unpublished doctoral dissertation, UniversidadAutónoma de Madrid, Madrid.
Froján-Parga, M. X., Montaño-Fidalgo, M., Calero-Elvira, A., García-Soler, A., Garzón-Fernández, A., & Ruiz-Sancho, E. (2008). Sistemade categorización de la conducta verbal del terapeuta [Therapist’sverbal behaviour coding system]. Psicothema, 20, 603-609.
Observer 1 and 2PA k p
Fragment 1 85% 0,73 < 0,01Fragment 2 86% 0,75 < 0,01Fragment 3 68% 0,51 < 0,01

Development and initial validation of an adolescent version of Tylka’s Intuitive Eating Scale
Carlo Chiorri1, Valeria Battini1,2 & Antonella Arata2
1Department of Anthropological Sciences, Psychology Unit, University of Genoa, [email protected] Disorder Unit, A.S.L. 3, Genoa
Università degli Studi di GenovaDipartimento di Scienze Antropologiche
Sezione di PsicologiaCorso Podestà, 2, 16128 Genova (Italy)
Dipartimento di Scienze Antropologiche
The Positive Pole of Eating Behaviours
Instruments that assess eating behaviours (EBs) have traditionally focused on pathology. However,
it has been shown that measures of Intuitive Eating, i.e., eating behaviour based on
physiological hunger and satiety cues rather than situational and emotional cues, were predictors of
well-being measures independent of eating disorder symptomatology (Tylka & Wilcox, 2006).
Measuring Intuitive Eating
Tylka (2006) developed a 21-item instrument, the Intuitive Eating Scale (IES), which assesses the three core components of intuitive eating: (a) Unconditional Permission to Eat (UPE, 9 items; e.g., “If I am craving a certain food, I allow myself to have it”), (b) Eating for
Physical Rather Than Emotional Reasons (EPR, 6 items; e.g., “I stop eating when I feel full [not
overstuffed]”), and (c) Reliance on Internal Hunger / Satiety Cues (RIH/SC, 6 items; e.g., “I trust my body to
tell me how much to eat”).
Development of the IES-A
Content and wording of the IES are not fully suitable for administration to adolescents. Starting
from the Italian adaptation of the IES (Chiorri, in press), an adolescent version of the IES (IES-A) was
developed.
1. I try to avoid certain foods high in fat, carbohydrates, or calories.2. I stop eating when I feel full (not overstuffed).
3. I find myself eating when I'm feeling emotional (e.g., anxious, depressed, sad), even when I'm not physically hungry.
4. If I am craving a certain food, I allow myself to have it.5. I follow a specific diet that dictate what, when, and/or how much to eat.
6. I find myself eating when I am bored, even when I'm not physically hungry.7. I can tell when I'm slightly full.
8. I can tell when I'm slightly hungry.9a. I can't eat something unhealthy (e.g. fat foods).
9b. I commit myself not to eat something unhealthy (e.g. fat foods).10. I find myself eating when I am lonely, even when I'm not physically hungry.
11. It is my body that tells me when to eat.12. It is my body that tells me what to eat.
13. It is my body that tells me how much to eat.14. I have forbidden foods that I don't allow myself to eat.
15. When I'm eating, I can tell when I am getting full.16. I use food to help me soothe my negative emotions.
17. I find myself eating when I am stressed out, even when I'm not physically hungry.18. I feel guilty if I eat a certain food that is high in calories, fat, or carbohydrates.
19. I think of a certain food as "good"or "bad" depending on its nutritional content.20. I am not sure I can resist eating tasty but fat foods.
21. I wish my mother did not keep in my house because I think that I may lose control and eat them.
Note: Bolded items are those modified from the original version; the original IES-A is in Italian, this English version is for explantory purposes only
Method
The IES-A was administered to 717 adolescents (70% females, mean age 15.25 ±0.71, range 13-19)
together with a socio-demographical questionnaire about EBs, attitudes toward food, physical
appearance and activity, and a brief battery of other measures (Rosenberg's Self-Esteem Scale [RSES], the OBQ Perfectionism Scale [OBQ-P] and General Self-Efficacy, [GSE]). To cross-validate results, the
total sample was randomly splitted into two subsamples. To cross-validate results, the total
sample was randomly splitted into two subsamples.
Results
Exploratory factor analyses on subsample-1 data showed that either a three- or a four-factor measurement
model could be considered adequate. Confirmatory factor analyses on subsample-2 showed that the four-
correlated-factor measurement model showed substantially higher fit indices. The correlations of IES-A scales with socio-demographical variables and the other
psychometric measures supported the criterion and construct validity of the new instrument.
EPR UPC RIH SC α
Items3, 6, 10, 16,
17, 201, 4(R), 5, 9a, 9b, 14
11, 12, 13
2, 7, 8, 15
EPR - .16 -.12 -.17 .83UPE - -.20 -.14 .80RIH - .35 .63SC - .74
Gender* .17 -.08 .18 .23Age .00 .03 .05 -.09corrected BMI -.19 .08 .09 -.06RSES .26 .18 -0.1 -.12 .84OBQ-P -.07 -.23 .09 .11 .83
GSE .28 .09 -.09 -.16 .84
Conclusions
The IES-A appears to be a valid and reliable tool for assessing intuitive eating in adolescents, while
retaining the sound psychometric properties of its original version. Further research is needed to provide more support to IES-A construct and
criterion validity and to investigate its test-retest reliability and sensitivity to change.
* F=0, M=1; Bolded coefficients are those >|.20|, suggesting a substantial association
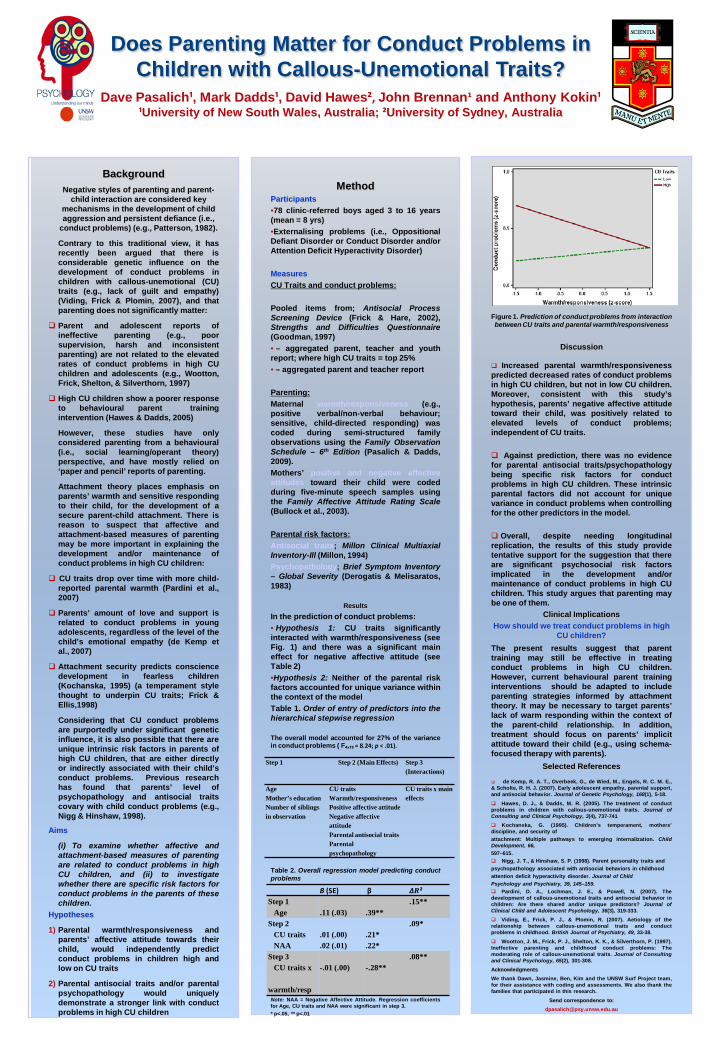
BackgroundNegative styles of parenting and parent-
child interaction are considered key mechanisms in the development of child aggression and persistent defiance (i.e.,
conduct problems) (e.g., Patterson, 1982).
Contrary to this traditional view, it hasrecently been argued that there isconsiderable genetic influence on thedevelopment of conduct problems inchildren with callous-unemotional (CU)traits (e.g., lack of guilt and empathy)(Viding, Frick & Plomin, 2007), and thatparenting does not significantly matter:
Parent and adolescent reports ofineffective parenting (e.g., poorsupervision, harsh and inconsistentparenting) are not related to the elevatedrates of conduct problems in high CUchildren and adolescents (e.g., Wootton,Frick, Shelton, & Silverthorn, 1997)
High CU children show a poorer responseto behavioural parent trainingintervention (Hawes & Dadds, 2005)
However, these studies have onlyconsidered parenting from a behavioural(i.e., social learning/operant theory)perspective, and have mostly relied on‘paper and pencil’ reports of parenting.
Attachment theory places emphasis onparents’ warmth and sensitive respondingto their child, for the development of asecure parent-child attachment. There isreason to suspect that affective andattachment-based measures of parentingmay be more important in explaining thedevelopment and/or maintenance ofconduct problems in high CU children:
CU traits drop over time with more child-reported parental warmth (Pardini et al.,2007)
Parents’ amount of love and support isrelated to conduct problems in youngadolescents, regardless of the level of thechild’s emotional empathy (de Kemp etal., 2007)
Attachment security predicts consciencedevelopment in fearless children(Kochanska, 1995) (a temperament stylethought to underpin CU traits; Frick &Ellis,1998)
Considering that CU conduct problemsare purportedly under significant geneticinfluence, it is also possible that there areunique intrinsic risk factors in parents ofhigh CU children, that are either directlyor indirectly associated with their child’sconduct problems. Previous researchhas found that parents’ level ofpsychopathology and antisocial traitscovary with child conduct problems (e.g.,Nigg & Hinshaw, 1998).
Aims
(i) To examine whether affective andattachment-based measures of parentingare related to conduct problems in highCU children, and (ii) to investigatewhether there are specific risk factors forconduct problems in the parents of thesechildren.
Hypotheses
1) Parental warmth/responsiveness andparents’ affective attitude towards theirchild, would independently predictconduct problems in children high andlow on CU traits
2) Parental antisocial traits and/or parentalpsychopathology would uniquelydemonstrate a stronger link with conductproblems in high CU children
MethodParticipants•78 clinic-referred boys aged 3 to 16 years(mean = 8 yrs)•Externalising problems (i.e., OppositionalDefiant Disorder or Conduct Disorder and/orAttention Deficit Hyperactivity Disorder)
MeasuresCU Traits and conduct problems:
Pooled items from; Antisocial ProcessScreening Device (Frick & Hare, 2002),Strengths and Difficulties Questionnaire(Goodman, 1997)• – aggregated parent, teacher and youthreport; where high CU traits = top 25%• – aggregated parent and teacher report
Parenting:Maternal warmth/responsiveness (e.g.,positive verbal/non-verbal behaviour;sensitive, child-directed responding) wascoded during semi-structured familyobservations using the Family ObservationSchedule – 6th Edition (Pasalich & Dadds,2009).Mothers’ positive and negative affectiveattitudes toward their child were codedduring five-minute speech samples usingthe Family Affective Attitude Rating Scale(Bullock et al., 2003).
Parental risk factors:Antisocial traits; Millon Clinical MultiaxialInventory-Ill (Millon, 1994)Psychopathology; Brief Symptom Inventory– Global Severity (Derogatis & Melisaratos,1983)
ResultsIn the prediction of conduct problems:• Hypothesis 1: CU traits significantlyinteracted with warmth/responsiveness (seeFig. 1) and there was a significant maineffect for negative affective attitude (seeTable 2)•Hypothesis 2: Neither of the parental riskfactors accounted for unique variance withinthe context of the modelTable 1. Order of entry of predictors into thehierarchical stepwise regression
The overall model accounted for 27% of the variancein conduct problems ( F₄,₇₃ = 8.24; p < .01).
Table 2. Overall regression model predicting conductproblems
Note: NAA = Negative Affective Attitude. Regression coefficientsfor Age, CU traits and NAA were significant in step 3.* p<.05, ** p<.01
Does Parenting Matter for Conduct Problems in Children with Callous-Unemotional Traits?
Dave Pasalich¹, Mark Dadds¹, David Hawes², John Brennan¹ and Anthony Kokin¹¹University of New South Wales, Australia; ²University of Sydney, Australia
Figure 1. Prediction of conduct problems from interaction between CU traits and parental warmth/responsiveness
Discussion
Increased parental warmth/responsivenesspredicted decreased rates of conduct problemsin high CU children, but not in low CU children.Moreover, consistent with this study’shypothesis, parents’ negative affective attitudetoward their child, was positively related toelevated levels of conduct problems;independent of CU traits.
Against prediction, there was no evidencefor parental antisocial traits/psychopathologybeing specific risk factors for conductproblems in high CU children. These intrinsicparental factors did not account for uniquevariance in conduct problems when controllingfor the other predictors in the model.
Overall, despite needing longitudinalreplication, the results of this study providetentative support for the suggestion that thereare significant psychosocial risk factorsimplicated in the development and/ormaintenance of conduct problems in high CUchildren. This study argues that parenting maybe one of them.
Clinical ImplicationsHow should we treat conduct problems in high
CU children?The present results suggest that parenttraining may still be effective in treatingconduct problems in high CU children.However, current behavioural parent traininginterventions should be adapted to includeparenting strategies informed by attachmenttheory. It may be necessary to target parents’lack of warm responding within the context ofthe parent-child relationship. In addition,treatment should focus on parents’ implicitattitude toward their child (e.g., using schema-focused therapy with parents).
Selected References
de Kemp, R. A. T., Overbeek, G., de Wied, M., Engels, R. C. M. E.,& Scholte, R. H. J. (2007). Early adolescent empathy, parental support,and antisocial behavior. Journal of Genetic Psychology, 168(1), 5-18. Hawes, D. J., & Dadds, M. R. (2005). The treatment of conductproblems in children with callous-unemotional traits. Journal ofConsulting and Clinical Psychology, 3(4), 737-741 Kochanska, G. (1995). Children’s temperament, mothers’discipline, and security ofattachment: Multiple pathways to emerging internalization. ChildDevelopment, 66,597–615. Nigg, J. T., & Hinshaw, S. P. (1998). Parent personality traits andpsychopathology associated with antisocial behaviors in childhoodattention deficit hyperactivity disorder. Journal of ChildPsychology and Psychiatry, 39, 145–159. Pardini, D. A., Lochman, J. E., & Powell, N. (2007). Thedevelopment of callous-unemotional traits and antisocial behavior inchildren: Are there shared and/or unique predictors? Journal ofClinical Child and Adolescent Psychology, 36(3), 319-333. Viding, E., Frick, P. J., & Plomin, R. (2007). Aetiology of therelationship between callous-unemotional traits and conductproblems in childhood. British Journal of Psychiatry, 49, 33-38. Wootton, J. M., Frick, P. J., Shelton, K. K., & Silverthorn, P. (1997).Ineffective parenting and childhood conduct problems: Themoderating role of callous-unemotional traits. Journal of Consultingand Clinical Psychology, 65(2), 301-308.AcknowledgmentsWe thank Dawn, Jasmine, Ben, Kim and the UNSW Surf Project team,for their assistance with coding and assessments. We also thank thefamilies that participated in this research.
Send correspondence to:[email protected]
Step 1 Step 2 (Main Effects) Step 3 (Interactions)
AgeMother’s educationNumber of siblings in observation
CU traitsWarmth/responsivenessPositive affective attitudeNegative affective attitudeParental antisocial traitsParental psychopathology
CU traits x main effects
B (SE) β ∆R²Step 1
Age .11 (.03) .39**.15**
Step 2CU traitsNAA
.01 (.00)
.02 (.01).21*.22*
.09*
Step 3CU traits x
warmth/resp
-.01 (.00) -.28**.08**
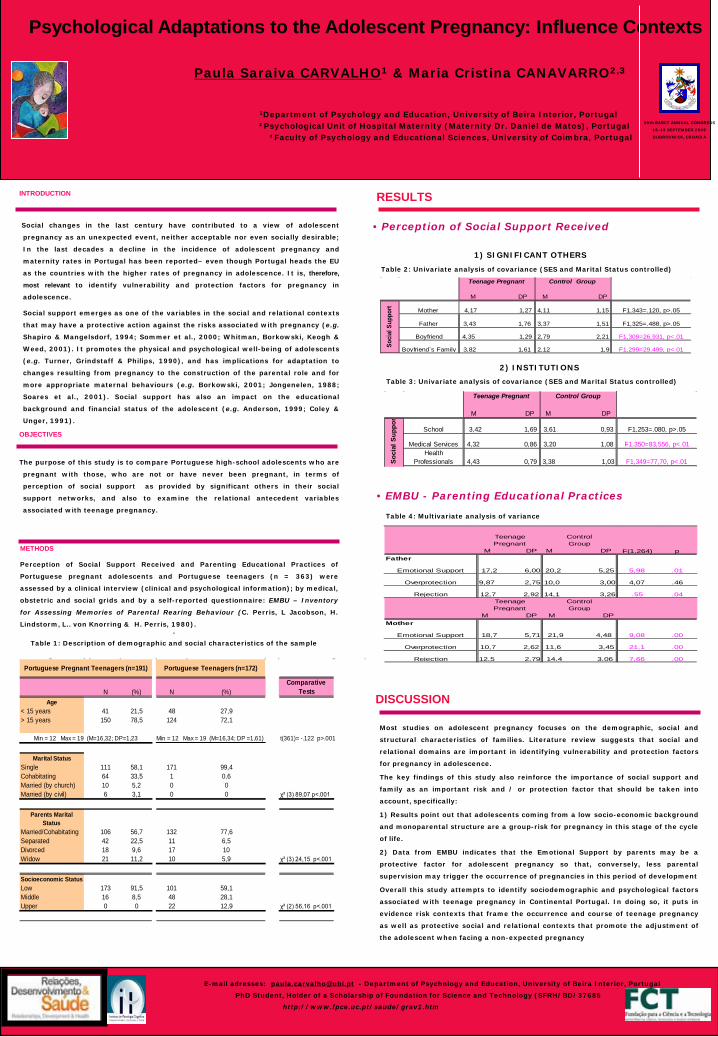
• Perception of Social Support Received
E-mail adresses: [email protected] - Department of Psychology and Education, University of Beira Interior, Portugal
PhD Student, Holder of a Scholarship of Foundation for Science and Technology (SFRH/BD/37685
http://www.fpce.uc.pt/saude/grav1.htm
Psychological Adaptations to the Adolescent Pregnancy: Influence Contexts
Paula Saraiva CARVALHO1 & Maria Cristina CANAVARRO2,3
1Department of Psychology and Education, University of Beira Interior, Portugal²Psychological Unit of Hospital Maternity (Maternity Dr. Daniel de Matos), Portugal
³Faculty of Psychology and Educational Sciences, University of Coimbra, Portugal
INTRODUCTION
Social changes in the last century have contributed to a view of adolescent
pregnancy as an unexpected event, neither acceptable nor even socially desirable;
In the last decades a decline in the incidence of adolescent pregnancy and
maternity rates in Portugal has been reported– even though Portugal heads the EU
as the countries with the higher rates of pregnancy in adolescence. It is, therefore,
most relevant to identify vulnerability and protection factors for pregnancy in
adolescence.
Social support emerges as one of the variables in the social and relational contexts
that may have a protective action against the risks associated with pregnancy (e.g.
Shapiro & Mangelsdorf, 1994; Sommer et al., 2000; Whitman, Borkowski, Keogh &
Weed, 2001). It promotes the physical and psychological well-being of adolescents
(e.g. Turner, Grindstaff & Philips, 1990), and has implications for adaptation to
changes resulting from pregnancy to the construction of the parental role and for
more appropriate maternal behaviours (e.g. Borkowski, 2001; Jongenelen, 1988;
Soares et al., 2001). Social support has also an impact on the educational
background and financial status of the adolescent (e.g. Anderson, 1999; Coley &
Unger, 1991).
OBJECTIVES
The purpose of this study is to compare Portuguese high-school adolescents who are
pregnant with those, who are not or have never been pregnant, in terms of
perception of social support as provided by significant others in their social
support networks, and also to examine the relational antecedent variables
associated with teenage pregnancy.
METHODS
Perception of Social Support Received and Parenting Educational Practices of
Portuguese pregnant adolescents and Portuguese teenagers (n = 363) were
assessed by a clinical interview (clinical and psychological information); by medical,
obstetric and social grids and by a self-reported questionnaire: EMBU – Inventory
for Assessing Memories of Parental Rearing Behaviour (C. Perris, L Jacobson, H.
Lindstorm, L.. von Knorring & H. Perris, 1980)..
Table 1: Description of demographic and social characteristics of the sample
Table 2: Univariate analysis of covariance (SES and Marital Status controlled)
Most studies on adolescent pregnancy focuses on the demographic, social and
structural characteristics of families. Literature review suggests that social and
relational domains are important in identifying vulnerability and protection factors
for pregnancy in adolescence.
The key findings of this study also reinforce the importance of social support and
family as an important risk and / or protection factor that should be taken into
account, specifically:
1) Results point out that adolescents coming from a low socio-economic background
and monoparental structure are a group-risk for pregnancy in this stage of the cycle
of life.
2) Data from EMBU indicates that the Emotional Support by parents may be a
protective factor for adolescent pregnancy so that, conversely, less parental
supervision may trigger the occurrence of pregnancies in this period of development
Overall this study attempts to identify sociodemographic and psychological factors
associated with teenage pregnancy in Continental Portugal. In doing so, it puts in
evidence risk contexts that frame the occurrence and course of teenage pregnancy
as well as protective social and relational contexts that promote the adjustment of
the adolescent when facing a non-expected pregnancy
DISCUSSION
39th EABCT ANNUAL CONGRESS
16-19 SEPTEMBER 2009
DUBROVNICK, CROACIA
RESULTS
Table 4: Multivariate analysis of variance
Teenage Pregnant Control Group
M DP M DP
2,79 2,21 F1,309=26,931, p<.01
Boyfriend`s Family 3,82 1,61 2,12 1,9 F1,299=29,499, p<.01
Mother 4,17 1,27 4,11 1,15 F1,343=.120, p>.05
Soci
al S
uppo
rt
Father 3,43 1,76 3,37 1,51 F1,325=.488, p>.05
Boyfriend 4,35 1,29
1) SIGNIFICANT OTHERS
2) INSTITUTIONS
Teenage Pregnant Control Group
M DP M DP
Soc
ial S
uppo
r
School 3,42 1,69 3,61 0,93 F1,253=.080, p>.05
Medical Services 4,32 0,86 3,20 1,08 F1,350=83,556, p<.01Health
Professionals 4,43 0,79 3,38 1,03 F1,349=77,70, p<.01
Table 3: Univariate analysis of covariance (SES and Marital Status controlled)
• EMBU - Parenting Educational Practices
Teenage Pregnant
ControlGroup
M DP M DPFather
Teenage Pregnant
ControlGroup
M DP M DPMother
7,66 .00
4,07 .46
.55 .04
9,08 .00
21,1
F(1,264) p
5,98 .01
.00Overprotection 10,7 2,62 11,6 3,45
Rejection 12,5 2,79 14,4 3,06
18,7 5,71 21,9 4,48Emotional Support
Overprotection 9,87 2,75 10,0 3,00
Rejection 12,7 2,92 14,1 3,26
17,2 6,00 20,2 5,25Emotional Support
N (%) N (%)Comparative
Tests
41 21,5 48 27,9150 78,5 124 72,1
t(361)= -.122 p>.001
111 58,1 171 99,464 33,5 1 0,610 5,2 0 06 3,1 0 0 χ² (3) 89,07 p<.001
106 56,7 132 77,642 22,5 11 6,518 9,6 17 1021 11,2 10 5,9 χ² (3) 24,15 p<.001
173 91,5 101 59,116 8,5 48 28,10 0 22 12,9 χ² (2) 56,16 p<.001
Min = 12 Max = 19 (M=16,34; DP =1,61)
Portuguese Pregnant Teenagers (n=191) Portuguese Teenagers (n=172)
Age< 15 years> 15 years
Min = 12 Max = 19 (M=16,32; DP=1,23
Parents Marital Status
Marital StatusSingleCohabitatingMarried (by church)Married (by civil)
Married/CohabitatingSeparatedDivorcedWidow
Upper
Socioeconomic StatusLowMiddle
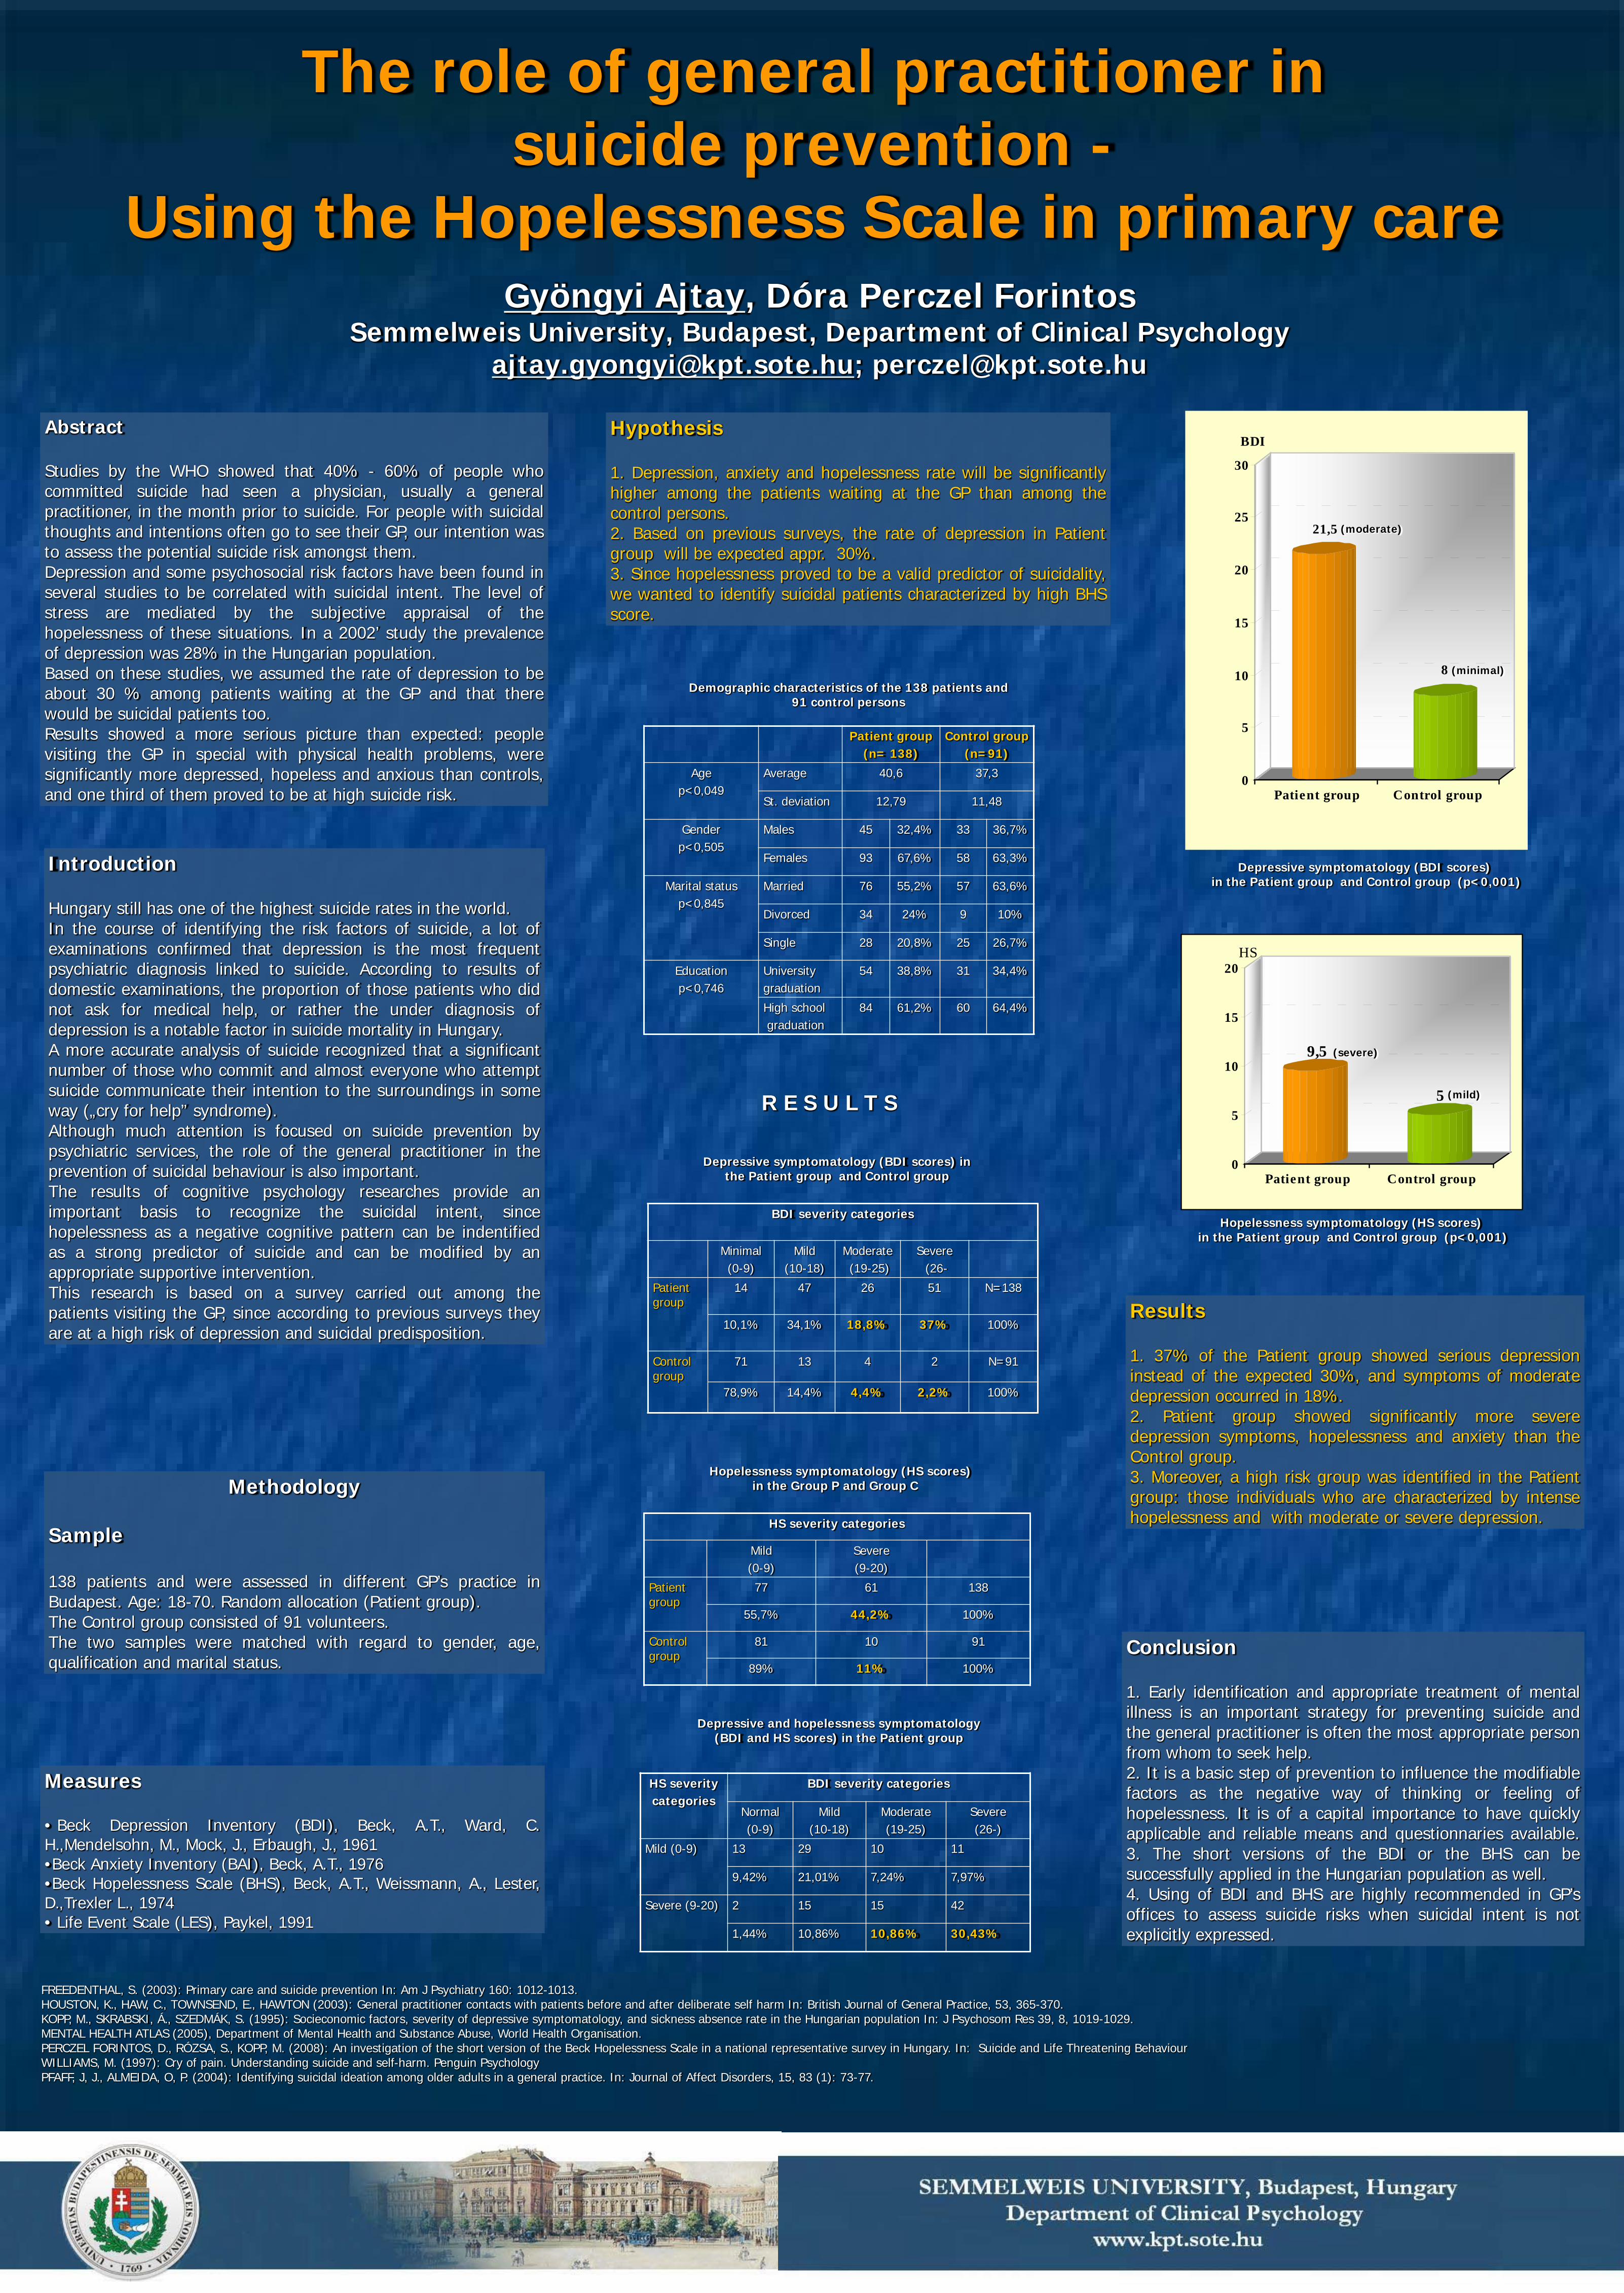
BDI severity categories
Minimal (0-9)
Mild (10-18)
Moderate(19-25)
Severe(26-
Patient group
14 47 26 51 N=138
10,1% 34,1% 18,8% 37% 100%
Control group
71 13 4 2 N=91
78,9% 14,4% 4,4% 2,2% 100%
Abstract
Studies by the WHO showed that 40% - 60% of people whocommitted suicide had seen a physician, usually a generalpractitioner, in the month prior to suicide. For people with suicidalthoughts and intentions often go to see their GP, our intention wasto assess the potential suicide risk amongst them.Depression and some psychosocial risk factors have been found inseveral studies to be correlated with suicidal intent. The level ofstress are mediated by the subjective appraisal of thehopelessness of these situations. In a 2002’ study the prevalenceof depression was 28% in the Hungarian population.Based on these studies, we assumed the rate of depression to beabout 30 % among patients waiting at the GP and that therewould be suicidal patients too.Results showed a more serious picture than expected: peoplevisiting the GP in special with physical health problems, weresignificantly more depressed, hopeless and anxious than controls,and one third of them proved to be at high suicide risk.
The role of general practitioner in suicide prevention -
Using the Hopelessness Scale in primary careGyöngyi Ajtay, Dóra Perczel Forintos
Semmelweis University, Budapest, Department of Clinical [email protected]; [email protected]
Introduction
Hungary still has one of the highest suicide rates in the world.In the course of identifying the risk factors of suicide, a lot ofexaminations confirmed that depression is the most frequentpsychiatric diagnosis linked to suicide. According to results ofdomestic examinations, the proportion of those patients who didnot ask for medical help, or rather the under diagnosis ofdepression is a notable factor in suicide mortality in Hungary.A more accurate analysis of suicide recognized that a significantnumber of those who commit and almost everyone who attemptsuicide communicate their intention to the surroundings in someway („cry for help” syndrome).Although much attention is focused on suicide prevention bypsychiatric services, the role of the general practitioner in theprevention of suicidal behaviour is also important.The results of cognitive psychology researches provide animportant basis to recognize the suicidal intent, sincehopelessness as a negative cognitive pattern can be indentifiedas a strong predictor of suicide and can be modified by anappropriate supportive intervention.This research is based on a survey carried out among thepatients visiting the GP, since according to previous surveys theyare at a high risk of depression and suicidal predisposition.
Methodology
Sample
138 patients and were assessed in different GP’s practice inBudapest. Age: 18-70. Random allocation (Patient group).The Control group consisted of 91 volunteers.The two samples were matched with regard to gender, age,qualification and marital status.
Patient group (n= 138)
Control group(n=91)
Age p<0,049
Average 40,6 37,3
St. deviation 12,79 11,48
Gender p<0,505
Males 45 32,4% 33 36,7%
Females 93 67,6% 58 63,3%
Marital status p<0,845
Married 76 55,2% 57 63,6%
Divorced 34 24% 9 10%
Single 28 20,8% 25 26,7%
Education p<0,746
University graduation
54 38,8% 31 34,4%
High schoolgraduation
84 61,2% 60 64,4%
Demographic characteristics of the 138 patients and 91 control persons
Measures
• Beck Depression Inventory (BDI), Beck, A.T., Ward, C.H.,Mendelsohn, M., Mock, J., Erbaugh, J., 1961•Beck Anxiety Inventory (BAI), Beck, A.T., 1976•Beck Hopelessness Scale (BHS), Beck, A.T., Weissmann, A., Lester,D.,Trexler L., 1974• Life Event Scale (LES), Paykel, 1991
Hypothesis
1. Depression, anxiety and hopelessness rate will be significantlyhigher among the patients waiting at the GP than among thecontrol persons.2. Based on previous surveys, the rate of depression in Patientgroup will be expected appr. 30%.3. Since hopelessness proved to be a valid predictor of suicidality,we wanted to identify suicidal patients characterized by high BHSscore.
Depressive symptomatology (BDI scores) in the Patient group and Control group
R E S U L T S
Hopelessness symptomatology (HS scores) in the Group P and Group C
HS severity categories
Mild (0-9)
Severe (9-20)
Patient group
77 61 138
55,7% 44,2% 100%
Control group
81 10 91
89% 11% 100%
Depressive and hopelessness symptomatology (BDI and HS scores) in the Patient group
HS severity categories
BDI severity categories
Normal(0-9)
Mild(10-18)
Moderate(19-25)
Severe(26-)
Mild (0-9) 13 29 10 11
9,42% 21,01% 7,24% 7,97%
Severe (9-20) 2 15 15 42
1,44% 10,86% 10,86% 30,43%
21,5
8
0
5
10
15
20
25
30
BDI
Patient group Control group
Depressive symptomatology (BDI scores)in the Patient group and Control group (p<0,001)
9,5
5
0
5
10
15
20HS
Patient group Control group
Hopelessness symptomatology (HS scores)in the Patient group and Control group (p<0,001)
Results
1. 37% of the Patient group showed serious depressioninstead of the expected 30%, and symptoms of moderatedepression occurred in 18%.2. Patient group showed significantly more severedepression symptoms, hopelessness and anxiety than theControl group.3. Moreover, a high risk group was identified in the Patientgroup: those individuals who are characterized by intensehopelessness and with moderate or severe depression.
Conclusion
1. Early identification and appropriate treatment of mentalillness is an important strategy for preventing suicide andthe general practitioner is often the most appropriate personfrom whom to seek help.2. It is a basic step of prevention to influence the modifiablefactors as the negative way of thinking or feeling ofhopelessness. It is of a capital importance to have quicklyapplicable and reliable means and questionnaries available.3. The short versions of the BDI or the BHS can besuccessfully applied in the Hungarian population as well.4. Using of BDI and BHS are highly recommended in GP’soffices to assess suicide risks when suicidal intent is notexplicitly expressed.
FREEDENTHAL, S. (2003): Primary care and suicide prevention In: Am J Psychiatry 160: 1012-1013. HOUSTON, K., HAW, C., TOWNSEND, E., HAWTON (2003): General practitioner contacts with patients before and after deliberate self harm In: British Journal of General Practice, 53, 365-370. KOPP, M., SKRABSKI, Á., SZEDMÁK, S. (1995): Socieconomic factors, severity of depressive symptomatology, and sickness absence rate in the Hungarian population In: J Psychosom Res 39, 8, 1019-1029.MENTAL HEALTH ATLAS (2005), Department of Mental Health and Substance Abuse, World Health Organisation.PERCZEL FORINTOS, D., RÓZSA, S., KOPP, M. (2008): An investigation of the short version of the Beck Hopelessness Scale in a national representative survey in Hungary. In: Suicide and Life Threatening Behaviour WILLIAMS, M. (1997): Cry of pain. Understanding suicide and self-harm. Penguin PsychologyPFAFF, J, J., ALMEIDA, O, P. (2004): Identifying suicidal ideation among older adults in a general practice. In: Journal of Affect Disorders, 15, 83 (1): 73-77.
(moderate)
(minimal)
(severe)
(mild)

Emotion regulation, negative affectivity, and dysphoria: Moderated mediation
Ljiljana Mihić1
Department of Psychology, University of Novi Sad, Serbia , Zdenka Novović, Veljko Jovanović, Boris Popov
Objectives. Previous research has shown that two emotion regulation strategies, experiential avoidance (a tendency to have negative reactions toward own internal experiences) and depression-related ruminative style, are related to dysphoria (Hayes, Strosahl, Wilson, Bissett, Pistorello, Toramino et al., 2004; Lyubomirsky & Nolen-Hoeksema, 1993). Also, thought suppression can make, ironically the thoughts more accessible and lead subsequently to rumination (Wenzlaff & Luxton, 2003). However, it remains unclear to what extent avoidance of internal experiences other then thoughts might lead to rumination. Additionally, the role of a general tendency to experience negative affect in the avoidance-rumination-dysphoria link is unclear. The proposed conceptual model that was tested in this study is depicted in Figure 1.
Methods. 223 Serbian undergraduates completed in a counterbalanced order: the Acceptance and Action Questionnaire II (Bond, Hayes, Baer, Carpenter, Orcutt, & Zettle, personal communication, January 15, 2008), the Response Style Questionnaire-SF (Nolen-Hoeksema, Parker, & Larson, 1994), the Positive and Negative Affect Schedule-SF (Watson, Clark, & Tellegen, 1988) and the Self-rating Dysphoria Scale (Novovic, Biro, &
Nedimovic, 2007). Results. A test of mediation, depicted in Figure 2, suggested that the link between experiential avoidance and
dysphoria was partly mediated through depression-related ruminative style (Sobel z = .36, p < .001; 95% PB CI = .20 -.54, p <.001). This indirect effect was moderated by a propensity to experience negative affect (NA). For High NA individuals (+1SD), the effect of rumination on dysphoria was larger (boot IE = .25, p < .01) compared to Low NA individuals (- 1SD) (boot IE = .12, p < .05).
Conclusions. Ruminative style acted as a partial mediator in the relation between experiential avoidance and dysphoria. This finding extends the previous research on thought suppression suggesting that avoidance of other internal experiences (emotions, impulses) can also lead to rumination, which, in turn, promotes dysphoria. The detrimental effects of rumination were particularly pronounced in High NA individuals. Noteworthy, experiential avoidance
still explained a significant portion of the variance in dysphoria when the mediator was taken into account, suggesting that both emotional regulation strategies are important in understanding vulnerability to dysphoria. Clients, particularly those high on NA, might benefit from intervention programs aimed at enhancing acceptance and psychological flexibility. REFERENCES: Bond, F. W., Hayes, S. C., Baer, R. A., Carpenter, K., Orcutt, H. K., & Zettle, R. D. Preliminary psychometric properties of the Acceptance and
Commitment Questionnaire-II. A revised measure of acceptance and psychological flexibility. Manuscript in preparation. Hayes, S. C., Strosahl, K. D., Wilson, K. G., Bissett, R. T., Pistorello, J., Toramino, D., et al. (2004). Measuring experiential avoidance. A
preliminary test of of a working model. Psychological Record, 54, 553-578. Lyubomirsky, S., & Nolen-Hoeksema, S. (1993). Self-perpetuating properties of dysphoric rumination. Journal of Personality and Social
Psychology, 65, 339-349. Nolen-Hoeksema, S., Parker, L. E., Larson, J. (1994). Ruminative coping with depressed mood following loss. Journal of Personality and Social
Psychology, 67, 92-104. Novović, Biro, & Nedimović (2007). Stanje depresivnosti: sindrom ili raspoloženje? Psihologija, 40, 447-461. Watson, D., Clark, L-A., & Tellegen, A. (1988). Development and validation of brief measure of positive and negative affect: The PANAS
scale. Journal of Personality and Social Psychology, 54, 1063-1070. Wenzlaff, R. M., & Luxton, D. D. (2003). The role of thought suppression in depressive rumination. Cognitive Therapy and Research, 27, 293-
308. 1 address for correspondence: [email protected]

Relation between cognitive and psychiatric constructs of vulnerability to depression
Zdenka Novović, Ljiljana Mihić, Veljko Jovanović, Mikloš Biro Department of Psychology, University of Novi Sad, Serbia
Introduction. The cognitive theories of depression have suggested several constructs of vulnerability to
depression based on the diathesis-stress models of psychopathology. On the other hand, in the history of psychiatry several authors have described depressive personality as potential vulnerability factor for the affective disorders. This construct served as a basis for the diagnosis of depressive personality disorder (DPD), as defined in Appendix B of the DSM-IV classification.
The objective of this study is to explore the relations among the cognitive constructs of depressive vulnerability: Sociotropy, Autonomy (Beck, 1983), Depression-related Ruminative Responsive Style (RRS; Nolan-Hoeksema, 2000), and Experiential Avoidance (EA) (Hayes et al., 1996), on the one hand, and, the DSM-IV criteria for DPD, on the other.
Methods. 225 undergraduates completed the cognitive measures of depressive vulnerability: 1) Personal Style Inventory (Robins et al, 1994), 2) Response Style Questionnaire-SF (Gonzales et al, 2003), 3) Acceptance and Action Questionnaire II (Hayes et al, 2004), 4) 7 DSM-IV criteria for DPD - a self-report instrument tapping DPD criteria using 4-point Likert scale. Results. To address the research question, a canonical correlation analysis was conducted to examine the multivariate relations among the cognitive measures of depressive vulnerability (left set) and 7 criteria for DPD based on the DSM-IV appendix B (right set). Four variants were extracted, but only two functions were significant that explained more than 10% of variance (figure 1)
Discussion and conclusions. The relation between the cognitive vulnerability to depression and the DSM-IV criteria for DPD can be described by two latent functions: 1. EA turned out to be the strongest predictor of the majority of the depressive personality criteria, followed by RRS and Sociotropy. It appears that the first
canonical variate is made up largely of a general cognitive vulnerability, on the one side, and the majority of criteria for DPD, on the other. 2. The second pair of canonical variables connected Beck’s Autonomy with one of the DPD criteria - negativism, criticism, and judgmentalness toward others. Successful psychotherapies based on the cognitive constructs can be recommended for persons with DPD. Therapies targeting EA can be especially potent. Psychological and psychiatric concepts of depressive vulnerability are interrelated but not redundant, suggesting both concurrent and construct validity of the DSM construct of depressive personality.
REFERENCES
Beck, A.T. (1983). Cognitive therapy of the depression: New perspectives. In P.J. Clayton & J.E. Barrett (Eds.), Treatment of depression: Old controversies and new approaches. New York: Raven.
Gonzales, R., Nolen-Hoeksema, S., Treynor, W. (2003). Rumination reconsidered: A psychometric analysis. Cognitive Therapy and Research, 27, 247-259.
Hayes, S. C., Strosahl, K. D.,Wilson, K. G., Bissett, R. T., Pistorello, J., Taormino, D., et al. (2004).Measuring experiential avoidance:Apreliminary test of a working model. Psychological Record, 54, 553–578.
Hayes, s. C, Wilson, k. G., Gifford. E. V.. Follette, v. M., & Strosahl, K. D. (1996). Experiential avoidance and behavioral disorders: A functional dimensional approach to diagnosis and treatment. Journal of Consultingand Clinical Psychology, 64, 1152-1168.
Nolen-Hoeksema, S. (2000). The role of rumination in depressive disorders and mixed anxiety/depressive Symptoms. Journal of Abnormal Psychology, 109(3), 504–511.
Robins, C. J., Ladd, J. S., Welkowitz. J., Blaney, P. H., Diaz, R., & Kutcher, G. (1994). The Personal Style Inventory: Preliminary validation studies of new measures of sociotropy and autonomy. Journal of Psychopathology and Behavioral Assessment, 16, 277-300.
E-mail adress: [email protected]
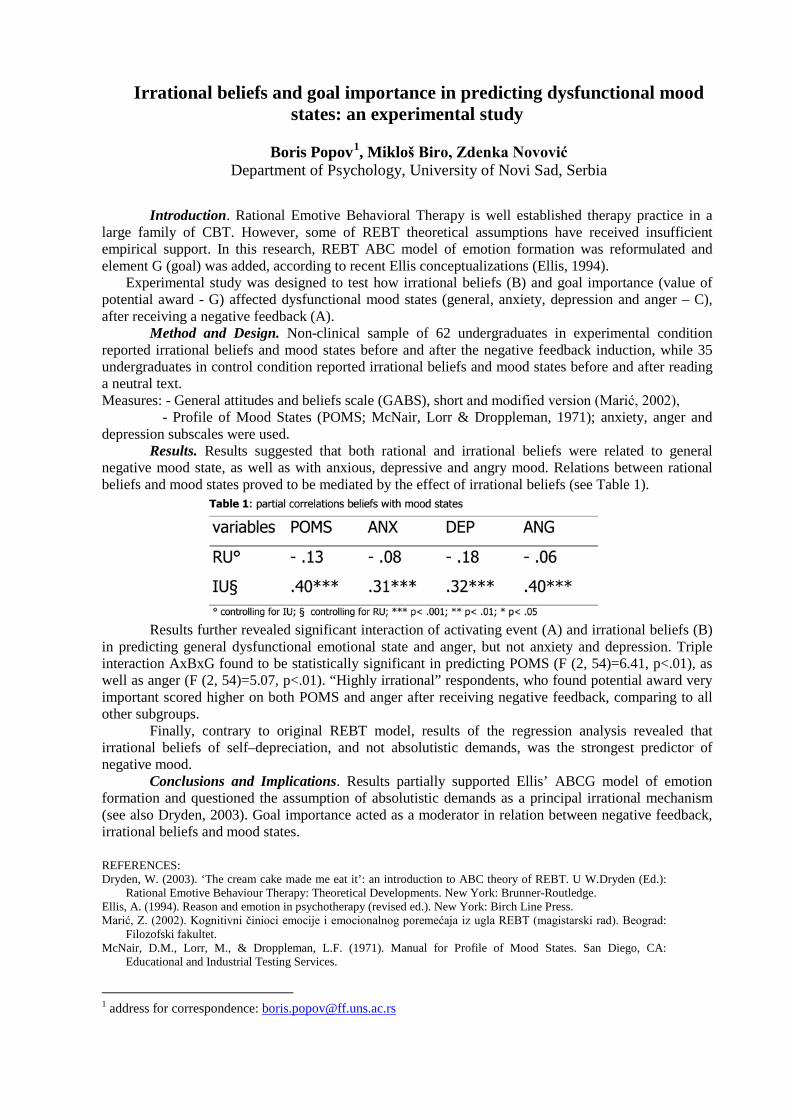
Irrational beliefs and goal importance in predicting dysfunctional mood states: an experimental study
Boris Popov1
Department of Psychology, University of Novi Sad, Serbia , Mikloš Biro, Zdenka Novović
Introduction. Rational Emotive Behavioral Therapy is well established therapy practice in a
large family of CBT. However, some of REBT theoretical assumptions have received insufficient empirical support. In this research, REBT ABC model of emotion formation was reformulated and element G (goal) was added, according to recent Ellis conceptualizations (Ellis, 1994).
Experimental study was designed to test how irrational beliefs (B) and goal importance (value of potential award - G) affected dysfunctional mood states (general, anxiety, depression and anger – C), after receiving a negative feedback (A).
Method and Design. Non-clinical sample of 62 undergraduates in experimental condition reported irrational beliefs and mood states before and after the negative feedback induction, while 35 undergraduates in control condition reported irrational beliefs and mood states before and after reading a neutral text. Measures: - General attitudes and beliefs scale (GABS), short and modified version (Marić, 2002),
- Profile of Mood States (POMS; McNair, Lorr & Droppleman, 1971); anxiety, anger and depression subscales were used.
Results. Results suggested that both rational and irrational beliefs were related to general negative mood state, as well as with anxious, depressive and angry mood. Relations between rational beliefs and mood states proved to be mediated by the effect of irrational beliefs (see Table 1).
Results further revealed significant interaction of activating event (A) and irrational beliefs (B) in predicting general dysfunctional emotional state and anger, but not anxiety and depression. Triple interaction AxBxG found to be statistically significant in predicting POMS (F (2, 54)=6.41, p<.01), as well as anger (F (2, 54)=5.07, p<.01). “Highly irrational” respondents, who found potential award very important scored higher on both POMS and anger after receiving negative feedback, comparing to all other subgroups.
Finally, contrary to original REBT model, results of the regression analysis revealed that irrational beliefs of self–depreciation, and not absolutistic demands, was the strongest predictor of negative mood.
Conclusions and Implications. Results partially supported Ellis’ ABCG model of emotion formation and questioned the assumption of absolutistic demands as a principal irrational mechanism (see also Dryden, 2003). Goal importance acted as a moderator in relation between negative feedback, irrational beliefs and mood states. REFERENCES: Dryden, W. (2003). ‘The cream cake made me eat it’: an introduction to ABC theory of REBT. U W.Dryden (Ed.):
Rational Emotive Behaviour Therapy: Theoretical Developments. New York: Brunner-Routledge. Ellis, A. (1994). Reason and emotion in psychotherapy (revised ed.). New York: Birch Line Press. Marić, Z. (2002). Kognitivni činioci emocije i emocionalnog poremećaja iz ugla REBT (magistarski rad). Beograd:
Filozofski fakultet. McNair, D.M., Lorr, M., & Droppleman, L.F. (1971). Manual for Profile of Mood States. San Diego, CA:
Educational and Industrial Testing Services.
1 address for correspondence: [email protected]
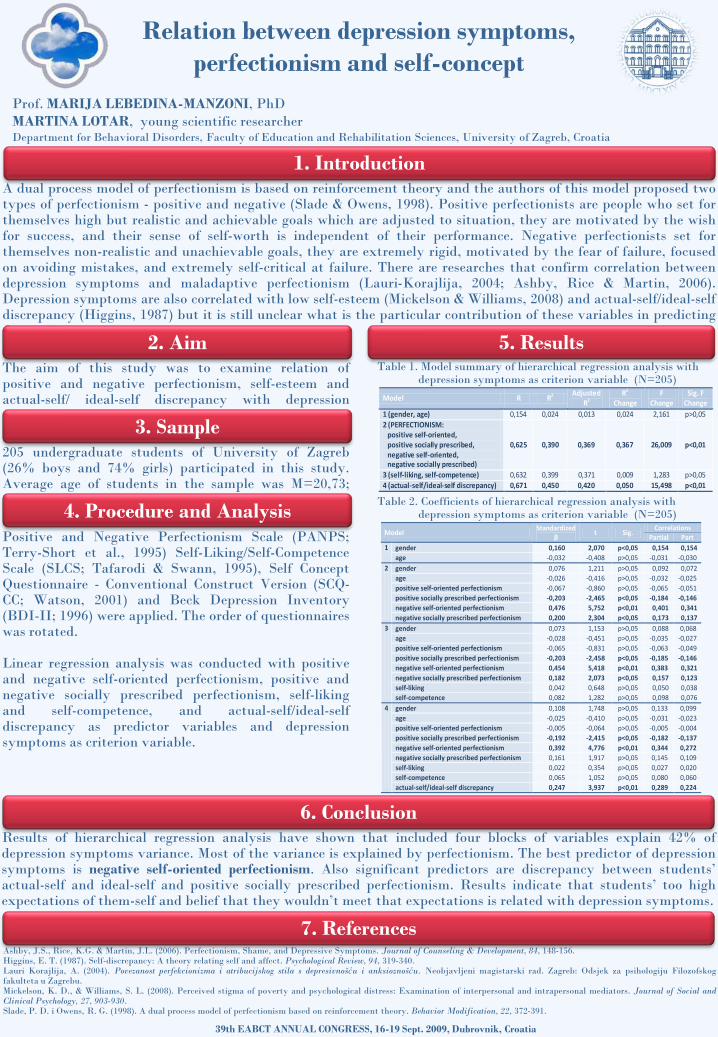
Relation between depression symptoms, perfectionism and self-concept
Prof. MARIJA LEBEDINA-MANZONI, PhDMARTINA LOTAR, young scientific researcherDepartment for Behavioral Disorders, Faculty of Education and Rehabilitation Sciences, University of Zagreb, Croatia
1. IntroductionA dual process model of perfectionism is based on reinforcement theory and the authors of this model proposed twotypes of perfectionism - positive and negative (Slade & Owens, 1998). Positive perfectionists are people who set forthemselves high but realistic and achievable goals which are adjusted to situation, they are motivated by the wishfor success, and their sense of self-worth is independent of their performance. Negative perfectionists set forthemselves non-realistic and unachievable goals, they are extremely rigid, motivated by the fear of failure, focusedon avoiding mistakes, and extremely self-critical at failure. There are researches that confirm correlation betweendepression symptoms and maladaptive perfectionism (Lauri-Korajlija, 2004; Ashby, Rice & Martin, 2006).Depression symptoms are also correlated with low self-esteem (Mickelson & Williams, 2008) and actual-self/ideal-selfdiscrepancy (Higgins, 1987) but it is still unclear what is the particular contribution of these variables in predictingdepression symptoms.
2. AimThe aim of this study was to examine relation ofpositive and negative perfectionism, self-esteem andactual-self/ ideal-self discrepancy with depressionsymptoms.
205 undergraduate students of University of Zagreb(26% boys and 74% girls) participated in this study.Average age of students in the sample was M=20,73;SD=1,797.
5. Results
Ashby, J.S., Rice, K.G. & Martin, J.L. (2006). Perfectionism, Shame, and Depressive Symptoms. Journal of Counseling & Development, 84, 148-156.Higgins, E. T. (1987). Self-discrepancy: A theory relating self and affect. Psychological Review, 94, 319-340.Lauri Korajlija, A. (2004). Povezanost perfekcionizma i atribucijskog stila s depresivnošću i anksioznošću. Neobjavljeni magistarski rad. Zagreb: Odsjek za psihologiju Filozofskogfakulteta u Zagrebu.Mickelson, K. D., & Williams, S. L. (2008). Perceived stigma of poverty and psychological distress: Examination of interpersonal and intrapersonal mediators. Journal of Social andClinical Psychology, 27, 903-930.Slade, P. D. i Owens, R. G. (1998). A dual process model of perfectionism based on reinforcement theory. Behavior Modification, 22, 372-391.
39th EABCT ANNUAL CONGRESS, 16-19 Sept. 2009, Dubrovnik, Croatia
6. Conclusion
7. References
Positive and Negative Perfectionism Scale (PANPS;Terry-Short et al., 1995) Self-Liking/Self-CompetenceScale (SLCS; Tafarodi & Swann, 1995), Self ConceptQuestionnaire - Conventional Construct Version (SCQ-CC; Watson, 2001) and Beck Depression Inventory(BDI-II; 1996) were applied. The order of questionnaireswas rotated.
Linear regression analysis was conducted with positiveand negative self-oriented perfectionism, positive andnegative socially prescribed perfectionism, self-likingand self-competence, and actual-self/ideal-selfdiscrepancy as predictor variables and depressionsymptoms as criterion variable.
Table 1. Model summary of hierarchical regression analysis with depression symptoms as criterion variable (N=205)
Table 2. Coefficients of hierarchical regression analysis with depression symptoms as criterion variable (N=205)
Results of hierarchical regression analysis have shown that included four blocks of variables explain 42% ofdepression symptoms variance. Most of the variance is explained by perfectionism. The best predictor of depressionsymptoms is negative self-oriented perfectionism. Also significant predictors are discrepancy between students’actual-self and ideal-self and positive socially prescribed perfectionism. Results indicate that students’ too highexpectations of them-self and belief that they wouldn’t meet that expectations is related with depression symptoms.
Model R R2 Adjusted R2
R2 Change
F Change
Sig. F Change
1 (gender, age) 0,154 0,024 0,013 0,024 2,161 p>0,05 2 (PERFECTIONISM: positive self-oriented, positive socially prescribed,
negative self-oriented, negative socially prescribed)
0,625 0,390 0,369 0,367 26,009 p<0,01
3 (self-liking, self-competence) 0,632 0,399 0,371 0,009 1,283 p>0,05 4 (actual-self/ideal-self discrepancy) 0,671 0,450 0,420 0,050 15,498 p<0,01
Model Standardized
β t Sig.
Correlations Partial Part
1 gender 0,160 2,070 p<0,05 0,154 0,154 age -0,032 -0,408 p>0,05 -0,031 -0,030
2
gender 0,076 1,211 p>0,05 0,092 0,072 age -0,026 -0,416 p>0,05 -0,032 -0,025 positive self-oriented perfectionism -0,067 -0,860 p>0,05 -0,065 -0,051 positive socially prescribed perfectionism -0,203 -2,465 p<0,05 -0,184 -0,146 negative self-oriented perfectionism 0,476 5,752 p<0,01 0,401 0,341 negative socially prescribed perfectionism 0,200 2,304 p<0,05 0,173 0,137
3
gender 0,073 1,153 p>0,05 0,088 0,068 age -0,028 -0,451 p>0,05 -0,035 -0,027 positive self-oriented perfectionism -0,065 -0,831 p>0,05 -0,063 -0,049 positive socially prescribed perfectionism -0,203 -2,458 p<0,05 -0,185 -0,146 negative self-oriented perfectionism 0,454 5,418 p<0,01 0,383 0,321 negative socially prescribed perfectionism 0,182 2,073 p<0,05 0,157 0,123 self-liking 0,042 0,648 p>0,05 0,050 0,038 self-competence 0,082 1,282 p>0,05 0,098 0,076
4
gender 0,108 1,748 p>0,05 0,133 0,099 age -0,025 -0,410 p>0,05 -0,031 -0,023 positive self-oriented perfectionism -0,005 -0,064 p>0,05 -0,005 -0,004 positive socially prescribed perfectionism -0,192 -2,415 p<0,05 -0,182 -0,137 negative self-oriented perfectionism 0,392 4,776 p<0,01 0,344 0,272 negative socially prescribed perfectionism 0,161 1,917 p>0,05 0,145 0,109 self-liking 0,022 0,354 p>0,05 0,027 0,020 self-competence 0,065 1,052 p>0,05 0,080 0,060 actual-self/ideal-self discrepancy 0,247 3,937 p<0,01 0,289 0,224
3. Sample
4. Procedure and Analysis
MONITORING GROUP COHESION IN CBT EDUCATIONAL GROUPS - A PROSPECTIVE STUDY
Zhivko Juzevski, Department of Psychology, Faculty of Philosophy, SCMU, Macedonia Tanja Atanasova, Association for Cognitive Behavioral Psychotherapy in Macedonia Vera Jovanovska, Association for Cognitive Behavioral Psychotherapy in Macedonia Biljana Gagachovska, Psychiatric Clinic, Faculty of Medicine, SCMU, Macedonia Emilija Jovanovska-Trajkovska, Psychiatric Clinic, University Clinical Center, Skopje
BACKGROUND: The Association for Cognitive Behavioral Psychotherapy in Macedonia
works as an educational centre for CBT since 2006, and has a total number of 55 members, of which 45 are students in training program. Until now three groups are already in CBT basic course training and have completed the Personal Development Program (PDP), based on the standards for personal therapy/development under EABCT.
AIM: We are interested in how the CBT training program affects the intergroup relations and
group cohesion level of groups as they progress in CBT training. We plan to conduct a 3 year prospective study based on our primary findings of the mean scores for each of the two groups in the initial testing with the Group Cohesion Scale - Revised (V. Veeraraghavan et al., 1999).
SAMPLE: (i) The first group has 19 (2 male, 17 female) (ii) The second group has 13 members (1 male, 12 female) The groups are comprised mostly of psychiatrists, psychologists and counselors in different
mental health areas. The first group had weekend workshops (2 daysX8h) once a month at irregular intervals and the second group had the same workshops every month (regular interval), during the business year (except national holydays and semester vacations).
PROCEDURE: For this task we have measured the level of group cohesion with the GCS-R
in two groups of students at the end of the first year of the training course (after they have finished the PDP). We intend to monitor the group’s cohesion level of both groups at the following intervals: two years and at the end of CBT course.
We also intend to include future comparison measures of the Relational Satisfaction Scale (RSS, Anderson M.C. et al., 2001) at the end of the second year and the end of the course, and also add a third group with comparison measures since 3 months of training.
INITIAL RESULTS and EXPECTATIONS: The mean scores on the GCS-R in the initial
testing were 53 and 79 for the first and second group, respectively, which show large difference in the level of group cohesion. We expect to find further evidence as the monitoring of group development goes along.
We expect that the smaller group will have greater group cohesion than the larger one and that the time spent on group work and intensity of educational sessions to be a positive influence on cohesiveness. We also expect that cohesion and relational satisfaction should relate in a positive manner.

GROUP COHESION RELATIONAL SATISFACTION Forsyth (1999) regarded cohesion as the strength of the bonds linking group members to the group. He observed that cohesive groups share some common characteristics: (a) enjoyment and satisfaction, (b) a cooperative and friendly atmosphere, (c) exchange of praise for accomplishments, (d) higher self-esteem and less anxiety among group members, and (e) greater member retention.
Frank (1997) claimed that group cohesion is important in therapy groups because it enables members not only to risk change but also to maintain the change.
Communication satisfaction can be defined as
a perception about the quality of group life that exists (Pavitt & Curtis, 1998). Satisfaction with intragroup relations is generally accepted as a maintenance dimension of group work.
Relational satisfaction as a concept presents building and maintaining of member relationships during communicative processes and practices throughout the life span of the group.
Pavitt and Curtis (1998) suggested that once group members build levels of cohesiveness, it can be viewed as an input variable that influences the group's discussions and recursively may even affect itself.
GROUP COHESION SCALE-REVISED RELATIONAL SATISFACTION SCALE The GCS-R is used to assess cohesion
among group members in terms of the diverse dimensions, such as interaction and communication (including domination and subordination), member retention, decision making, vulnerability among group members, and consistency between group and individual goals. It should be regarded as a state, as opposed to a trait, instrument, and thus, it can be appropriately used to assess fluctuations in cohesion within a group's development.
GSC-R (V. Veeraraghavan et al., 2001) showed acceptably high reliability for use in research (α=0.84).
Therapists can use the GCS-R as a barometer to assess cohesiveness at different stages of group development.
The RSS is designed to measure people's
perceptions of the social fabric of group experiences. Participants are instructed to "think of their latest work-related group" in responding to the Likert-type items on a range from "Strongly Agree" (5) to "Strongly Disagree" (1).
The RSS may prove useful for testing motives for communicating in groups and would also be a useful tool in testing models addressing the relational side of groups.
The scale results from a single factor, that is taken as a unidimensional measure (Anderson M.C. et al., 2001) and the reliability for the RSS is α=0.89.
References:
1. Anderson, C. M., Riddle, B. R., & Martin, M. M. (2001). Small group relational satisfaction scale:
development, reliability and validity, Communication Studies. Article at www.highbeam.com 2. Forsyth, D. R. (1999). Group dynamics (3rd ed.). New York: Brooks/Cole. 3. Frank, J. D. (1997). Some determinants, manifestations, and effects on cohesiveness in therapy groups. The
Journal of Psychotherapy Practice and Research, 6(1), 59-70. 4. Keyton, J. (2000). Introduction: The relational side of groups. Small Group Research, 37, 387-396. 5. Pavitt, C., & Curtis, E. (1998). Small group discussion (3rd ed., On-line). Available: http//www.udel.edu/
communication/COMM356/pavitt. 6. Veeraraghavan, V., Kellar, H., Treadwell, T. W., & Kumar, V. K. (1999). The Group Cohesion Scale-Revised.
Unpublished psychological test, West Chester University, West Chester, PA. 7. Veeraraghavan, V., Kellar, H., Treadwell, T. W., & Kumar, V. K. (2001). The group cohesion scale-revised:
reliability and validity. International Journal of Action Methods, Article at www.highbeam.com

A NEW TECHNIQUE, CINEMATHERAPY: CLINICAL PRACTICE
Irem Motan, Ph.D.Department of Psychology, Ondokuz Mayıs University-Turkey
“Arizona Dream”is mentioned to be the best film identified with, is dealing with feelings of “worthlessness” and “emptiness”.
“The Sea Inside” is considered to be about “loss”, “fear of dying” , and “choices we make”.
According to her, “Vicky Christina Barcelona” is projection of conflicts between actual and ideal self as well as feelings of being victimized by matrimony.
The purpose of this study is to report, through one case, a new technique:
cinematherapy that works into CBT. In other
words, this study is conducted in order to
determine the therapeutic effect of
cinematherapy technique of Cognitive-Behavioral
Therapy in-sessions. One of the uses of this
technique is to deal with unwanted negative
emotions such as shame and guilt. In general, this
technique motivates patients to realise their repressed emotions and
focuses on their self-awareness.
This case study is about a 27 years-old female
doctorate student –to -be had lost her parents from
cancer when a child herself.
Indications:•Fear of abondenment•A pattern of unstable and intense interpersonal relationships(idealization-devaluation)•Affective instability •Chronic feelings of emptiness, shame, guilt•Inappropriate, intense anger or difficulty controlling anger•Depressive symptoms and suicide ideation
Cinematherapy technique is combined with CBT in total of 49 psychotherapy sessions weekly for approximately two years
23
31
628
The patient shows a pervasive pattern of
instability in interpersonal
relationships, self-image and emotions. The data is derived from records
and transcription of psychotherapy sessions
conducted by the researcher herself and
homework assignments done by the patient. In
addition to these materials, self-report scales are assessed for
psychopathological symptoms. The selected
films which display more contributions in
improvement for psychological problems
were: Arizona Dream (1993), The Sea Inside
(Mar adentro-2004), and Vicky Christina
Barcelona (2008)..
Consequently, the patient confronts her repressed negative emotions and accept her psychological problems. Feelings of anger, unhappiness, shame and guilt are recognized, distinguished and
construed while she gains insight about her distorted perceptions, negative automatic thoughts and irrational beliefs. Along with depressive symptoms, affective instability, impulsivity and,
interpersonal issues improved as well. As a result, the cinematherapy technique is proved to be a useful tool for confronting unwanted emotions such as anger, shame and guilt, in addition to support
cognitive-behavioral therapy.
Assignment Questions:Tell me about the characters in the movie. What was the character thinking/feeling? What did the character see as his or her main problem? How did the character resolve his or her issues? What other solutions might the character have used? What was his or her relationship to other characters? Who did you like/not like? Who did you identify with? Why?

The Preliminary Psychometric Properties of the Center for Epidemiologic Studies-
Depression Scale (CES-D) in a Turkish sample
A. Esin Yılmaza, İrem Motanb
a Department of Psychology, Abant Izzet Baysal University, Bolu, Turkey,
b Department of Psychology, Ondokuz Mayıs University, Samsun, Turkey,
Introduction
In Turkey a reliable measure of depressive symptoms is needed for use in research to
determine the incidence, prevalence, and risk factors associated with depression in several
populations. The Center for Epidemiologic Studies-Depression Scale (CES-D; Radloff, 1977)
was chosen for this study over other depression inventories because it was developed for use
in the community rather than a psychiatric population, and the wording of the CES-D is more
concise than other available instruments. While the CES-D has been used extensively in other
populations to screen for depression, there has been no reported psychometric testing or use in
Turkish population, including a wide range of age groups. The aim of the present study was to
investigate the psychometric properties of the CES-D in a Turkish community sample.
Method
Subjects. Three-hundred and twenty six subjects comprised of 175 (53.8%) females
and 150 (46.2%) males, with one case not indicating his/her gender, participated in the study.
The age of the total sample ranged from 18 to 52 years with a mean of 22.02 (SD = 4.01).
Instruments. Along with the CES-D, Beck Depression Inventory (BDI; Beck, Rush,
Shaw, & Emery, 1979), Brief Symptom Inventory (BSI; Derogatis, 1992), Positive Affect
Negative Affect Scale (PANAS; Watson, Clark, & Tellegen, 1988), and Reassurance Seeking

Scale (RASS; it is one of four components of the Depressive Interpersonal Relationships
Inventory; Coyne, 1976) were administered.
Procedure. The CES-D was translated into Turkish using the two-way translation
procedure. Following the participants’ informed consent, the instruments were administered
in a randomized order to eliminate the effect of sequencing.
Results
Descriptive Statistics. Gender differences for the measures of the study were
examined with independent samples t-tests and the differences between men and women on
the total scores of the measures of the study did not emerge as significant.
Factor Structure. Scores obtained from the CES-D were subjected to exploratory
factor analysis using principal components factoring. The Kaiser-Meyer-Olkin measure of
sampling adequacy was found to be .92 and Bartlett’s test of sphericity was significant (df =
190, p < .001). Scree plot and Eigen values indicated four factors with eigenvalues of 7.56,
1.53, 1.19, and 1.01 for extraction. These factors together were explained 56.48 percent of the
variance. However, when these factors were subjected to four, three and two factor solutions
with varimax rotation (and also with oblique and promax rotations), items were not loaded
under their respective factors as supported by previous studies. In these analyses, the lower
limit for a salient factor loading was set at .32 (Tabachnick & Fidell, 2001). As a result, a
single-factor solution accounting for 37.81 percent of the total variance by itself seemed to be
more appropriately fit the data. The loadings of the items on this single factor were ranged
from 0.34 to 0.82.
Reliability. The corrected item-total coefficients for the total CES-D ranged from .29
to .77, indicating that all items are associated with the whole CES-D. Cronbach’s alpha
coefficient for the whole scale was found to be .91, supporting high reliability for the scale
corresponding with the relevant literature. The Guttman split-half reliability for the whole

CES-D was .91, where the Cronbach’s alpha coefficient for the first half composed of 10
items was .84, it was .82 for the second half which consisted of 10 items.
Convergent Validity. Supporting the convergent validity, the CES-D showed
significant positive correlations with the BDI, BSI, PANAS-NA, and RASS (see Table 2). As
expected, there was a significant negative correlation between CES-D and PANAS-PA.
Conclusion
The findings of the present study indicated that the CES-D had adequate psychometric
properties in a Turkish community sample. In particular, the results revealed preliminary
evidence for the cross-cultural utility of the CES-D in epidemiological studies.
Consistent with the present results, there is still no complete consensus concerning the
factorial structure of the CES-D. Although most researchers point out a four-factor solution,
there are variations among the factor structure, the item content and hierarchy of items
loading on the factors in the literature. Future research investigating the cross-cultural aspects
of depressive symptomatology is strongly encouraged.
Table 1. Descriptive statistics (means with standard deviations in parentheses) for the study variables
Total (N = 326)
Men (N = 150)
Women (N = 175)
t value
1. CES-D 15.92 (10.86)
16.10 (10.89)
15.70 (10.86)
0.33
2. BDI 11.68 (8.38)
12.22 (9.21)
11.21 (7.62)
1.08
3. BSI 105.17 (34.87)
102.79 (34.25)
107.29 (35.44)
-1.16
4. Panas-NA 20.21 (7.16)
20.28 (7.02)
20.14 (7.32)
0.18
5. Panas-PA 30.21 (7.26)
30.35 (6.99)
30.04 (7.49)
0.38
6. RASS 11.87 (4.95)
11.69 (4.99)
12.03 (4.93)
-0.61
Note. CES-D = Center for Epidemiologic Studies-Depression Scale, BDI = Beck Depression
Inventory, BSI = Brief Symptom Inventory PANAS-NA = Negative Affect Scale, PANAS-PA =
Positive Affect Sale, RASS = Reassurance Seeking Scale.
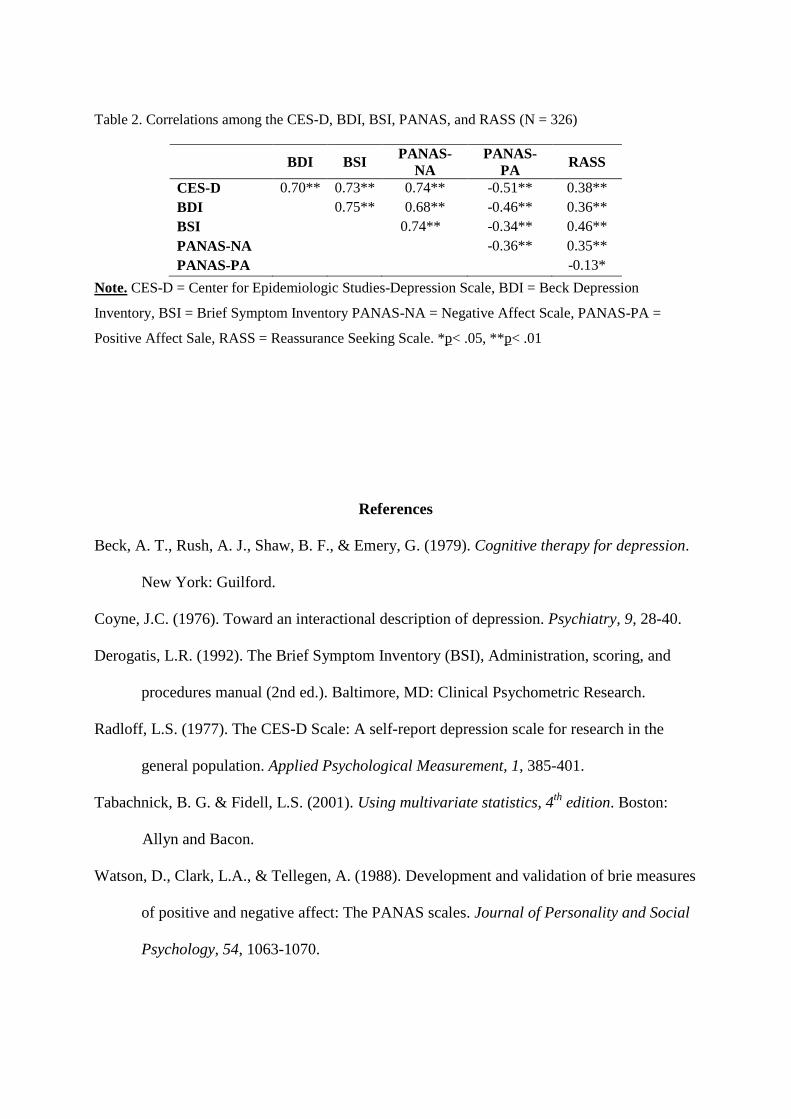
Table 2. Correlations among the CES-D, BDI, BSI, PANAS, and RASS (N = 326)
Note. CES-D = Center for Epidemiologic Studies-Depression Scale, BDI = Beck Depression
Inventory, BSI = Brief Symptom Inventory PANAS-NA = Negative Affect Scale, PANAS-PA =
Positive Affect Sale, RASS = Reassurance Seeking Scale. *p< .05, **p< .01
References
Beck, A. T., Rush, A. J., Shaw, B. F., & Emery, G. (1979). Cognitive therapy for depression.
New York: Guilford.
Coyne, J.C. (1976). Toward an interactional description of depression. Psychiatry, 9, 28-40.
Derogatis, L.R. (1992). The Brief Symptom Inventory (BSI), Administration, scoring, and
procedures manual (2nd ed.). Baltimore, MD: Clinical Psychometric Research.
Radloff, L.S. (1977). The CES-D Scale: A self-report depression scale for research in the
general population. Applied Psychological Measurement, 1, 385-401.
Tabachnick, B. G. & Fidell, L.S. (2001). Using multivariate statistics, 4th edition. Boston:
Allyn and Bacon.
Watson, D., Clark, L.A., & Tellegen, A. (1988). Development and validation of brie measures
of positive and negative affect: The PANAS scales. Journal of Personality and Social
Psychology, 54, 1063-1070.
BDI BSI PANAS-NA
PANAS-PA RASS
CES-D 0.70** 0.73** 0.74** -0.51** 0.38** BDI 0.75** 0.68** -0.46** 0.36** BSI 0.74** -0.34** 0.46** PANAS-NA -0.36** 0.35** PANAS-PA -0.13*

PREDICTION OF THERAPEUTIC RESPONSE TO CBT IN PATIENTS SUFERING
WITH OBSESSIVE COMPULSIVE DISORDER RESISTANT TO THE TREATMENT WITH PSYCHOPHARMACS
Barbora Buliková, Ján Pra!ko, Michal Raszka, Andrea Cinculová, Jana Vysko"ilová, Katarína Adamcová, Jana Kop#ivová, Hana Kudrnovská
Psychiatric Department of University Hospital Olomouc • Palacky University Olomouc • Prague Psychiatric Centre • Centre of Neuropsychiatric studies
INTRODUCTION
!
!
!
!
No consistent predictors of outcome have been identified for the treatment of the obsessive-
compulsive disorder (OCD).
The purpose of the present study is to examine the effectiveness of CBT on a sample of no selected,
pharmacologically treatment-resistant OCD patients and to find the predictors of successful
treatment in these conditions.
The therapy was conducted in a naturalistic setting and systematic CBT steps were adapted to each
patient.
Pharmacologic treatment underwent no or minimal changes during the trial period.
!
!
Outcome measures included the Yale-Brown Obsessive Compulsive Scale, subjective version, the
Clinical Global Impressions-Severity of Illness scale, Beck Depression Inventory, Beck Anxiety
Inventory, Somatoform Dissociation Questionaire, Dissociative Experience Scale.
The primary outcome measure for response was a rating of 25% improvement in Y-BOCS. There was
border for remission -12 points or less on the same scale, and 1-2 points in CGI-S.
RESULTS
47 patients completed the trial (19 male and 28 female). One patient refused the protocol.
All patients finished minimum of 5 weeks of CBT and showed statistically significant improvement
on all outcome measures.
At the end of therapy:
• 64.1% of patients were improved as measured by the 25% decreasing in Y-BOCS.
• 50% of patients reach remission according Y-BOCS
• and 40.4% according CGI.
The main of good therapeutic outcome were lower scores in Y-BOCS, good insight, high
resistance against symptoms, low level of dissociation, and aggressive character of obsessions.
The were control/symmetry obsession and compulsions, and obsessive
slowness and ambivalence
predictors
negative predictors
!
!
!
!
!
Figure 1: Clinical rating scales during the treatment
Y-BOCS: ANOVA week 0 to 5: p < 0.0001; t-test week 0 a LOCF: p<0.0001
BDI: ANOVA week 0 to 5: p<0.05; t-test week 0 and LOCF: p<0.0001
BAI: ANOVA week 0 a! 5: ns; t-test week 0 and LOCF: p<0.0001
CONCLUSIONS
!
!
CBT could be effectively used for medication-resistant OCD patients.
There are some factors, like intensity of OCD symptoms, level of insight, resistance against symptoms, and level of
dissociation, which could predict outcome of the therapy. It is important in future to find new therapeutic strategies to
influence these negative predictors.
Contact:[email protected]
This work was supported by.CNS
RESULTS
There were significant decreases of the mean scores in outcome measures during the treatment.
Table: Mean scores during the treatment
Measurements WEEK 0 WEEK 1 WEEK 2 WEEK 3 WEEK 4 WEEK 5 WEEK 6 LOCF
Y-BOCS 21.97 + 6.83 18.73 + 5.72 16.58 + 7.50 15.64 + 8.06 13.46 + 7.91 12.56 + 7.42 16.63 + 7.06 14.59+ 7.87
CGI 4.43 + 1.06 2.83 + 1.19
BDI 18.00 ± 9.61 15.53 ± 8.62 14.11 ± 8.69 12.44 ± 7.82 13.51 ± 9.29 12.74 ± 8.98 13.02 ± 8.98 11.47 + 7.28
BAI 20.81 ± 12.14 19.19 ±11.42 17.11±9.89 16.29 ±9.05 15.67 ±11.04 16.00 ±11.19 15.34 ±10.37 12.77 + 8.19
!
Table: Demographic and clinical data before therapy
Age 32.2 + 9.3 let
Gender 19 males and 28 females
Years of education 14.0 ± 3.1 let
Age of OCD onset 15.3 + 7.7 let
Years of OCD symptoms 16.8 + 9.7 let
Treatment delay 10.5 + 7.3 let
S-Y-BOCS
total 22.97 + 6.83
obsessions 11.15 ± 3.04
compulzions 10.95 ± 4.32
SDQ-20 23.67 ± 4.86
DES
total 12.86 + 11.15
depersonalization 43.33 ± 63.66
disociativní amnézie 50.50 ± 65.55
imaginal concern 158.3 ± 140.4
CGI 4.43 + 1.06
BAI 20.81 ± 12.14
BDI 18.00 ± 9.61
Doses of antidepressants (eqvivalent of paroxetine) 39.57 + 30,80
Adjuvant medication (n of patients):
antipsychotics
antikonvulsiva
without medikation 4 (8,5%)
Comorbidity axis I 20 (42,6%)
Comorbidity axis II 30 (62,8%)
17 (36,2%)
3 (6,4%)
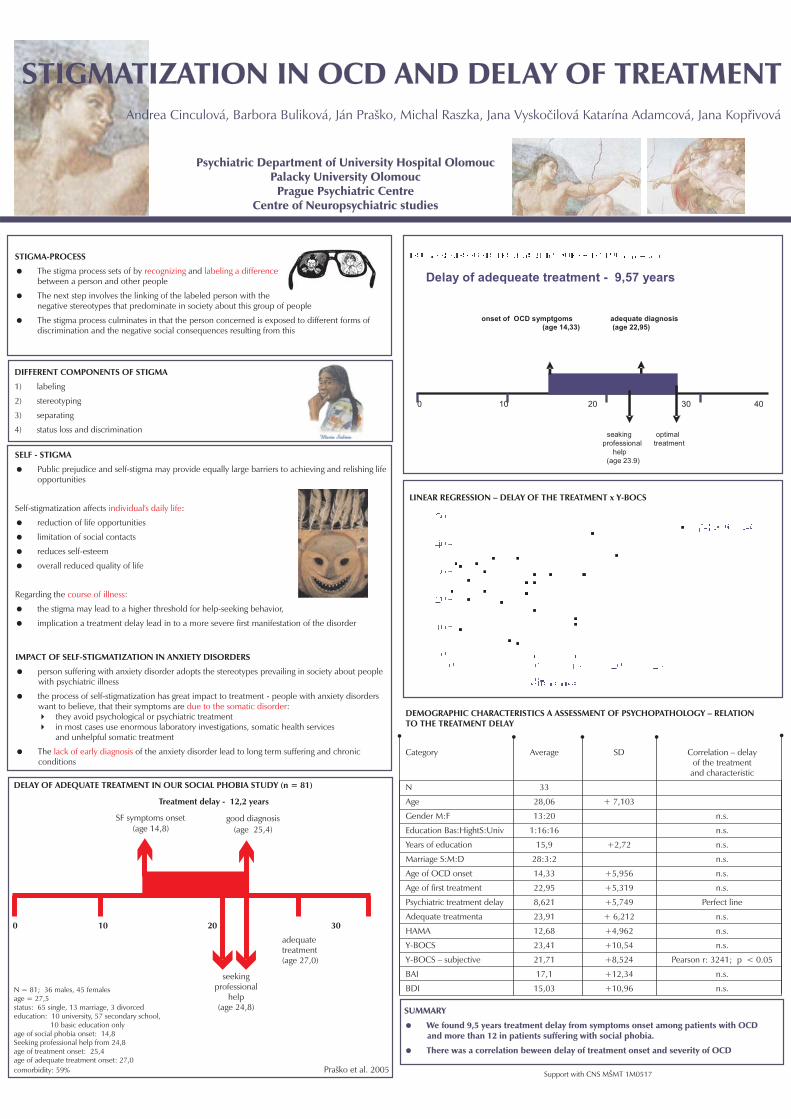
Delay of adequeate treatment - 9,57 years
onset of OCD symptgoms adequate diagnosis(age 14,33) (age 22,95)
0 10 20 30 40
seaking optimalprofessional treatment
help(age 23.9)
Psychiatric Department of University Hospital OlomoucPalacky University Olomouc
Prague Psychiatric CentreCentre of Neuropsychiatric studies
STIGMA-PROCESS
!
!
!
The stigma process sets of by andbetween a person and other people
The next step involves the linking of the labeled person with thenegative stereotypes that predominate in society about this group of people
The stigma process culminates in that the person concerned is exposed to different forms ofdiscrimination and the negative social consequences resulting from this
recognizing labeling a difference
DIFFERENT COMPONENTS OF STIGMA
1) labeling
2) stereotyping
3) separating
4) status loss and discrimination
SELF - STIGMA
!
!
!
!
!
!
!
Public prejudice and self-stigma may provide equally large barriers to achieving and relishing lifeopportunities
Self-stigmatization affects :
reduction of life opportunities
limitation of social contacts
reduces self-esteem
overall reduced quality of life
Regarding the :
the stigma may lead to a higher threshold for help-seeking behavior,
implication a treatment delay lead in to a more severe first manifestation of the disorder
individual's daily life
course of illness
IMPACT OF SELF-STIGMATIZATION IN ANXIETY DISORDERS
!
!
"
"
!
person suffering with anxiety disorder adopts the stereotypes prevailing in society about peoplewith psychiatric illness
the process of self-stigmatization has great impact to treatment - people with anxiety disorderswant to believe, that their symptoms are :
they avoid psychological or psychiatric treatmentin most cases use enormous laboratory investigations, somatic health servicesand unhelpful somatic treatment
The of the anxiety disorder lead to long term suffering and chronicconditions
due to the somatic disorder
lack of early diagnosis
DELAY OF ADEQUATE TREATMENT IN OUR SOCIAL PHOBIA STUDY (n = 81)
N = 81; 36 males, 45 femalesage = 27,5status: 65 single, 13 marriage, 3 divorcededucation: 10 university, 57 secondary school,
10 basic education onlyage of social phobia onset: 14,8Seeking professional help from 24,8age of treatment onset: 25,4age of adequate treatment onset: 27,0comorbidity: 59% Pra!ko et al. 2005
LINEAR REGRESSION – DELAY OF THE TREATMENT x Y-BOCS
SUMMARY
We found 9,5 years treatment delay from symptoms onset among patients with OCDand more than 12 in patients suffering with social phobia.
There was a correlation beween delay of treatment onset and severity of OCD
!
!
Support with CNS M"MT 1M0517
STIGMATIZATION IN OCD AND DELAY OF TREATMENTSTIGMATIZATION IN OCD AND DELAY OF TREATMENTAndrea Cinculová, Barbora Buliková, Ján Pra!ko, Michal Raszka, Jana Vysko#ilová Katarína Adamcová, Jana Kop$ivová
Treatment delay - 12,2 years
SF symptoms onset good diagnosis(age 25,4)(age 14,8)
0 10 20 30
seekingprofessional
help(age 24,8)
adequatetreatment(age 27,0)
DEMOGRAPHIC CHARACTERISTICS A ASSESSMENT OF PSYCHOPATHOLOGY – RELATIONTO THE TREATMENT DELAY
Category Average SD Correlation – delayof the treatment
and characteristic
N 33
Age 28,06 + 7,103
Gender M:F 13:20 n.s.
Education Bas:HightS:Univ 1:16:16 n.s.
Years of education 15,9 +2,72 n.s.
Marriage S:M:D 28:3:2 n.s.
Age of OCD onset 14,33 +5,956 n.s.
Age of first treatment 22,95 +5,319 n.s.
Psychiatric treatment delay 8,621 +5,749 Perfect line
Adequate treatmenta 23,91 + 6,212 n.s.
HAMA 12,68 +4,962 n.s.
Y-BOCS 23,41 +10,54 n.s.
Y-BOCS – subjective 21,71 +8,524 Pearson r: 3241; p < 0.05
BAI 17,1 +12,34 n.s.
BDI 15,03 +10,96 n.s.

PERSONALITY DISORDER INFLUENCE THE TREATMENT OF SOCIAL PHOBIA1,2,3,5 3,4 3 1,2 1,2 3,4,5 3Jan Prasko, Jana Vyskocilova , Libuse Pohlova, Barbora Bulikova, Andrea Cinculova, Tomas Novak, Katarina Adamcova
1 2 3
4 5
Psychiatry Clinic University Hospital Olomouc • Palacky University Olomouc • Prague Psychiatric Center, Prague3rd Faculty Of Medicine, Charles University Prague • Center Of Neuropsychiatric Studies Prague, Czech Republic
Support by project CNS MSMT CR 1M0517
INTRODUCTION
The efficacy of the treatment of personality disorder was repeatedly been reported as less successful than the therapy ofpatients without personality disorder. Most clinicians tend to believe that the occurrence of the anxiety disorder in tandem with apersonality disorder often leads to longer treatment, worsens the prognosis, and thus increasing treatment costs.
Our study is designed to compare the short-term effectiveness of combination of cognitive behavioral therapy and pharmaco-
therapy in patient suffering with social phobia with and without personality disorder.
METHOD
The aim of the study was to asses the efficacy of the 6 week therapeutic program designed for social phobia (SSRIs and CBT) inpatients suffering with social phobia and comorbid personality disorder (17 patients) and social phobia without comorbidpersonality disorder (18 patients). Diagnosis was done according to the ICD-10 research diagnostic criteria confirmed withMINI. Patients were treated with CBT and antidepressants. They were regularly assessed in week 0, 2, 4, and 6 on the CGI(Clinical Global Improvement) for severity, LSAS (Liebowitz Social Anxiety Scale), and in self-assessments BAI (Beck AnxietyInventory) and BDI (Beck Depression Inventory).
Table 1: Time table assessment and measurement methods
ICD -10 diagnostic criteria X
MINI X
CGI-severity X X X X
BAI X X X X
BDI X X X X
LSAS X X X X
scale
–
ICD - 10: International classification of the disorders 10. revision; MINI: Mini international neuropsychiatric interview; CGI: Clinical global impression; BAI: Beck
anxiety inventory; BDI: Beck depressive inventory; LSAS: Liebowitz social anxiety
–
Method Week 0 Week 2 Week 4 Week 6
RESULTS
Patients of both two groups improved in most of assessment instruments. A combination of CBT and pharmacotherapyproved to be the effective treatment of patients suffering with social phobia with or without comorbid personality disorder. Thetreatment efficacy in the patients with social phobia without personality disorder had been showed significantly bettercompared with the group with social phobia comorbid with personality disorder in CGI and specific inventory for social phobia
LSAS. Also the scores in subjective depression inventory BDI showed significantly higher degrease during the treatment in
the group without personality disorder. But the treatment effect between groups did not differ in subjective general anxietyscales BAI.
–
Table 2: Description of the patients
Personality disorder chi or Fischer's testage 29.06 ± 2.625 n.s.Gender: male : female 7 : 10 n.s.Marital status(Single: Married: Divorced/Widowed) 14 : 2 : 1 n.s.Education basal: secondary school:university 4:13:0 P<0.005Employment: yes: no 10 : 7 n.s.Personality Disorder• Histrionic 2
Narcissistic 3Avoidant 5Dependent 1Borderline 5Schizoid 3Anakastic 1Paranoid 1
Comorbidity current disorder 13 (76 %) P<0.05
DysthymiaPanic disorder/agoraphobiaGADDepressive disorderObsessive compulsive disorderAdaptation disorderAlcohol misuseSomatoform disorderGambling 0Balbuties 0
With medication: without medication 12 : 5 n.s.
2
–
No personality disorder32.17 ± 2.401
9:9
12 : 4 : 2
2 : 10 : 613 : 5
0
8 (44 %)
10 : 8
17
•••••••
• 1 (6 %)• 2 (11 %)• 2 (11 %)• 2 (11 %)• 1 (6 %)• 1 (6 %)• 2 (11 %)• 2 (11 %)••
03 (16 %)2 (11 %)
01 (5 %)
000
1 (5 %)1 (5 %)
CGI-SEVERITY
0
1
2
3
4
5
6
week 0 week 2 week 4 week 6
WEEKS
ME
AN
SC
OR
ES
with personality disorder
without personal ity disorder
Beck Anxiety Inventory
0
5
10
15
20
25
30
week 0 week 2 week 4 week 6
WEEK
ME
AN
SC
OR
ES
with personality disorder
without personal ity disorder
Beck Depression Inventory
0
5
10
15
20
25
week 0 week 2 week 4 week 6
WEEKS
ME
AN
SC
OR
ES
with personality disorder
without personal ity disorder
LSAS-ANXIETY
0
5
10
15
20
25
30
35
40
45
week 0 week 2 week 4 week 6
WEEKS
ME
AN
SC
OR
ES
with personality disorder
without personal ity disorder
LSAS-AVOIDANCE
0
5
10
15
20
25
30
35
40
week 0 week 2 week 4 week 6
WEEKS
ME
AN
SC
OR
ES
with personality disorder
without personal ity disorder
LSAS-TOTAL SCORE
0
10
20
30
40
50
60
70
80
0. t!den 2. t!den 4. t!den 6. t!den
WEEKS
ME
AN
SC
OR
ES
with personality disorder
without personal ity disorder
CONCLUSIONS
Our study showed that, patients suffering with social phobia and comorbid personality disordershowed a smaller decrease of specific social phobia symptomatology during the treatment compared
with the patients with social phobia without personality disorders. Nevertheless, a significant decreasein symptomatology occurs in personality disorder patients as well.
Table 3: Changes of psychopathology during the treatment
scale time mean SD p valueCGI Week 0 5,059 0,1348 ns
Week 2 4,706 0,1872 P<0.05Week 4 4 0,1917 P<0.005Week 6 3,471 0,2121 P<0.0001
pair t-test p value P<0.0001one-way ANOVA p value P<0.0001BAI Week 0 20,24 2,524 ns
Week 2 24,41 2,135 nsWeek 4 21,76 2,379 nsWeek 6 18,76 2,431 ns
pair t-test p value nsone-way ANOVA p value nsBDI Week 0 23,65 2,049 P<0.005
Week 2 22,47 2,243 P<0.05Week 4 20,59 2,592 P<0.005Week 6 18,47 2,223 P<0.001
pair t-test p value nsone-way ANOVA p value P<0.005LSAS-Anxiety Week 0 41,12 2,613 ns
Week 2 35,94 3,009 nsWeek 4 32 2,761 nsWeek 6 32,41 2,801 P<0.01
pair t-test p value P<0.05one-way ANOVA p value P<0.001LSAS-avoidance Week 0 34,53 3,571 ns
Week 2 32,12 3,421 nsWeek 4 29,59 3,55 nsWeek 6 25,65 3,866 ns
pair t-test p value nsone-way ANOVA p value P<0.005LSAS-total score Week 0 75,65 6,000 ns
Week 2 69,24 6,384 nsWeek 4 62,76 6,201 nsWeek 6 58,71 6,481 P<0.05
pair t-test p value nsone-way ANOVA p value P<0.005
With personality Without personalityun-pair t-test
Statisticsdisorder (n=17) disorder (n=18)
mean SD4,722 0,15774,167 0,14573,222 0,12922,333 0,14
P<0.0001P<0.0001
18,94 1,79422,56 2,50516,89 2,22914,33 1,597
nsP<0.005
14,72 1,52114,33 2,353
11 1,438,5 1,415
P<0.001P<0.001
37,61 3,03333,39 2,89927,67 2,66121,78 2,422
P<0.001P<0.001
35,39 3,18429 3,226
23,72 3,05718,61 2,311
P<0.001P<0.001
73,61 6,07362,94 5,96451,94 5,62840,61 4,506
P<0.0001P<0.0001
Contact: [email protected]
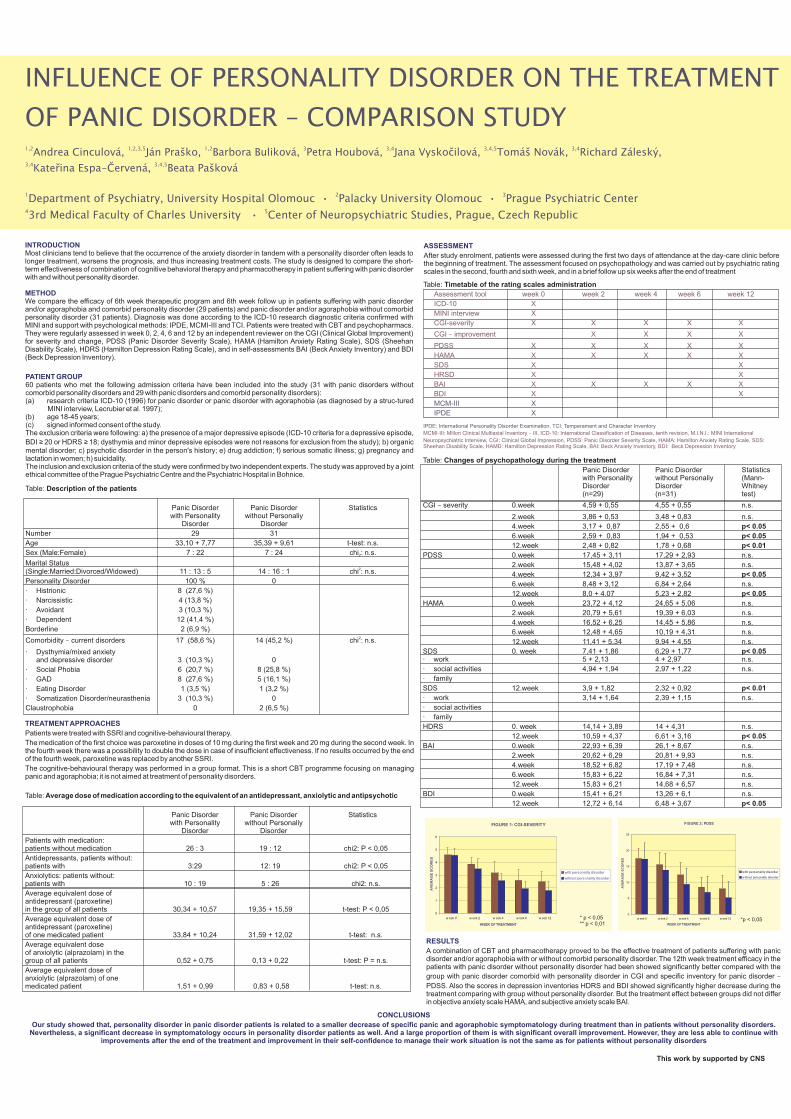
INFLUENCE OF PERSONALITY DISORDER ON THE TREATMENT
OF PANIC DISORDER – COMPARISON STUDY1,2 1,2,3,5 1,2 3 3,4 3,4,5 3,4
3,4 3,4,5
Andrea Cinculová, Ján Pra!ko, Barbora Buliková, Petra Houbová, Jana Vysko"ilová, Tomá! Novák, Richard Zálesk#,
Kate$ina Espa-%ervená, Beata Pa!ková
1 2 3
4 5
Department of Psychiatry, University Hospital Olomouc • Palacky University Olomouc • Prague Psychiatric Center
3rd Medical Faculty of Charles University • Center of Neuropsychiatric Studies, Prague, Czech Republic
INTRODUCTION
METHOD
Most clinicians tend to believe that the occurrence of the anxiety disorder in tandem with a personality disorder often leads tolonger treatment, worsens the prognosis, and thus increasing treatment costs. The study is designed to compare the short-term effectiveness of combination of cognitive behavioral therapy and pharmacotherapy in patient suffering with panic disorderwith and without personality disorder.
We compare the efficacy of 6th week therapeutic program and 6th week follow up in patients suffering with panic disorderand/or agoraphobia and comorbid personality disorder (29 patients) and panic disorder and/or agoraphobia without comorbidpersonality disorder (31 patients). Diagnosis was done according to the ICD-10 research diagnostic criteria confirmed withMINI and support with psychological methods: IPDE, MCMI-III and TCI. Patients were treated with CBT and psychopharmacs.They were regularly assessed in week 0, 2, 4, 6 and 12 by an independent reviewer on the CGI (Clinical Global Improvement)for severity and change, PDSS (Panic Disorder Severity Scale), HAMA (Hamilton Anxiety Rating Scale), SDS (SheehanDisability Scale), HDRS (Hamilton Depression Rating Scale), and in self-assessments BAI (Beck Anxiety Inventory) and BDI(Beck Depression Inventory).
PATIENT GROUP60 patients who met the following admission criteria have been included into the study (31 with panic disorders withoutcomorbid personality disorders and 29 with panic disorders and comorbid personality disorders):(a) research criteria ICD-10 (1996) for panic disorder or panic disorder with agoraphobia (as diagnosed by a struc-tured
MINI interview, Lecrubier et al. 1997);(b) age 18-45 years;(c) signed informed consent of the study.The exclusion criteria were following: a) the presence of a major depressive episode (ICD-10 criteria for a depressive episode,
BDI 20 or HDRSs history; e) drug addiction; f) serious somatic illness; g) pregnancy and
lactation in women; h) suicidality.The inclusion and exclusion criteria of the study were confirmed by two independent experts. The study was approved by a jointethical committee of the Prague Psychiatric Centre and the Psychiatric Hospital in Bohnice.
! ! 18; dysthymia and minor depressive episodes were not reasons for exclusion from the study); b) organicmental disorder; c) psychotic disorder in the person'
Table:
Panic Disorder Panic Disorder Statistics
Number 29 31
Age 33,10 + 7,77 35,39 + 9,61 t-test: n.s.
Sex (Male:Female) 7 : 22 7 : 24 chi : n.s.
Marital Status(Single:Married:Divorced/Widowed) 11 : 13 : 5 14 : 16 : 1 chi : n.s.
Personality Disorder 100 % 0
Histrionic
Narcissistic
Avoidant
Dependent
Borderline 2 (6,9 %)
Comorbidity current disorders
Dysthymia/mixed anxietyand depressive disorder
Social Phobia
GAD
Eating Disorder
Somatization Disorder/neurasthenia
Claustrophobia 0
Description of the patients
with Personality without PersonaliyDisorder Disorder
8 (27,6 %)
4 (13,8 %)
3 (10,3 %)
12 (41,4 %)
17 (58,6 %) 14 (45,2 %) chi : n.s.
3 (10,3 %) 0
6 (20,7 %) 8 (25,8 %)
8 (27,6 %) 5 (16,1 %)
1 (3,5 %) 1 (3,2 %)
3 (10,3 %) 0
2 (6,5 %)
2
2
·
·
·
·
·
·
·
·
·
– 2
ASSESSMENT
After study enrolment, patients were assessed during the first two days of attendance at the day-care clinic beforethe beginning of treatment. The assessment focused on psychopathology and was carried out by psychiatric ratingscales in the second, fourth and sixth week, and in a brief follow up six weeks after the end of treatment
Table: Timetable of the rating scales administration
Assessment tool week 0 week 2 week 4 week 6 week 12
ICD-10 X
MINI interview X
CGI-severity X X X X X
CGI improvement X X X X
PDSS X X X X X
HAMA X X X X X
SDS X X
HRSD X X
BAI X X X X X
BDI X X
–
MCMI-III: Millon Clinical Multiaxial Inventory III, ICD-10: International Classification of Diseases, tenth revision, M.I.N.I.: MINI International
Neuropsychiatric Interview, CGI: Clinical Global Impression, PDSS: Panic Disorder Severity Scale, HAMA: Hamilton Anxiety Rating Scale, SDS:Sheehan Disability Scale, HAMD: Hamilton Depression Rating Scale, BAI: Beck Anxiety Inventory, BDI: Beck Depression Inventory
–
MCM-III X
IPDE X
IPDE: International Personality Disorder Examination, TCI: Temperament and Character Inventory
TREATMENTAPPROACHES
Patients were treated with SSRI and cognitive-behavioural therapy.
The medication of the first choice was paroxetine in doses of 10 mg during the first week and 20 mg during the second week. Inthe fourth week there was a possibility to double the dose in case of insufficient effectiveness. If no results occurred by the endof the fourth week, paroxetine was replaced by another SSRI.
The cognitive-behavioural therapy was performed in a group format. This is a short CBT programme focusing on managingpanic and agoraphobia; it is not aimed at treatment of personality disorders.
Table:
Patients with medication:patients without medication 26 : 3 19 : 12 chi2: P < 0,05
Antidepressants, patients without:patients with 3:29 12: 19 chi2: P < 0,05
Anxiolytics: patients without:patients with 10 : 19 5 : 26 chi2: n.s.
Average equivalent dose ofantidepressant (paroxetine)in the group of all patients 30,34 + 10,57 19,35 + 15,59 t-test: P < 0,05
Average equivalent dose ofantidepressant (paroxetine)of one medicated patient 33,84 + 10,24 31,59 + 12,02 t-test: n.s.
Average equivalent doseof anxiolytic (alprazolam) in thegroup of all patients 0,52 + 0,75 0,13 + 0,22 t-test: P = n.s.
Average equivalent dose ofanxiolytic (alprazolam) of onemedicated patient 1,51 + 0,99 0,83 + 0,58 t-test: n.s.
Average dose of medication according to the equivalent of an antidepressant, anxiolytic and antipsychotic
Panic Disorder Panic Disorder Statisticswith Personality without Personaliy
Disorder Disorder
Table:
(n=29) (n=31) test)
CGI severity 0.week 4,59 + 0,55 4,55 + 0,55 n.s.
2.week 3,86 + 0,53 3,48 + 0,83 n.s.
4.week 3,17 + 0,87 2,55 + 0,6
6.week 2,59 + 0,83 1,94 + 0,53
12.week 2,48 + 0,82 1,78 + 0,68
PDSS 0.week 17,45 + 3,11 17,29 + 2,93 n.s.
2.week 15,48 + 4,02 13,87 + 3,65 n.s.
4.week 12,34 + 3,97 9,42 + 3,52
6.week 8,48 + 3,12 6,84 + 2,64 n.s.
12.week 8,0 + 4.07 5,23 + 2,82
HAMA 0.week 23,72 + 4,12 24,65 + 5,06 n.s.
2.week 20,79 + 5,61 19,39 + 6,03 n.s.
4.week 16,52 + 6,25 14,45 + 5,86 n.s.
6.week 12,48 + 4,65 10,19 + 4,31 n.s.
12.week 11,41 + 5,34 9,94 + 4,55 n.s.
SDSwork
social activities
family
SDS
work
social activities
family
HDRS 0. week 14,14 + 3,89 14 + 4,31 n.s.
12.week 10,59 + 4,37 6,61 + 3,16
BAI 0.week 22,93 + 6,39 26,1 + 8,67 n.s.
2.week 20,62 + 6,29 20,81 + 9,93 n.s.
4.week 18,52 + 6,82 17,19 + 7,48 n.s.
6.week 15,83 + 6,22 16,84 + 7,31 n.s.
12.week 15,83 + 6,21 14,68 + 6,57 n.s.
BDI 0.week 15,41 + 6,21 13,26 + 6,1 n.s.
12.week 12,72 + 6,14 6,48 + 3,67
Changes of psychopathology during the treatment
p< 0.05
p< 0.05
p< 0.01
p< 0.05
p< 0.05
p< 0.05
p< 0.05
Panic Disorder Panic Disorder Statisticswith Personality without Personaliy (Mann-Disorder Disorder Whitney
0. week 7,41 + 1,86 6,29 + 1,775 + 2,13 4 + 2,97 n.s.
4,94 + 1,94 2,97 + 1,22 n.s.
12.week 3,9 + 1,82 2,32 + 0,92
3,14 + 1,64 2,39 + 1,15 n.s.
–
p< 0.05
p< 0.01
·
·
·
·
·
·
FIGURE 1: CGI-SEVERITY
0
1
2
3
4
5
6
w eek 0 w eek 2 w eek 4 w eek 6 w eek 12
WEEK OFTREATMENT
AV
ER
AG
ES
CO
RE
S
with personality disorder
without personality disorder
* p < 0,05** p < 0,01
FIGURE 2: PDSS
0
5
10
15
20
25
w eek 0 w eek 2 w eek 4 w eek 6 w eek 12
WEEK OFTREATMENT
AV
ER
AG
ES
CO
RE
S
with personality disorder
w ithout personality disorder
*p < 0,05
RESULTS
A combination of CBT and pharmacotherapy proved to be the effective treatment of patients suffering with panicdisorder and/or agoraphobia with or without comorbid personality disorder. The 12th week treatment efficacy in thepatients with panic disorder without personality disorder had been showed significantly better compared with the
group with panic disorder comorbid with personality disorder in CGI and specific inventory for panic disorder
PDSS. Also the scores in depression inventories HDRS and BDI showed significantly higher decrease during thetreatment comparing with group without personality disorder. But the treatment effect between groups did not differin objective anxiety scale HAMA, and subjective anxiety scale BAI.
–
CONCLUSIONS
Our study showed that, personality disorder in panic disorder patients is related to a smaller decrease of specific panic and agoraphobic symptomatology during treatment than in patients without personality disorders.Nevertheless, a significant decrease in symptomatology occurs in personality disorder patients as well. And a large proportion of them is with significant overall improvement. However, they are less able to continue with
improvements after the end of the treatment and improvement in their self-confidence to manage their work situation is not the same as for patients without personality disorders
This work by supported by CNS