Ingegneria dei Materiali - unibo.itamsdottorato.unibo.it/5709/1/Cicek_Bugra_Tesi.pdf · Ingegneria...
136
Alma Mater Studiorum – Università di Bologna DOTTORATO DI RICERCA IN Ingegneria dei Materiali Ciclo XXV Settore concorsuale di afferenza: 09/D1 Settore scientifico disciplinare di afferenza: ING-IND/22 Development of glass-ceramics from combination of industrial wastes with boron mining waste Presentata da: Bugra Cicek Coordinatore Dottorato Relatore Prof. Ing. Giorgio Timellini Dott. Arturo Salomoni Esame finale anno 2013
Transcript of Ingegneria dei Materiali - unibo.itamsdottorato.unibo.it/5709/1/Cicek_Bugra_Tesi.pdf · Ingegneria...

AAllmmaa MMaatteerr SSttuuddiioorruumm –– UUnniivveerrssiittàà ddii BBoollooggnnaa
DOTTORATO DI RICERCA IN
Ingegneria dei Materiali
Ciclo XXV
Settore concorsuale di afferenza: 09/D1 Settore scientifico disciplinare di afferenza: ING-IND/22
Development of glass-ceramics from combination of industrial wastes with boron mining waste
Presentata da: Bugra Cicek Coordinatore Dottorato Relatore
Prof. Ing. Giorgio Timellini Dott. Arturo Salomoni
Esame finale anno 2013

ii


iv
Yaşamak şakaya gelmez,
büyük bir ciddiyetle yaşayacaksın
bir sincap gibi mesela,
yani, yaşamanın dışında ve ötesinde
hiçbir şey beklemeden,
yani bütün işin gücün yaşamak olacak.
Yaşamayı ciddiye alacaksın,
yani o derecede, öylesine ki,
mesela, kolların bağlı arkadan, sırtın
duvarda,
yahut kocaman gözlüklerin,
beyaz gömleğinle bir laboratuarda
insanlar için ölebileceksin,
hem de yüzünü bile görmediğin insanlar
için,
hem de hiç kimse seni buna
zorlamamışken,
hem de en güzel en gerçek şeyin
yaşamak olduğunu bildiğin halde.
Yani, öylesine ciddiye alacaksın ki
yaşamayı,
yetmişinde bile, mesela, zeytin
dikeceksin,
hem de öyle çocuklara falan kalır diye
değil,
ölmekten korktuğun halde ölüme
inanmadığın için,
yaşamak yani ağır bastığından.
Nazım Hikmet

v
La vita non è uno scherzo.
Prendila sul serio
come fa lo scoiattolo, ad esempio,
senza aspettarti nulla
dal di fuori o nell'al di là.
Non avrai altro da fare che vivere.
La vita non é uno scherzo.
Prendila sul serio
ma sul serio a tal punto
che messo contro un muro, ad esempio, le
mani legate,
o dentro un laboratorio
col camice bianco e grandi occhiali,
tu muoia affinché vivano gli uomini
gli uomini di cui non conoscerai la faccia, e
morrai sapendo
che nulla é più bello, più vero della vita.
Prendila sul serio
ma sul serio a tal punto
che a settant'anni, ad esempio, pianterai
degli ulivi
non perché restino ai tuoi figli
ma perché non crederai alla morte
pur temendola,
e la vita peserà di più sulla bilancia.
Nazim Hikmet

vi
Alla Bella Bologna…

vii
ABSTRACT
This thesis was aimed to develop efficient utilization methods for highly
produced waste materials using glass-ceramic technology. Glass-ceramic
materials feature a great potential for environmental clean-up, since they may
combine waste stabilization and valorization. In present research, considering
the main aim of the thesis, as environment friendly waste utilization, energy
consumption was also noticed, in order support environment respecting
production techniques. For this concern a controlled fast heating rate, ranging
between 40ºC min-1
to 2 ºC min-1
was applied to studied waste mixtures.
The borate mineral wastes obtained through boron mines and enrichment
plants were selected to be the constant starting material in all performed
studies. Borate mineral wastes contain high amount of B2O3, a very well-
known glass forming oxide with a large scale of application areas, also
providing lower sintering temperatures. The utilization of borate mineral
wastes with glass-ceramic technology was first time studied and primarily not
investigated combinations of wastes were incorporated into the research.
These wastes consist of; soda lime silica glass, meat bone and meal ash and fly
ash. In order to investigate possible and relevant application areas in ceramics,
kaolin clay, an essential raw material for ceramic industry was also employed
in some studied compositions. Different proportions prepared according to the
objected glass-ceramic ternary systems such as; B2O3–P2O5–SiO2 (boro-
phospho-silicate) and SiO2-Al2O3-CaO (wollastonite).
In order to determine cytotoxicty, cell toxicity analyses applied to some of
the studied products, in order to see the effect of boron (a regular daily intake
element) in glass structure.
As a result, three different glass-ceramic articles obtained by using powder
sintering method via individual sintering processes. Light weight micro porous
glass-ceramic from borate mining waste, meat bone and meal ash and kaolin
clay was developed. In some compositions in related study, soda lime silica
glass waste was used as an additive providing lightweight structure with a
density below 0.45 g/cm3
and a crushing strength of 1.8±0.1 MPa.
In another study within the research, compositions respecting the B2O3–
P2O5–SiO2 glass-ceramic ternary system were prepared from; borate wastes,
meat bone and meal ash and soda lime silica glass waste and sintered up to
950ºC. Low porous, highly crystallized glass-ceramic structures with density
ranging between 1.8 ± 0,7 to 2.0 ± 0,3 g/cm3
and tensile strength ranging
between 8,0 ± 2 to 15,0 ± 0,5 MPa were achieved.
Lastly, diopside - wollastonite glass-ceramics (SiO2-Al2O3-CaO) from
borate wastes, fly ash and soda lime silica glass waste were successfully
obtained with controlled rapid sintering up to 950 and 1050ºC. The
wollastonite and diopside crystal sizes were improved by adopting varied
combinations of formulations and heating rates.

viii
The properties of the obtained materials show; the products with a uniform
pore structure could be useful for thermal and acoustic insulations and can be
embedded in lightweight concrete where low porous glass-ceramics can be
employed as building blocks or additive in cement and ceramic industries.

ix
Table of Contents
Chapter 1
Boron
1.1 History of Boron 1
1.2 Properties of Boron 3
1.3 Boron and Environment 4
1.4 Boron Uses 6
Chapter 2
Borates
2.1 Borates and Their Production 18
2.2 World Borate Deposits 21
2.3 Borate Enrichment 25
2.3.1 Gravity Separation 26
2.3.2 Calcination 27
2.3.3 Electrostatic Separation 27
2.3.4 Magnetic Separation 28
2.3.5 Mechanical Screening 28
2.3.6 Forth Floatation 28
2.4 Borate Wastes 29
2.4.1 Waste Waters 31
2.4.2 Utilization and Applications 31

x
Chapter 3
Glass-Ceramics and Their Production
3.1 Glass-Ceramics 39
3.2 Glass-Ceramics from Wastes 39
3.3 Crystallisation (devitrification) 40
3.4 Glass-Ceramic Production Routes 41
Chapter 4
Materials and Characterisation
4.1 Aim of the Study 48
4.2 Materials 50
4.2.1 Materials for producing micro porous glass ceramics from
combination of borate, phosphate and silicate wastes 51
4.2.2 Materials for producing of dense glass-ceramic from borate and
silica wastes and for its cytotoxic characterization 53
4.2.3 Materials for producing wollastonite glass ceramics from fly ash
borate wastes 54
4.3 Characterisation
4.3.1 Inductively Coupled Plasma (ICP) 55
4.3.2 X-Ray Diffraction (XRD) 55
4.3.3 Heating Microscopy (Hot Stage Microscopy) 57
4.3.4 Density 59
4.3.5 Mechanical Strength 60
4.3.6 Scanning Electron Microcopy (SEM) 62
4.3.7 Light Microscopy 62
4.3.8 Cytotoxity 63
4.3.9 Surface Roughness 64

xi
Chapter 5
Experimental Procedure
5.1 Experimental procedure for producing micro porous glass-ceramics
from combination of borate, phosphate and silicate wastes 69
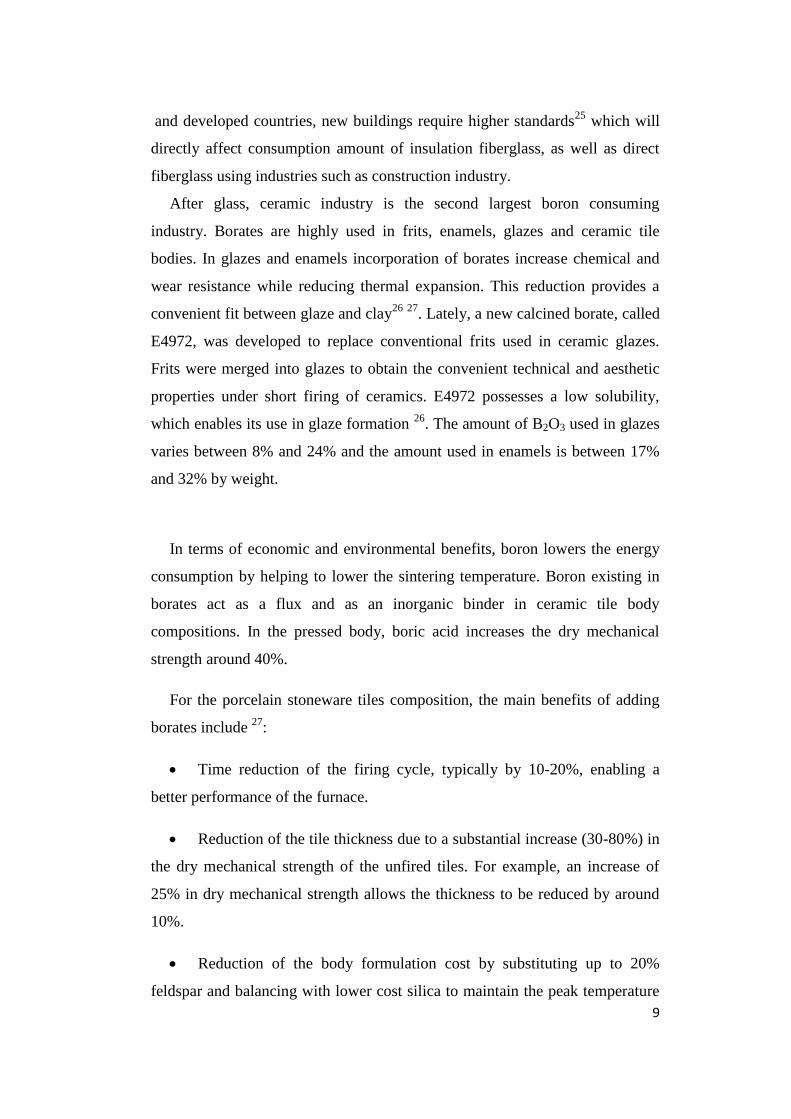
5.2 Experimental procedure for producing dense glass-ceramic from borate
and silica wastes and its cytotoxic characterization 72
5.3 Experimental procedure for producing wollastonite glass-ceramics from
fly ash and boron containing wastes 79
Chapter 6
Results and Discussions
6.1 Micro porous glass ceramics from combination of borate, phosphate and
silicate wastes 84
6.2 Dense glass-ceramic from borate and silica wastes and its cytotoxic
characterization 91
6.3 Wollastonite glass-ceramics from fly ash borate wastes 109
Chapter 7
Conclusions
7.1 Micro porous glass ceramics from combination of borate, phosphate and
silicate wastes 121
7.2 Dense glass-ceramic from borate and silica wastes and its cytotoxic
characterization 122
7.3 Wollastonite glass-ceramics from fly ash borate wastes 122

xii

1
Chapter 1
Boron
1.1 History of Boron
The name “Boron” originates from the Arabic word “Buraq” and it may
have been known approximately since 6000 years. Today, it is known that
Babylonians used boron as flux in their gold and silver treatments.
Archeological researches also showed Egyptians, not far from its missions
today, took advantages of boron in mummifying, medical and metallurgic
applications.1
The first recognized boron ore beds were located in Tibetan lakes, where the
name “Tincal” (a former synonym, e.g., tincar) comes from. Boron containing
minerals obtained from these lakes were carried to China and, over
Himalayans, to India2. The usage of boron by Arabian gold and silversmiths in
8th
century2, preoccupies that these minerals were brought there from India by
Arabian traders using Indian-Arabic trading routes, which were highly used at
those times3. Famous explorer Marco Polo was the one who introduced boron
from India to Europe first in 13th
century2.
Until the researches in 1808 made by the triumvirate of England’s Sir
Humphrey Davy, Joseph Louis Gay-Lussac and Louis-Jacques Thénard from
France, boron was considered as a mineral rather than an element. Humphrey
Davy prepared boron by reduction of boron trioxide with potassium and by
electrolysis of moistened boric acid. The purity of their products was about
50% and named “Boracium”4. Louis-Jacques Thénard and Gay-Lussac used
iron to reduce boric acid at high temperatures. They oxidized boron with air
and proved that boric acid is an oxidation product of boron5. Jöns Jakob
Berzelius identified boron as an element in 18246. In 1909, William Weintraub
produced 99 % pure boron7; these “discoveries” lead boron to have a place in

2
periodic table2. It took nearly 50 years that the right physical and chemical
properties have been examined. High purity boron produced by electrolysis and
vapor deposition methods has made such determinations possible.
In 18th
century, Sassolite was found in Tuscany, Italy. Sassolite is a boron
containing mineral and it occurs from boric acid carrying geyser steam1. It was
produced thousands of tons per year to meet boric acid demand of Europe till
1950’s. In this period the first known industrial boron enrichment took place in
England, Germany and France by converting boric acid into borax.8
Turkey, today world’s largest boron producer started its boron mining
facilities during Ottoman Empire times in 1865. The first production was
borate pandermite (priceite, 4CaO5B203 7H20)8. After Ottoman Empire’s fall,
Turkish Republic took control of the mines and launched a new national
mining enterprise called ETI, taking its name from ancient Hittites civilization,
known as first modern miners in history. Turkey, first started its modern
manufacturing with supplying colemanite (CaO•3B2O3•5H2O) for European
boric acid producers. As a result of exploring new boron mines and increasing
technology, today, Turkey produces large variety of boron products through
holding 72% of world’s boron resources.9
Figure 1.1.1: Pandermite production in Turkey at the end of 1800’s

3
Around same times with Turkey’s boron mining facilities, several
colemanite and ulexite deposits were found in California, Nevada (1872) and in
Searles lake (1873) U.S.A. The first investors could easily turn these minerals
into Borax and increased its commercial value. Today these mines are operated
by U.S.A’s leading boron producers, U.S Borax (owned by Rio Tinto Group)
and Searles Valley Minerals (owned by India’s Gujarat-based Nirma Limited).
These two companies are still the largest boron producers of U.S.A10
.
Turkey and U.S.A are the top Borate producing countries, followed by
China, Peru, Bolivia, Chile, Kazakhstan, Argentina and Iran.
Figure 1.1.2: Borate production in early 1900’s at Searles Lake, CA, USA
1.2 Properties of Boron
Boron is a ubiquitous element in rocks, soil, coal, water (in the oceans
mostly in the form of borates)11
. It takes part more than in 230 mineral in
nature9. It is a metalloid element with an atomic number of 5 and symbolized
with letter B. It is located at the top of right hand side of periodic table in group
3A (See Figure 3): surprisingly, its beviour is more similar to silicon than to
other metalloids.12
Boron has two stable isotopes, these are 10
B and 11
B and it
does not generally make ionic bonds, forms stable covalent bonds. Compared
to high industrial benefit class elements, so-called competitors, boron’s
structure is extremely simple. This simple structured element is also considered
as one of the most problematic industrial element due to its characteristics in
mining and enrichment processes.

4
Figure 1.2.1: Boron in Periodic Table
Boron is a hard element, after Carbon (diamond), crystalline boron is the
second hardest of all the elements on the Mohs scale. In 2009, a team led by
Artem Oganov was able to demonstrate the new form of boron contains two
structures, B12 icosohedra and B2 pairs. Gamma-boron, as it has been called, is
almost as hard as diamond and more heat-resistant than diamond13
.
Chemical characteristics of boron depend on its particle size and
morphology, in example; while micron sized amorphous boron can react easily,
crystalline boron stays unreactive under similar conditions.
Boron has high heat resistance; its melting point is 2075°C. Only 11
elements have higher melting points than boron, these are C, W, Re, Os, Ta,
Mo, Nb, Ir, Ru, Hf, and Tc14
. At room temperature it is a poor conductor of
electricity, but a good conductor at high temperature.
Boron has unique optical properties, it can transmit infrared light; boron
mineral ulexite exhibits natural fiber optic properties15
.
1.3 Boron and Environment
Elemental boron is not considered to be toxic for mammals but assimilation
of boron compounds has a cumulative toxic effect16
. Boron containing minerals
exhibit high solubility in water, as a consequence, boron compounds can easily

5
merge with hydrological systems and they can be a link to reach organics
systems, like plants and animals17
. When boron merges with plants, animals
and drinking water, it would also have effects on human health18
.
Boron can also reach soil through atmospheric deposition, decomposition of
organic matter and boron containing products (including boron containing
fertilizers). It has been determined that between 1.3 and 4 million tonnes of
boron are transmitted to atmosphere only from marine sources each year19
, the
origin of which is not completely clear20
. Boron in oceans generally occurs
with an average concentration of 4.5 mg/litre21
as borates, but the boron
amount in fresh water is related with the geochemical nature of the drainage
area, proximity to marine coastal regions, and inputs from industrial and
municipal effluents.
For humans, boron exposure occurs primarily through the diet and drinking
water, and its tolerable intake was set at 0.4 mg/kg body weight per day.
However, the last results assessed in different countries, concerning the amount
of boron in drinking water, underlines as it is set between 0.1 and 0.3 mg/litre
(Table 1.3.1), corresponding to the mean global boron concentration in
drinking water. For the general population, the greatest boron exposure comes
from the oral intake of food: in the humans and animals, boric acid and borate
are absorbed from the gastrointestinal and respiratory tracts, and the mean daily
intake of boron in the diet is about 1.2 mg22
. More than 90% of administered
doses of these compounds are absorbed, as evidenced by a rapid excretion in
the urine (occurring over a few to several days) 21.
Area
Samples
No.
Concentration
(mg/litre)
USA 2595 ~1.0
Germany 240
110
~ 0.25
~ 0.21

6
Table 1.3.1: Concentrations of Boron in Drinking Water
Soruce: WHO (1998a) Guidelines for drinking-water quality. Second edition. Addendum to
Volume 1: Recommendations. Geneva, World Health Organization.
1.4 Boron Uses
The significant progress in technology makes more complicated to
comprehend the range of uses of boron. Traces of boron can be seen nearly in
every field surrounding daily life, such as; construction, manufacturing,
medicine, electronics, pharmaceuticals, telecommunication and aerospace
products.
Today, there are more than 300 end uses linked with borates (Figure 1.4.1
represents the global rate of 2010). Approximately 75% of the world’s supply
is consumed by for four main end uses, which are: glass, agriculture, ceramics
and cleaning products (detergents, soaps, bleaches). Their distribution, by the
end of 2010, was: 54% glasses, 10% ceramics, 5% agriculture (fertilizers), 4%
cleaning products, and 27 % others23
. These mass boron consuming industries
and their main products are reported in Table 1.4.1.23
United
Kingdom
N/A
200
0.05-0.505
0.01-0.45
Chile N/A 0.31-15.0

7
GLASS
Borosilicate glass, Pyrex type glass, Lime-soda glass,
Optical glass, Glass-fibres, Glass ceramics, Flat glass,
Automotive glass, Sealed beam headlamps, LCD,
Cookware, Laboratory-ware
CERAMICS Ceramic tiles, Frit and Glazings, Earthenware and China
Fluxes
DETERGENTS &
SOAP
Sodium perborate, Washing powder,Hydrogen peroxide
AGRICULTURE Fertilizers, Herbicides, Pesticides
METALLURGY
Flux covers in non-ferrous metallurgy, Cover flux in steel
production, Metal boron alloys, Ferroboron, Metal boron
alloys, Ne-Fe-B magnets
CORROSION
INHIBITORS
Antifreeze, Brewing cutting fluids, Heat treatment,
Hydraulic fluids
FLAME
RETARDATION &
WOOD
PRESERVATION
Flame proofing of timber board, Plywood cotton textiles,
Paper and cellulose insulation, Wire drawing and cables
ADHESIVES Starch and dextrin based adhesives, Solvent and
preservative for casein
ABRASIVES Borosilicate glass matrix, Boron carbide
OTHERS
Nylon sizing, Paint, Paper, Plastics, Polishes, Refractory ,
Rubber, Catalysts, Cement and Concrete, Photography,
Fire extinguishing, Electrolytic Capacitors, Leather and
Skins, Pharmaceuticals, Cosmetics, Buffers in the
manufacture of dyestuffs,Dying of nylon carpets,
Absorbent to neutrons, Control of nuclear reactions
Table 1.4.1: Mass boron consuming industries and their main products
Since 1950s glass industry has been the main borate consuming market.
Today, nearly 54 % of global borate consumption is used in glass industry. In
glass, boron is used as an additive: it provides chemical resistance, reduction of
thermal expansion, improvement of strength, durability, resistance against
vibration, high temperature and thermal shock resistance. Boron effect can be

8
seen evidently in a very widely known example: borosilicate glasses.
The other main aim of using boron in glass is, the ability of using it as a
fluxing agent, reducing the viscosity of glass during formation.
Source: The Economics of Boron, 2010
Figure 1.4.1: Boron End uses
Insulation and textile fiberglass industries represent the largest single borate
consumption with 45% of total consuming. In fiberglass, boron provides
corrosion/heat-resistance, high-strength and improves quality significantly2.
Mainly in Europe (as agreed by EU through the 20-20-20 targets
a24)
a Due to EU’s climate and energy policy released in March 2007, it has decided to combat
against climate change and increase the EU’s energy security while strengthening its
competitiveness. They committed Europe to transforming itself into a highly energy-efficient,
low carbon economy. These targets are;
A reduction in EU greenhouse gas emissions of at least 20% below 1990 levels
20% of EU energy consumption to come from renewable resources
A 20% reduction in primary energy use compared with projected levels, to be
achieved by improving energy efficiency.
9
and developed countries, new buildings require higher standards25
which will
directly affect consumption amount of insulation fiberglass, as well as direct
fiberglass using industries such as construction industry.
After glass, ceramic industry is the second largest boron consuming
industry. Borates are highly used in frits, enamels, glazes and ceramic tile
bodies. In glazes and enamels incorporation of borates increase chemical and
wear resistance while reducing thermal expansion. This reduction provides a
convenient fit between glaze and clay26
27
. Lately, a new calcined borate, called
E4972, was developed to replace conventional frits used in ceramic glazes.
Frits were merged into glazes to obtain the convenient technical and aesthetic
properties under short firing of ceramics. E4972 possesses a low solubility,
which enables its use in glaze formation 26
. The amount of B2O3 used in glazes
varies between 8% and 24% and the amount used in enamels is between 17%
and 32% by weight.
In terms of economic and environmental benefits, boron lowers the energy
consumption by helping to lower the sintering temperature. Boron existing in
borates act as a flux and as an inorganic binder in ceramic tile body
compositions. In the pressed body, boric acid increases the dry mechanical
strength around 40%.
For the porcelain stoneware tiles composition, the main benefits of adding
borates include 27
:
Time reduction of the firing cycle, typically by 10-20%, enabling a
better performance of the furnace.
Reduction of the tile thickness due to a substantial increase (30-80%) in
the dry mechanical strength of the unfired tiles. For example, an increase of
25% in dry mechanical strength allows the thickness to be reduced by around
10%.
Reduction of the body formulation cost by substituting up to 20%
feldspar and balancing with lower cost silica to maintain the peak temperature

10
and cycle length. Alternatively, the binding effect of the boric acid can be used
to substitute some high quality clay with lower quality, less plastic clay to
further increase cost savings.
Reduction of the firing temperature by more than 25°C, keeping the
same cycle length, and thereby producing energy savings.
Boron in the form of Boron Carbide is a vital ingredient in lightweight
ceramic armor used in defense industry. In example; boron carbide ceramic
plates in Kevlar flak jackets protect soldiers from high-velocity projectiles such
as bullets28
.
Late advancements in ceramic industry suggest that the demand for boron in
ceramic industry will rise continuously. In recent years, China, Brazil and
Turkey are rapidly increasing their ceramic tile and sanitary ware production
amount. Together with undeniable impact of European economic crisis that
took place in 2010, losses caused by these new competitors can be seen in
European ceramic industry. Consumption of borates by the ceramics industry is
expected to shift away from Europe to Asia, which accounted for 60% of world
demand in 201029
. For giving an idea concerning the increasing consumption,
the boric acid import of China only from U.S.A jumped from 26.500Mt to
59.900Mt between 2009 and 201030
.
In agriculture, boron is considered as a must nutrient. As in case of all
nutrients, boron requirements differ widely between species, so that deficient
tissue levels for one species might already be toxic for another one. In
agriculture, boron is highly required for plant growth and must remain
available for plant uptake during the growth period. Boric acid and calcium
borate are highly used as fertilizers serving nearly in every field of agriculture.
Next to its chemical and biological benefits, physical benefits such as solubility
in water makes boron compounds available for spraying and irrigation water.
Overmuch boron fertilization, can cause toxicity, which studies suggested was
more often caused by higher boron levels in irrigation water than those in soil

11
31.
Figure 1.4.2: Comparison of plants height and root growth of sun flowers
grown hydroponically with different boron concentrations (left to right, 0, 0.2,
0.4, 0.8, 1.6 ppm B)32
There is no doubt that the increase in human population together with life
quality will cause a rise on food demand. A simple prevision may give an idea
to get the picture about boron demand for next years.
Borates are used as alkaline buffers, enzyme stabilizers, oxygen-based
bleaching agents, and water softeners in detergent industry. Peroxygen bonds
existing in sodium perborate and perboratetetrahydrate, allows them to be used
as oxidizing bleaching agents. Plainly, the high pH value of borax, which is
about 9.5, helps it to produce a basic solution in water, thus increasing the
effectiveness of bleach and other cleaners. Sodium perborate is considered as
an extraordinary bleaching agent known for nearly 100 years. The production
of Hydrogen peroxide, an effective and widely known bleaching agent, takes
place when sodium perborate undergoes hydrolysis while in contact with
water. Due to hydrogen peroxide’s inability of incorporation into detergents,
sodium perborate is used as its carrier together with hot water 29
.
Hydrogen peroxide and other available oxygen components are highly
reactive with organic matter and their deactivation of proteins and enzymes,
produces a strong disinfectant effect making them available for detergents used

12
for sanitization.33
In metallurgical boron consuming applications, the most famous product is
ferroboron with holding 2% of total world borate consumption. Ferroboron
(FeB) is an alloy containing boron, ranging between 17.5 wt. % and 24 wt. %
together with iron (Fe). It is known as the most low cost additive mainly for
steel and some other iron related metal production. Compared to other high-
strength steels, ferroboron possess higher strength and lighter weight. The steel
industry direct and indirectly consumes more than 50% of the boron produced
every year34
.
The main application areas for ferroboron can be listed as: high technology
constructions, automotive, neodymium-iron-boron magnets (in computer hard
drives and wind turbines35
), aluminum castings, high conductive copper,
nonferrous metals industry.
The ability of adsorbing/capturing neutrons makes boron compounds
available to be used in nuclear reactors. In reactors too many neutrons can
cause a fission reaction might get out of control with few neutrons, fission
reaction stops. Control rods, from boron carbide are employed to control
fission reaction by adsorbing neutrons. Furthermore, boric acid is used in the
cooling water around reactors to capture leaked neutrons. These properties of
boron make it a vital element for nuclear reactors36
.
Boron treatment in is commonly used as a long term wood protecting
technique against harmful wood destroying organisms such as wood-decay
fungus, termites, carpenter ants and roaches37
. Several kinds of boron
containing solutions acts as preservatives to treat wood, engineered wood
composites and other building materials like studs, plywood, joists and
rafters38
. Combined with zinc (zinc borate), barium (barium metaborate) and
ammonium (ammonium fluoroborate) borates are used to retard flames and
suppress smoke in polymers.

13
Borates and boric acid based products also act as a flame retardant in
cellulose insulation. Before reaching the combustion temperature boron
removes the H2O molecules existing in cellulose and covers the surface of
appeared carbon layer thus retards a further fire.
Compared to 2009, in 2010 annual boron products consumption increased
approximately 32% to 3.95 Mt. The undeniable effect of industrial growth in
Asia and South America shows the boron products consumption will increase
rapidly due to new researches and developments.

14
References
1William G. W., An Introduction to Boron: History, Sources, Uses, and
Chemistry, Environ Health Perspect 102 (7) (1994) 5-11 2 Garrett D. E. Borates: handbook of deposits, processing, properties, and use.
Academic Press.(102 1998) 385–386 3 Travis N.J., Cocks E.J,.The Tincal Trail-A History of Borax.London:Harraps
Ltd., (1984) 4 Davy H. "An account of some new analytical researches on the nature of
certain bodies, particularly the alkalies, phosphorus, sulphur, carbonaceous
matter, and the acids hitherto undecomposed: with some general observations
on chemical theory". Philosophical Transactions of the Royal Society of
London, 99 (1809) 33–104 5 Gay Lussac J.L. ,Thenard, L.J., Sur la décomposition et la recomposition de
l'acideboracique," Annales de chimie [later: Annales de chemie et de
physique], 68 (1808) 169–174 6 Berzelius,J.,"Undersökning af fluss pats syranochdes smärkvär di gaste
föreningar" (Part 2) (Investigation of hydrofluoric acid and of its most
noteworthy compounds), Kongliga Vetenskaps-Academiens Handlingar,
Proceedings of the Royal Science Academy,12 (1824) 46-98 7 Weintraub E., Preparation and properties of pure boron. Transactions of the
American Electrochemical Society 16 (1909) 165–184 8 Sprague R.W. Boron. Metals and Minerals Annual Review, Metals Minerals,
2 (1992) 106 9 EtiMaden AS, 2010 Annual Sectoral report 2010: Ankara, Turkey, EtiMaden
AS, 3 –Translated from Turkish- 10
Vulcan T., Boron, From Fishing Rods To Flares
www.hardassetsinvestor.com, 2011 11
World Health Organization/International Programme on Chemical
Safety.Environmental Health Criteria 204, Boron, (1998) 1-10 12
Laubengayer A. W., Hurd D. T., Newkirk A. E., Hoard J. L., Boron. I.
Preparation and Properties of Pure Crystalline Boron. J. Am. Ceram.
Soc., 65 (10), 1924–1931, 1943

15
13
Artem R. O., Ionic high-pressure form of elemental boron., Nature 457
(2009) 863-867 14
David R. L., Properties of the Elements and Inorganic Compounds; melting,
boiling, and critical temperatures of the elements.CRC Handbook of
Chemistry and Physics, 84th Edition, Section 4, (2003) 15
Simmons R., Ahsian N., Raven H. The Book of Stones: Who They Are and
What They Teach. North Atlantic Books. (2007) 421–422 16
Geugten R. P., Determination of boron in river water with flameless atomic
absorption spectrometry (graphite furnace technique) Fresen J. Anal. Chem.,
3061 (1981) 13-14 17
WHO, World Health Organization Annual Report 2008 18
Ross O. Nable, Gary S. Banuelos , Jeffrey G. Paull CSIRO, Boron toxicity,
Plant and soil, 193 (1997) 181-198 19
Argust p., Distribition of Boron in Environment Biol. Trace. Elem. Res.,66,
(1998) 1-3 20
Anderson D.L., Kilto M. E., McCarthy L., Zoller W.H, Sources and
atmospheric distribution of particule and gas phase boron atmosphere
environment, Atmos. Environ, 28 (1994) 1401-1410, 21
UNEP United nations environment programme Report 2009 , 43-44 22
Pieczyńska J., Burnecka J. B., Biernat J., Grajeta H., Żyrnicki W.,
Żechałko-Czajkowska A., Boron content in daily meals for preschool children
and school youth, Biol. Trace Elem. Res. 96 (2003) 1-8
23
EtiMaden AS Annual report 2009, EtiMaden AS,–Translated from Turkish-
(2009) 44
24
http://ec.europa.eu/clima/policies
25
Towards a low carbon future, A European Strategic Energy Technology Plan
(Set-Plan) Commision of the European Communities, Brussels, (2007) 723 26
Industrial Minerals, 2009a, Borates’ tile target: Industrial Minerals, no. 501,
(2009 ) 67. 27
www.etiproducts.com 28
Industrial Minerals, 2008b, Technical ceramics take off: Industrial Minerals,
no. 495, 66. 2008. 29
Marc A. A, Robert D. C., Jr., Boron, USGS mineral year book 2010.

16
30
U.S. Census Bureau report 2010 31
Troeh, F.R., Thompson, L.M., Soils and soil fertility, IA, Blackwell
Publishing, (2005) 489 32
T.J. Blom, Light and media in U of G studies, www.greenhousecanada.com 33
Rio Tinto Borax, Bleaching with sodium perborate: Boron, Rio Tinto Borax,
2005. 34
Eti Holding Inc, Pre-feasibility report summaries of boron carbide, boron
nitride, ferroboron, frit and glaze, textile glass fibre, zinc borate, Eti Holding
Inc., (2003) 23 35
Moores S., Minerals for the digital age, Industrial Minerals, 513 (2010) 42, 36
Ceradyne Inc., Boron products, Costa Mesa, CA, Ceradyne Inc.
http://www.ceradyneboron.com, 2011 37
Blanchette R. A., A. R. Biggs. Defense mechanisms of woody plants against
fungi, Spinger-Verlag, (1992) 458 38
www.borax.com/wood/products2.html

17

18
Chapter 2
Borates
2.1 Borates and Their Production
Elemental boron has limited applications; the term, “boron consumption”
today is mostly mistaken with the term “borate consumption”. I.e., the global
consumption rate of elemental boron was estimated to be 15.000 t/yr in 2010
where only B2O3 was 1.5 million t/yr 1 2. Borates are defined as “salts or esters
of boric acid; a compound containing the radical B2O3"3. Today, borates are
accepted as any compound that contains or supplies B2O3 and, therefore, they
are priced and sold based on their boric oxide content. Researches show there
are more than 300 natural occurring borate minerals. There are also many of
non-mineral borates produced in laboratory conditions.
The reason for the existence of many boron containing mineral is related to
the ability to form boron-oxygen compounds in many molecular and polymer
types. As an effect of rapid crystallization of boron together with silicates and
the ability of replacing aluminum or silicon, there are more than 8 Na-borate
minerals and approximately 23 Ca-borates with no other cations or anions4.
Borates linked with calcium, sodium, magnesium and its hydrate compounds
has higher economic importance5. Enrichment process of borates aims at
removal of undesired elements such as Arsenic, Germanium and increasing the
weight percentage of B2O3 in mineral6. Borates are often defined and sold by
their boric oxide (the pure form of B2O3) or B2O3, content, and most statistical
data are listed in tons of B2O3.
The world’s largest borate reserves are located in Turkey, U.S.A and Russia
followed by China, Argentina, Bolivia, Chile, Peru, Kazakhstan, Serbia and
Iran. Table 2.1.1 shows the total world boron mineral reserves.

19
Country Total Reserves
(ThousandTons B2O3)
Total Reserves
(% B2O3)
Turkey1
864.500 72
USA2
80.000 7
Russia2
100.00 8
China2
47.000 4
Argentina2
9.000 1
Bolivia3
19.000 2
Chile3
41.000 3
Peru2
22.000 2
Kazakhstan4
- -
Serbia5
16.200 1
Iran2
1.000 0
Total 1.241.000 100
1. EtiMaden, 2010
2. USGS Mineral Commodity Summariers, January 2009
3. USGS Mineral Commodity Summariers, January 2002
4. Due to contradictional statements about Kazakhtan’s reserves it has not reported it table.
5. www.riotinto.com
Table 2.1.1: Total Reserves of Boron Producing Countries
The 90% of the borates used in industry worldwide are sodium and calcium
borates, as borax, kernite, colemanite and ulexite11 .
These minerals are mainly
produced by Turkey, U.S.A, China, Chile and Argentina. These countries’
production capacities reached 4.8 Mt, containing 2.2Mt of B2O3. The world
boron production capacities in 2010 are reported in table 2.1.2

20
Countries Production Capacity
(Mt)
Turkey 1,785
USA 1,560
Argentina 196
Bolivia 78
Peru 75
Chile 415
China 545
Russia 151
India 48
TOTAL 4,853
*Etimaden,2010
Table 2.1.2: The world boron production capacities in 2010
Borate mining, or in other words, “boron mining” works usually takes place
as open pit and in some cases as underground mining (Russia). Mass producing
boron mines, such as Turkish (Kırka) and American (California), operate their
deposits by open pit mining.
Open pit mines are made of benches providing an operating way to
machineries and walls less than vertical angle to minimize and danger from
rock falls. The range of wall angle and its size depends on the type of mine.
The walls of the mines are stepped. The inclined of the mine is called batter
and the flat part of the step is known as bench (berm).7
Haul roads of the open pit are generally built at the sides of the pit,
providing a way for machineries such as trucks carrying ore and waste rock.
Generally waste rock is piled up at the surface, near the edge of the open pit
called waste dump. Waste dumps are also tiered and stepped, to minimize
degradation.8

21
Figure 2.1.1: Open pit Mining Bigadic, Turkey
2.2 World Borate Deposits
Argentina: In South America by the end of 2010, Argentina took the lead
in borate production. Argentinean heavy borate deposits are located at Porvenir
in Jujuy Province, Sijes and Tincalayu in Salta Province, producing,
colemanite, hydroborocite, kernite, tincal, and ulexite. These mines are located
at 4,100 m above sea level, the Tincalayu Mine is Argentina’s largest open pit
operation. The deposit consisted primarily of borax, with rare occurrences of
ulexite and 15 other borates9 Argentina also produces granular deca-and
pentahydrate borax, boric acid powder and various grades and sizes of natural
boron minerals.1
Bolivia: Boron mining in Bolivia started as small enterprises as
cooperatives at Andes Plateau producing ulexite together with tincal. The
Bolivian Mining Agency (COMIBOL) has invested in Salar de Uyuni salt flats
in order to produce boric acid.1

22
Chile: Chile is the second boron producing south American country, in
2010 Chile’s boron production decreased 17% compared to previous year.
Chile has the world’s largest ulexite deposits (30 Mt B2O3) and is the leading
ulexite producer mostly as boric acid.10
1
China: Despite of having large borate deposits, over 90% of Chinese
deposits are low graded, consisting B2O3 between 8-12 wt. %. In China, main
boron production takes place in northern part of the country at magnesium
borate (askarit) deposit and at Qinhai deposit,4,100 m above sea level, hard to
operate, similar to Argentinean deposits with consisting related borates (boron
lithium potassium). Due to heavy and growing industry, China became import
reliant on boron.
Figure 2.2.1: World Borate Deposits11

23
Between 2000-2007, Chinese boron production increased 7 % however,
today some of Chinese deposits are running low, expected to stop production
soon.1 10
India: India’s borate deposits are located at Pithampur, Madya Pardesh and
northeast of Mumbai, mainly producing borax and boric acid. Since the Indian
reserves cannot meet the domestic requests, similarly in the case of China, also
India is a reliable importer of borate products.
Russia: Russia has the world’s 3rd
largest boron deposit, consisting of low
grade of B2O3 ranging between 9-12 wt %.
U.S.A: As investigated in “History of Boron” part, USA is one of the first
borate extracting countries. This early mining activities, supported with
industrial and technologic progress led USA being world’s leader borate
producer for long time, today passed the chair to Turkey.
The main borate producers of USA are U.S. Borax (Rio Tinto Minerals –
United Kingdom) and Searles Valley Minerals (Nirma - India). The largest
borate deposits of USA are located at California, operated mainly by surface
mining and brine extraction through solution mining mostly associated with
compound plants. The tincal and kernit obtained from those deposits has
average grades of 25.3% and 31.9% of B2O3.The kernite was used for boric
acid production and the tincal was used as a feedstock for sodium borate
production.12
10 1
Turkey: Borate deposits in Turkey are located at north western part of the
country controlled by the state owned company Eti Maden A.S., primarily
investigated in “History of Boron” part. Turkey is world’s largest borate
producer with holding nearly 72% of the world’s total borate reserves. The
main borate production areas are: Bigadic, Emet and Kırka.

24
In Turkey, the boron deposits exhibit variable B2O3 amounts. Kırka, largest
borate deposit of Turkey produces 25-26% B2O3 containing tincal, similar to
Californian deposits10
. Colemanite, ulexite and probertite (in some areas found
merged in each other)13
gathered from Emet deposit contains 30-32%B2O3
while Bigadic produces 28-37% B2O3 containing colemanite.
Lately, Turkey started to invest on refined borate production and related
compounds rather than raw ores together with increasing research and
development facilities in order to build other boron consuming markets.
Country Region and Type Total
ore
Contained
B2O3
B2O3 Reserve B2O3 Reserve
Base
B2O3
Total Reserve
Turkey Bigadic-Balıkesir
(Ca-NaCa types)
Emet-Kütahya (Ca-
type)
Kestelek (Ca-type)
Kırka (Na-type)
Subtotal
935545
7
520
2007
330
200
3
140
673
(1030-360)
(890-310)(8-
3)(519-130)
227
624
851
USA Boron-(Na-type)
Ca-type)
Subtotal
Searles Lake, Death
Valley, Hector,
Owens
Lake, Salton Sea,
Four Corners,
MuddyMountains,
etc.
Subtotal
113
198
311
255
566
26
20
46
77
123
40
40
80
Russia Dalnegorsk, etc 700 64 40 60 100
China Liaoning, Quanhai
etc.
480 65 27 9 36
Mexico Mesa del Amo, Vitro,
Tubutama, etc
140 13.5

25
(Roskill, 11. Edition 2006), (Lyday 2006)
Table 2.2.1: World Borate deposits and Estimated B2O3 Reserves
2.3 Borate Enrichment
The term “boron enrichment” in mining means increasing the grade of B2O3
in borates. The fact making borate more valuable is its B2O3 grade thus; boron
enrichment is important as boron extraction. The price of a concentrated
colemanite nearly doubles the price of the raw colemanite, this also motivates
producers to invest more in boron enrichment techniques. Today, industrially,
enrichment can increase the grade of B2O3 up to 85%, depending on the type.
Boron mines are generally characterized by the presence of
enrichment/concentration plants and waste water lakes located close to the
extraction area. Depending to the characteristics of the mine, after washing
step, boron minerals are crushed (or vice versa) and classified according to the
quality (impurities contents), particle size, use fields and economic values
(separation, triage and classification processes). Recently, these
enrichment/determining processes are also developing together with the
increasing rate of the technologic knowledge including techniques, taking the
advantages of infra-red, high-tech imaging and ultrasound technologies. After
determination of the materials there are still processes to go in order to increase
the grade of B2O3 of the mine.
Argentina Loma Blanca, Sijes,
Tincalayu, Salars, etc
100 20,5 2 7 9
Chile Surire, Atacama, etc. 60 76 8 33 41
Serbia Jarandol, Raska, etc. 40 8 3 - 3
Kazakhstan Inder, Satimola, etc. 77 5 14 1 15
Bolivia Salars, Uyuni, etc 20 15 4 15 9
Peru Salars de Salinas, etc 20 5 4 18 22
Others Iran, India,
Germany, etc.
100 10
General Total 4310 1078 369 807 1176

26
Figure 2.2.2: Borate rock crusher (Joyal Shangai Machinery)
Most widely used and efficient enrichment processes can be listed as;
Gravity separation
Calcination
Electrostatic separation
Magnetic separation
Mechanical screening
Froth Flotation
2.3.1 Gravity Separation
Gravity separation is one of the oldest methods in mining activities. In this
method gravity is the dominant force. The aim of the gravity separation method
is to take advantage of the difference in specific weight of the components to
separate them in a low cost-efficient way. With gravity separation method, the

27
grade of B2O3 in colemanite can be increased from 36% up to 55% with 65%
of efficiency14
.
2.3.2 Calcination
Calcination (also known as calcining) is a thermal process decomposing or
phase transiting solid substances when exposed to heat via release of volatile
fractions existing in their molecular structure, i.e.; Calcite (CaCO3), fluorite
(CaF2), gypsum (CaSO4. 2H2O), colemanite and tincal (borax) (Na2B4O7-
8H2O). In boron industry this method is also known as “decrepitation method”
due to decrepitation of borates in different temperatures. This method is also
used to separate the borates even in each other such as ulexite and
colemanite13
.
Calcination is a widely used method in colemanite enrichment process: it
helps the ore milling and increases the B2O3 content. Colemanite decomposes
with the release of its five molecules of H2O between 450 and 500 °C. The
temperature of onset of dehydration for colemanite is 262 °C and the first water
molecule is lost at 327 °C15 16. Decomposition of colemanite provides release
of impurities thus increases weight percentage of the B2O3 content. In
colemanite, with calcination method the content of B2O3 can be increased with
83% efficiency.17 18
2.3.3 Electrostatic Separation
Electrostatic separation is a process that uses electrostatic charges to
separate crushed particles of materials also known as high tension separator
(roller). This process is mainly used to separate and to sort large amounts of
mineral ores in mining or beneficiation plants. Not differently than other
methods in borate mining, this process is also used to increase weights
percentage amount of B2O3. With this method the B2O3 amount can be
increased 5 to 10%14
.

28
2.3.4 Magnetic Separation
Magnetic separation is a widely used separation process used in a large
spectrum. Minerals with low magnetic characteristics and low susceptibilities
could be recovered by high intensity magnetic separators with generating high
magnetic fields19
. Boron recoveries with magnetic separation method are
ranging between 41 and 84% depending on the type of the borate.20
21
2.3.5 Mechanical Screening
This method is mainly used in mining and mineral processing industries,
also known as screening. Screening is used to separate materials due to their
particle sizes, in mining, this method is often used to separate high grade
components from impurities such as; clay. In mining industry there are two
kinds of mechanical screening: wet and dry screening. In borate production,
wet screening is the preferential method. As a result of having significant
amount of clay in raw borate mining products, minerals have to be washed
before or after screening due to their particle sizes , in order to get rid of clay
impurities by spiral classifier or hydrocyclone. There are different kinds of
mechanical screening equipment for different purposes: scrubber screens, roller
screens, Trommel screens, Circle-throw washing/vibrating equipment. Boron
recoveries with mechanical screening method are increasing up to 81%
depending on the type of the borate.22
2.3.6 Froth Flotation
Froth flotation process is used to separate minerals from gangue in complex
structures by taking advantages of differences in hydrophobicity where gravity

29
method is not available. This process is not efficient for all kinds of borates,
only ulexite and colemanite can be treated in flotation plants in industrial scale
due to their mineral structure. Froth flotation process is a cost reducing method
in enrichment of minerals.
2.4 Borate Wastes
For a long time, borate wastes also known as boron wastes, coming mostly
from concentrator plants were stored in large deposits after aforementioned
enrichment processes. These waste deposits were located near the boron mines.
As an example of the amount of these wastes, only in Turkey, which has the
largest reserve of borate minerals, the amount of such waste is in the order of
600.00023
tons in 2002; by the end of 2010 this amount expected to reach 1.5
million tonnes. These wastes consist of clay and carbonates, with lower B2O3
content compared to the concentrated minerals and main ore. Wastes gathered
from enrichment plants are generally in solid form or pulp24
. But also waste in
liquid form exists, as the water lakes near to the mines, occurs after washing
step of the minerals. Before realizing the huge environmental problems that
they could represent, these wastes were drained into sea, rivers or in non-
populated areas, without any kind of remediation. Recently, the awareness for
environment became a real responsibility for mining industry in according to
the understanding of issue in international political platforms, as in example
from EU25
.
A very important problem is the storage of these kinds of wastes that could
be partially solved by using them as “new raw material” in different industrial
fields. Waste storage will most probably be used as the resource for the future
industry with many advantages in term of solving environmental problem and
economic profits. An appropriate evaluation of these wastes, in terms of
mineralogical and chemical composition, could allow to better address their re
– use, in this way decreasing both the problems originated from their storage,

30
by minimising the wastes disposal and stocking costs, and the final cost of the
waste itself.
Various efficient strategies are till now used to manage boron waste. The
first simpler strategy, their storing with preferential recovery, is the less
efficient and should be going to be given up. The technological level reached in
material sciences allowed new recovery methods to use those stored wastes in
more efficient ways. Other approaches consist in recovery of valuable minerals
from waste water, recovery of valuable minerals from primary and secondary
wastes, in which boron minerals occur only in traces.
This last approach is the usage of clay based boron waste in industry,
especially in ceramics industry. The boron wastes, concentrator wastes, borax
lime wastes, lineal wastes and derivatives wastes, to say, mainly enrichment
wastes usually contain large amounts of clays, such as montmorillonite,
vermiculite, illite and chlorite26
. So the final removed clay-based product,
considered as “boron waste” (borate waste), contains still a rather large amount
of B2O3,(depending on the minerals type) the percentage of which is a function
of the kind of mine.
As told, the largest amount of boron wastes comes from the boron
concentrator plants. The utilization of boron waste can be argued in some main
titles as recovery of boron minerals from wastes, safe disposal of boron tailings
with suitable methods which will not harm the environment and lastly, direct
use of boron tailings in the clay based industry, due to the large amount of
clays and carbonates present in this class of waste.
Generally, during the enrichment of boron wastes, several methods which
already applied in their premier enrichment are still in use, in order to regain
the B2O3 which ran into the waste, mechanical distribution, classification,
gravity methods, magnetic separation, electrostatic separation, soda
(flocculation, flotation, thermal treatment, calcination, decrepitation) and
briquetting methods are being used27
. Besides, lately it has proved that sound
waves are an efficient way to remove clay28
.

31
2.4.1 Waste Waters
The presence of such lakes is necessary for the first mineral enriching
operation, that consists in a washing of boron containing minerals, in particular
for tincal, colemanite and ulexite (colemanite and ulexite are less soluble in
water). The waste lakes, so formed, still contain large amounts of boron
minerals ranging between 5-18 % of B2O3 that can be further concentrated and
extracted, for a direct utilization.
The treatment methods used for the removal of boron from water are
grouped into several categories: coagulation and electro-coagulation processes,
29 30
31
adsorption32
and ion-exchange processes33
34
35
and all those processes
using membranes systems, such as Donnan dialysis36
, electrodialysis37
and
reverse osmosis (RO). 38
When paramagnetic and ferromagnetic minerals are present, an effective
separation can be made with high-intensity differential magnetic permanent
magnet39
40
.
Due to the fact that different boron minerals can be found as a mixture,
further separations treatments are necessary, as in the case of colemanite and
ulexite. Calcination is an efficient method which can be used in these
circumstances41
. A thermal treatment, at 450°C for a mix of ulexite and
colemanite, allows the first one to gain hardness while colemanite is going to
decrepitate for the sudden loss of the five water molecules present in its
formula13
.
2.4.2 Utilization and Applications
Due to the high percentage of clays present in most kind of boron waste,
scientists are also studying the possibility of their use in the silica based
products industry, which can take advantage of the boron mineral included in
the clay, that is able to lower the sintering temperatures. At this regard,
interesting opportunities are offered by the traditional ceramic industry (wall
and floor tiles, glazes, heavy clay ceramics, cement). It has been reported that

32
the use of boron waste in heavy clay ceramics is feasible, “as is”, in small
percentages (5-10 %), whereas higher additions may necessitate the
optimization of the sintering profile or pre-calcination step for boron waste42
.
The studies in brick industry showed, fritted solid boron waste could be
evaluated as a brick product due to exclusive physical and mechanical
properties43
. In ceramic industry, different kinds of wastes have been till now
incorporated in tiles and bricks raw materials
The researches on red mud and Kirka Etimine borate waste showed, that the
studied composition provides floor tiles characterised by high strength and low
water absorption. In a similar study it has been seen boron waste use in ceramic
tiles and its glazes. Using it as fluxing agent provides low porous and high
strength structure together with providing glass crystals in low temperatures44
.
Boron waste from Kirka Etimine, has been used as masse in tile industry45
. In
several studies it has been experimentally seen that boron waste clay can be
used in brick industry as a raw material46
47
48
49
47
.
Laboratory studies on boron waste utilization in cement industry, showed
colemanite addition into cement has an impact on reducing the shrinkage50
. In
related studies it has been found that boron waste through several borates
increases the durability while decreasing the mechanical strength.51
Also
separated boron containing clay waste in concrete was investigated by several
groups52
53
: author would like to state that, none of these researches could have
brought an efficient utilization for boron containing wastes employed by
cement industry54
55
56
.

33
References
1 Marc A. A, Robert D. C., Jr., Boron, USGS mineral year book 2010.
2 U.S Geological Survey , Mineral Commodity Summaries: Boron,, U.S
Department of the Interior, 2012.
3 Bates R.L., Jackson J.A., Glossary of Geology, 3rd ed., American Geological
Institute, 778, 1987.
4 Garrett, D. E. Borates: handbook of deposits, processing, properties, and use,
Academic Press. 6, 1998.
5 Encyclopædia Britannica "Borate mineral", Online Encyclopædia Britannica
Inc., 2012.
6 Vulcan T., Boron, From Fishing Rods To Flares,
www.hardassetsinvestor.com, 2011.
7 Mine Engineer Community, Open Pit Surface Mine, 2011.
8 European Commission Environment, Mining Waste, 2011.
9 Industrial Minerals, 2009b, Minerals in the mist: Industrial Minerals, no.
498, March, p. 40.
10
Eti Maden Annual Boron Report 2010
11
Warren J. K. , Evaporites through time: Tectonic, climatic and eustatic
controls in marine and nonmarine deposits, Earth-Science Reviews, 98, 217-
268, 2010.
12
U.S. Geological Survey, Mineral Commodity Summaries, January 2012.
13
ŞenerS., Özbayoǧlu G.,Separation of from colemanite by calcination,
Minerals Eng. 8 (1995) 697–704,
14
Kaytaz, Y., Doğan, M.Z., Önal, G., Perek, K.T., Bigadiç ve Kestelek bor
atıklarının ısıl işlem, elektrostatik ayırma ve flotasyon ile zenginleştirm e
olanaklarının araştırılması, 2. Endüstriyel Hammaddeler Sempozyumu,
Makaleler kitabı, İzmir, Enrichment of Bigadic and Kestelek boron waste with
heating, electrostatic separation and flotation, II. Industrial Raw Materials
Symposium, Papers Booklet, Izmir, Turkey (1997) 76-85.
15
M.S. Celik, F. Suner , A thermodynamic analysis of the decrepitation
process, Thermochimi Acta 245 (1995) 167 174

34
16
B. Cicek; L. Esposito; A. Tucci; E. Bernardo; A. R. Boccaccini; P. A.
Bingham: Microporous glass ceramics from combination of silicate, borate
and phosphate wastes, Advances in Applied Ceramics 111 (2012) 415-421
17
Erkal F. İ., Girgin, İ., Etibank Emet kolemanit işletmesi kaba artıklarının
konsantre üretimi amacıyla değerlendirilmesi, 4. Uluslararası Cevher
Hazırlama Sempozyumu, Utilization of Etibank Emet colemanite raw wastes in
concentrate production, IV. International Ore Preparation Symposium, Turkey,
2 (1992) 599-608.
18
Aytekin, Y., Barduk, M., Emet kolemanit cevherlerinin dekrepitasyon
yoluyla zenginleştirilebilirliğinin araştırılması, 4. Uluslararası Cevher
Hazırlama Sempozyumu, Antalya, Enrichment of Emet colemanite ore with
decrepitation method, IV. National Ore Preparation Symposium, Turkey 2
(1992) 549-561.
19
Svoboda, J. Magnetic Techniques for the Treatment of Minerals, Kluwer
Academic Publishers, London, 2004.
20
Bilici, U., Akçin, H., Karakoç, G., Doğan, A., Kestelek konsantratör tesisi
ara ürün stoklarının B2O3 içeriklerinin iyileştirilmesi çalışmaları, Eti Holding
A.Ş., Ankara. B2O3 recovery from Kestelek concentrator mid products, ETI
Holding,Ankara, Turkey (2000).
21
Özdağ, H., Bozkurt, R., Uçar, A., Kestelek bor atıklarından borun
kazanılması, 2.Uluslararası Cevher Hazırlama Sempozyumu, İzmir, Turkey
(1988) 282-288.
22
Sönmez, E., Özdağ, H. , Beneficiation of Emet tailings by water absorption+
mechanical attrition+ magnetic separation, Changing Scopes in Mineral
Processing, Rottterdam, (1996) 143.
23
C. Yaman and M. Marasoglu: 4th
Ceramic congress articles book, Anatolian
University, Eskisehir, Turkey (1998) 97-102.
24
C. Yaman, I. International boron symposium report, Kutahya, 2002
25
T Bentli, I. International boron symposium report, Kutahya, 2002
26
Karasu, B., Kaya, G., Kozulu, R., Evaluation of Etibank-Kırka Borax Solid
Wastes of Turkey in Wall Tile Glazes, Abstract Book of 104th Annual Meeting
& Exposition of the American Ceramic Society, (2002) 275.
27
Brian Lewis - A preliminary report on the relative effectiveness of ultrasonic
cleaning versus soaking conversation of clay tablets – Iraq, 43 1 (1981) 76-78
28
T. Kavas, Use of boron waste as a fluxing agent in production of red mud
brick, Building and Environment 41 (2006)1779-1783

35
29
A.E. Yilmaz, R. Boncukoglu, M.M. Kocakerim, B. Keskinler The
investigation of parameters affecting boron removal by electrocoagulation
method, J. Hazard. Mater 125 (2005) 160-165
30
A.E Yilmaz. . Boncukoglu, M.M. Kocakerim, A quantitative comparison
between electrocoagulation method and chemical coagulation for boron
removal from boron-containing solution, J. Hazard .Mater. 125 (2007) 475-481
31
A.E Yilmaz. . R. Boncukoglu, M.M. Kocakerim. An empirical model for
parameters affecting energy consumption in boron removal from boron-
containing waste waters by electrocoagulation J. Hazard.Mater 142 (2007)
101-107
32
Y. Cengeloglu, A. Tor, G. Aslan. M.Ersoz, S.Gezgin, Removal of boron from
aqueous solution by using neutralized red mud J. Hazard Mater 142 (2007)
412-417
33
A.E. Yilmaz, R. Boncukoglu, M.M. Kocakerim M.T Yilmaz, Adsorption of
boron from boron-containing waste waters by ion exchange in a continious
reactor, J. Hazard. Mater (2005) 221-226
34
R. Boncukoglu, A.E. Yilmaz, M.M. Kocakerim, M. Copur An empirical
model for kinetics of boron removal from boron-containing wastewaters by ion
exchange in a batch reactor, Desalination 160 (2004) 159-166
35
M. Badruk, N. Kabay, M.Demircioglu, H. Mordogan, U. Ipekoglu,
Removal of boron from wastewater of geothermal power plant by selective ion
exchange resigns. II. Column sorption-elution studies, Sep. Sci. Technol. 34
(1999) 2981-2995
36
H.F. Ayyildiz, H. Kara, Boron removal of boron from by ion exchange
membranes, Desalination 180 (2005) 99-108
37
Z. Yazicigil, Y. Ozeltekin, Boron removal by electrodialysis with anion-
exchange membranes, Desalination 190 (2006) 71-78
38
G. Georghiou, I. Pashalidis, Boron in ground waters of Nicosia (south
cyprus) and its treatments by reverse osmosis, Desalination 215 (2007) 104-
110
39
M. Rodrigues-Pastor. A.F. Ruiz, M.F. Chillion, D.P. Rico Influence of pH in
the elimination of boron by means of reverse osmosis, Desalination 140 (2001)
145-152
40
Gh. Iacob, Al. D. Ciochina, O. Bredetean , High gradue High Gradient
Magnetic Separation Ordered Matrices, Eur Cells Mater 3 (2002) 167-169

36
41
J.C. Fernandez Caliani, F. Ruiz Muiioza, E. Ganb , Clay mineral and heavy
metal distributions in the lower estuary of Huelva and adjacent Atlantic shelf,
Sci Toral Environ 198 (1997) 181-200
42
A. Christogerou, T. Kavas, Y. Pontikes, S. Koyas, Y. Tabak, G.N.
Angelopoulos, Use of boron wastes in the production of heavy clay ceramics,
Ceram Inter. 35 (2009) 447-452
43
Kaya, I. International boron symposium report , Turkey,(2002).
44
F. Oruç, E. Sabah, Z. E. Erkani, Evaluation Strategies of Boron Tailings
according to Sector, II. International boron symposium, Eskisehir,Turkey)
2004)
45
Yaman, C, Bor Mineral Atıklarının Seramik Endüstrisinde Kullanılabilirliği,
VIII. Ulusal Kil Sempozyumu, Dumlupınar Üniversitesi, Bildiriler Kitabi,
Kütahya, 345-352. Use of Boron Mineral waste in Ceramic Industry, VIII.
National Clay Symosium , Papers Book, Dumlupınar University, Kütahya,
Turkey (1997) 345-352
46
Sönmez, E., Özdağ, H., Özler, A., Sümer, G., Kırka Boraks İşletmesi Atık
Killerinin Seramik Endüstrisinde Kullanılabilirliğinin Araştırılması, Türkiye
XIII. Madencilik Kongresi, TMMOB MadenMühendisleriOdası, İstanbul, 561-
566, Kirka Boron Mine Waste Clay Usage Possiblites in Ceramic Industry,
XIII. Mining Congress, Chamber of Turkish Mining Engineers , Istanbul,
Turkey, (1993) 561-566
47
Sur, H., Yaman, C, Pişkin, S., Bor Atıklarının İnşaat Tuğlası Üretiminde
Kullanılması, VIII. Ulusal Kil Sempozyumu (Kil'97), Bildiriler Kitabı, 392
Dumlupınar Üniversitesi, Kütahya, 555. Boron waste re-use possibilities in
brick production, VIII. National Clay Symposium (Kil 97), Abstract Book, ,
Dumlupinar University, Kutahya, Turkey (1997) 392
48
Sönmez, E., Yorulmaz, S. Kırka Boraks İşletmesi Atık Killerinin Tuğla
Yapımında Kullanılabilirliğinin Araştırılması, Endüstriyel Hammaddeler
Sempozyumu, TMMOB, Maden Mühendisleri Odası, İzmir, 163-168. Kirka
Boron Mine Waste Clay Re-use possibilities in Brick Industry, Industrial Raw
Materials Symposium, Chamber of Turksih Mining Engineers, Izmir, Turkey
(1995) 163-198.
49
Sönmez, E., Özdağ, H., Özler, A., Sümer, G., Kırka Boraks İşletmesi Atık
Killerinin Seramik Endüstrisinde Kullanılabilirliğinin Araştırılması, Türkiye
XIII.Madencilik Kongresi, 561-566, TMMOB Maden Mühendisleri Odası,
İstanbul, 1993. Kirka Boron Mine Waste Clay Re-use Possibilities in Ceramic
Industry, XIII. Mining Congress, , Chamber of Turkish Mining Engineers,
Istanbul, Turkey (1993) 561-566
50
U.K. Sevim, Colemanite ore waste concrete with low shrinkage and high
split tensile strength, Materials and structures, 44, (2011) 187-193

37
51
I.Kula, A Olgun, V.Sevinc, Y. Erdogan , An investigation on the use of tincal
ore waste, fly ash, and coal bottom ash as Portland cement replacement
materials, Concret Res, 32 (2002) 227–232
52
Targan, Ş., Erdoğan, Y., Olgun, A., & Zeybek, B., Sevinç, V., Kula Cürufu,
Bentonit ve Kolemanit Atıklarının Çimento Üretiminde Değerlendirilmesi, I.
Uluslararası Bor Sempozyumu, Kütahya, 259-266. The utilization methods for
Kula slag, bentonite and colemanite wastes in cement production, I.
International Boron Symposium Report, (2002) 259-266, Kutahya,
53
Ozdemir M, Ozturk N .U, Utilization of clay wastes containing boron as
cement additives, Cement and Concrete Res, 3 (2003) 10
54
Topçu I.B., Boga A.R., Effect of boron waste on the properties of mortar
and concrete. Waste Manag Res. 28 (2010) 626-33
55
I.Y. Elbeyli, Utilization of industrial borax wastes (BW) for Portland cement
production Turkish J. Eng. Env. Sci. 28 (2004) 281 287.
56
T. Batar, N. S. Koksal, S. E. Yersel, Production and Characterization of
Wall Plaster with Borax and Paper Wastes and Perlite Additives, Ekoloji 18,
72 (2009) 45-53

38

39
Chapter 3
Glass-Ceramics and Their Production
3.1 Glass-Ceramics
Glass-ceramics are polycrystalline materials obtained through controlled
crystallization (devitrification) of selected/suitable glass compositions. Due to
characteristics of glasses, the decided composition and its heating treatments
have to be well studied. Today, not only glass compositions but also different
heat treatments are still discussed in respect of producing glass ceramics1.
There are limited glass composing precursors for glass-ceramics production.
Compared to stable and difficult crystallizing parent glasses, some glasses
crystallize fast (spontaneous crystallization) and uncontrollably, resulting in
undesirable microstructure making impossible to employ a preferred structure2
3.
Glass-ceramics have a glass (amorphous) phase and typically one or two
crystalline phases usually in the range from 30 vol% to 95 vol %. Glass-
ceramics share the unique characteristics and advantages of glasses as well as
ceramics, exhibiting significant advantages compared to conventional glass or
ceramic materials. Glass-ceramics technology provides materials having high
mechanical strength and toughness, low (even negative) thermal expansion,
high thermal strength. A widely known example for heat resistant glass-
ceramic is Li2O-Al2O3-SiO2 system4 2.
3.2 Glass Ceramics from Wastes
Thermal treatments of problematic wastes by glass-ceramic technology has
been well-documented regarding its effectiveness in immobilising the toxic
contents in their glass matrices. These kinds of heat treatment technologies
have been widely used for treatment of several wastes usually processed to
form glass-ceramic products. These wastes, coming from numerous sources,
can be also considered raw materials and comprise, as main examples 2 3 5
6
Slag from metallurgical processes (iron and steel production)7 8 9
6 10
11
12
13
14
Coal Ash from Power Stations15
16
17
18
19
20
21
22
23
24
25
26
27

40
Residues from Urban Incinerators28
29
30
31
32
33
34
35
36
37
Slag from Gasification Processes38
Electric Arc Furnace Dust (Steel Fly Ash)39
40
Cement Dust41
Ore-Refining Quartz-Feldspar Waste42
Fluorescent Glass Waste43
Sewage Sludge44
45
Anodising Plant Industrial Waste46
Zinc-Hydrometallurgy Wastes47
48
49
50
Clay-Refining Waste (Kira)51
3.3 Crystallisation (devitrification)
The transformation of glass to form glass-ceramic is called crystallization,
also known as devitrification. This transformation consists of two parts, called
nucleation and growth. Nucleation is the key part in controlling the
crystallisation where crystalline glass phases occur. There are two types of
nucleation: the first one is volume nucleation, which is commonly used
technique for both homogenous and heterogeneous nucleation. The second type
is surface nucleation by which is more difficult to control the crystallization.
The nucleation process mostly ends with an undesired microstructure setting
the characteristics of the glass ceramic. So, it must be never forget that large
oriented structure exhibits better mechanical properties. In some parent glass
compositions, nucleating agents are needed; these agents can be either metallic
or non-metallic due to envisaged characteristics of the glass-ceramic.
Nucleation through nucleating agent is called internal nucleation or bulk
nucleation52
53
.
The growth part takes place after obtaining a nucleus matching desired
characteristics. The transformation in growth part is movement of
atoms/molecules from the glass, across the glass-crystal interface and into the
crystal2, a temperature depending treatment to grow the grains
54. A typical
processing cycle for Li2O-Al2O3-SiO2 system is given in Figure 955
.

41
Figure 3.3.1: Processing Cycle of Li2O-Al2O3-SiO2 Glass-ceramic System
3.4 Glass-Ceramic Production Routes
An increasing amount of investigation on glass-ceramic production has been
made in recent years. These processing routes differ from each other in order to
obtain unique properties such as expected microstructural or mechanical
properties. The glass-ceramic production techniques can be listed as;
Conventional Method (two-stage)
Modified Conventional Method (single-stage)
Petrurgic Method
Powder Methods
Sol-Gel Method

42
References
1 Strnad, Z.,Glass-CeramicMaterials. Elsevier, Amsterdam (1986).
2 R. D. Rawlings, J. P. Wu, A. R. Boccaccini, Glass-ceramics: Their
production from wastes. A review, J Mater Sci, 41 (2006) 733-761
3 Hölland, W.,Beall, G., Glass-CeramicTechnology, The American Ceramic
Society, Westerville, OH, (2002)
4 T. Manfredini, G.C. Pellacani and J. M. Rincon, Glass-Ceramic Materials.
Fundamentals and Applications. Modena, Italy (1997)
5 C. Ferreira, A. Riberio and L. Ottosen, Possible applications for municipal
solid waste fly ash, J Hazard Mat, 2003, 96, 201-216.
6 V.Gomes, C.D.G. De Borba and H.G. Riella Production and
characterization of glass ceramics from steelwork slag, J Mater Sci, 37 (2002)
2581-2585. 7 Davies, M. W., Kerrison, B., Gross, W. E., Robson, W. J., and Wichell D. F.,
Slagceram: a glass-ceramic from blast-furnace slag, J Iron Steel I, 208 (1970)
348-370.
8 Davies, M. W., Hazeldean, G. S. F., Robson, W. J., Science of Ceramics,
Swedish Institute of Silicate Research, Gothenburg (1970).
9 Berezhnoi, A. I., “Glass-Ceramics and Photo-Sitalls” Trans. from Russian,
Plenum Press, New York and London (1970).
10
Bondarev, K. T. and Pavlushkin, N. M, Slag-Sitall, A Material of the
Future, in Proc. 9th Int. Congress on Glass, Versailles, France, Scientific and
Technical Communications, 2 (1971) 1237-1250.
11
Ovecoglu, M. L., Microstructural Characterization and Physical Properties
of a Slag-based Glass-ceramic Crystallized at 950 and 1100°C, J Eur Ceram
Soc 18 (1998) 161-168.
12
Ferreira, E. B., Zanotto, E. D., Scudeller, L. A. M., Glass and glass-ceramic
from basic oxygen furnace (BOF) slag, Glass Sci Technol 75(2) (2002) 75-86.
13
Fredericci, C., Zanotto, E. D., Ziemath, E. C., Crystallization mechanism
and properties of a blast furnace slag glass, J Non-Cryst Solid 273 (2000) 64-
75.
14
El-Alaily, N. A., Study of some properties of lithium silicate glass and glass
ceramics containing blast furnace slag, Glass Technol 44 (2003) 30-35.

43
15
De Guire, E. J., Risbud, S. H., Crystallization and properties of glasses
prepared from Illinois coal fly ash, J Mater Sci 19 (1984) 1760-1766
16
Cumpston, B., Shadman, F., Risbud, S., Utilization of coal-ash minerals for
technological ceramics, J Mater Sci 27 (1992) 1781-1784.
17
Erol, M., Demirler, U., Küçükbayrak, S., Ersoy-Meriçboyu, A., Öveçoğlu,
M. L., Characterization investigations of glass-ceramics developed from
Seyitömer thermal power plant fly ash, J Eur Ceram Soc 23 (2003) 757-763.
18
Erol, M., Genç, A., Ovecoglu, M. L., Yücelen, E., Küçükbayrak, S., Taptık,
Y., Characterization of a glass-ceramic produced from thermal power plant fly
ashes, J. Eur Cera Soc 20 (2000) 2209-2214.
19
Leroy, C., Ferro, M. C., Monteiro, R. C. C., Fernandes, M. H. V., Production
of glass-ceramics from coal ashes, Journal of the European Ceramic Society 21
(2001) 195-202.
20
Peng, F., Liang, K., Hu, A., Shao, H., Nano-crystal glass-ceramics obtained
by crystallization of vitrified coal fly ash, Fuel 83:14-15 (2004) 1973-1977.
21
Ferro, M. C.,Leroy, C., Monteiro, R. C. C., Fernandes, M. H. V., Fine-
grained Glass-ceramics obtained by crystallisation of vitrified coal ashes, Key
Eng Mat 230-232 (2002) 408-411.
22
Barbieri, L., Lancellotti, I., Manfredini, T., Queralt, I., Rincon, J. Ma.,
Romero, M., Design, obtainment and properties of glasses and glass-ceramics
from coal fly ash, Fuel 78 (1999) 271-276.
23
Kniess, C. T., de Borba, C. D. G., Neves, E., Kuhnen, N. C., Riella, H. G.,
(2002). Obtaining and characterizing Li2O-Al2O3-SiO2 glass-ceramics using
coal bottom ash as raw material, Interceram 51 (2002) 140-143.
24
Boccaccini, A. R.,Bucker, M., Bossert, J., Marszalek, K., Glass matrix
composites from coal fly ash and waste glass, Waste Manage 17 (1997) 39-45.
25
Francis, A. A.,Rawlings, R. D., Sweeney, R., Boccaccini, A. R., Processing
of coal ash into glass ceramic products by powder technology and sintering,
Glass Technol 43 (2002) 58-62.
26
Francis, A. A., Boccaccini, A. R., Rawlings, R. D., Production of glass-
ceramics from coal Ash and waste glass mixtures, Key Eng Mat 206-213
(2002) 2049-2052.
27
Kim, J. M., Kim, H. S., Processing and properties of a glass-ceramic from
coal fly ash from a thermal power plant through an economic process, J Eur
Ceram Soc. 24 (2004) 2825-2833.

44
28
Romero, M., Rawlings, R. D., Rincon, J. Ma. Crystal nucleation and growth
in glasses from inorganic wastes from urban incineration, J. Non-Cryst.
Solids271 (2000) 106-118
29
Cheng, T. W.,Ueng, T. H., Chen, Y. S., Chiu, J. P., Production of glass-
ceramic from incinerator fly ash, Ceram Inter 28 (2002) 779-783.
30
Hjelmar, O.,Disposal strategies for municipal solid waste incineration
residues, J Hazard Mater 47 (1996) 345-368.
31
Derie, R., A new way to stabilize fly ash from municipal incinerators, Waste
Manage 16 (1996) 711-716.
32
Haugsten, K. E.,Gustavson, B., Environmental properties of vitrified fly ash
from hazardous and municipal waste incineration, Waste Manage 20 (2000)
167-176.
33
Nishida, K.,Nagayoshi, Y., Ota, H., Nagasawa, H., Melting and stone
production using MSW incinerated ash, Waste Manage 21 (2001) 443-449.
34
Cheng, T. W.,Chen, Y. S., On formation of CaO-Al2O
3-SiO
2 glass-ceramics
by vitrification of incinerator fly ash, Chemosphere 51 (2003) 817-824.
35
Cheng, T. W.,Chen, Y. S., Characterisation of glass ceramics made from
incinerator fly ash, Ceram Inter 30 (2004) 343-349.
36
Wiles, C. C.,Municipal solid waste combustion ash: State-of-the-knowledge,
J Hazard Mater 47 (1996) 325-344
37
Appendino, P., Ferraris, M., Matekovits, I., Salvo, M., Production of glass-
ceramic bodies from bottom ashes of municipal solid waste incinerators, J Eur
Ceram Soc 24 (2004) 803-810.
38
Acosta, A., Iglesias, I., Aineto, M., Romero, M., Rincon, J. Ma., Thermal
and sintering characterization of IGCC slag, J Therm Anal Calorim 67 (2002)
249-255.
39
Goodwill, J. E.,Schmitt, R. J., An update of electric arc furnace dust
treatment in the United States, Resource Conservation and Environmental
Technologies (1994) 25-34.
40
Pelino, M., Karamanov, A., Pisciella, P., Crisucci, S., Zonetti, D.,
Vitrification of electric arc furnace dusts, Waste Manage 22 (2002) 945-949.
41
Morsi, M. M., Khater, G. A., Range, K. J., Glass ceramics in the system
diopside-anorthite-orthoclase prepared by using some industrial waste
materials, Glass Technol 42 (2001) 160-164.

45
42
Gorokhovsky, A.,Escalante-Garcia, J. I., Gorokhovsky, V., Mescheryakov,
D., InorganicWastes in the Manufacture of Glass and Glass-Ceramics: Quartz-
Feldspar Waste of Ore-Refining, Metallurgical Slag, Limestone Dust, and
Phosphorus Slurry, J Am Ceram Soc 85 (2002) 285-287.
43
Yun, Y. H.,Yoon, C. H., Oh, J. S., Kim, S. B., Kang, B. A., Hwang, K. S.,
Waste fluorescent glass and shell derived glass-ceramics, J Mater Sci 37
(2002) 3211-3215.
44
Suzuki, S.,Tanaka, M., Kaneko, T., Glass-ceramic from sewage sludge ash,
Journal of Materials Science 32 (1997) 1775-1779.
45
Park, Y. J., Moon, S. O., Heo, J., Crystalline phase control of glass ceramics
obtained from sewage sludge fly ash, Ceram Inter 29 (2003) 223-227.
46
Diaz, C., Salgado, S., Jordan, R., Cruz, E., Zayas, M. E., Glass-Ceramics
nade from anodizing plant industrial waste, Am Ceram Soc Bull 82 (2003)
9601-9604
47
Pelino, M., Cantalini, C., Rincon, J. Ma., Preparation and properties of
glass-ceramic materials obtained by recycling goethite industrial waste, J
Mater Sci 32 (1997) 4655-4660.
48
Romero, M. and Rincon, J. Ma., Surface and bulk crystallization of glass-
ceramic in the Na2O-CaO-ZnO-PbO-Fe
2O
3-Al
2O
3-SiO
2 system derived from a
goethite waste, J Am Ceram Soc, 82 (1999) 1313-1317
49
Marabini, A. M., Plescia, P., Maccari, D., Burragato, F., Pelino, M., New
materials from industrial and mining wastes: glass-ceramics and glass- and
rock-woolfibre, Int. J Miner Process 53 (1998) 121-134.
50
Romero, M., Rincon, J. Ma., Preparation and properties of high iron oxide
content glasses obtained from industrial wastes, J Eur Ceram Soc 18 (1998)
153-160.
51
Toya, T.,Tamura, Y., Kameshima, Y., Okada, K., Preparation and
properties of CaO-MgO-Al2O
3-SiO
2 glass-ceramics from kaolin clay refining
waste (Kira) and dolomite, Ceram Inter, 30 (2004) 983-989
52
Beall, G. H., Design and properties of glass-ceramics. A. Review. Mater. Sci.
22 (1992) 91–119
53
Höland W., Rheinberger V. and Schweiger M. A Control of nucleation in
glass ceramics Phil. Trans. R. Soc. Lond 361 (2003) 575-589
54
Beall, G. H. Glass-ceramics: recent development and application. in
nucleation and crystallization in glasses and liquids (ed. M. C. Weinberg).

46
Ceramic Transactions Series, Westerville, Ohio. The American Ceramic
Society.30 (1993) 241–266.
55
A. D. Rollett Microstructure properties: II Crystallization of Glass, Lecture
Notes 2002

47

48
Chapter 4
Materials and Characterisation
4.1 Aim of the Study
It is a present fact that no manufacturing or industrial process can exist
without emission of some level of unwanted by-products, i.e. wastes. The
consequent environmental damage is obviously enhanced by the associated
consumption of natural resources, which are increasingly limited in supply.
Glass-ceramic technology can provide a positive contribution to the reduction
of negative impacts to the environment, since added-value products can be
developed using inorganic wastes, thus coupling waste reduction and rational
(re)use of natural raw materials. Wastes usually processed to form glass-
ceramic products come from numerous sources.
Borate and phosphate wastes, less studied as secondary raw materials in
comparison with SLS scrap glass and fly ash, require brief introduction in the
context of the present investigation.
The extraction of commercially valuable borate minerals, such as
colemanite (CaO•3B2O3•5H2O), ulexite (Na2O•2CaO•5B2O3•2H2O) and borax
(Na2O•2B2O3•10H2O), generates a large amount of boron-containing waste.
These consist of clay and carbonates, with a lower B2O3 content compared to
the main ore. Various potential applications of these wastes have been
considered for the building materials industry, i.e. in formulations for cements
and bricks. Most reports in the literature show that borate wastes (BW) cannot
be used efficiently as additive in the aforementioned industrial products due to
the rather high amount of water emitted during the required thermal treatment.
The phosphate waste used in this study, meat and bone meal (MBM) ash,
also known as “bone ash”; is a residue from incineration of meat and bone

49
meal, featuring high percentages of P2O5 and CaO. This residue is available in
very large quantities; the total production of MBM in the European Union
exceeds 3,500,000 tons/year. As an example, in France 850,000 tons of MBM
are produced each year, but only 45% is used in cement plants, while the other
55% does not presently have any established applications. 1
In ceramic and cement industry, fly ash was investigated in numerous
studies. The current annual production of coal ash worldwide is estimated to be
around 600 million tons, with fly ash constituting about 500 million tons at 75–
80% of the total ash produced2. Thus, the amount of coal waste (fly ash),
released by factories and thermal power plants has been increasing throughout
the world, and the disposal of the large amount of fly ash has become a serious
environmental problem. The present day utilization of ash on worldwide basis
is ranging between 3% and 57%, yet the world average only amounts to 16%
of the total ash2. A substantial amount of ash is still disposed of in landfills
and/or lagoons at a significant cost for the utilizing companies and thus for the
consumers.
The thesis is dedicated to the development of glass-ceramic from a
combination of wastes not previously investigated: i) borate and phosphate
containing wastes, ii)common recycled soda-lime-silica (SLS) glass, iii)fly ash.
Three different studies were carried out:
Micro porous glass ceramics from combination of borate,
phosphate and silicate wastes
Dense glass-ceramic production from borate and silica wastes
and its cytotoxic characterization
Wollastonite glass-ceramics from fly ash and boron containing
wastes

50
4.2 Materials
As addressed in the aim title of the introduction part, this thesis is focused
on obtaining three different products through aforementioned wastes where
borate waste was constant at all studies. The used wastes, in addition to BW,
are;
Borate waste (BW) from the borate mine waste deposits in Bigadic
(Turkey);
Meat bone and meal (MBM) ashes, from Glanford Power Station near
Scunthorpe in Lincolnshire, UK;
SLS glass waste from municipal recycling (provided by SASIL Life,
Biella, Italy).
In every product mentioned, wastes were treated separately, with different
instruments in different conditions. Particle sizes, applied thermal treatments
and used methods were varied in each product in order to achieve the expected
structure and explore the alternative methods. For a better understanding of the
each research, production steps will be explained and examined separately for
each product.
The constant material BW used in all studies was selected from three
different borate wastes gathered from ulexite and colemanite concentrator
plants located next the borate mines in Turkey. After chemical analyses, it has
been decided to use, in all studies, the high B2O3 containing waste, from
Bigadic colemanite enrichment plant. The chemical compositions of the used
materials are presented in Table 4.2;

51
FA BW SLG MBM
Kaolin
Clay
SiO2 49,4 16,1 71,6 2.3 54
Na2O 0,9 0,22 13,5 8.7
K2O 1,4 0,51 0,4 3.5
MgO 1,6 6,91 3,9 1.3
CaO 8,9 26,41 9 46.4
SrO 1,23
Al2O3 22,7 0,89 1 0.2 46
Fe2O3 7,4 0,11 0,1
TiO2 1,1 3.6
SO3 0 34.0
P2O5 0
B2O3 0 19,67
others 5,3 0,5
LOI 1,3 27,98
Table 4.2 Details of the chemical compositions of the used materials
4.2.1 Materials for producing micro porous glass ceramics
from combination of borate, phosphate and silicate wastes
Cellular ceramics, or ceramic foams, constitute a typology of ceramic
products of growing interest due to their industrial use as insulators,
membranes for separation processes in the chemical industry and foamed
filters, for hot gas cleanup and molten metal processing3. For the production of
these kinds of materials, different techniques are used connected to the
application areas, i.e. sol–gel methods, polymeric sponge method, control of

52
sintering conditions to achieve a partial densification, reaction sintering, direct
foaming, pyrolysis of organic additives and bubbles generation in slurries or in
a green body, during specific thermal treatments4. A limited number of papers,
to date, report the production of glass-ceramic foams. Most are in the field of
biomaterials5,6,7
and other papers concern foams from inorganic wastes8,9,10
.
Such foams could be very attractive, considering the possibility of confining
toxic components in an ecologically harmless, leach-resistant glass-ceramic
matrix phase in the form of a foamed material with tailored high porosity,
suitable for various purposes.
The evolution of non-toxic gas in a silicate-glass matrix upon thermal
decomposition of BW is potentially advantageous, for a foaming process. If a
glassy phase with an appropriate viscosity is available. It is also known that the
foaming of glass occurs when gaseous species originate by decomposition or
oxidation of a pyroplastic mass, not too viscous to feature a modest expansion
nor excessively fluid to release the gases11
. The calcite present in BW, as an
example, may be very useful as a foaming agent if the softening temperature of
the glass in which it is embedded is not higher than its decomposition
temperature, as in the case of CRT glasses12
. Starting from the aforementioned
BW and phosphate waste, a glassy phase was expected to be developed by the
combined action of borate and phosphate compounds, well known to provide
glasses with low characteristic temperatures13
; the addition of kaolin clay
provided silica and alumina. Recycled SLS glass was chosen as an extra
additive essentially to modify the features of the developed glassy phase. The
presence of more than one oxide, acting as a glass network former, was
expected to promote crystallisation, i.e. the obtainment of porous glass
ceramics, taking into account the high tendency towards phase separation of
glasses containing multiple glass formers13
. For the optimised combination of
wastes, additives and thermal treatments, high porous glass ceramics with
homogeneous microstructure were effectively obtained. Such positive results
may promote the large scale reutilisation of the selected wastes in the
formation of structural foams.

53
4.2.2 Materials for producing of dense glass-ceramic from
borate and silica wastes and for its cytotoxic characterization
Distinctively from the previous study, in this research soda lime silica glass
(SLS) waste was used as a main additive together with BW and MBM ash in
different proportions and heating rates. SLS wastes, that usually contain 70%
SiO2, 10% Na2O and 10% Ca2O, is one of the most important waste materials
considering not only its amount of production, but also its natural and
economic gains. It is collected from windowpanes, bottles (containers) and
glass products through various industries (glass packaging and other waste
glass from municipal, commercial or industrial sources, mixed municipal solid
waste and bulky waste etc.). In 2009, 11.5 million tons of packaging glass
waste were collected from all the 27 European countries, including Norway,
Switzerland and Turkey. Packaging glass recycle ratio is 65% in EU
countries14
.
Various researches are published on the re-use possibilities of waste glasses,
especially when there are colored glasses that are hard to separate, and these
researches are generally focused on utilizing them in glass15
, ceramic16
, glass-
ceramic17
, porcelain18
and in cement industry19
.
The main objective of the present study is to obtain a glass-ceramic
structure by favoring crystallization with rapid firing at relatively low
temperature through using well known glass forming oxides and to obtain a
previously uninvestigated dense glass-ceramics from combination of three
different wastes.
As Mentioned in chapter 3, beside of being a highly preferred and gainful
waste utilization technique, glass-ceramic option has its own boundaries too. In
glass- ceramic technology, the toxic components can be encapsulated in the
material’s glass matrix phase, but on the other side, boron within a glass
forming oxide B2O3, can be toxic after reaching previously mentioned
amounts. In this research this effect will be studied through cytotoxicity
analyses on sintered samples.

54
4.2.3 Materials for producing wollastonite glass ceramics
from fly ash borate wastes
Fly ash is a side product obtained from the combustion of coal in power
plants (energy production). The physical and chemical characteristics of fly ash
depend on the type of coal used and the combustion conditions; due to these
variable characteristics, fly ash is considered as an environmental pollutant, as
well as a waste and a potential raw material. In energy production, fly ash is a
waste material, but also a resource waiting to be utilized in the coal industry.
Fly ash has been examined numerous times by the thermal electricity
production industry in order to find efficient re-use strategies: in last 15 years,
significant developments have been achieved by research and development
studies.
Today, fly ash is being used by the cement industry as an additive in
concrete production as well as ceramic industry. In ceramic industry fly ash
utilization together with clay has been studied and efficient strategies
developed for the production of dry pressed ceramic tiles20
21
.
This research is focused on the re-use and utilization possibility of fly ash
(FA) obtained from power plant in Greece, together with previously
investigated waste materials, BW and SLS . After examining the researches
made on FA utilization technologies, it has been seen that FA containing high
amounts of SiO2, CaO, and Al2O3 can be used as a suitable raw material for
glass-ceramic production. The objective of the research was to study a possible
starting composition respecting the CaO- SiO2- Al2O3 (wollastonite) glass-
ceramic ternary system, with a heat treatment studied in aforementioned
researches, thus comparing the results in order to achieve glass ceramics with
better characteristics which also can be used in construction industry.

55
4.3 Characterisation
4.3.1 Inductively Coupled Plasma (ICP)
Inductive coupling plasma is an efficient instrument for chemical composition
analyses, compared to other methods ICP analyses are considered more
economic and sensitive in several aspects.
In inductively coupling plasma analyses, a high-frequency current is sent to
load the coils which surrounds a torch, with conductive argon gas being
swirled through the torch, a spark is applied to the gas causing some electrons
to be stripped from their argon atoms. These electrons then caught up in the
magnetic field and accelerated by it. Adding energy to the electrons by this
manner is known “inductive coupling”. The Argon gas passing through this
coil forms the argon plasma, reaching a temperature of 6000 to 11000°C. By
high temperature plasma, excited electrons carried by a secondary gas emit
energy at a given wavelength, as they return to ground state after excitation.
Nearly all elements in examined sample create its own wavelength specific to
its own. At the end, a spectrometer analyses the spectra of the emitted lights of
the examined elements, resulting sensitive analyses possible.
Emission spectrometry using an ICP light source is known as "ICP Emission
Spectrometry."
All the chemical analyses in this research are done with inductively coupled
plasma optical emission spectroscopy model; 3200 XL Perkin Elmer, USA
4.3.2 X-Ray Diffraction (XRD)
X-ray diffraction (XRD) is a non-destructive highly preferred analyse
technique mainly used for phase identification of crystalline materials, minerals
or inorganic compounds. XRD also can be used to examine unit cell
dimensions.

56
In this method, the analysed material has to be finely grounded and
homogenized. X-rays are produced in a device called an X-ray tube. (Figure
4.3.2.1) It consists of an evacuated chamber with a filament at one end of the
tube(cathode) and a metal target at the other end (anadode).
Electrical current is run through the tungsten filament, causing it to glow and
emit electrons. A large voltage difference is placed between the cathode and
the anode, causing the electrons to move at high velocity from the filament to
the anode target resulting inner outer shell transfer of the electrons. These
electronic transitions results in the generation of X-rays. 22
Figure 4.3.2.1 - X-Ray Tube
The generated X-rays are concentrated and directed towards on the sample.
Due to Bragg's Law (nλ=2d sin θ) when a monochromatic X-ray beam with
wavelength lambda is projected onto a crystalline material at an angle theta,
diffraction occurs only when the distance traveled by the rays reflected from
successive planes differs by a complete number n of wavelengths. In other
words, this law relates the wavelength of electromagnetic radiation to the
diffraction angle and the lattice spacing in a crystalline sample.
These diffracted X-rays are then detected, processed than noted. By scanning
the sample through a range of 2θangles, all possible diffraction directions of
the lattice should be attained due to the random orientation of the powdered
material. Conversion of the diffraction peaks to d-spacing allows identification
of the mineral because each mineral has a set of unique d-spacing. Typically,
this is achieved by comparison of d-spacing with standard reference patterns. 23
X-ray powder diffraction is also used for;

57
Characterization of crystalline materials
Identification of fine-grained minerals such as clays and mixed layer
clays that are difficult to determine optically
Determination of unit cell dimensions
Measurement of sample purity
With specialized techniques, XRD can be used to:
Determine crystal structures using rietveld refinement
Determine of modal amounts of minerals (quantitative analysis)
Characterize thin films samples
Make textural measurements, such as the orientation of grains, in a
polycrystalline sample23
Phase characterization of the starting materials was performed by Philips
PW3830, NL; phase identification was achieved by means of the Match!
program package (Crystal Impact GbR, Bonn, Germany), supported by data
from PDF-2 database (ICDD-International Centre for Diffraction Data,
Newtown Square, PA).
4.3.3 Heating Microscopy (Hot Stage Microscopy)
Heating microscopy is also known as hot stage or thermal microscopy, a
combined system of microscopy and thermal analyses. This technique provides
a better understanding concerning the sintering behaviors of the materials, such
as determining the melting point and changes in volume while sintering, plus,
enabling the simultaneous comparison of the sintering behaviors of the
samples.

58
Figure 4.3.3.1 - Heating Microscope- Expert system solutions, A) Hot stage, B)
Microscope
Figure 4.3.3.2 - A comparison between two samples accessed with heating
microscopy
The heating microscopy analyses in this research are made by, Expert system
solutions-Heating microscope HSM MO, Italy.

59
4.3.4 Density
The densities in this research are measured with pycnometer and by averaging
mass by geometrical volume methods.
Pycnometer is a container usually made of glass or metal, used to determine the
density of the insoluble, irregular, porous solid materials .While determining
the density of the material with pycnometer, the mass of solid is determined by
weighing. While measuring the denstiy, the sample is first placed in a
pycnometer filled with a liquid of known density such as water, the volume of
the liquid which will overflow is equal to the volume of the solid. The density
measurements in this research was made by Micromeritics AccuPyc 1330,GA,
USA.
The mass of the overflown liquid is defined as the difference between the sum
of the mass of the pycnometer filled with liquid, plus the mass of the solid and
the mass of the pycnometer filled with liquid after the solid has been placed
inside. The volume associated to this mass is determined from the known
density of the liquid. The density of the solid is determined from these
measurements of mass and volume.24
Density is the ratio of the mass of a body to its volume.
d= M/V
M: The mass of the empty pycnometer
Mw : The mass of the pycnometer filled with water at t°C.
d: The density of water at t°C
V:Volume of the pycnometer
V = (Mw−M)/d 1
ML: The mass of the pycnometer when filled with the liquid.
dL: The density of the liquid
dL = (ML − M)/V = d(ML − M)/(Mw−M) 2

60
MS: The mass of the solid
ML’s: The mass of the pycnometer containing the sample and filled with the
liquid.
The mass of the liquid displaced is;
ML’ + Ms − ML’s 3
When the volume of the solid is equal to the ratio of the mass of the liquid
displaced to d’, the density of this liquid at t°C,
The mass of the solid at that temparature;
(ML’ + Ms − ML’s)/d’ 4
ds = Msd’/(ML’ + Ms − ML’s) 5
4.3.5 Mechanical Strength
To determine the mechanical characteristics of the sintered samples, worldwide
used testing equipment Instron is used. Method of instron is subjecting a
selected sample from the material or component to forces either tensile (pull),
compressive (crushing), bending, torsion (twisting), frictional, peel resistance.
The testing machine measures the forces applied to the sample and determines
the behavior of the material. In this research compression and split tensile
strengths of the materials are studied. Split tensile strength of some samples are
measured with Brazilian testing method, the required details about this method
will be examined in part 6.3

61
Figure 4.3.5.1 - Instron
To measure compression strength with instron, sample is placed on a receptacle
between two pressing arms. In small samples (less than 3cm of diameter), in
order to prevent surface cracks which may cause rubbing with the load arm’s
surface, the surface of the arms has to be covered with a plastic patch. This
patch must not be over 2 mm, due to the possibility of miscalculation by stress
absorbing ability of the patch. When the sample is placed, loading begins till
the maximum stress that the sample can sustain (crush of the sample) load rates
can be read through the monitor of the instron in order to calculate by dividing
the maximum load by the original cross-sectional area of the sample. In this
research, to obtain a valid result, 20 samples from each composition are tested
by means of Instron 1121 UTS and Instron 4204, MA, USA.

62
4.3.6 Scanning Electron Microcopy (SEM)
The objective of the scanning electron microscopy (SEM) is to magnify and
focus on the studied solid surface in high magnifications when the other lens
holding microscopes are not enough. The external morphology, elemental map,
crystalline structure and crystalline shapes of the examined sample can be
determined/imaged through SEM. Instead of glass lenses, in SEM,
electromagnets
are used to focus beam of high-energy electrons and to generate a variety of
signals at the targeted area, this areas (mainly range between 1 cm to 5 microns
in width) can be imaged in a scanning mode using conventional SEM
techniques (20X to 30,000X)
A SEM equipped with an Energy-Dispersive X-Ray Spectroscopy (EDS) can
help on determining the chemical composition of the scanned area, or to
determine the crystals in case of complex and unknown structures
For a dependable analyse in SEM, samples must be conductive and electrically
grounded in order to prevent accumulation, thus to obtain higher resolution, to
provide this sample is coated with gold and combined to is receptacle with
copper band, in some cases liquid carbon is also used to for a better
conductivity.
The scanning electron microscopy used in this study was; Zeiss EVO 40 D,
Germany and Quanta FEI 200, Netherlands equipped with an energy dispersive
X-ray analysis attachment (EDS, Inca, Oxford Instruments, UK).
4.3.7 Light Microscopy
Light microscope is a widely used optical microscope providing high-
resolution images of a variety of specimens. In recent years this imaging
technology is highly improved. It is called light microscope because to identify
small objects, it employs light from a source . The light is reflected from a
specimen with a condenser lens, then is passed through other lenses (2 or

63
more depending on the microscope) placed at end of the tube, each magnify the
image.
In light microscopy, resolution, illumination and contrast is as important
magnification. Resolution can be improved using different types of lenses
developed for specific purposes, lighting and contrast can be also improved
using led, florescent modifications such as dark field, phase contrast, and
differential interference contrast. 25
The light microscope used in this study was
LM Zeiss, Primo Vert, Germany.
Figure 4.3.7.1 Light microscope optical pathways26
4.3.8 Cytotoxity
In materials, cytotoxity test is mainly used for testing bio-compatibility and
toxicity of the materials as well as measuring their intolerance levels. In
cytotoxicity tests, due to the fact that toxic chemicals affect parent functions of
cells which are common to all cells, toxicity can be measured by measuring
cellular damage.
Depending on the aim of the test various methods can be followed, in materials
testing, there are two main basic analyses. The first one is to measure cellular
metabolic activity. The metabolic function is assessed through measuring

64
cellular ATP levels or mitochondrial activity. Cellular damage lowers
metabolic activity and enables to comment about the toxicity level of the
examined material.
The other analyse mainly used is the measurement of membrane integrity. The
cell membrane is consisted of an outer system covering the cell which contains
transporters, receptors and secretion pathways. Membrane integrity is
determined by measuring lactate dehyrogenase (LDH) in the extracellular
medium. This enzyme is present in the cytosol, and only can be measured
when the cell is damaged. Due to level of the damage, the cell spread can be
either slow or stopped. The detailed information (parallel to research) about
cyctotoxity analyses will be in part 6.2
4.3.9 Surface Roughness
Surface roughness, also known as “roughness” is a measurement technique of
examining surface texture, this method is mainly used in determining the
surface interaction characteristics of materials in their usage area. The large
deviations on the surface represents rough surfaces which in many cases an
expected feature such as in wearing and friction, while smooth surfaces are
preferred in high surface interaction applications, such as various types of
biomaterials. Roughness measurement can be also made in nanometric scale in
order determine long term behaviors of the materials (cracks, corrosion etc.)
and also to prevent un expected results. 27
In this Research optical determination technique is used with Taylor Hobson,
CCI MP - 3D Optical Profiler, UK. To determine surface characteristics, a
beam of electromagnetic radiation is reflected off from surface, depending on
the surface roughness, radiation of a certain wavelength can be reflected
speculary while another wavelength reflects diffusely, this specular and diffuse
reflections helps to map the surface the sample.

65
References
1Syndicat des Industries Francaises de Co-Produits Animaux (SIFCO),
http://www.sifco.fr/index.html
2 Joshi RC, Lothia RP. Fly ash in concrete: production, properties and uses
Advances in Concrete Technology. Gordon and Breach Science Publishers 2
(1997).
3 L.M. Sheppard: Porous Materials, The American Ceramic Society,
Westerville, OH., 31 (1993) 3-25.
4 R.A. Lopes and A.M. Segadaes Microstructure, permeability and mechanical
behavior of ceramic foams, Mater. Sci. Eng. A., 209 (1996) 149–155.
5 E. de Sousa, C.R. Rambo, D. Hotza, A.P. Novaes de Oliveira, T. Fey and P.
Greil, Microstructure and properties of LZSA glass-ceramic foams Mater. Sci.
Eng., 476 (2008) 89-97.
6 M.F. Gorriti, J.M.P. Lopez and A.R. Boccaccini, In vitro Study of the
Antibacterial Activity of Bioactive Glass-ceramic Scaffolds, Adv. Eng. Mater.,
11 (2009) B67-B70.
7 R. Huang, J. Pan and A.R. Boccaccini, A two-scale model for simultaneous
sintering and crystallization of glass-ceramic scaffolds for tissue engineering,
Acta Biomater., 4 (2008) 1095-1103.
8 D.U. Tulyaganov, H.R. Fernandes, S. Agathopoulos , J.M.F. Ferreira, Low
temperature synthesis of anorthite based glass-ceramics via sintering and
crystallization of glass-powder compacts. J. Porous Mater, 13 (2006) 133-
139(7).

66
9 J.P. Wu, A.R. Boccaccini, P.D. Lee, M.J. Kershaw, R.D. Rawlings, Glass
ceramic foams from coal ash and waste glass: production and
characterisation, Adv. Appl. Ceram., 105 (2006) 32-39.
10 E. Bernardo, Micro- and Macro-cellular Sintered Glass-ceramics from
Wastes, J. Eur. Ceram. Soc., 27 (2007) 2415-2422.
11 G. Scarinci, G. Brusatin, E. Bernardo: Production Technology of Glass
Foam, Cellular Ceramics. Structure, Manufacturing, Properties and
Applications,Wiley-VCH, Weinheim, (2005) 158-176
12 E. Bernardo G. Scarinci, S. Hreglich, Foam glass as a way of recycling
glasses from cathode ray tubes. Glass Sci. Technol., 78, (2005) 7-11
13 J.E. Shelby: Introduction to Glass Science and Technology, The Royal
Society of Chemistry, Cambridge, (2005) 67, 77, 93-100.
14 http://www.feve.org/ The EU association for container glass annual statistics
2009
15 W.M. Brown, K.J.D. Mackenzie, Process design for the production of a
ceramic-like body from recycled waste glass J. Mater. Sci. ,17 (1982) 2164–
2183
16 R.V. Manukyan, N.S. Davydova, Use of waste in the ceramic industry, Glass
and Ceram., 53 (7–8) (1996) 247–248
17 E. Bernardo, R. Dal Maschio, Glass–ceramics from vitrified sewage sludge
pyrolysis residues and waste glasses Waste Manage, 31 (2011) 2245-2252
18 A. Tucci, L. Esposito, E. Rastelli, C. Palmonari, E. Rambaldi, Fired
Porcelain using Wasted Glasses as a Fluxing , J Eur Ceram Soc ,24 (2004) 83–
92

67
19 F. Matteucci, M. Dondi, G. Guarini, Effect of soda-lime glass on sintering
and technological properties of porcelain stoneware tiles, Ceram Int. 28
(2002) 873–880
20 R. Sokolar, L. Smetanova Dry pressed ceramic tiles based on fly ash–clay
body: influence of fly ash granulometry and pentasodium triphosphate addition
Ceram Inter, 36 (1) (2010) 215–221
21 I. Queralt, X. Querol, A. López-Soler, F. Plana Use of coal fly ash for
ceramics: a case study for a large Spanish power station Fuel, 76 (8) (1997),
787–791
22 Stephen A. Nelson X-Ray Crystallography,19.10.2011,
http://www.tulane.edu
23Barbara L Dutrow, Louisiana State University ,Christine M. Clark, Eastern
Michigan University X-ray Powder Diffraction (XRD), www.carleton.edu
24 Cenco Physics Selected Experiments in Physics (No. 71990-184), Copyright,
Sargent-Welch Scientific Company (2003)
25 David R. Caprette, Rice University, 7 Sept 1995 http://www.ruf.rice.edu
26 Olympus micrsocopy reseource center http://www.olympusmicro.com
27 Degarmo, E. Paul; Black, J T.; Kohser, Ronald A. Materials and Processes
in Manufacturing (9th ed.), Wiley, (2003) 223

68

69
Chapter 5
Experimental Procedure
5.1 Experimental procedure for producing micro porous
glass-ceramics from combination of borate, phosphate and
silicate wastes
The wastes used in the preparation of the studied mixtures were borate
waste (BW) and meat bone and meal (MBM) ashes. Their chemical
composition, determined with inductively coupled plasma optical emission
spectroscopy (ICP-OES model 3200 XL Perkin Elmer, USA), is reported in
Table 4.2. Pure kaolin clay and, in some compositions, SLS glass waste were
used as additives. The raw materials used in this study except BW were
previously studied by the ceramic and related industries numerous times, while,
due to the limited knowledge of BW used in this study, BW has been examined
and analysed more in detail than the other selected materials in every step of
the research in order to observe its characteristics under conditions variations.
The raw materials were used after dry ball milling and sieving to a maximum
dimension of 150 µm, the starting SLS glass powder, used in some
compositions was finer, having an average particle size of 50 µm. Both BW
and kaolin clay were used after calcination in an electric laboratory oven at
500°C for 180 min.
Phase characterization of the starting materials was performed by means of
X-ray diffraction (Philips PW3830, NL); phase identification was achieved by
means of the Match! program package (Crystal Impact GbR, Bonn, Germany),
supported by data from PDF-2 database (ICDD-International Centre for
Diffraction Data, Newtown Square, PA). The thermal characterization of BW
powder (< 150µm particle size) and MBM ash (< 150µm particle size) was
investigated by heating microscopy (Expert system solutions-Heating

70
microscope HSM), up to 970°C and 1350°C, respectively, adopting a heating
rate of 5°Cmin-1
.
BW and MBM ash wastes were mixed first with only kaolin clay, giving
origin to the formulation labelled “Mix A”, as reported in Table 5.1.1; such
basic formulation was modified adding 8 and 16 wt% of SLS glass giving
origin to further mixes, labelled “Mix B” and “Mix C” respectively, also
reported in Table 5.1.1.
Table 5.1.1 - Details of the formulations for porous glass-ceramics.
In order to promote the homogeneity of the formulations, the starting
powders were milled with ethanol in zirconia jar mill for 35 min. After drying
in oven at 100°C for 60 min, the powders were sieved at 150 µm sieve,
moisturized with 5 wt.% H2O and uniaxially pressed at 50 MPa to form
cylinders with a diameter of 20 mm and a height of about 9 mm, without using
any binder.
Firing of samples was performed up to the maximum temperature of 1050°C
and adopting very different heating rates, from 2 to 40 °Cmin-1
. Natural
cooling was applied after a dwell of 30 min at the maximum temperature.
Details of the thermal treatments investigated are reported in Table 5.1.2.
Formulations of the tested mixes*, wt%
BW MBM ash SLS glass Kaolin clay
Mix A 36 20 44
Mix B 34 18 8 40
Mix C 30.5 16 16 37.5

71
5.1.2 Details of the adopted combinations of formulation and heating rate.
The phase composition of the fired materials was determined by X-ray
diffraction (XRD) analysis (PW3830, Philips, NL). Phase identification was
achieved by means of the Match! program package (Crystal Impact GbR,
Bonn, Germany), supported by data from PDF-2 database (ICDD-International
Centre for Diffraction Data, Newtown Square, PA). For quantitative
determinations, powdered specimens were diluted with 10 wt% of corundum
NIST 676, acting as an internal standard, and carefully side loaded to minimize
preferred orientation. The data were collected in the angular range 2θ=10-80°
with steps of 0.02° and 5 s/step; Rietveld refinements were performed using
GSAS.1 The microstructure of the fired materials was analysed by scanning
electron microscopy (SEM, Zeiss EVO 40, D) equipped with an energy
dispersive X-ray analysis attachment (EDS, Inca, Oxford Instruments, UK).
Mix Sample Heating
rate,
Cmin-1
Remarks Density,
gcm-3
[Porosity]
Crushing
strength,
MPa
A A1 2 Microporous body 1.52 0.7
[44%]
8.7 1.3
A2 10 Microporous body
A3 20 Microporous body
A4 40 Cracked sample
B B1 2 Microporous body 1.28 0.6
B2 10 Microporous body
B3 20 Microporous body 1.180.4
B4 40 Cracked sample
C C1 10 Inhomogenous Foam
C2 20 Foam 0.44 0.03
[84%]
1.8 0.1
C3 40 Cracked sample

72
The bulk density of fired materials was inferred by averaging masses by
geometrical volumes. For a selected composition small blocks of about 10 mm
10 mm 8 mm were cut from larger disc samples (31 mm diameter) and
used for bulk density measurements and compressive testing (by means of
Instron 1121 UTS, Instron, Danvers, MA) with a cross-head speed of 1
mm/min. True density determinations were performed by means of a gas
pycnometer (Micromeritics AccuPyc 1330, Norcross, GA) on powdered
blocks.
5.2 Experimental procedure for producing dense glass-
ceramic from borate and silica wastes and its cytotoxic
characterization
The three wastes, BW, MBM ash and SLS, were used as starting materials
to prepare the tested mixes. As in the previous study, chemical compositions of
the used wastes were determined with inductively coupled plasma optical
emission spectroscopy (ICP-OES model 3200 XL Perkin Elmer, USA), is
reported in Table 4.2. The phase composition of the starting material and of the
studied mixes, after the thermal treatments, was determined by X-ray powder
diffraction analysis (Philips PW3830, NL); phase identification was achieved
by means of the Match! program package (Crystal Impact GbR, Bonn,
Germany), supported by data from PDF-2 database (ICDD-International Centre
for Diffraction Data, Newtown Square, PA). The thermal characterization of
the starting materials was performed with the use of a heating microscopy
(Expert system solutions-Heating microscope HSM, IT)
Two different mixes were prepared. The first one, labeled A, contains
30wt% of MBM, 30wt% of BW and 40wt% of SLG. Due to the presence of
crystalline phases such as calcite (CaCO3) and colemanite (CaO·3B2O3·5H2) in
BW, that would have released gases during the following heating step, the BW

73
material were calcined at 500°C. The calcined BW and MBM ash are milled
below 150µm. SLG glass is milled below 50µm (Retcsh PM 100 Germany).
Compared to the annual production amounts and re-use capacities of the
selected wastes, BW has the highest amount of production. For this reason, in
the second studied composition, labelled “B”, always respecting the glass-
ceramic ternary system, the amount of BW was increased up to its highest
possible limit. As a final result, B samples contained 40wt% of BW and 30wt%
of MBM ash and SLG. It is known that colemanite (CaO.3B2O3.5H2O), present
in the studied BW, decomposes with the release of five molecules of H2O
between 450 and 500°C, by transforming into a fine particulate material, less
than 0.2 mm in size.2 The temperature of onset of dehydration for colemanite
is 262°C and the first water molecule is lost at 327°C, which coincides
approximately with the onset of decrepitating. The last crystal water loss takes
place at 412°C.3 Several studies underline that the calcination step of
colemanite has an impact similar to that of the milling process.4 5
According to
the main aim of the study, this impact is used to replace calcination, an energy
consuming process. As a result, differently from A samples, the BW waste
used in B samples was not calcined.
The sintering tests were performed on compacted specimens, uniaxially
pressed in form of discs of 10mm diameter and 4.5 mm in height, under a load
of 5.104
N. Specimens of both the mixes were sintered at 950°C by using
different heating rates. A fast sintering, characterised by heating rate of
16.5°C/min up to the maximum heating temperature of 950°C, the sintered
samples are labelled with a tag “F”. The samples fired with the same heating
cycle, but with 1 hour of dwell time at 950°C, are labelled with a tag “H”. A
rather rapid cooling, about 1 hour to reach room temperature, was adopted for
both.
A slow sintering, characterised by heating rate of 2.6 °C/min up to the
maximum temperature of 950°C, with a 3 hours of dwell and natural cooling.

74
The sintered samples are labelled with “S”. In Table 5.2.1, the details of the
different sintering treatments are reported.
Mix Sample Heating rate
°C/min
Tmax /
Soaking time
Cooling Density
g/cm3
σd
MPa
A
AF 16.5 950°C / 1min Fast, 1 hour 1.76 18.40
AH 16.5 950°C / 1h Fast, 1 hour 1.97 12.98
AS 2.6 950°C / 3h Slow, natural
cooling
2.07 14.02
B
BF 16.5 950°C / 1min Fast, 1 hour 2.04 7.88
BH 16.5 950°C / 1h Fast, 1 hour 2.02 14.37
BS 2.6 950°C / 3h Slow, natural
cooling
1.96 15.00
Table 5.2.1 - Details of the adopted combinations of formulation and
heating rate and their physical and mechanical characteristics
The bulk density of fired materials was inferred by averaging masses by
geometrical volumes. The mechanical strength of the different sintered samples
was measured by Brazilian test method. This method is also known as
“diametric compression” and “indirect (splitting) tensile test”, an indirect
experimental method to measure the tensile strength of materials.6 For each
composition, ten sintered discs were tested by using a universal machine
(Instron 4204, Instron, Danvers, Ma, USA).
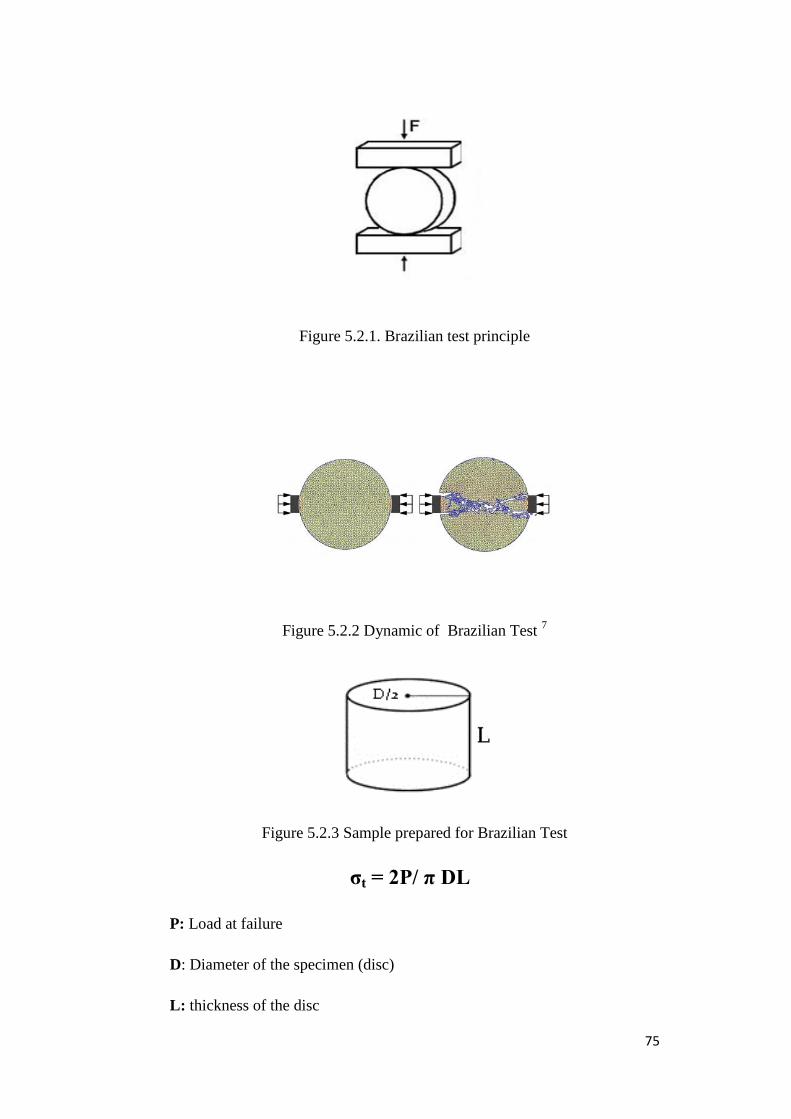
75
Figure 5.2.1. Brazilian test principle
Figure 5.2.2 Dynamic of Brazilian Test 7
Figure 5.2.3 Sample prepared for Brazilian Test
σt = 2P/ π DL
P: Load at failure
D: Diameter of the specimen (disc)
L: thickness of the disc

76
The morphology of sintered samples were investigated by means of light
(LM Zeiss, Primo Vert, Germany) and scanning electron microscopy (SEM),
(Quanta FEI 200, Netherlands).
Surface roughness analyses of the sintered samples were performed by 3D
surface profilometer (Taylor Hobson Precision Ltd, UK). In order to perform
the cell toxicity analyses, the surfaces which to be cell seeded has to meet the
required profile for the cell growth. These analyses were done in order to
determine the surface structure of the sintered samples.
To evaluate the cell toxicity of two different waste materials compared with
a reference, MEF (mouse embryonic fibroblasts, Fig. 5.2.4) cells (provided
from Prof. Fabry, Biophysics Erlangen, Germany) were used. These cells was
cultured at 37 °C in a humidified atmosphere of 95 % air and 5 % CO2, in
RPMI 1640 (Gibco, Germany) containing 10 vol.% fetal bovine serum (FBS,
Sigma-Aldrich, Germany) and 1 vol.% penicillin/streptomycin (Sigma-Aldrich,
Germany). Cells were grown for 48 hours to confluence in 75 cm2 culture
flasks (Nunc, Denmark), before harvested using Trypsin/EDTA (Sigma,
Germany), counted by a hemocytometer (Roth, Germany) and diluted to a final
concentration of 100,000 cells/ml.

77
Fig. 5.2.4: Light microscopic image of MEF cells.
Before cell seeding, material samples were cleaned by soaking in Extran
(Merck, Germany) and sodium dodecyl sulphate (SDS, Sigma, Germany)
solutions. Afterwards they were sterilized at 134 °C in an autoclave (Systec,
Germany) and placed in a 48-well cell culture plate (Greiner, Germany).
LDH (Lactate dehydrogenase activity )-activity gives a measurement of the
amount of attached cells on the analysed materials. Therefore, the toxicology
kit from Sigma was used. LDH reduces NAD+, which catalyses the conversion
of tetrazolium to a coloured formazan derivative. A commercially available
lactate dehydrogenase (LDH) quantification kit (TOX7, Sigma-Aldrich) was
used to quantify cell proliferation by enzyme activity in cell lysate. Cells
cultured in 48-well plates were washed with phosphate buffered saline (PBS)
solution and lysed with lysis buffer for 10 minutes (1 ml/well). The lysate
solutions were centrifuged for 5 min at 1000 rpm and 100 µl from the
supernatant solutions was transferred to a 98-well plate. 30 µl of Master-mix
was added to each well containing equal amounts of: substrate solution, dye
solution and cofactor solution for LDH assay. The plates were left for 30
minutes in the dark and the reaction was stopped with 40 µl HCl 1 N per well.

78
The dye was measured using a spectrophotometer (SPECORD 40 BU,
analytikjena, Germany) at 490 nm.
For measuring the mitochondrial activity and assessing the influence of
different materials on the viability of MEF cells after 48 hours of culture, a
WST-8 assay (Sigma-Aldrich) was used. After a cultivation period of 24 hours,
the mitochondrial activity MEF cells was measured by the conversion of
tetrazolium (WST-8, Sigma) to formazan by mitochondrial enzymes. Culture
media was removed from the 48-well wells plates and the cells were washed
with PBS. After addition of 100 µl of solution containing 99 µl culture medium
and 1 µl WST-8 in each well, the plates were incubated for 1 h. Subsequently,
the solution was given in a 98-well plates (50 µl in each well) to measure the
absorbance at 450 nm.
Cell morphology
After 24 hours the cultures were washed with PBS. Cells were fixed with a
solution containing 3 vol.% glutaraldehyde (Sigma, Germany) and 3 vol.%
paraformaldehyde (Sigma, Germany) in 0.2 M sodium cacodylate buffer (pH
7.4) and rinsed three times with PBS. For cell observation using scanning
electron microscopy (Quanta FEI 200, Netherlands), all samples were
dehydrated in a graded ethanol series (10, 30, 50, 75, 90, 95, 98 and 100
vol.%). Samples were maintained at 100 vol.% ethanol and critical-point dried.
The samples were sputtered with gold before being examined by scanning
electron microscopy (SEM).
Statistics
Results are presented as mean value ± standard deviation of four replicates
of each sample type. Statistical evaluation was performed by one-way analysis
of variance (ANOVA) with a level of statistical significance of P = 0.05
(Origin 6.1G, Origin Lab. Corp., USA). All results were normalized to REF
(=100%).

79
5.3 Experimental procedure for producing wollastonite glass-
ceramics from fly ash and boron containing wastes
The waste materials are selected to generate low porous glass-ceramic
structure respecting SiO2-Al2O3-CaO (wollastonite) glass-ceramic system.
Chemical compositions of the used wastes were determined with inductively
coupled plasma optical emission spectroscopy (ICP-OES model 3200 XL
Perkin Elmer, USA), and are reported in Table 4.2
The phase composition of the starting material and of the studied mixes,
after the thermal treatments, was determined by X-ray powder diffraction
analysis (Philips PW3830, NL).
The thermal characteristics of the raw materials and compositions were
studied with heating microscopy (Expert system solutions-Heating microscope
HSM) by adopting the same thermal cycle used for sintering.
It is expected the amounts of Al2O3 present in FA and B2O3 in BW will
provide positive effect on glass structure as glass network former and lower the
sintering temperature while CaO has a modifying effect. On the other hand,
traces of ZrO and BaO are expected to lower the viscosity. Fe2O3 in FA is an
intermediate character which can stabilize the glass structure and can generate
porosity between 850-950 °C caused by Fe2O3 transformation. Ternary system
respecting these compositions point a high chemical stability due to the amount
of alkalines present in wastes.
In order to meet the required proportions for a wollastonite glass-ceramic
system, two compositions were prepared. These compositions are named B and
B2. Composition B was consisting of 30 wt % FA, 30 wt % BW and 40%
SLG, where B2 was 30 wt % FA, 20 wt % BW and 50% SLG. The reason for
decreasing the BW amount in composition B2 was to obtain more closer
proportions to the requirements of the wollastonite glass-ceramic ternary
system. The weight percentage of the compositions are reported in table 5.3.1.
As in previous studies, the used boron waste is calcined at 500°C. All waste
materials used milled below 100µm (Retsch PM 100 Germany).

80
Formulations of the tested mixes* wt%
B 30 30 40
B2 30 20 50
BW is calcined
Table 5.3.1 The weight percentage of the prepared compositions
Samples’ firing was performed up to maximum temperature of 950 and
1050 °C and adopting different heating rates from 5.5 °C/min to 21 °C/min.
Half of each compositions was sintered with a holding time of 1 hour while the
natural cooling was applied to the other half. Holding time was applied in order
to observe the sintering effect, providing better properties in case of ceramics,
and to observe the characteristics of the expected crystals, their sizes, and
amorphous wt% of the sintered samples.
The samples prepared with composition B without holding time with a
heating rate of 21 °C/min. were labeled as FB, same rate with 1 hour of holding
time were labeled as FBH and slow sintered samples with a heating rate of 5.5
°C/min. were labeled as BS. Same labeling also applied for composition B2
(FB2,FB2H, FBS), Table 5.3.2 shows the heating rates and sample codes.
The sample FB95 was sintered up to 950°C with a heating rate of 21
°C/min. in order to observe its microstructural characteristics at a relatively
lower temperature and, as in previous studies, to examine the effects of fast
sintering, an environment friendly technique. The researches at 950°C were
suspended after observing poor crystals on SEM results of the sintered
samples. Sample BS was sintered with a heating rate of 5.5°C/min., in order to
study and compare effects of fast sintering.

81
Sample Comp. Heating rate
(°C/min)
Max. Temp. (° C) Holding Time
FB95 B 21 950 NO
FB B 21 1050 NO
FBH B 21 1050 1 hour at 1050
FB2 B2 21 1050 NO
FB2H B2 21 1050 1 hour at 1050
BS B 5.5 1050 1 hour at 1050
BS2 B2 5.5 1050 1 hour at 1050
Table 5.3.2 Heating rates and sample codes

82
References
1 A.C. Larson, R.B. Von Dreele, General Structural Analysis System (GSAS),
Los Alamos National Laboratory Report, LAUR., (1994) 86-748.
2 S. Piskin: Thermal properties of hydrated boron minerals, Doctoral
Dissertation, Istanbul Technical University, (1983)
3 M.S. Celik, F. Suner: A thermodynamic analysis of the decrepitation process,
Thermochim Acta, 245 (1995) 167174 4 Ö. Yildiz, The effect of heat treatment on colemanite processing: a ceramics
application Powder Technol., 2004 142 7-12. 5 M.S. Celik, F. Suner: Thermodynamic Analysis of Decrepitation of Boron
Minerals, Thermochim. Acta, 245 (1995) 167–174.
6 M.K. Fahad: Stresses and Failure in the Diametral Compression Test, J.
Mater Sci, 31 (1996) 3723-3729 7 D’Addetta, G. A., Ramm, E., Diebels, S., Ehlers, W. A particle center based
homogenization strategy for particle assemblies, Engng. Comp., 21 (2004)
360–383.

83

84
Chapter 6
Results and Discussions
6.1 Micro porous glass-ceramics from combination of borate,
phosphate and silicate wastes
Colemanite (CaO.3B2O3.5H2O), present in BW, is known to decompose
with a rapid release of its five molecules of water in the range 450-500 °C, by
transforming into a fine particulate material, less than 0.2 mm in size1. For this
reason, several studies underline that the calcination step of colemanite has an
impact similar to that of the milling process2,3
. In order to exploit this “auto-
milling” and promote homogenisation, BW and kaolin clay were used after
mixing and calcination at 600°C. From heating microscopy observations it was
found that BW began to melt at 880°C. On the contrary, MBM ash did not melt
and had no significant change, except for a slight expansion of 1%, in the
temperature range of 900-1200 °C.
The XRD analyses of the studied wastes are reported in Fig. 6.1.1. BW (Fig.
6.1.1a) contains, as main crystal phases, colemanite (PDF#74-2336) and calcite
(CaCO3) (PDF#05-0586). The presence of minerals similar to colemanite, but
having a different CaO/B2O3 ratio, such as olshanskyite (3CaO.2B2O3.9H2O)
(PDF#22-0144)and another calcium borate hydrate
(2CaO.3B2O3.5H2O,PDF#22-0146), is also probable, mainly considering the
peaks at 216°, 229° and 232°. Traces of saponite
[(Ca,Na)0,3(Mg,Fe+2
)3(Si,Al)4O10(OH)24(H2O)], gypsum (CaSO42H2O) and
illite [(K,H3O)(Al,Mg,Fe)2(Si,Al)4O10[(OH)2,(H2O)] cannot be excluded,
because their peaks overlap with those of the main crystal phases.
MBM ash has a much simpler phase assemblage (see Fig.6.1.1b), consisting
of hydroxyapatite (Ca5(PO4)3(OH), (PDF#73-0294) and traces of beta-phase

85
tri-calcium phosphate (β-TCP, Ca3(PO4)2), also known as whitlockite
(PDF#09-0169).
After the thermal treatment of BW/MBM ash/kaolin clay mixture, the
original phase composition changes (see Fig.6.1.1b), owing to calcite
decomposition, providing both CaO and CO2 gas, useful for obtaining porous
bodies. Hydroxyapatite, from MBM ash, is still present, but accompanied by a
significant amount of anorthite, CaAl2Si2O8 (CaO·Al2O3·2SiO2) (PDF#86-
1706). The presence of such newly formed phase is consistent with recent
observations regarding the thermal behaviour of kaolin minerals when coupled
with Ca-rich substances, including Ca-rich glasses4 as metakaolinite
(Al2O3·2SiO2), from kaolin dehydration, interacts with Ca2+
ions, forming
calcium feldspar (anorthite). The other components are likely involved in the
formation of a glassy phase.
Figure 6.1.1 - X-ray diffraction patterns of the starting wastes and of sample
A1 (fired mixture of BW, MBM and kaolin clay).

86
To better understand the phase reactions, for selected fired samples,
quantitative X-ray diffraction analysis were also performed, the results of
which are reported in Table 6.1.1
Table 6.1.1 - Quantitative X-ray diffraction analysis results of selected
samples.
The crystallization of anorthite in samples A1 and B1, subjected to the same
heating rate of 2 °C min-1
, is similar. The distribution of further phases,
however, may be interpreted on the basis of a different origin of CaO, reacting
with clay residue to yield anorthite. In fact, CaO may originate: i) from the
decomposition of calcite, ii) from the decomposition of hydroxyapatite into
whitlockite (2Ca5(PO4)3OH3Ca3(PO4)2+CaO+H2O), iii) from the glass. The
increased content of hydroxyapatite compared to whitlockite, when passing
from A1 to B1, is the reasonable effect of the fact that CaO was extracted from
the glass rather than by decomposition of hydroxyapatite. Due to the lower
content of MBM ash, hydroxyapatite should be present in a lower amount in
mix B, compared to mix A. Anorthite formation is greatly conditioned by the
heating rate, as testified by the comparison of samples B1 and B3: the slow
Formulation A1 B1 B3
Heating rate, °Cmin-1
2 2 20
Crystal phases, wt.%
Quartz 1.0(1) 0.9(1) 0.2(1)
Anorthite 43.5(3) 44.2(2) 26.6(3)
Hydroxyapatite 7.2(2) 10.5(2) 8.5(2)
Whitlockite 14.1(3) 8.1(3) 7.4(3)
Amorphous phase 34.2(1) 36.3(8) 57.3(9)

87
heating rate of 2 °Cmin-1
, used for B1, determined longer times at high
temperature, 50 min, for passing from 950 °C, a temperature around which
anorthite is reported to precipitate,5 to 1050 °C. This condition in turn favoured
the interdiffusion of ions and crystallisation phenomena.
The basic formulation, Mix A, was originally developed to form ternary
B2O3-P2O5-SiO2 glasses, yielding particularly porous bodies, i.e. the so-called
“gas-ceramics” from Corning Inc.5.The molar balance among the network
formers is very close to the reference glasses, however, the presence of
network modifiers, and typically CaO, complicated the achievement of
homogeneous foams. The remarkable formation of anorthite greatly increased
the apparent viscosity, so that the CO2 released from the decomposition of
calcite, in BW, did not cause a significant expansion.
Fig. 6.2 illustrates some microstructural details of the porous glass-ceramics
developed from the selected mixtures of wastes. Mix A, when treated with the
slow heating rate of 2 °Cmin-1
, led to microporous samples that were not
particularly homogeneous (Fig. 6.1.2a). The precipitation of many
microcrystals, visible in the high magnification image of Fig. 6.1.2b, justifies
such poor homogeneity. The introduction of SLS glass, in Mix B, as illustrated
by Fig. 6.1.2c, enhanced the viscous flow, leading to the formation of many
pores with a more rounded shape. In any case, due to the slow heating, even in
the presence of glass additive, the samples cannot be regarded as “foams”, but
simply microporous bodies, since the pores are all quite isolated and separated
by relatively thick struts. The increase of heating rate, owing to the above
discussed effect of limiting the crystallization (mainly of anorthite phase),
greatly favoured the development of pores. The porosity increased with
increasing glass addition, from A2, (Fig. 6.1.2d) to B2 (Fig. 6.1.2e) and C1
(Fig. 6.1.2f). Samples B2 and C1 were clearly foamed, but again with poor
homogeneity. B2, in fact, exhibited great differences in pore size along the
thickness, whereas C1 showed quite large struts, in turn featuring many
micropores, known to be detrimental to the mechanical properties.Error!
Bookmark not defined.

88
Figure 6.1. 2 - SEM micrographs of fracture surfaces of selected porous
glass-ceramic samples: a, b) A1; c) B1; d) A2; e) B2; f) C1.
To improve the foaming process, the application of faster heating rates,
typical of the firing of most industrial ceramic products, was tested. The use of
a heating rate of 40 °Cmin-1
was very disadvantageous, leading to cracked
samples (Fig. 6.1.3), for every formulation, from A4 (without glass) to C3
(comprising 20 wt.% glass).
Figure 6.1.3 - Macroscopic appearance of samples A4, B4 and C3 after the
thermal treatment with 40 °C min-1
heating rate.

89
A likely reason for this behaviour is represented by non-uniform heating. In
fact, very high heating rates determine a temperature gradient from the hotter
surface to the centre of the samples, with consequent differential sintering and
foaming. The foaming of the internal zone probably occurred slightly after the
foaming of the surface, where the pores first developed had enough time to
collapse, causing the samples to “explode”. As shown by Fig. 3, sample C3,
featuring more glass, appeared more "foamy" and less cracked; this could be
interpreted on the basis of a higher ability to accommodate the volume changes
associated to the release of CO2, due to increased viscous phase.
The intermediate heating rate of 20 °Cmin-1
was finally used for all the
formulations. Samples A3 and B3, with no glass and with limited glass content
respectively, were still poorly foamed or inhomogeneous. Sample C2, on the
other hand, consisted of a white foam with uniform pore structure: as shown in
Fig. 6.1.4a, the struts are thin, exhibiting limited microporosity. As illustrated
by the micrograph in Fig. 6.1.4b and by the XRD patterns in Fig. 6.1.5, the
foam is still crystalline with anorthite being the main crystal phase and
hydroxyapatite and whitlockite being secondary phases. Formulation A yielded
more crystallized samples, as demonstrated by the higher intensities of the
diffraction peaks in Fig. 6.1.5a. Furthermore, both the formulation A and B
were quite stable, in their crystallization, when passing from 10 to 40 °Cmin-1
(the quantitative data reported for the heating at 20 °C min-1
, in Table 6.1.3,
may be considered valid also for the other heating rates). On the other hand,
formulation C, characterised by the presence of a larger amount of SLS glass,
is more influenced by the heating rate. C3 sample, heated at 40 °C min-1
, is
characterised by a rather low crystallization, as can be inferred by the height of
the peaks in Fig. 6.1.5b, whereas C2 sample, heated at 20 °Cmin-1
, was quite
similar to samples B2 and B4.

90
Figure 6.1.4 - SEM micrographs of sample C2, 20 °C min-1
heating rate,
characterised by optimized foaming, a) surface, b) high magnification detail of
a cell strut, evidencing lot of microcrystals.
Figure 6.1.5 - X-ray diffraction patterns of the studied glass-ceramics.
The crushing strength of 1.8 MPa, obtained for the foamed C2 sample, is of
the same order of magnitude as most glass foams reported in literature.Error!
Bookmark not defined. It should be remembered that glass foams are no longer
merely used for both thermal and acoustic insulation, in the form of panels, but
they are now used also for lightweight concrete manufacturing, in the form of
loose aggregates or granules.Error! Bookmark not defined. The comparison with
microporous A1 sample is interesting in the view of this latest application. A1,

91
due to its superior compressive strength, almost 9 MPa, could be applied in
lightweight concrete structures subjected to moderate loads, featuring moderate
thermal insulation ability (concretes of this type generally feature aggregates
with strength from 7 to 18 MPa). C2 formulation could be useful for actual
thermally insulating concrete, to be used as insulating filler or coating
(concretes of this type generally comprise aggregates with modest strength and
density below 0.8 gcm-3
)6. Cellular glasses have been reported to be less
susceptible to the alkali-silica reaction, generally involving aggregates
featuring amorphous silica, than monolithic glasses7. The materials here
presented, being partially crystalline, are thought to be even more chemically
resistant; specific determinations of the behaviour of optimised foams in
concrete will be the object of future investigations
6.2 Dense glass-ceramic from borate and silica wastes and its
cytotoxic characterization
The different amounts of wastes used in the two mixes were chosen to
generate the B2O3: P2O5: SiO2 ternary system and to meet the rates of the
amounts of the system. The aim was to enable controlled crystallization on
selected wastes, providing a high chemical durability and strength. The reason
for this high chemical durability should be assured by the presence of SiO2
glass matrix in glass-ceramic structure which protects the crystals from
chemical reactions.
The XRD patterns of the mixtures after firing, in different conditions, are
reported in Fig. 6.2.1. The crystallinity of the samples, owing to the almost flat
background and the number of peaks, is reputed to be substantial. As a general
trend, the main peaks can be grouped into two groups, labelled as “S” and “P”
in both Fig.6.2.1a and 6.2.1b. The “P” peaks are almost constant, in terms of
intensity, whereas “S” peaks are quite variable. For A samples, shown in Fig.
6.2.1a, “S” peaks decrease when passing from fast treatment (AF, 950 °C for 1
min, after rapid heating) to slow treatment (AS, 950 °C for 3 h, after slow
heating). Interestingly, for B samples, shown in Fig.6.2.1b, “S” peaks exhibit

92
an opposite trend. Finally, the most crystallized samples for the two
formulations, as testified by Fig.6.2.1c, are very similar.
Fig.6.2.1c shows that the two groups of main peaks are attributable to two
distinct types of compounds. While “S” peaks are due to the contribution of
silicate phases, such as diopside (CaMgSi2O6, PDF#83-1818) and wollastonite
(-CaSiO3, PDF#72-2284), “P” peaks are due to hydroxyapatite (HAp,
PDF#86-0740). Also minor peaks are associated to a combination of silicates,
such as akermanite (Ca2MgSi2O7, PDF#87-0049), and phosphates, such as
tricalcium phosphate (Ca3(PO3)2, PDF#70-2065) and Na-Ca phosphate
(NaCaPO3, PDF#74-1950). Phosphates represent unreacted phases, being
already present in MBM waste; the absence of practical variations, comparing
A and B samples, is consistent with the fact that the two formulations comprise
the same amount of MBM. The different balance, in A and B formulations,
among BW and soda-lime glass, has an impact on the crystallization of
silicates. A higher content of soda-lime glass (samples A) promotes a
substantial crystallization in short firing times, likely attributable to interaction
between glass and CaO and MgO oxides from BW; longer firing treatments
evidently favour some dissolution of the silicates, operated by secondary
components of the same BW. On the contrary, a lower content of soda-lime
glass (samples B) promotes a progressive crystallization.
(a)
15 20 25 30 35 40 45 50 55 60 65 70 75
AS
AH
S
S
P
P
Inte
nsity / a
.u.
2 / deg.
AF

93
Figure 6.2.1 Diffraction pattern of samples from MBM/BW/soda-lime glass
mixtures: a) A samples; b) B samples; c) comparison among most crystallized
samples and phase identification.
Optical analyses performed with light microscope. In these analyses
differently from samples sintered up to 950 °C, samples sintered up to 1050 °C
indicated a foamy structure with closed pores with smooth, glassy surface. The
(b)
15 20 25 30 35 40 45 50 55 60 65 70 75
S
P
P
S
BS
BH
BF
2 / deg.
Inte
nsity / a
.u.
(c)
15 20 25 30 35 40 45 50 55 60 65 70 75
AF
Phosphates
BS
Inte
nsity / a
.u.
2 / deg.
Silicates Akermanite [87-0049]
Diopside [83-1818]
Wollastonite [72-2284]
HAp [87-0049]
Na-Ca phopshate
[74-1950]
TCP [70-2065]

94
reason for this might be the melting temperature of colemanite 950-1050 °C
and the difference in dimension with viscosity of matrices.
Figures shown below represent light microscope images of sintered
samples;
Figure 6.2.2 - Light microscope image of AF
Figure 6.2.2 represents the light microscopy image of sample AF which was
milled under 150 µm. As an effect of mentioned particle size, brown points
derived from SLG can be observed. The crack on the upside of image is
probably caused by pressing conditions.
Figure 6.2.3 - Light microscope image of AH

95
Figure 6.2.3 represents the light microscopy image of sample AH.
Differently from sample AF, AH was milled under 100 µm like the following
samples. As an effect of mentioned milling, impurities in brown color
disappeared. Due to 1 hour of holding time more porous structure were
observed. The pores are mostly shapeless and dimensions ranging between 0.3
and 0.8 mm.
Figure 6.2.4 - Light microscope image of AS
Figure 6.2.4 represents the light microscopy image of sample AS. As an
effect of slow sintering, low porosity and shapeless pores ranging between 0.1
and 0.9 mm can be observed.
Figure 6.2.5 - Light microscope image of BF

96
Figure 6.2.5 represents the light microscopy image of sample BF.
Differently from AF more porosity ranging between 0.6 and 0.1 can be
observed. The brown point on the left side of image is again trace from SLG.
Figure 6.2.6 - Light microscope image of BH
Figure 6.2.6 represents the light microscopy image of sample BH. As an
effect of one hour holding time, a porous structure like sample AH with
shapeless pores ranging between 0.1 and 0.08 mm can be observed.
Figure 6.2.7 - Light microscope image of BS

97
Figure 6.2.7 represents the light microscopy image of sample BS. Compared
to the other slow sintered sample AS, in BS more porosity (like cracks) can be
observed with dimensions ranging between 0.1 and 0.9 mm.
For the mix A samples, the density values increase with the soaking time at
950 °C (Table 2) as a result of progressive crystallization. SEM observations
(Fig. 6.2.8) point out as sample AF presents a higher porosity, in comparison
with AH and AS, characterized by a larger range of pore sizes. In addition,
while for AH and AS the pores are usually rather round, the short soaking time
adopted for AF samples did not allow to develop an amount of low viscosity
liquid phase able to create spherical pores. In all samples, during sintering
between 400-450 °C, calcite (a foaming agent) in BW turns into wollastonite,
CaSiO3, together with SiO2 carried from SLS. As a result, the decomposition of
calcite in the temperature range of 750-900 °C can not take place; CO2 release
in a more viscous phase is prevented, and this can lead up to a high porous or
foamy structure.
(a) (b)

98
(c)
Figure. 6.2.8 - SEM micrographs of a) AF, b) AH and c) AS samples.
(a) (b)
(c)
Fig. 6.2.9 - SEM micrographs of a) AF, b) AH and c) AS samples

99
For all the three thermal cycles, as reported by the XRD results, a rather
high crystallization is observed (Fig. 6.2.9). It is interesting to note as, for AF,
elongated tubular crystals of wollastonite are observed, that are very probably
responsible of the found increased mechanical properties.
For the mix B samples, the density values slowly decrease with the soaking
time at 950 °C (Table 2). While no large differences in terms of porosity,
essentially closed pores, are observed between BF and BH samples (Fig.
6.2.10a and b), the microstructure of sample BS (Fig.6.2.10c) is characterized
by a diffuse and large interconnected porosity.
(a) (b)
(c)
Figure 6.2.10 - SEM micrographs of a) BF, b) BH and c) BS samples

100
(a) (b)
(c)
Figure 6.2.11 - SEM micrographs of a) polished surface of BH, b) particular
of a) and c) particular of the inside of a pore in BS sample.
Backscattered SEM images of polished surface of BH are shown in figure
6.2.11a and b. A homogeneous distribution of wollastonite crystals was found
together with diopside crystals, mainly located inside the pores, as observed in
Fig. 6.2.11c.
The tensile strength of sintered samples was ranging between 7.88 to 18.40
MPa, mechanical properties of the studied samples values in agreement with
other studies891011
. Differently from BF, the fast sintered sample AF possessed
more crystals. Owing to these crystals, the tensile strength of AF was measured
18 MPa with a density of 1.76g/cm3, whereas BF was 7.88 MPa with a density
of 2.0476 g/cm3. AB and AH, sintered with the same holding time, were quite
similar, in their crystallization. The measured tensile strength of AH, 12.98
MPa, is lower than BH with 14.37 MPa of strength. The densities of AH and

101
BH were 1.97 g/cm3 and 2.02 g/cm
3 similar to each other. On the other hand, S
labelled (i.e. characterised by the slow sintering) samples, AS and BS,
exhibited a relatively high strength as a result of long sintering time. The
tensile strength of AS was 14.02 MPa with 2.07 g/cm3
density, while BS was
15.00 MPa with a density of 1.96 g/cm3.
Figures 6.2.12 and 6.2.17 represent 2 dimensional surface images of the
sample BH and sintered SLG. With the support of the related analyses reported
in figures 6.2.16-21, it has been seen, in BH, that pores were ranging between
10 µm to 25 µm, with an average depth of 2 µm, while in SLG they ranged
from 10 µm to 50 µm with an average depth of 2 µm, meeting the required
standards of surface structure for cell feeding.
Figure 6.2.12 - 2D surface image of the Fıgure 6.2.13 - Extracted 2D profile
sample BH sample BH

102
6.2.14 - Primary profile and roughness profile (with 80 mm filter) of the sample
BH
Figure 6.2.15 - 3D surface roughness parameters of BH with gauss filter

103
Figure 6.2.16 - 3D surface image of sample BH
Figure 6.2.17 - 2D surface image of Figure 6.2.18 Extracted 2D profile
sintered SLG of sintered SLG
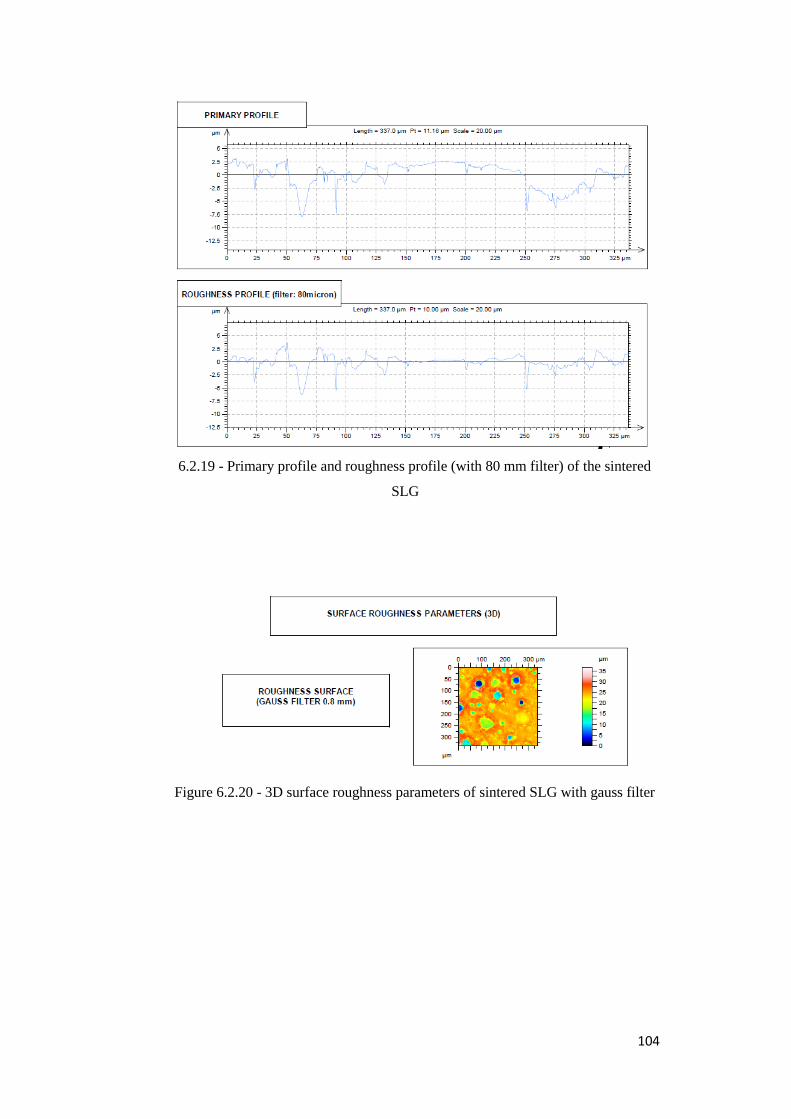
104
6.2.19 - Primary profile and roughness profile (with 80 mm filter) of the sintered
SLG
Figure 6.2.20 - 3D surface roughness parameters of sintered SLG with gauss filter

105
Figure 6.2.21 - 3D surface image of sample SLG
Cell proliferation & cell viability
In Figure 6.2.22 cell proliferation of MEF cells after 24 hours on SLG, BH and
REF materials is shown. On both tested materials significant less cells are gown,
compared to the REF. Furthermore, cell viability of MEF cells is reduced though the
SLG material and cells attached on BH surface got no vitality. While the SLG
materials caused any major cytotoxic effect, BH can be classified as a cytotoxic
material.

106
Soda BCT Reference
0
20
40
60
80
100
120
LD
H-&
mito
ch
on
dri
al a
ctivitiy
[%
]
Materials
LDH-activity
Mitochondrial activitiy
Figure 6.2.22: Results of cell proliferation analysis: LDH- and mitochondrial
activity of MEF cells cultured on SLG, BH and REF materials over 24 hours.
Analysis of the cell morphologies (Fig. 6.2.23-26) support the measurements
shown in related SEM images. MEF cells are homogenous distributed on the SLG
surface. Nevertheless, MEFs grown on the reference showed a more structured cell
membrane than the cells on SLG. Cells are well attached and got a fibroblastic
phenotype. On BH only few cells attached, the cell morphology is mostly a globular
form with no membrane structures (SEM-image Fig. 6.2.26), which indicated the
highly toxic effect of this material.

107
(a) (b)
Fig. 6.2.23: SEM-images of MEF cells grown on SLG after 24 hours, a) low
magnification, b) high magnification
(a) (b)
Figure 6.2.24 SEM-images of MEF cells grown on sample BH after 24 hours, a)
low magnification, b) high magnification

108
(a) (b)
Figure 6.2.25 SEM-images of MEF cells grown on reference sample (REF) after
24 hours, a) low magnification, b) high magnification
Figure 6.2.26 Cell morphology on sample BH

109
6.3. Wollastonite glass-ceramics from fly ash borate wastes
The samples prepared with composition B without holding time are named
FB, with 1 hour of holding time were FBH, same coding applied also for
composition B2
The sample FB95 sintered up to 950°C with a heating rate of 19°C/min in
order to observe its microstructural characteristics at a relatively lower
temperature.
In heating microscopy analyses it has seen the earliest reacting material was
SLS with a 30% change in volume between 650 and 850°C, where borate
waste began to melt around 880°C. As being a residue from power plants FA
did not give any reaction till 1250°C except 1-2% volume change. The heating
microscopy results of the raw materials and the prepared compositions are
reported in figure 6.3.1.
Figure 6.3.1 The heating microscopy results of the raw materials and the
prepared compositions

110
XRD results of all examined samples exhibited similar results which
wollastonite (PDF#43-1460) and diopside (PDF#41- 1370 were main phases.
In sample FB95 due to the low temperature sintering process, formation
between 950-1050°C causing sintering in liquid phase did not take place as in
the other samples, therefore traces of Albite (PDF#9-466)and Crystoballite
(PDF#39-1425) came forward to low intensities of the main phases.
Figure 6.3.2 shows low magnification SEM image of sample FB95, a
homogenous porosity can be seen easily. Colemanite and SLG existing in
compositions begin to melt around 920°C, the short sintering time applied to
sample FB95, sintering ended up with a liquid phase together with occurrence
of little crystals attributed to wollastanite and diopside. As an aim of the study,
in order to promote size of the crystals in a positive way and provide a glass
phase with the existed silicates, samples sintered up to 1050°C.
The low magnification images of sample FB (Figure 6.3.3) is similar to the
sample FB95,in addition pore sşze on the surface of the sample are larger than
the pore sizes of FB95. The FB2 sample (Fig. 6.3.4) with 50 wt % of SLG
exhibited higher porosity due to the gas release in its softening point and higher
amount of crystallization supported by Xrd results report in Figure 6.3.12.
Figure 6.3.2 – Low magnification SEM image of FB95

111
Figure 6.3.3 – Low magnification SEM image of FB
Figure 6.3.4 – Low magnification SEM image of FB2

112
Figure 6.3.5 High magnification SEM image of FB95
Figure 6.3.6 High magnification SEM image of FB

113
Figure 6.3.7 High magnification SEM image of FB
Figure 6.3.8 High magnification SEM image of FB2 (calcium aliminium
silicate)
In low magnification images of sample FB95 (Fig. 6.3.5) relatively small
crystals can be seen easily. In sample FB (Fig. 6.3.6) glass phase with presence
of diopside crystals (supported with EDS) and high amount of related crystals

114
(Fig. 6.3.7) expected to be wollastonite 2M exhibits an expected glass ceramic
structure.

115
Figure 6.3.9 High and low Magnification SEM image of a)FBH b)FBH2
c)FBH d)FBH2
The samples sintered with a holding time exhibits crystals merged into glass
structure with a porosity caused by primarily investigated reactions which can
be seen in figure 6.3.9.
The Xrd patterns of the sintered waste compositions, in different heating
rates are reported in figures 6.3.10 to 6.3.14.
The sintered samples exhibit very similar results. The main reason for these
results is; the similarly prepared compositions containing amounts close in
each other in order to meet the required proportion of the wollastonite glass-
ceramic ternary system. Due to the many overlapping in the patterns, manual
identification applied. The silicate phases; Wollastonite (CaSiO3 PDF#43-
1460) and Diopside (CaMgSi2O6 PDF#43-1370) are the main phases followed
by quartz (SiO2 PDF# 461045) traces. In shown figures wollastonite and
diopside phases are represented as their capital letters “W” and “D”. In some
cases both phases are appearing in the same peak.

116
Figure 6.3.10 X-ray diffraction patterns of the Sample FB95
Figure 6.3.11 X-ray diffraction patterns of the Sample FB
Figure 6.3.12 X-ray diffraction patterns of the Sample FB2

117
Figure 6.3.13 X-ray diffraction patterns of the Sample FBH
Figure 6.3.14 X-ray diffraction patterns of the Sample FBH2
The most crystalline phases can be seen in samples FB2 (figure 6.3.12 )and
FBH (figure 6.3.13 ) .
Figure 6.3.10 represents sample FB95. Due to low sintering temperature, the
peaks are lower than the samples sintered up to 1050ºC, exhibiting less
crystallization. The sample FB, (figure 6.3.11), sintered up to 1050º C
represents higher amount of crystallization with wollastonite as main peak. The
sample FBH sintered up to 1050º C with a holding time of 1 hour acts similar
to the sample FB but as a result of 1 hour of holding time. In sample FB2

118
(figure 6.3.12 ) as a result of containing high amount of SLG, in rapid
sintering, higher amount of crystallization can be observed where the sample
FBH2 (figure 6.3.14), same composition sintered up to 1050º C with a holding
time of 1 hour ended up with a lower crystallization, due to the dissolution of
the Silicates (mainly in SLG) operated by the secondary components of BW .

119
References
1 S. Piskin: Thermal properties of hydrated boron minerals, Doctoral
Dissertation, Istanbul Technical University, 1983.
2 Ö. Yildiz, The effect of heat treatment on colemanite processing: a ceramics
application Powder Technol., 142 (2004) 7-12.
3 M.S. Celik, F. Suner: A thermodynamic analysis of the decrepitation process,
Thermochim Acta, 245 (1995) 167174
4 E. Bernardo, L. Esposito, E. Rambaldi, A. Tucci and S. Hreglich, Recycle of
Waste Glass into “Glass-ceramic Stoneware, J Am Ceram Soc 91, (2008)
2156-2162.
5 W. Höland, G. Beall, Glass Ceramic Technology, The American Ceramic
Society, Westerville OH, 2002.
6 Foamed Concrete, Composition and Properties, British Cement Association,
(1994), Ref. 46.042.
7 S. Fotiadou, M.C. Limbachiya, A.N. Fried and J.J. Roberts: Proceedings of
International Conference Thomas Telford, September, (2004) 305–312.
8 T.W. Cheng, Y.S. Chen, Characterisation of glass ceramics made from
incinerator fly ash, Ceram. Int., 30 (2004) 343–349
9 E . Bernardo , M. Varrasso , F. Cadamuro , S. Hreglich, Vitrification of
wastes and preparation of chemically stable sintered glass-ceramic products,
J. Non. Cryst. Solids, 352 (2006) 4017–4023
10 T.W. Cheng, T.H. Ueng, Y.S. Chen, J.P. Chiu, Production of glass-ceramic
from incinerator fly ash, Ceram Int, 28 (2002) 779–783
11 E. Bernardo, Fast Sinter-crystallization of a glass from waste materials, J.
Non. Cryst. Solids, ,354 (2008) 3486–3490

120

121
Chapter 7
Conclusions
7.1 Micro porous glass ceramics from combination of borate,
phosphate and silicate wastes
BW and MBM ash can be combined, together withinbexpensive kaolin clay, to
produce glass ceramic articles, generally featuring anorthite and phosphate
crystals. While the resulting phosphate phase corresponds to that already
present in MBM ash, anorthite was formed by the reaction between clay
residues and Ca rich compound. BW acts as a flux, allowing the formation of
liquid phase even at the moderate temperature of 1050ºC.
In the studied mixtures, the water fraction included in the colemanite present in
BW is less useful due to the low evolution temperatures, while CO2, escaping
from the decomposition of calcite mineral fraction, constitutes a valid foaming
agent. The liquid phase provided by BW is insufficient for a massive foaming
operated by calcite decomposition, mainly for the remarkable precipitation of
anorthite crystals. Even if the anorthite crystallisation may be controlled by
adjusting the heating rate, extensive foaming is essentially associated with the
addition of SLS glass waste. The optimised formulation led to highly porous
and homogenous bodies that could be exploited for both thermal and acoustic
insulations and even embedded in lightweight concrete.

122
7.2 Dense glass-ceramics from borate and silica wastes and for
its cytotoxic characterization
Glass-ceramics were obtained for the first time from a combination of three
wastes; i) boron waste, ii) meat bone and meal ash and iii) soda lime silica
glass waste. The effects of rapid sintering, particle sizes of the selected wastes,
additive amount of the glass-ceramic forming oxides and sintering cycle were
found to be significant.
Boron within BW acts as a flux, providing a lower liquid phase forming
temperature of 950°C. The reaction between, MgO and CaO together with the
silicate phase forms mainly wollastonite and diopside phases.
The cell toxicity analyses showed the obtained materials were cytotoxic (toxic
to cells). The properties of the obtained glass-ceramics show that the obtained
material cannot be considered as waste delivered bioactive material but as in
the case of building materials it can be employed as building structural blocks
or as an additive in the cement and ceramic industries.
7.3 Wollastonite glass-ceramics from fly ash borate wastes
Wolastonite glass-ceramics from i) Boron Waste ii) Fly Ash iii) SLG was
successfully obtained through rapid sintering process.
The wollastonite glass-ceramic structure was expected, but due to the little
amount of MgO existing in the starting wastes, diopside phase was a critical
goal of the study in order to achieve a strong material . The Xrd results showed
the reactions during rapid sintering lead to wollastonite phase followed by
Diopside (MgCaSi2O6) formation.
This structure can be called “diospide reinforced wollastonite glass-ceramic”
which is a desirable structure in glass-ceramics. The crystallization process and
crystal size are controlled with adjusting heating rates and compositions.

123
The literature research and the derived results show the obtained material can
be used as an additive in ceramic, cement and brick industry.

124