GLI INDICATORI PER LO SVILUPPO SOSTENIBILE NEL ...€¦ · vita e la stabilità sociale. Questa...
82
APAT – Agenzia per la protezione dell’ambiente e per i servizi tecnici Dipartimento Stato dell’ambiente e metrologia ambientale Servizio Sviluppo sostenibile e cambiamenti climatici GLI INDICATORI PER LO SVILUPPO SOSTENIBILE NEL MEDITERRANEO ITALIA - ANNO 2007 Settembre 2007
Transcript of GLI INDICATORI PER LO SVILUPPO SOSTENIBILE NEL ...€¦ · vita e la stabilità sociale. Questa...

APAT – Agenzia per la protezione dell’ambiente e per i servizi tecnici Dipartimento Stato dell’ambiente e metrologia ambientale
Servizio Sviluppo sostenibile e cambiamenti climatici
GLI INDICATORI PER LO SVILUPPO SOSTENIBILE NEL MEDITERRANEO
ITALIA - ANNO 2007
Settembre 2007

2
Roberta Pignatelli
APAT, Dipartimento Stato dell’Ambiente e Metrologia Ambientale
Si ringraziano:
- Rocio Condor, Mario Contaldi, Natascia Di Carlo, Alessandra Galosi, Barbara Gonella,
Arianna Lepore, Patrizia Lucci, Manlio Maggi, Claudio Piccini, Silvana Salvati, Vanessa
Ubaldi, Marina Vitullo (APAT), Renzo Barberis (ARPA Piemonte), Grazia Di Bella
(ISTAT) e Claudia Croce (MATTM) per il popolamento degli indicatori;
- Mariaconcetta Giunta (APAT) per il controllo statistico dei dati;
- Rita Calicchia e Maria Alessia Alessandro (APAT) per la peer review.
Un particolare ringraziamento a Maria Dalla Costa (APAT) per aver stimolato questo lavoro e per i
consigli forniti.

3
INDICE
Introduzione. pag. 5
1. Lo sviluppo sostenibile nel Mediterraneo: il quadro istituzionale. pag. 6
2. Come misurare lo sviluppo sostenibile: gli indicatori. pag. 7
3. Gli indicatori prioritari per il follow-up della “Strategia mediterranea per pag. 9
lo sviluppo sostenibile”.
4. I dati forniti dall’Italia al Plan Bleu dell’UNEP MAP. pag. 13
Bibliografia. pag. 79
Acronimi. pag. 81

4

5
INTRODUZIONE
La regione mediterranea costituisce un ambiente naturale e culturale unico al mondo, la cui
prosperità dipende in primo luogo dalla salvaguardia e dalla valorizzazione delle sue risorse
naturali; basti pensare, per esempio, all’importanza delle attività turistiche e agricole nell’area.
I 22 Paesi e territori rivieraschi costituiscono il 6% delle superfici emerse del pianeta e ospitano il
7% della popolazione mondiale, ma il 60% della popolazione mondiale con scarsità d’acqua; essi
accolgono il 32% del turismo internazionale e producono il 13% del PIL mondiale, ma anche l’8%
delle emissioni di anidride carbonica. Circa l’80% dell’inquinamento del mar Mediterraneo
proviene da tre fonti principali: rifiuti municipali, acque reflue urbane ed emissioni industriali. Nel
Mediterraneo, inoltre, transita il 30% del traffico merci marittimo internazionale e il 20-25% del
petrolio trasportato via mare (dati UNEP 2006).
Nella regione si riscontrano molteplici tendenze che danno luogo a uno sviluppo “non sostenibile”;
tra queste vi sono la disparità tra le sponde settentrionale e meridionale, la crescente vulnerabilità ai
rischi naturali, l’invecchiamento della popolazione sulla sponda Nord, la disoccupazione nel Sud, la
lentezza imprenditoriale, le tensioni sociali e, soprattutto, il degrado ambientale.
L’insufficiente gestione delle scarse risorse naturali, soprattutto per quanto riguarda acque, territorio
agricolo, energia e zone costiere, costituisce un ostacolo per lo sviluppo economico, la qualità della
vita e la stabilità sociale. Questa tendenza, inoltre, viene aggravata dal processo di globalizzazione
attualmente in corso; tale processo dovrebbe essere accompagnato dalla promozione di modelli di
produzione e di consumo più sostenibili, dal miglioramento della cooperazione regionale e da
meccanismi più efficaci di gestione sostenibile dell’ambiente e delle risorse naturali. A tutto ciò si
aggiunge l’emergenza del cambiamento climatico, destinata a determinare un aumento della
pressione delle popolazioni africane sul Mediterraneo, già colpito da desertificazione su 30 milioni
di ettari lungo le coste.
A partire dagli anni Settanta è cresciuta la consapevolezza della necessità di proteggere e conservare
l’ambiente mediterraneo; il principio dello sviluppo sostenibile ha iniziato a ispirare anche le
politiche dei Paesi mediterranei, portando alla creazione di istituzioni, convenzioni e programmi a
livello regionale. Tra questi vi sono la “Convenzione per la protezione del mare Mediterraneo
dall’inquinamento (Convenzione di Barcellona)” e i suoi Protocolli, il Piano d’azione per il
Mediterraneo del Programma delle Nazioni Unite per l’ambiente (UNEP MAP, nato nel 1975 quale
braccio operativo della Convenzione con i relativi Centri di attività regionali), la Commissione
mediterranea per lo sviluppo sostenibile, il Programma euro-mediterraneo per l’ambiente (SMAP,
lanciato nel 1997) e l’iniziativa “Horizon 2020”, approvata dai Ministri euro-mediterranei per
l’ambiente al Cairo nel novembre 2006 e finalizzata a ridurre, entro il 2020, i livelli di
inquinamento del mar Mediterraneo.
6
1. LO SVILUPPO SOSTENIBILE NEL MEDITERRANEO: IL QUADRO ISTITUZIONALE
La Commissione mediterranea sullo sviluppo sostenibile (MCSD), istituita nel 1995, è l’organo
consultivo delle Parti contraenti della Convenzione di Barcellona ed è coordinata dall’UNEP MAP,
che ha sede ad Atene. Essa è composta da 37 membri, ventidue dei quali rappresentano le Parti
contraenti e quindici la società civile, ossia autorità locali, attori socio-economici e organizzazioni
non governative. Nel 1995 la Commissione ha approvato la “Strategia mediterranea per lo sviluppo
sostenibile” (MSSD), adottata nel 2005 al XIV meeting delle Parti contraenti della Convenzione di
Barcellona.
La Strategia mira ad adattare gli impegni internazionali alle condizioni regionali, a guidare le
strategie nazionali di sviluppo sostenibile e a promuovere un partenariato dinamico tra i Paesi a
livelli diversi di sviluppo, allo scopo di rafforzare la pace, la stabilità e la prosperità nella regione;
vengono considerate sia alcune aree prioritarie (acqua, energia, trasporti, turismo, agricoltura,
sviluppo urbano e gestione costiera), sia temi trasversali quali la gestione della conoscenza, la
capacity building, la governance, il partenariato e le strategie di finanziamento. Poiché il principio
di base è costituito dall’interdipendenza tra lo sviluppo economico, l’equità sociale e la protezione
ambientale, insieme a una migliore governance, la Strategia evidenzia la necessità di invertire le
attuali tendenze verso uno sviluppo regionale iniquo, squilibrato, standardizzato e dispendioso, per
superare i rischi e le scarse prospettive offerte dallo scenario di sviluppo tendenziale. L’importanza
dell’uso della Strategia come strumento di riferimento complessivo è stata riconosciuta anche
nell’ambito del rilancio del partenariato euro-mediterraneo e dell’iniziativa “Horizon 2020”.
Per promuovere il progresso verso la sostenibilità economica, sociale e ambientale, la Strategia
afferma che occorre contribuire allo sviluppo economico accrescendo le risorse del Mediterraneo,
riducendo le disparità sociali attraverso l’attuazione degli “Obiettivi di sviluppo del Millennio
(MDGs)” dell’ONU approvati nel 2005, e il rafforzamento delle identità culturali, modificando i
modelli insostenibili di produzione e consumo, assicurando la gestione sostenibile delle risorse
naturali e migliorando la governance ai livelli nazionale, regionale e locale. Sono state pertanto
individuate le seguenti azioni prioritarie:
- migliorare la gestione integrata della risorse idriche e della relativa domanda;
- assicurare una gestione sostenibile dell’energia, nonché la mitigazione del cambiamento
climatico e l’adattamento ad esso;
- assicurare una mobilità sostenibile attraverso un’appropriata gestione dei trasporti;
- promuovere un turismo sostenibile;
- promuovere uno sviluppo agricolo e rurale sostenibile;
- promuovere uno sviluppo urbano sostenibile;
- promuovere una gestione sostenibile del mare e delle zone costiere e intraprendere azioni
urgenti per porre fine al degrado di queste ultime.
Poiché questi impegni implicano cambiamenti profondi, il successo della Strategia dipende dalla
capacità dei governi, delle amministrazioni locali, delle imprese e degli altri attori della società
civile di promuovere una convergenza nelle loro politiche, decisioni e azioni. Ciò richiede la
mobilizzazione di risorse umane e lo sviluppo di un quadro istituzionale appropriato, ma anche il
monitoraggio della sua attuazione; i progressi dovranno necessariamente essere graduali e
differenziati, a partire da azioni a breve termine chiaramente identificate per aprire la strada a
misure di più lungo termine.

7
2. COME MISURARE LO SVILUPPO SOSTENIBILE: GLI INDICATORI
Il concetto di sviluppo sostenibile indica un tipo di sviluppo “che soddisfa le necessità del presente
senza compromettere la possibilità per le generazioni future di soddisfare le proprie” (WCED,
1987). Il benessere da perseguire viene considerato dai punti di vista economico, ambientale e
sociale, tenendo conto delle relazioni esistenti tra di essi; pertanto i tradizionali obiettivi di tipo
economico vengono integrati da obiettivi di natura sociale e ambientale, che comprendono l’equità
inter-generazionale e l’equità tra le diverse zone del mondo, ai quali si sono poi aggiunti obiettivi di
tipo istituzionale. L’idea di “sviluppo”, che implica il conseguimento di una situazione migliore
della precedente, ha caratteristiche sia qualitative che quantitative; essa va differenziata dal concetto
di crescita, che invece riguarda solo l’aumento quantitativo nelle dimensioni fisiche. Lo sviluppo
sostenibile si configura come un processo evolutivo continuo, che per la sua attuazione richiede il
coinvolgimento di tutti gli attori sociali (individui, comunità, decisori politici) nella riflessione sulle
implicazioni delle proprie scelte quotidiane.
La Conferenza delle Nazioni Unite sull’ambiente e lo sviluppo (UNCED), tenutasi a Rio de Janeiro
nel 1992, ha posto questo concetto al centro dell’agenda politica mondiale e, per renderlo operativo
per le politiche pubbliche, ha invitato tutti i Paesi e la comunità internazionale a sviluppare
indicatori di sviluppo sostenibile. Questo invito è stato raccolto, negli anni seguenti, da una
molteplicità di aziende, organizzazioni non governative, università, comunità, nazioni e
organizzazioni internazionali.
Gli indicatori sono misure quantitative che, seguite nel tempo, forniscono informazioni sulle
tendenze di un fenomeno e che hanno un significato che si estende oltre quello associato alle
proprietà delle variabili stesse; essi sono in grado di comunicare in modo semplice fenomeni
complessi e di quantificare gli elementi necessari a monitorare e a valutare un intervento.
In particolare, gli indicatori che misurano la sostenibilità consentono di monitorare l’andamento
delle diverse variabili sociali, economiche e ambientali, mostrandone le interazioni, e di effettuare
un bilancio delle azioni adottate; il loro supporto al processo decisionale è dato dalla valutazione
delle implicazioni di lungo periodo di progetti, piani e programmi, nonché dalla più generale
valutazione degli andamenti complessivi dello sviluppo rispetto a obiettivi di sostenibilità.
Nella regione mediterranea, diversi progetti relativi agli indicatori di sviluppo sostenibile sono stati
portati avanti dal Plan Bleu, il Centro di attività regionale dell’UNEP MAP focalizzato sui legami
tra ambiente e sviluppo; in queste attività, il Centro ha tenuto conto dell’esperienza maturata in vari
percorsi internazionali ed europei, quali il gruppo di esperti dell’ONU sugli indicatori di sviluppo
sostenibile, il gruppo di lavoro ONU-ECE/OCSE/Eurostat e il lavoro dell’Agenzia europea
dell’ambiente (EEA).
A partire dal 1996 il Plan Bleu ha partecipato a un network mediterraneo per promuovere questo
tipo di processo, con il supporto di numerosi partner (METAP, Unione Europea, MCSD, agenzie
ambientali e di sviluppo di diversi paesi mediterranei). In particolare, esso ha avviato il progetto
“Indicatori di sviluppo sostenibile” (SDI), che mira a sviluppare indicatori di progresso verso lo
sviluppo sostenibile dei Paesi dell’Europa, dell’Africa e dell’Asia che si affacciano sul
Mediterraneo, offrendo la grande opportunità di confrontare gli sviluppi del processo di
integrazione dell’ambiente nelle politiche di realtà nazionali profondamente diverse.
La MCSD costituisce il forum preferenziale per questo lavoro, che si avvale anche dell’esperienza
derivata dal progetto “Indicatori di Performance Ambientale” (EPI), e che può essere confermato a
livello locale, come dimostra il Programma di Gestione delle Aree Costiere (CAMP) del MAP.
Questa attività ha reso possibile arrivare alle raccomandazioni adottate a Malta, nel 1999, dalle Parti
contraenti della Convenzione di Barcellona, inclusa l’adozione di un “insieme congiunto” di 130

8
indicatori per lo sviluppo sostenibile del Mediterraneo1. Il Plan Bleu ha inoltre sviluppato indicatori
per temi specifici come le acque, il turismo, le superfici forestali e i suoli.
L’approccio generale seguito per questi progetti si basa sui seguenti principi:
- “dai problemi agli indicatori”, ossia è necessario analizzare attentamente i problemi che
devono essere misurati dagli indicatori, i quali non costituiscono quindi un fine in se stessi;
- “uno strumento preferito per il dialogo”, ossia la selezione e il calcolo di indicatori comuni
costituisce un metodo straordinario per il dialogo, costringendo a formulare analisi e a porle
in un ordine gerarchico;
- “una procedura che evolve nel tempo”, ossia il valore della selezione e del processo di
calcolo degli indicatori risiede nel loro arco temporale e nel loro costante riaggiustamento,
tenendo conto dell’evoluzione dei temi trattati e del modo in cui essi vengono percepiti.
1 L’Italia, su decisione del Ministero dell’ambiente che richiese la collaborazione dell’ANPA (Agenzia Nazionale per la
Protezione dell’Ambiente – attuale APAT) tramite la designazione di un esperto, ha partecipato all’esercizio di
popolamento degli indicatori svolto nel 2000-2001, fornendo i dati relativi a 99 indicatori, elaborati dall’Agenzia con la
collaborazione dell’ISTAT.

9
3. GLI INDICATORI PRIORITARI PER IL FOLLOW-UP DELLA “STRATEGIA MEDITERRANEA PER LO SVILUPPO SOSTENIBILE”
Le Parti contraenti della Convenzione di Barcellona hanno affidato al Plan Bleu il compito di
monitorare l’attuazione della “Strategia mediterranea per lo sviluppo sostenibile”, selezionando 34
indicatori prioritari e definendoli dal punto di vista operativo attraverso delle schede metodologiche;
tali schede sono state presentate alla MCSD nel maggio 2006. Su questa base, diversi Paesi
volontari hanno designato un esperto incaricato di raccogliere i dati necessari al popolamento degli
indicatori a livello nazionale; tra questi Paesi vi è l’Italia, su decisione del Ministero dell’ambiente e
della tutela del territorio e del mare, che ha richiesto la collaborazione dell’APAT tramite la
designazione di un proprio esperto.
Le schede redatte dal Plan Bleu sono state inviate agli esperti nazionali per aiutarli a raccogliere le
informazioni di base e a calcolare gli indicatori non disponibili nelle fonti internazionali; tali dati
verranno usati, inizialmente, per testare gli indicatori e illustrarne l’utilizzo. Contemporaneamente,
il Plan Bleu ha raccolto ed elaborato i dati delle basi di dati internazionali. Entro la fine del 2007,
tutte queste informazioni verranno utilizzate per produrre un primo rapporto basato sugli indicatori
prioritari al fine di presentare le tendenze principali dello sviluppo sostenibile nella regione
mediterranea.
La Tabella 1 descrive la struttura concettuale che definisce i 34 obiettivi prioritari e i relativi
indicatori (vedi anche Tabella 2).
Tabella 1.
1. MIGLIORARE LA GESTIONE INTEGRATA DELLE RISORSE IDRICHE E DELLA RELATIVA DOMANDA
Obiettivi Indicatori Stabilizzare la domanda d’acqua e ridurre perdite e abusi, stabilendo obiettivi di efficienza per ogni
settore d’utilizzo.
WAT_P01
Disaccoppiare la domanda idrica dalla crescita del PIL e aumentare significativamente il valore
aggiunto agricolo per metro cubo di acqua utilizzata.
WAT_P02
Proteggere le risorse idriche. WAT_P03
Raggiungere gli “Obiettivi di sviluppo del Millennio” relativi all’accesso ad acqua potabile e
fognature.
WAT_P04
WAT_P05
2. GESTIRE LA DOMANDA ENERGETICA E MITIGARE GLI EFFETTI DEL CAMBIAMENTO CLIMATICO
Obiettivi Indicatori Usare l’energia in modo razionale stabilendo obiettivi globali e settoriali. ENE_P01
Sviluppare le energie rinnovabili per giungere al 7% della domanda energetica (escluse le
biomasse) entro il 2015.
ENE_P02
Controllare, stabilizzare o ridurre le emissioni di gas serra. ENE_P03
Usare i meccanismi flessibili del Protocollo di Kyoto per lo sviluppo sostenibile dei Paesi in via di
sviluppo mediterranei.
ENE_P04
3. GESTIRE I TRASPORTI AL FINE DI ASSICURARE UNA MOBILITÀ SOSTENIBILE
Obiettivi Indicatori Disaccoppiare la domanda di trasporto motorizzato dalla crescita del PIL. TRA_P01
Stabilizzare o ridurre quando possibile la quota del trasporto stradale sul totale del traffico,
attraverso uno spostamento verso le modalità marittima e ferroviaria.
TRA_P02
Ridurre la congestione veicolare e l’inquinamento acustico nelle città, promuovendo un trasporto
pubblico poco inquinante.
TRA_P03

10
4. PROMUOVERE UN TURISMO SOSTENIBILE
Obiettivi Indicatori Diversificare l’attività turistica sviluppando offerte che accrescano la diversità mediterranea (eco-
turismo, turismo culturale, turismo urbano e rurale).
TOU_P01
Aumentare il valore aggiunto del turismo per le comunità locali nei Paesi in via di sviluppo. TOU_P02
5. PROMUOVERE UN’AGRICOLTURA SOSTENIBILE E LO SVILUPPO RURALE
Obiettivi Indicatori Diversificare l’economia rurale attraverso lo sviluppo di attività non agricole. AGR_P01
Combattere la desertificazione e la perdita di terra produttiva entro il 2015, ridurre di almeno un
terzo gli attuali tassi di perdita di terre di qualità dovuta a salinizzazione, desertificazione, erosione,
abbandono, sviluppo urbano.
AGR_P02
Promuovere programmi di sviluppo rurale agricolo sostenibile, soprattutto in aree rurali marginali. AGR_P03
Accrescere il valore aggiunto dell’agricoltura, nonché l’identificazione e il marketing dei prodotti
mediterranea di qualità.
AGR_P04
6. PROMUOVERE UNO SVILUPPO URBANO SOSTENIBILE
Obiettivi Indicatori Promuovere un’economia urbana sostenibile; prevedere e prevenire la crescita urbana attesa. URB_P01
Ridurre le disparità sociali. URB_P02
Migliorare l’ambiente urbano, attraverso la riduzione della produzione di rifiuti, il
disaccoppiamento dell’aumento della produzione di rifiuti dalla crescita del PIL e la riduzione
degli inquinanti atmosferici.
URB_P03
URB_P04
7. PROMUOVERE LA GESTIONE SOSTENIBILE DEL MARE E DELLE AREE COSTIERE E BLOCCARNE IL DEGRADO
Obiettivi Indicatori Promuovere uno sviluppo equilibrato e una gestione integrata delle coste, limitare l’urbanizzazione
per prevenire l’artificializzazione delle coste, evitare un processo di urbanizzazione lineare e
continuo.
COA_P01
Eliminare, entro il 2025, l’inquinamento dovuto alle operazioni delle navi. COA_P02
Ridurre l’inquinamento da fonti terrestri. COA_P03
Arrestare o ridurre sostanzialmente la perdita di biodiversità marina e costiera entro il 2010, e
portare almeno il 10% della superficie marina e costiera sotto qualche forma di protezione.
COA_P04
8. RAFFORZARE LA SOLIDARIETÀ, L’IMPEGNO E IL FINANZIAMENTO DELLO SVILUPPO SOSTENIBILE
Obiettivi Indicatori Entro il 2015, innalzare il livello di aiuto pubblico allo sviluppo dai Paesi OCSE europei allo 0,7%
del loro PNL e rafforzare questo contributo di supporto all’attuazione della Strategia.
COO_P01
Rafforzare gli impegni reciproci, la solidarietà e la cooperazione mediterranea ed euromediterranea
per lo sviluppo sostenibile.
COO_P02
Promuovere la realizzazione di sistemi che permettano il finanziamento delle piccole e medie
imprese per attività produttive e innovative (micro-credito, incentivi, ecc.).
COO_P03
Rafforzare le prerogative e le capacità delle amministrazioni locali. COO_P04
Rafforzare la coesione territoriale e sociale e sviluppare meccanismi finanziari pubblici per aiutare
le regioni meno favorite.
COO_P05
9. RAFFORZARE IL CAPITOLE UMANO E IL COINVOLGIMENTO DEGLI ATTORI (RICERCA, ISTRUZIONE, ECC.)
Obiettivi Indicatori Assicurare a tutti l’istruzione elementare. HUM_P01
Eliminare le disparità tra ragazze e ragazzi nell’istruzione. HUM_P02
In sinergia con il settore privato, entro il 2015 aumentare le spese in ricerca e sviluppo per
avvicinarsi almeno al livello medio dei Paesi con reddito equivalente.
HUM_P03

11
In Italia sono stati popolati tutti gli indicatori, eccetto quelli relativi al tema “Cooperazione allo
sviluppo” a causa della non disponibilità dei dati necessari nei tempi a disposizione. Tale esercizio
ha richiesto il coinvolgimento di un gruppo di esperti, interni ed esterni ad APAT (vedi Tabella 2).
Tabella 2
Tema N. Codice Indicatori Esperti
WAT 1 WAT_P01 Water Efficiency Index (total and by sector) ISTAT – G. Di Bella WAT 2 WAT_P02 Water demand and compared to GDP (total and by sector) ISTAT – G. Di Bella
WAT 3 WAT_P03 Exploitation Index of renewable resources ISTAT – G. Di Bella WAT 4 WAT_P04 Share of population with access to an improved water sources
(total, urban, rural) ISTAT – G. Di Bella
WAT 5 WAT_P05 Share of population with access to an improved sanitation system (total, urban, rural) ISTAT – G. Di Bella
ENE 6 ENE_P01 Energy intensity (total and by sector) APAT - M. Contaldi
ENE 7 ENE_P02 Share of renewable energies in energy balance APAT - M. Contaldi ENE 8 ENE_P03 Greenhouse gas emissions APAT - M. Contaldi ENE 9 ENE_P04 Amount financed in the framework of the Kyoto Protocol flexibility
mechanisms by the annex 1 countries to the benefit of other Mediterranean countries MATT - C. Croce
TRA 10 TRA_P01 Motor transport intensity compared to GDP APAT - R. Pignatelli TRA 11 TRA_P02 The proportion of road transport in terms of land freight transport APAT - R. Pignatelli TRA 12 TRA_P03 Share of public surface transport (urban and inter-urban) APAT - R. Pignatelli
TOU 13 TOU_P01 Share of "non-seaside resort beds" vs total number of beds APAT - A. Galosi TOU 14 TOU_P02 International tourism receipts APAT - R. Pignatelli AGR 15 AGR_P01 Ratio of agricultural population vs rural population APAT - R. Condor AGR 16 AGR_P02 Loss of arable land APAT - M. Vitullo
AGR 17 AGR_P03 Share of public budget allocated to sustainable rural development programmes APAT - R. Condor
AGR 18 AGR_P04 Proportion of agriculture quality products and Share of the agricultural land area used by organic farming APAT - R. Condor
URB 19 URB_P01 Number of cities with over 10 000 inhabitants engaged in a process Agenda 21 type or in urban renewal programmes APAT - P. Lucci
URB 20 URB_P02 Proportion of urban population with access to a decent dwelling APAT - V. Ubaldi, A. Lepore
URB 21 URB_P03 Household waste produced per capita and number of uncontrolled landfills APAT - B. Gonella
URB 22 URB_P04 Air quality in the main Mediterranean urban areas APAT - N. Di Carlo
COA 23 COA_P01 Share of artificialised coastline ARPA Piemonte - R. Barberis
COA 24 COA_P02 Operational pollution from ships APAT - R. Pignatelli
COA 25 COA_P03 Proportion of coastal urban population connected to a sanitation network APAT - S. Salvati
COA 26 COA_P04 Surface of protected coastal and marine areas APAT - C. Piccini
COO 27 COO_P01 ODA allocated as % of OECD DAC countries donors' GNP; proportion of the ODA allocated to Mediterranean countries and proportion contributing to the strategy objectives ---
COO 28 COO_P02 EU net public financial flows to EU Mediterranean members, candidates, CARDS and MEDA countries (in absolute value and per capita) and proportion contributing to the objectives of the strategy ---
COO 29 COO_P03 Proportion of bank credit allocated to the private sector - Existence of alternative financing systems to bank credit ---
COO 30 COO_P04 Proportion of local government tax receipts as percentage of total tax revenues (government receipts)Proportion of government budget allocated to local authorities. ---
COO 31 COO_P05 Public financing mechanisms to support the least favoured regions --- HUM 32 HUM_P01 Youth literacy rate APAT - M. Maggi HUM 33 HUM_P02 Girl/Boy primary and secondary school registration ratio APAT - M. Maggi HUM 34 HUM_P03 Public and private expenses for research and development in
percentage of GDP APAT - M. Maggi

12
13
4. I DATI FORNITI DALL’ITALIA AL PLAN BLEU DELL’UNEP MAP
Vengono di seguito riportati, in lingua originale, i 34 indicatori prioritari popolati a cura di APAT e
trasmessi al Plan Bleu nella primavera nel 2007. Per ogni indicatore, i dati vengono preceduti dalla
scheda metodologica predisposta dal Plan Bleu, che ne descrive le caratteristiche principali
(obiettivo strategico, analisi, definizione, unità di misura, target, documenti di riferimento e fonti
internazionali di dati), fornendo al contempo indicazioni e precauzioni per l’utilizzo dei dati.
Si fa presente che, trattandosi di un primo tentativo di popolamento di tali indicatori, finalizzato a
fornire un input al Plan Bleu nei tempi previsti, si riscontrano diversi limiti e lacune; ciò è dovuto a
carenze riscontrabili sia dal lato dell’offerta di informazione, che è certamente suscettibile di
miglioramento, sia dal lato della domanda informativa, che deve essere meglio finalizzata per tenere
maggior conto della realtà dei dati a livello nazionale. In entrambi i casi, l’esercizio costituisce
un’utile base per apportare miglioramenti, sia ai dati che alla struttura degli indicatori.
Il lavoro effettuato va quindi inteso come una struttura di riferimento che, se opportunamente
affinata e approfondita, può consentire utili confronti all’interno del nostro Paese tra i vari anni, e
tra il nostro e gli altri Paesi mediterranei.
Il valore aggiunto di questo tipo di indicatori risiede nel fatto che la struttura concettuale è frutto di
un lavoro istituzionale di livello internazionale e di un ragionamento condiviso. La complessità
delle sfide di tipo ambientale e socio-economico che la regione mediterranea si trova ad affrontare
richiede che i diversi fenomeni vengano esaminati all’interno di una cornice che consenta di fornire
loro il giusto peso, di coglierne le interrelazioni e quindi di poterli valutare in modo corretto, nonché
di poter effettuare confronti tra le diverse realtà geografiche. Gli indicatori di sviluppo sostenibile,
se correttamente costruiti e popolati, costituiscono un ottimo strumento per la valutazione delle
politiche e misure intraprese a livello nazionale.

14
MSSD 1 - WAT_P01 Water Efficiency Index (total an by sector)
Strategic Objective: To stabilize water demand: reduction in the North and controlled increase in the South and East. To reduce losses and misuse by defining efficiency targets in all sectors. To create more added value through more efficient
use of water for irrigation, cities and industry, and to satisfy economic and social requirements at lower costs.
Rationale: Water volumes lost and “misused” in all sectors are such that they artificially increase water demand in Mediterranean countries. Thus, at the scale of Mediterranean catchment’s areas, the “feasible savings potential” has been appraised to be at 24% of current demand. Definition: This indicator measures progress in water savings through demand management, by reducing losses and waste during transport. It covers total and sectoral Efficiency (drinking water, agriculture and industry): 1) Sectoral Efficiencies. (a) Drinking Water Efficiency - This is the share of drinking water produced, distributed (in the sense of networks upstream from losses), and paid by consumers. Epot = V1/V2 (V1 = drinking water volume invoiced and paid by consumer; V2 = total drinking water volume produced and distributed). The indicator measures both the physical efficiency of drinking water distribution networks (loss rates or yield) and economic efficiency, e.g., the capacity of network managers to cover costs through consumer payments. (b) Irrigation Water Efficiency - The physical efficiency of irrigation water is the product of “network for irrigation water transport and distribution” efficiency by plot efficiency. Eirr = E1xE2 (E1: efficiency of irrigation water transport and distribution networks, upstream from agricultural plots, measured as the ratio between water volumes actually distributed to plots and the total volume of water for irrigation, upstream of networks, including losses in networks; E2: plot irrigation efficiency is defined as the sum of efficiencies (per plot) of all irrigation methods (surface irrigation, sprinkler irrigation, micro-irrigation, others), weighted by the respective proportions of all local methods and estimated as the ratio between water volumes actually consumed by plants and volumes delivered to plots). E2 = S1,n (SmXEm)/S (N: number of irrigation methods used; Sm: surfaces irrigated using method m; Em: method efficiency m; S: total local irrigated surface according different methods). (c) Industrial Water Efficiency. The volume of recycled industrial water (recycling index): Eind = V1/V2 (V1 = Recycled water volumes; V2 = Gross volume consumed for industrial processes which is equal to the volume incoming for the first-time to the industrial plant + recycled volume). 2) Total Efficiency. Total physical efficiency of water consumption is defined as the sum of used water quantity ratios per sector (demand-losses) over sector demand, weighted by the share of sectoral requirements (drinking water, irrigation and industry): E = (Epot x Dpot + Eirr x Dirr + Eind x Dind) / D. Water demand is defined as the sum of water volumes dedicated to satisfying needs (excluding “green” water and “virtual” water), including volumes lost in production, transport and consumption. This corresponds to the sum of water volumes abstracted, non-traditional water production (desalination and imports), and water reuse, minus export volumes. Unit: Percentage. Objective and/or targeted values: To achieve the 2025 physical efficiency levels recommended by the alternative scenario of the Blue Plan: (1) Drinking water in communities: restore levels of distribution losses to 15%; (2) Industry recycling generalized at 50%; (3) Irrigation: restore levels of transport losses to 10% and maintain high physical efficiency at 80%. Or to achieve national total physical efficiency objectives. Methodological Indications: When network measurement tools are available (meters, satellite imaging), the efficiency of the irrigation network (E1) can be estimated by management structures. Efficiency is network-specific. However, national average efficiency could be assessed by computing individual network averages, weighted by volumes distributed yearly. In situ measurements of actual average plot irrigation efficiency (E2) are more complex, in view of the difficulty in precisely assessing volumes consumed by plants, and in view of the high number of plots. The value of E2 will be estimated. Each country has national estimates of the average efficiency of all systems, based on pilot experiments. The value of E2 in fact highlights the distribution of irrigation per major modes of irrigation at national level. As an initial approximation, and in the absence of precise data on the actual efficiency of the modes of irrigation, the indicator may be computed on the basis of theoretical average efficiency estimated at 40% for surface irrigation, 70% for sprinkler irrigation and 90% for localised irrigation. E2 = (S1x0.40+S2x0.70+S3x0.90)/S (S1: surface irrigation and similar; S2: land irrigated by sprinkler; S3: land irrigated with the localised irrigation method; S: total country surface irrigated for all modes of irrigation). References: « L’eau des méditerranéens: situation et perspectives », Jean Margat, PNUE, PAM, Plan Bleu, 2004 ; «A Sustainable Future for the Mediterranean: The Blue Plan’s Environment & Development Outlook», Plan Bleu, 2005; http://www.veoliawater.com/services/industrial-customers/applications/re-use/ International Data Sources: FAO-Aquastat ; http://www.fao.org/ag/agl/aglw/aquastat/dbase/index.stm Precaution for use: In some cases, and due to the diversity in data sources for one country, or due to heterogeneous definitions, total water demand can be different from the sum of demand in various sectors. The economic efficiency of drinking water is dependent on invoicing modes (subscription, meters) and meter malfunction can yield biased results.

15
Code WAT_P01
Indicator Water efficiency index
Place Italy
Water efficiency
index
Drinking water
efficiency
Drinking water volume
invoiced and paid by
consumer
Total drinking water
volume produced and
distributed Units
Years
% % km3 km3
1999 61,82 5,65 9,14
Sources
Notes
Water efficiency index Italy
ISTAT (Italian Institute of Statistics), Water Surveys System 1999 (http://acqua.istat.it, in
Italian)
Data are collected from water management companies. To better measure water
management efficiency, as the object of the indicator seems to point out, the value used as
denominator is “water abstraction ” instead of “water produced and distributed ”.
Drinking water efficiency
0
10
20
30
40
50
60
70
0 500 1000 1500 2000 2500
%
Drinking water efficiency

16
MSSD 2 - WAT_P02 Water demand and compared to GDP (total and by sector)
Strategic Objective: To stabilize water demand: reduction in the North and controlled increase in the South and East. To reduce losses and misuse by setting consumption efficiency objectives for all sectors. To create additional added value through more efficient use of water for irrigation and industrial and urban needs. To decouple water demand and gross domestic product (GDP) growth and significantly increase added value from agriculture per cubic meter consumed. Rationale: The evolution of water demand is a major concern in the Mediterranean, in view of the scarcity of the resource. Demographic growth and the associated drinking water demand are naturally the main factors responsible for the changes in water consumption, particularly in high-growth urban areas, and as regards the higher irrigation requirements to cover food production. Industrial development is also a major factor. Definition: This indicator is defined by: (a) Total water demand defined as the sum of consumed water volumes (excluding «green 1» water and «virtual 2» water) to satisfy different uses, including volumes lost during production, transport and consumption. It corresponds to the sum of water samples, unconventional water production, reuse and imports, minus exports. Total (km3) and relative share (%) per sector will be specified – agriculture, industry, household water consumption (including tourism) ; (b) Water demand and demand compared to GDP, total and for agriculture and industry, by computing the ratio of agricultural and industrial water respectively over agricultural and industrial GDP. As regards agriculture, the ratio of irrigation water demand can be computed over the added value from irrigated production. Unit: km3/year for total demand and % per sector; km3 / US$ for demands compared to GDP. Objective and/or targeted values: For agriculture: reduce demand forecasts by 10% in 2015 and increase added value from production. Methodological Indications: GDP figures are aggregates of National Accounting, corresponding to the sum of added value created by resident producers (plus taxes minus subsidies). For this indicator, GDP is expressed at constant prices. Data in national currency can be converted in US$ at constant PPP. Purchasing Power Parity (PPP) are rates which allow conversion to a common currency while eliminating purchasing power differences between currencies. In other words, their application for conversion purposes eliminates inter-country disparities. This indicator can also be used to compute water demand per capita, as it measures different demands within one regional group or worldwide. Geographical scope: National level. References: « L’eau des méditerranéens : situation et perspectives », Jean Margat, PNUE, PAM, Plan Bleu, 2004 ; «A Sustainable Future for the Mediterranean: The Blue Plan’s Environment and Development Outlook », Plan Bleu, 2005. International Data Sources: FAO-Aquastat http://www.fao.org/ag/agl/aglw/aquastat/dbase/index.stm Methodological Annex:
Source : Plan Bleu, J. Margat

17
Code WAT_P02
Indicator Total water demand
Place Italy
Total water
demand
Water demand for
agriculture
Water demand
for agriculture
Water demand
for industry
Water
demand for
industry
Household
water
demand
Household
water
demand Units
Years
km3 % km3 % km3 % km3
1977-1985 41,55 55,00 22,86 29,40 12,20 15,60 6,50
1975 5,66
1987 7,33
1999 7,84
2005 7,80
Sources
Notes
Total water demand Italy
Water demand 1977-1985: Italian Ministry of Agriculture and Forests. Other data on household water
demand : ISTAT (Italian Institute of Statistics).
Water demand 1977-1985: estimated values referred to different years. Other data on household water
demand : data collected on water management companies about amount of water which fed municipal
water supply system including volumes lost during distribution (not including aqueduct losses).
Total water demand Italy
0
5
10
15
20
25
30
35
40
45
0 1 2 3 4 5 6
km
3
0
10
20
30
40
50
60
0 1 2 3 4 5 6
%
Water demand foragriculture
Water demand forindustry
Household waterdemand
18
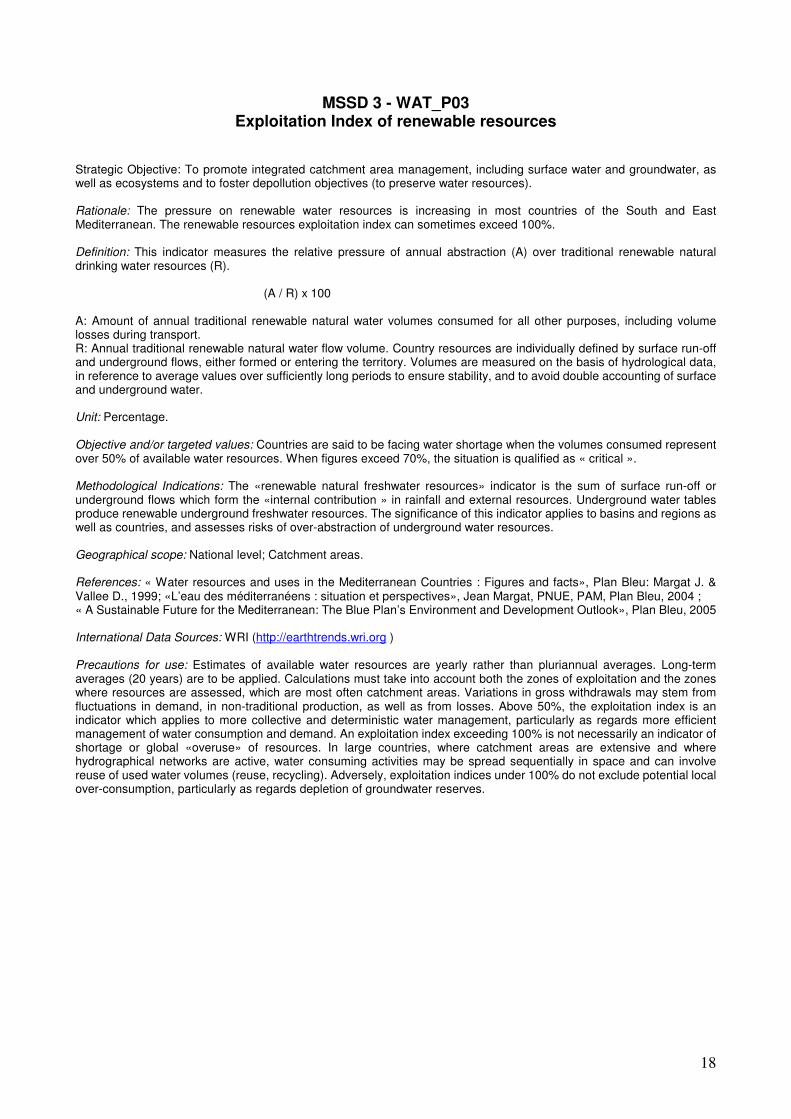
MSSD 3 - WAT_P03 Exploitation Index of renewable resources
Strategic Objective: To promote integrated catchment area management, including surface water and groundwater, as well as ecosystems and to foster depollution objectives (to preserve water resources). Rationale: The pressure on renewable water resources is increasing in most countries of the South and East Mediterranean. The renewable resources exploitation index can sometimes exceed 100%. Definition: This indicator measures the relative pressure of annual abstraction (A) over traditional renewable natural drinking water resources (R).
(A / R) x 100
A: Amount of annual traditional renewable natural water volumes consumed for all other purposes, including volume losses during transport. R: Annual traditional renewable natural water flow volume. Country resources are individually defined by surface run-off and underground flows, either formed or entering the territory. Volumes are measured on the basis of hydrological data, in reference to average values over sufficiently long periods to ensure stability, and to avoid double accounting of surface and underground water. Unit: Percentage. Objective and/or targeted values: Countries are said to be facing water shortage when the volumes consumed represent over 50% of available water resources. When figures exceed 70%, the situation is qualified as « critical ». Methodological Indications: The «renewable natural freshwater resources» indicator is the sum of surface run-off or underground flows which form the «internal contribution » in rainfall and external resources. Underground water tables produce renewable underground freshwater resources. The significance of this indicator applies to basins and regions as well as countries, and assesses risks of over-abstraction of underground water resources. Geographical scope: National level; Catchment areas. References: « Water resources and uses in the Mediterranean Countries : Figures and facts», Plan Bleu: Margat J. & Vallee D., 1999; «L’eau des méditerranéens : situation et perspectives», Jean Margat, PNUE, PAM, Plan Bleu, 2004 ; « A Sustainable Future for the Mediterranean: The Blue Plan’s Environment and Development Outlook», Plan Bleu, 2005 International Data Sources: WRI (http://earthtrends.wri.org ) Precautions for use: Estimates of available water resources are yearly rather than pluriannual averages. Long-term averages (20 years) are to be applied. Calculations must take into account both the zones of exploitation and the zones where resources are assessed, which are most often catchment areas. Variations in gross withdrawals may stem from fluctuations in demand, in non-traditional production, as well as from losses. Above 50%, the exploitation index is an indicator which applies to more collective and deterministic water management, particularly as regards more efficient management of water consumption and demand. An exploitation index exceeding 100% is not necessarily an indicator of shortage or global «overuse» of resources. In large countries, where catchment areas are extensive and where hydrographical networks are active, water consuming activities may be spread sequentially in space and can involve reuse of used water volumes (reuse, recycling). Adversely, exploitation indices under 100% do not exclude potential local over-consumption, particularly as regards depletion of groundwater reserves.

19
Code WAT_P03
Indicator Exploitation index of renewable water resources
Place Italy
Exploitation
index of
renewable water
resources
Annual
abstraction
Annual
traditional
renewable
natural water
flow volume Units
Years
% km3 km3
1998 81,01 41,98 51,82
Sources
Notes
Exploitation index of renewable water resources Italy
IRSA-CNR (1999)
Estimated values. Annual traditional renewable natural water flow volume:
estimation of water resources actually available.
Exploitation index of renewable water resources Italy
0
10
20
30
40
50
60
70
80
90
1970 1975 1980 1985 1990 1995 2000
%

20
MSSD 4 - WAT_P04 Share of population with access to an improved water sources (total, urban, rural)
Strategic Objective: To achieve Millennium Goals for development regarding access to drinking water. Rationale: According to currently available UN estimates, rates of water supply to rural populations in Mediterranean countries remain low. Approximately 30 million inhabitants of the region do not have access to an improved water sources. Definition: This indicator covers the share of populations supplied with or having reasonable access to sufficient volumes of drinking water. The volume required to satisfy metabolic, hygienic and domestic requirements is estimated at a minimum of 20 litres per day and per capita.
( E / P ) x 100
E: Population supplied with or having reasonable access to sufficient water volumes within reasonable distance; P: Total Population. This indicator may be calculated for urban and rural populations on specific dates. Unit: Percentage. Objective and/or targeted values: To reduce by half the proportion of populations deprived of regular access to drinking water by 2015. Methodological Indications: Drinking water is water free of pathogens or chemical agents at levels detrimental to health; this includes drilling water, wells and treated and non-treated surface waters which are not contaminated. Waterways and lakes must be considered as drinking water if water quality is regularly monitored and acceptable to Public Health authorities. Reasonable access signifies the existence of household water supply, or that of a source within less than 1,000 meters in distance. Geographical scope: National level. References: Millennium indicators: http://millenniumindicators.un.org ; http://www.childinfo.org International Data Sources: Millennium indicators: http://millenniumindicators.un.org ; http://www.childinfo.org Precautions for use: The distinction between « urban » and « rural » populations can not be satisfied with a single global definition, due to the differences between urban and rural area characteristics in the different countries. National definitions usually refer to the size of the locality. Rural populations represent the rest of the population not considered as urban. This indicator does not take into consideration the issues facing populations in many Mediterranean cities, submitted to frequent interruptions in water supply. National definitions of urban populations are not similar, and may lead to biased international comparisons. Methodological Annex: According to the World Health Organization, “improved” water sources involve public water conveyance networks, public drilling operations, and collected rainwater. «Non-improved» sources are: unprotected wells and sources, purchase from water distributors, bottled water (issue of water supply quantity rather than quality), water delivered in tankers. «Access » refers to a source producing at least 20 litres per capita and per day, and located at less than 1,000 meters in distance. This assumption has been tested by WHO, in its National Health Study, conducted in 70 countries (March 25, 2003 Communication, Health and Sanitary Program).

21
Code WAT_P04
Indicator Share of population with access to an improved water source
Place Italy
Share of population with access to
an improved water source
Population with access to an
improved water source Total population
Units
Years
% Inhab Inhab
1975 96,7 47.097.494 48.714.000
1987 98,2 51.666.271 52.639.447
1999 99,7 57.515.866 57.679.895
Sources
Notes
Share of population with access to an improved water source Italy
Italian Institute of Statistics (Istat) - Water Surveys System 1999 (http://acqua.istat.it, in Italian).
Census data, collected from municipalities. 1975 and 1987 data refer to resident population in Localities
(Centri e Nuclei Abitati), as defined in Italian Population Census, served by public water supply. 1999 data
refer to total resident population of municipalities served by a public water supply system. In case the
public service is not available population is served by a self-supply system (private wells).
Drinking water quality of the public supply system is monitored by local and national public authorities
who guarantee that the standards law are respected. Recently, in some cases (there are also Istat
statistics available), people do not drink tap water because they are not confident about its quality and so
they drink mineral bottled water. This is mainly due, on the one hand to few information on tap water
quality provided and to the pressing advertising activity of bottled water producing companies, and on the
other hand to the dissatisfaction on the taste, smell or hardness of the tap water.
Share of population with access to an improved water source Italy
70
75
80
85
90
95
100
105
1970 1975 1980 1985 1990 1995 2000 2005
%
Tot
22
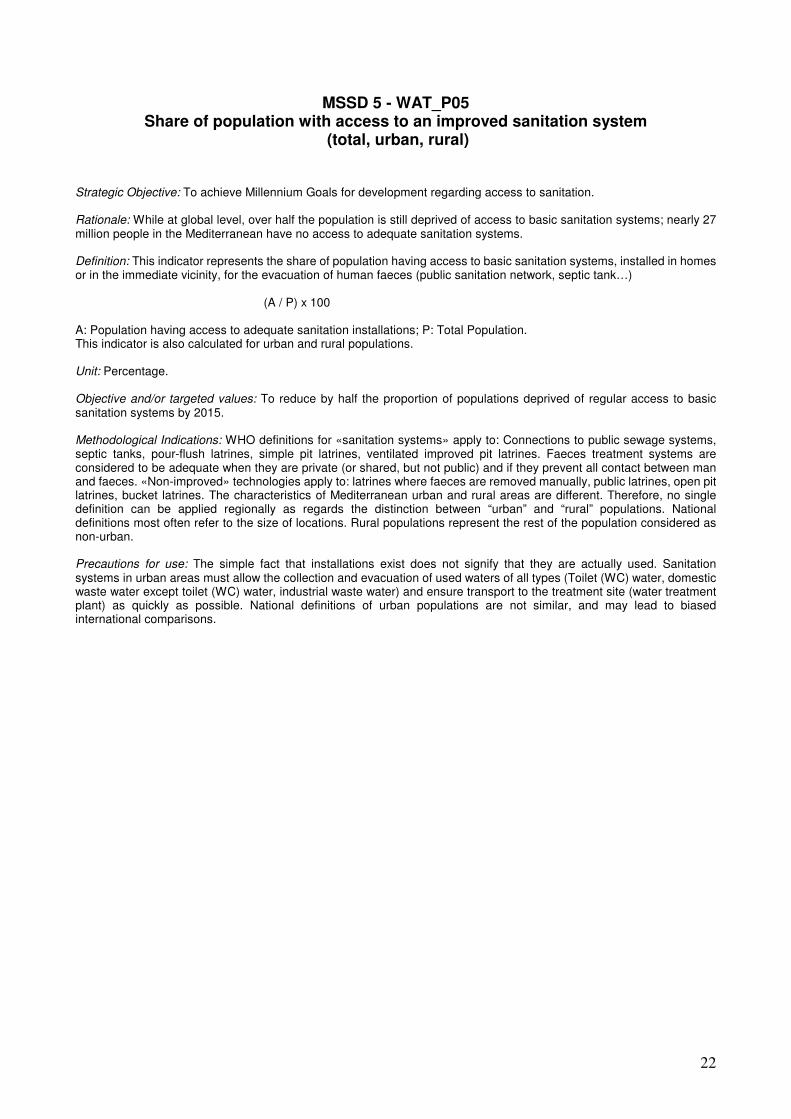
MSSD 5 - WAT_P05 Share of population with access to an improved sanitation system
(total, urban, rural)
Strategic Objective: To achieve Millennium Goals for development regarding access to sanitation. Rationale: While at global level, over half the population is still deprived of access to basic sanitation systems; nearly 27 million people in the Mediterranean have no access to adequate sanitation systems. Definition: This indicator represents the share of population having access to basic sanitation systems, installed in homes or in the immediate vicinity, for the evacuation of human faeces (public sanitation network, septic tank…)
(A / P) x 100
A: Population having access to adequate sanitation installations; P: Total Population. This indicator is also calculated for urban and rural populations. Unit: Percentage. Objective and/or targeted values: To reduce by half the proportion of populations deprived of regular access to basic sanitation systems by 2015. Methodological Indications: WHO definitions for «sanitation systems» apply to: Connections to public sewage systems, septic tanks, pour-flush latrines, simple pit latrines, ventilated improved pit latrines. Faeces treatment systems are considered to be adequate when they are private (or shared, but not public) and if they prevent all contact between man and faeces. «Non-improved» technologies apply to: latrines where faeces are removed manually, public latrines, open pit latrines, bucket latrines. The characteristics of Mediterranean urban and rural areas are different. Therefore, no single definition can be applied regionally as regards the distinction between “urban” and “rural” populations. National definitions most often refer to the size of locations. Rural populations represent the rest of the population considered as non-urban. Precautions for use: The simple fact that installations exist does not signify that they are actually used. Sanitation systems in urban areas must allow the collection and evacuation of used waters of all types (Toilet (WC) water, domestic waste water except toilet (WC) water, industrial waste water) and ensure transport to the treatment site (water treatment plant) as quickly as possible. National definitions of urban populations are not similar, and may lead to biased international comparisons.

23
Code WAT_P05
Indicator Share of population with access to an improved sanitation system
Place Italy
Share of population with
access to an improved
sanitation system
Population with access to an
improved sanitation system Total population
Units
Years
% inhab inhab
1987 94,8 49.916.256 52.639.447
1999 98,8 56.973.782 57.679.895
2005 99,4 58.415.737 58.751.711
Sources
Notes
Share of population with access to an improved sanitation system Italy
Data collected from municipalities. 1987 and 1999: census data; 2005: sample survey
data. 1987 data refer to resident population in Localities (Centri e Nuclei Abitati), as
defined in Italian Population Census, served by public sewerage system. 2005 data refer
to total resident population of municipalities served by a public sewerage system. In
case the public service is not available, population is served by private On-Site Sewage
Facilities (septic tanks).
National Institute of Statistics (Istat) - Water Surveys System 1999 (http://acqua.istat.it, in
Italian), Surveys System 2005
(http://www.istat.it/salastampa/comunicati/non_calendario/20061129_00/, in Italian)
Share of population with access to an improved sanitation system Italy
94
95
96
97
98
99
100
1986 1988 1990 1992 1994 1996 1998 2000 2002 2004 2006
%

24
MSSD 6 - ENE_P01 Energy intensity (total and by sector)
Strategic Objective: Promote rational use of energy. Rationale: This indicator reflects the trends in overall energy use relative to GDP, indicating the general relationship of energy use to economic development. Energy is essential for economic and social development. However, energy use affects resource availability and the environment. In particular, fossil fuel use is a major cause of air pollution and climate change. In the Mediterranean, energy consumption is highly dependent on fossil energy sources and has more than doubled over 30 years. In many Mediterranean countries, pricing and tax structures are not conducive to energy savings. The objective for Mediterranean countries is to maintain identical energy supply and to reduce consumption. Considerable energy savings are identifiable in the areas of services and residential construction (energy-efficient buildings, household appliances, lighting, air conditioning…), in transport (hybrid engines, biofuels…) and in industry. Definition: This indicator is defined as the ratio of final commercial energy consumption per GDP unit per year (this indicator can also be defined as the ration of primary energy offer or electricity consumption per GDP unit). It can be disaggregated per sector: agriculture, industry, services, transport, households/residential. It can also be defined as the ratio of energy consumption by one sector or sub-sector vs production (or activity) in said sector. Unit: Tons of oil equivalent (toe) per US dollar PPP (total and per sector); toe per passenger or freight km (transport); toe per square meter used (services or households); toe per person (households). Objective and/or targeted values: There are no international conventions or agreements regulating or limiting energy consumption per GDP unit. Energy intensity improves when the ratio is lower. The Mediterranean Strategy for Sustainable Development recommends “to reduce energy consumption by 1 to 2% per year per GDP unit by 2015”. Methodological Indications: Energy consumption values are reported in kg of oil equivalent, as per the IEA conversion factors. The computed consumption is “apparent” consumption (production + imports – exports – bunkers +/- stocks). National energy consumption figures combine 4 major energy sources: solid fuels, liquid fuels, gaseous fuels, and primary electricity. GDP is a National Accounting aggregate which corresponds to the sum of added value created by resident producers (+ taxes - subsidies). For this indicator, GDP is expressed at constant prices. National currency data may be converted to US dollars at constant PPP (Purchasing Power Parity). PPP rates are used to convert prices to a common currency which eliminates the effect of purchasing power differences between national currencies. To calculate this indicator per sector, it is necessary to use added value figures per sector as well as activity figures such as km per passenger. The computation of this indicator requires statistics from national accounts, census, transport and energy. The table below lists the required data and suggests statistical classifications and units. It is based on internationally applied and recommended calculation methodologies (IAEA, 2005).
Indicators
Energy consumption
Production / activities
Unit
Observations
Total energy intensity
Total final energy consumption
GDP at constant prices in USD PPP
Toe / USD
Energy intensity in agriculture
Final energy consumption in agriculture
Added value from agriculture in USD PPP
Toe / USD
Energy intensity in industry
Final energy consumption in industrial sectors
Added value from industry in USD
Toe / USD
ISIC divisions may lead to confusion. It is strongly advised to check which sectors are included by countries.
Energy intensity in the services industry
Final energy consumption in the services sector
Added value from services in USD PPP
Toe / USD
Check that energy consumption figures differentiate services and residential/households sector.
Energy intensity in residential/households
Commercial energy consumed by households
Number of inhabitants: Population figures
Toe / USD per person or toe/m2
The no. of inhabitants may be replaced by the no. of households or by the surface per person. These statistics are however more difficult to obtain.
Energy intensity in land transport
Commercial energy consumed by transport
Passenger-km; Freight-km; Figures from transport statistics
Toe / km
This indicator could be detailed per type of vehicle or mode of transportation.
Geographical scope: National level.

25
References: United Nations (2003), “Indicators for Monitoring the Millennium Development Goals”; IAEA, UNDESA, IEA, Eurostat, EEA (2005), “Energy Indicators for Sustainable Development: Guidelines and Methodologies”. International Data Sources: United Nations: http://millenniumindicators.un.org/unsd/mi/mi_goals.asp; International Energy Agency: http://www.iea.org/ ; Eurostat : http://www.europa.eu.int/comm/eurostat/ Precautions for use: It is not sufficient to only consider the energy consumption indicator vs. GDP (total energy intensity for national economy) as the indicator of energy intensity. In fact, fluctuations in total domestic energy intensity can also be impacted by changes in the structure of the national economy, by climate (cold and hot temperatures) or geographical conditions, as well as by effective efforts to save energy (e.g., national economies based on the use of raw materials consume more energy than importer countries). Country comparisons as regards energy consumed per GDP unit can be further complicated by geographical considerations: transport costs tend to be higher in large countries where distances are longer. Climate can also have an impact: populations in cold climates consume more energy per capita for heating. This indicator is also complex to interpret as regards environmental impact, since energy options at identical levels of intensity tend to affect the environment in different ways. Thus, in view of the many factors which have an influence on energy consumption vs GDP, the global indicator must be supported by disaggregated energy intensity indicators per sector. The same drawbacks apply to all sectors, and it would be necessary to compute energy intensity per product but the data required for such computation are almost impossible to obtain. Results and international comparisons can also be impacted by the base year selected for PPP conversion. Methodological annex: Energy consumption per sector and production statistics (added value):
Energy statistics per sector Production statistics
Sectors Ex: ISIC correspondence Industry Iron and steel; Chemical Industry; Non ferrous metal; Non-metallic minerals;
Transport equipment; Machines; Extraction and quarry extraction; Food, beverages, tobacco; Pulp, paper and copy; Wood products and wood; Textiles and leather; Construction; Not classified elsewhere
Division C, D, E, F for industry as a whole
Transport Road; Rail; Air; Pipelines; National navigation Other sectors
Agriculture; Trade and utilities; Residential; Others Division A Division other than A to F
Source : OECD, IEA, Eurostat (2004) - Energy Statistics Manual
Code ENE_P01
IndicatorEnergy intensity
Place Italy
Energy
intensit
y
Total final
energy
consumptio
n
GDP
Energy
intensity
in
Industry
Final energy
consumption
in industrial
sector
Industry
GDP ( value
added)
Energy
intensity
in the
Services
Final energy
consumption
in the
services
sector
Added
value
from
services
Energy
intensit
y in
residen
tial/hou
seholds
Commercial
energy
consumed by
households
(except
transports)
Total
populati
on
Energ
y
intens
ity in
land
transp
ort
Commercial
energy
consumed by
land transport
t-km + p-
km
toe /
10^6
toe 10^6 euro,
2000
toe /
10^6
toe 10^6 euro,
2000
toe /
10^6
toe 10^6 euro,
2000
toe /
hab
toe million
hab
toe/10
^6km
toe 10^9 km
1975 156,9 101.250.000 645.209 218,7 36.990.000 169.129 21,6 8.066.723 373.724 0,408 22.533.277 55,29 36,63 18.790.000 513,0
1980 134,4 107.790.000 802.060 168,4 37.910.000 225.082 19,2 8.617.686 448.129 0,427 24.072.314 56,39 37,88 24.350.000 642,9
1985 121,9 106.310.000 871.911 136,3 31.450.000 230.674 17,4 8.910.302 511.505 0,435 24.889.698 57,20 36,86 26.910.000 730,1
1990 117,5 119.500.000 1.017.430 134,2 36.450.000 271.655 15,7 9.354.000 596.438 0,442 25.239.000 57,10 33,71 32.870.000 975,1
1995 115,9 125.600.000 1.083.771 129,8 36.900.000 284.386 16,6 10.628.000 638.545 0,448 25.697.000 57,33 33,57 36.650.000 1.091,9
2000 113,2 134.846.000 1.191.057 137,2 40.177.000 292.788 16,7 11.803.000 705.308 0,476 27.534.000 57,84 31,41 38.710.000 1.232,4
2005 119,2 146.589.000 1.229.568 141,6 41.061.000 289.941 19,0 14.067.506 742.230 0,562 32.995.494 58,75 32,78 40.790.000 1.244,5
Source: APAT (Italian Agency for Environmental Protection and Technical Services)
Notes: Data on energy intensity in land transport include an evaluation of transport demand for less than 50 kilometres, considered important in this context.
Energy intensity Italy
0
50
100
150
200
250
1975 1980 1985 1990 1995 2000 2005
toe /
10^6
euro
Total
Industry
Tertiary
Energy intensity in residential/households
0
0
0
0
0
1
1
1975 1980 1985 1990 1995 2000 2005
toe / h
ab
Energy intensity in land transport
0
5
10
15
20
25
30
35
40
1975 1980 1985 1990 1995 2000 2005
toe/1
0^6
km

26
MSSD 7 - ENE_P02 Share of renewable energies in energy balance
Strategic Objective: To enhance the potential of renewable energies. Rationale: As demonstrated in 2002 by the Johannesburg Summit on Sustainable Development, renewable energies and consumption efficiency are considered as the most promising routes to improving access to energy for the largest number, contributing to the development of less advanced countries and facing up to the major stakes of environmental impacts. Renewable energies alone guarantee the sustainability of their production resources. Furthermore, they bring an alternative solution to diversify and secure energy supply sources (wind, solar). In the Mediterranean, renewable energies hold strong potential which still largely under-tapped, both for electricity production and domestic consumption. The share of renewable energies (hydraulic, solar, geothermal, windmills) in the energy balance is only 3% in 2000 (2% for hydraulic and 1% for solar, geothermal and wind). Definition: This indicator measures the share of total domestic energy consumption in renewable energy resources (hydraulic, solar, geothermal, wind). Unit: Percentage. Objective and/or targeted values: To cover 7% of total energy demand through renewable energies by 2015 (excluding renewable fuels). Methodological Indications: Renewable energy includes both combustible and non-combustible renewables: non-combustible renewables include geothermal, solar, wind, hydro, tide and wave energy; combustible renewables consist of biomass (fuel wood, vegetal waste, ethanol) and animal products (animal materials/wastes and sulphite lyes), municipal waste and industrial waste (IAEA, 2005). Note: the indicator described herein only covers the first point of this definition. The computed consumption is « apparent » consumption: primary production + imports + exports - bunkers (+/-) stocks. Geographical scope: National level. References: IAEA, UNDESA, IEA, Eurostat, EEA (2005), “Energy Indicators for Sustainable Development: Guidelines and Methodologies”; OECD FACTBOOK 2005 – ISBN 92-64-01869-7 – OECD 2005; http://oberon.sourceoecd.org/factbookpdfs/07-02-03.pdf International Data Sources: United Nations (2005), “2002 Energy Statistics Yearbook”; IEA (2004), “Renewable Information”; World Resources Institute Precautions for use: This indicator only applies to the following renewable energies: hydraulic, solar, geothermal, wind. Combustible renewables (solid biomass and animal products, biomass gases and fluids, municipal and industrial waste) are not included. It must however be remembered that these combustible renewables may represent a large share of the Mediterranean energy supply sources: in 2000 renewable energies excluding combustible renewables account for 3% of energy supply, and the figure reaches 6.6% if combustible renewables are included. Methodological Annex: The following conversion rates are recommended for unit conversion per energy source (United Nations, Energy Statistics Yearbook): tce = ton coal equivalent; 1 tce = 0,7 toe (ton of oil equivalent); hydraulic and wind energy: yield estimated at 100%, 0.123 tce /1000 kW; geothermal energy: yield estimated at 10%, 1.228 tce/1000 kW.

27
Code ENE_P02
Indicator Proportion of renewable energies in the energy balance sheet
Place Italy
Proportion of
renewable
energies in
the energy
balance sheet
Solar energy
production
(thermal)
Geothermal
electricity
production
Wind and solar
energy
production
Hydro energy
production
(pumping
excluded from
2000 on)
Total primary
energy
consumption
Units
Years
% toe toe toe toe toe
Target
1990 3,8 2.770.920 3.016.794 151.700.000
1995 3,9 2.955.000 3.250.000 159.820.000
2000 4,6 4.046.300 48.934 3.801.114 171.600.000
2005 4,4 200.000 4.578.640 204.078 3.101.762 185.170.000 no target
2010 (*)
Source: APAT (Italian Agency for Environmental Protection)
Notes: Photovoltaic production is marginal and has been included in wind production. No data on solar thermal devices, before 2005.
Data have been computed according to the proposed UNEP methodology (similar to IEA standards). The percentage value of
renewables to total primary consumption of this indicator cannot be compared to EU target of 17% of renewables in final consumption
by 2020. (*) Italy has committed herself to a target of 22% of electricity production produced by renewables by 2010, including biomass
and waste.
Proportion of renewable energies in the energy balance sheet Italy
Proportion of renewable energies in the energy balance sheet Italy
0,0
0,5
1,0
1,5
2,0
2,5
3,0
3,5
4,0
4,5
5,0
1985 1990 1995 2000 2005 2010
%

28
MSSD 8 - ENE_P03 Greenhouse gas emissions
Strategic Objective: To control, stabilize or reduce greenhouse gas emissions. Rationale: During the 20th century, the Earth’s average surface temperature rose by around 0.6°C, and evidence is growing that most of this warming is attributable to increasing concentrations of GHGs in the atmosphere. The resulting effect is predicted to lead to more extreme weather events than in the past, with some areas experiencing increased storms and rainfall, and others suffering drought. How fast and where this change will happen is still uncertain, but the consequences may be serious, especially in developing countries, which are the least able to prepare for and deal with the effects of extreme weather conditions such as floods, landslides, droughts, etc. (IAEA, 2005). The objective of the UN Framework Convention on Climate Change, adopted in Rio de Janeiro in June 1992, is the stabilization of GHG emissions at a level preventing hazardous anthropic climate disruptions. Specific targets to reduce GHG (CO2, N2O, CH4, HFC, PFC, SF6) in developed countries have been set by the Kyoto Protocol, signed in December 1997: 38 industrialized countries must globally reduce their CO2 equivalent emissions by 5.2% over the period 2008-2012, vs 1990 levels (in the EU, reduction targets have been set at -8%). Definition: This indicator corresponds to aggregated annual national emissions of the main GHGs: carbon dioxide (CO2), nitrogen protoxide (NO2), methane (CH4) and halocarbons (HFC, PFC) and sulphur hexafluoride (SF6). Unit: Gigagrams (Gg) of CO2 equivalent per year. Objective and/or targeted values: To achieve Kyoto Protocol targets on greenhouse gas emission reduction. All countries will reduce emissions as per percentage levels set by the Protocol, over the period 2008-2012. Methodological Indications: GHG emissions are estimated using the IPCC (Intergovernmental Panel on Climate Change) methodology. N2O, CH4, HFC, PFC, SF6 emissions are expressed in CO2 equivalent, weighted by their Potential for Global Warming (GWP) coefficient at 20 years. Geographical scope: National level. References: UNEP DTIE; IAEA, UNDESA, IEA, Eurostat, EEA (2005), “Energy Indicators for Sustainable Development: Guidelines and Methodologies”; http://www.uneptie.org/energy/tools/ghgin/docs/GHG_Indicator.pdf ; http://ghg.unfccc.int/index.html International Data Sources: http://ghg.unfccc.int/index.html Methodological Annex: Global Warming Potentials
Global Warming Potential (Time Horizon) Chemical formula Lifetime (years) 20 years 100 years 500 years
CO2 CO2 Variable 1 1 1 Methane CH4 12+-3 56 21 6,5 Nitrous oxide N2O 120 280 310 170 HFC-23 CHF3 264 9.100 11.700 9.800 HFC-32 CH2F2 5,6 2.100 650 200 HFC-41 CH3F 3,7 490 150 45 HFC-43-10mee C5H2F10 17,1 3.000 1.300 400 HFC-125 C2HF5 32,6 4.600 2.800 920 HFC-134 C2H2F4 10,6 2.900 1.000 310 HFC-134a CH2FCF3 14,6 3.400 1.300 420 HFC-152a C2H4F2 1,5 460 140 42 HFC-143 C2H3F3 3,8 1.000 300 94 HFC-143a C2H3F3 48,3 5.000 3.800 1.400 HFC-227ea C3HF7 36,5 4.300 2.900 950 HFC-236fa C3H2F6 209 5.100 6.300 4.700 HFC-245ca C3H3F5 6,6 1.800 560 170 Sulphur hexafluoride SF6 3.200 16.300 23.900 34.900 Perfluoromethane CF4 50.000 4.400 6.500 10.000 Perfluoroethane C2F6 10.000 6.200 9.200 14.000 Perfluoropropane C3F8 2.600 4.800 7.000 10.100 Perfluorobutane C4F10 2.600 4.800 7.000 10.100 Perfluorocyclobutane c-C4F8 3.200 6.000 8.700 12.700 Perfluoropentane C5F12 4.100 5.100 7.500 11.000 Perlfuorohexane C6F14 3.200 5.000 7.400 10.700 Source: Climate Change 1995, The Science of Climate Change: Summary for Policymakers and Technical Summary of the Working Group I Report, pg. 26.

29
Code ENE_P03
Indicator GHG emissions
Place Italy
GHG emissionsGHG emissions
per capitaTotal population
GHG emissions
per GDP unitGDP
Units
Years
kt CO2 eq. t CO2 eq. / inhab. 106 inhab. t CO2 eq. / 10
6 € 10
6 € 2000
1970 53,66
1975 433.853 7,83 55,40 1,49 645.209
1980 483.948 8,58 56,42 1,66 802.060
1985 466.683 8,17 57,14 1,87 871.911
1990 519.656 9,00 57,73 1,96 1.017.430
1995 532.733 9,22 57,77 2,03 1.083.771
2000 554.083 9,58 57,84 2,15 1.191.057
2005 583.319 10,07 57,90 2,11 1.229.568
Source: APAT (Italian Agency for Environmental Protection and Technical Services)Notes: For years 1975-1985 only CO2 emissions from energy are available (source: IEA).
For consistency of time series they have been transformed in total GHG using 1990 data.
GHG emissions Italy
Greenhouse gas emissions Pays
0
100.000
200.000
300.000
400.000
500.000
600.000
700.000
1970 1975 1980 1985 1990 1995 2000 2005 2010
kt
eq C
O2
Greenhouse gas emissions per capita
0,0
2,0
4,0
6,0
8,0
10,0
12,0
1970 1975 1980 1985 1990 1995 2000 2005 2010
t eq C
O2 /In
hab
Greenhouse gas emissions per GDP unit
0,0
0,5
1,0
1,5
2,0
2,5
1970 1975 1980 1985 1990 1995 2000 2005 2010
t eq C
O2 / 1
0^6
euro

30
MSSD 9 - ENE_P04 Amount financed in the framework of the Kyoto Protocol flexibility mechanisms by
the annex 1 countries to the benefit of other Mediterranean countries Strategic Objective: Apply the Kyoto Protocol flexibility mechanisms to sustainable development in developing Mediterranean countries. Rationale: The MSSD recommends stronger regional cooperation and support to the implementation of the UN Framework Convention on Climate Change (UNFCCC) and of the Kyoto Protocol: - Invites Mediterranean countries to cooperate in the implementation of the UNFCCC and of the flexibility mechanisms of the Kyoto Protocol; to prepare for the period following 2012; and to undertake greenhouse gas emission reduction investments in the Mediterranean region. - Recommends the development of synergies with the Mediterranean Renewable Energy Programme (MEDREP), the Rome Euro-Mediterranean Energy Platform (REMEP) and the Euro-Mediterranean Energy Policy. Definition: Amounts financed under the Flexibility Mechanisms of the Kyoto Protocol (i) by Annex 1 countries and (ii) in developing countries (South and East Rim) and in transition countries (East Adriatic). Unit: US $ Methodological Indications: Country commitments are ambitious. Their implementation is facilitated by the Kyoto Protocol, giving countries access to “flexibility” mechanisms, in addition to policies and measures to be implemented at national level. There are three such mechanisms: (1) " Emission trading", allowing the sale or purchase of rights between industrialized countries; (2) "Joint implementation", allowing developed countries to invest in greenhouse gas emission reduction outside of their national borders, and to benefit from the emission credits thus generated; (3) “Clean development mechanism", similar to the above, but where investments are undertaken by developed countries in developing countries. At international level, in December 2001, the Conference of the Parties to the Marrakech Protocol defined the eligibility criteria to apply to initiatives, and to the joint implementation and clean development mechanisms: (i) the impact of initiatives must be “additional”, i.e. generate effective emission reductions in the related field of activity vs what the situation could have been in the absence of such an approach; (ii) host countries must first ratify the Kyoto Protocol and formally approve initiatives if they come under the national strategy for sustainable development. There are technical difficulties involved in the implementation of these mechanisms, as regards the evaluation and measurement of effective greenhouse gas emission reductions, and therefore the quantification of the expected additional impact of such projects. However, solutions are gradually being developed for these difficulties and well-defined legal frameworks are now available for investors. Geographical scope: National level. References: http://cdm.unfccc.int/ Precautions for use: Amounts financed under the Flexibility Mechanisms of the Kyoto Protocol are not necessarily limited to environmental objectives and can also apply to upgrading operations.

31
Code ENE_P04
Indicator
Place Italy
Amount financed in the framework of the Kyoto Protocol
flexibility mechanisms by the Annex 1 countries to the
benefit of other Mediterranean countries
Units
Years
US $
2005 163800,0
2006 2891120,0
2007 865000,0
2008 1099000,0
2009 1382500,0
2010 1680700,0
2011 1949500,0
2012 2003400,0
2013 2037000,0
2014 1983800,0
2015 1939700,0
Source: Italian Ministry for the Environment, Land and the Sea
Notes: The following projects have been included: two Emission Reduction Purchase Agreements between the Government of Tunisia and the World Bank as the trustees of the Italian
Carbon Fund; Tunisia Capacity Building; PROSOL project in Tunisia for the use of thermal sola heathing; Montenegro Capacity Building; Albania Capacity Building.
Amount financed in the framework of the Kyoto Protocol flexibility mechanisms by the Annex 1 countries to the benefit of other Mediterranean countries Italy
Amount financed in the framework of the Kyoto Protocol flexibility mechanisms by the Annex 1 countries to the benefit of other Mediterranean countries
Amount financed in the framework of the Kyoto Protocol flexibility mechanisms by the
Annex 1 countries to the benefit of other Mediterranean countries Italy
0
500000
1000000
1500000
2000000
2500000
3000000
3500000
2004 2006 2008 2010 2012 2014 2016
US
$

32
MSSD 10 - TRA_P01 Motor transport intensity compared to GDP
Strategic Objective: To improve the inclusion of transport policies in economic planning to establish continuous improvement as regards the decoupling of motor transport increase and GDP growth. Rationale: Passenger and freight transport demand is growing faster than the economy and population. Transport represents one third of the total energy consumption in Northern countries, and therefore significantly contributes to greenhouse gas emissions and to pollution. The costs of congestion from motor transport are steadily increasing. Transport trends in Southern countries are also a major concern: they are often aggravated by public investments, subsidies and fiscal structures more favourable to individual motor travel and road transport than to public transportation. Definition: This indicator measures the growth of motor transport (air, rail, road) vs economic growth, and is subdivided into 2 indicators: (1) Freight: transport of goods vs GDP; (2) Passengers: passenger transport vs GDP. Waterways, sea transport and pipelines are not included. Unit: Ton-kilometre / US dollars; Passenger-kilometre / US dollars. Objective and/or targeted values: Indicator decrease. Methodological Indications: Goods transport services: sum of km per year, in ton-kilometres (t-km): 1 ton-kilometre corresponds to transport of one ton over one kilometre. GDP figures are aggregates of National Accounting, corresponding to the sum of added value created by resident producers (plus taxes minus subsidies). For this indicator, GDP is expressed at constant prices. Data in national currency can be converted in US$ at constant PPP (Purchasing Power Parity). PPP rates are used to convert prices to a common currency which eliminates the effect of purchasing power differences between national currencies, i.e., their application to conversion eliminates the impact of inter-country price differentials. Geographical scope: National level. References: International Civil Aviation Organization (ICAO); International Road Federation (IRF). International Data Sources: International Civil Aviation Organization (ICAO); International Road Federation (IRF).
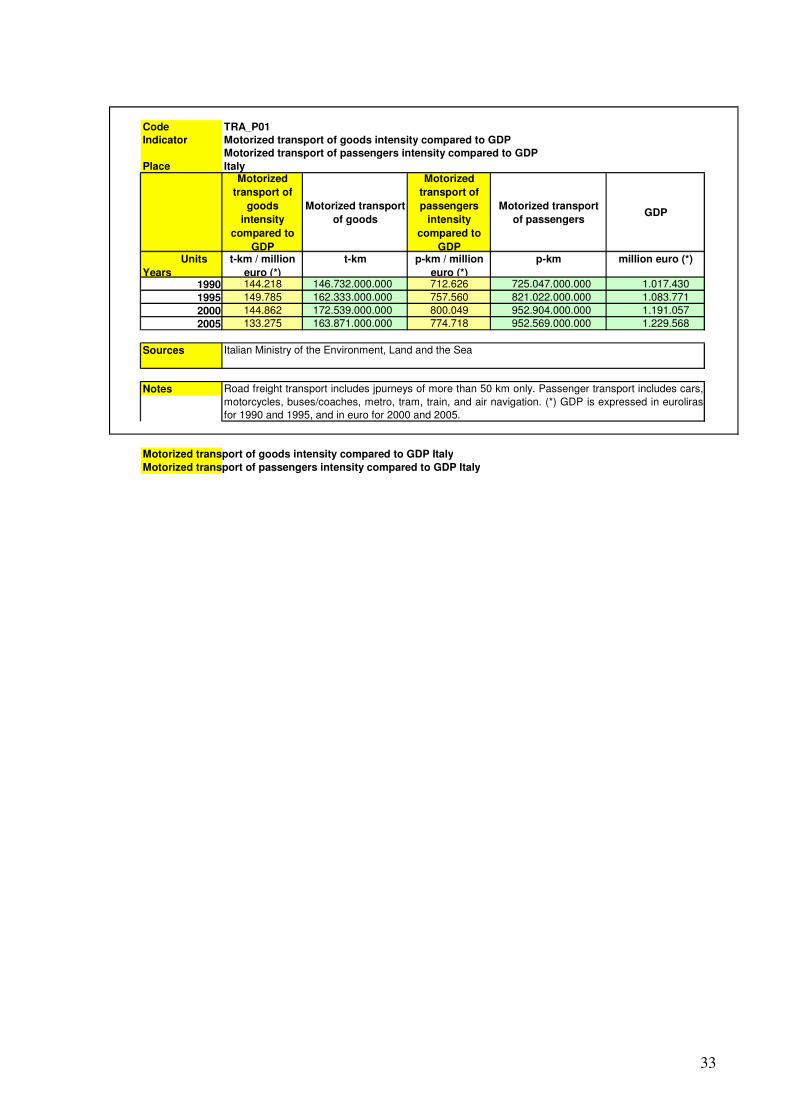
33
Code TRA_P01
Indicator Motorized transport of goods intensity compared to GDP
Motorized transport of passengers intensity compared to GDP
Place ItalyMotorized
transport of
goods
intensity
compared to
GDP
Motorized transport
of goods
Motorized
transport of
passengers
intensity
compared to
GDP
Motorized transport
of passengers GDP
Units
Years
t-km / million
euro (*)
t-km p-km / million
euro (*)
p-km million euro (*)
1990 144.218 146.732.000.000 712.626 725.047.000.000 1.017.430
1995 149.785 162.333.000.000 757.560 821.022.000.000 1.083.771
2000 144.862 172.539.000.000 800.049 952.904.000.000 1.191.057
2005 133.275 163.871.000.000 774.718 952.569.000.000 1.229.568
Sources
Notes
Motorized transport of goods intensity compared to GDP Italy
Motorized transport of passengers intensity compared to GDP Italy
Italian Ministry of the Environment, Land and the Sea
Road freight transport includes jpurneys of more than 50 km only. Passenger transport includes cars,
motorcycles, buses/coaches, metro, tram, train, and air navigation. (*) GDP is expressed in eurolirasfor 1990 and 1995, and in euro for 2000 and 2005.

34
MSSD 11 - TRA_P02 The proportion of road transport in terms of land freight transport
Strategic Objective: To stabilize and if possible to reduce the relative proportion of road transport within the global volume of traffic through a shift to sea and rail transport. To promote the integration of transport networks to enhance complementarity among road, rail and sea transport; to promote a significant shift from road to sea and rail. Rationale: The dominant position of road transport for goods has become a major issue, not only due to the resulting increase in traffic (and congestion, leading to considerable socio-economic consequences), but also to the impact on the environment and on public health. In the Mediterranean, road transport of goods represents 82% of total traffic. Consequently, actions must be undertaken to reduce the use of this mode of transport, to improve transport efficiency (loading rate) and to promote transfer from road to rail, internal and sea navigation, as well as transfers to combined modes of transport (multimodal transport). Definition: This indicator measures the share of road transport for goods vs land transport for goods (road + rail + waterways + pipelines). Unit: Percentage. Objective and/or targeted values: A suitable target could be the reduction of the share of road freight to 75% of land transport for goods by 2015. Methodological Indications: Freight traffic is measured in tons multiplied by number of travelled kilometres. Geographical scope: National level.

35
Code TRA_P02
Indicator Proportion of road transport in terms of land freight transport
Place ItalyProportion of road
transport in terms of
land freight transport
Road transport of
goods
Land transport of
goods
Units
Years
% t km t kmTarget
1990 80,100 124.209.000 190.679.000
1995 80,300 137.254.000 206.325.000
2000 80,800 146.640.000 215.029.000 50
2005 80,100 138.414.000 210.005.000 50
Source: Italian Ministry of Transport
Notes: Data are expressed in thousands of tons-kilometre, but the proportion is obviously the same. Maybe
the indicator could be better called "Volume of freight transport by road relative to volume of freight inland
transport"; it would be more interesting, indeed, to compute the volume of freight transport by road relative
to the volume of total freight transport. Freight transport by road includes journeys of more than 50 km only.
Proportion of road transport in terms of land freight transport Italy
Proportion of road transport in terms of land freight transport Italy
50
55
60
65
70
75
80
85
90
95
100
1985 1990 1995 2000 2005 2010
%

36
MSSD 12 TRA_P03: Share of public surface transport (urban and inter-urban)
Strategic Objective: Limit congestion and hazards from urban transport through the development and promotion of cleaner modes of public transportation. To reduce congestion from urban traffic and to stem pollution through the promotion of less polluting public transport at local level. Rationale: In most developed countries, governments consider public transport essential to improve the quality of daily life in urban areas, and to the development of their economy, and have developed financial aid programs to support and develop public transport. Definition: The share of public surface transport is the ratio of passenger movements in all modes of land public transport vs movements in all modes of land transport. Unit: Percentage. Objective and/or targeted values: To increase the share of public transport (less polluting). Methodological Indications: Movements are measured in passenger x km. The modes of public transport taken into account include road transport by bus, and travel by rail; sea or river transport may also be included. All modes of transport include the above-mentioned public transport plus individual road transport (private automobiles, two-wheelers…). Public transport is a mode of mobility accessible to passengers, in vehicles specifically designed to transport a large number at the same time. They are easily accessible, generally in exchange for payment of a one-way trip ticket, or of a subscription (week, month, year). Public transport is often managed by public authorities, either by public companies or by Public Industrial or Commercial Establishments. They can also be managed by private companies, under the authority of local transport organizing bodies. These bodies define service requirements and prices; they ensure total or partial financing through public funds and manage receipts and expenses. Geographical scope: National scope. Methodological Annex: Public transport modes can be classified as follows: – From a technical standpoint: (i) Guided mode: train; subway; monorail, air train; tramway, streetcars; tram-train and train-tram; funicular, cable car on rails, cable-car. (ii) Non-guided mode: autobus (urban services), coach (inter-urban services); trolleybus; taxi (public, non public transport); pleasure boat, liner, ferry; plane. (iii) Manual, on clean sites: traditional autobus in reserved lanes, or above-ground subway. – From a functional standpoint: Urban transport; Inter-urban transport; Tourist transport. – From a regulatory standpoint: (i) Public Transport Utilities: subways, tramways; autobus, some local and regional coach lines; regional trains. (ii) Competitive and commercial transport: main lines, high-speed train; Inter-urban coach lines; airlines; Cruise lines.

37
Code TRA_P03
Indicator Proportion of public surface transport (urban and interurban)
Place Italy
Proportion of
public surface
transport (urban
and interurban)
Passenger
movements in all
modes of land
public transport
Passenger
movements in all
modes of land
transport
Units
Years
% Pass km Pass kmTarget
1990 19,24 138.801 721.518
1995 17,39 141.986 816.581
2000 16,17 153.007 946.467 75
2005 17,10 161.326 943.661 75
Source: Italian Ministry of Transport
Notes: Data are expressed in millions of passengers-km; but the proportion is the same.
"Modes of land public transport" include bus (urban + interurban), metro, tram, rail, and ferries.
"Modes of land transport" include cars and motorcycles as well.
Proportion of public surface transport (urban and interurban) Italy
Proportion of public surface transport (urban and interurban) Italy
0
10
20
30
40
50
60
70
80
90
100
1985 1990 1995 2000 2005 2010
%

38
MSSD 13 - TOU_P01 Share of “non-seaside resort beds” vs total number of beds
Strategic Objective: Reduce the negative impacts of tourism in the territories and on the environment, particularly in current coastal destinations. Diversify tourism through the development of offers promoting Mediterranean diversity (ecotourism, cultural tourism, urban and rural). Rationale: In 2025, approximately 637 million tourists (foreign and domestic) are expected to visit the region, representing an increase of 270 million vs 2000, of which 50% in coastal zones. Definition: This indicator measures the share of “non-seaside resort beds” vs the total number of beds in coastal zones, for all types of tourist accommodations in the trade sector (with services). Unit: Percentage. Objective and/or targeted values: Increase the “non-seaside” offer based on national situations (deviate 1/3 of flows). Methodological Indications: Coastal tourism is defined as tourism in coastal communes or districts. Tourist accommodations mean “any establishment accommodating tourists on a regular or occasional basis». The distinction must be made between commercial establishments satisfying the largest share of the demand for accommodation and the provision of occasional accommodation services. There are two major types of tourist accommodations: 1. Group accommodation establishments: “group accommodation establishment” defines all accommodation establishments providing travellers with a room or other unit. However, the number of availabilities must be higher than the minimum determined for groups larger than families. Furthermore, the establishment must have the same commercial administration capabilities as other establishments, even in the case of non-profit establishments. 2. Private tourist accommodations: they provide a limited number of rooms to be rented or made available free-of-charge. These accommodations are not covered by the definition on group accommodation establishments and are not included in the calculation of the indicator. Geographical scope: National level; Mediterranean Coastal Zones (NUTS 3). References: WTO (World Tourism Organisation); IFEN (Institut Français de l’Environnement); AFIT (Agence Française de l’Ingénierie Touristique). International Data Sources: No international sources: the potential national sources are the National Tourism Institutes and/or Observatories and Tourism Ministries. Precautions for use: The scope of the offer may not be on a par with the number of tourists, and must include overnight stays and attendance rates (based on a homogeneous definition).

39
Code TOU_P01
Indicator Share of "non-seaside resort beds" vs total number of beds
Place ItalyShare of "non-
seaside resort beds"
vs total number of
beds
Number of seaside
beds
Total number of
tour. beds
Units
Years
% Nb NbTarget
1996 42,3 2.023.459 3.505.637 50
1997 42,3 2.045.969 3.544.363 50
1998 42,5 2.054.283 3.574.876 50
1999 42,7 2.076.432 3.623.891 50
2000 42,5 2.247.506 3.909.998 50
2001 42,4 2.319.824 4.024.330 50
2002 42,5 2.357.862 4.099.585 50
2003 42,2 2.405.224 4.158.621 50
2004 42,2 2.430.223 4.205.577 50
Source: Central Statistics Institute
Share of "non-seaside resort beds" vs total number of beds Italy
Share of "non-seaside resort beds" vs total number of beds Italy
41
42
43
44
45
46
47
48
49
50
51
1995 1996 1997 1998 1999 2000 2001 2002 2003 2004 2005
%
40
MSSD 14 - TOU_P02 International tourism receipts
Strategic Objective: Increase the added value produced for local communities and stakeholders by tourism (in developing countries). Rationale: The Mediterranean is the first tourist destination worldwide. Tourism is essentially focused on a seasonal and seaside model and is a major challenge for all countries, in terms of employment and revenue. The global share of Mediterranean revenue from international tourism has however been decreasing since 1970 and is far lower than its share of arrivals. Tourism contributes significantly to local economies in many countries, but takings are unevenly spread. The negative impacts on the environment (transport, noise, waste, use of space, deterioration of landscapes, coastal areas and ecosystems) are not taken into account by national tourism statistics. Definition: This indicator measures international tourism receipts (foreign visitors expenditures in the host country). Unit: Constant US$. Objective and/or targeted values: Increase the added value of tourism. Methodological Indications: International tourism receipts corresponds to the «Credit» line in the Balance of Payments for such items as «Travel» and «Transport». Only the «Travel» item is covered herein, including expenditure by non-resident visitors for accommodation, food, transport and acquisition of goods and services, within the limits of the reference country, and/or relative to goods and services provided by residents. This concept includes receipts produced by overnight stays and daily excursions, which may be substantial, as in the case of countries where visitors from neighbouring countries purchase significant quantities of goods and services. Geographical scope: National level; Mediterranean Coastal Zones (NUTS 3). References: WTO “Tourism Satellite Account (TSA)”; Eurostat “Community methodology on tourism statistics”; UNEP MAP, “Dossier on tourism and sustainable development in Mediterranean” – Plan Bleu, 2005, TRS 159 International Data Sources: WTO (World Tourism Organisation) Precautions for use: The increase of the international tourism receipts is not indicative of the amount of effective economic gain for host countries and local populations. This gain must be analysed within the framework of tourism impact studies on local situations, such as employment, revenue increases. It is interesting to compare the percentages of tourism receipts with GDP, and with exports of goods and services. Methodological Annex: International tourism receipts in fact corresponds to expenditure (or consumption) by tourists and non-resident visitors as defined under the Satellite Tourism Accounts in compliance with the Statistics Commission of the United Nations. Extract from the WTO website: http://www.world-tourism.org/francais/statistics/tsa_project/basic_references/index-en.htm Visitor consumption is the basic concept measuring tourism activity and refers to total consumption of or on behalf of visitors and could, consequently, also be termed as "visitor demand". In visitor consumption concepts, visitor final consumption expenditure in cash (its main component), corresponds to the term "visitor expenditure", traditionally used in the analysis of tourism. Visitor consumption exceeds visitor purchases on a trip. It encompasses these purchases as well as all expenditure on goods and services by all other institutional units on behalf of visitors. If cash or financial assets are transferred to the visitor to finance his/her trip, the purchases funded by these are included in visitor consumption. Along with this are all forms of transfers in kind and other transactions benefiting visitors where it is not cash or financial assets which is provided to the visitors but the goods and services themselves - thus the consumption of individual non-market services is included. Essentially all transactions where there is a direct link between the visitor and the producer/provider of the good or service are within scope.

41
Code TOU_P02
Indicator International tourism receipts
Place Italy
International tourism receipts
Units
Years
Thousand euros
1975 1105000
1980 3943000
1985 8239000
1990 10129000
1995 24172000
2000 29920000
2005 28453000
Source: UIC (Italian Bureau of Exchange)
International tourism receipts Italy
International tourism receipts Italy
0
5000000
10000000
15000000
20000000
25000000
30000000
35000000
1970 1975 1980 1985 1990 1995 2000 2005 2010
Thousand e
uro
s

42
MSSD 15 - AGR_P01 Ratio of agricultural population vs rural population
Strategic Objective: Diversify the rural economy through the development of non-agricultural activities. Rationale: The baseline scenario highlights the on-going diminution in the number of active agricultural populations from 3.60 million in 2000 to 2.25 million by 2010 and to 1.43 million in 2025 in EU-Med 4 countries, dropping the rate of active agricultural populations to only 1.5% in France and 2% in Italy in 2025. Extension of farmlands and abandonment of agricultural space will have significant negative consequences in terms of sustainability. The increasing geographical concentration of agriculture will be detrimental to the maintenance of the quality of Mediterranean space and landscapes. Smaller active populations will reduce collective professional solidarity and the agricultural world’s ability to withstand urban sprawl, in particular in coastal plains. In the mountain areas, the even smaller population of breeders will need to turn to invasive techniques, such as burning on a large scale (burn beating). Society will increase the use of public funds for space management (maintenance of waterways, pathways, forests, fire fighting, large fauna regulation). Definition: This indicator measures the share of agricultural population vs rural population. Unit: Percentage (%). Objective and/or targeted values: The creation of non-agricultural employment applied to diversify the rural economy will lead to a drop in the indicator. Methodological Indications: The agricultural population definition refers to all people dependent on agriculture, hunting, fishing and forestry for their livelihood (all populations active in agriculture, forestry and fishing, and their dependents). Rural area residents: In most cases, urban areas, and therefore their inhabitants, are clearly defined, while other areas are considered as rural. In practical terms, the criteria applied to the distinction between urban and rural areas vary from country to country. There are nonetheless three major groups: localities of a given size are classified as urban; administrative centres of smaller civilian divisions are classified as urban. Smaller civilian divisions are classified on the basis of specific criteria, which can include the type of local administration, the number of inhabitants or the share of the active population working in agriculture. Geographical scope: National level; Mediterranean Coastal Zones (NUTS 3). References: FAO International Data Sources: FAO: http://faostat.fao.org/ Precautions for use: A share of the agricultural population can be urban. Methodological Annex: International comparisons are further complicated by the fact that there are major differences between the criteria (populations not included in urban areas, listed as « cities » or « communes », the number of commune inhabitants, size of urban area population, population density, equipment rate, share of agricultural population among active populations) and thresholds (from 400 inhabitants in Albania to 10 000 in Italy) retained by Mediterranean countries to differentiate between rural and urban. This indicator can be completed with socio-economic indicators on rural areas (employment, businesses).

43
Code AGR_P01
Indicator Ratio of agricultural population vs rural population
Place ItalyRatio of
agricultural
population
vs rural
population
Agricultural
population
Rural
population
Units
Years
% Inhab Inhab
1991 5,3% 654.232 12.312.716
2001 4,0% 480.169 11.951.080
Sources
Ratio of agricultural population vs rural population Italy
National Institute of Agricultural Economics (INEA)
Ratio of agricultural population vs rural population Italy
0%
1%
2%
3%
4%
5%
6%
1991 2001

44
MSSD 16 - AGR_P02 Loss of arable land
Strategic Objective: To combat desertification and the loss of productive land by 2015, to reduce by at least one third the current rates of quality farmland lost to erosion, salinization, desertification, urban sprawl and other forms of land abandonment. Rationale: Estimates regarding the extent of desertification and degree of irreversibility are often contradictory and very controversial. However, the seriousness of the phenomenon is today widely recognized in the Mediterranean region. According to evaluations undertaken at the beginning of the 1990s, 80% of arid or dry areas are impacted by desertification in the South and East Mediterranean. In these areas, the impact is most severe on rangelands (84%) and on rainfed crops (74%), and irrigated land is impacted by salinization. Desertification also impacts 63% of arid or dry lands in European Mediterranean countries, in Spain, Greece, and Italy. This demonstrates that, out of the estimated 245 million hectares of arid land forecast to be impacted by desertification in the Mediterranean, over 188 million (i.e., 77%) were already considered as more or less deteriorated in 1990. Definition: This indicator measures the evolution of pressure and use on arable land surfaces: desertification, erosion, salinization, artificialization, deforestation, and abandonment of agriculture. Unit: Hectares. Objective and/or targeted values: Reduce by at least 1/3 all losses of farmland to erosion, salinization, desertification, urban sprawl or other forms of abandonment by 2015. Methodological Indications: «Arable land» is land dedicated to temporary crops (surfaces harvested twice are accounted for once only), temporary prairies to be cut or reserved for grazing, marketing and vegetable gardens (including greenhouse products) and temporary fallow land (under 5 years). Land abandoned after shifting cultivation is not taken into account (FAO definition). «Desertification» is to be understood as « the deterioration of land in arid, semi-arid and dry sub-wetland areas, due to various factors, which include climate variations and human activity. Desertification is therefore not the advance of desert as such, but rather a process of gradual loss of soil productivity and depletion of land cover mainly attributable to human activity in dry areas. Geographical scope: National level; Mediterranean Coastal Zones (NUTS 3). References: FAO; “A Sustainable Future for the Mediterranean: The Blue Plan’s Environment & Development Outlook”, Plan Bleu, 2005.

45
Code AGR_P02
Indicator Loss of arable land
Place Italy
Loss of arable land
Units
Years
ha
1975 8.232.896
1980 8.372.825
1985 8.142.292
1990 8.106.753
1995 8.283.397
2000 8.479.000
2005 8.224.188
Sources: APAT (Italian Agency for Environmental Protection and Technical Services); FAO (Food and Agriculture
Organization); ISTAT (Central Statistics Institute).
Notes: Data refer to the amount of arable land in Italy, following the FAO definition "Arable land: land under
temporary crops (double-cropped areas are counted only once), temporary meadows for mowing or pasture,
land under market and kitchen gardens and land temporarily fallow (less than five years). The abandoned land
resulting from shifting cultivation is not included in this category. Data for "Arable land" are not meant to indicate
the amount of land that is potentially cultivable".
Loss of arable land Italy
Loss of arable land Italy
0
1000000
2000000
3000000
4000000
5000000
6000000
7000000
8000000
9000000
10000000
1970 1975 1980 1985 1990 1995 2000 2005 2010
ha

46
MSSD 17 - AGR_P03 Share of public budget allocated to sustainable rural development programmes
Strategic Objective: To promote sustainable agricultural and rural development programs, particularly in marginal rural areas. Rationale: Sustainable agricultural and rural development programs are components of alternative national and regional strategies, to further the reduction of rural poverty, hinterland rehabilitation, the development of domestic and international markets, and the conservation of environmental public goods. Definition: The existence of other sustainable rural development programs in favour of underprivileged rural areas is measured by its relative share of the departmental budgets allocated for agriculture and environment. Unit: Percentage. Methodological Indications: Sustainable rural development programs for underprivileged rural areas, reconciling human development requirements and environmental protection, including biosphere reserves and natural parks (relative proportion of the budget of the departments concerned). Geographical scope: National level; Catchment areas; Mediterranean Coastal Zones (NUTS 3). References: http://www.fao.org/sd/index_en.htm
Code AGR_P03
Indicator
Place Italy
Share of public budget
allocated to sustainable
rural development
programmes
Budget of the departments
concerned by agriculture
and environment allocated
to sustainable rural
development programmes
Total budget of the
departments concerned by
agriculture and
environment
Units
Years
% Euro Euro
2000-2005 10.480.872.000
Source: National Institute of Agricultural Economics (INEA)
Share of public budget allocated to sustainable rural development programmes Italy
Share of public budget allocated to sustainable rural development programmes

47
MSSD 18 - AGR_P04 Proportion of agriculture quality products and
Share of the agricultural land area used by organic farming Strategic Objective: Increase added value from agriculture through the development, recognition and commercialisation of quality Mediterranean products. Rationale: The growth of international and domestic demand for typical and quality Mediterranean products constitutes a unique opportunity to increase the global competitiveness of Mediterranean agriculture. Definition: This indicator measures: 1. The share of quality agricultural products (identification, labels of origin, regional products, organic agriculture) in all Mediterranean countries. 2. The share of farmland dedicated to organic agriculture. Unit: Percentage. Methodological Indications: Products labelled as organic are products that are stored, processed, managed and commercialised in compliance with specific technical standards and certified as « organic » by supervisory organizations. Labels are awarded by these organizations after assessing compliance with standards. Labelling depends on the supervisory organization, but guarantees that all essential ingredients are «organic», from agricultural production to sale; organic labelling applies to the full production process, i.e., modes of production and of processing specific to organic agriculture. The “organic” label is therefore not limited to quality certification. "Organic agriculture is a holistic production management system which promotes and enhances agroecosystem health, including biodiversity, biological cycles, and soil biological activity. It emphasises the use of management practices in preference to the use of off-farm inputs, taking into account that regional conditions require locally adapted systems. This is accomplished by using, where possible, agronomic, biological, and mechanical methods, as opposed to using synthetic materials, to fulfil any specific function within the system." (FAO/WHO Codex Alimentarius Commission, 1999). Geographical scope: National level. References: http://europa.eu.int/comm/agriculture/foodqual/quali1_en.htm; FAO, Agriculture biologique : http://www.fao.org/organicag/default.htm ; IFOAM (2004), “The World of Organic Agriculture – Statistics and Emerging Trends”; http://www.soel.de/inhalte/publikationen/s/s_74.pdf International Data Sources: The World of Organic Agriculture – Statistics and Emerging Trends – 2004 http://www.soel.de/inhalte/publikationen/s/s_74.pdf Precautions for use: Organic production systems and products are not always guaranteed. This is specified on labels reading: agriculture and products not certified as organic’; this definition excludes agricultural systems which use no synthetic ingredients by default (i.e., systems which do not apply land quality maintenance systems, and which are therefore responsible for land deterioration).

48
Code AGR_P04
Indicator Organic Agriculture
Place Italy
Proportion
of
agriculture
quality
products
Production of
agriculture
quality products
Agriculture
production
Share of the
agricultural
land area used
by organic
farming
Superficiy of the
agricultural land
area used by
organic farming
Superficiy of the
agricultural land
area
Units
Years
% US $ US $ % ha ha
1990 0,1 13.000 15.895.753
1995 1,3 204.238 15.426.999
2000 6,7 1.040.377 15.569.951
2004 1,6 2.880.000.000 180.000.000.000 6,2 954.361 15.334.514
2005 6,9 1.067.102 15.383.110
Sources FIBL-IFOAM for
organic value
ISTAT for Agriculture
production value
AIAB and Biobank for
1990 to 1999, Ministry of
Agricultural Policy and
Forestry for 2000 to
2005
2000-2003: National
Institute of Statistics
(ISTAT). 2004-2005:
FAOSTAT (FAO
database).
Notes Proportion of agriculture quality products : The organic production and the agriculture production include the industrial processing value.
It is possible to have only a value for year 2004.
Share of the agricultural land area used by organic farming : a time series from 1990-2005 has been estimated;
only years requested are presented.
Superficiy of the agricultural land area used by organic farming : we have translated "superficity" as surface for this indicator. The organic
surface include surface which is organic and in conversion. Agricultural land includes: arable land, permanent crops and permanent
pastures.
Organic Agriculture Italy
Organic Agriculture Italy
0
1
2
3
4
5
6
7
8
1985 1990 1995 2000 2005 2010
%
Proportion of agriculture qualityproducts
Share of the agricultural landarea used by organic farming

49
MSSD 19 - URB_P01 Number of cities with over 10 000 inhabitants engaged in a process Agenda 21 type
or in urban renewal programmes Strategic Objective: To promote sustainable urban economy and approaches to development which take into account the growth of urban populations over the next decades. Rationale: Examples of successful urban renovation on both rims demonstrate the impact of appropriate urban management on sustainable development. However, such initiatives are still far from sufficient: less than 600 urban areas have implemented Agenda 21 type projects. Agenda 21 complies with sustainable development objectives: integration of economy, society and environment, short- and long-term perspectives, local and global approaches, and proper governance. Definition: This indicator measures the number of cities of over 10 000 inhabitants, engaged in Agenda 21 processes or in urban renewal programs. Unit: Number. Objective and/or targeted values: To invite all Mediterranean urban areas, and particularly large cities, to undertake Local Agenda 21 initiatives by 2015, to develop strategies, calendars and programs involving urban inhabitants, associations and businesses in joint urban renewal projects and in public/private partnerships. Methodological Indications: In Rio in 1992, the United Nations Conference on Environment and Development (UNCED) adopted the principles and objectives of Agenda 21. States have taken the commitment to cooperate and create, as per their specific context, the conditions required to guarantee sustainable development in the future. In some cases, countries have formalized their commitments within national programs which define the priorities and actions, in the form of official Agenda 21 publications. In parallel, local communities (regions, departments, cities, communes) may also undertake such LA21 initiatives, involving local stakeholders in territorial projects. Local Agenda 21 initiatives: local participation process in cities and rural communities to concretely implement sustainable development concepts. Geographical scope: National level; Mediterranean Coastal Zones (NUTS 3); Mediterranean Sites. References: http://www.iclei.org/ ; «A Sustainable Future for the Mediterranean: The Blue Plan’s Environment & Development Outlook», Plan Bleu, 2005 International Data Sources: http://www.iclei.org/ Precautions for use: The engagement of the cities in “Local Agenda type 21” programs do not prejudge results of these programs. Methodological Annex: Agendas 21 have been born after the 1992 Rio Earth Summit, which defined an Agenda (in Latin, ‘what has to be done’) for the 21st century on the world scale. Its chapter 28 encouraged the launching of Local Agendas 21. International organisations such as the International Union of Local Authorities (IULA), the Fédération Mondiale des Cités Unies (FMCU) and the Local Governments for Sustainability (ICLEI) have been supporting the movement by signing the Aalborg Chart for sustainability. In the Mediterranean, there is no specific survey on LA21 processes. At the global level, the ICLEI survey to local authorities and associations in 2002 shows that of 6.416 LA21 processes in 113 countries, the majority of actions takes place in Europe (the total number of LA21 in 36 European countries represent near 80% of the global results). In the Mediterranean, LA21s registered by ICLEI in 2002 were breakdown as follows: 900 processes in the 4 EU-Med countries (of which 360 in Spain and 430 and Italy), 30 in the Eastern Adriatic countries, 50 in Turkey, 15 in Mashrek and 20 in Maghreb. It is however difficult to use these data as if they were statistics, without taking into account the size and the number of municipalities in each country, the diversity of processes and the nature of projects. In certain countries, projects follow a national-level campaign; in other countries, the initiative is taken by local authorities and the State only provides support to some selected projects. Some processes relate to a global and integrated strategy which is elaborated with local actors’ participation; others are of a sectoral nature and relate to a specific town policy (housing, natural hazards, transport, energy, greenhouse effect, tourism, etc). Source: “A Sustainable Future for the Mediterranean: The Blue Plan’s Environment & Development Outlook”, Plan Bleu, 2005 from ICLEI. Second Local Agenda 21 Survey 2002.

50
Code URB_P01
Indicator
Place Italy
Number of cities with over 10000 inhabitants
engaged in a process Agenda 21 type or in
urban renewal programmes
Units
Years
Nb
2003 2,0
2004 8,0
2005 14,0
2006 24,0
Source: APAT (Italian Agency for Environmental Protection and Technical Services)
Notes: The APAT analysis addressed the 24 Italian towns with more than 150000 inhabitants.
21 towns out of 24 started their LA21 processes.
Number of cities with over 10000 inhabitants engaged in a process Agenda 21 type or in urban renewal programmes Italy
Number of cities with over 10000 inhabitants engaged in a process Agenda 21 type or in urban renewal programmes
Number of cities with over 10000 inhabitants engaged in a process Agenda
21 type or in urban renewal programmes Italy
0
5
10
15
20
25
30
2002 2007

51
MSSD 20 - URB_P02 Proportion of urban population with access to a decent dwelling
Strategic Objective: Reduce social discrepancies by reducing the proportion of squalid housing. Rationale: One of the consequences of rapid urban sprawl is the difficulty to access decent dwelling, since public housing policies have not achieved their objectives in the Mediterranean. Not only is construction below objectives and insufficient to cover requirements, but housing is also too expensive for the populations for which it was originally designed, and so-called public housing is purchased by well-to-do middle classes. Definition: This indicator measures the share of inhabitants having access to decent dwelling. Unit: Percentage. Objective and/or targeted values: To significantly reduce the proportion of squalid housing. Methodological Indications: Decent dwelling does not present obvious risks for physical security or health and equipped to comply with residential requirements. Geographical scope: National level; Mediterranean Coastal Zones (NUTS 3); Coastal Zones ; Mediterranean Sites. References: www.unhabitat.org
Code URB_P02
Indicator Proportion of urban population with access to a decent dwelling
Place ItalyProportion of urban
population with access to a
decent dwelling Units
Years
%
2001 94,5
2002 94,9
2003 94,8
Source: ISTAT (Central Statistics Institute)
Proportion of urban population with access to a decent dwelling Italy
Proportion of urban population with access to a decent dwelling Italy
0
10
20
30
40
50
60
70
80
90
100
2000 2001 2002 2003 2004
%

52
MSSD 21 - URB_P03 Household waste produced per capita and number of uncontrolled landfills
Strategic Objective: To improve the quality of urban life through the development of green areas and the reduction of environmental hazards. To reduce waste production. To decouple increased waste production and GDP growth. Rationale: Since the mid-70s, urban waste has become a priority concern for urban area management in the Mediterranean. The waste is essentially produced in the form of household waste, collected and treated by municipalities or specialized companies on their behalf. Definition: This indicator measures the production of waste per capita and the number of uncontrolled dumping sites. Unit: Tons par capita and per year; Number. Objective and/or targeted values: A suitable objective by 2015 could be the decoupling of increasing waste production and GDP growth, so as to reduce by approximately 50% the current growth rate of waste production, to double the share of recycling and to transform at least half of the uncontrolled landfills into controlled landfills. In summary, from today to 2015: (i) control household waste production per capita, to reduce waste production increase by approximately 50%; (2) eliminate 50% of uncontrolled landfills (long-term objective = 0). Methodological Indications: Waste refer here to materials that are not prime products (i.e. products produced for the market) for which the generator has no further use for own purpose of production, transformation or consumption, and which he discards, or intends or is required to discard. Wastes may be generated during the extraction of raw materials during the processing of raw materials to intermediate and final products, during the consumption of final products, and during any other human activity. Are excluded: residuals directly recycled or reused at the place of generation (i.e. establishment), and waste materials that are directly discharged into ambient water or air. Municipal waste includes household waste and similar waste. The definition also includes: bulky waste (e.g. white goods, old furniture, mattresses), and yard waste, leaves, grass clippings, street sweepings, the content of litter containers, and market cleansing waste, if managed as waste. It includes waste originating from households, commerce and trade, small businesses, office buildings and institutions (schools, hospitals, government buildings). It also includes: waste from selected municipal services, i.e. waste from park and garden maintenance, waste from street cleaning services (street sweepings, the content of litter containers, market cleansing waste), if managed as waste. «Household waste» generally includes normal and special household waste and bulky waste. Controlled landfill: Landfill whose operation is submitted to a permit system and to technical control procedures in compliance with the national legislation in force. Includes specially engineered landfill. Geographical scope: National level. References: Joint questionnaire OECD/Eurostat ; “A Sustainable Future for the Mediterranean: The Blue Plan’s Environment & Development Outlook”, Plan Bleu, 2005. Precautions for use: Definitions of household waste and controlled landfill may vary in the countries.

53
Code URB_PO3
Indicator Household waste produced per capita
Place Italy
Household waste
produced per capita
Generation of
household wastePopulation
Units
Years
t/hab t hab
1975 0,26 14.472.681 55.293.000
1980 0,30 16.993.334 56.388.000
1985 0,33 18.791.263 57.202.345
1990 0,39 22.230.754 57.103.523
1995 0,45 25.780.023 57.332.996
2000 0,50 28.958.542 57.844.017
2005 0,54 31.676.617 58.751.711
Source: APAT (Italian Agency for Environment Protection and Technical Services)
Notes: Data on generation of household waste for 1975, 1980, 1985 and 1990 are estimated.
Household waste produced per capita Italy
Household waste produced per capita Italy
0
0
0
0
0
1
1
1970 1975 1980 1985 1990 1995 2000 2005 2010
t/hab

54
MSSD 22 - URB_P04 Air quality in the main Mediterranean urban areas
Strategic Objective: To reduce pollutants impacting urban air quality, such as CO, NOx, COV, suspended particles, lead, etc…This requires the development of appropriate policies for vehicle standards, traffic management, reinforcement of public transportation networks, deviation of heavy goods vehicles circulation and use of clean fuels. Rationale: Urban air pollutants may be produced by different sources, although they mainly stem from combustion processes. Exposure to these pollutants may cause respiratory and heart disease. Definition: This indicator measures air quality in urban areas over a one-year period, though the ATMO index categories. Unit: Percentage of Index classes from 1 to 10. Objective and/or targeted values: 70% of the index values in green categories (1 to 4) during the year. Methodological Indications: The ATMO index and mode of computation are defined by national regulations for all urban areas of more then 100 000 inhabitants. This is a synthetic indicator describing urban air quality in Paris, on the basis of a score from 1 (very high) to 10 (very poor). The index is determined on the basis of pollution levels measured throughout the day by urban control stations. The index covers four air pollutants, tracers for transport, urban and industrial activities: sulphur dioxide (SO2), fine particles (PM10), nitrogen dioxide (NO2) and ozone (O3). Sub-indices are calculated for all pollutants and the lowest score is retained to assess daily general air quality. Geographical scope: Mediterranean sites. References: AIRPARIF : http://www.airparif.asso.fr/ Methodological Annex: Grid for the index computation: Averages of Maximum hourly concentration
INDEX
SO2 (µg/m
3)
PM10 (µg/m
3)
O3 (µg/m
3)
NO2 (µg/m
3)
1 Very good 1-39 0-9 0-29 0-29 2 Very good 40-79 10-19 30-54 30-54 3 Good 80-119 20-29 55-79 55-84 4 Good 120-159 30-39 80-104 85-109 5 Average 160-199 40-49 105-129 110-134 6 Bad 200-249 50-64 130-149 135-164 7 Bad 250-299 65-79 150-179 165-199 8 Very bad 300-399 80-99 180-209 200-274 9 Very bad 400-499 100-124 210-239 275-399
10 Very bad >=500 >=125 >=240 >=400 Source : Air parif

55
Source: APAT (Italian Agency for Environmental Protection and Technical Services)
URB_P04 - Annual averaged concentrations of NO2 in the considered monitoring stations
(limit value at 2010 from DM60/02: 40 mg/m3)
Urban area Station type Site type 1995 2000 2005
Torino Background Suburban 52 42Traffic Urban 86 69 67Background Urban 52 50 53Traffic Urban 117 83 73
Milano Traffic Urban 70 58 59Background Suburban 73 70 36Traffic Urban 86 67 64Traffic Urban 67 67 60Traffic Urban 85 49 52Background Urban 84 72 58Background Urban 64 57 49Traffic Urban 96 85 76Background Urban 63 58Traffic Urban 88 87 72Background Suburban 59 56 50Traffic Urban 77 62 68Background Suburban 57 43Traffic Urban 82 68 56Traffic Urban 86 75 59Traffic Urban 69 64 56
Genova Background Urban 37 38 25Traffic Urban 73 71 57Background Urban 60 51 38Traffic Urban 91 72 53Background Urban 37 34 26
Bologna Traffic Urban 41 48Background Urban 53 39 43Traffic Urban 56 66
Traffic Urban 46 55
Traffic Urban 54 54
Firenze Background Urban 49 40 40Background Urban 30Background Urban 34Traffic Urban 70 65 69Traffic Urban 82 68 74Background Urban 34 33 31Traffic Urban 74Background Urban 56 53 54Background Urban 47Background Rural 14Traffic Urban 58 50 38Background Urban 46 44 34Traffic Urban 47 43Background Suburban 33 52Background Urban 53Background Urban 40Traffic Urban 36Traffic Urban 66 47Background Rural 29Background Urban 30Traffic Urban 34
Roma Traffic Urban 75 80Background Rural 22 19Traffic Urban 56 54Traffic Urban 91 73 74Traffic Urban 91 88 68Traffic Urban 86 82Background Urban 77 61 54Traffic Urban 87 74 80Traffic Urban 94 101 87Background Rural 37 41Traffic Urban 89 87Background Urban 42 41
Napoli Background Suburban 42 51 28Traffic Urban 71 65 43Traffic Urban 50 60 48Traffic Urban 100 77 40Traffic Urban 119 133 70Traffic Suburban 63 28Traffic Suburban 65 29
Palermo Traffic Urban 52 53Background Suburban 14 21Traffic Urban 70 56Traffic Urban 77

56
Source: APAT (Italian Agency for Environmental Protection and Technical Services)
URB_P04 - Number of limit value's exceedances hours of NO2 in the considered monitoring stations
(maximum number of exceedence hours allowed at 2010, DM60/02: 18)
Urban area Station type Site type 1995 2000 2005
Torino Background Urban 4 2 2
Traffico Urban 101 27 11
Traffico Urban 549 47 60Background Suburban 1 0
Milano Traffic Urban 46 0 3
Background Suburban 10 0
Traffic Urban 35 2 0
Background Suburban 26 19 0
Traffic Urban 33 6 2
Traffic Urban 53 52 11
Background Urban 115 26 3
Background Urban 34 4 0
Traffic Urban 132 24 23
Background Urban 57 26 27
Traffic Urban 134 55 11
Background Suburban 26 15 4
Traffic Urban 74 5 23
Traffic Urban 77 26 2
Traffic Urban 61 25 0Traffic Urban 114 25 11
Genova Traffic Urban 21 7 0
Background Urban 2 3 0
Traffic Urban 50 2 0
Background Urban 0 0 0Background Urban 0 0 0
Bologna Traffic Urban 0
Background Urban 0 0 20
Traffic Urban 0 4
Traffic Urban 0Traffic Urban 0 2
Firenze Traffic Urban 0
Background Urban 0
Background Rural 0
Traffic Urban 0
Background Urban 0
Background Urban 0
Background Urban 0 1 0
Traffic Urban 3 0 2
Background Urban 27 1 0
Background Urban 0
Traffic Urban 53 8 1
Traffic Urban 42
Background Urban 0 4 3
Background Rural 0
Background Urban 0 0 0
Background Urban 2
Background Urban 1
Traffic Urban 0
Traffic Urban 0 0 0
Background Suburban 5 0Traffic Urban 1 0
Roma Traffic Urban 3 2
Background Rural 0 0
Traffic Urban 0 6
Traffic Urban 36 0 8
Traffic Urban 18 5 1
Traffic Urban 1 3
Traffic Urban 45 80 6
Background Rural 0 0
Traffic Urban 11 33
Background Urban 2 0
Background Urban 0 4Traffic Urban 9 16
Napoli Traffic Urban 786 1650 20
Traffic Urban 116 0
Traffic Suburban 308 15
Traffic Suburban 181 0
Traffic Urban 190 7 2
Background Suburban 0Traffic Urban 0
Palermo Traffic Urban 3 0
Background Suburban 0 0
Traffic Urban 13 0
Traffic Urban 3 0

57
URB_P04 - Alert threshold's exceedences days of O3 in the considered monitoring stations
(according to legislative decree 183/04)
Urban area Station type Site type 1995 2000 2005
Torino Background Urban 24 14 15
Background Suburban 37 5
Milano Background Suburban 45 45 16
Traffic Urban 36 24 18
Background Urban 13 15 0
Background Suburban 34 19 11
Bologna Background Urban 5 11 7
Genova Background Urban 11 1 0
Background Urban 33 23 0
Background Urban 31 14 0
Firenze Background Urban 13 0
Background Urban 1 0
Background Urban 12 0 5
Background Urban 8 0 0
Background Rural 28 3 9
Background Urban 0 0 5
Background Urban 12 1
Background Urban 1
Background Suburban 2 1
Roma Background Rural 12 0
Background Rural 37 2
Background Urban 15 11
Background Urban 9 5
Napoli Traffic Suburban 6 5
Traffic Suburban 1 1
Background Suburban 0 5
Palermo Background Suburban 23 10
Traffic Urban 0 0
Source: APAT (Italian Agency for Environmental Protection and Technical Services)

58
URB_P04 - Annual averaged concent rat ion of PM10 in t he considered m onit or ing st at ions
(lim it value at 2005, DM 60/02: 40 m g/m 3)
Urban area St at ion t ype 1995 2000 2005
Tor ino Traf f ic 71 65
Milano Traf f ic 46
Background 33
Traf f ic 37
Traf f ic 35
Background 44 45
Background 39 41
Background 41 47
Background 43
Traf f ic 43
Traf f ic 41 37
Genova Traf f ic 63
Background 34 19
Bo logna Traf f ic 64 42
Firenze Background 29
Background 29
Traf f ic 57 26 31
Traf f ic 40
Background 49 23 31
Traf f ic 35
Background 38
Traf f ic 38 32 28
Background 42 38 41
Background 33 31
Traf f ic 29
Background 40
Traf f ic 38
Rom a Traf f ic 54 42
Traf f ic 61
Traf f ic 42 48
Background 31 29
Nap o li Background 22
Traf f ic 70
Traf f ic 23
Traf f ic 25 27
Traf f ic 62 31
Traf f ic 33
Palerm o Traf f ic 34 35
Background 25 22
Traf f ic 48 34
Traf f ic 43
Traf f ic 46 40
Traf f ic 36 28
Traf f ic 42 28
Traf f ic 43 37
Source: APAT (It alian Agency f o r Environm ent al Pro t ect ion and Techn ical Services)

59
URB_P04 - PM10: Number of limit value's exceedances days in the considered monitoring stations
(max. number of exceedence days allowed at 2005, DM60/02: 35)
Urban area Station type Site type 1995 2000 2005
Torino Traffic Urban 214 199
Milano Traffic Urban 124
Background Suburban 93 133
Traffic Urban 95 72
Traffic Urban 127 70
Background Urban 100 127
Background Urban 80 99
Background Urban 93 133
Background Urban 93
Traffic Urban 115
Traffic Urban 84 72
Genova Traffic Urban 36
Background Urban 7 0
Bologna Traffic Urban 164 100
Firenze Background Urban 1 28
Background Urban 18
Traffic Urban 92 3 31
Traffic Urban 78
Background Urban 148 2 39
Traffic Urban 53
Background Urban 55
Traffic Urban 97 54 6
Background Urban 44 21 72
Background Urban 61 50
Traffic Urban 29
Background Rural 77
Traffic Urban 74
Roma Traffic Urban 73 92
Traffic Urban 221
Traffic Urban 125 127
Background Urban 28 21
Napoli Background Suburban 13
Traffic Urban
Traffic Urban
Traffic Urban 23
Traffic Urban 38
Traffic Suburban 32
Palermo Traffic Urban 43 48
Background Suburban 18 10
Traffic Urban 116 37
Traffic Urban 80
Traffic Urban 106 65
Traffic Urban 41 13
Traffic Suburban 75 9
Traffic Urban 81 54
Source: APAT (Italian Agency for Environmental Protection and Technical Services)

60
URB_P04 - SO2: Number of limit value's exceedences days in the considered monitoring stations
(maximum number of exceedence days allowed at 2005, DM60/02: 3)
Urban area Station type Site type 1995 2000 2005
Torino Traffic Urban 0 0 0
Traffic Urban 0 0 0
Milano Traffic Urban 0 0 0
Traffic Urban 0 0 0
Background Urban 0 0 0
Background Urban 0 0 0
Genova Background Urban 0 0 0
Background Urban 0 0 0
Firenze Background Rural 0
Background Urban 0
Traffic Urban 0 0 0
Background Urban 0 0 0
Background Urban 0 0 0
Traffic Urban 0 0 0
Background Urban 0 0 0
Background Urban 0 0 0
Roma Traffic Urban 0 0 0
Traffic Urban 0
Background Urban 0
Napoli Traffic Suburban 0
Background Suburban 0
Source: APAT (Italian Agency for Environmental Protection and Technical Services)

61
MSSD 23 - COA_P01 Share of artificialised coastline
Strategic Objective: Promote balanced development and integrated coastal management, and to ensure free access to coastal areas for all populations. To preserve, enhance or restore coastal heritage quality; to control linear and on-going coastal urban sprawl, and prevent coastal artificialization. Reduce vulnerability of sensitive areas. Rationale: Based on the assumption (trend scenario) that 200 additional km are artificialised on average per year, 50% of Mediterranean coastal areas could be irreversibly artificialised by 2025. In some countries, large coastal conurbations or widespread urban sprawl could spread over tens, if not hundreds of kilometres. There are many consequences to linear coastal area artificialization: pollution, traffic congestion, deterioration of coastal landscapes and ecosystems, increased coastal erosion, etc. Definition: This indicator is defined by the artificialised surface of coastal strips vs total coastal strip surface. (It is advised to compute the indicator for a coastal strip of 1km and 10 km deep). Unit: Percentage. Objective and/or targeted values: To preserve "Le tiers sauvage" = no more than 2/3 of the coastal area artificialised. Methodological Indications: Linear coastal segments are said to be “artificialised” when all or part of the 100 meter area on both sides are or have recently been subjected to transformation by Man, modifying their original physical state (housing, embankments equipment). The term « coastal segment » is used as it is highly dependent on the chosen calculation methodology and size may vary with techniques. The definition requires a resolution lesser than 100 meters, and artificialization observation methods are based on aerial photography or highly precise mappings. Geographical scope: National level; Mediterranean Coastal Zones (NUTS 3); Coastal Zones. References: «A Sustainable Future for the Mediterranean: The Blue Plan’s Environment & Development Outlook», Plan Bleu, 2005; http://www.languedoc-roussillon.ecologie.gouv.fr/publication/litto/artifici.htm International Data Sources: http://dataservice.eea.eu.int

62
Code COA_P01
Indicator Share of artificialised coastline
Place Italy
Share of artificialised
coastline (0–1km strip)
Artificialised area in
the coastal strip
(0–1km strip)
Area of the coastal
strip (0-1 km strip)
Units
Years
% km2 km2
1975 92,3 1.200 1.300
1990 93,8 1.500 1.600
2000 94,4 1.700 1.800
Source: ARPA (Regional Agency for Environmental Protection) Piemonte
Notes: Data source is the Lacoast Project, I&CLC 2000.
Share of artificialised coastline Italy
Share of artificialised coastline Italy
0
10
20
30
40
50
60
70
80
90
100
1970 1975 1980 1985 1990 1995 2000 2005
% 0-1 km
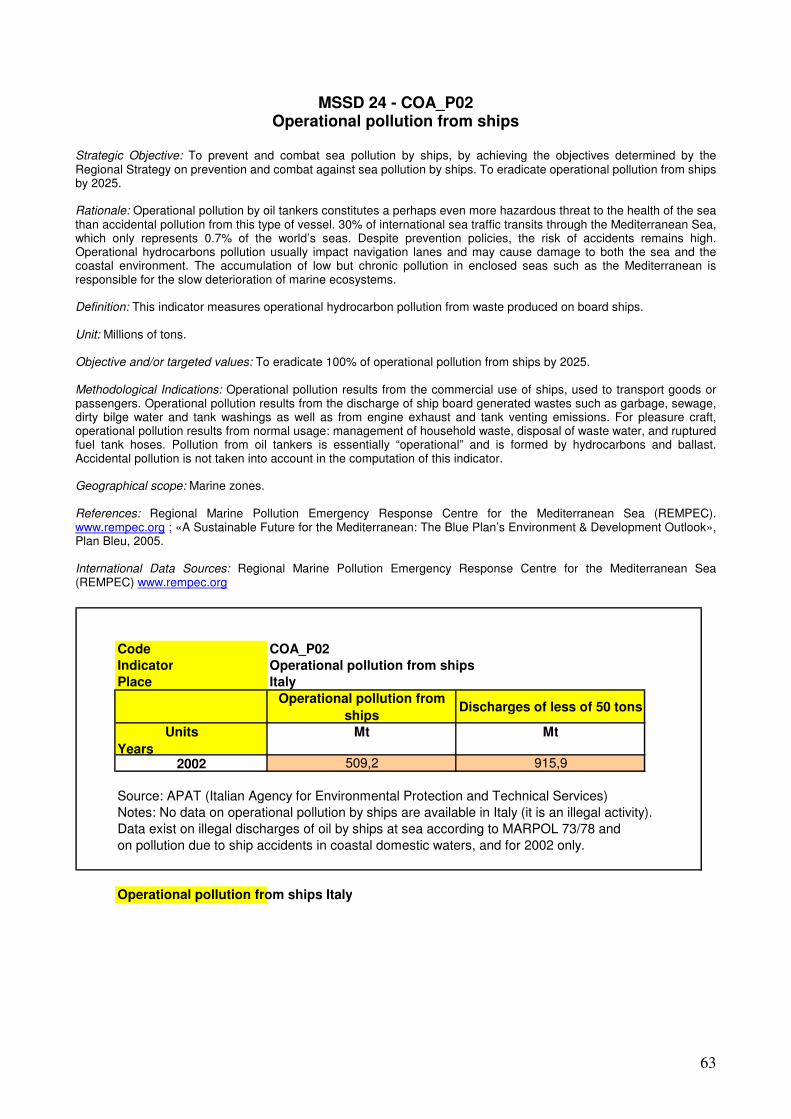
63
MSSD 24 - COA_P02 Operational pollution from ships
Strategic Objective: To prevent and combat sea pollution by ships, by achieving the objectives determined by the Regional Strategy on prevention and combat against sea pollution by ships. To eradicate operational pollution from ships by 2025. Rationale: Operational pollution by oil tankers constitutes a perhaps even more hazardous threat to the health of the sea than accidental pollution from this type of vessel. 30% of international sea traffic transits through the Mediterranean Sea, which only represents 0.7% of the world’s seas. Despite prevention policies, the risk of accidents remains high. Operational hydrocarbons pollution usually impact navigation lanes and may cause damage to both the sea and the coastal environment. The accumulation of low but chronic pollution in enclosed seas such as the Mediterranean is responsible for the slow deterioration of marine ecosystems. Definition: This indicator measures operational hydrocarbon pollution from waste produced on board ships. Unit: Millions of tons. Objective and/or targeted values: To eradicate 100% of operational pollution from ships by 2025. Methodological Indications: Operational pollution results from the commercial use of ships, used to transport goods or passengers. Operational pollution results from the discharge of ship board generated wastes such as garbage, sewage, dirty bilge water and tank washings as well as from engine exhaust and tank venting emissions. For pleasure craft, operational pollution results from normal usage: management of household waste, disposal of waste water, and ruptured fuel tank hoses. Pollution from oil tankers is essentially “operational” and is formed by hydrocarbons and ballast. Accidental pollution is not taken into account in the computation of this indicator. Geographical scope: Marine zones. References: Regional Marine Pollution Emergency Response Centre for the Mediterranean Sea (REMPEC). www.rempec.org ; «A Sustainable Future for the Mediterranean: The Blue Plan’s Environment & Development Outlook», Plan Bleu, 2005.
International Data Sources: Regional Marine Pollution Emergency Response Centre for the Mediterranean Sea (REMPEC) www.rempec.org
Code COA_P02
Indicator Operational pollution from ships
Place Italy
Operational pollution from
shipsDischarges of less of 50 tons
Units
Years
Mt Mt
2002 509,2 915,9
Source: APAT (Italian Agency for Environmental Protection and Technical Services)
Notes: No data on operational pollution by ships are available in Italy (it is an illegal activity).
Data exist on illegal discharges of oil by ships at sea according to MARPOL 73/78 and
on pollution due to ship accidents in coastal domestic waters, and for 2002 only.
Operational pollution from ships Italy

64
MSSD 25 - COA_P03 Proportion of coastal urban population connected to a sanitation network
Strategic Objective: To prevent and reduce land-based pollution, by achieving the objectives defined by the “Strategic Action Program” adopted in 1997 to combat pollution from land-based human activities. Rationale: It is estimated that 48% of large Mediterranean coastal urban areas (over 100 000 inhabitants) have no treatment plant, 10% have primary treatment facilities, 38% secondary and only 4% tertiary, before disposal into the sea. Main concerns are the repercussions of land-based pollution on human health, on the treatment costs of industrial and domestic pollutants and solid waste, and impacts on marine ecosystems. Definition: This indicator measures the number of inhabitants (the share of population) in coastal cities connected to household used water sanitation networks. Several sub-indicators can be calculated: (1) Population connected to sanitation networks equipped with used water treatment plants (differentiating between treatment types) vs total population; (2) Population connected to sanitation networks without used water treatment plants vs total population. Unit: Percentage. Objective and/or targeted values: To reduce by half the number of coastal cities inhabitants not connected to sanitation networks by 2015. To reach a level of 100% connection (access) to sanitation networks. Methodological Indications: «Coastal cities» designates cities of over 10 000 inhabitants established along the coast line. Differentiation is made between sanitation networks that are or not connected to treatment plants, and according to treatment types. Data on population connected to sanitation networks are usually available at the local Town Hall or in companies in charge of network maintenance. Precautions for use: Some cities of less than 10 000 inhabitants may host a much larger population during the high summer season and are not included in this calculation.

65
Code COA_P03
Indicator Proportion of coastal urban population connected to a sanitation network
Place Italy
Proportion of coastal
urban population
connected to a
sanitation network with
wastewater plant
Coastal urban population
connected to a sanitation
network with wastewater
plant
Coastal urban
population
Units
Years
% Inhab Inhab
2004 76,7 9.390.660 12.237.610
Source: APAT (Italian Agency for Environmental Protection and Technical Services)
Proportion of coastal urban population connected to a sanitation network Italy
Proportion of coastal urban population connected to a sanitation network Italy
0
10
20
30
40
50
60
70
80
90
0 500 1000 1500 2000 2500
%
with wastewater plant

66
MSSD 26 - COA_P04 Surface of protected coastal and marine areas
Strategic Objective: To curtail or substantially reduce the loss of marine and coastal biodiversity by 2010 in EU Member States, and to substantially reduce losses in all other countries, according to international and European commitments. Significantly increase the creation of protected areas throughout the Mediterranean Region; to apply IUCN protection criteria to at least 10% of coastal and marine habitats. Rationale: The deterioration observed in coastal biodiversity has increasingly motivated civil society, countries and the international community to pool their efforts. Regulations, in the form of international treaties, regional protocols and agreements, national legislation, which are, in some cases, specific to the Mediterranean, have been adopted over the last 30 years. However, the relative share of protected coastal areas is still too limited to ensure the conservation of biodiversity, and the pace of implementation of the protocols and action plans adopted within the framework of Barcelona Convention remains much too slow. Definition: The indicator is defined for a specific year by the sum of protected coastal and marine areas. Unit: Km2. Objective and/or targeted values: Extend the surface of protected coastal and marine areas. To protect at least 10% of coastal and marine habitats. Methodological Indications: Marine and coastal zones are areas which include coastal ecosystems (continental and/or marine) and marine areas (pelagic and deep-sea habitats). The total surface of the protected area is taken into consideration, despite the fact that the coastal area itself may only represent a small portion. National legislation exists in all countries regarding the protection of natural heritage. For the sake of comparison, protected areas are listed under the categories defined by IUCN. IUCN defines six categories of protected areas in two groups: (1) Fully protected areas maintained in their original state and closed to extractive uses: Natural Reserves/Natural Zones, National Parks, and Natural Monuments; (2) Partially protected areas are equipped for such specific uses as leisure activities, to guarantee optimal living conditions for species and ecological communities: habitats/species management zones, protected land and marine landscapes, and protected resource management zones. In the case of protected areas, it will be necessary, at a later stage, to determine those which are located, even if only partially, along a coast. The total protected area surface will be included in the indicator, aggregating total protected area surfaces at national level. Geographical scope: National level; Mediterranean Coastal Zones (NUTS 3); Coastal Zones; Marine Zones. References: www.iucn.org ; World Conservation Monitoring Center (WCMC); MAP-Regional Activity Centre / Specially Protected Areas (RAC/SPA) http://www.racspa.org ; “A Sustainable Future for the Mediterranean: The Blue Plan’s Environment & Development Outlook”, Plan Bleu, 2005. International Data Sources: www.iucn.org ; http://iucn.org/places/medoffice/en/index.html ; http://www.unep-wcmc.org/ Precautions for use: Protection of ecosystems does not necessarily involve the application of national and/or international classifications: as an example, military zones, territories managed by specific institutions (forests), and properties of the Conservatoire du Littoral or equivalent. Methodological Annex: Categories: (I a) Strict Nature Reserve: protected area managed mainly for science - Area of land and/or sea possessing some outstanding or representative ecosystems, geological or physiological features and/or species, available primarily for scientific research and/or environmental monitoring. (I b) Wilderness Area: protected area managed mainly for wilderness protection - Large area of unmodified or slightly modified land, and/or sea, retaining its natural character and influence, without permanent or significant habitation, which is protected and managed so as to preserve its natural condition. (II) National Park: protected area managed mainly for ecosystem protection and recreation - Natural area of land and/or sea, designated to protect the ecological integrity of one or more ecosystems for present and future generations, exclude exploitation or occupation inimical to the purposes of designation of the area and provide a foundation for spiritual, scientific, educational, recreational and visitor opportunities, all of which must be environmentally and culturally compatible. (III) Natural Monument: protected area managed mainly for conservation of specific natural features - Area containing one, or more, specific natural or natural/cultural feature which is of outstanding or unique value because of its inherent rarity, representative or aesthetic qualities or cultural significance. (IV) Habitat/Species Management Area: protected area managed mainly for conservation through management intervention - Area of land and/or sea subject to active intervention for management purposes so as to ensure the maintenance of habitats and/or to meet the requirements of specific species. (V) Protected Landscape/Seascape: protected area managed mainly for landscape/seascape conservation and recreation - Area of land, with coast and sea as appropriate, where the interaction of people and nature over time has produced an area of distinct character with significant aesthetic, ecological and/or cultural value, and often with high biological diversity. Safeguarding the integrity of this traditional interaction is vital to the protection, maintenance and evolution of such an area. (VI) Managed Resource Protected Area: protected area managed mainly for the sustainable use of natural ecosystems - Area containing predominantly unmodified natural systems, managed to ensure long term protection and maintenance of biological diversity, while providing at the same time a sustainable flow of natural products and services to meet community needs.

67
Surface of protected terrestrial areas
Code COA_P04
Indicator Surface of protected terrestrial and marine areas
Place Italy
Surface of protected
terrestrial areas
Surface of protected
marine areas
Units
YearsKm
2Km
2
2001 27.530 2.610
2002 27.142 2.662
2003 29.119 28.207
Source: MATT (Italian Ministry for the Environment, Land and the Sea)
Notes: Protected terrestrial areas include not only coastal areas.
Protected marine areas include the marine areas of terrestrial protected areas as well.
Surface of protected terrestrial and marine areas Italy
0
5000
10000
15000
20000
25000
30000
35000
2000 2001 2002 2003 2004
Km
2

68
MSSD 27 - COO_P01 ODA allocated as % of OECD DAC countries donors’ GNP;
proportion of the ODA allocated to Mediterranean countries and proportion contributing to the strategy objectives
Strategic Objective: Invite European donor countries, members of the OECD Development Aid Committee (DAC), to comply with Millennium goals for development by increasing the share of public aid to 0.7% of GNP, by 2015. Encourage donors to integrate sustainable development in strategies and methods. Substantially increase the relative share of aid contributing to Strategy. Rationale: This indicator measures the increase in aid offered or received in the region and assesses whether aid is allocated to initiatives contributing to the achievement of MSSD objectives. There are significant requirements for public financing attached to the implementation of the Strategy, in such areas as: the reduction of environmental issues, improved access to basic services, promotion of research and development, establishment of sustainable transport systems, incentives for new consumption and production patterns, strengthening of capacities, and promotion of sustainable agricultural and rural development. However, funds are very limited in most Southern and Eastern Mediterranean countries. The use of Official Development Aid (ODA) to fund projects that are compatible with MSSD targets can considerably boost regional development and support the achievement of MSSD targets. Observation: ODA in % of GDP is also a monitoring indicator for Millennium goal No. 8 regarding the establishment of a global development partnership. Definition: This is a multiple indicator: ODA provided (% of GNP in Mediterranean donor countries, members of the OECD DAC); Share of ODA earmarked for Mediterranean countries; Share of aid provided as contribution to MSSD targets. Unit: Percentage. Objective and/or targeted values: Increase ODA from European donor countries, members of OECD DAC, to 0.7% of GNP (MDG) before 2015. Methodological Indications: Official development assistance is defined as those flows to countries on Part I of the DAC List (available at www.oecd.org/dac/htm/daclist.htm ) and to multilateral institutions for flows to Part I aid recipients which are: (1) provided by official agencies, including state and local governments, or by their executive agencies; (2) each transaction of which: a) is administered with the promotion of the economic development and welfare of developing countries as its main objective; and b) is concessional in character and conveys a grant element of at least 25% (calculated at a rate of discount of 10%). Extract of the OECD report DCD/DAC/STAT(2001)8 available on the OCDE web site: www.oecd.org/dataoecd/21/21/34086975.pdf. ODA to countries includes: aids/ donations/subsidies; and subsidised loans (for example, loans from the World Bank or IMF). Aid can also be obtained through multilateral or bilateral cooperation. Aid can be provided through direct financial aid transfers in kind (food, equipment) or through compensation for local experts (technical cooperation). Private aid (decentralized cooperation, NGO) is not accounted for herein as it is difficult to assess, but can nonetheless be highly significant. Geographical scope: National level. References: OCDE/DAC : www.oecd.org/dac International Data Sources: OCDE/DAC : www.oecd.org/dac; United Nations: http://millenniumindicators.un.org/unsd/mi/mi_goals.asp Precautions for use: Figures only cover the spread of ODA and DA provided by DAC member countries only. They do not include aid provided by Mediterranean countries not members of DAC (such as Tunisia and Israel). Methodological Annex: Distinction between «Official Development Aid» and «Official Aid»: All aid contributions are included in the DAC list of beneficiary countries, which has recently been updated to include political and economic changes and is designed for statistics purposes. However, only traditional contributions to developing countries (in Part I of the list) are considered as «Official Development Aid», and should represent 0.7% of donor country GNP, as per the long-standing UN objective. The following beneficiary countries are included in Part I of the OECD/DAC list: Albania, Algeria, Bosnia Herzegovina, Egypt, Morocco, Serbia Montenegro, Syria, Tunisia and Turkey. Aid to developing countries and to «more advanced» Eastern European countries (listed in Part II of the List) is accounted for separately as « Official Development Aid ». In 2003, this second list included: Cyprus, Israel, Libya, Malta and Slovenia. In 2003, the share of ODA directly favourable to sustainable development was estimated by Plan Bleu, using OECD/DAC data, the Creditor Country Notification System (aid activities database). On the basis of this information, Plan Bleu defined 7 categories and gave estimations on the corresponding aid levels: three areas (environment, human capital and democracy) are considered as directly favourable to sustainable development, with a share estimated at 19% for the period 1973-2002. The share is certainly under-estimated as, in addition to categories with specific links to sustainable development, sustainability components can also be found in other categories. The spread of aid will require updating, according to MSSD orientations.

69
MSSD 28 - COO_P02 EU net public financial flows to EU Mediterranean members, candidates, CARDS
and MEDA countries (in absolute value and per capita) and proportion contributing to the objectives of the strategy
Strategic Objective: Reinforce mutual commitments, solidarity and Mediterranean and Euro-Mediterranean cooperation for sustainable development. Substantially increase the relative share of aids contributing to Strategy goals. Promote financing of decentralized development programs, particularly in the case of MEDA funds. Rationale: According to MSSD: “As a result of the EU’s enlargement process and its Community Assistance for Reconstruction, Development and Stabilization (CARDS) programme, commitment and solidarity are already being strengthened in countries on the northern shore of the Mediterranean. In terms of sustainable development, it is necessary to improve the integration of the principles and goals of the European and Mediterranean sustainable development strategies in the process of enlargement. The Euro-Mediterranean Partnership, initiated in 1995, constitutes a major political framework for the implementation of the Mediterranean Strategy. It is expected that the next steps in the EU’s Mediterranean neighbourhood policy toward Southern and Eastern Mediterranean countries will integrate social and ecological issues more fully into the decision-making process so as to build a genuine policy of sustainable co-development. A strengthened Euro-Mediterranean Partnership will provide Mediterranean countries with greater opportunities to achieve their aspirations. Sustainable development should be a guiding principle in the Euro-Mediterranean project and the neighbourhood policy. This renewal will have to be combined with strengthened synergies with other regional cooperation frameworks, and particularly with the Mediterranean Action Plan (MAP). The Euro-Mediterranean Partnership will gain much from this positive reorientation, which is of vital importance for the region’s future. Policy renewal needs to guarantee the progressive enlargement of solidarity to southern and eastern Mediterranean countries, taking their specificities into account.” Rational and targeted increases of European loans in favour of South and East Mediterranean countries and the consolidation of efforts for South-Eastern European countries could greatly contribute to boosting development in the region as a whole and allow it to achieve MSSD goals. Definition: Multiple Indicator: (1) Net EU financing for member, candidate, CARDS and MEDA Mediterranean countries (in absolute value and per capita); (2) Relative share contributing to Strategy goals. Unit: US $ and US $ per capita; Percentage. Geographical scope: National level. References: Eurostat, European Commission, OECD/DAC. International Data Sources: Eurostat, OECD/DAC.

70
MSSD 29 - COO_P03 Proportion of bank credit allocated to the private sector – Existence of alternative financing systems to bank credit
Strategic Objective: Promote the implementation of mechanisms to finance productive and innovative small and medium –sized enterprises (SMEs) activities (micro-credit, venture capital, incentives…). Rationale: This indicator yields information on fluctuations in the spread of bank loans between the private and public sector (the banking sector remains the main source of financing in the Mediterranean), as well as indirect information on the availability of bank loans for the private sector. In several South and East Mediterranean countries, the public sector monopolizes a large share of total savings, and only a relatively limited share of loans is allocated to the private sector vs total bank loans. Equally, access to production financing by SMEs is strongly limited by the stringent guarantees required by merchant banks and by the high cost of loans. And lastly, due to weak financial markets and lack of alternative financing solutions, banks hold a quasi-monopolistic position. Micro-financing is common practice in Asia, but is not generally known or applied in Mediterranean countries. SMEs in particular could benefit from easier and less costly access to loans if the share of bank loans to the private sector was increased and micro-credit developed. Definition: Multiple Indicator: (1) Share of bank loans allocated to the private sector; (2) Existence of alternative funding mechanisms. Unit: Percentage (of total loans granted the economic sector); Percentage of GDP; Number of micro-credit creditors; number of micro-financing institutions. Objective and/or targeted values: Continue and accelerate reforms in taxation, and in financial and bank mechanisms, taking into account sustainable development requirements (comparison between countries with equivalent revenue). Methodological Indications: Domestic credit to private sector refers to financial resources provided to the private sector, such as through loans, purchases of non-equity securities, and trade credits and other accounts receivable that establish a claim for repayment. For some countries these claims include credit to public enterprises. Alternative funding mechanisms: (1) Venture capital investments in % of GDP: Venture capital investments are defined as private equity made available to businesses. Management purchases and buy-backs of listed shares are not included. Data are classified under two investment stages: preliminary (seeding + start-up) and expansion and replacement (expansion capital and replacement capital); (2) Micro-credit: This financing mechanism applies market conditions to the grant of short-term loans for limited amounts, to populations excluded from the banking system. The loan is invested in the creation of business activities, often for people services. Geographical scope: National level. References: IMF (International Finance Statistics), Eurostat. International Data Sources: IMF(International Finance Statistics), Eurostat.

71
MSSD 30 - COO_P04 Proportion of local government tax receipts as percentage
of total tax revenues (government receipts). Proportion of government budget allocated to local authorities
Strategic Objective: Strengthen the prerogatives and authority of local authorities. Rationale: Local policies and territorial approaches are one of the keys to the implementation of the sustainable development strategy and involve decentralized activities and/or management. Decentralization requires that sufficient financial means, compatible with the responsibilities of local communities, are available, either through the State budget or local public revenue. Definition: Share of local public revenue vs total public revenue (government receipts); - Share of the State Budget allocated to local authorities. Unit: Percentage. Methodological Indications: This indicator strives to collect information on the financial resources of local administrations, through tax revenue, as well as on the development of local tax potential in the countries. Geographical scope: National level. References: IMF, OECD, Eurostat. International Data Sources: IMF, OECD, Eurostat. Precautions for use: The indicator does not document the degree of autonomy of local administrations in terms of taxation. For example, in some countries, the infra-national administration does not have the authority to change the tax rate or base. The indicator does not document the quality and objectives of public local expenditure.

72
MSSD 31 - COO_P05 Public financing mechanisms to support the least favoured regions
Strategic Objective: Reinforce social and territorial cohesion. Support within the Euro-Mediterranean Partnership, the transition to sustainable agricultural and rural development, and the emergence of integrated mechanisms and programs. Rationale: The development of the least favoured regions is crucial to improve territorial balance and requires the implementation of financing mechanisms. Objective 1 of the Structural Funds is the main priority of the European Union's cohesion policy. In accordance with the treaty, the Union works to "promote harmonious development" and aims particularly to "narrow the gap between the development levels of the various regions". In Southern and Eastern Mediterranean countries, there are very significant differences in social and economic development, particularly between urban and rural areas. Financing mechanisms to support under-privileged regions may play an important role in reducing these differences. Definition: Public financing mechanisms to support the most under-privileged regions are funds invested by national and international donors in the reduction of regional development discrepancies. Unit: US$ Geographical scope: National level. References: http://ec.europa.eu/comm/regional_policy/objective1/index_fr.htm ; Eurostat. International Data Sources: Eurostat.
73
MSSD 32 HUM_P01 Youth literacy rate
Strategic Objective: Generalize primary education, according to Millennium Goals. Rationale: Illiteracy rates, particularly in rural areas and among women, remain high in developing Mediterranean countries. The misalignment between qualifications acquired through schools and universities and market needs causes high unemployment, particularly among young graduates. Definition: The number of literate/illiterate persons aged fifteen to twenty-four, expressed as a percentage of the total population in that age group. A person is considered literate/illiterate if he/she can/cannot read and write with understanding a simple statement related to his/her life. Unit: Percentage. Objective and/or targeted values: Implement global primary education. Ensure that, by 2015, all children, boys and girls, in all countries, are able to complete a full primary education. Methodological Indications: The indicator is usually calculated by dividing the number of literate 15 to 25 year-olds by the total population in the same age group, and multiplying by 100. Considering that data on literacy are not always available for all countries or all censuses, the Institute of Statistics of UNESCO applies modelling techniques to produce yearly literacy estimates based on data from national censuses and overviews. Geographical scope: National level. References: UNESCO Institute of Statistics http://www.uis.unesco.org http://millenniumindicators.un.org/unsd/mi/mi_goals.asp International Data Sources: UNESCO Institute of Statistics http://www.uis.unesco.org http://millenniumindicators.un.org/unsd/mi/mi_goals.asp Precautions for use: Literacy may be assessed by different means: either with a simple question: «Can you read and write? Yes/No», or with a panel of literacy evaluation tests. In some cases, literacy is roughly assessed in population censuses, based on self-affidavits or on estimates of the un-schooled or uneducated population. This situation complicates international comparisons. Time data comparisons, even in the same survey, may also be problematic, in that the definitions of literacy applied in surveys are not standardized.

74
Code HUM_P01
Indicator Youth literacy rate
Place Italy
Youth literacy
rate
Number of
literate people
between 15 and
25 years old
Number of
people between
15 and 25 years
old Units
Years
% Nb NbTarget
1980 99,77 9.737.304 9.759.836
2000 99,81 6.375.978 6.387.979 100
Source: ISTAT (Central Statistics Institute)
Notes: Data for 1980 consider people between 14 and 24 years old. Data for 2000 consider
people between 15 and 24 years old.
Youth literacy rate Italy
Youth literacy rate Italy
0
20
40
60
80
100
120
1975 1980 1985 1990 1995 2000 2005
%

75
MSSD 33 - HUM_P02 Girl/Boy primary and secondary school registration ratio
Strategic Objective: Eradicate differences in education between genders, in compliance with Millennium Goals. Rationale: Education is essential to human development and eradicating differences between genders could contribute to enhancing the status and potential of women. Education of women is also a determining factor for economic development. Definition: The indicator compares the ratio of girls and boys registered in private and public primary and secondary schools. Unit: Percentage. Objective and/or targeted values: Promote equal opportunity and more power for women. Eradicate gender differences in primary and secondary education, preferably by 2005, and for all levels of education by 2015, at the latest. Methodological Indications: The indicator is the ratio of the number of girls in school vs the number of boys, regardless of age. Geographical scope: National level. References: UNESCO http://portal.unesco.org http://millenniumindicators.un.org/unsd/mi/mi_goals.asp International Data Sources: UNESCO Institute of Statistics http://www.uis.unesco.org http://millenniumindicators.un.org/unsd/mi/mi_goals.asp Precautions for use: The indicator is an imperfect measure of girls’ access to schools, since fluctuations in the ratio can reflect an increase in the schooling of girls (positive) or a drop in the number of boys (negative), and because there is no specification as to the number of children registered in school who complete the full appropriate cycle. The indicator is further limited by the fact that the ratio reflects the gender-based structure of the school-age population. In case of a significant difference of 1 between the genders in the school-age population, the indicator does not accurately reflect the actual differences between registration of girls and boys. This is the case in countries where boys outnumber girls in the youngest populations.

76
Code HUM_P02
Indicator
Place Italy
Girl/Boy primary
and secondary
school
registration ratio
Number of girls
registered in
primary and
secondary
schools
Number of boys
registered in
primary and
secondary
schools
Units
Years
% Nb NbTarget
1975 90,0 4.599.766 5.108.828
1980 93,4 4.700.323 5.030.554
1985 94,7 4.407.834 4.656.853
1990 95,1 3.983.623 4.190.157
1995 95,2 3.618.120 3.801.923
2000 93,3 3.515.483 3.768.216 100
2005 94,1 3.525.870 3.748.215 100
Sources: ISTAT (Central Statistics Institute); UNESCO (United Nations Educational,
Scientific and Cultural Organization)
Girl/Boy primary and secondary school registration ratio Italy
Girl/Boy primary and secondary school registration ratio
Girl/Boy primary and secondary school registration ratio Italy
0
20
40
60
80
100
120
1970 1975 1980 1985 1990 1995 2000 2005 2010
%

77
MSSD 34 HUM_P03 Public and private expenses for research and development in percentage of GDP
Strategic Objective: Increase expenditures for research and development, in synergy with the private sector, by 2015, to attain the average level of countries with equivalent revenues. Emphasize rational use of natural resources, development of environmentally-friendly techniques, and enhance the economic and social know-how and diversity of the Mediterranean. Rationale: Average expenditures for research & development (R&D), including in developed North Rim countries, are much lower than expenditure in countries with equivalent revenues in other regions of the world. Definition: The indicator is composed of two sub-indicators, defined as follows: (1) the share of the operational budget of the public sector earmarked for R&D; and (2) the share of R&D expenditures vs GDP for the private sector. Unit: Percentage. Methodological Indications: Experimental research and development include innovations and systematic increase of knowledge, including knowledge of Mankind, culture and society, and the use of this knowledge in new applications. R&D is defined as three activities: fundamental research, applied research and experimental development. R&D expenditures include amounts and expenses paid to trainers, and amounts to fund the appropriate facilities, if they are solely dedicated to training and limited to company use. Geographical scope: National level. References: UNESCO Institute of Statistics http://www.uis.unesco.org International Data Sources: UNESCO Institute of Statistics http://www.uis.unesco.org Methodological Annex: Gross domestic expenditure on R&D (GERD) is total intramural expenditure on R&D performed on the national territory during a given period. The sources of funds for GERD are classified according to the following five categories: (1) Business enterprise funds include funds allocated to R&D by all firms, organizations and institutions whose primary activity is the market production of goods and services (other than the higher education sector) for sale to the general public at an economically significant price, and those private non-profit institutes mainly serving these firms, organizations and institutions. (2) Government funds refer to funds allocated to R&D by the central (federal), state or local government authorities. These includes all departments, offices and other bodies which furnish but normally do not sell to the community those common services, other than higher education, which cannot be conveniently and economically provided and administer the state and the economic and social policy of the community. Public enterprises funds are included in the business enterprise funds sector. These authorities also include private non-profit institutes controlled and mainly financed by government. (3) Higher education funds include funds allocated to R&D by institutions of higher education comprising all universities, colleges of technology, other institutes of post-secondary education, and all research institutes, experimental stations and clinics operating under the direct control of or administered by or associated with higher educational establishments. (4) Private non-profit funds are funds allocated to R&D by non-market, private non-profit institutions serving the general public, as well as by private individuals and households. (5) Funds from abroad refer to funds allocated to R&D by institutions and individuals located outside the political frontiers of a country except for vehicles, ships, aircraft and space satellites operated by domestic organisations and testing grounds acquired by such organisations, and by all international organizations (except business enterprises) including their facilities and operations within the frontiers of a country.

78
Code HUM_P03
Indicator R&D expenditures
Place Italy
Share of R&D
expenditures vs GDPR&D expenditures GDP at market prices
Units
Years
% euro euro (current prices)
1980 0,74 1.496.317.000 203.383.000.000
1985 1,10 4.716.750.000 429.649.000.000
1990 1,25 8.780.398.000 701.352.000.000
1994 1,02 8.980.596.000 877.708.000.000
2000 1,05 12.460.348.000 1.191.057.000.000
2003 1,11 14.768.856.000 1.335.354.000.000
Sources: ISTAT (Central Statistics Institute); UNESCO (United Nations Educational,
Scientific and Cultural Organization)
Notes: Titles of columns have been changed according to data available.
R&D expenditures Italy
Share of R&D expenditures vs GDP - Italy
0
1
2
3
4
5
6
7
8
9
10
1975 1980 1985 1990 1995 2000 2005
%

79
BIBLIOGRAFIA
Commission of the European Communities, “Communication from the Commission to the Council
and the European Parliament – Establishing an Environment Strategy for the Mediterranean” –
COM(2006) 475 final – Brussels, 2006
Commission of the European Communities, “Communication from the Commission – A
Sustainable Europe for a Better World: A European Union Strategy for Sustainable Development
(Commission’s proposal to the Gothenburg European Council)” – COM(2001)264 final – Brussels,
2001
Commission of the European Communities, “Communication from the Commission to the
European Parliament, the Council, the Economic and Social Committee and the Committee of the
Regions – Towards a global partnership for sustainable development” – COM(2002)82 final –
Brussels, 2002
Commission of the European Communities, “Communication from the Commission to the Council
and the European Parliament - Establishing an Environment Strategy for the Mediterranean” –
COM(2006) 475 final – Brussels, 2006
Council of the European Union, “Review of the EU Sustainable Development Strategy (EU SDS) –
Renewed Strategy” – Brussels, 26 June 2006
ICLEI, “Second Local Agenda 21 Survey” - 2002
International Atomic Energy Agency, United Nations Department of Economic and Social Affairs,
International Energy Agency, Eurostat, European Environment Agency, “Energy indicators for
sustainable development: guidelines and methodologies”- IAEA – Vienna, 2005
International Energy Agency, “Renewable Information 2004” – OECD Publications - Paris, 2004
International Federation of Organic Agriculture Movements, “The World of Organic Agriculture
2004 - Statistics and Emerging Trends” – IFOAM – Bonn, February 2004
Margat J., “L’eau des Méditerranéens: situation and perspectives” – UNEP MAP, Plan Bleu - 2004
Margat J., Vallee D., “Water resources and uses in the Mediterranean Countries : figures and facts”
- UNEP MAP - Plan Bleu, 1999
Organization for Economic Cooperation and Development, “OECD Factbook 2005” – ISBN 92-64-
01869-7 – OECD, 2005
Organization for Economic Cooperation and Development, International Energy Agency, Eurostat,
“Energy Statistics Manual” – OECD / IEA – Paris, 2004
Plan Bleu – Regional Activity Centre , “Plan Bleu – Activity Report 2006” – Sophia Antipolis, May
2007
Plan Bleu – Regional Activity Centre, “A sustainable future for the Mediterranean: the Blue Plan’s
Environment & Development Outlook” – Sophia Antipolis, 2005

80
Plan Bleu – Regional Activity Centre, “Methodological sheets of the 34 priority indicators for the
<Mediterranean Strategy for Sustainable Development> Follow-up” – Sophia Antipolis, May 2006
Statistical Office of the European Communities, “Community methodology on tourism statistics” –
Eurostat – Luxembourg, 2005
United Nations Department of Economic and Social Affairs - Division for Sustainable
Development, “Report – Expert Group Meeting on Indicators of Sustainable Development” – New
York, December 2005
United Nations Environment Programme – Mediterranean Action Plan, “Mediterranean Strategy for
Sustainable Development – A framework for environmental sustainability and shared prosperity” –
Athens, 2005
United Nations Environment Programme – Mediterranean Action Plan, “MedWaves – The
Mediterranean Action Plan magazine – Special edition – MAP 30° Anniversary” – Athens, 2005
United Nations Environment Programme – Mediterranean Action Plan, “Dossier on tourism and
sustainable development of the Mediterranean” – Plan Bleu - 2005
United Nations Environment Programme – Mediterranean Action Plan, “A sustainable future for
the Mediterranean – The Blue Plan’s Environment and Development Outlook” – Sophia Antipolis,
2006
United Nations, “2002 - Energy Statistics Yearbook” – April 2005
United Nations, “Johannesburg Plan of Implementation – World Summit on Sustainable
Development” - 2002
United Nations World Tourism Organization, “Tourism Satellite Account: Recommended
Methodological Framework” – UNWTO – 2001
World Commission on Environment and Development, “Our Common Future” – Oxford University
Press – Oxford, 1987

81
ACRONIMI
AFIT Agence Française de l’Ingénierie Touristique
ANPA Agenzia Nazionale per la Protezione dell’Ambiente
APAT Agenzia per la Protezione dell’Ambiente e per i Servizi Tecnici
BP/RAC Blue Plan / Regional Activity Centre
CAMP Coastal Areas Management Programme
CARDS Community Assistance for Reconstruction, Development and Stabilization
DAC Development Aid Committee
EEA European Environment Agency
EPI Environmental Performance Indicators
EU SDS EU Sustainable Development Strategy
EU European Union
EUROSTAT Statistical Office of the European Communities
FAO Food and Agriculture Organization
FMCU Fédération Mondiale des Cités Unies
GDP Gross Domestic Product
GERD Gross Domestic Expenditure on Research & Development
GHG Greenhouse Gas
GWP Global Warming Potential
IAEA International Atomic Energy Agency
ICAO International Civil Aviation Organization
ICLEI Local Governments for Sustainability
IEA International Energy Agency
IFEN Institut Française de l’Environnement
IFOAM International Federation of Organic Agriculture Movements
IMF International Monetary Fund
IPCC Intergovernmental Panel on Climate Change
IRF International Road Federation
ISTAT Istituto Nazionale di Statistica
IULA International Union of Local Authorities
LA21 Local Agenda 21
MCSD Mediterranean Commission on Sustainable Development
MDGs Millennium Development Goals
MEDREP Mediterranean Renewable Energy Programme
METAP Mediterranean Environment Technical Assistance Program
MSSD Mediterranean Strategy for Sustainable Development
NUTS Nomenclatura delle Unità Territoriali per le Statistiche
ODA Official Development Aid
OECD Organization for Economic Cooperation and Development
PPP Purchasing Power Parity
R&D Research & Development
RAC / SPA Regional Activity Centre / Specially Protected Areas
REMEP Rome Euro-Mediterranean Energy Platform
REMPEC Regional Marine Pollution Emergency Response Centre for the
Mediterranean Sea
SDI Sustainable Development Indicators
SMAP Short and Medium-Term Priority Environmental Action Programme
SMEs Small and Medium-sized Enterprises
TOE Ton of Oil Equivalent

82
UN United Nations
UNCED UN Conference on Environment and Development
UNDESA UN Department of Economic and Social Affairs
UNECE UN Economic Commission for Europe
UNEP MAP UNEP Mediterranean Action Plan
UNESCO UN Educational, Scientific and Cultural Organization
UNEP DTIE UNEP Division of Technology, Industry, and Economics
UNEP UN Environment Programme
UNFCCC UN Framework Convention on Climate Change
UNWTO UN World Tourism Organization
USD United States Dollars
WCED World Commission on Environment and Development
WCMC World Conservation Monitoring Center
WHO World Health Organization
WRI World Resources Institute