DEVELOPMENT OF MICROFLUIDIC DEVICES FOR … · Grazie alla microfabbricazione, siamo stati capaci...
128
i Main Administrative site of graduate school: UNIVERSITY OF TRIESTE RESEARCH CENTRE: SINCROTRONE TRIESTE S.C.P.A. PhD fellowship sponsored by Physics Department trough Sincrotrone Trieste funds XXIII CYCLE OF GRADUATE SCHOOL OF NANOTECHNOLOGY TITLE OF THE THESIS: DEVELOPMENT OF MICROFLUIDIC DEVICES FOR BIOMEDICAL APPLICATIONS OF SYNCHROTRON RADIATION INFRARED MICROSPECTROSCOPY Scientific sector (SSD) FIS 01 EXPERIMENTAL PHYSICS PhD CANDIDATE GIOVANNI BIRARDA Chairman of Graduate School in Nanotechnology (Director of the School) PROF. MAURIZIO FERMEGLIA FIRMA: __________________________________ SUPERVISOR: PROF. ALFONSO FRANCIOSI – UNIVERSITÀ DI TRIESTE FIRMA: __________________________________ TUTOR: DOTT.SSA LISA VACCARI – SINCROTRONE TRIESTE FIRMA: __________________________________ TUTOR: DOTT. GIANLUCA GRENCI – IOM CNR FIRMA: __________________________________ ACADEMIC YEAR 2009/2010
Transcript of DEVELOPMENT OF MICROFLUIDIC DEVICES FOR … · Grazie alla microfabbricazione, siamo stati capaci...
i
Main Administrative site of graduate school: UNIVERSITY OF TRIESTE
RESEARCH CENTRE: SINCROTRONE TRIESTE S.C.P.A.
PhD fellowship sponsored by Physics Department trough Sincrotrone Trieste funds
XXIII CYCLE OF
GRADUATE SCHOOL OF NANOTECHNOLOGY
TITLE OF THE THESIS:
DEVELOPMENT OF MICROFLUIDIC DEVICES FOR
BIOMEDICAL APPLICATIONS OF SYNCHROTRON RADIATION
INFRARED MICROSPECTROSCOPY
Scientific sector (SSD) FIS 01 EXPERIMENTAL PHYSICS
PhD CANDIDATE
GIOVANNI BIRARDA Chairman of Graduate School in Nanotechnology
(Director of the School)
PROF. MAURIZIO FERMEGLIA
FIRMA: __________________________________
SUPERVISOR: PROF. ALFONSO FRANCIOSI –
UNIVERSITÀ DI TRIESTE
FIRMA: __________________________________
TUTOR: DOTT.SSA LISA VACCARI – SINCROTRONE
TRIESTE
FIRMA: __________________________________
TUTOR: DOTT. GIANLUCA GRENCI – IOM CNR
FIRMA: __________________________________
ACADEMIC YEAR 2009/2010


i
“Research is to see what everybody has seen, and to think what nobody else has thought.”
- Albert Szent-Gyorgyi
“Science is a way of thinking much more than it is a body of knowledge.”
Carl Sagan

ii
iii
ABSTRACT
DEVELOPMENT OF MICROFLUIDIC DEVICES FOR BIOMEDICAL
APPLICATIONS OF SYNCHROTRON RADIATION INFRARED
MICROSPECTROSCOPY
by Birarda Giovanni
The detection and measurement of biological processes in a complex living system is a
discipline at the edge of Physics, Biology, and Engineering, with major scientific challenges, new
technological applications and a great potential impact on dissection of phenomena occurring at
tissue, cell, and sub cellular level.
The present PhD Thesis dealt with the development of methodologies and technologies to
transform InfraRed MicroSpectroscopy (IRMS) into a mature technique to observe in real time
biological events, and improving its ability to perform in vitro bio-experiments under
physiological conditions.
This goal has been achieved through the exploitation of microfabrication techniques to
realize lab-on-chip (LOCs) transparent both in the Infrared and Visible region (IR-Vis), which
allows measuring living cells. Up to now, IRMS has been almost exclusively employed for
studying fixed cellular samples or tissues, allowing acquiring only “still frames” of the
phenomena under investigation. The reason for that is to be ascribed both to the spectroscopic
difficulties in working in water based environment and to the manufacturing constrains of the
most common IR transparent materials, that limit the design flexibility of LOC devices suitable
for IR analysis.
We have overcome the so called “water absorption barrier” by extending microfluidic
concepts to calcium fluoride, implementing innovative fabrication solutions for the realization
of custom devices for IRMS studies of living cells subjected to different chemical and physical
stimuli. Exploiting the high brightness of Synchrotron Radiation (SR) IR sources, that allows
sampling at diffraction limited spatial resolution, we demonstrated the feasibility of the
iv
detection of intra-cellular processes. In parallel, novel strategies for IR data acquisition and
analysis have been developed, opening the possibility to execute novel original experiments.
Our studies were focused on the immune system, and in particular in evaluating the
biochemical rearrangements characterizing human circulating leukocytes during their
deformation, either when induced by purely mechanical stimuli or in response to a chemical
gradient. Thanks to the microfabrication approach, we were able to mimic the cellular
microenvironment both for studying pressure-driven micro-capillary circulation and chemically-
driven extravasations of white blood cells.
The present Thesis demonstrates that the “synergy of micro-approaches”, or rather the
combination of micro-fabrication and IR micro-spectroscopy, can be exploited for extending
the frontiers of Fourier Transform Infrared Spectroscopy (FTIR) to unexplored fields of life
sciences. Through the careful control of the cellular microenvironment, crucial for an accurate
data analysis as well as fundamental for the reliability of biological conclusions, some light could
be shed on phenomena never investigated with IRMS, such as mechano-biology we directly
explored, pulling down the water-barrier.
v
RIASSUNTO
SVILUPPO DI DISPOSITIVI MICROFLUIDICI PER APPLICAZIONI
BIOMEDICHE DELLA MICROSPETTROSCOPIA INFRAROSSA CON
RADIAZIONE DI SINCROTRONE
di Birarda Giovanni
L’identificazione e la quantificazione di processi biologici in un complesso sistema vivente
può essere ritenuta una disciplina al confine tra la Fisica, la Biologia e l’Ingegneria, con
importanti sfide scientifiche, innovazioni tecnologiche e un grande impatto sulla dissezione di
fenomeni a livello tissutale, cellulare e sub cellulare.
Il presente lavoro di Dottorato ha avuto come obiettivo lo sviluppo di metodologie e
tecnologie atte a rendere la MicroSpettroscopia InfraRossa (MSIR) una tecnica matura allo
studio in tempo reale di fenomeni biologici, permettendo di effettuare esperimenti “in vitro” in
condizioni fisiologiche.
Questo obiettivo è stato raggiunto tramite l’utilizzo delle tecniche di microfabbricazione
per la realizzazione di un “Lab-on-Chip” (LOC) trasparente sia nella regione dell’infrarosso che
nel visibile, tramite il quale misurare cellule vive. Infatti fin’ora la MISR è stata impiegata quasi
esclusivamente per lo studio di campioni di tessuti o di cellule fissati, permettendo di registrare
solo “singoli fotogrammi” dei fenomeni sotto indagine. La ragione di questa limitazione è da
imputarsi alle difficoltà spettroscopiche che si incotrano nell’investigazione di sistemi acquosi e
ai limiti di fabbricazione dei più comuni materiali IR trasparenti, che hanno limitato la flessibilità
di design necessaria alla realizzazione di LOC adatti alle analisi tramite MSIR.
Siamo riusciti a superare la cosiddetta “barriera di assorbimento dell’acqua” tramite
l’estensione dei concetti della microfluidica e dellamicrofabbricazione al calcio fluoruro,
implementando soluzioni fabbricative che hanno permesso lo studio tramite MSIR di cellule
viventi sottoposte a differenti stimoli sia di natura chimica che fisica. Grazie all’alta brillanza
della Radiazione di Sinctrotrone (SR) IR, che permette il campionamento con una risoluzione
spaziale al limte di diffrazione, abbiamo dimostrato la fattibilità dell’individuazione dei processi
intra celluari. Contemporaneamente sono state sviluppate nuove strategie per l’acquisizione dei
dati e per la loro analisi, permettendo il design di esperimenti innovativi.
vi
I nostri studi si sono concentrati sullo studio del sistema immunitario, in particolare nella
valutazione della risposta biochimica caraterristica dei leucociti circolanti durante la loro
deformazione, sia indotta da cause di tipo puramente meccanico, sia in risposta a gradienti
chimici. Grazie alla microfabbricazione, siamo stati capaci di simulare il microambiente cellulare
sia per lo studio dei globuli bianchi durante la circolazione microcapillare sia durante
l’extravasazione indotta da gradienti chimici.
La presente Tesi dimostra che la sinergia dei “micro” approcci, o piuttosto la combinazione
di microfabbricazione e microspettroscopia IR, può essere usata per estendere le frontiere della
MSIR a nuovi campi nello studio delle scienze della vita. Attraverso il preciso controllo del
microambiente cellulare, cruciale per un’accurata analisi dei dati e fondamentale per
l’attendibilità delle conclusioni biologiche, si possono chiarire fenomeni finora mai investigati
tramite MSIR, come la meccano-biologia che abbiamo esplorato direttamente, abbattendo la
barriera dell’acqua.

vii
Contents
Abstract iii
Riassunto v
Contents vii
Acronyms ix
List of Tables xi
Acknowledgments xiii
Aim of the thesis 1
CHAPTER 1 5
Introduction 5
1.1 Infrared Spectroscopy ........................................................................................................... 5
1.2 Biochemical and biological applications of infrared spectroscopy ............................... 8
1.5 Synchrotron Radiation Infrared Sources ......................................................................... 20
1.6 Water-absorption barrier .................................................................................................... 22
1.7. Microfabrication .................................................................................................................. 24
1.7.1 Photolithography .............................................................................................................. 25
1.8 IR compatible materials ...................................................................................................... 29
1.9 Immune System .................................................................................................................... 30
1.10 Complementary Biological Assays .................................................................................. 34

viii
CHAPTER 2 37
Microfabrication 37
2.1 Microfabrication for IRMS ................................................................................................ 38
2.2 X-ARP 3100/10 characterization ..................................................................................... 39
2.3 Wet etching of calcium fluoride ........................................................................................ 43
2.4 Fabrication of the prototype liquid cell ............................................................................ 45
2.5 Dynamic Devices ................................................................................................................. 46
2.6 Sample Holder ...................................................................................................................... 51
2.7 Biocompatibility ................................................................................................................... 54
CHAPTER 3 57
Immune system studied by SR-IRMS 57
3.1 The Cellular Model .............................................................................................................. 58
3.2 Preliminary Flow Cytometry Assays ................................................................................. 58
3.3 Data Acquisition and Analysis ........................................................................................... 60
3.4 Cellular fixation protocols: the effect on MIR cellular features .................................. 63
3.5 Mechanical Deformation .................................................................................................... 76
3.6 Cell Apoptosis ...................................................................................................................... 81
3.7 Chemical Stimulation .......................................................................................................... 91
3.8 SR Mapping ........................................................................................................................... 96
CHAPTER 4 99
Conclusions 99
Bibliography 102
List of Publications 108
APPENDIX I 110
Novolac Resins ........................................................................................................................ 110

ix
Acronyms
µ-TAS: Micro Total Analysis System ABR: Actual Brilliance Ratio ATCC: American Type Culture Collection ATR: Attenuated Total Reflection BaF2: Barium Fluoride CaF2: Calcium Fluoride CCCP: Carbonyl cyanide m-chlorophenyl hydrazone CO2: Carbon Dioxide CPD: Critical Point Drying DI: DeIonized DiOC6: 3,3′-dihexyloxacarbocyanine iodide DNA: Deoxyribonucleic acid DOF: Depth of Field FBS: Fetal bovine Serum FIR: Far Infrared FITC: fluorescein isothiocyanate fMLP: Formyl Methionily-Leucyl-Phenilalanine FPA: Focal Plane Array FS: Forward Scattering FTIR: Fourier Transform Infrared GI: Grazing Incidence IC: Integrated Circuit IRMS: Infrared Microspectroscopy IRSR: Infrared Synchrotron Radiation LILIT: Laboratory for Interdisciplinary LIThography LOC: Lab On Chip MCT: Mercury-Cadmium-Telluride MEMS: Micro-Electronic Mechanical Systems MFI: Mean Fluorescence Intensity

x
MHC: Major Histocompatibility Complex MIR: Medium Infrared NF-kB: Nuclear Factor kappa-B NIR: Near Infrared PBS: Phosphate buffered saline PCR: Polymerase Chain Reaction PCD: Programmed Cell Death PCR: Polymerase Chain Reaction PEEK: Polyether Ether Ketone PI: Propidium Iodide PL: Photo Lithography PMGI: Polymethylglutarimide PP: Polypropylene RNA: Ribonucleic acid RPMI: Roswell Park Memorial Institute (cell culture medium) SISSI: Synchrotron Infrared Source for Spectroscopy Imaging SR: Synchrotron Radiation UHV: Ultra High Vacuum UV: Ultraviolet UVL: Ultra Violet Lithography VIS/IR: Visible / Infrared X-ARP: eXperimental – All Resist Positive (resist) ZnSe: Zincum Selenide

xi
LIST OF TABLES
Tables
Table 1 IR-Active Markers for Proteins. .............................................................................................. 11
Table 2 IR-Active Markers for Lipids. .................................................................................................. 12
Table 3 IR-Active Markers for Nucleic Acids in solution. ............................................................... 13
Table 4 IR-Active Markers for Carbohydrates. ................................................................................... 14
Table 5 Morphological and chemical features of prokaryotic and eukaryotic Cells [11] ........... 15
Table 6 Mechanical, physical, chemical and optical properties of commonly employed
IR windows .................................................................................................................................. 29
Table 7 Tested lithographical conditions on a 5 µm thin film of X-ARP 3100/10 spin
coated on silicon at 5000 rpm. ................................................................................................. 41
Table 8 Biocompatibility Test on U937 ............................................................................................... 54
Table 9 Results of DiOC6 staining on U937 cells exposed to the different
photoresists and coatings. ......................................................................................................... 55
Table 10 Effects of fixation on bio samples evaluated via vibrational spectroscopies.
Adapted from [72] ...................................................................................................................... 63
Table 11 Apoptosis Test on U937 ......................................................................................................... 82

xii

xiii
ACKNOWLEDGMENTS
I would like to thank many people who helped me during these years. Thanks to my
parents and my grandmother, thank you for your support and affection, without which I
wouldn't be able to achieve this goal.
Thanks to Synchrotron Trieste, to IOM-CNR and to SISSI and LILIT beamlines’ groups
for permitting and supporting my PhD.
I prefer not to bother the reader with a long list of names: they would be really too many;
so, in order to include everybody and not to forget anyone, I would like to say thanks to all my
friends and to all the people I met here during my journey, all you have demonstrated to be
wonderful colleagues, but, what is much more important, amazing friends... So THANK YOU,
I owe you really a lot!!!!

xiv

1
Aim of the thesis
In the post-genomic era there is a great need to understand the structure and dynamics of
macromolecules, not just single molecules but also their multiple complex interactions as a part
of a biological system using a multidisciplinary approach known as systems biology [1]. It is
therefore not surprising that in recent years several Nobel Prizes have been awarded to
scientists who have further developed well established analytical techniques for the study of
biological systems including mass spectrometry, NMR spectroscopy, magnetic resonance
imaging and fluorescence microscopy. Chemistry 2002 was awarded "for the development of
methods for identification and structure analyses of biological macromolecules" with one half
jointly to John B. Fenn and Koichi Tanaka "for their development of soft desorption ionisation
methods for mass spectrometric analyses of biological macromolecules" and the other half to
Kurt Wüthrich "for his development of nuclear magnetic resonance spectroscopy for
determining the three-dimensional structure of biological macromolecules in solution". In 2003
Paul C. Lauterbur and Sir Peter Mansfield won the Nobel Prize in Physiology or Medicine “for
their discoveries concerning magnetic resonance imaging" while the Chemistry Nobel Prize in
2008 was awarded to Osamu Shimomura, Martin Chalfie and Roger Y. Tsien "for the discovery
and development of the green fluorescent protein, GFP".
There is no doubt that the development of new analytical techniques as well as the more
effective utilisation of existing methods is vital for obtaining a better picture of the details of
2
bio-molecules and/or bio-processes, part of the entangled network of the biological
organization. However, the complexity of biological systems is such that no single experimental
method can provide information on all aspects of molecular structure and function. There is a
large variety of spectroscopic techniques for the characterization of biological systems. Some
can be used to carry out analysis in both in vivo and in vitro whereas others are restricted, at least
currently, to one particular environment. The timescales of these techniques can be very
different; some require the use of probes, whereas others do not. Clearly, no single technique is
perfect and each has its advantages and disadvantages.
For example, among the microscopy techniques routinely employed for the
characterization of biological samples, fluorescence microscopy can be operated both in vivo
and in vitro and it is extremely selective; however, it requires the employment of fluorescent
labels that could alter cell-physiology [2]. Raman microscopy is a label-free vibrational method
of analysis that, similarly to fluorescence microscopy, can be operated with sub-micrometer
spatial resolution; however, under non resonant conditions, the signal to noise ratio of Raman
spectra is usually quite low [3] while the laser power delivered can damage a bio-specimen by
sample-heating and/or photoproducts generation [4]. InfraRed MicroSpectroscopy (IRMS) is
also a label-free vibrational method. Compared to Raman, IRMS is very sensitive and not
damaging but its bio-applications have been limited by the strong water absorption features and
by the low spatial resolution. The possibility to exploit the high brilliance of Synchrotron
Radiation (SR) sources has allowed reaching the diffraction limit of the technique, bringing
IRMS to a new life. Therefore, nowadays the water absorption represents the major barrier
toward the full exploitation of IRMS diagnostic capabilities in the field of life sciences.
The aim of this PhD is to monitor by SR IRMS real-time biochemical changes in
individual living cells without the need of any marker, through the overcoming of the “water
absorption barrier”. The goal has been achieved by pursuing a microfabrication strategy for
producing IR-Vis transparent microfluidic devices suitable for SR IRMS analysis of circulating
leucocytes, undergoing both mechanical and chemical stimulation. Commercial demountable
liquid cells, realized by holding apart two optical windows with micrometer thick spacers of
Mylar, polyamide or Teflon, do not guarantee the precise control on and the long-range
reproducibility of the optical path, both fundamental for an accurate water subtraction in order
to disclose cellular IR features.
The present manuscript reports on the experimental activity and results of my PhD and it
is organized as in the following.
3
In the Chapter 1, Introduction, a short overview on Fourier Transform InfraRed
spectroscopy (FTIR) principles is given. The emphasis is put on the understanding of IRMS
basis and on the more recent improvements of the technique, such as the exploitation of bright
infrared SR sources. Details on the biochemical and biological applications of IRMS are given,
focusing the attention on biological data analysis and interpretation. The so-called “water
absorption barrier” is described and jointly I present the reason for the strategy we followed for
overcoming such a limit. Since microfabrication marks a turning point, some basic concepts of
microfabrication are explained, helpful for a better understanding of the experimental part of
this thesis. In Chapter 1, the topic of mechano-biology of leucocytes is also introduced, with
special attention to the deformations white-blood cells are subjected both during micro capillary
circulation and bloodstream extravasation in response a chemical gradient.
In the Chapter 2, Microfluidic device fabrication, is discussed the progress beyond the state of
the art in the field of microfabrication of Vis-IR transparent materials. Then there is the
description of devices used for the measurements performed during the PhD Thesis, both static
and fluidic, documenting both design choices and fabrication procedures.
In the Chapter 3, Immune system studied by SR IRMS, are described the experiments of
mechanobiology done during the thesis. First of all, I illustrate the differences between
measuring fixed cells in respect to living ones, highlighting not only the advantage of following
in real time a biological process, but also the artefacts and limitations induced by the fixing
protocols themselves. Then I report the biochemical changes undergone by living leucocytes
subjected to deformation and I compare them with those of chemically stimulated white blood
cells, lead to deform in response of an inflammation process. Moreover I present experiments
where the cellular apoptosis have been induced and monitored, comparing the achieved results
with those coming from a well established analytical technique such as the flow-cytometry.
A summary of the obtained results along with the future perspectives of the started activity
is presented in Chapter 4, Conclusions.

4
5
CHAPTER 1
Introduction
The aim of this chapter is to summarize some basic concepts at the base of infrared
spectroscopy, microfabrication and immunology, devoting a special attention to IRMS, to
microfluidics and to the role of human leucocytes in immune response respectively. It is beyond
the purpose of this Thesis to go into details of each subject, but this Chapter has been written
to provide the reader with the fundamental knowledge for each topic, needed for a critical
reading of manuscript.
1.1 Infrared Spectroscopy
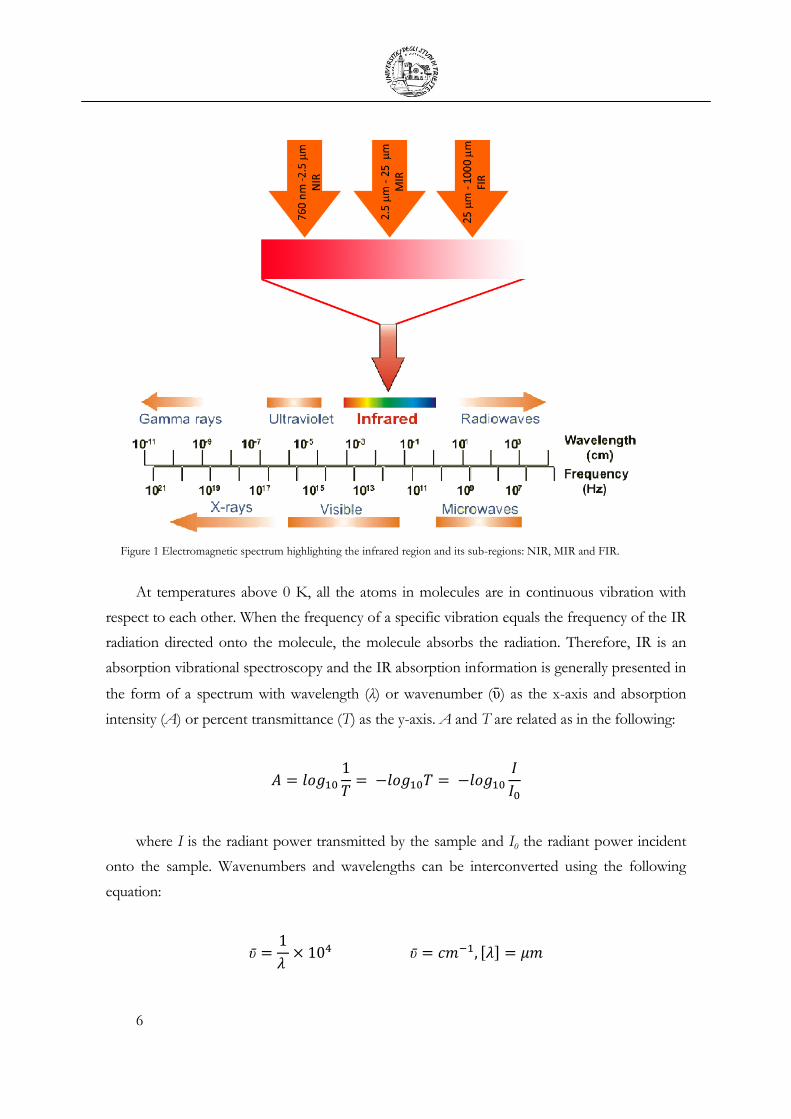
The infrared regime covers a quite broad range of frequencies, extending from visible to
microwaves. It is conventionally divided in three main regions, the near (NIR), the mid (MIR)
and the far (FIR) infrared. From here on, we will concentrate on MIR, the region of
wavenumbers from 4000 to 400 cm-1, since the energies involved, from about 1 to 10
Kcal/mol, correspond to the vibrational energies of the organic molecules, leading actors of the
biochemistry of life.
6
Figure 1 Electromagnetic spectrum highlighting the infrared region and its sub-regions: NIR, MIR and FIR.
At temperatures above 0 K, all the atoms in molecules are in continuous vibration with
respect to each other. When the frequency of a specific vibration equals the frequency of the IR
radiation directed onto the molecule, the molecule absorbs the radiation. Therefore, IR is an
absorption vibrational spectroscopy and the IR absorption information is generally presented in
the form of a spectrum with wavelength (λ) or wavenumber (ῡ) as the x-axis and absorption
intensity (A) or percent transmittance (T) as the y-axis. A and T are related as in the following:
where I is the radiant power transmitted by the sample and I0 the radiant power incident
onto the sample. Wavenumbers and wavelengths can be interconverted using the following
equation:
7
The absorption intensity, A, is proportional to the molar concentration of the sample, C,
and the optical path, b, through the molar extinction coefficient, ε, according to the Lambert
Beer law:
Each atom in a molecule has three degrees of freedom, corresponding to motions along
each of the three Cartesian axes (x, y, and z). Consequently a polyatomic molecule of n atoms
has 3n total degrees of freedom. Three degrees of freedom are required to describe the
translation motion of the entire molecule through space and other three describe the whole
molecule rotation. The remaining 3n – 6 degrees of freedom are the fundamental vibrations for
nonlinear molecules; linear molecules possess 3n – 5 fundamental vibrational modes because
only 2 degrees of freedom are sufficient to describe the entire molecule rotation. Among the 3n
– 6 (or 3n – 5) fundamental vibrations (also known as normal modes of vibration), only those
that produce a net change in the dipole moment are IR active. The larger this change, the higher
the molar extinction coefficient and more intense the absorption band will be. Those vibrations
that produce polarizability changes give rise to Raman activity; evidentially, some vibrations can
be both IR- and Raman-active [5].
Vibrations can involve either a change in bond length or in bond angle, known as
stretching and bending respectively. When the bonds stretch in-phase, the stretching is defined
symmetric (νs), asymmetric in the case of a stretching out-of-phase (νas). The bending vibration
that determines a variation of the angle between two bonds is known as scissoring or
deformation, that is the only bending vibration for the water molecule, H2O (see Figure 2).
Rocking, wagging and twisting are bending vibrations that produce a change in angle between
the plane defined by the group of atoms and the rest of the molecule. Molecules that have a
preferred orientation, that cannot freely rotate, can however revolve slightly back and forth with
respected to the “fixed” orientation; such a type of reciprocal motion is known as libration. It is
the case of liquid water, where the network of hydrogen bonding is imposing a preferential
orientation; librations modes of water are shown in Figure 2.

8
Figure 2 Vibrational modes of water molecule.
Adapted from http://www.btinternet.com/~martin.chaplin/vibrat.html
The total number of observed IR absorption bands is generally different from the total
number of active fundamental vibrations. A reduction can be appreciated when a single
frequency causes more than one mode of motion to occur. Conversely, additional bands can be
seen, such as:
Overtones, integral multiples of the fundamental absorption frequencies;
Combinations of fundamental frequencies;
Differences of fundamental frequencies;
Coupling interactions of two fundamental absorption frequencies;
Coupling interactions between fundamental vibrations and combination bands
(Fermi resonance).
The intensities of overtone, combination, and difference bands are lower than those of the
fundamental bands. The blending of all the bands thus creates a unique IR spectrum for each
compound.
1.2 Biochemical and biological applications of infrared spectroscopy
Infrared spectroscopy has been widely employed in the last decades for the
characterization of isolated molecules of biological interest, which are proteins, lipids,
carbohydrates and nucleic acids. Since such species are macromolecules, the number of IR
active fundamental vibration is huge and their infrared spectra would result rather complex.
However, due to the strong overlapping of the vibrational bands, the spectra are surprisingly
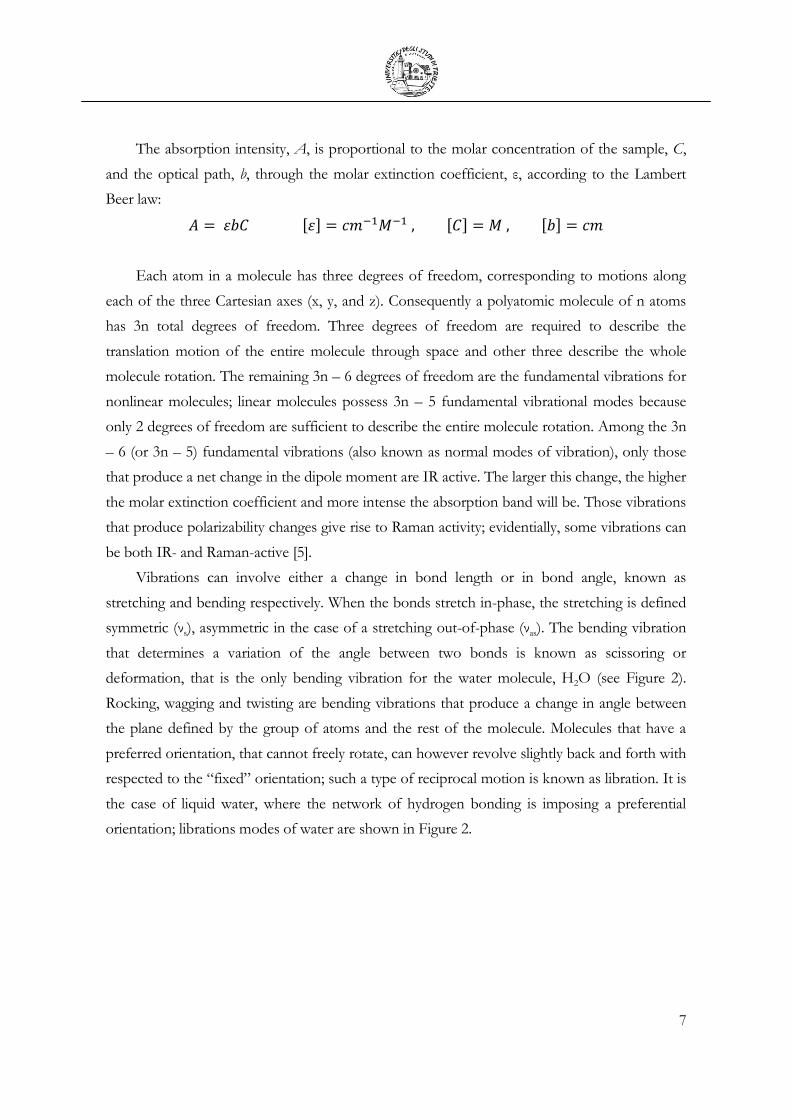
simple and region diagnostic for each macromolecule can be identified (see Figure 3).
9
Figure 3 Representative spectra of the main bio-macromolecules. For each representative spectrum, sideways is sketched the structure of a representative molecule of the class considered: the tri-peptide Ala-Leu-Phe for proteins; a diacyl phospholipid for lipids; the nucleobasis adenine-cytosine for nucelic acids; the disaccharide maltose for carbohydrates. Adapted from [6]
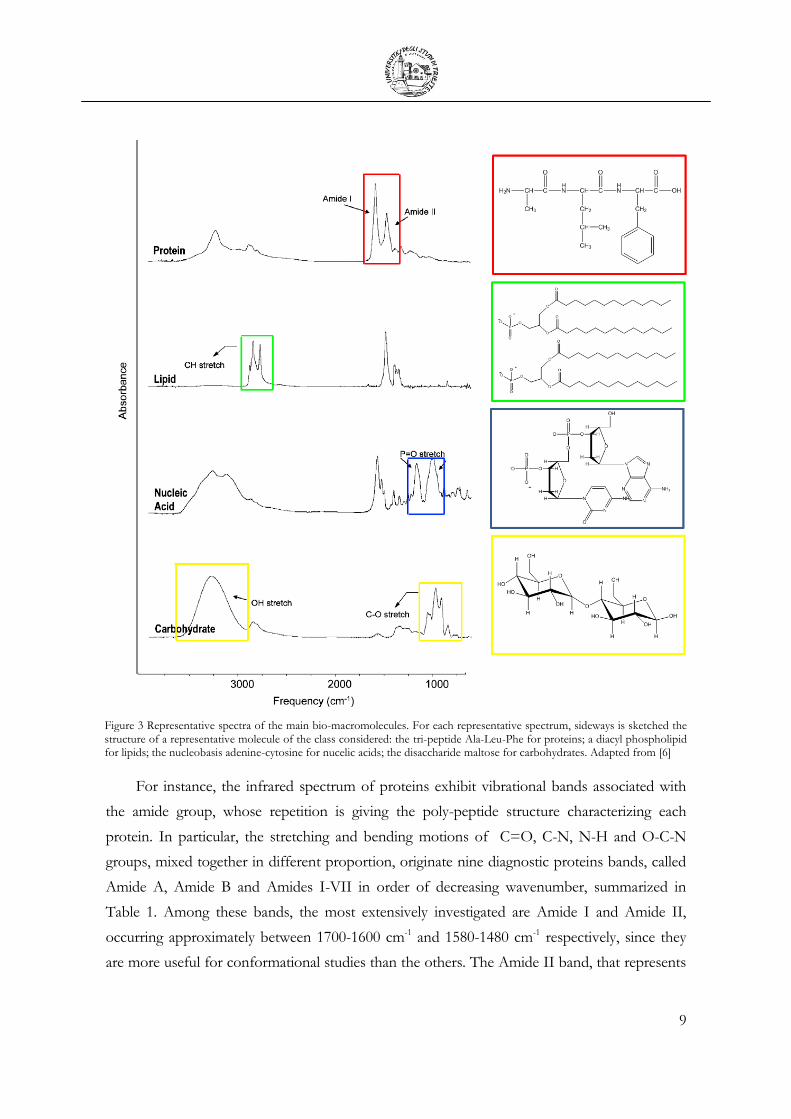
For instance, the infrared spectrum of proteins exhibit vibrational bands associated with
the amide group, whose repetition is giving the poly-peptide structure characterizing each
protein. In particular, the stretching and bending motions of C=O, C-N, N-H and O-C-N
groups, mixed together in different proportion, originate nine diagnostic proteins bands, called
Amide A, Amide B and Amides I-VII in order of decreasing wavenumber, summarized in
Table 1. Among these bands, the most extensively investigated are Amide I and Amide II,
occurring approximately between 1700-1600 cm-1 and 1580-1480 cm-1 respectively, since they
are more useful for conformational studies than the others. The Amide II band, that represents

10
mainly the N-H bending (~60%) with a contribution coming from C-N stretching (~40%), can
provide useful information about the accessibility of the solvent to the protein backbone. As a
matter of fact, Amide II band shifts lower of about 100 cm-1, from ~1550 to ~1450 cm-1, as a
consequence of the protein deuteration. Highly ordered proteins, such as α-helix or β-sheet rich
structure, have a reduced probability of exchange the N-H proton with deuterium, preventing a
complete deuteration, therefore diagnostic of a tightly ordered protein. However, the Amide I is
the most useful band for the characterization of the secondary protein structure. The Amide I
represents mainly the C=O stretching of peptide bond, with contributions from C-N stretching
(~10%) and N-H bending (~10%), and its position is sensitive to the network of hydrogen
bonds involving the carbonyl group, then to the protein secondary structure. The structure of a
protein is usually heterogeneous, composed by fragments with different conformation. For
such a reason, the Amide I is almost always a complex band, originating from the overlapping
of the different contributions coming from helix, sheet, turn and random domains. In Table 1
the assignment of each conformation is reported. The contribution of amino acid side chains to
the protein spectrum is usually negligible, with expectation of the methyl/methylene stretching
and bending regions, 3000-2800 and 1480-1360 cm-1 respectively.
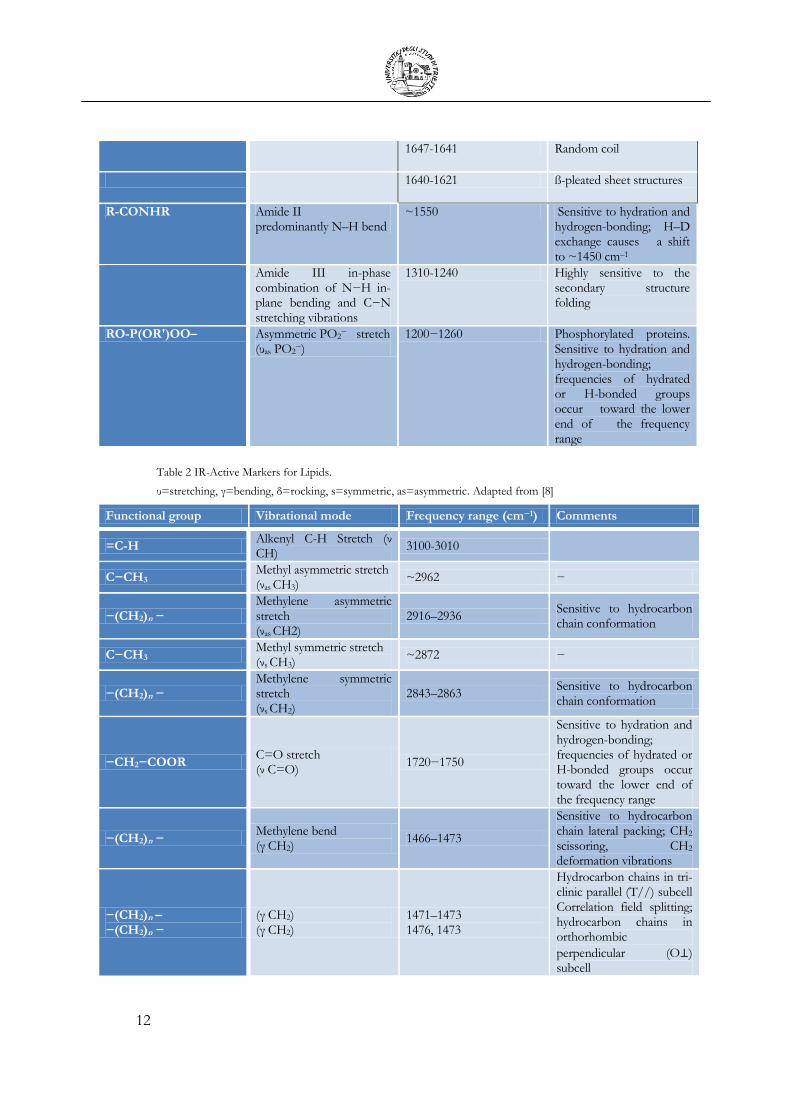
Lipids are probably the more heterogeneous class of natural occurring molecules. They are
small biomolecules, hydrophobic or amphiphilic, with different structure and multiple biological
functions. The ones in which we are more interest are those constituting the membranes of
eukaryotic cells: phospholipids, glycolipids, and cholesterols. The proportion of the three
classes is dependent on the cell type, but phospholipids are the most abundant in the majority
of eukaryotic cells. Phospholipids are amphipathic molecules having a hydrophilic head and
hydrophobic tails. The head contains the negatively charged phosphate group while the tail
usually consists of long hydrocarbon chains (see Figure 3). An interface region characterized by
the C=O ester group can also be recognized. The major vibrational modes of phospholipids are
reported in Table 2. The fatty acid tails originate the bands associated to the stretching and
bending of C-Hn groups: - CH3 methyl, -CH2 methylene and alkenyl =C-H stretch. The
strongest bands in a lipid spectrum are usually those of symmetric and asymmetric stretching of
methylene moieties, the most abundant in the acyl chains. The ratio between the stretching
bands can be indicative of the acyl chain ramification and/or instauration while their position is
diagnostic for the chain conformation (gauche/trans). Among the vibrational modes diagnostic
for the phosphate head reported in Table 2, the more intense are due to asymmetric and
symmetric stretching of PO2-, at around 1228 and 1084 cm-1 respectively. Finally, the 1750-1700
cm-1 region is diagnostic for the C=O stretching mode of the two carbonyl ester group of diacyl
11
lipids. The shift of this band from ~1740 to ~1730 cm-1 reflects the gauche-bend of one of the
acyl chains in order to make them parallel. In Table 2 some bands characteristic of lipid
organized in membrane structures are also reported.
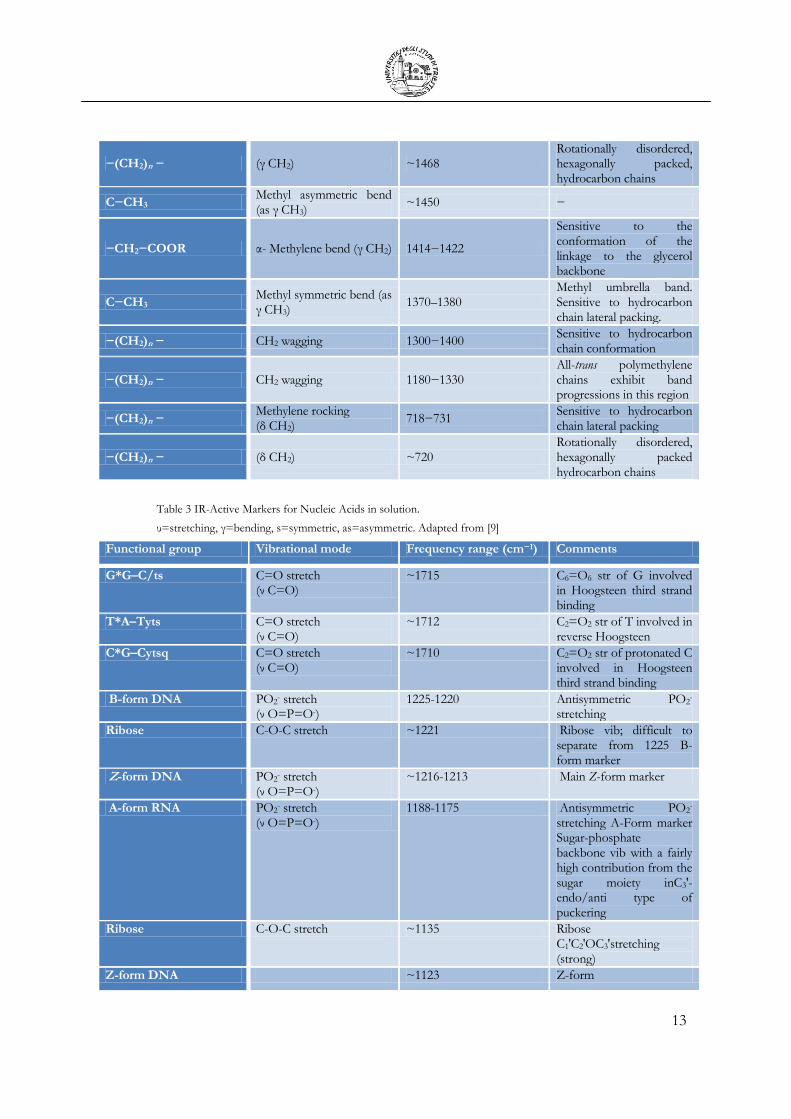
Nucleic acids can be classified in two main categories: deoxyribonucleic acid (DNA) and
ribonucleic acid (RNA). They are both linear polymers whose repetitive unit is known as
nucleotide. Each nucleotide is the assembly of three components: a phosphate group, a pentose
sugar and a nucleobase. The sugar-phosphate alternation through a phosphodiester linkage
originates the nucleic acid backbone. DNA and RNA differ for: i- the pentose sugar, 2'-
deoxyribose for DNA and ribose for RNA; ii- the nucleobases: adenine, cytosine, guanine and
thymine in DNA while uracil substitutes thymine in RNA; iii- DNA molecules are double-
stranded and RNA molecules are single-stranded. In the 1800-1500 cm-1 region fall the bands
of purinic and pyrimidinic bases, sensitive to base-paring and base-stacking effects (nucleic acid
secondary structure). In the 1250-1000 cm-1 region, the PO2- group of phosphate nucleotide
moiety gives rise to two bands, symmetric and asymmetric stretching, diagnostic for nucleic acid
conformation changes (nucleic acid tertiary structure). For more details see Table 3.
For an animal eukaryotic cell only the 6-8% of its dry mass is constituted by carbohydrates
while this percentage rise up to almost 80% for plant cells. Polysaccharides are characterized by
hydroxyl groups as well as by the C-O-C ether linkage and the pseudo-ether C-O-C of sugar
rings. The ether and pseudo-ether bonds along with the C-O stretch of C-OH sugar groups
give rise to a complex series of bands, localized below 1200 cm-1. Active markers for
carbohydrates are reported in Table 4.
Table 1 IR-Active Markers for Proteins.
υ=stretching, γ=bending, s=symmetric, as=asymmetric. Adapted from [7]
Functional group Vibrational mode Frequency range (cm−1) Comments
R-NH Amide A( ν N-H) Amide B( ν N-H)
~3300 ~3100
N-H stretching, in resonance with overtone (2x Amide II)
R-CONHR Amide I predominantly (ν C=O)
1610−1695 Sensitive to hydration and hydrogen-bonding;
1692-1681 Turns and Bends
1671-1679 Resulting from antiparallel pleated sheets and ß-turns of proteins
1671-1658 Turns and Bends
1657-1651 α-helical structures
12
1647-1641 Random coil
1640-1621 ß-pleated sheet structures
R-CONHR Amide II predominantly N–H bend
~1550 Sensitive to hydration and hydrogen-bonding; H–D exchange causes a shift to ~1450 cm–1
Amide III in-phase combination of N−H in-plane bending and C−N stretching vibrations
1310-1240 Highly sensitive to the secondary structure folding
RO-P(OR′)OO– Asymmetric PO2− stretch
(υas PO2−)
1200−1260 Phosphorylated proteins. Sensitive to hydration and hydrogen-bonding; frequencies of hydrated or H-bonded groups occur toward the lower end of the frequency range
Table 2 IR-Active Markers for Lipids.
υ=stretching, γ=bending, δ=rocking, s=symmetric, as=asymmetric. Adapted from [8]
Functional group Vibrational mode Frequency range (cm−1) Comments
=C-H Alkenyl C-H Stretch (ν CH)
3100-3010
C−CH3 Methyl asymmetric stretch (νas CH3)
~2962 −
−(CH2)n − Methylene asymmetric stretch (νas CH2)
2916–2936 Sensitive to hydrocarbon chain conformation
C−CH3 Methyl symmetric stretch (νs CH3)
~2872 −
−(CH2)n − Methylene symmetric stretch (νs CH2)
2843–2863 Sensitive to hydrocarbon chain conformation
−CH2−COOR C=O stretch (ν C=O)
1720−1750
Sensitive to hydration and hydrogen-bonding; frequencies of hydrated or H-bonded groups occur toward the lower end of the frequency range
−(CH2)n − Methylene bend (γ CH2)
1466–1473
Sensitive to hydrocarbon chain lateral packing; CH2 scissoring, CH2 deformation vibrations
−(CH2)n – −(CH2)n −
(γ CH2) (γ CH2)
1471–1473 1476, 1473
Hydrocarbon chains in tri-clinic parallel (T//) subcell Correlation field splitting; hydrocarbon chains in orthorhombic
perpendicular (O⊥) subcell
13
−(CH2)n − (γ CH2) ~1468 Rotationally disordered, hexagonally packed, hydrocarbon chains
C−CH3 Methyl asymmetric bend (as γ CH3)
~1450 −
−CH2−COOR α- Methylene bend (γ CH2) 1414−1422
Sensitive to the conformation of the linkage to the glycerol backbone
C−CH3 Methyl symmetric bend (as γ CH3)
1370–1380 Methyl umbrella band. Sensitive to hydrocarbon chain lateral packing.
−(CH2)n − CH2 wagging 1300−1400 Sensitive to hydrocarbon chain conformation
−(CH2)n − CH2 wagging 1180−1330 All-trans polymethylene chains exhibit band progressions in this region
−(CH2)n − Methylene rocking (δ CH2)
718−731 Sensitive to hydrocarbon chain lateral packing
−(CH2)n − (δ CH2) ~720 Rotationally disordered, hexagonally packed hydrocarbon chains
Table 3 IR-Active Markers for Nucleic Acids in solution.
υ=stretching, γ=bending, s=symmetric, as=asymmetric. Adapted from [9]
Functional group Vibrational mode Frequency range (cm−1) Comments
G*G–C/ts C=O stretch (ν C=O)
~1715 C6=O6 str of G involved in Hoogsteen third strand binding
T*A–Tyts C=O stretch (ν C=O)
~1712 C2=O2 str of T involved in reverse Hoogsteen
C*G–Cytsq C=O stretch (ν C=O)
~1710 C2=O2 str of protonated C involved in Hoogsteen third strand binding
B-form DNA PO2- stretch
(ν O=P=O-) 1225-1220 Antisymmetric PO2
- stretching
Ribose C-O-C stretch ~1221 Ribose vib; difficult to separate from 1225 B-form marker
Z-form DNA PO2- stretch
(ν O=P=O-) ~1216-1213 Main Z-form marker
A-form RNA PO2- stretch
(ν O=P=O-) 1188-1175 Antisymmetric PO2
- stretching A-Form marker Sugar-phosphate backbone vib with a fairly high contribution from the sugar moiety inC3'-endo/anti type of puckering
Ribose C-O-C stretch ~1135 Ribose C1'C2'OC3'stretching (strong)
Z-form DNA ~1123 Z-form
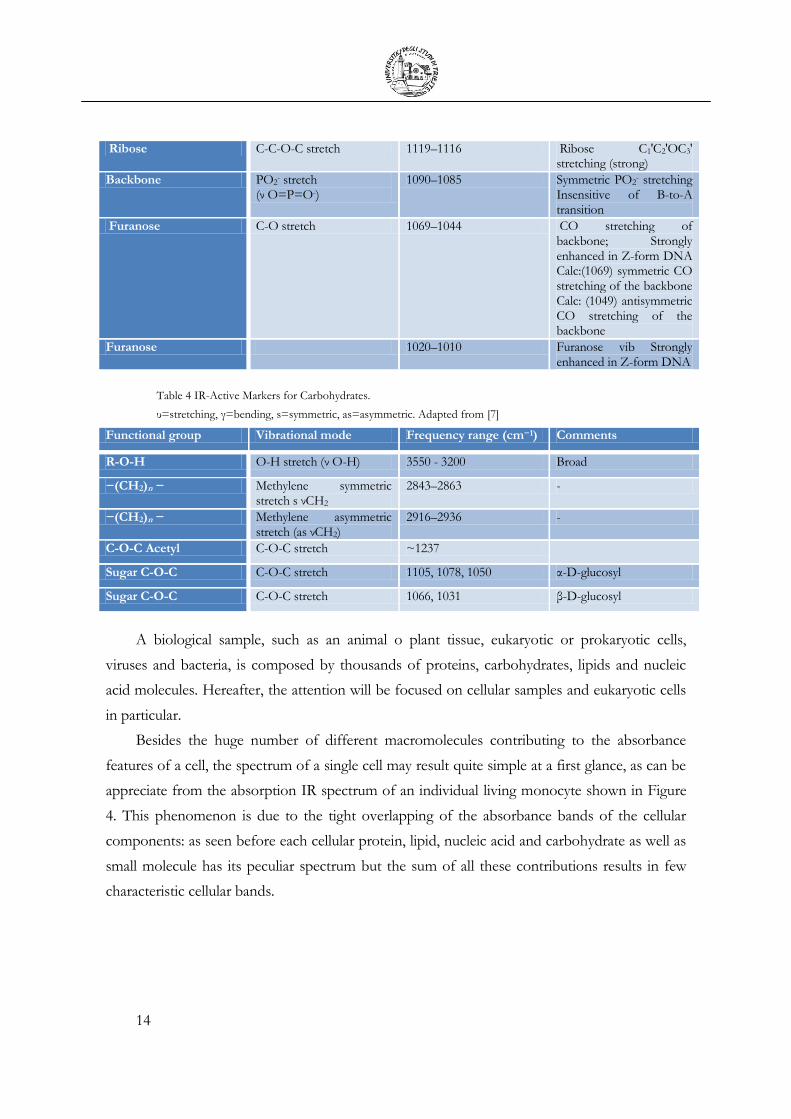
14
Ribose C-C-O-C stretch 1119–1116 Ribose C1'C2'OC3' stretching (strong)
Backbone PO2- stretch
(ν O=P=O-) 1090–1085 Symmetric PO2
- stretching Insensitive of B-to-A transition
Furanose C-O stretch 1069–1044 CO stretching of backbone; Strongly enhanced in Z-form DNA Calc:(1069) symmetric CO stretching of the backbone Calc: (1049) antisymmetric CO stretching of the backbone
Furanose 1020–1010 Furanose vib Strongly enhanced in Z-form DNA
Table 4 IR-Active Markers for Carbohydrates.
υ=stretching, γ=bending, s=symmetric, as=asymmetric. Adapted from [7]
Functional group Vibrational mode Frequency range (cm−1) Comments
R-O-H O-H stretch (ν O-H) 3550 - 3200 Broad
−(CH2)n − Methylene symmetric stretch s νCH2
2843–2863 -
−(CH2)n − Methylene asymmetric stretch (as νCH2)
2916–2936 -
C-O-C Acetyl C-O-C stretch ~1237
Sugar C-O-C C-O-C stretch 1105, 1078, 1050 α-D-glucosyl
Sugar C-O-C C-O-C stretch 1066, 1031 β-D-glucosyl
A biological sample, such as an animal o plant tissue, eukaryotic or prokaryotic cells,
viruses and bacteria, is composed by thousands of proteins, carbohydrates, lipids and nucleic
acid molecules. Hereafter, the attention will be focused on cellular samples and eukaryotic cells
in particular.
Besides the huge number of different macromolecules contributing to the absorbance
features of a cell, the spectrum of a single cell may result quite simple at a first glance, as can be
appreciate from the absorption IR spectrum of an individual living monocyte shown in Figure
4. This phenomenon is due to the tight overlapping of the absorbance bands of the cellular
components: as seen before each cellular protein, lipid, nucleic acid and carbohydrate as well as
small molecule has its peculiar spectrum but the sum of all these contributions results in few
characteristic cellular bands.

15
Figure 4 Representative IR spectrum of a living monocyte. The spectral regions more representative for lipids, proteins, nucleic acids and carbohydrates are shown. The assignment of the most important absorptions bands is also done.
The attribution of cellular vibrational bands has to be done taking in consideration not
only the position of the bands but also the cell type, eukaryotic or prokaryotic, the cell origin,
animal or vegetal, and, in the case of microscopy with sub-cellular lateral resolution, the sample
compartment investigated (see following section). For an animal eukaryotic cell, such as the one
in the exemplificative spectrum of Figure 4, almost 70% of the cell weight is given by
intracellular water; the remaining dry mass is roughly constituted by 60% of proteins, 15-20 %
of lipids, 5% of nucleic acids, 10% of carbohydrates and the remaining 10% of a miscellaneous
of molecules, such as metabolites, salts, and others (Table 6) [10].
Table 5 Morphological and chemical features of prokaryotic and eukaryotic cells [11]
Bacteria Yeasts Animal Cells
Radius [μm] 1 10 100
Volume [μm3] 1 1000 >10 000
Surface/volume [μm-1] 1 0.1 tissue
Generation time [h] 0.2-10 1-10 20
DNA base-pairs 4 x 10⁶ 20 x 106 500-5000 x106
Number of "genes" 4000 20 000 >50 000
Size of ribosome 70 S 80 s 80 S
RNA % [w/w]on 10-20 ~ 3 3-4
DNA % [w/w] 3-4 ~ 1 ~ 1
Proteins % [w/w] 40-60 50-60 60
Lipids % [w/w] 10-15 ~ 10 15-20
Polysaccharides % [w/w] 10-20 10-20 6-8
16
Because proteins constitute almost the 60% of the dry mass of an eukaryotic cell, the
spectral region between 1700 and 1500 cm-1, where Amide I e II bands are, can be considered
diagnostic of cellular proteins. As a matter of fact, in view of the low abundance of nucleic
acids, the contribution of purine and pyrimidine bases to this portion of the spectrum can be
considered minor. The spectral region below 1300 cm-1 is instead diagnostic for nucleic acids,
and especially for nucleic acid conformational changes. The asymmetric stretching band of PO2-
group is in a region almost free of other bands while the symmetric stretching band overlap
with the complex network of C-O stretching bands characterizing cellular carbohydrates.
However, for an animal cell, polysaccharide bands are only partially hindering the spectral
interpretation. Methyl and methylene moieties are present in almost each class of
macromolecules considered, proteins and lipids especially, but their abundance is significantly
higher for lipids. For such a reason the 3000-2800 cm-1 range is usually employed to carry out
cellular membrane studies. Information on cellular membrane order and fluidity can be drawn
out from the analysis of these bands as well as on membrane lipid composition, by taking
advantage also from the band centred at ~1730 cm-1, assigned to C=O stretching of
phospholipids.
Clearly, IR spectroscopy of complex bio-system is not a single-molecule detection
technique, such as fluorescence microscopy; however band intensity, position, width and shape
(band components) are sensitive to subtle biochemical changes affecting the most fundamental
cellular constituents. Changes in cellular protein conformation, in membrane order and
composition as well as in nucleic acid content can be deduced by spectral comparison, as
detailed in the previous paragraph. Such differences are usually so fine that the human eyes are
not able to appreciate them; therefore the simplistic approach of spectra comparison is not
useful for the analysis of bio-spectra, also because usually a statistical relevant number of
sampling has to be done.
Even if it was the 1911 when W.W. Coblentz, first, suggested that biological materials
could be analysed by infrared spectroscopy it was only in the 50s the spectroscopists
demonstrated the feasibility to characterize microorganisms, higher organized cells and even
tissues by infrared spectroscopy. Unfortunately, due to the lack of efficient computers and the
weak instrumental specifications at that time, reports on microorganisms and tissue
characterizations by infrared spectroscopy became less frequent in the 60s [12] and ceased in
the 70s [13]. It was thanks to the development of modern Fourier Transform InfraRed
spectroscopy (FTIR), to the availability of new powerful personal computers and to new
algorithms of multivariate statistical analysis that FTIR was again seen as a powerful tool for
17
characterizing biological relevant microbial and human cells, tissues, and body fluids in the last
twenty years.
Nowadays infrared spectra of plant, animal or human cells and tissues as well as of
microbial species are employed for differentiating microbial cells and strains [14], for
characterizing healthy and diseased tissues and/or cells [15], for studying phenomena
dependent on cellular growth and cell interaction with different agents such as drugs, pollutants,
poisons, chemotaxis agents [16] and for many other applications [17].
Moreover in recent years infrared spectroscopy is going through a renaissance catalysed by
some exciting developments in technology. This includes the use of the bright SR sources for
recording infrared spectra and the development of sampling strategies that allow combining the
chemo-structural information contained in an IR spectrum with the sample morphology
through the use of Visible-Infrared (Vis-IR) microscopes, which means with the development
of infrared microspectroscopy (IRMS).
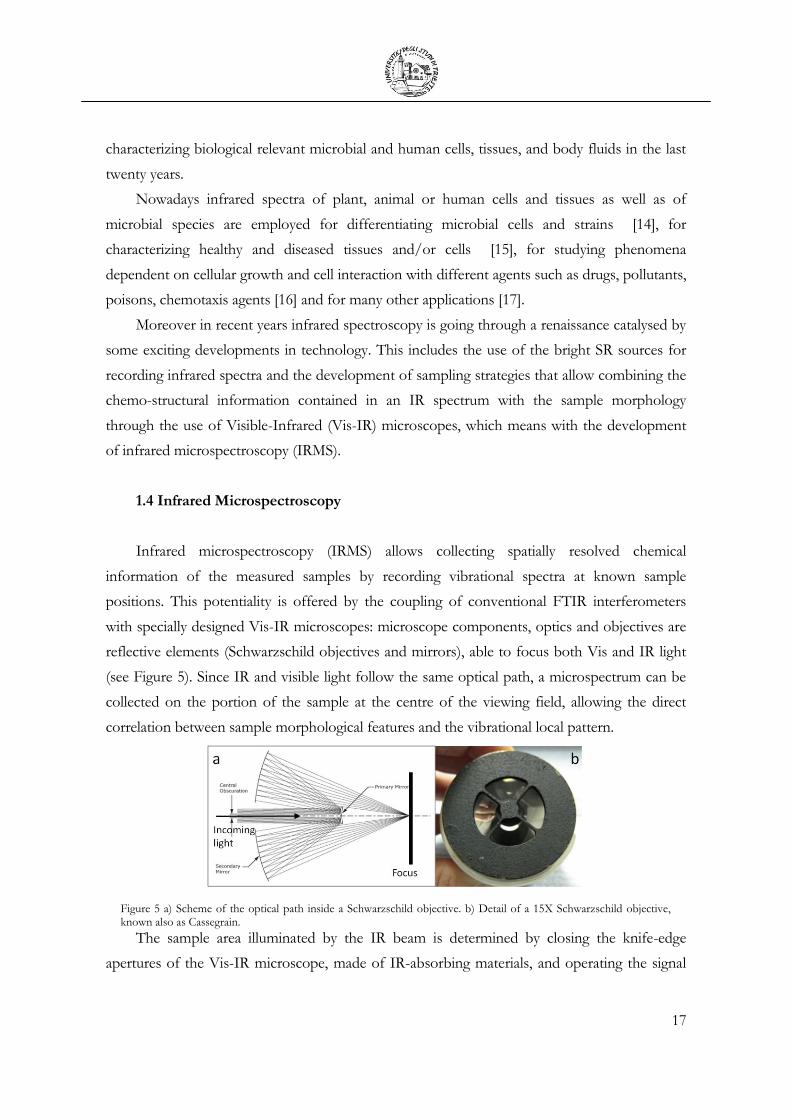
1.4 Infrared Microspectroscopy
Infrared microspectroscopy (IRMS) allows collecting spatially resolved chemical
information of the measured samples by recording vibrational spectra at known sample
positions. This potentiality is offered by the coupling of conventional FTIR interferometers
with specially designed Vis-IR microscopes: microscope components, optics and objectives are
reflective elements (Schwarzschild objectives and mirrors), able to focus both Vis and IR light
(see Figure 5). Since IR and visible light follow the same optical path, a microspectrum can be
collected on the portion of the sample at the centre of the viewing field, allowing the direct
correlation between sample morphological features and the vibrational local pattern.
Figure 5 a) Scheme of the optical path inside a Schwarzschild objective. b) Detail of a 15X Schwarzschild objective, known also as Cassegrain.
The sample area illuminated by the IR beam is determined by closing the knife-edge
apertures of the Vis-IR microscope, made of IR-absorbing materials, and operating the signal
18
acquisition by using a single-point detector, usually the liquid nitrogen cooled HgCdTe
(Mercury-Cadmium-Telluride, MCT). Vis-IR microscopes can operate both in transmission and
in reflection mode. In the transmission mode, the IR light is first focused on the sample by
using a first Cassegrain as condenser and then the transmitted light is collected by a second
Schwarzschild objective that collimates the beam, sending it to the detector. In the reflection
configuration, the same Schwarzschild objective is used for focusing the beam on the sample
and for collecting the reflected light. For doing that, half of the objective is obscured for the
incoming light by the same mirror that collects the reflected light. In such configuration, almost
the 50% of the incident light is lost, consequently decreasing the flux on the sample. Therefore,
the transmission configuration should be preferred if applicable.
Special objectives are designed for Grazing Incidence (GI) and Attenuated Total
Reflection (ATR) microspectroscopy, both sampling techniques surface-sensitive, usable for
very reflective and non-reflective substances respectively.
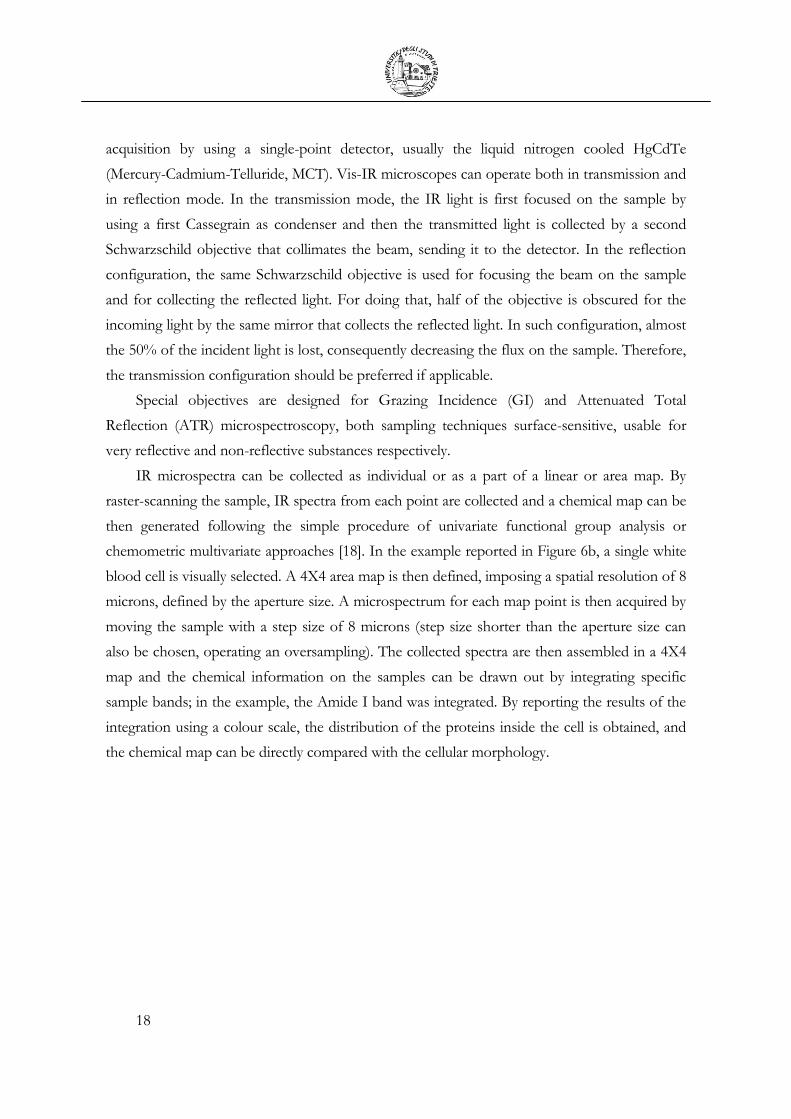
IR microspectra can be collected as individual or as a part of a linear or area map. By
raster-scanning the sample, IR spectra from each point are collected and a chemical map can be
then generated following the simple procedure of univariate functional group analysis or
chemometric multivariate approaches [18]. In the example reported in Figure 6b, a single white
blood cell is visually selected. A 4X4 area map is then defined, imposing a spatial resolution of 8
microns, defined by the aperture size. A microspectrum for each map point is then acquired by
moving the sample with a step size of 8 microns (step size shorter than the aperture size can
also be chosen, operating an oversampling). The collected spectra are then assembled in a 4X4
map and the chemical information on the samples can be drawn out by integrating specific
sample bands; in the example, the Amide I band was integrated. By reporting the results of the
integration using a colour scale, the distribution of the proteins inside the cell is obtained, and
the chemical map can be directly compared with the cellular morphology.
19
Figure 6 a) Bruker Hyperion 3000 Vis-IR microscope at SISSI beamline@Elettra Synchrotron Light Laboratory (Synchrotron Infrared Source for Spectroscopy and Imaging). b) The IR mapping procedure: a visible image is recorded and divided in a matrix of points (I). The knife-edge apertures of the microscope are closed to the desired lateral resolution and the sample is raster-scanned in order to collect an infrared spectrum from every point (II). By integrating specific bands of the acquired spectra (univariate functional group mapping), a map of the chemical distribution of the molecule of interest is obtained (III). (Optical path and scheme simplified)
IRMS is a diffraction limited microscopy technique [6]; on the basis of the Rayleigh
criterion [19], considering that most of the IR objectives-condensers have numerical apertures
ranging from 0.4 to 0.7, the diffraction-limited spatial resolution in the MIR (2.5-25µm) can be
estimated in the order of few microns.
However such a limit is practically achievable only taking advantage of the high brilliance
of Synchrotron Radiation (SR), that ensures to record spectra with appreciable Signal to Noise
ratio (S/N) at lateral resolutions of 10 microns or less [20]. More details on SR IR sources and
infrared beamlines will be given in the following paragraph.
Nowadays infrared MCT detector arrays (Focal Plane Arrays, FPA, or Linear Arrays) are
also employed with conventional IR Globar sources for FTIR imaging, which allow the fast
acquisition of large sample areas with high spatial resolution [21, 22]. The effective pixel size of
these detectors is some tenths of microns (~40 µm for a 64x64 pixel detector, with a Field of
View ~2.6 x 2.6 mm2 [17]); using 15X or 36X objectives a pixel resolution respectively of ~2.6
and ~1.1 µm is achievable (Figure 7). Since the Rayleigh criterion is still valid, chemical images
are affected by diffraction artefacts although the major drawback of these systems is the poor
spectral quality and the low signal to noise ratio [17]. Approaching the diffraction limit,

20
bidimensional detectors do not provide, in terms of S/N ratio, results comparable with SR
source and single point detector [23-26].
Figure 7 IR Imaging: a) Bruker Hyperion 3000 microscope equipped with FPA (Focal Plane Array) detector. b) Detail of the sensitive elements of the detector. c) Schematic flow chart of IR image acquisition (image integrated in respect of lipid bands (2800-3000 cm-1). (Optical path and scheme simplified)
1.5 Synchrotron Radiation Infrared Sources
In the last 20 years the number of infrared beamlines across the world, specifically
dedicated to bio applications have increased exponentially since the SR brightness offers the
unique opportunity to resolve spectral details at single-cell and even sub-cellular level. This has
provided comprehensive biochemical information on major cellular macro-compartments, such
as nuclear, perinuclear and cytoplasm regions, without radiation-induced damage as
demonstrated by Holman and co-workers [27].
Synchrotron is an electron storage ring that produces intense broadband light from Hard
X-rays through microwaves. Synchrotron light is emitted as relativistic electrons are accelerated
along a circular trajectory [28]. The brightness is defined as the photon flux per unit solid angle
and per unit source area. The natural divergence of IR light emitted by a storage ring (IRSR)
increases with the wavelength with a λ1/3 law [29], thus the photon angular distribution ranges
between 10 to 100 mrad in the infrared range. Therefore, a meaningful photon flux (1013 - 1014
photons/sec/0.1% bandwidth) is obtained in the infrared only using large extraction angles
[30]. The brightness gain of IRSR with respect to conventional infrared sources (ABR, Actual
Brilliance Ratio) has been addressed by many authors as the main figure of merit of an IRSR
21
beamline [29]. Data available in the literature show that ABR is of the order of 100 for the far-
infrared region (0.01 - 0.1 eV), but decreases to ~ 10 in the mid-infrared region (0.1- 1 eV),
where the thermal sources reach a maximum in the emitted intensity [31].
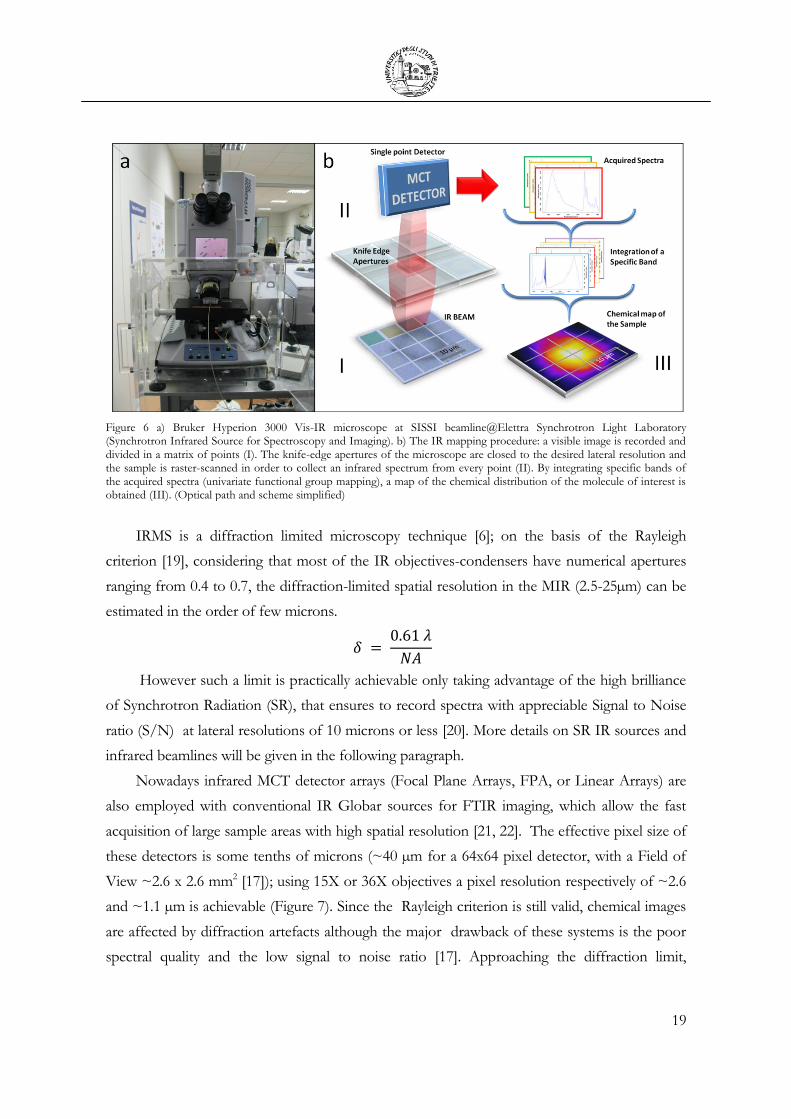
Figure 8 shows the intensity profile of the Globar source (on the left, a) and the IRSR
source (on the right, c) in the MIR for the IR beamline at Elettra, SISSI (Synchrotron Infrared
Source for Spectroscopy and Imaging) [32]. The brightness advantage can be clearly
appreciated.
Figure 8 a) Intensity profile of the Globar source on the FPA (Focal Plane Array) detector, collected using a 15X objective; measurements done at SISSI. b) Infrared signal through various aperture sizes comparing Elettra IR versus Globar source. Measurements done using a MCT detector c) Intensity profile of the SISSI IR beam on the FPA detector, collected using a 36X objective.
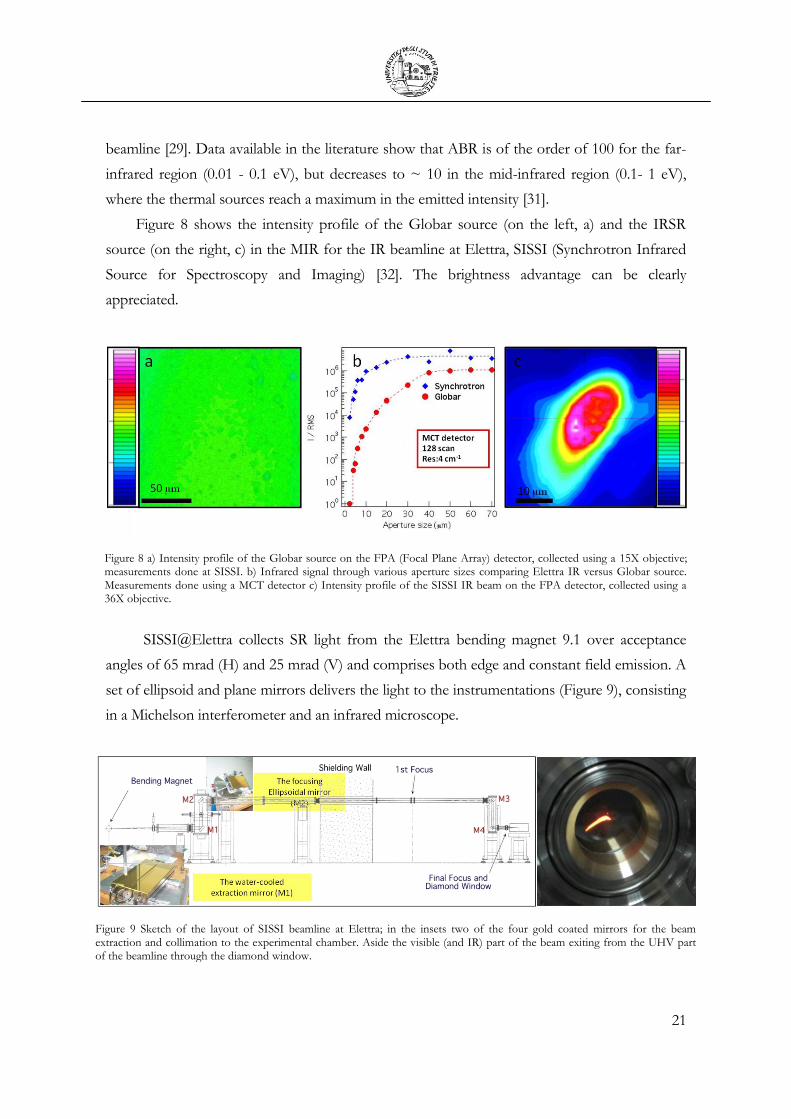
SISSI@Elettra collects SR light from the Elettra bending magnet 9.1 over acceptance
angles of 65 mrad (H) and 25 mrad (V) and comprises both edge and constant field emission. A
set of ellipsoid and plane mirrors delivers the light to the instrumentations (Figure 9), consisting
in a Michelson interferometer and an infrared microscope.
Figure 9 Sketch of the layout of SISSI beamline at Elettra; in the insets two of the four gold coated mirrors for the beam extraction and collimation to the experimental chamber. Aside the visible (and IR) part of the beam exiting from the UHV part of the beamline through the diamond window.
22
Before the last diamond window that separates the UHV part of the beamline from the
end station, there is an additional movable mirror that allows switching the IRSR to one of the
two measurement stations present at SISSI. The beamline, indeed, hosts two branches, one
designed to cover the whole IR range, from FIR to NIR, equipped with an IFS66v
interferometer and a Hyperion 2000 microscope, mostly dedicated to solid state physics and
high pressure studies; the second on the contrary is more dedicated to biological studies and it
is optimized for working in the MIR regime. The biobranch end station consists in a Bruker
VERTEX70 interferometer operated in controlled N2 environment and a Hyperion 3000
Visible/Infrared microscope, equipped with MCT single point detector and a FPA64x64 pixel
detector. The bio-branch of SISSI was employed for performing almost all the measurements
presented in this thesis.
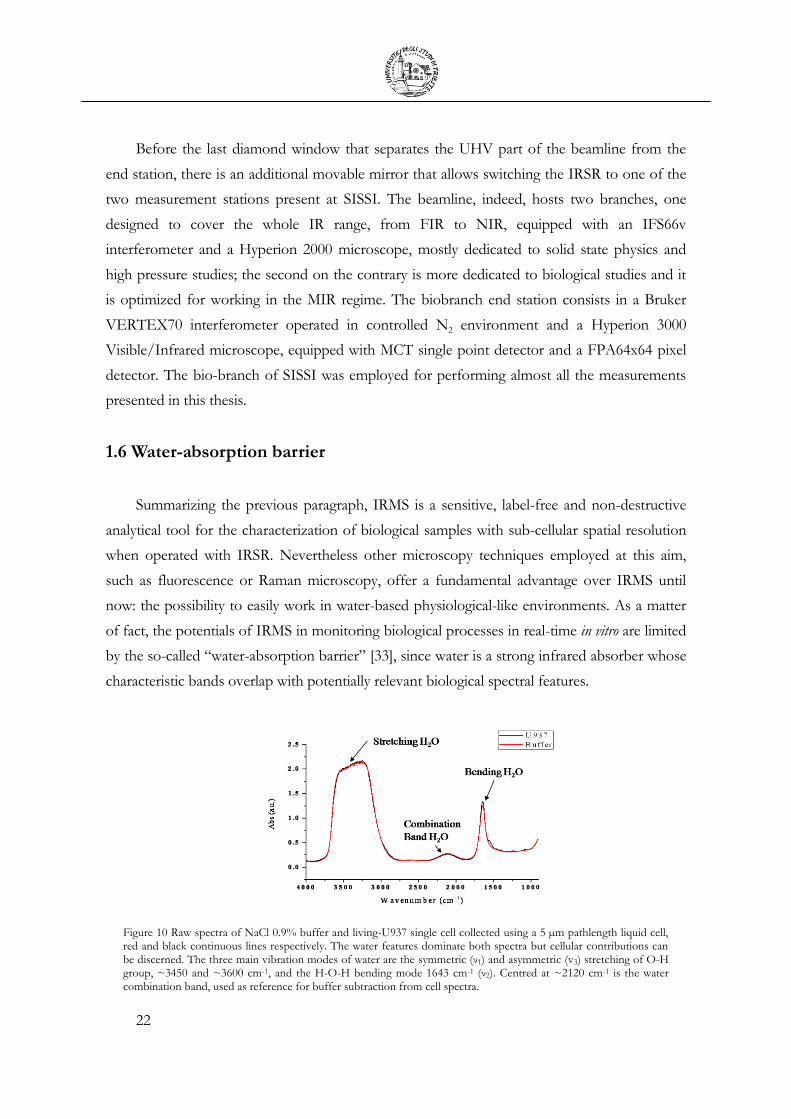
1.6 Water-absorption barrier
Summarizing the previous paragraph, IRMS is a sensitive, label-free and non-destructive
analytical tool for the characterization of biological samples with sub-cellular spatial resolution
when operated with IRSR. Nevertheless other microscopy techniques employed at this aim,
such as fluorescence or Raman microscopy, offer a fundamental advantage over IRMS until
now: the possibility to easily work in water-based physiological-like environments. As a matter
of fact, the potentials of IRMS in monitoring biological processes in real-time in vitro are limited
by the so-called “water-absorption barrier” [33], since water is a strong infrared absorber whose
characteristic bands overlap with potentially relevant biological spectral features.
Figure 10 Raw spectra of NaCl 0.9% buffer and living-U937 single cell collected using a 5 µm pathlength liquid cell, red and black continuous lines respectively. The water features dominate both spectra but cellular contributions can be discerned. The three main vibration modes of water are the symmetric (ν1) and asymmetric (v3) stretching of O-H group, ~3450 and ~3600 cm-1, and the H-O-H bending mode 1643 cm-1 (ν2). Centred at ~2120 cm-1 is the water combination band, used as reference for buffer subtraction from cell spectra.

23
The liquid water spectrum in the MIR is shown in Figure 10 (red curve) as acquired using a
5 μm liquid cell. An isolated water molecule possesses three vibrational modes, the symmetric
(ν1) and asymmetric (ν3) stretching of O-H group and the H-O-H bending mode (ν2). For water
in the liquid state, the ν2 band is centred at 1643 cm-1 while ν1 and ν3 are at ~3450 and ~3600
cm-1 respectively. The overlapping of these two contributions with the 2ν2 overtone is
originating the strongest multi-component absorption band of water in the MIR. This band is
clearly saturated in the shown spectra and only below 1 μm pathlength it can be recorded in the
linear absorbance regime [34]. One more band characteristic of liquid water can be recognized
at ~2127 cm-1, combination of ν2 with the librational bands, a broad band in the 800-500 cm-1
range, arising from a collective vibrational mode of water molecules [35]. The water bending
band overlaps with the Amide I band, crucial for determining the protein-folding conformation,
diagnostic for disease states or cellular viability, just as an example. The extinction coefficient of
water (εwater) in the 1700-1600 cm-1 region is about 20 L·mol-1·cm-1 [34], while the one of Amide
I is on average one order of magnitude higher [36]. However, the concentration of water
molecules in the sampled volume, defined by setting knife-edge apertures in order to match the
cells diameter, is much higher than the total protein concentration. Hence water accounts for
the large majority of the absorbance in the 1700-1600 cm-1, as can be appreciated from Figure
10, where the raw spectrum of a living monocyte is also shown (dark line). It is hard to give a
realistic estimation of the weight of this contribution, due to the extreme variability in protein
cellular concentration not only among different cell types but even for different cell cycle stages
[10]. Anyway, it is evident that Amide I band has to be disclosed by subtracting the water signal
for retrieving protein structural information that it carries on. It is worth mentioning that for an
accurate subtraction, the saturation of H2O bending band has to be avoided, implying optical
paths shorter that ~9 microns [37].
One possible approach often employed for limiting the spectral water contribution to
cellular spectra is the Attenuated Total Reflection (ATR) sampling technique [38]. Since the
penetration depth of the evanescent field is in the range of 1 micron or less, the water
absorbance is minimized but this also prevents the sampling of the entire cell volume, limiting
the spectral information to the outermost part of the cell [39, 40]. An alternative approach has
recently been proposed by Holman and co-workers [33] who built a gold-coated silicon open-
channel microfluidic device for measuring microbial cells in transflection mode. Besides the
“spectral artefacts” affecting transflectance spectra [41], the open channel geometry does not
offer a controlled environment. Demountable flow cells for microscopy measurements in
transmission have also been proposed, where very thin spacers of Mylar [42], polyamide [43] or

24
teflon [44] were employed to held apart two optical windows, CaF2, BaF2 or diamond [45].
These cells, anyway, do not offer the precise control on and the long-range reproducibility of
the optical path, which are fundamental for achieving a good accuracy in water subtraction.
Moreover, only very simple geometries with low spatial resolution can be obtained, limiting the
possible experimental designs.
We propose the full exploitation of microfabrication capabilities for the realization of Vis-
IR transparent microfluidic devices of any desired design for the measurement of living cells
undergoing both mechanical and chemical stimulation.
1.7. Microfabrication
The word microfabrication describes the ensemble of processes for the manufacturing of
systems with micrometric features. Born for the production of semiconductor devices in
integrated circuits (ICs), in the last 20 years the microfabrication expanded its frontiers through
MEMS (MicroElectronic Mechanical Systems) to bio-MEMS, specially designed fluidic
microsystems for the manipulation of biological matter and its analysis with a variety of
techniques (UV, fluorescence or electrochemical detection [46, 47]). The microfabrication
approach showed its peculiar advantage in being applied to biological and chemical fields,
mostly when microfluidic emerged as a new technological tool. Microfluidic is the science and
technology of manipulating fluids in networks of channels with dimension of ~5-500 µm [48],
with several advantages: it requires only small volume of samples and reagents, produces little
waste, permits the precise control of the sample environment. A microfabricated bio-MEMS
could include sorting, filtering and mixing capabilities as well as almost all the features required
for having a fully functional bio-laboratory in a single chip (micro Total Analysis System - µ-
TAS) [48, 49], but obviously with reduced dimensions compared with other analytical devices.
DNA chips, real-time PCR, cellular LOC for single-cell analysis are just some examples.
Multifunctional LOCs are highly integrated micro and nano-sized electro-fluidic devices
realized by using the microfabrication strategies developed in the field of IC technology. The
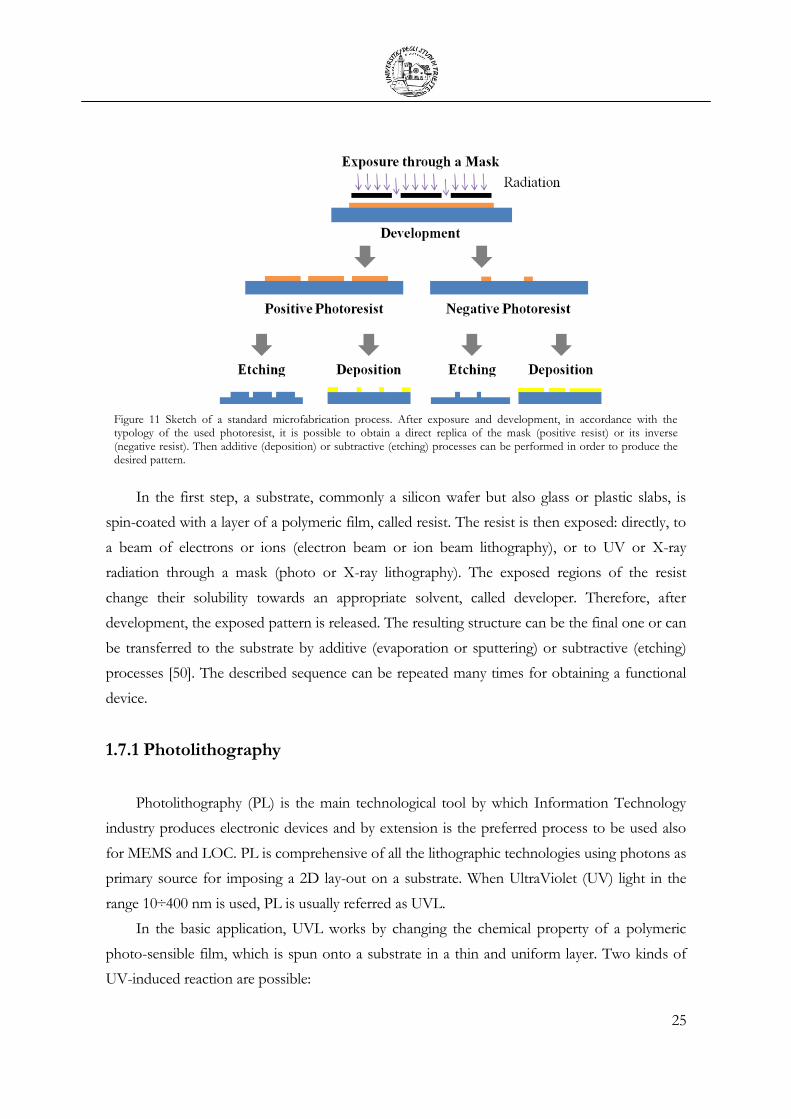
basic step sequence for such a technology is exemplified in Figure 11.
25
Figure 11 Sketch of a standard microfabrication process. After exposure and development, in accordance with the typology of the used photoresist, it is possible to obtain a direct replica of the mask (positive resist) or its inverse (negative resist). Then additive (deposition) or subtractive (etching) processes can be performed in order to produce the desired pattern.
In the first step, a substrate, commonly a silicon wafer but also glass or plastic slabs, is
spin-coated with a layer of a polymeric film, called resist. The resist is then exposed: directly, to
a beam of electrons or ions (electron beam or ion beam lithography), or to UV or X-ray
radiation through a mask (photo or X-ray lithography). The exposed regions of the resist
change their solubility towards an appropriate solvent, called developer. Therefore, after
development, the exposed pattern is released. The resulting structure can be the final one or can
be transferred to the substrate by additive (evaporation or sputtering) or subtractive (etching)
processes [50]. The described sequence can be repeated many times for obtaining a functional
device.
1.7.1 Photolithography
Photolithography (PL) is the main technological tool by which Information Technology
industry produces electronic devices and by extension is the preferred process to be used also
for MEMS and LOC. PL is comprehensive of all the lithographic technologies using photons as
primary source for imposing a 2D lay-out on a substrate. When UltraViolet (UV) light in the
range 10÷400 nm is used, PL is usually referred as UVL.
In the basic application, UVL works by changing the chemical property of a polymeric
photo-sensible film, which is spun onto a substrate in a thin and uniform layer. Two kinds of
UV-induced reaction are possible:
26
the UV light provokes chain scission events, reducing the mean molecular weight of the
polymer;
the UV light promotes the polymer cross-linking.
The first type of reaction is encountered in the so-called positive tone resist, while the
second is characteristic for the negative tone ones. The effect of UV illumination is to change
the solubility of the polymer towards an appropriate solvent, only in the area where the light
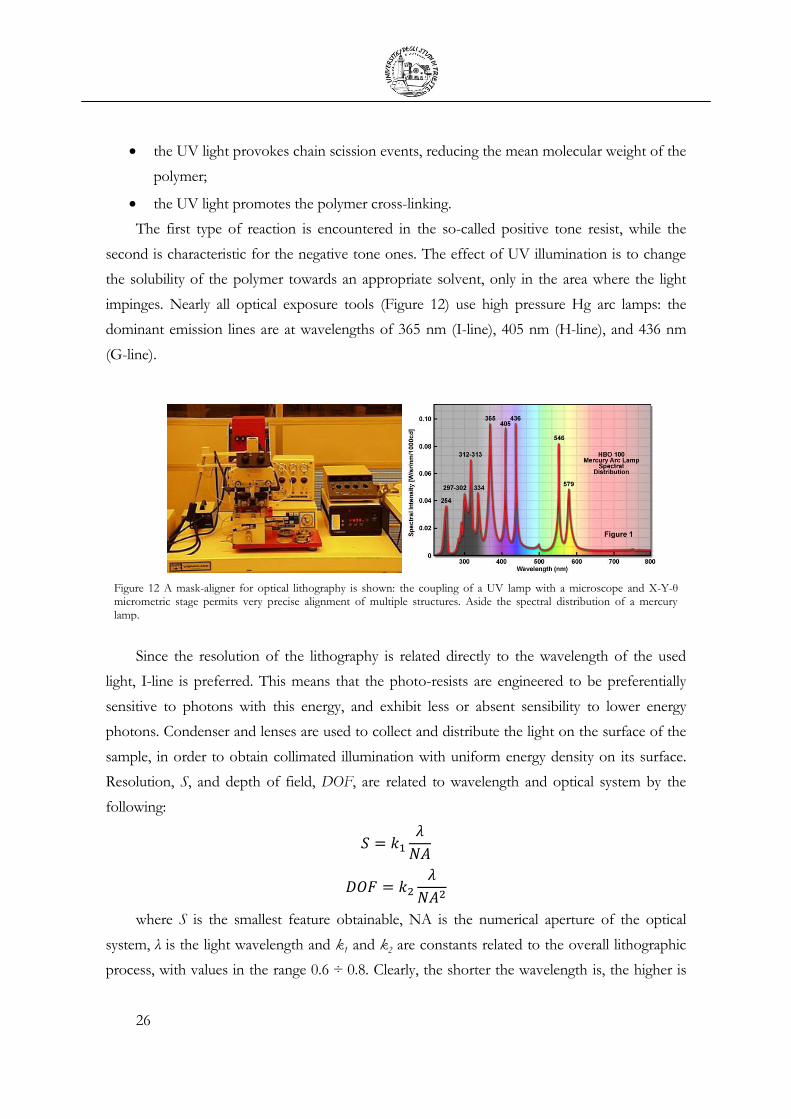
impinges. Nearly all optical exposure tools (Figure 12) use high pressure Hg arc lamps: the
dominant emission lines are at wavelengths of 365 nm (I-line), 405 nm (H-line), and 436 nm
(G-line).
Figure 12 A mask-aligner for optical lithography is shown: the coupling of a UV lamp with a microscope and X-Y-θ micrometric stage permits very precise alignment of multiple structures. Aside the spectral distribution of a mercury lamp.
Since the resolution of the lithography is related directly to the wavelength of the used
light, I-line is preferred. This means that the photo-resists are engineered to be preferentially
sensitive to photons with this energy, and exhibit less or absent sensibility to lower energy
photons. Condenser and lenses are used to collect and distribute the light on the surface of the
sample, in order to obtain collimated illumination with uniform energy density on its surface.
Resolution, S, and depth of field, DOF, are related to wavelength and optical system by the
following:
where S is the smallest feature obtainable, NA is the numerical aperture of the optical
system, λ is the light wavelength and k1 and k2 are constants related to the overall lithographic
process, with values in the range 0.6 ÷ 0.8. Clearly, the shorter the wavelength is, the higher is

27
the resolution, but as a draw-back, depth of focus becomes also lower. To define the area where
the light is free to illuminate the resist and where is stopped by absorption or reflection, a mask
is employed. This is commonly made by a transparent substrate (usually a slab of Soda lime or
Quartz glass, 3-5 mm thick) on which a 2D pattern is defined on a 100 nm thick chromium
layer (which stops UV light); passing through such a mask, UV light impresses the 2D layout
onto the polymeric resist. The energy delivered to the resist produces the so-called aerial image.
By removing the exposed resist (positive tone) or the un-exposed one (negative tone) by
immersion into an appropriate solvent (developer), the result is the replica of the exposed
structure in resist. Every commercially available resist is designed to be used in a particular
wavelength window. In this region, the contrast is maximized; for a definition of the contrast of
a resist, γ, see Figure 13.
Figure 13 Response curve of a resist obtained by measuring post-development the normalized resist thickness, after an exposure at different doses. Contrast is determined from the extrapolated slope of the linear portion of the response curve.
Let’s consider a positive tone resist, exposed to different increasing energy doses, defined
as the energy delivered per unit area. After the same development process (developing solution,
time and temperature), the residual thickness of the resist is measured and normalized to the
initial value, then reported respect to the energy dose in semi-logarithmic scale. The contrast, γ,
is defined as in the following:
where D0 is the energy at which the residual thickness equals zero and D1 the intersection
between the tanget of the curve in D0 and the horizontal line y=1. The higher is the contrast,
the better is the resolution of the resist. When a non monochromatic light source is used,
enhanced absorption of photons with energy different from the optimized one ends in a loss of
resolution and worsening of the contrast. By consequence, not only the fidelity of the
28
reproduction of feature’s dimensions but also the slope of the resist walls are affected. For a
positive resist, over-doses produce a positive slope of the walls (negative slope for negative tone
resist), while under-doses prevent the clearing of the substrate. More complex combination of
process parameters (dose level, developing time and temperature) give profiles that are not
always easy to understand. Basically, considering the dose level and developing time, one of the
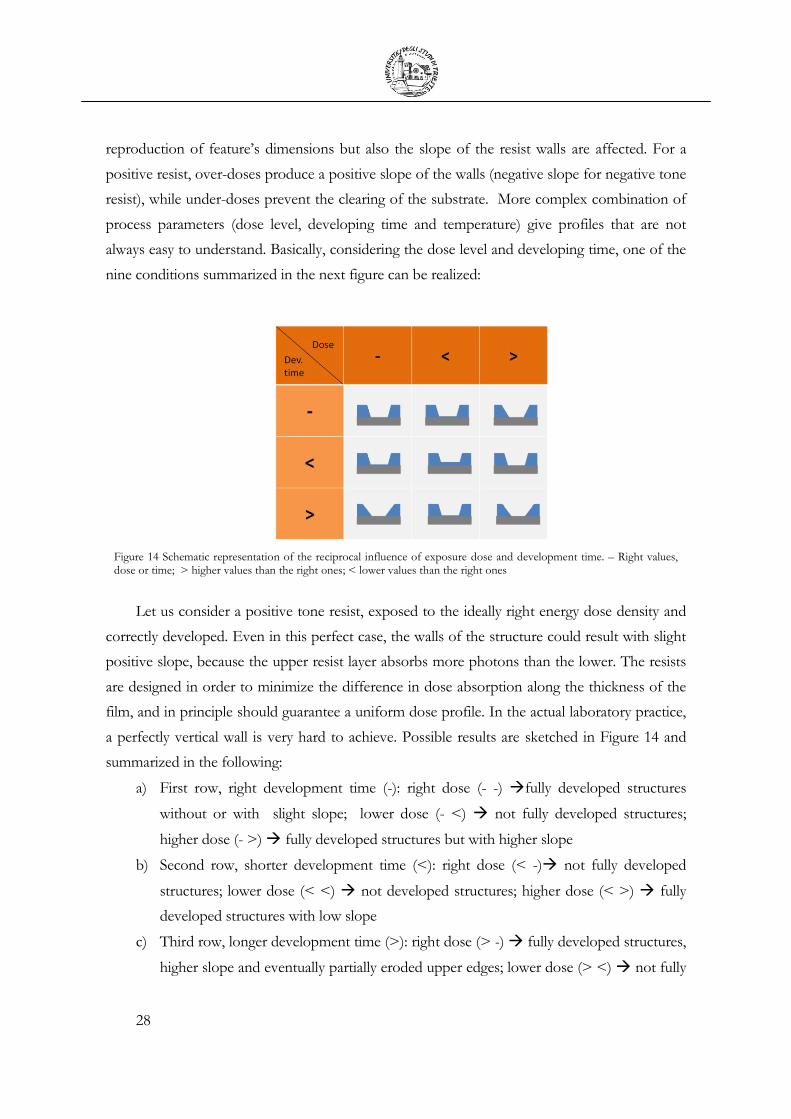
nine conditions summarized in the next figure can be realized:
Figure 14 Schematic representation of the reciprocal influence of exposure dose and development time. – Right values, dose or time; > higher values than the right ones; < lower values than the right ones
Let us consider a positive tone resist, exposed to the ideally right energy dose density and
correctly developed. Even in this perfect case, the walls of the structure could result with slight
positive slope, because the upper resist layer absorbs more photons than the lower. The resists
are designed in order to minimize the difference in dose absorption along the thickness of the
film, and in principle should guarantee a uniform dose profile. In the actual laboratory practice,
a perfectly vertical wall is very hard to achieve. Possible results are sketched in Figure 14 and
summarized in the following:
a) First row, right development time (-): right dose (- -) fully developed structures
without or with slight slope; lower dose (- <) not fully developed structures;
higher dose (- >) fully developed structures but with higher slope
b) Second row, shorter development time (<): right dose (< -) not fully developed
structures; lower dose (< <) not developed structures; higher dose (< >) fully
developed structures with low slope
c) Third row, longer development time (>): right dose (> -) fully developed structures,
higher slope and eventually partially eroded upper edges; lower dose (> <) not fully

29
developed structures, lower slope of the walls; higher dose (> >) fully developed
structures, high slope angle and eroded upper edges
An extremely high over-dose could end in the lift-off of the smallest structures.
The most common polymers employed in optical lithography are comprised in a wide
family called Novolac resins (see Appendix I)
Nevertheless the cited materials, beings organic polymers, have strong absorbance in the
MIR and cannot be used as a bulk to define microfluidic IR transparent devices. Therefore
alternative materials have to be employed as substrates for the devices.
1.8 IR compatible materials
Infrared transparent materials have been available since many years in form of single or
poly crystalline windows, with a thickness ranging from few microns to some millimetres. Table
5 summarizes the most interesting properties of commonly employed IR-transparent substrates
from a mechanical, thermal and chemical point of view.
Table 6 Mechanical, physical, chemical and optical properties of commonly employed IR windows
Material IR transmission range [cm-1]
Young Modulus [GPa]
Density [g/cm3]
Thermal conductivity [W/mK]
Water solubility [g/100 g of water]
Refractive Index at 1
µm [51]
Fused Silica 50,000-2500 72 2.20 1.4 Insoluble 1.45
Diamond 45,450-2325 1665-285
1050 3.515 >1800 Insoluble 2.39
CaF2 66,666-1110 76 3.18 9.7 0.00151 (20°C) 1.42
BaF2 50,000-770 53 4.89 11.72 0.12 (25°C) 1.46
ZnSe 10,000-500 70 5.27 18 Insoluble 2.49
Silicon 10,000-1540 500-30
131 2.33 148 Insoluble 3.59
Germanium 5,000-600 103 5.32 60 Insoluble 4.10
Sapphire 50,000-1780 345-86 3.98 6.66 Insoluble 1.75
For what is concerning the applicability of bio-MEMS to IRMS, the most important
regions where IR transparency has to be guaranteed are between 3050 and 2800 cm-1 and 1800
and 1000 cm-1 (see Figure 2), with special care for the 1700-1450 cm-1 range, where Amide I and
II bands are [11]. Besides this, the choice of a suitable material for fabricating microfluidic
devices should take in consideration both thermal and mechanical properties of the substrate.
After all, most of the fabrication processes involve thermal treatments and/or mechanical
manufacturing, such as drilling or polishing, so too hard or brittle materials will result extremely
30
difficult to handle. Another very important issue is the chemical stability of the window
materials, since wet and/or dry chemical treatments are often employed for shaping 3D
features. Silicon and diamond are quite inert in aqueous environment, as well as quartz and
fused silica that, nevertheless, are not transparent in the spectral regions of interest [52].
Calcium fluoride is slightly soluble in water, but it is transparent to both infrared and visible
light. The infrared properties of BaF2 are even better, but the high water solubility is limiting its
direct applicability for microfluidic purposes, becoming toxic for living cells. ZnSe has also low
water solubility (Kps = 3.6 x 10⁻²⁶) but it is less transparent than BaF2 and CaF2 to visible light
and toxic for cellular samples (EU classification: T).
Si and its compounds (oxide or nitride) are very easily machinable to a final shape with
nanometric precision and also in form of very thin membranes if needed. However they are not
the best choice for biological application because of their poor transmittance below 1300 cm-1
[53]. One of the best materials, considering the light transmission properties and the
mechanical-thermal stability as well as the microfabrication possibilities offered, would be
diamond [54], which is obviously used only if strictly necessary, for its high costs.
So, concluding, we found a good compromise in CaF2, which have just one drawback: the
lack of standard protocols for microfabrication.
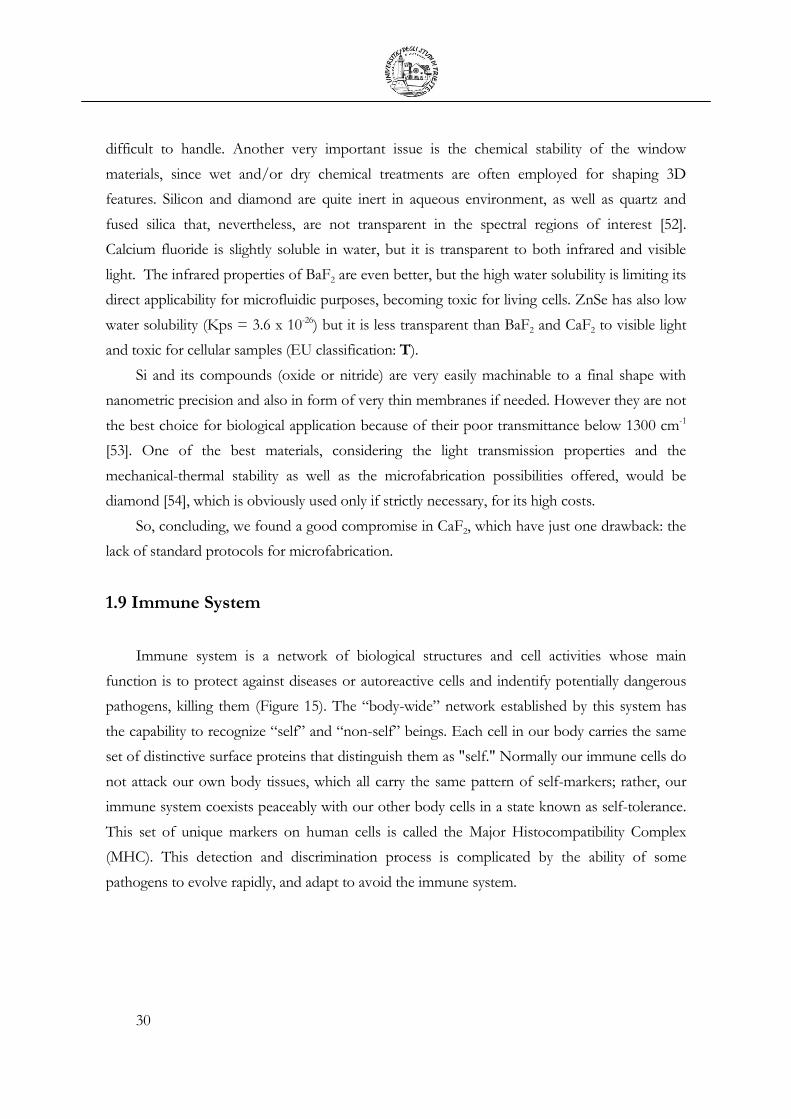
1.9 Immune System
Immune system is a network of biological structures and cell activities whose main
function is to protect against diseases or autoreactive cells and indentify potentially dangerous
pathogens, killing them (Figure 15). The “body-wide” network established by this system has
the capability to recognize “self” and “non-self” beings. Each cell in our body carries the same
set of distinctive surface proteins that distinguish them as "self." Normally our immune cells do
not attack our own body tissues, which all carry the same pattern of self-markers; rather, our
immune system coexists peaceably with our other body cells in a state known as self-tolerance.
This set of unique markers on human cells is called the Major Histocompatibility Complex
(MHC). This detection and discrimination process is complicated by the ability of some
pathogens to evolve rapidly, and adapt to avoid the immune system.

31
a b
Figure 15 a) The immune system is a finely tuned biological warfare mechanism responsible for identifying, differentiating and destroying pathogenic invaders. b) Disturbances to the biochemical environment in which the immune system has to function can be expected to lead to variable forms of immune system failure As a result the system may overreact to pollens or other non-pathogenic invaders. It may fail to deal effectively with bacteria and viruses and could even attack the body’s own cells as in autoimmune diseases such as arthritis, diabetes, and multiple sclerosis. (Adapted by http://knol.google.com/k/buteyko-hyperventilation#Immune_System)
To overcome this problem the human immune system adapts itself over time to recognize
specific pathogens more efficiently. This adaptation process is referred to as "adaptive
immunity" or "acquired immunity" and creates immunological memory. Immunological
memory, created from a primary response to a specific pathogen, provides an enhanced
response to secondary encounters with a same specific pathogen.
On the contrary the fast response of the system to a pathogen is carried on by the innate
immune system (Figure 16), which comprises the cells and mechanisms that defend the host
from infection by other organisms, in a non-specific manner. This means that the cells of the
innate system recognize and respond to pathogens in a generic way, but unlike the adaptive
immune system, it does not confer long-lasting or protective immunity to the host [10].
The major functions of the vertebrate innate immune system include:
Recruiting immune cells to sites of infection, through the production of chemical
factors, including specialized chemical mediators, called cytokines.
Activation of the complement cascade to identify bacteria, activate cells and to promote
clearance of dead cells or antibody complexes.
The identification and removal of foreign substances present in organs, tissues, the blood
and lymph, by specialized white blood cells.
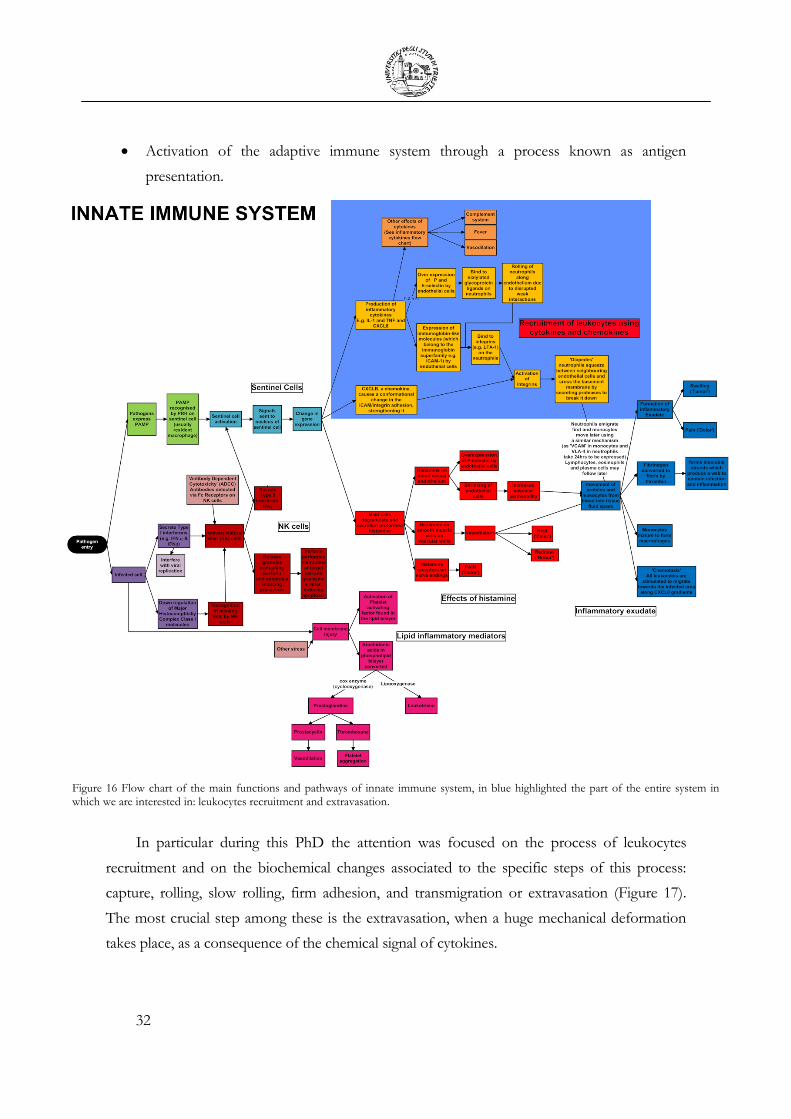
32
Activation of the adaptive immune system through a process known as antigen
presentation.
Figure 16 Flow chart of the main functions and pathways of innate immune system, in blue highlighted the part of the entire system in which we are interested in: leukocytes recruitment and extravasation.
In particular during this PhD the attention was focused on the process of leukocytes
recruitment and on the biochemical changes associated to the specific steps of this process:
capture, rolling, slow rolling, firm adhesion, and transmigration or extravasation (Figure 17).
The most crucial step among these is the extravasation, when a huge mechanical deformation
takes place, as a consequence of the chemical signal of cytokines.
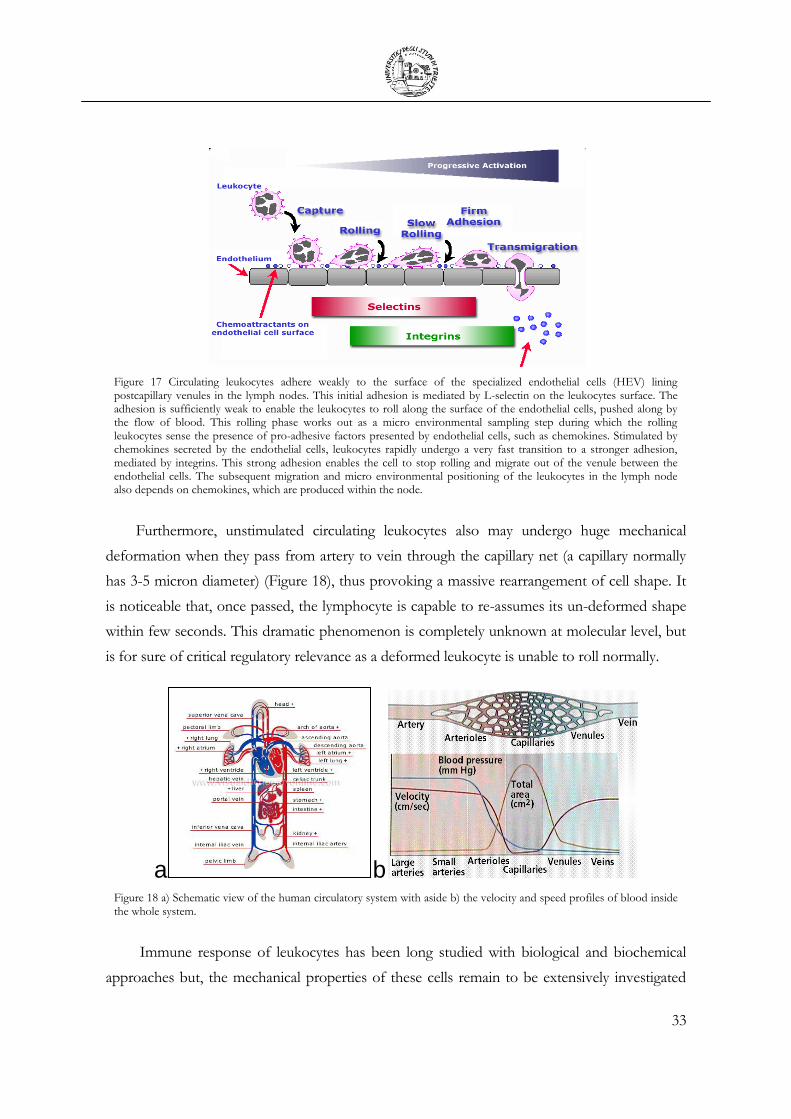
33
Figure 17 Circulating leukocytes adhere weakly to the surface of the specialized endothelial cells (HEV) lining postcapillary venules in the lymph nodes. This initial adhesion is mediated by L-selectin on the leukocytes surface. The adhesion is sufficiently weak to enable the leukocytes to roll along the surface of the endothelial cells, pushed along by the flow of blood. This rolling phase works out as a micro environmental sampling step during which the rolling leukocytes sense the presence of pro-adhesive factors presented by endothelial cells, such as chemokines. Stimulated by chemokines secreted by the endothelial cells, leukocytes rapidly undergo a very fast transition to a stronger adhesion, mediated by integrins. This strong adhesion enables the cell to stop rolling and migrate out of the venule between the endothelial cells. The subsequent migration and micro environmental positioning of the leukocytes in the lymph node also depends on chemokines, which are produced within the node.
Furthermore, unstimulated circulating leukocytes also may undergo huge mechanical
deformation when they pass from artery to vein through the capillary net (a capillary normally
has 3-5 micron diameter) (Figure 18), thus provoking a massive rearrangement of cell shape. It
is noticeable that, once passed, the lymphocyte is capable to re-assumes its un-deformed shape
within few seconds. This dramatic phenomenon is completely unknown at molecular level, but
is for sure of critical regulatory relevance as a deformed leukocyte is unable to roll normally.
Immune response of leukocytes has been long studied with biological and biochemical
approaches but, the mechanical properties of these cells remain to be extensively investigated
a b
Figure 18 a) Schematic view of the human circulatory system with aside b) the velocity and speed profiles of blood inside the whole system.

34
and complemented with biochemical data, as well as others cellular processes involving
transformations and sustenance of mechanical forces and belonging to the research subjects of
the emerging new field of mechanobiology [55]. Mechanobiology merges the older science of
mechanics with the newer and emerging disciplines of molecular biology and genetics.
In living cells, the application of a mechanical stimulus causes not only a mechanical
response but also a biological response. Using complex networks of sensors, transducers and
actuating mechanisms, cells are able to respond and adapt to their mechanical environment, and
these effects can be profound and critical to normal physiology and, in some cases, pathology.
It is useful to consider what components a cell needs to respond to a mechanical stimulus.
Mechanoreception. First, a cell must detect the stimulus and relay the message from
outside the cell (where the stimulus acts) to inside the cell (where a response will
ultimately be generated). To do so, cells use mechanoreceptors.
Signal transmission. Once sensed, the mechanical signal needs to be relayed within
the cell to various targets throughout the cell; cells appear to use both biochemical
pathways and the cytoskeleton to transmit this signal.
Target activation. When the signal reaches its target (usually a protein), the target is
activated. This causes alterations in cell behaviour through a variety of molecular
mechanisms.
This entire cascade of signals corresponds in changes in the conformation or
functionalization (phosphorylation) of target molecules or macromolecules, transcription of
RNA to the synthesis of new proteins or changes in membrane or cytoskeleton composition,
and all the phenomena enlisted, if enough relevant, could result detectable by the analysis of the
infrared spectra of the cell.
1.10 Complementary Biological Assays
To validate the measurement setup proposed and enforce the conclusions drawn out on
data acquired, we performed complementary cytometric assays.
Flow cytometry is a technology that simultaneously measures and then analyzes multiple
physical characteristics of single particles, usually cells, as they flow in a fluid stream through a
beam of light. The properties measured include a particle’s relative size (Forward Scattering),
relative granularity or internal complexity (Side Scattering), and relative fluorescence intensity.
35
In most cases, particles without intrinsically interesting auto-fluorescence are stained with
fluorescent dyes during preparation to make non-fluorescent compounds “visible” to the
cytometer. A fluorescent dye is one that absorbs light of certain specific colour and then emits
light of a different colour (usually of a longer wavelength).
In our experiments we used three kind of staining for the cells:
Propidium Iodide (PI): an intercalating agent that stoichiometrically binds DNA.
When excited with 488 nm wavelength light, it fluoresces red and can be detected
with 562-588 nm band pass filter. Propidium iodide is used as a DNA stain for
evaluating cell viability or DNA content in cell cycle analysis.
3,3′-dihexyloxacarbocyanine iodide (DiOC6): fluorescent dye used for the staining
of mitochondria [56]. Binding to these structures occurs via the dye's hydrophilic
groups. DiOC6 can be used to label living cells; however they are quickly damaged
due to photodynamic toxicity, so cells stained with this dye can only be exposed to
light for short periods of time. When exposed to blue light, the dye fluoresces
green.
Fluorescein Isothiocyanate (FITC): a fluorescein molecule functionalized with an
isothiocyanate group (-N=C=S), replacing a hydrogen atom on the bottom ring of
the structure. This derivative is reactive towards amine groups of proteins inside
cells. FITC has excitation and emission lines at approximately 495 nm/521 nm.
Data resulting from these analyses can be plotted in several ways, the most common are:
The histogram representation, which is used to display the distribution of one
parameter over the cells in the data file. With the data from a five-parameter
flow cytometer, there will be five numbers describing each cell (e.g., the
intensities of forward scatter, side scatter, green fluorescence, orange
fluorescence, and red fluorescence).
The Two-dimension plot, which is used to correlate each other the “numbers”
describing each cell. For example, by using a two-dimensional plot, it is
possible to see whether the cells that fluoresce green also fluoresce orange.
As an example, the combination of PI and FITC staining permits to determine cell’s cycle
distribution. During its life a cell passes through several phases, all dedicated to its replication,
the mitosis for eukaryotic cells. The cell cycle consists of four distinct phases: G1 phase, S phase
(synthesis), G2 phase (collectively known as interphase) and M phase (mitosis). In each of these

36
phases cellular constituents, in terms of protein or DNA content, change in time as a
consequence of transcription and synthesis processes. Once a cell completes its cycle, it enters
in a fifth phase called G0, which is its resting state, where the cell is more sensitive and receptive
to external stimulation.
Figure 19 Diagram representing the different phases of the cell cycle. Adapted from “http://scienceblogs.com/neurotopia/2010/05/cell_cycle_p21_depression_and.php”
37
CHAPTER 2
Microfabrication
The aim of this Chapter is to illustrate the fabrication choices done during the PhD activity
in order to produce the devices used for IRMS measurements of living white blood cells,
presented in Chapter 3. All the fabrication steps have been carried out in collaboration with
LILIT group (Laboratory for Interdisciplinary Lithography) [57, 58] IOM-CNR and its
laboratories and facilities.
In this Chapter I present the fabrication steps I did, in order to obtain the final
measurement setup. As illustrated in “Section 1.7”, microfabrication and microfluidic are used to
realize IR-Vis transparent devices with a precise spacing and layout as to be able to overcome
the “water-absorption barrier”. Starting presenting issues regarding photoresist adhesion, I then
illustrate the optimization of lithographical parameters, highlighting the preservation of
substrate’s optical proprieties throughout the whole process. Once defined the fabrication steps
for the devices, the attention is posed on the realization of the interfacing systems.
Finally, through biochemical assays, I will demonstrate the complete biocompatibility of
the materials and protocols employed during these studies.
38
2.1 Microfabrication for IRMS
The first task pursued during my PhD Thesis was the fabrication of suitable devices for
the study of living cells by IRMS. This task was troublesome due both to the lack of standard
protocols for the fabrication of materials transparent in the MIR region and for the difficulties
on their handling.
The substrate material chosen was CaF2: transparent both to IR and visible light, slightly
soluble in water, exerting a negligible cytotoxicity and cheaper than others, calcium fluoride
represents the best choice among the possible substrates, as detailed in the previous Chapter
(Section 1.8).
Before entering in the detail of the fabrication, it could be helpful to briefly describe the
process flow that was employed for the fabrication of our devices, both static prototypes and
final microfluidic cells, which is shown in Figure 20. In the first fabrication step, a substrate,
commonly a silicon wafer, CaF2 in the specific, is spin-coated with a layer of a polymeric resist
film. By modulating the spinning rate, the resist thickness can be carefully controlled. The resist
is then baked, following a specific profile of temperature and exposed, and this is the
photolithography step properly named. A lithographic mask is placed between the substrate and
the UV source of the mask aligner, made of UV-transparent and absorbing regions. All the
masks employed in this Thesis were produced following the design specification contained in a
CAD file. The exposed regions of the resist change their solubility towards an appropriate
solvent, called developer. Therefore, after development, the exposed pattern is released. The
resulting structure can be the final one or can be transferred to the substrate by additive
(evaporation or sputtering) or subtractive processes (etching). The described sequence can be
repeated many times for obtaining a functional device.
The first problem to be solved was to find a photoresist that would prove a good adhesion
on CaF2, since its low surface energy (30-50 mJ/m2 ) [59] caused problems when employing the
standard commercial photoresist, for example the S1828 from Shipley and SU8 from
MicroChem. After several trials we choose the experimental positive tone novolac-based
photoresist called X-ARP 3100/10 by AllResist GmbH. This photoresist was proposed by
AllResist as an HF (5%) resistant coating with improved adhesion.
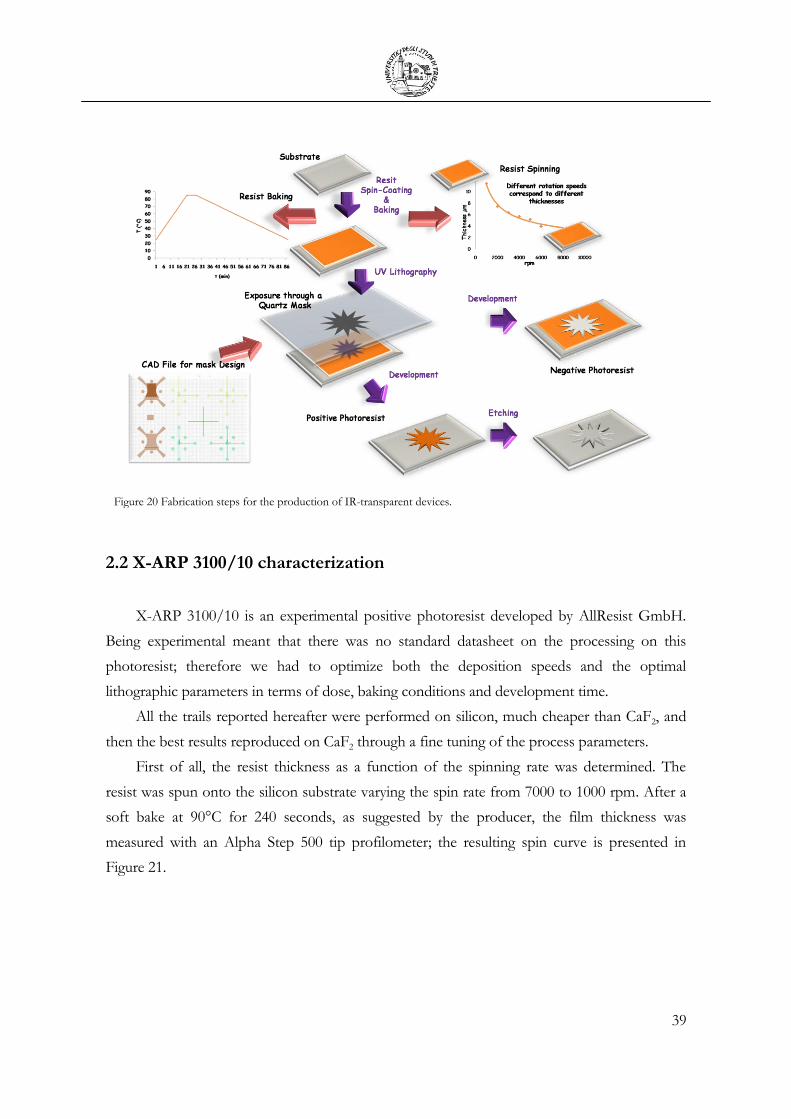
39
Figure 20 Fabrication steps for the production of IR-transparent devices.
2.2 X-ARP 3100/10 characterization
X-ARP 3100/10 is an experimental positive photoresist developed by AllResist GmbH.
Being experimental meant that there was no standard datasheet on the processing on this
photoresist; therefore we had to optimize both the deposition speeds and the optimal
lithographic parameters in terms of dose, baking conditions and development time.
All the trails reported hereafter were performed on silicon, much cheaper than CaF2, and
then the best results reproduced on CaF2 through a fine tuning of the process parameters.
First of all, the resist thickness as a function of the spinning rate was determined. The
resist was spun onto the silicon substrate varying the spin rate from 7000 to 1000 rpm. After a
soft bake at 90°C for 240 seconds, as suggested by the producer, the film thickness was
measured with an Alpha Step 500 tip profilometer; the resulting spin curve is presented in
Figure 21.
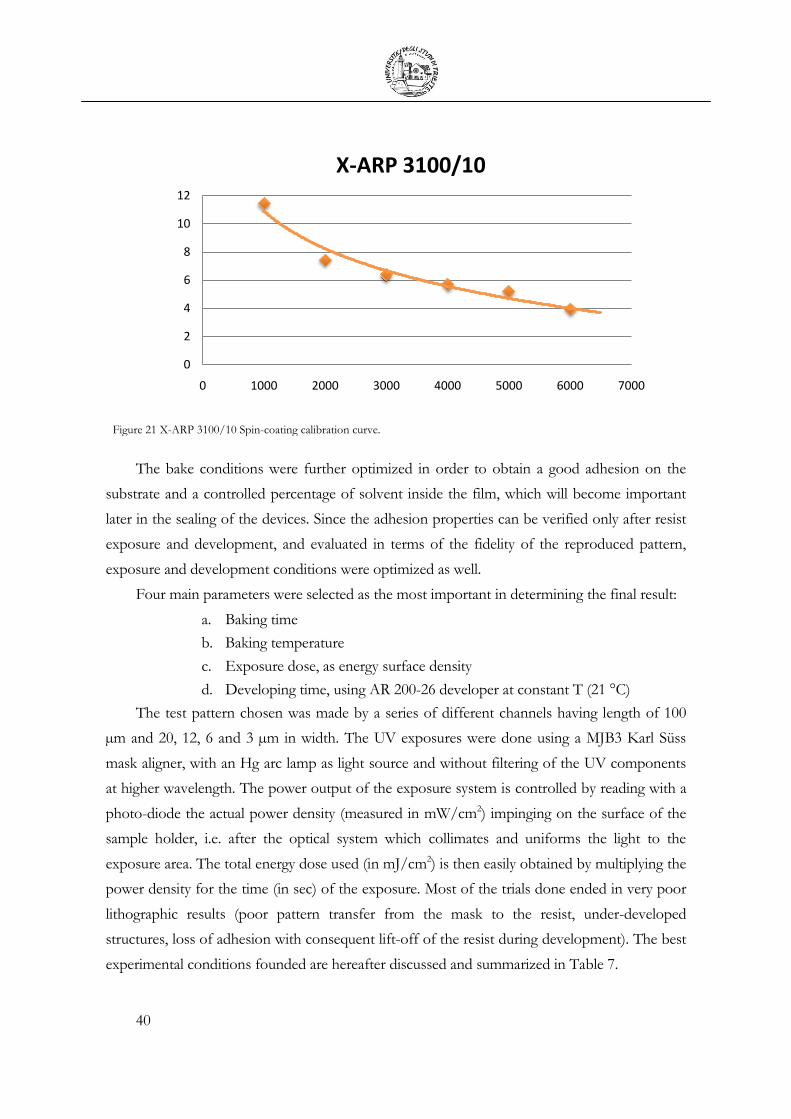
40
Figure 21 X-ARP 3100/10 Spin-coating calibration curve.
The bake conditions were further optimized in order to obtain a good adhesion on the
substrate and a controlled percentage of solvent inside the film, which will become important
later in the sealing of the devices. Since the adhesion properties can be verified only after resist
exposure and development, and evaluated in terms of the fidelity of the reproduced pattern,
exposure and development conditions were optimized as well.
Four main parameters were selected as the most important in determining the final result:
a. Baking time
b. Baking temperature
c. Exposure dose, as energy surface density
d. Developing time, using AR 200-26 developer at constant T (21 °C)
The test pattern chosen was made by a series of different channels having length of 100
µm and 20, 12, 6 and 3 µm in width. The UV exposures were done using a MJB3 Karl Süss
mask aligner, with an Hg arc lamp as light source and without filtering of the UV components
at higher wavelength. The power output of the exposure system is controlled by reading with a
photo-diode the actual power density (measured in mW/cm2) impinging on the surface of the
sample holder, i.e. after the optical system which collimates and uniforms the light to the
exposure area. The total energy dose used (in mJ/cm2) is then easily obtained by multiplying the
power density for the time (in sec) of the exposure. Most of the trials done ended in very poor
lithographic results (poor pattern transfer from the mask to the resist, under-developed
structures, loss of adhesion with consequent lift-off of the resist during development). The best
experimental conditions founded are hereafter discussed and summarized in Table 7.
0
2
4
6
8
10
12
0 1000 2000 3000 4000 5000 6000 7000
X-ARP 3100/10

41
The first trial was done following the producer suggestions (sample a) in Table 7 and the
result can be shown in Figure 22.
Table 7 Tested lithographical conditions on a 5 µm thin film of X-ARP 3100/10 spin coated on silicon at 5000 rpm.
Sample Bake Temperature
(°C)
Bake Time (sec) Dose @ 3.3 mW
(mJ/cm2)
Developement (sec)
a 90 240 198 60
b 105 300 396 60
c 115 120 198 120
d 115 420 198 150
Figure 22 Sample a: the first trial resulted in a quite clean bottom part of the lithography in the channels, but is noticeable a roughness in the walls of lithography in the scanning electron microscope (SEM) micrographs.
Sample a (Figure 22) shows a good reproduction of the lay-out, but the ruined edge on the
top of the structure and the not perfectly cleared substrate indicate that there was still too much
solvent in the resist, while a further development would have lead to the lost of the channels.
Therefore we decided to increase the bake time and temperature to permit a better solvent
evaporation from the surface. The resulting structure (sample b in Table 7, Figure 23) has
clearly a better resolution and definition of the edges, but required an higher exposure dose and
the slight rounding of the upper part of the lithography is probably due to this over-exposure.
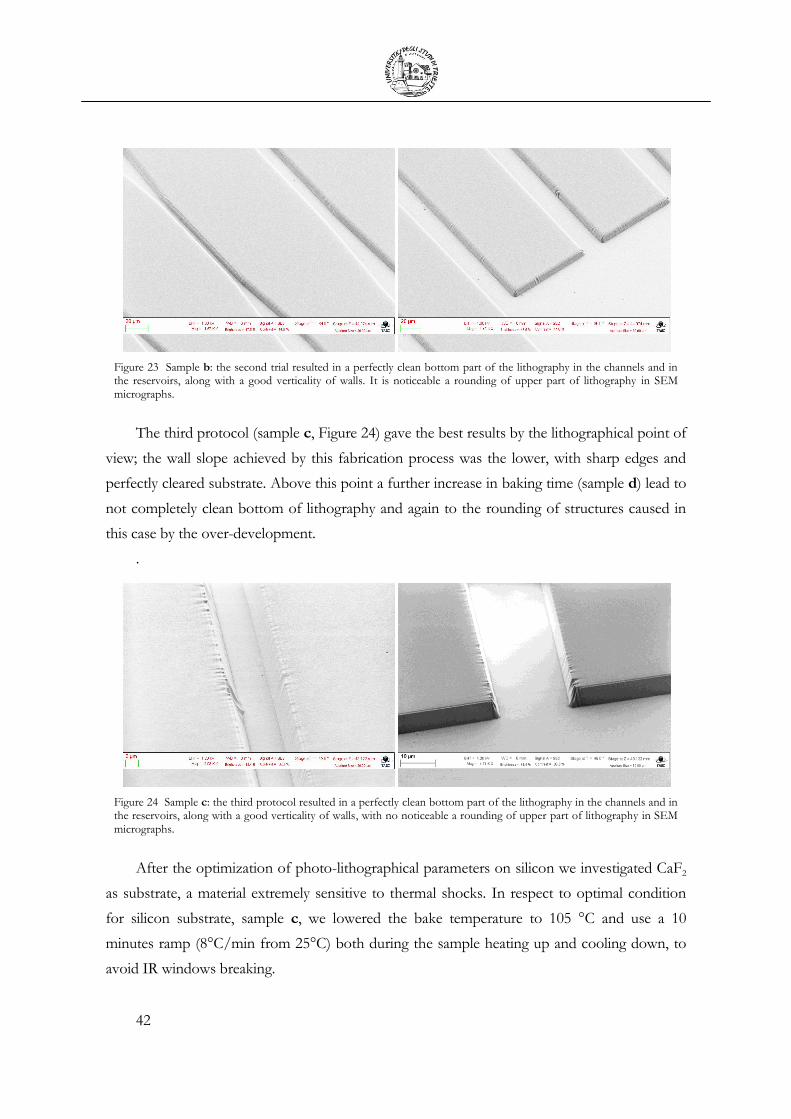
42
Figure 23 Sample b: the second trial resulted in a perfectly clean bottom part of the lithography in the channels and in the reservoirs, along with a good verticality of walls. It is noticeable a rounding of upper part of lithography in SEM micrographs.
The third protocol (sample c, Figure 24) gave the best results by the lithographical point of
view; the wall slope achieved by this fabrication process was the lower, with sharp edges and
perfectly cleared substrate. Above this point a further increase in baking time (sample d) lead to
not completely clean bottom of lithography and again to the rounding of structures caused in
this case by the over-development.
.
Figure 24 Sample c: the third protocol resulted in a perfectly clean bottom part of the lithography in the channels and in the reservoirs, along with a good verticality of walls, with no noticeable a rounding of upper part of lithography in SEM micrographs.
After the optimization of photo-lithographical parameters on silicon we investigated CaF2
as substrate, a material extremely sensitive to thermal shocks. In respect to optimal condition
for silicon substrate, sample c, we lowered the bake temperature to 105 °C and use a 10
minutes ramp (8°C/min from 25°C) both during the sample heating up and cooling down, to
avoid IR windows breaking.
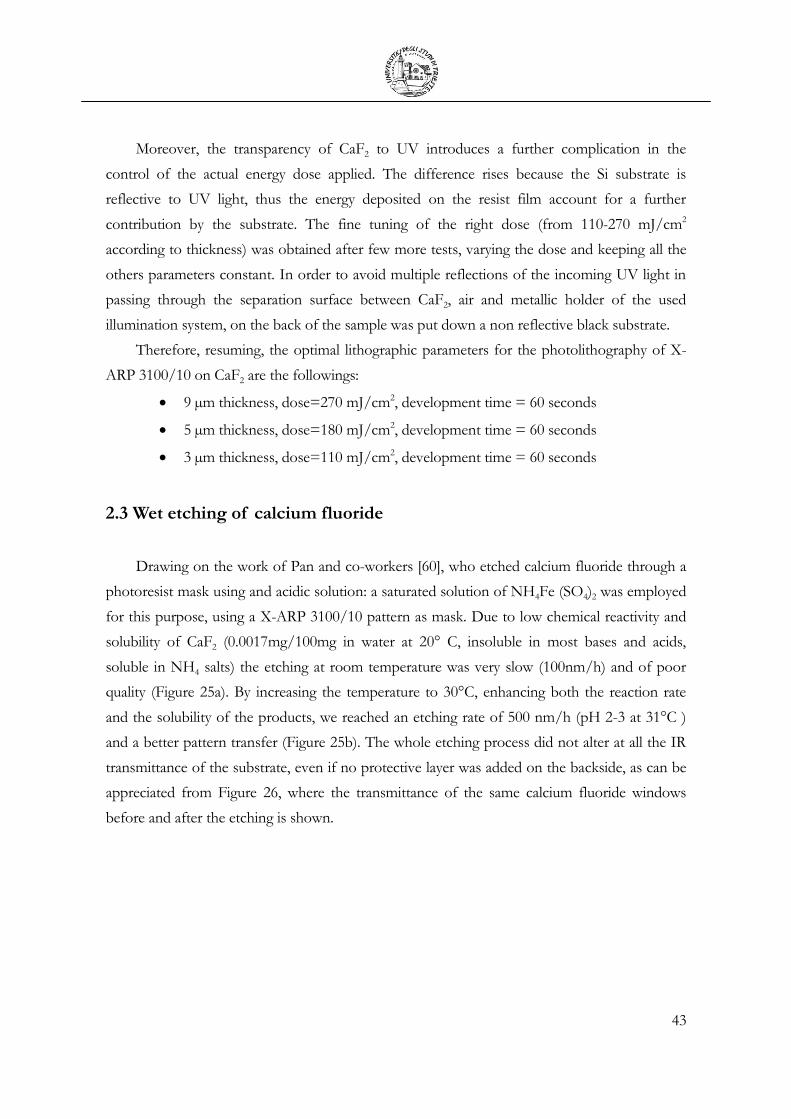
43
Moreover, the transparency of CaF2 to UV introduces a further complication in the
control of the actual energy dose applied. The difference rises because the Si substrate is
reflective to UV light, thus the energy deposited on the resist film account for a further
contribution by the substrate. The fine tuning of the right dose (from 110-270 mJ/cm2
according to thickness) was obtained after few more tests, varying the dose and keeping all the
others parameters constant. In order to avoid multiple reflections of the incoming UV light in
passing through the separation surface between CaF2, air and metallic holder of the used
illumination system, on the back of the sample was put down a non reflective black substrate.
Therefore, resuming, the optimal lithographic parameters for the photolithography of X-
ARP 3100/10 on CaF2 are the followings:
9 µm thickness, dose=270 mJ/cm2, development time = 60 seconds
5 µm thickness, dose=180 mJ/cm2, development time = 60 seconds
3 µm thickness, dose=110 mJ/cm2, development time = 60 seconds
2.3 Wet etching of calcium fluoride
Drawing on the work of Pan and co-workers [60], who etched calcium fluoride through a
photoresist mask using and acidic solution: a saturated solution of NH4Fe (SO4)2 was employed
for this purpose, using a X-ARP 3100/10 pattern as mask. Due to low chemical reactivity and
solubility of CaF2 (0.0017mg/100mg in water at 20° C, insoluble in most bases and acids,
soluble in NH4 salts) the etching at room temperature was very slow (100nm/h) and of poor
quality (Figure 25a). By increasing the temperature to 30°C, enhancing both the reaction rate
and the solubility of the products, we reached an etching rate of 500 nm/h (pH 2-3 at 31°C )
and a better pattern transfer (Figure 25b). The whole etching process did not alter at all the IR
transmittance of the substrate, even if no protective layer was added on the backside, as can be
appreciated from Figure 26, where the transmittance of the same calcium fluoride windows
before and after the etching is shown.
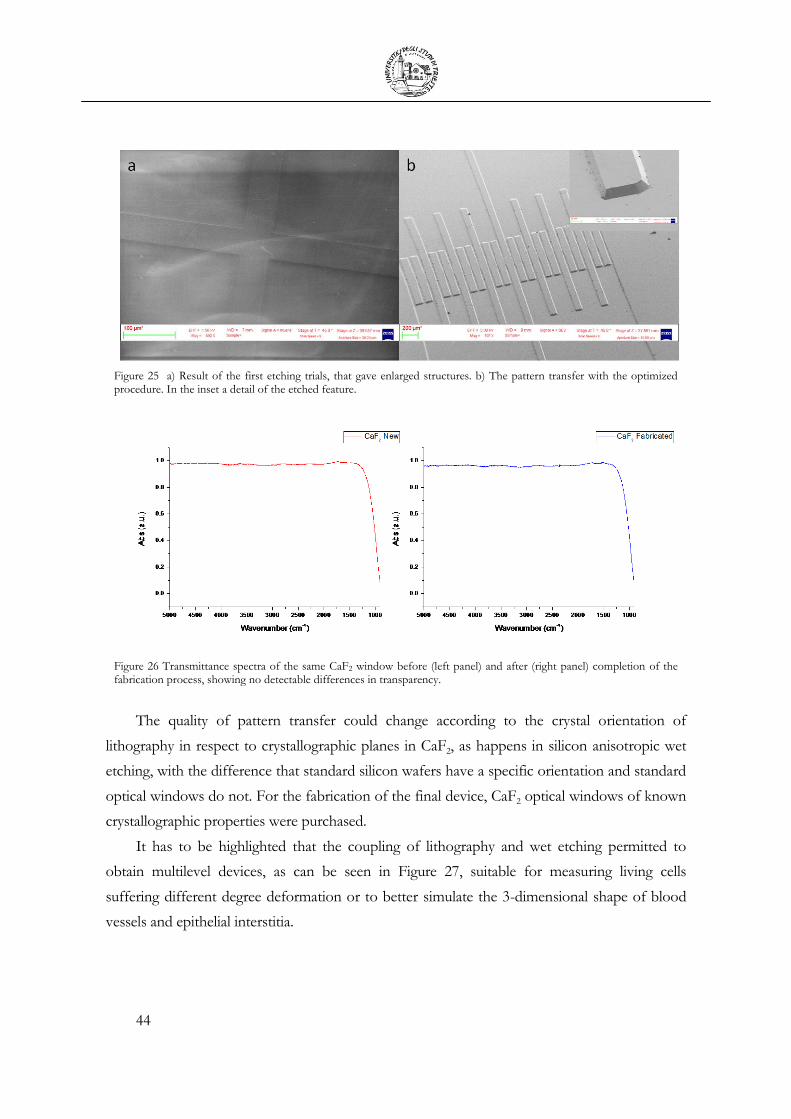
44
Figure 25 a) Result of the first etching trials, that gave enlarged structures. b) The pattern transfer with the optimized procedure. In the inset a detail of the etched feature.
Figure 26 Transmittance spectra of the same CaF2 window before (left panel) and after (right panel) completion of the fabrication process, showing no detectable differences in transparency.
The quality of pattern transfer could change according to the crystal orientation of
lithography in respect to crystallographic planes in CaF2, as happens in silicon anisotropic wet
etching, with the difference that standard silicon wafers have a specific orientation and standard
optical windows do not. For the fabrication of the final device, CaF2 optical windows of known
crystallographic properties were purchased.
It has to be highlighted that the coupling of lithography and wet etching permitted to
obtain multilevel devices, as can be seen in Figure 27, suitable for measuring living cells
suffering different degree deformation or to better simulate the 3-dimensional shape of blood
vessels and epithelial interstitia.
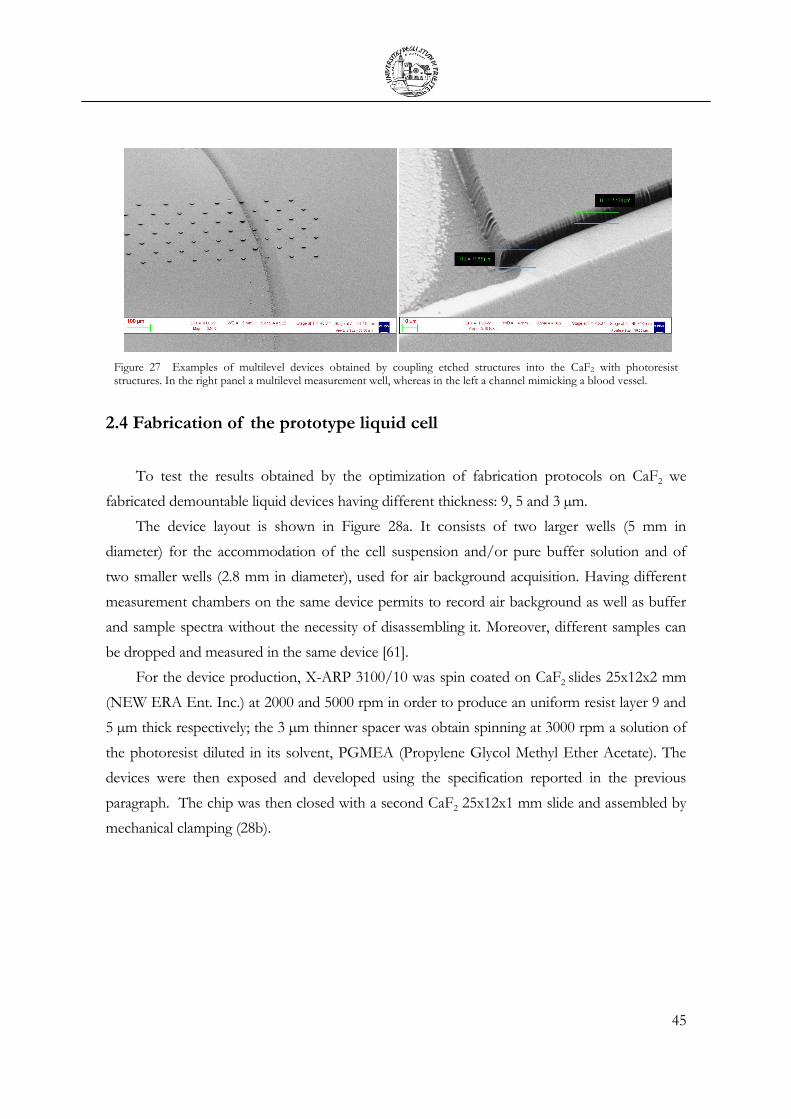
45
Figure 27 Examples of multilevel devices obtained by coupling etched structures into the CaF2 with photoresist structures. In the right panel a multilevel measurement well, whereas in the left a channel mimicking a blood vessel.
2.4 Fabrication of the prototype liquid cell
To test the results obtained by the optimization of fabrication protocols on CaF2 we
fabricated demountable liquid devices having different thickness: 9, 5 and 3 µm.
The device layout is shown in Figure 28a. It consists of two larger wells (5 mm in
diameter) for the accommodation of the cell suspension and/or pure buffer solution and of
two smaller wells (2.8 mm in diameter), used for air background acquisition. Having different
measurement chambers on the same device permits to record air background as well as buffer
and sample spectra without the necessity of disassembling it. Moreover, different samples can
be dropped and measured in the same device [61].
For the device production, X-ARP 3100/10 was spin coated on CaF2 slides 25x12x2 mm
(NEW ERA Ent. Inc.) at 2000 and 5000 rpm in order to produce an uniform resist layer 9 and
5 µm thick respectively; the 3 µm thinner spacer was obtain spinning at 3000 rpm a solution of
the photoresist diluted in its solvent, PGMEA (Propylene Glycol Methyl Ether Acetate). The
devices were then exposed and developed using the specification reported in the previous
paragraph. The chip was then closed with a second CaF2 25x12x1 mm slide and assembled by
mechanical clamping (28b).

46
Figure 28 a) Graphical representation of the fabricated CaF2 static device. The lower patterned window (25X12X2 mm) consists of two larger wells for the accommodation of the cell suspension and/or pure buffer solution and of two smaller wells, used for air background acquisition. The transparent CaF2 cover lid (25X12X1 mm) is also shown. b) Aside is represented the sketch of the front view of the sealed device in its aluminium holder.
The same device could be used for several measurements; moreover the substrate could be
recycled, after removing the photoresist, for the fabrication of a new device, making the set-up
fabrication procedure easy, robust and cheap. These characteristics along with the design
flexibility, the precise control of the optical path and the good sealing properties are the
strength points of our devices. The relative novelty and simplicity of our fabricated liquid cells
allowed us to perform a novel kind of experiments, in which living white blood cells could be
measured directly in physiological conditions. Using these prototype devices we studied the
spectral features of U937 monocytes in comparison with fixed cells as well as the response of
the U937 and THP1 monocytic cell line to mechanical compression, as will be explained in
Chapter 3.
2.5 Dynamic Devices
The static liquid cell is a 2D device with a demountable lid. Even if it was possible to
measure for hours using these devices without solvent evaporation, a careful control of the
environmental conditions can be guarantee only by a sealed fluidic device. Moreover, in
prospect to study the response to cells to deformation, a multi-level 3D device represents the
optimal solution. The realization of multilevel structures is based on the coupling of
photolithographic and etching processes, so it did not represent a problem, while it was
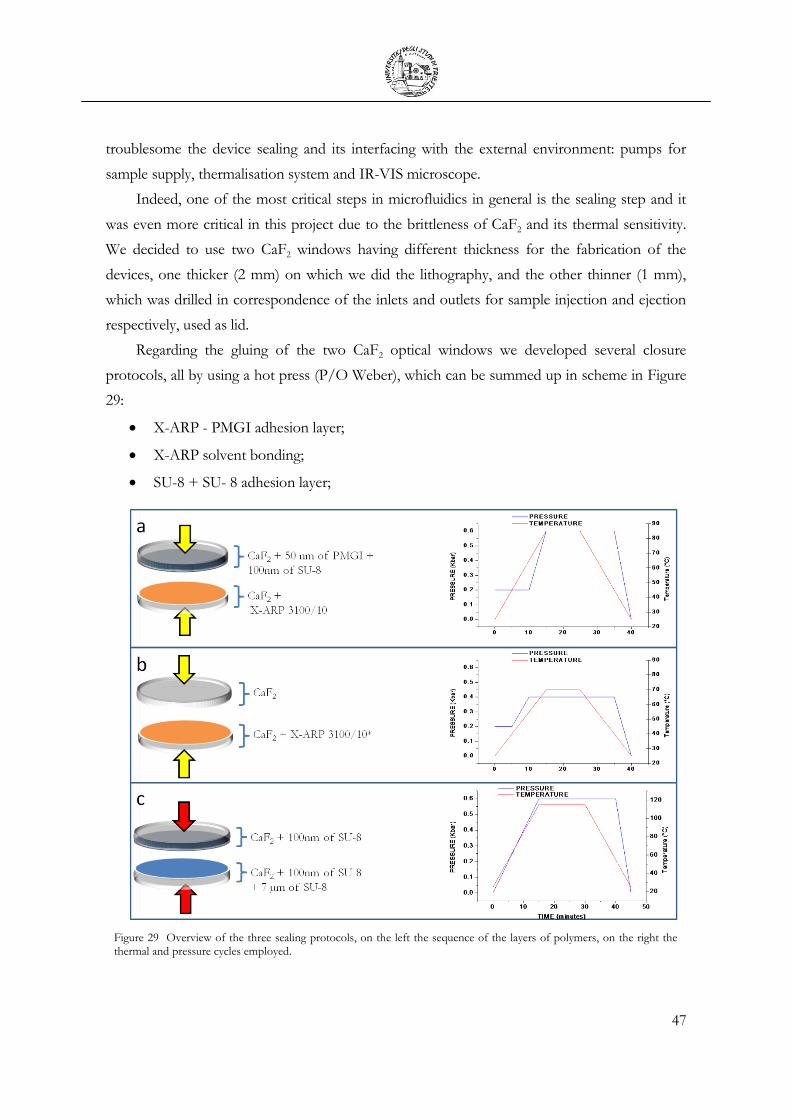
47
troublesome the device sealing and its interfacing with the external environment: pumps for
sample supply, thermalisation system and IR-VIS microscope.
Indeed, one of the most critical steps in microfluidics in general is the sealing step and it
was even more critical in this project due to the brittleness of CaF2 and its thermal sensitivity.
We decided to use two CaF2 windows having different thickness for the fabrication of the
devices, one thicker (2 mm) on which we did the lithography, and the other thinner (1 mm),
which was drilled in correspondence of the inlets and outlets for sample injection and ejection
respectively, used as lid.
Regarding the gluing of the two CaF2 optical windows we developed several closure
protocols, all by using a hot press (P/O Weber), which can be summed up in scheme in Figure
29:
X-ARP - PMGI adhesion layer;
X-ARP solvent bonding;
SU-8 + SU- 8 adhesion layer;
Figure 29 Overview of the three sealing protocols, on the left the sequence of the layers of polymers, on the right the thermal and pressure cycles employed.
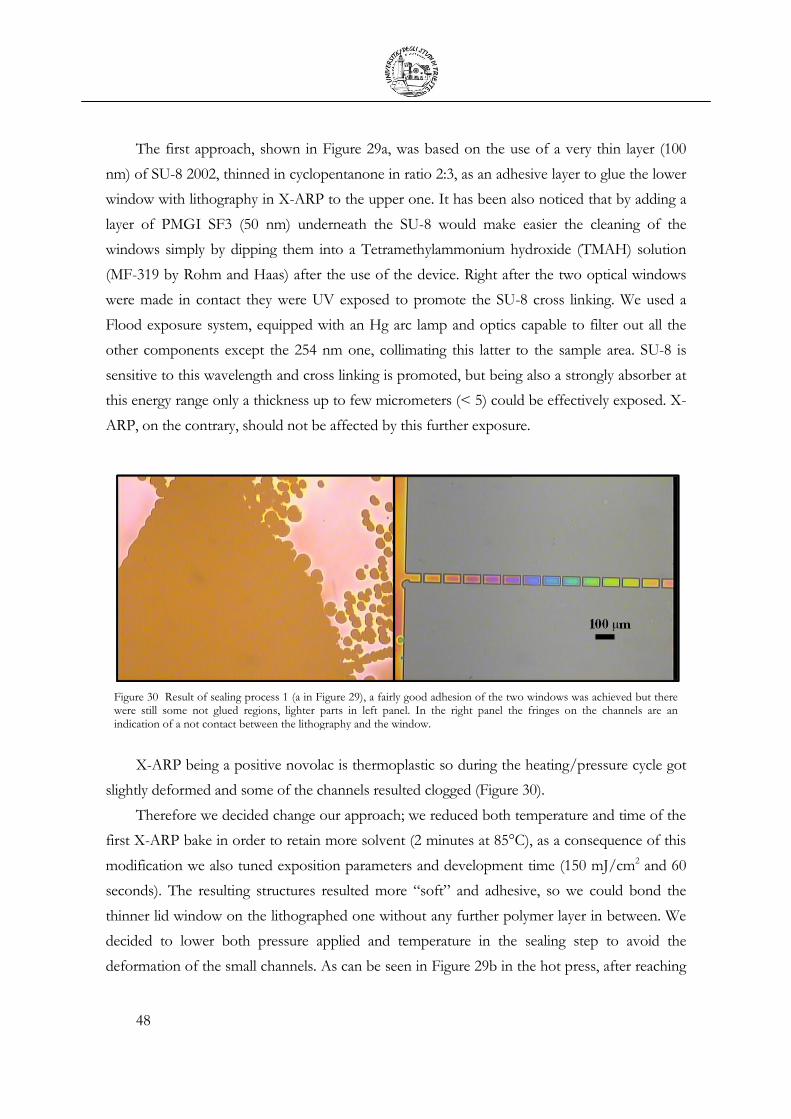
48
The first approach, shown in Figure 29a, was based on the use of a very thin layer (100
nm) of SU-8 2002, thinned in cyclopentanone in ratio 2:3, as an adhesive layer to glue the lower
window with lithography in X-ARP to the upper one. It has been also noticed that by adding a
layer of PMGI SF3 (50 nm) underneath the SU-8 would make easier the cleaning of the
windows simply by dipping them into a Tetramethylammonium hydroxide (TMAH) solution
(MF-319 by Rohm and Haas) after the use of the device. Right after the two optical windows
were made in contact they were UV exposed to promote the SU-8 cross linking. We used a
Flood exposure system, equipped with an Hg arc lamp and optics capable to filter out all the
other components except the 254 nm one, collimating this latter to the sample area. SU-8 is
sensitive to this wavelength and cross linking is promoted, but being also a strongly absorber at
this energy range only a thickness up to few micrometers (< 5) could be effectively exposed. X-
ARP, on the contrary, should not be affected by this further exposure.
Figure 30 Result of sealing process 1 (a in Figure 29), a fairly good adhesion of the two windows was achieved but there were still some not glued regions, lighter parts in left panel. In the right panel the fringes on the channels are an indication of a not contact between the lithography and the window.
X-ARP being a positive novolac is thermoplastic so during the heating/pressure cycle got
slightly deformed and some of the channels resulted clogged (Figure 30).
Therefore we decided change our approach; we reduced both temperature and time of the
first X-ARP bake in order to retain more solvent (2 minutes at 85°C), as a consequence of this
modification we also tuned exposition parameters and development time (150 mJ/cm2 and 60
seconds). The resulting structures resulted more “soft” and adhesive, so we could bond the
thinner lid window on the lithographed one without any further polymer layer in between. We
decided to lower both pressure applied and temperature in the sealing step to avoid the
deformation of the small channels. As can be seen in Figure 29b in the hot press, after reaching
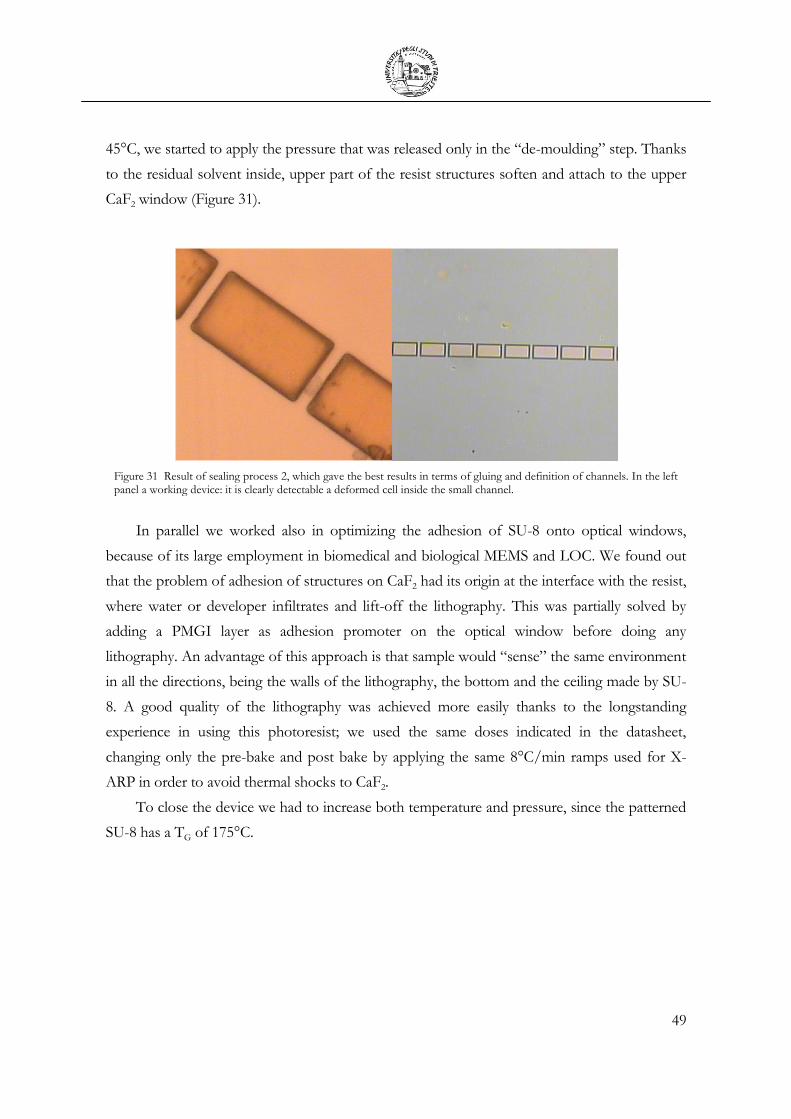
49
45°C, we started to apply the pressure that was released only in the “de-moulding” step. Thanks
to the residual solvent inside, upper part of the resist structures soften and attach to the upper
CaF2 window (Figure 31).
Figure 31 Result of sealing process 2, which gave the best results in terms of gluing and definition of channels. In the left panel a working device: it is clearly detectable a deformed cell inside the small channel.
In parallel we worked also in optimizing the adhesion of SU-8 onto optical windows,
because of its large employment in biomedical and biological MEMS and LOC. We found out
that the problem of adhesion of structures on CaF2 had its origin at the interface with the resist,
where water or developer infiltrates and lift-off the lithography. This was partially solved by
adding a PMGI layer as adhesion promoter on the optical window before doing any
lithography. An advantage of this approach is that sample would “sense” the same environment
in all the directions, being the walls of the lithography, the bottom and the ceiling made by SU-
8. A good quality of the lithography was achieved more easily thanks to the longstanding
experience in using this photoresist; we used the same doses indicated in the datasheet,
changing only the pre-bake and post bake by applying the same 8°C/min ramps used for X-
ARP in order to avoid thermal shocks to CaF2.
To close the device we had to increase both temperature and pressure, since the patterned
SU-8 has a TG of 175°C.
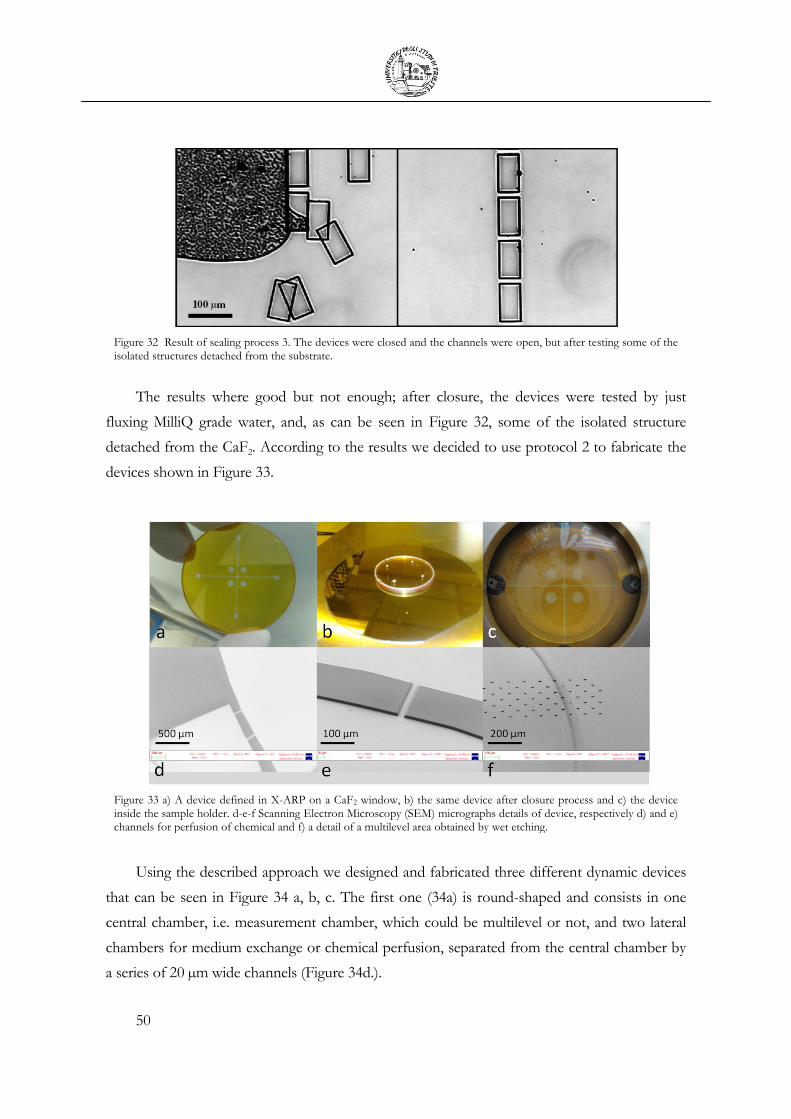
50
Figure 32 Result of sealing process 3. The devices were closed and the channels were open, but after testing some of the isolated structures detached from the substrate.
The results where good but not enough; after closure, the devices were tested by just
fluxing MilliQ grade water, and, as can be seen in Figure 32, some of the isolated structure
detached from the CaF2. According to the results we decided to use protocol 2 to fabricate the
devices shown in Figure 33.
Figure 33 a) A device defined in X-ARP on a CaF2 window, b) the same device after closure process and c) the device inside the sample holder. d-e-f Scanning Electron Microscopy (SEM) micrographs details of device, respectively d) and e) channels for perfusion of chemical and f) a detail of a multilevel area obtained by wet etching.
Using the described approach we designed and fabricated three different dynamic devices
that can be seen in Figure 34 a, b, c. The first one (34a) is round-shaped and consists in one
central chamber, i.e. measurement chamber, which could be multilevel or not, and two lateral
chambers for medium exchange or chemical perfusion, separated from the central chamber by
a series of 20 µm wide channels (Figure 34d.).

51
The second one is rectangular and similarly to the first has a big measurement chamber
with inlets and outlets along the diagonals of the rectangle and a smaller one on the opposite
side separated by a series of channels of variable width (from 12 to 3 µm) (Figure 34e.). These
two lay-outs have been used for chemotaxis experiments and in general to study the effects of
some chemicals on living cells.
The latter device (Figure 34c.) consists in a smaller measurement chamber (500 µm in
diameter) separated in two by a porous sect (a series of channels 5 µm wide and 10 µm long) as
can be seen in Figure 34f. All these devices contain regions separated from the fluidic part used
to collect the background in air during the measurements.
Figure 34 a) Round device for chemotaxis studies X-ARP on a CaF2 window, in d) CAD image detailing the narrow perfusion channels b) Rectangular device for migration studies in e) CAD image of the detail of section variable channels connecting the two chambers. c) Small chamber device and in f) CAD detailing the porous sect.
2.6 Sample Holder
The further step after the establishing of sealing protocol for the devices was to interface
them with the external pumping system, constituted by four Harvard Apparatus Syringe Pumps,
with the heater and the measurement system.
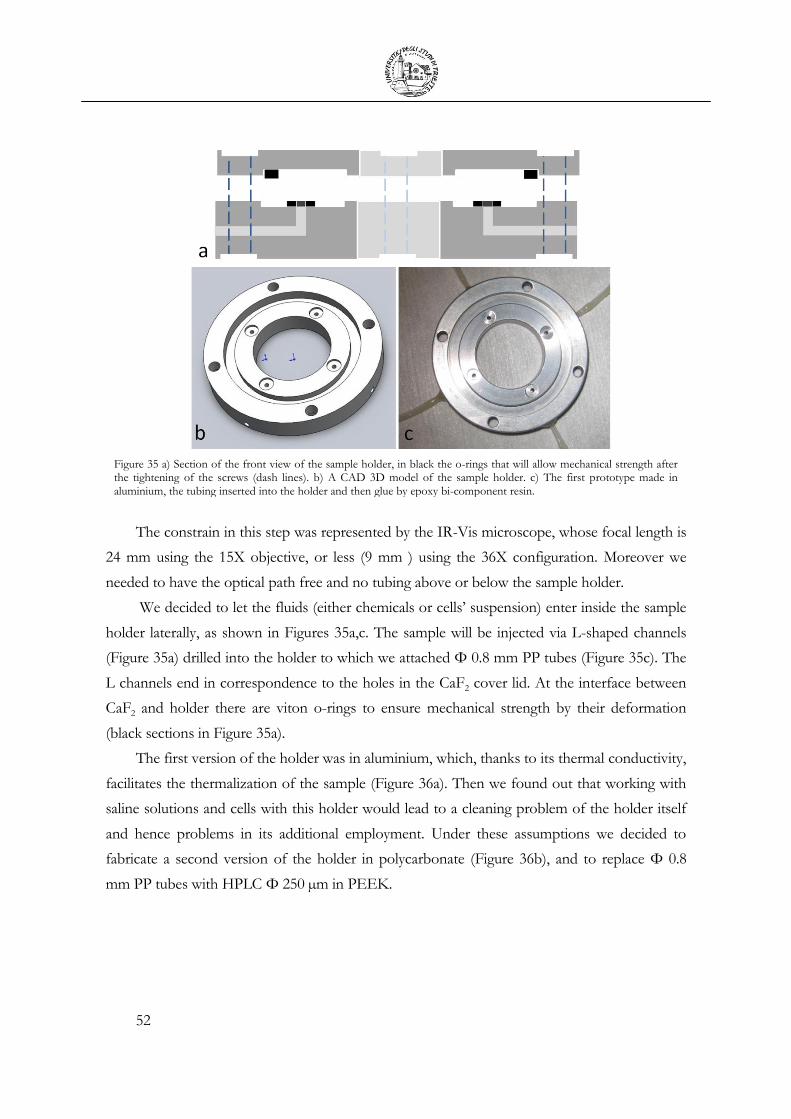
52
Figure 35 a) Section of the front view of the sample holder, in black the o-rings that will allow mechanical strength after the tightening of the screws (dash lines). b) A CAD 3D model of the sample holder. c) The first prototype made in aluminium, the tubing inserted into the holder and then glue by epoxy bi-component resin.
The constrain in this step was represented by the IR-Vis microscope, whose focal length is
24 mm using the 15X objective, or less (9 mm ) using the 36X configuration. Moreover we
needed to have the optical path free and no tubing above or below the sample holder.
We decided to let the fluids (either chemicals or cells’ suspension) enter inside the sample
holder laterally, as shown in Figures 35a,c. The sample will be injected via L-shaped channels
(Figure 35a) drilled into the holder to which we attached Φ 0.8 mm PP tubes (Figure 35c). The
L channels end in correspondence to the holes in the CaF2 cover lid. At the interface between
CaF2 and holder there are viton o-rings to ensure mechanical strength by their deformation
(black sections in Figure 35a).
The first version of the holder was in aluminium, which, thanks to its thermal conductivity,
facilitates the thermalization of the sample (Figure 36a). Then we found out that working with
saline solutions and cells with this holder would lead to a cleaning problem of the holder itself
and hence problems in its additional employment. Under these assumptions we decided to
fabricate a second version of the holder in polycarbonate (Figure 36b), and to replace Φ 0.8
mm PP tubes with HPLC Φ 250 µm in PEEK.

53
Figure 36 a) First prototype of heating chamber. It was a copper mantle in which circulates water at 37°C. b) In the final device the heater is made by a resistor and the temperature is controlled by a thermocouple.
An additional improvement concerned also the engineering of the heater. Since the first
heater was a copper chamber for the circulation of water (Figure 36a), not easily controllable
and transportable, we decided to design and realize a new one, where the heating element is a
flexible resistor embedded inside an aluminium cylinder in which the temperature is measured
via a thermocouple and controlled by an external power pack (Figure 36b).
Considering the complexity of the interfacing holder, the possibility of using the 36X
objective and condenser, was rejected a priori, and we concentrated in fabricating a functional
devices thinner than ~20 mm.
Figure 37 a. First version of the set-up under the IR-VIS Bruker microscope equipped at SISSI beamline @ Elettra. b. Last version of the measurement setup under the Nicolet-Continuum equipped at SMIS beamline @ Soleil.
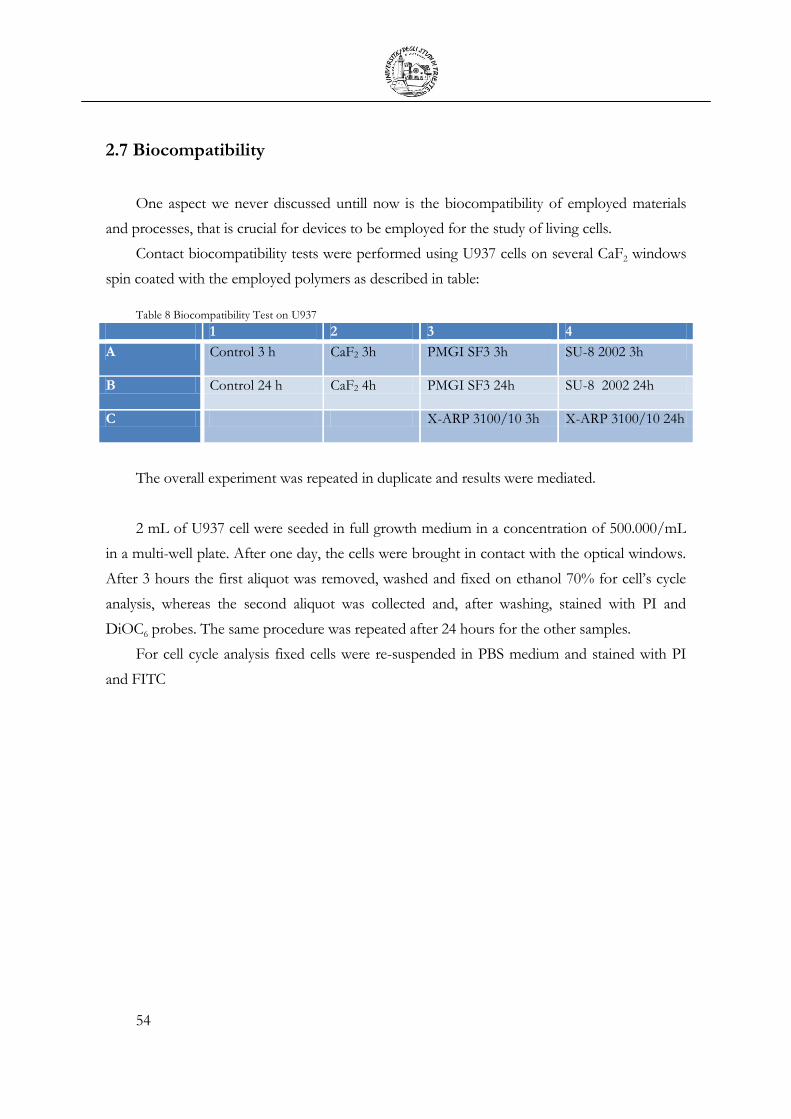
54
2.7 Biocompatibility
One aspect we never discussed untill now is the biocompatibility of employed materials
and processes, that is crucial for devices to be employed for the study of living cells.
Contact biocompatibility tests were performed using U937 cells on several CaF2 windows
spin coated with the employed polymers as described in table:
Table 8 Biocompatibility Test on U937
1 2 3 4
A Control 3 h CaF2 3h PMGI SF3 3h SU-8 2002 3h
B Control 24 h CaF2 4h PMGI SF3 24h SU-8 2002 24h
C X-ARP 3100/10 3h X-ARP 3100/10 24h
The overall experiment was repeated in duplicate and results were mediated.
2 mL of U937 cell were seeded in full growth medium in a concentration of 500.000/mL
in a multi-well plate. After one day, the cells were brought in contact with the optical windows.
After 3 hours the first aliquot was removed, washed and fixed on ethanol 70% for cell’s cycle
analysis, whereas the second aliquot was collected and, after washing, stained with PI and
DiOC6 probes. The same procedure was repeated after 24 hours for the other samples.
For cell cycle analysis fixed cells were re-suspended in PBS medium and stained with PI
and FITC
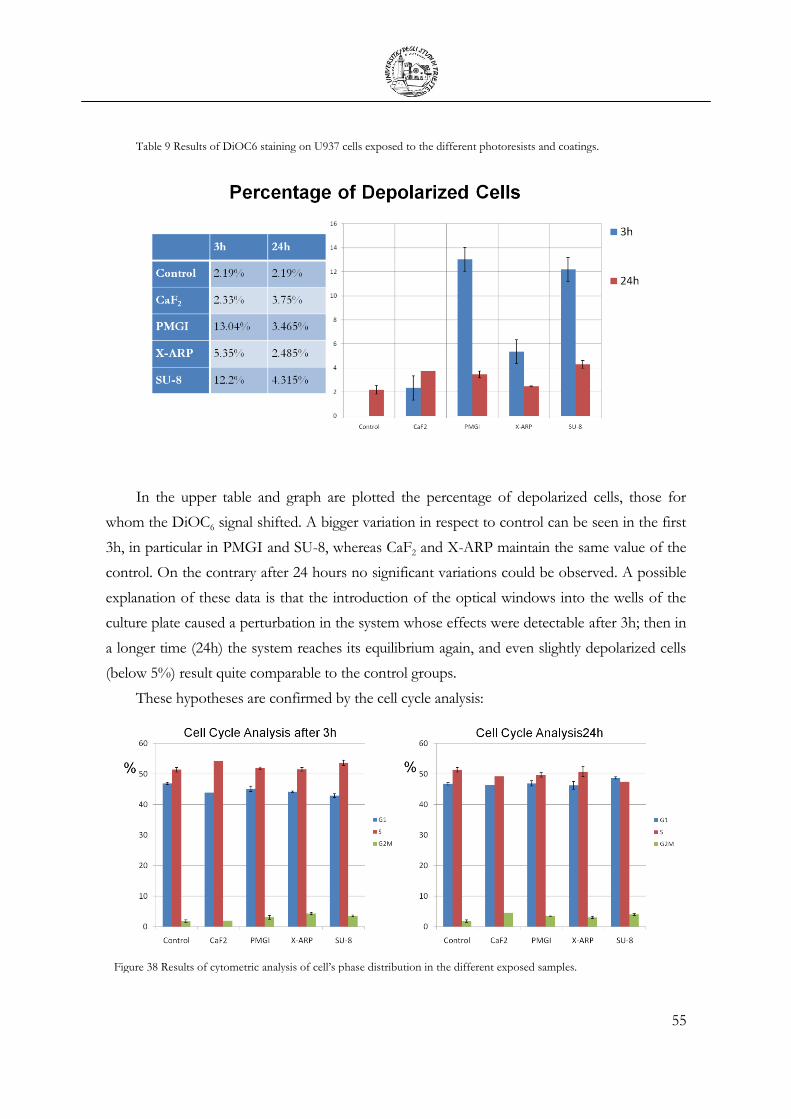
55
Table 9 Results of DiOC6 staining on U937 cells exposed to the different photoresists and coatings.
In the upper table and graph are plotted the percentage of depolarized cells, those for
whom the DiOC6 signal shifted. A bigger variation in respect to control can be seen in the first
3h, in particular in PMGI and SU-8, whereas CaF2 and X-ARP maintain the same value of the
control. On the contrary after 24 hours no significant variations could be observed. A possible
explanation of these data is that the introduction of the optical windows into the wells of the
culture plate caused a perturbation in the system whose effects were detectable after 3h; then in
a longer time (24h) the system reaches its equilibrium again, and even slightly depolarized cells
(below 5%) result quite comparable to the control groups.
These hypotheses are confirmed by the cell cycle analysis:
Figure 38 Results of cytometric analysis of cell’s phase distribution in the different exposed samples.

56
PI/FITC staining for cell cycle analysis showed no significant changes in cell’s cycle
distribution upon the exposure to the different polymers, clue that none of them alters the
metabolism and the viability of the examined cells. The only difference that could be
appreciated concerns the S phase, where “perturbed” cells result retarded in comparison with
control.

57
CHAPTER 3
Immune system studied by
SR-IRMS
In this chapter the IRMS measurements on living monocytes performed during the thesis
are presented. Results coming from flow cytometry are also reported in order to enforce the
reliability of the developed protocols.
After a brief description on the choice of our cellular model, the spectral differences
among live cells measurements and those more commonly performed on fixed cells are
reported, highlighting the advantages of the living cell spectroscopy, in particular in the nucleic
spectral acid region.
In the following it is presented a study on cell deformation, both to verify the validity of
the microfluidic approach for studying living cells, considering the reduced space available to
the cells in this kind of devices, and to mimic processes of cell deformation during the cell life
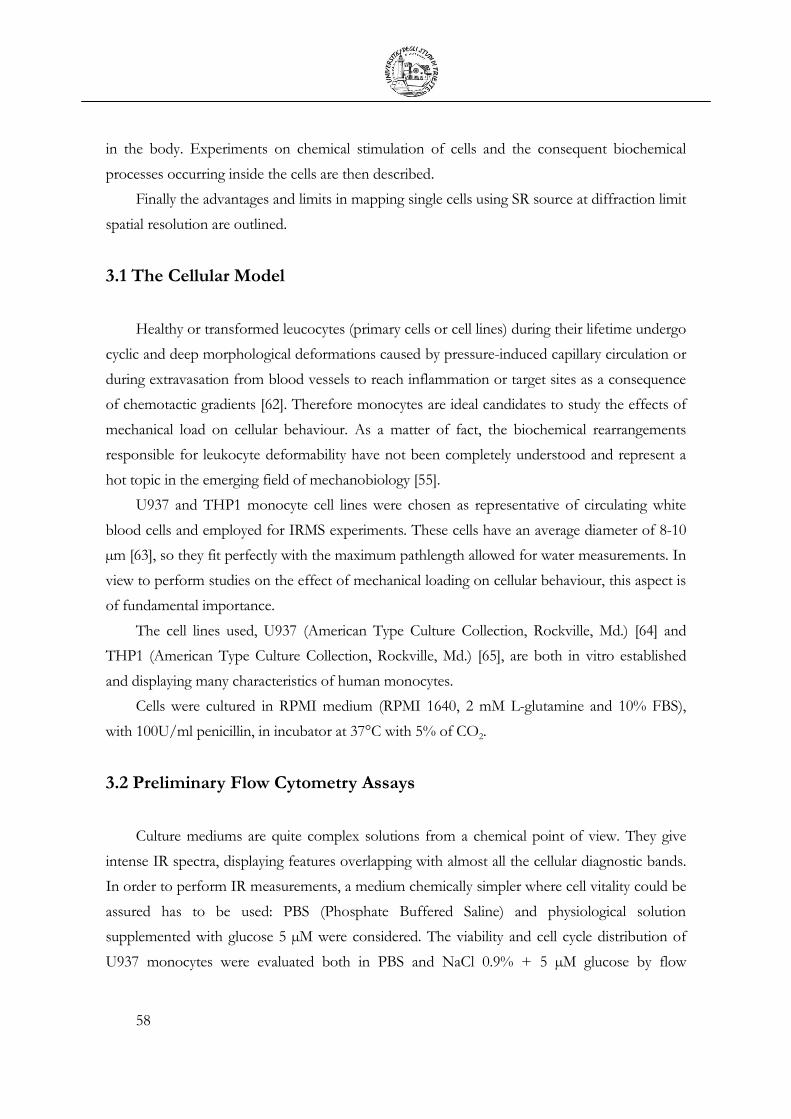
58
in the body. Experiments on chemical stimulation of cells and the consequent biochemical
processes occurring inside the cells are then described.
Finally the advantages and limits in mapping single cells using SR source at diffraction limit
spatial resolution are outlined.
3.1 The Cellular Model
Healthy or transformed leucocytes (primary cells or cell lines) during their lifetime undergo
cyclic and deep morphological deformations caused by pressure-induced capillary circulation or
during extravasation from blood vessels to reach inflammation or target sites as a consequence
of chemotactic gradients [62]. Therefore monocytes are ideal candidates to study the effects of
mechanical load on cellular behaviour. As a matter of fact, the biochemical rearrangements
responsible for leukocyte deformability have not been completely understood and represent a
hot topic in the emerging field of mechanobiology [55].
U937 and THP1 monocyte cell lines were chosen as representative of circulating white
blood cells and employed for IRMS experiments. These cells have an average diameter of 8-10
µm [63], so they fit perfectly with the maximum pathlength allowed for water measurements. In
view to perform studies on the effect of mechanical loading on cellular behaviour, this aspect is
of fundamental importance.
The cell lines used, U937 (American Type Culture Collection, Rockville, Md.) [64] and
THP1 (American Type Culture Collection, Rockville, Md.) [65], are both in vitro established
and displaying many characteristics of human monocytes.
Cells were cultured in RPMI medium (RPMI 1640, 2 mM L-glutamine and 10% FBS),
with 100U/ml penicillin, in incubator at 37°C with 5% of CO2.
3.2 Preliminary Flow Cytometry Assays
Culture mediums are quite complex solutions from a chemical point of view. They give
intense IR spectra, displaying features overlapping with almost all the cellular diagnostic bands.
In order to perform IR measurements, a medium chemically simpler where cell vitality could be
assured has to be used: PBS (Phosphate Buffered Saline) and physiological solution
supplemented with glucose 5 µM were considered. The viability and cell cycle distribution of
U937 monocytes were evaluated both in PBS and NaCl 0.9% + 5 µM glucose by flow

59
cytometry after a period of 90 minutes once removed from the incubator and maintained at
room temperature (RT), the typical conditions of an IRMS experiment; the results were
compared with those obtained by using the complete culture medium (TC) in the same
experimental conditions.
The cell vitality of U937 monocytes was tested after 90 minutes of incubation at RT by
marking the cells with Propidium Iodide (PI), for assessing DNA content diagnostic of cell
viability and cell cycle phase, and with Fluorescein IsoThioCyanate (FITC), active towards
nucleophiles including amine and sulfhydryl groups of proteins (Figure 39). The PI staining did
not show significant evidence of necrotic or apoptotic cells in both PBS and NaCl 0.9%
supplemented with glucose 5 µM. Moreover, the distribution of cells among the cell cycle
phases after 90 min of incubation was found to be independent from the medium used and
comparable to the cells recovered from standard culture conditions. The cellular phase
distribution was determined: 42% G1/G0, 38% S and 20% G2/M (Multicycle ® Analysis).
Figure 39 Cytometric analysis of cell’s phase distribution at experimental like conditions (90 minutes after removal
from the cell incubator at RT) in different media: complete culturing medium (TC), Phosphate Buffered Saline (PBS)
and physiological solution supplemented with glucose 5mM (NaCl). In the first line the 2D plots show the number of
events as a function of the DNA content measured by PI staining. For each plot, from the left to the right, each area
represents cells in G1/G0, S and G2/M. In the second line, the same results are present in the form of a histogram.
Similar experiments were carried out on THP1 cell line, producing the same results: both
NaCl 0.9% + 5 µM glucose and PBS did not alter at all cell viability and cell cycle in the tested
conditions. However, the physiological solution was preferred to PBS in order to limit the
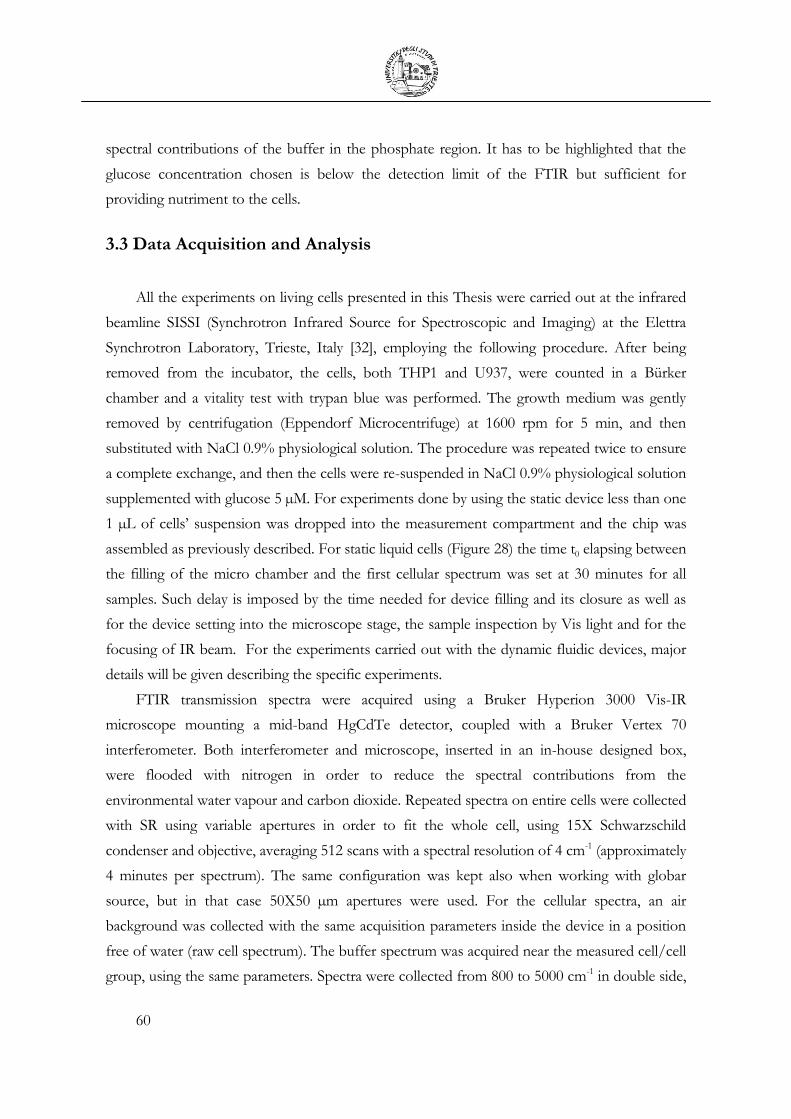
60
spectral contributions of the buffer in the phosphate region. It has to be highlighted that the
glucose concentration chosen is below the detection limit of the FTIR but sufficient for
providing nutriment to the cells.
3.3 Data Acquisition and Analysis
All the experiments on living cells presented in this Thesis were carried out at the infrared
beamline SISSI (Synchrotron Infrared Source for Spectroscopic and Imaging) at the Elettra
Synchrotron Laboratory, Trieste, Italy [32], employing the following procedure. After being
removed from the incubator, the cells, both THP1 and U937, were counted in a Bürker
chamber and a vitality test with trypan blue was performed. The growth medium was gently
removed by centrifugation (Eppendorf Microcentrifuge) at 1600 rpm for 5 min, and then
substituted with NaCl 0.9% physiological solution. The procedure was repeated twice to ensure
a complete exchange, and then the cells were re-suspended in NaCl 0.9% physiological solution
supplemented with glucose 5 µM. For experiments done by using the static device less than one
1 µL of cells’ suspension was dropped into the measurement compartment and the chip was
assembled as previously described. For static liquid cells (Figure 28) the time t0 elapsing between
the filling of the micro chamber and the first cellular spectrum was set at 30 minutes for all
samples. Such delay is imposed by the time needed for device filling and its closure as well as
for the device setting into the microscope stage, the sample inspection by Vis light and for the
focusing of IR beam. For the experiments carried out with the dynamic fluidic devices, major
details will be given describing the specific experiments.
FTIR transmission spectra were acquired using a Bruker Hyperion 3000 Vis-IR
microscope mounting a mid-band HgCdTe detector, coupled with a Bruker Vertex 70
interferometer. Both interferometer and microscope, inserted in an in-house designed box,
were flooded with nitrogen in order to reduce the spectral contributions from the
environmental water vapour and carbon dioxide. Repeated spectra on entire cells were collected
with SR using variable apertures in order to fit the whole cell, using 15X Schwarzschild
condenser and objective, averaging 512 scans with a spectral resolution of 4 cm-1 (approximately
4 minutes per spectrum). The same configuration was kept also when working with globar
source, but in that case 50X50 µm apertures were used. For the cellular spectra, an air
background was collected with the same acquisition parameters inside the device in a position
free of water (raw cell spectrum). The buffer spectrum was acquired near the measured cell/cell
group, using the same parameters. Spectra were collected from 800 to 5000 cm-1 in double side,
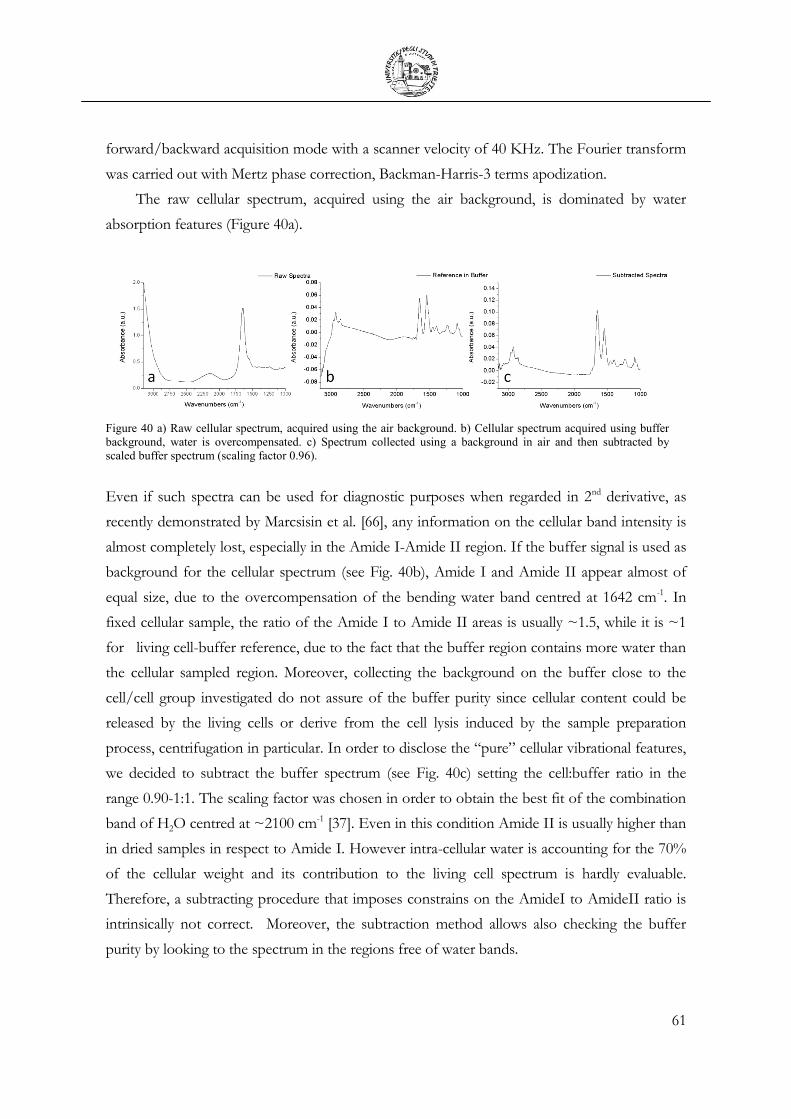
61
forward/backward acquisition mode with a scanner velocity of 40 KHz. The Fourier transform
was carried out with Mertz phase correction, Backman-Harris-3 terms apodization.
The raw cellular spectrum, acquired using the air background, is dominated by water
absorption features (Figure 40a).
Even if such spectra can be used for diagnostic purposes when regarded in 2nd derivative, as
recently demonstrated by Marcsisin et al. [66], any information on the cellular band intensity is
almost completely lost, especially in the Amide I-Amide II region. If the buffer signal is used as
background for the cellular spectrum (see Fig. 40b), Amide I and Amide II appear almost of
equal size, due to the overcompensation of the bending water band centred at 1642 cm-1. In
fixed cellular sample, the ratio of the Amide I to Amide II areas is usually ~1.5, while it is ~1
for living cell-buffer reference, due to the fact that the buffer region contains more water than
the cellular sampled region. Moreover, collecting the background on the buffer close to the
cell/cell group investigated do not assure of the buffer purity since cellular content could be
released by the living cells or derive from the cell lysis induced by the sample preparation
process, centrifugation in particular. In order to disclose the “pure” cellular vibrational features,
we decided to subtract the buffer spectrum (see Fig. 40c) setting the cell:buffer ratio in the
range 0.90-1:1. The scaling factor was chosen in order to obtain the best fit of the combination
band of H2O centred at ~2100 cm-1 [37]. Even in this condition Amide II is usually higher than
in dried samples in respect to Amide I. However intra-cellular water is accounting for the 70%
of the cellular weight and its contribution to the living cell spectrum is hardly evaluable.
Therefore, a subtracting procedure that imposes constrains on the AmideI to AmideII ratio is
intrinsically not correct. Moreover, the subtraction method allows also checking the buffer
purity by looking to the spectrum in the regions free of water bands.
Figure 40 a) Raw cellular spectrum, acquired using the air background. b) Cellular spectrum acquired using buffer
background, water is overcompensated. c) Spectrum collected using a background in air and then subtracted by
scaled buffer spectrum (scaling factor 0.96).
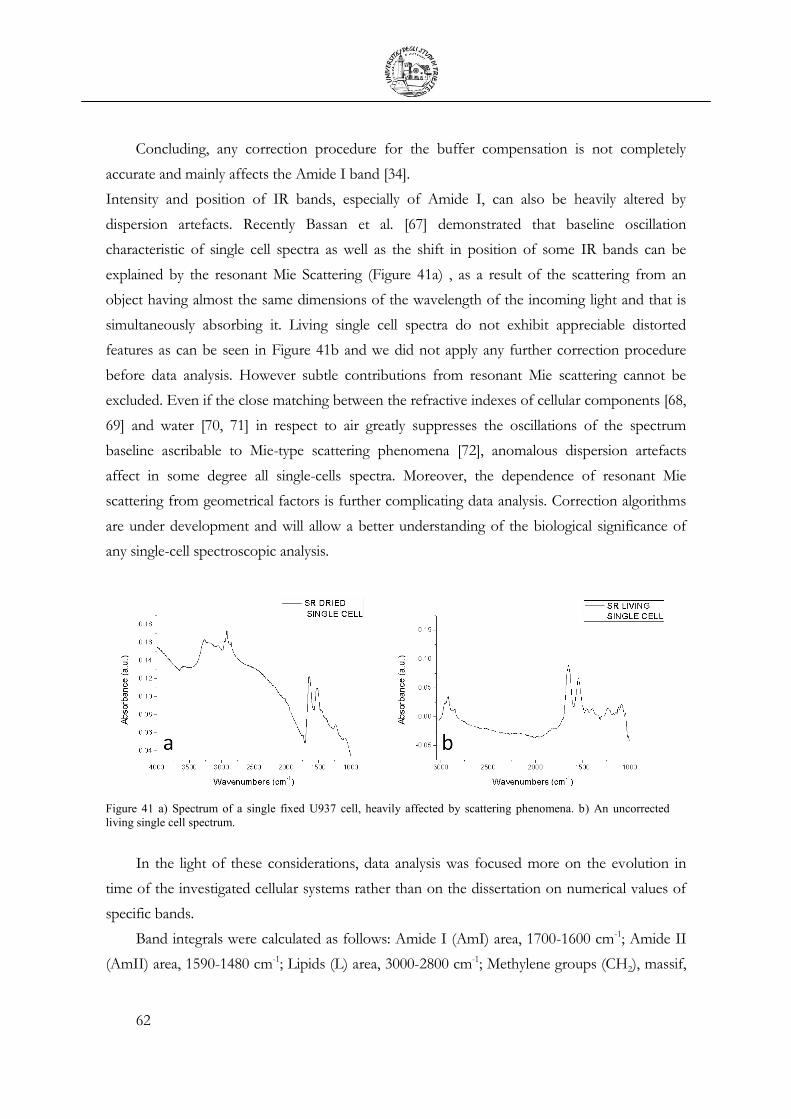
62
Concluding, any correction procedure for the buffer compensation is not completely
accurate and mainly affects the Amide I band [34].
Intensity and position of IR bands, especially of Amide I, can also be heavily altered by
dispersion artefacts. Recently Bassan et al. [67] demonstrated that baseline oscillation
characteristic of single cell spectra as well as the shift in position of some IR bands can be
explained by the resonant Mie Scattering (Figure 41a) , as a result of the scattering from an
object having almost the same dimensions of the wavelength of the incoming light and that is
simultaneously absorbing it. Living single cell spectra do not exhibit appreciable distorted
features as can be seen in Figure 41b and we did not apply any further correction procedure
before data analysis. However subtle contributions from resonant Mie scattering cannot be
excluded. Even if the close matching between the refractive indexes of cellular components [68,
69] and water [70, 71] in respect to air greatly suppresses the oscillations of the spectrum
baseline ascribable to Mie-type scattering phenomena [72], anomalous dispersion artefacts
affect in some degree all single-cells spectra. Moreover, the dependence of resonant Mie
scattering from geometrical factors is further complicating data analysis. Correction algorithms
are under development and will allow a better understanding of the biological significance of
any single-cell spectroscopic analysis.
In the light of these considerations, data analysis was focused more on the evolution in
time of the investigated cellular systems rather than on the dissertation on numerical values of
specific bands.
Band integrals were calculated as follows: Amide I (AmI) area, 1700-1600 cm-1; Amide II
(AmII) area, 1590-1480 cm-1; Lipids (L) area, 3000-2800 cm-1; Methylene groups (CH2), massif,
Figure 41 a) Spectrum of a single fixed U937 cell, heavily affected by scattering phenomena. b) An uncorrected
living single cell spectrum.
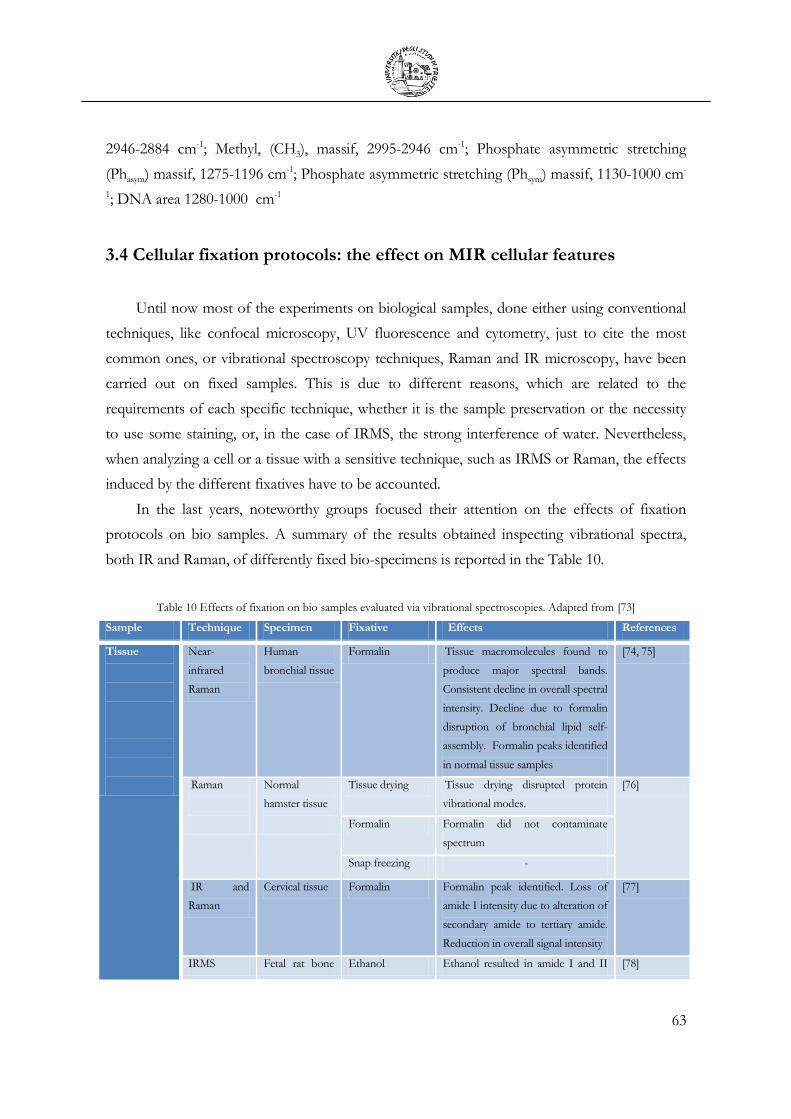
63
2946-2884 cm-1; Methyl, (CH3), massif, 2995-2946 cm-1; Phosphate asymmetric stretching
(Phasym) massif, 1275-1196 cm-1; Phosphate asymmetric stretching (Phsym) massif, 1130-1000 cm-
1; DNA area 1280-1000 cm-1
3.4 Cellular fixation protocols: the effect on MIR cellular features
Until now most of the experiments on biological samples, done either using conventional
techniques, like confocal microscopy, UV fluorescence and cytometry, just to cite the most
common ones, or vibrational spectroscopy techniques, Raman and IR microscopy, have been
carried out on fixed samples. This is due to different reasons, which are related to the
requirements of each specific technique, whether it is the sample preservation or the necessity
to use some staining, or, in the case of IRMS, the strong interference of water. Nevertheless,
when analyzing a cell or a tissue with a sensitive technique, such as IRMS or Raman, the effects
induced by the different fixatives have to be accounted.
In the last years, noteworthy groups focused their attention on the effects of fixation
protocols on bio samples. A summary of the results obtained inspecting vibrational spectra,
both IR and Raman, of differently fixed bio-specimens is reported in the Table 10.
Table 10 Effects of fixation on bio samples evaluated via vibrational spectroscopies. Adapted from [73]
Sample Technique Specimen Fixative Effects References
Tissue
Near-
infrared
Raman
Human
bronchial tissue
Formalin Tissue macromolecules found to
produce major spectral bands.
Consistent decline in overall spectral
intensity. Decline due to formalin
disruption of bronchial lipid self-
assembly. Formalin peaks identified
in normal tissue samples
[74, 75]
Raman
Normal
hamster tissue
Tissue drying Tissue drying disrupted protein
vibrational modes.
[76]
Formalin Formalin did not contaminate
spectrum
Snap freezing -
IR and
Raman
Cervical tissue Formalin Formalin peak identified. Loss of
amide I intensity due to alteration of
secondary amide to tertiary amide.
Reduction in overall signal intensity
[77]
IRMS Fetal rat bone Ethanol Ethanol resulted in amide I and II [78]
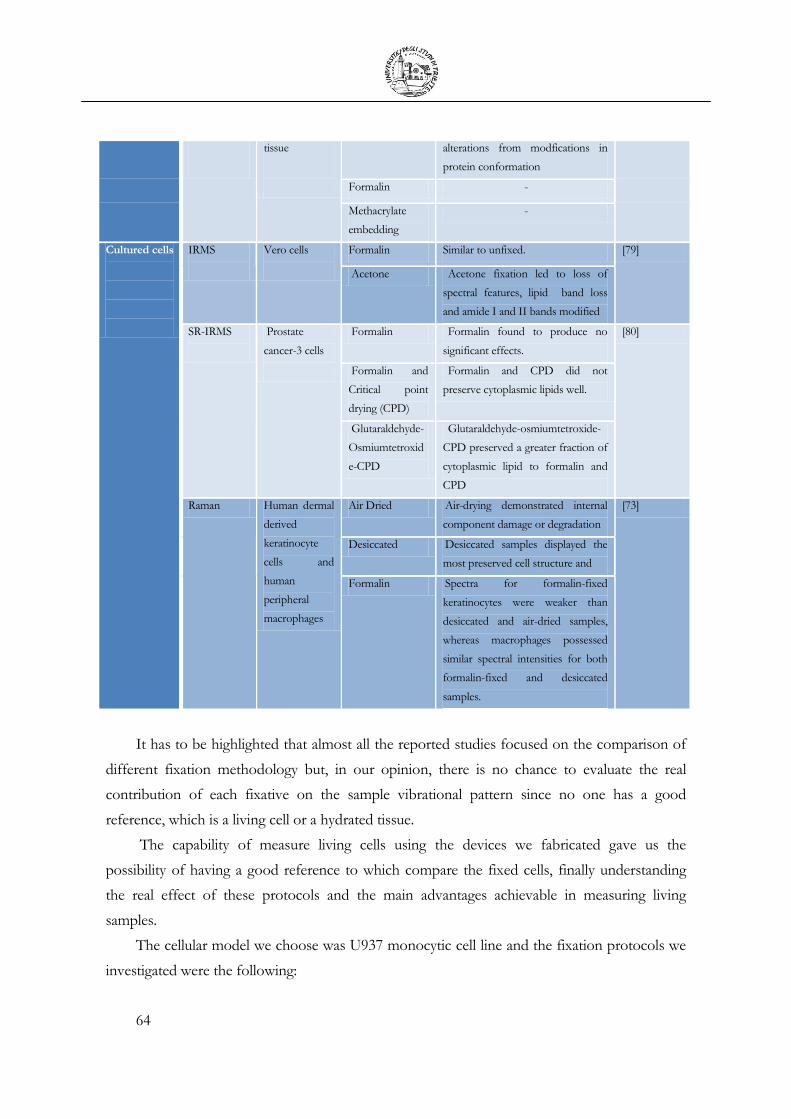
64
tissue
alterations from modfications in
protein conformation
Formalin -
Methacrylate
embedding
-
Cultured cells
IRMS
Vero cells
Formalin Similar to unfixed. [79]
Acetone Acetone fixation led to loss of
spectral features, lipid band loss
and amide I and II bands modified
SR-IRMS
Prostate
cancer-3 cells
Formalin Formalin found to produce no
significant effects.
[80]
Formalin and
Critical point
drying (CPD)
Formalin and CPD did not
preserve cytoplasmic lipids well.
Glutaraldehyde-
Osmiumtetroxid
e-CPD
Glutaraldehyde-osmiumtetroxide-
CPD preserved a greater fraction of
cytoplasmic lipid to formalin and
CPD
Raman Human dermal
derived
keratinocyte
cells and
human
peripheral
macrophages
Air Dried Air-drying demonstrated internal
component damage or degradation
[73]
Desiccated Desiccated samples displayed the
most preserved cell structure and
Formalin Spectra for formalin-fixed
keratinocytes were weaker than
desiccated and air-dried samples,
whereas macrophages possessed
similar spectral intensities for both
formalin-fixed and desiccated
samples.
It has to be highlighted that almost all the reported studies focused on the comparison of
different fixation methodology but, in our opinion, there is no chance to evaluate the real
contribution of each fixative on the sample vibrational pattern since no one has a good
reference, which is a living cell or a hydrated tissue.
The capability of measure living cells using the devices we fabricated gave us the
possibility of having a good reference to which compare the fixed cells, finally understanding
the real effect of these protocols and the main advantages achievable in measuring living
samples.
The cellular model we choose was U937 monocytic cell line and the fixation protocols we
investigated were the following:

65
Formalin 4% fixation in adhesion;
Formalin 4% fixation in suspension;
Ethanol 70% fixation in adhesion;
Ethanol 70% fixation in suspension;
Air Drying in adhesion;
For cells fixed in adhesion the following protocol was applied: 30 µL of a suspension
(300.000 cells/mL) were dropped onto the CaF2, incubated at 4°C for 20 minutes to let adhere
on the surface. Once removed the excess, the fixative was added and left to act at room
temperature for 20 minutes. The fixative was then removed and cells washed with deionized
water (DI). Whereas for cells in suspension: 40 µL of U937 suspension (1.000.000 cells/mL) in
PBS, were diluted in 1 mL of fixative. Then a drop of fixed cells was deposited onto the CaF2
window, the excess of liquid was removed and cells washed with DI water. Regarding air
drying, a 50 µL drop of cell suspension (250.000 cells/mL) in PBS was spotted on a CaF2
window, incubated at 4°C to let cells adhere on the surface, and then air dried at room
temperature for 1 hour; then the excess of cells and the PBS crystal were removed by gently
rinsing in DI water, at the and the sample was vacuum dried overnight.
All the data acquired were then compared with spectra of living cells, prepared as follows:
U937 were removed from culture medium (1.000.000 cells/mL) and buffer exchanged with
NaCl 0.9 %. Two microliters of the cell suspension was dropped into an 8 um thick static
device, as to not induce any sample deformation, issue that will be discussed and clarified in
next session.
Carrying out these experiments, we did both single cell SR measurements (for living cells at
Elettra and for fixed at SMIS beamline at Soleil – France [81]) and average measurements on
densely packed cell monolayers using 50x50 µm apertures (~20-30 cells) and conventional
Globar MIR source. Data acquired on cell carpets should be only slightly affected by resonant
Mie scattering [67], while spectra of single fixed cells they are. For such a reason, we will discuss
first the results obtained on cell monolayers.
First of all we investigated the differences among each fixative in suspension versus the
same in adhesion. To highlight spectral changes we decided to analyze the 2nd derivatives of
spectra. For both ethanol and formalin, in the region 3000-2800 cm-1 significant difference
could not be appreciated (see Figure 42 b and d): the spectra are almost superimposable, hint
that the effect of both fixatives on the membranes of either adherent or floating cells is the
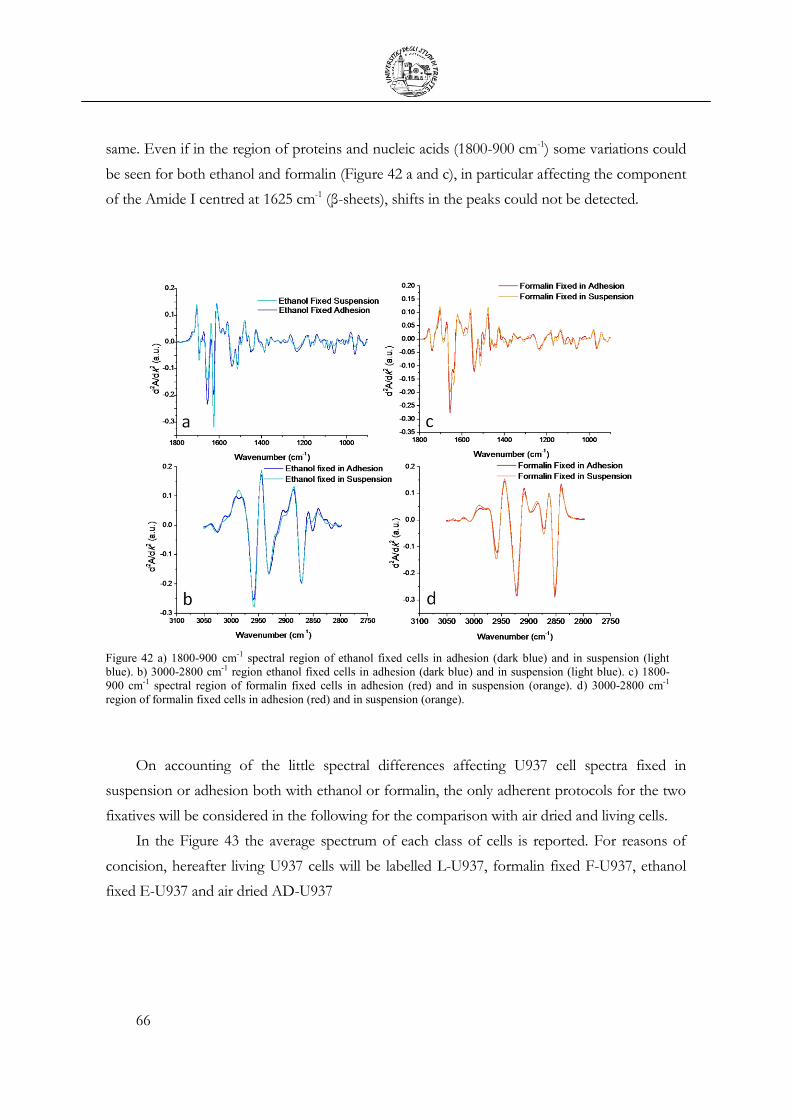
66
same. Even if in the region of proteins and nucleic acids (1800-900 cm-1) some variations could
be seen for both ethanol and formalin (Figure 42 a and c), in particular affecting the component
of the Amide I centred at 1625 cm-1 (β-sheets), shifts in the peaks could not be detected.
On accounting of the little spectral differences affecting U937 cell spectra fixed in
suspension or adhesion both with ethanol or formalin, the only adherent protocols for the two
fixatives will be considered in the following for the comparison with air dried and living cells.
In the Figure 43 the average spectrum of each class of cells is reported. For reasons of
concision, hereafter living U937 cells will be labelled L-U937, formalin fixed F-U937, ethanol
fixed E-U937 and air dried AD-U937
Figure 42 a) 1800-900 cm-1 spectral region of ethanol fixed cells in adhesion (dark blue) and in suspension (light
blue). b) 3000-2800 cm-1 region ethanol fixed cells in adhesion (dark blue) and in suspension (light blue). c) 1800-
900 cm-1 spectral region of formalin fixed cells in adhesion (red) and in suspension (orange). d) 3000-2800 cm-1
region of formalin fixed cells in adhesion (red) and in suspension (orange).

67
For data analysis, the multivariate statistical approach of cluster analysis has been selected.
The cluster analysis is a classification method based on the calculation of the spectral distances.
The spectral distance indicates the degree of spectral similarity. Two spectra with a spectral
distance of 0 are entirely identical (within the frequency ranges tested). The higher is the
difference between two spectra, the higher will result the spectral distance.
Once retrieved the spectral distances between each pair of spectra of the dataset (or their
derivatives) by using the desired algorithm for distance calculation (for example Euclidean
distances), therefore once generated a distance-matrix, the spectra are grouped together on the
base of the clustering algorithm (different algorithms can be chosen also in this case) and the
graphical result of the grouping procedure is a dendrogram [82].
Vector normalized second derivatives of cellular spectra have been first analyzed in the
3000-2800 cm-1 region: Euclidean distances have been chosen and the Ward’s algorithm applied
for the classification [83]. As it can be appreciated from the dendrogram (Figure 44), E-U937
Figure 43 Average spectrum of a) Air Dried U937 b) Formalin fixed cells c) Living U937 and Ethanol fixed cells; in
the insets of each spectrum an optical image of the sampled cells.
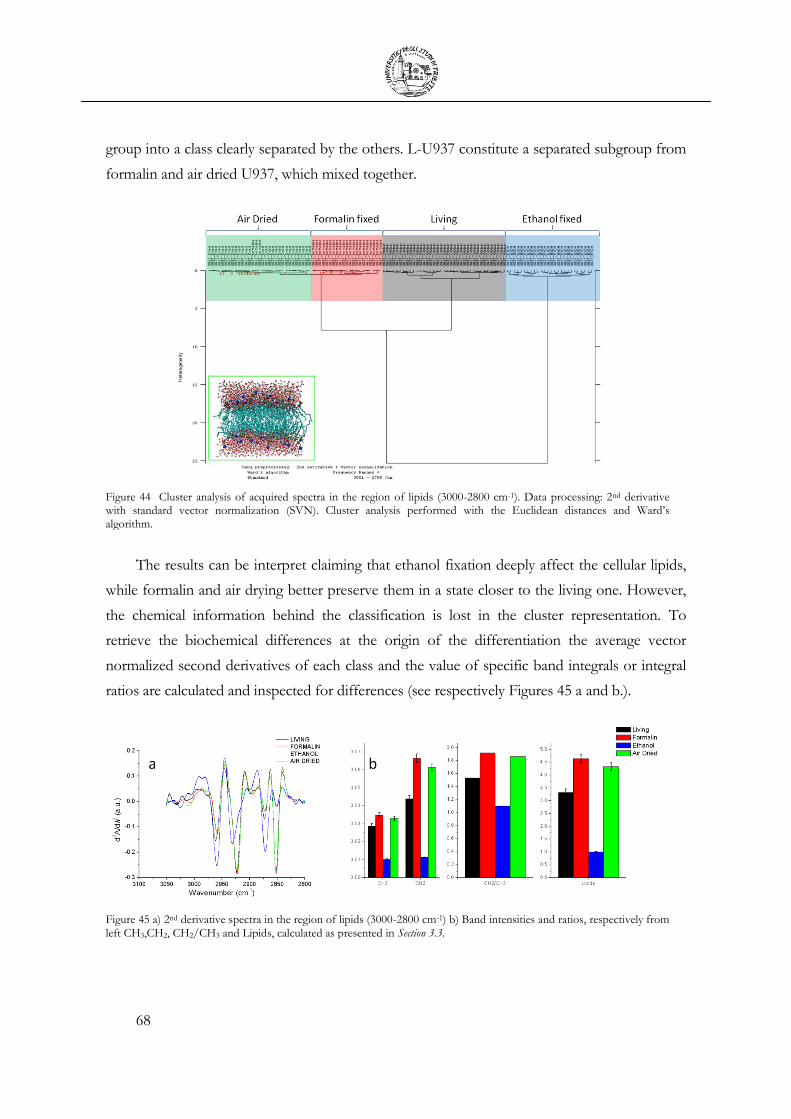
68
group into a class clearly separated by the others. L-U937 constitute a separated subgroup from
formalin and air dried U937, which mixed together.
The results can be interpret claiming that ethanol fixation deeply affect the cellular lipids,
while formalin and air drying better preserve them in a state closer to the living one. However,
the chemical information behind the classification is lost in the cluster representation. To
retrieve the biochemical differences at the origin of the differentiation the average vector
normalized second derivatives of each class and the value of specific band integrals or integral
ratios are calculated and inspected for differences (see respectively Figures 45 a and b.).
Figure 44 Cluster analysis of acquired spectra in the region of lipids (3000-2800 cm-1). Data processing: 2nd derivative with standard vector normalization (SVN). Cluster analysis performed with the Euclidean distances and Ward’s algorithm.
Figure 45 a) 2nd derivative spectra in the region of lipids (3000-2800 cm-1) b) Band intensities and ratios, respectively from left CH3,CH2, CH2/CH3 and Lipids, calculated as presented in Section 3.3.

69
The shifts at higher wavenumbers of the methylene asymmetric stretching band of E-
U937 from 2925 to 2930 cm-1 evidences for an altered membrane lipid order [84, 85] while the
reduced intensity of both methyl and methylene asymmetric and symmetric stretching bands is
indicative of a considerable decrement in lipidic cellular content. Moreover, the change in
methyl to methylene ratio indicates an altered composition in cellular membrane where lipids
richer in methyl moieties are more abundant in E-U937. The disappearance of the carbonyl
stretching bands of phospholipids in the 1750-1700 cm-1 region, shown in Figure 43d, is
enforcing our hypothesis. The conclusions drawn out are in agreement with the known effects
of ethanol on cellular biochemistry. Ethanol extracts lipids from cells [86] while formalin
preserve lipids by reacting with unsaturated hydrocarbon chains in its hydrated form. Moreover
ethanol causes a decrease in cell volume due to the intracellular water extraction with
consequent cell shrinkage. Such aspect can be clearly appreciated looking to Figure 46, where
SEM micrographs of AD-U937, E-U937 and F-U937 are presented, taken after the IRMS
measurements: the spherical morphology of U937 cells is preserved after formalin and air
drying while it changes dramatically after ethanol fixation. Air drying could cause the collapse of
internal cellular structures, due to the sudden variation of cellular osmotic pressure during the
drying. However, the results achievable with such method are extremely sensitive to the specific
protocol used. The one we set gave good results in term of preservation of both cellular
morphology and biochemistry.
Ethanol is also known to displace water from proteins, resulting in denaturation of water
soluble proteins and consequent precipitation. Also air drying induces protein denaturation as a
consequence of the activation of cell autolysis. On the contrary, formalin is known to preserve
the secondary structure of proteins being a coagulative protein fixative that cause the
crosslinking of primary and secondary amine groups [86]. This different mechanism of action
can be appreciated from the inspection of the dendogram in Figure 47, where the four groups
Figure 46 SEM micrographs of fixed U937 cells: a) Air dried cells on CaF2 b) Ethanol fixed cells and c) Formalin fixed. (scale bar 10 µm)
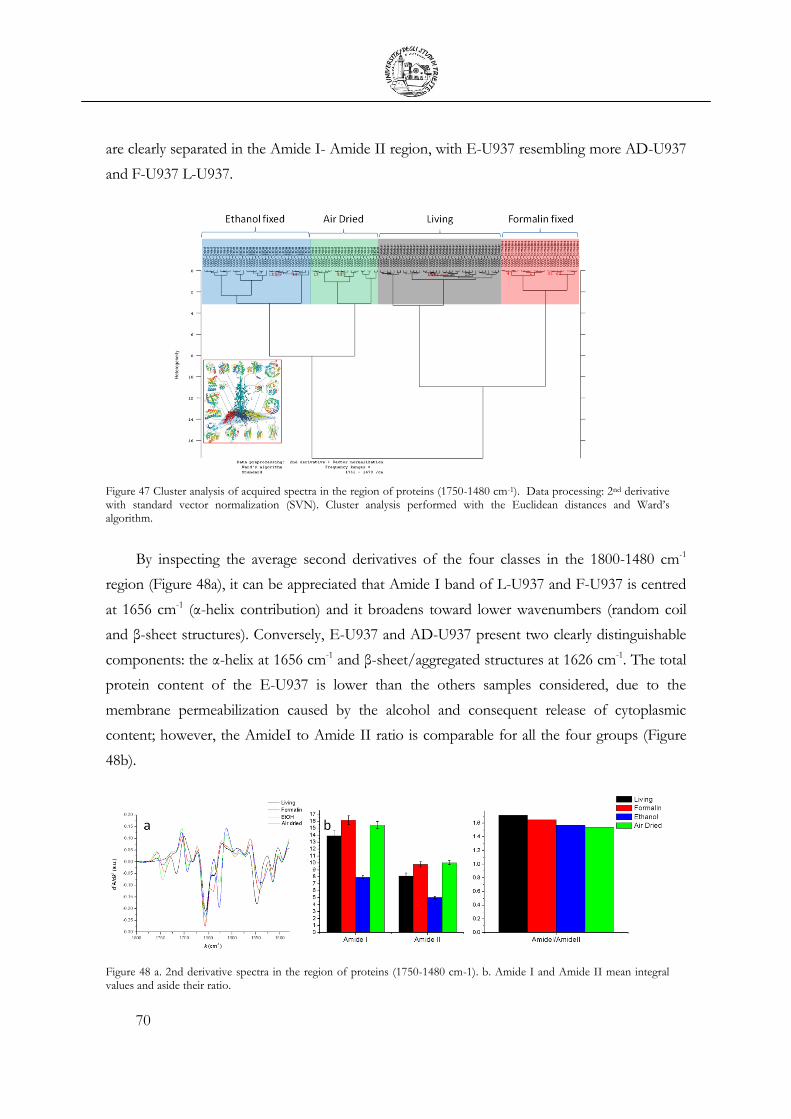
70
are clearly separated in the Amide I- Amide II region, with E-U937 resembling more AD-U937
and F-U937 L-U937.
By inspecting the average second derivatives of the four classes in the 1800-1480 cm-1
region (Figure 48a), it can be appreciated that Amide I band of L-U937 and F-U937 is centred
at 1656 cm-1 (α-helix contribution) and it broadens toward lower wavenumbers (random coil
and β-sheet structures). Conversely, E-U937 and AD-U937 present two clearly distinguishable
components: the α-helix at 1656 cm-1 and β-sheet/aggregated structures at 1626 cm-1. The total
protein content of the E-U937 is lower than the others samples considered, due to the
membrane permeabilization caused by the alcohol and consequent release of cytoplasmic
content; however, the AmideI to Amide II ratio is comparable for all the four groups (Figure
48b).
Figure 47 Cluster analysis of acquired spectra in the region of proteins (1750-1480 cm-1). Data processing: 2nd derivative with standard vector normalization (SVN). Cluster analysis performed with the Euclidean distances and Ward’s algorithm.
Figure 48 a. 2nd derivative spectra in the region of proteins (1750-1480 cm-1). b. Amide I and Amide II mean integral values and aside their ratio.

71
Paying attention to the 1750-1700 cm-1 region it is possible to appreciate that, beside the
carbonyl ester band of phospholipids (1740-1745 cm-1), and extra band centred at 1716 cm-1 is
present only for L-U937. This band can be assigned to the hydrated form of phosphodiester
bond of nucleic acids, therefore appreciable only in living conditions [87]. It is indeed the
nucleic acid region, below 1280 cm-1, where living U937 cells greatly differ from all the fixed
investigated (see Figure 49).
This difference is even more evident when looking to the second derivatives of the spectra
(see Figure 50). As a matter of fact only under physiologic conditions it is possible to identify
the bands of DNA conformers (see table 3), detectable by the splitting in two different
components of the asymmetric PO2- stretching 1245-1225 cm-1 attributed respectively to RNA
and to B form of DNA and by the increase of the 1088 cm-1 symmetric PO2- band.
As a matter of fact DNA has three main different conformers A, B and Z [88], although
only B and Z have been confirmed to have a biological role in living beings [89, 90] and A-
DNA appears to occur only in dehydrated samples [91].
Figure 49 Cluster analysis of acquired spectra in the region of nucleic acids (1280-1000 cm-1). Data processing: 2nd derivative with standard vector normalization (SVN). Cluster analysis performed with the Euclidean distances and Ward’s algorithm.
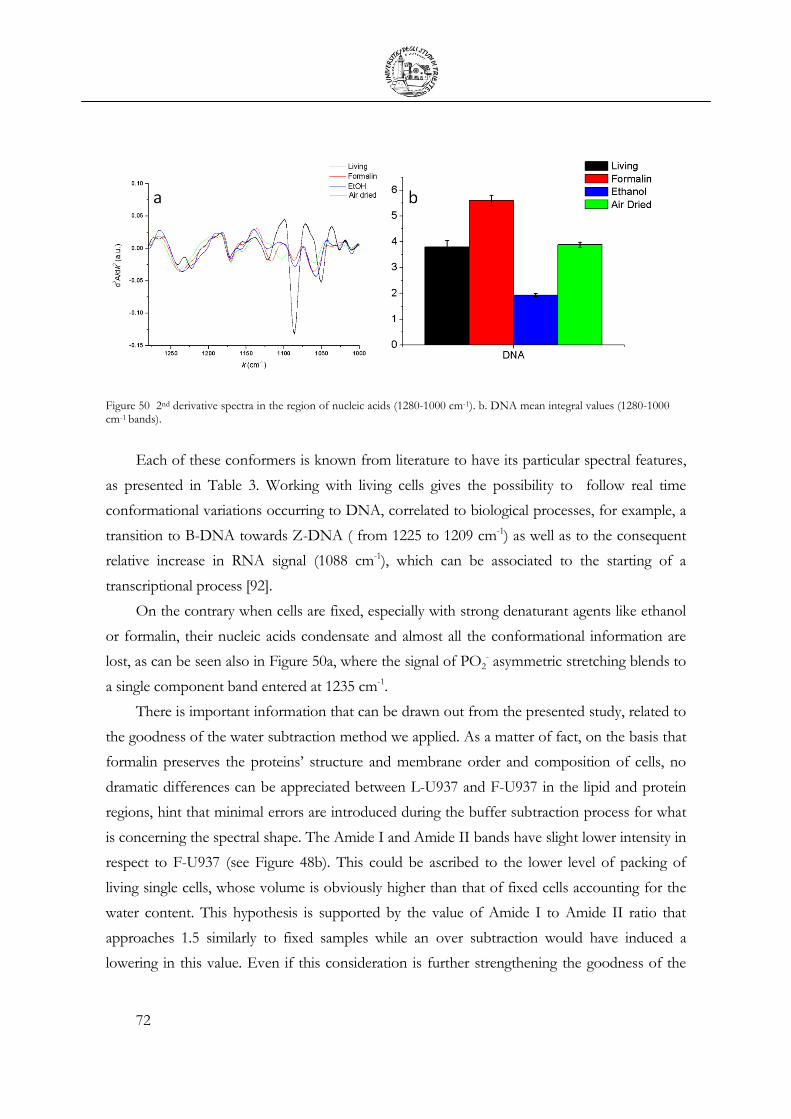
72
Each of these conformers is known from literature to have its particular spectral features,
as presented in Table 3. Working with living cells gives the possibility to follow real time
conformational variations occurring to DNA, correlated to biological processes, for example, a
transition to B-DNA towards Z-DNA ( from 1225 to 1209 cm-1) as well as to the consequent
relative increase in RNA signal (1088 cm-1), which can be associated to the starting of a
transcriptional process [92].
On the contrary when cells are fixed, especially with strong denaturant agents like ethanol
or formalin, their nucleic acids condensate and almost all the conformational information are
lost, as can be seen also in Figure 50a, where the signal of PO2- asymmetric stretching blends to
a single component band entered at 1235 cm-1.
There is important information that can be drawn out from the presented study, related to
the goodness of the water subtraction method we applied. As a matter of fact, on the basis that
formalin preserves the proteins’ structure and membrane order and composition of cells, no
dramatic differences can be appreciated between L-U937 and F-U937 in the lipid and protein
regions, hint that minimal errors are introduced during the buffer subtraction process for what
is concerning the spectral shape. The Amide I and Amide II bands have slight lower intensity in
respect to F-U937 (see Figure 48b). This could be ascribed to the lower level of packing of
living single cells, whose volume is obviously higher than that of fixed cells accounting for the
water content. This hypothesis is supported by the value of Amide I to Amide II ratio that
approaches 1.5 similarly to fixed samples while an over subtraction would have induced a
lowering in this value. Even if this consideration is further strengthening the goodness of the
Figure 50 2nd derivative spectra in the region of nucleic acids (1280-1000 cm-1). b. DNA mean integral values (1280-1000 cm-1 bands).
73
subtraction protocol, quantitative consideration on the Amide I will be avoided in the following
for the multiple reasons already highlighted.
The same analytical procedure employed for the analysis of cell monolayers was used for
the analysis of single cell spectra acquired by using SR. As highlighted in the Section 3.3, Data
acquisition and analysis, single cell spectra are distorted by the so called “dispersion artifacts”,
related to resonant Mie scattering phenomena introduced by an absorbing body having
dimensions similar to the wavelength of the incoming light. For the living cell spectra, such
artifacts are smoothed due the close matching between the refractive indexes of the water
medium and the cellular sample (see Figure 41b). For fixed cells measured in air, the scattering
contribution to the spectral shape could be dramatic. It depends by many factors, first of all the
cellular morphology and complex nature of the refractive index. For the investigated fixation
protocols, E-U937 exhibited strongest scattering distortions. For correcting these effects we
applied the RMieS correction algorithm developed by Bassan et al. [67, 93] that gently provided
us the program. Without entering the algorithm details, that can be recovered from the cited
scientific publications, the program needs as input data i- the lower and upper range for the
scattering particle diameter, that we know from SEM analysis ii-the low and upper range for the
average refractive index of the scattering bodies, the we fixed in the interval 1.2-1.6, accordingly
to scientific literature [94], and iii- a reference spectrum that should be as much as possible
dispersion-artifacts free. The option to employ the spectrum of a Matrigel layer as reference is
foreseen by the program (Matrigel is a mixture of gelatinous proteins secreted by mouse
sarcoma cells). We applied the correction algorithm to both formalin and ethanol fixed U937
cells, using a custom reference spectrum. For single E-U937, the reference spectrum was built
as in the following: the cellular spectra of U937 collected from the cell monolayer were base line
corrected (rubberband correction, 64 base line points), vector normalized and then averaged.
The average spectrum was taken as reference. For the formalin fixed single cells, the reference
spectrum was obtained following the same procedure. The effects of the correction algorithm
on the spectral shape can be appreciated in Figures 51 and 52 for formalin and ethanol fixed
cells respectively.
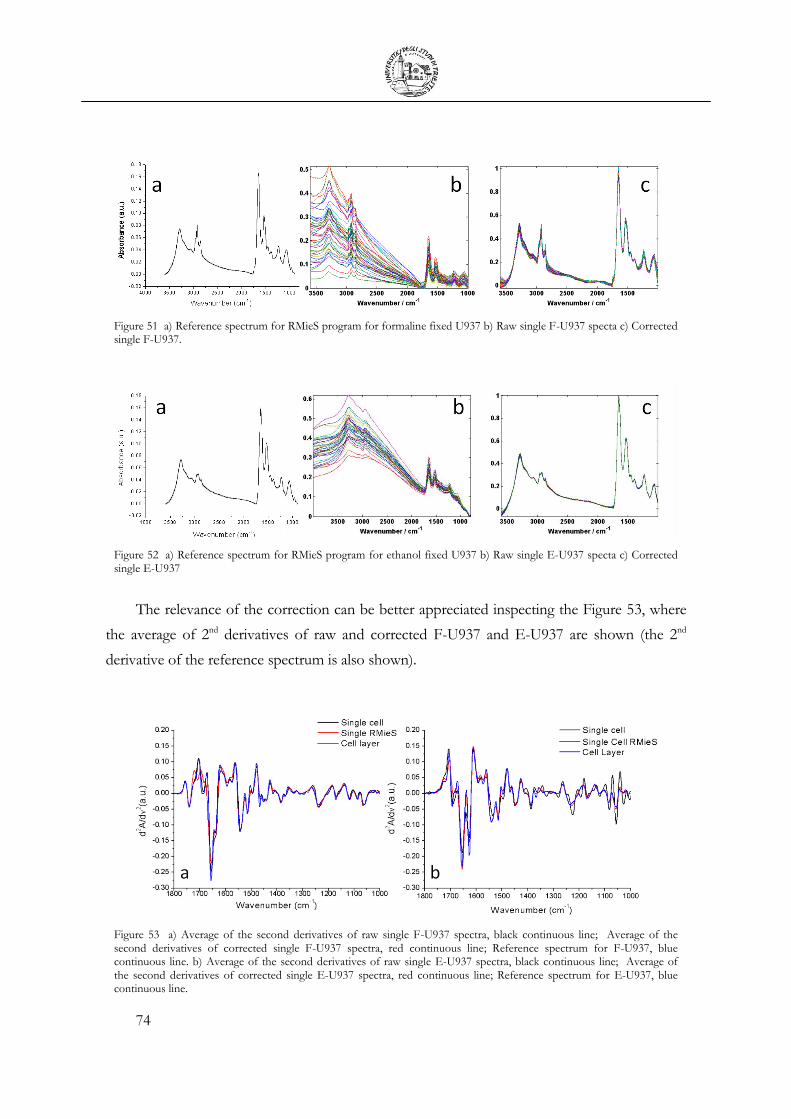
74
Figure 51 a) Reference spectrum for RMieS program for formaline fixed U937 b) Raw single F-U937 specta c) Corrected single F-U937.
Figure 52 a) Reference spectrum for RMieS program for ethanol fixed U937 b) Raw single E-U937 specta c) Corrected single E-U937
The relevance of the correction can be better appreciated inspecting the Figure 53, where
the average of 2nd derivatives of raw and corrected F-U937 and E-U937 are shown (the 2nd
derivative of the reference spectrum is also shown).
Figure 53 a) Average of the second derivatives of raw single F-U937 spectra, black continuous line; Average of the second derivatives of corrected single F-U937 spectra, red continuous line; Reference spectrum for F-U937, blue continuous line. b) Average of the second derivatives of raw single E-U937 spectra, black continuous line; Average of the second derivatives of corrected single E-U937 spectra, red continuous line; Reference spectrum for E-U937, blue continuous line.

75
Clearly, correction effects are more pronounced for E-U937, which are more scattering
affected than F-U937. After the application of the algorithm, corrected E-U937, corrected F-
U937 and L-U937 clusterize consistently with results obtained for cell monolayers (Figure 54,
55), and then allowing to draw out the same biological conclusions.
Figure 54 Cluster analysis of acquired spectra in the region of proteins (1750-1480 cm-1). Data processing: 2nd
derivative with standard vector normalization (SVN). Cluster analysis performed with the Euclidean distances and
Ward’s algorithm.
Figure 55 Cluster analysis of acquired spectra in the region of lipids (3000-2800 cm-1). Data processing: 2nd derivative with standard vector normalization (SVN). Cluster analysis performed with the Euclidean distances and Ward’s algorithm.
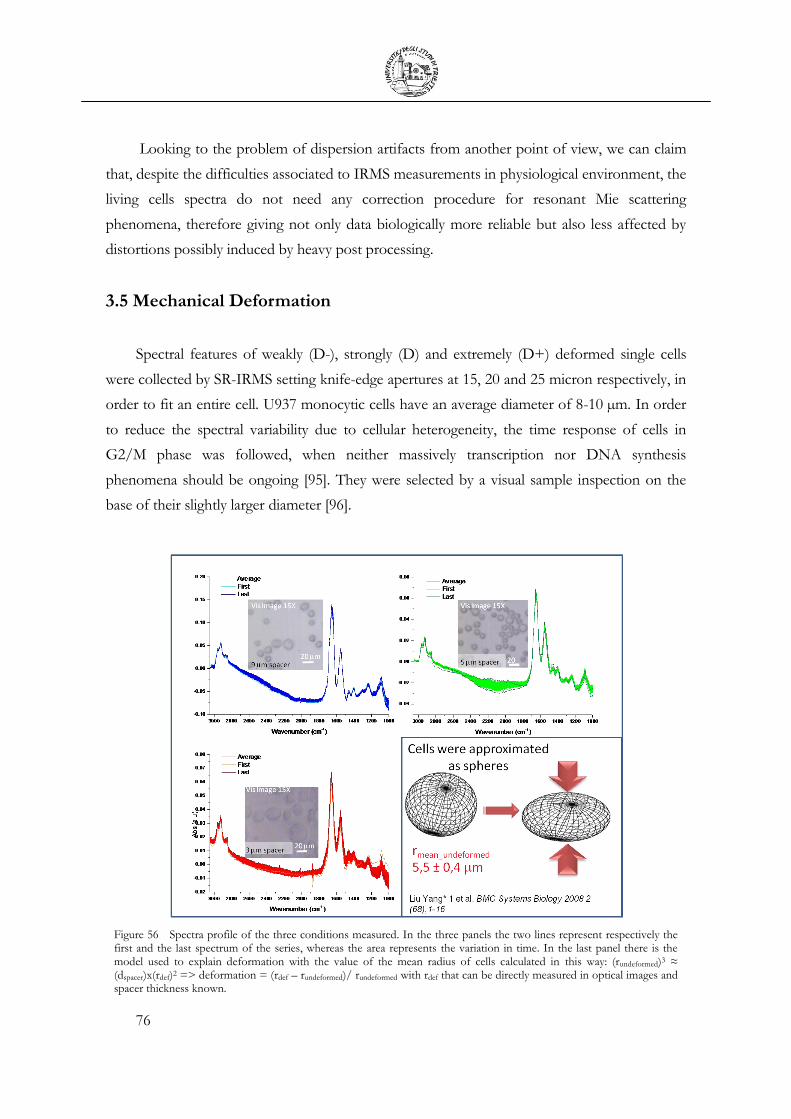
76
Looking to the problem of dispersion artifacts from another point of view, we can claim
that, despite the difficulties associated to IRMS measurements in physiological environment, the
living cells spectra do not need any correction procedure for resonant Mie scattering
phenomena, therefore giving not only data biologically more reliable but also less affected by
distortions possibly induced by heavy post processing.
3.5 Mechanical Deformation
Spectral features of weakly (D-), strongly (D) and extremely (D+) deformed single cells
were collected by SR-IRMS setting knife-edge apertures at 15, 20 and 25 micron respectively, in
order to fit an entire cell. U937 monocytic cells have an average diameter of 8-10 µm. In order
to reduce the spectral variability due to cellular heterogeneity, the time response of cells in
G2/M phase was followed, when neither massively transcription nor DNA synthesis
phenomena should be ongoing [95]. They were selected by a visual sample inspection on the
base of their slightly larger diameter [96].
Figure 56 Spectra profile of the three conditions measured. In the three panels the two lines represent respectively the first and the last spectrum of the series, whereas the area represents the variation in time. In the last panel there is the model used to explain deformation with the value of the mean radius of cells calculated in this way: (rundeformed)3 ≈ (dspacer)x(rdef)2 => deformation = (rdef – rundeformed)/ rundeformed with rdef that can be directly measured in optical images and spacer thickness known.
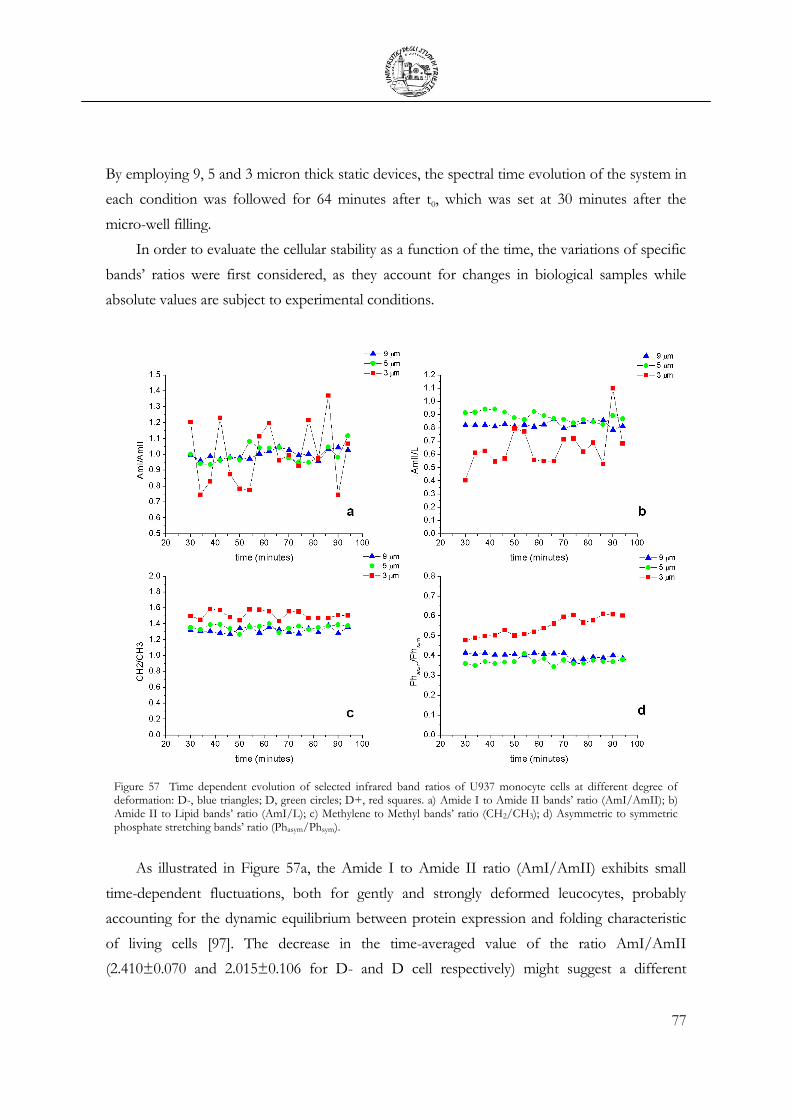
77
By employing 9, 5 and 3 micron thick static devices, the spectral time evolution of the system in
each condition was followed for 64 minutes after t0, which was set at 30 minutes after the
micro-well filling.
In order to evaluate the cellular stability as a function of the time, the variations of specific
bands’ ratios were first considered, as they account for changes in biological samples while
absolute values are subject to experimental conditions.
Figure 57 Time dependent evolution of selected infrared band ratios of U937 monocyte cells at different degree of deformation: D-, blue triangles; D, green circles; D+, red squares. a) Amide I to Amide II bands’ ratio (AmI/AmII); b) Amide II to Lipid bands’ ratio (AmI/L); c) Methylene to Methyl bands’ ratio (CH2/CH3); d) Asymmetric to symmetric phosphate stretching bands’ ratio (Phasym/Phsym).
As illustrated in Figure 57a, the Amide I to Amide II ratio (AmI/AmII) exhibits small
time-dependent fluctuations, both for gently and strongly deformed leucocytes, probably
accounting for the dynamic equilibrium between protein expression and folding characteristic
of living cells [97]. The decrease in the time-averaged value of the ratio AmI/AmII
(2.410±0.070 and 2.015±0.106 for D- and D cell respectively) might suggest a different
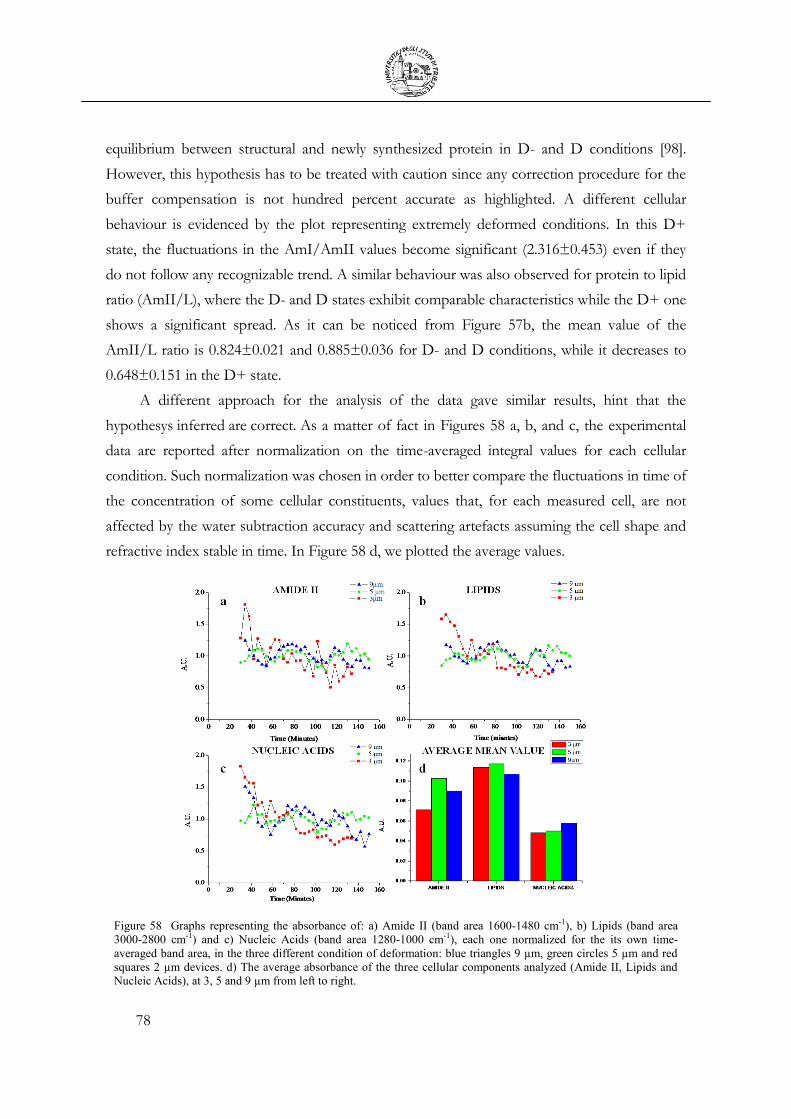
78
equilibrium between structural and newly synthesized protein in D- and D conditions [98].
However, this hypothesis has to be treated with caution since any correction procedure for the
buffer compensation is not hundred percent accurate as highlighted. A different cellular
behaviour is evidenced by the plot representing extremely deformed conditions. In this D+
state, the fluctuations in the AmI/AmII values become significant (2.316±0.453) even if they
do not follow any recognizable trend. A similar behaviour was also observed for protein to lipid
ratio (AmII/L), where the D- and D states exhibit comparable characteristics while the D+ one
shows a significant spread. As it can be noticed from Figure 57b, the mean value of the
AmII/L ratio is 0.824±0.021 and 0.885±0.036 for D- and D conditions, while it decreases to
0.648±0.151 in the D+ state.
A different approach for the analysis of the data gave similar results, hint that the
hypothesys inferred are correct. As a matter of fact in Figures 58 a, b, and c, the experimental
data are reported after normalization on the time-averaged integral values for each cellular
condition. Such normalization was chosen in order to better compare the fluctuations in time of
the concentration of some cellular constituents, values that, for each measured cell, are not
affected by the water subtraction accuracy and scattering artefacts assuming the cell shape and
refractive index stable in time. In Figure 58 d, we plotted the average values.
Figure 58 Graphs representing the absorbance of: a) Amide II (band area 1600-1480 cm-1), b) Lipids (band area
3000-2800 cm-1) and c) Nucleic Acids (band area 1280-1000 cm-1), each one normalized for the its own time-
averaged band area, in the three different condition of deformation: blue triangles 9 µm, green circles 5 µm and red
squares 2 µm devices. d) The average absorbance of the three cellular components analyzed (Amide II, Lipids and
Nucleic Acids), at 3, 5 and 9 µm from left to right.
79
At 9 and 5 μm deformation, U937 cells exhibit similar behaviour. The time averaged
values are comparable and both cellular systems show small fluctuations, almost periodic
(periodicity of about 40 minutes), potentially related to the dynamic behaviour of a living cell.
When looking at a cell deeply deformed by confinement in a 3 μm device, great differences can
be appreciated. Even if the time-averaged values of all the integrals considered are comparable
with those of D- and D states, with the exception of Amide I, a progressive time-decrement of
the cellular content of proteins, nucleic acids and lipids can be inferred by the presented data.
The amide II band was chosen, indeed, as indicator of the cellular protein concentration
since the water absorption in this region is less pronounced. Interestingly, the decrement in the
protein to lipid ratio, probably accounting for the decrease of both protein and lipid
concentrations, is coming with changes in lipid composition: the methylene to methyl ratio
increases from 1.317±0.034 to 1.51±0.052 with the mechanical loading (see Figure 57b and
Figure 57c). This reveals a different proportion between lipids richer in methyl-groups (i.e.
cholesterol, sphingolipids and branched phospholipids) and phospholipids with linear aliphatic
chains [99].
This hypothesis is also supported by the major intensity of phosphodiester band of
phospholipids (1720-1760 cm-1) in the D+ state as can be seen in the inset of Figure 59b (black
arrow). From the Figure it is also appreciable the phosphodiester band of nucleic acid backbone
in hydrated conditions (gray arrow) [100]. Even more pronounced differences were evidenced
in the phosphate region, 1280-1000 cm-1, for which the ratio of asymmetric to symmetric
phosphate’s stretching (Phasym/Phsym) was considered. The plot of Figure 57d shows that in the
D- and D conditions, Phasym/Phsym remains almost constant, statistically oscillating around mean
values of 0.401 and 0.369 respectively. By decreasing the spacer to 3 µm, the ratio increases with
time, reaching at 94 minutes the value of 0.601, therefore revealing a rearrangement of
ribonucleic and deoxyribonucleic acids upon cell compression. By comparing the 1180-1000
cm-1 band for the three conditions (see Figure 57c), a progressive lowering of the band intensity
can be appreciated as well as its contemporary shift at lower wavenumbers (from 1089 to 1084
cm-1). It is also possible to notice a pronounced attenuation of the shoulder at 1116-1089 cm-1,
revealing changes in both concentration and conformation of DNA [9, 101].
A substantial biochemical rearrangement of monocyte U937 cells upon mechanical
deformation can be assumed by the present data. Since we looked to the phenomenon about
20-30 minutes after the application of the mechanical stress, we recorded the late stages of the
cellular response, which might involve a down-regulation of protein and lipid synthesis, related

80
to the plastic answer of monocytes to mechanical stresses as well as to changes in curvature
radius. Anyway in slightly deformed states, the cell shows quite stable spectral features in time
in terms of band intensity and position, with small fluctuations potentially related to the cellular
processes taking place in a living system.
By increasing the deformation, confining the cell in a device with a chamber height which
is almost half of the cell diameter (D condition), small amplitude fluctuations in AmI/AmII,
AmII/L and Phasym/Phsym ratios are still detected. The differences in the time-averaged band
ratio values might evidence dissimilar protein equilibrium, involving transcription, protein new-
synthesis and folding. Variations of membrane composition and order can also be assumed and
related to the plastic answer of monocytes to mechanical stresses, and to changes in curvature
radius [102]. In extremely deformed conditions, the cellular equilibrium is radically changed and
the cell seems to be activated. Therefore in this state any measurement that requires long-term
system stability such as chemical mapping is not reliable.
Figure 59 Time-averaged absorbance spectra of U937 monocyte cells at different level of deformation. The asymmetric and symmetric stretching bands of methyl and methylene groups are represented in panel a), for the weakly deformed (D-), strongly deformed (D) and extremely deformed (D+) states. Spectra have been normalized on methylene asymmetric stretching band (massif 2946-2884 cm-1) and plotted with a shift of 0.5 a.u. in order to make easier their visualization. The same visualization mode was chosen for the panel b) where the spectral region 1800-1000 cm-1 is shown for D-, D and D+ states after spectral normalization on Amide I band. Changes in symmetric and asymmetric stretching bands of phosphates, both in intensity and shape, are appreciable. In the inset, the phosphodiester region 1760-1700 cm-1 of D- and D+ cells is enlarged: contributions to the band arising from phospholipids and from the backbone of nucleic acids are arrowed in black and gray respectively.

81
These results can be considered the first step in setting up a methodology for monitoring
the massive cellular response to mechanical deformation, which may affect many cellular
functions, such as cell proliferation, ECM gene and protein expression. Moreover, they suggest
a careful evaluation of loading effects on each cellular system before in vitro FTIR experiments,
in order to avoid ambiguous data interpretation.
3.6 Cell Apoptosis
Apoptosis is the process of programmed cell death (PCD) that may occur in multi-cellular
organisms. Biochemical events lead to characteristic cell changes (morphology) and death.
These changes include blebbing, loss of cell membrane asymmetry and attachment, cell
shrinkage, nuclear fragmentation, chromatin condensation, and chromosomal DNA
fragmentation, for instance, DNA double strand cleavage in apoptotic cells occurs at the linker
regions between nucleosomes to produce fragments that are multiples of approximately 185 bp
[103].
Unlike necrosis, which is a form of traumatic cell death that results from acute cellular
injury, apoptosis produces cell fragments called apoptotic bodies that surrounding cells are able
to engulf and quickly remove before the contents of the cell can spill out and cause damage.
Research in and around apoptosis has increased substantially since the early 1990s. In
addition to its importance as a biological phenomenon, defective apoptotic processes have been
implicated in an extensive variety of diseases. Excessive apoptosis causes atrophy, such as in
ischemic damage, whereas an insufficient amount results in uncontrolled cell proliferation, such
as cancer.
The process of apoptosis is controlled by a diverse range of cell signals, which may
originate either extracellularly (extrinsic inducers) or intracellularly (intrinsic inducers).
Extracellular signals may include toxins [104], hormones, growth factors, nitric oxide [105] or
cytokines, that must either cross the plasma membrane or transduce to effect a response. These
signals may positively (i.e., trigger) or negatively (i.e., repress, inhibit, or dampen) affect
apoptosis.
A cell initiates intracellular apoptotic signalling in response to a stress, which may bring
about cell suicide. The binding of nuclear receptors by glucocorticoids, heat, radiation, nutrient

82
deprivation, viral infection, hypoxia, as can be seen in figure 41, for example, by damage to the
membrane, can all trigger the release of intracellular apoptotic signals by a damaged cell.
Figure 60 The binding of nuclear receptors by glucocorticoids, heat, radiation, nutrient deprivation, viral infection,
hypoxia, for example, by damage to the membrane, can all trigger the release of intracellular apoptotic signals by a
damaged cell.
Before the actual process of cell death is precipitated by enzymes, apoptotic signals must
cause regulatory proteins to initiate the apoptosis pathway. This step allows apoptotic signals to
cause cell death, or the process to be stopped, should the cell no longer need to die. Several
proteins are involved, but two main methods of regulation have been identified: targeting
mitochondria functionality, or directly transducing the signal via adaptor proteins to the
apoptotic mechanisms.
For these studies the cell apoptosis was induced by two different ways:
By serum deprivation (FBS, Fetal Bovine Serum) in the culture medium of U937
By causing the depolarization of the mitochondrial membrane by the action of a
molecule called CCCP , Carbonyl Cyanide m-Chloro Phenylhydrazone [106], an
uncoupling agent that dissipates proton gradients across membranes, which acts
more faster than serum deprivation.
For preliminary citofluorimetric tests U937 were cultured 500.000/mL in three multi-well
plates in different conditions as reported in Table 11:
Table 11 Apoptosis Test on U937
1 2 3
A Control FBS 10 % 1% FBS 0% FBS
B Control FBS 10 % 1% FBS 0% FBS
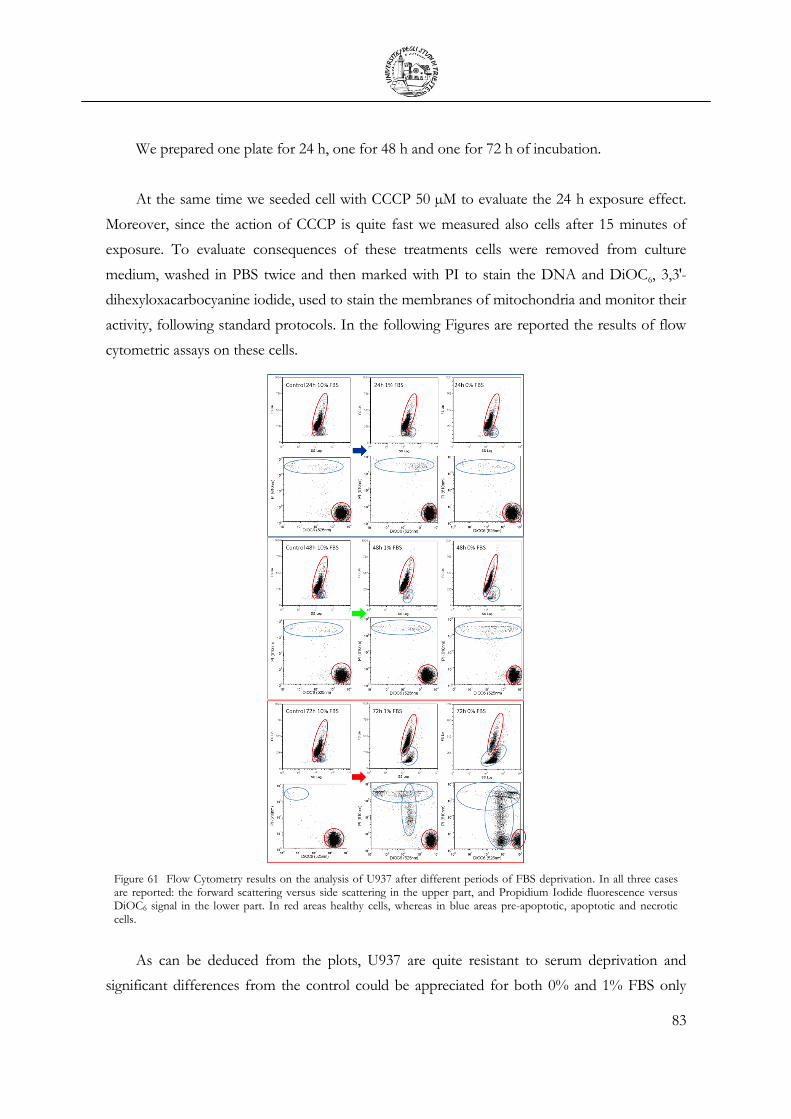
83
We prepared one plate for 24 h, one for 48 h and one for 72 h of incubation.
At the same time we seeded cell with CCCP 50 µM to evaluate the 24 h exposure effect.
Moreover, since the action of CCCP is quite fast we measured also cells after 15 minutes of
exposure. To evaluate consequences of these treatments cells were removed from culture
medium, washed in PBS twice and then marked with PI to stain the DNA and DiOC6, 3,3′-
dihexyloxacarbocyanine iodide, used to stain the membranes of mitochondria and monitor their
activity, following standard protocols. In the following Figures are reported the results of flow
cytometric assays on these cells.
Figure 61 Flow Cytometry results on the analysis of U937 after different periods of FBS deprivation. In all three cases are reported: the forward scattering versus side scattering in the upper part, and Propidium Iodide fluorescence versus DiOC6 signal in the lower part. In red areas healthy cells, whereas in blue areas pre-apoptotic, apoptotic and necrotic cells.
As can be deduced from the plots, U937 are quite resistant to serum deprivation and
significant differences from the control could be appreciated for both 0% and 1% FBS only

84
after 48-72 hours. After 72 hours the population of cells with smaller radius increases for both
1% and 0% FBS, as could be identified by the FS vs SS plot in Figure 61 (blue circles); those
represent apoptotic cells. The indications of the starting of the apoptotic processes are the
decrease in DiOC6 signal, hint of the decrement of cellular respiration activity, and the starting
of increase of PI signal. Highlighting only the 72 hours plots, in Figure 62, we can clearly see
the two distinct groups of cells, present only in those starved cells.
Figure 62 After 72h of starvation are clearly detectable two different families of cells. In this case red dots represent
healthy cells, whereas in blue spots pre-apoptotic, apoptotic and necrotic cells.
Similar analyses were carried out also for CCCP treatment (50 µM) and the results are
shown in Figure 63. Right after few minutes of CCCP action a shift in DiOC6 signal is
detectable as shift of Median Fluorescence Intensities (MFI) (from 286±9.5, to 78±0.9), due to
the fast depolarization of mitochondrial membrane.
Figure 63 In blue areas healthy cells, whereas in red areas pre-apoptotic, apoptotic and necrotic cells.
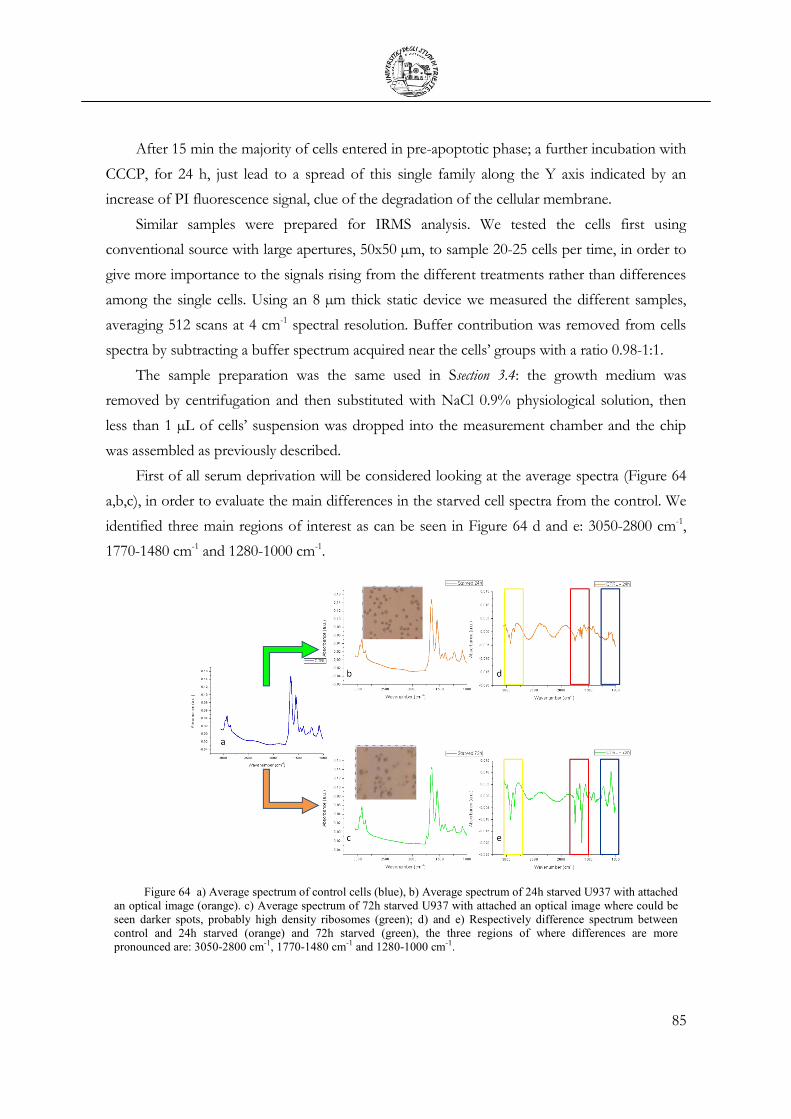
85
After 15 min the majority of cells entered in pre-apoptotic phase; a further incubation with
CCCP, for 24 h, just lead to a spread of this single family along the Y axis indicated by an
increase of PI fluorescence signal, clue of the degradation of the cellular membrane.
Similar samples were prepared for IRMS analysis. We tested the cells first using
conventional source with large apertures, 50x50 µm, to sample 20-25 cells per time, in order to
give more importance to the signals rising from the different treatments rather than differences
among the single cells. Using an 8 µm thick static device we measured the different samples,
averaging 512 scans at 4 cm-1 spectral resolution. Buffer contribution was removed from cells
spectra by subtracting a buffer spectrum acquired near the cells’ groups with a ratio 0.98-1:1.
The sample preparation was the same used in Ssection 3.4: the growth medium was
removed by centrifugation and then substituted with NaCl 0.9% physiological solution, then
less than 1 µL of cells’ suspension was dropped into the measurement chamber and the chip
was assembled as previously described.
First of all serum deprivation will be considered looking at the average spectra (Figure 64
a,b,c), in order to evaluate the main differences in the starved cell spectra from the control. We
identified three main regions of interest as can be seen in Figure 64 d and e: 3050-2800 cm-1,
1770-1480 cm-1 and 1280-1000 cm-1.
Figure 64 a) Average spectrum of control cells (blue), b) Average spectrum of 24h starved U937 with attached
an optical image (orange). c) Average spectrum of 72h starved U937 with attached an optical image where could be
seen darker spots, probably high density ribosomes (green); d) and e) Respectively difference spectrum between
control and 24h starved (orange) and 72h starved (green), the three regions of where differences are more
pronounced are: 3050-2800 cm-1, 1770-1480 cm-1 and 1280-1000 cm-1.
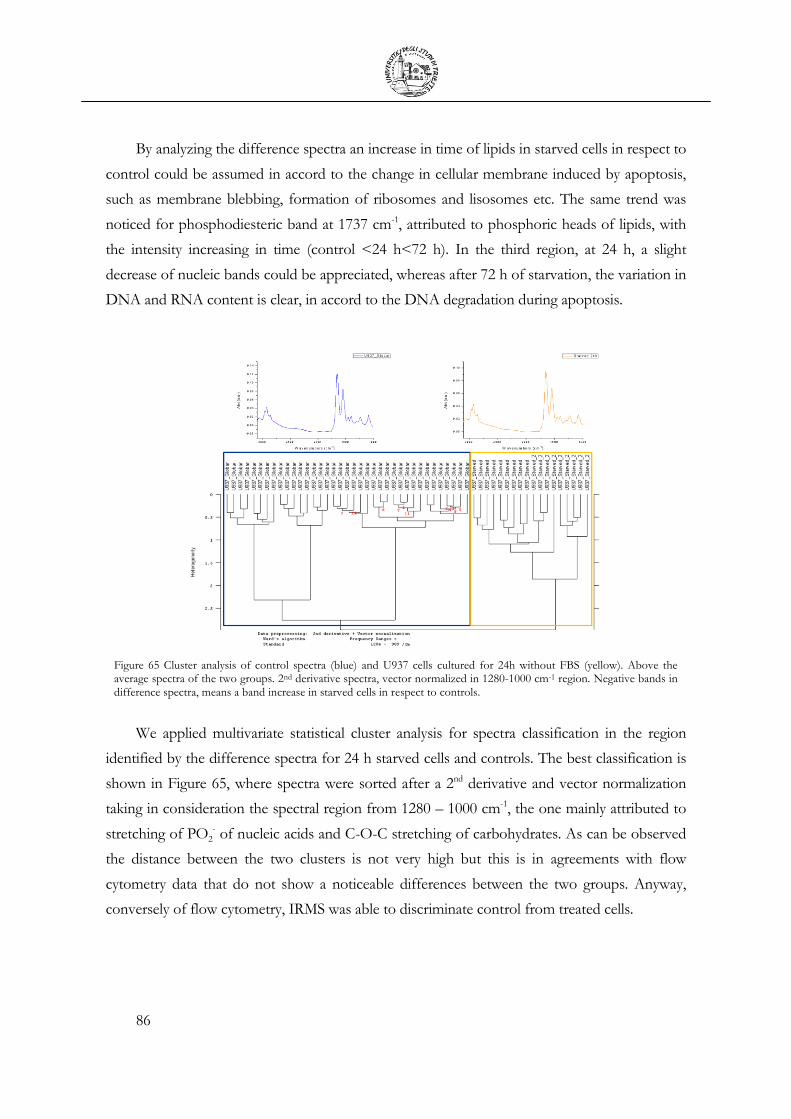
86
By analyzing the difference spectra an increase in time of lipids in starved cells in respect to
control could be assumed in accord to the change in cellular membrane induced by apoptosis,
such as membrane blebbing, formation of ribosomes and lisosomes etc. The same trend was
noticed for phosphodiesteric band at 1737 cm-1, attributed to phosphoric heads of lipids, with
the intensity increasing in time (control <24 h<72 h). In the third region, at 24 h, a slight
decrease of nucleic bands could be appreciated, whereas after 72 h of starvation, the variation in
DNA and RNA content is clear, in accord to the DNA degradation during apoptosis.
Figure 65 Cluster analysis of control spectra (blue) and U937 cells cultured for 24h without FBS (yellow). Above the average spectra of the two groups. 2nd derivative spectra, vector normalized in 1280-1000 cm-1 region. Negative bands in difference spectra, means a band increase in starved cells in respect to controls.
We applied multivariate statistical cluster analysis for spectra classification in the region
identified by the difference spectra for 24 h starved cells and controls. The best classification is
shown in Figure 65, where spectra were sorted after a 2nd derivative and vector normalization
taking in consideration the spectral region from 1280 – 1000 cm-1, the one mainly attributed to
stretching of PO2- of nucleic acids and C-O-C stretching of carbohydrates. As can be observed
the distance between the two clusters is not very high but this is in agreements with flow
cytometry data that do not show a noticeable differences between the two groups. Anyway,
conversely of flow cytometry, IRMS was able to discriminate control from treated cells.
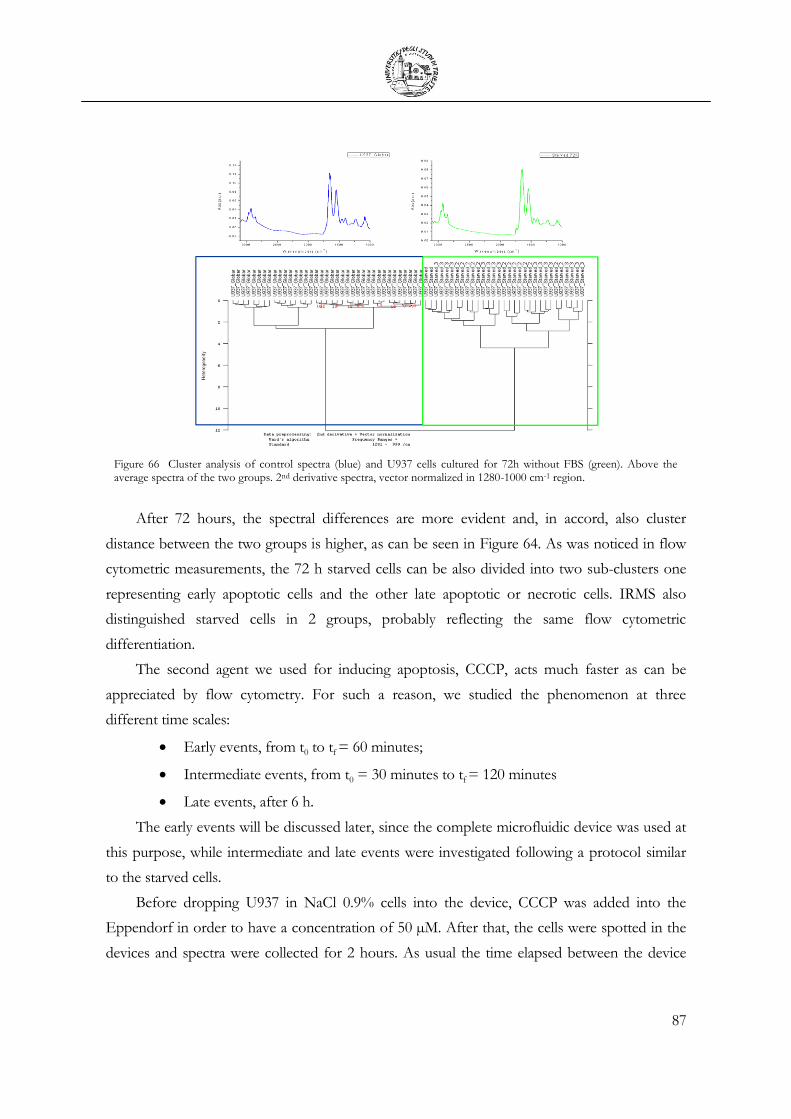
87
Figure 66 Cluster analysis of control spectra (blue) and U937 cells cultured for 72h without FBS (green). Above the average spectra of the two groups. 2nd derivative spectra, vector normalized in 1280-1000 cm-1 region.
After 72 hours, the spectral differences are more evident and, in accord, also cluster
distance between the two groups is higher, as can be seen in Figure 64. As was noticed in flow
cytometric measurements, the 72 h starved cells can be also divided into two sub-clusters one
representing early apoptotic cells and the other late apoptotic or necrotic cells. IRMS also
distinguished starved cells in 2 groups, probably reflecting the same flow cytometric
differentiation.
The second agent we used for inducing apoptosis, CCCP, acts much faster as can be
appreciated by flow cytometry. For such a reason, we studied the phenomenon at three
different time scales:
Early events, from t0 to tf = 60 minutes;
Intermediate events, from t0 = 30 minutes to tf = 120 minutes
Late events, after 6 h.
The early events will be discussed later, since the complete microfluidic device was used at
this purpose, while intermediate and late events were investigated following a protocol similar
to the starved cells.
Before dropping U937 in NaCl 0.9% cells into the device, CCCP was added into the
Eppendorf in order to have a concentration of 50 µM. After that, the cells were spotted in the
devices and spectra were collected for 2 hours. As usual the time elapsed between the device
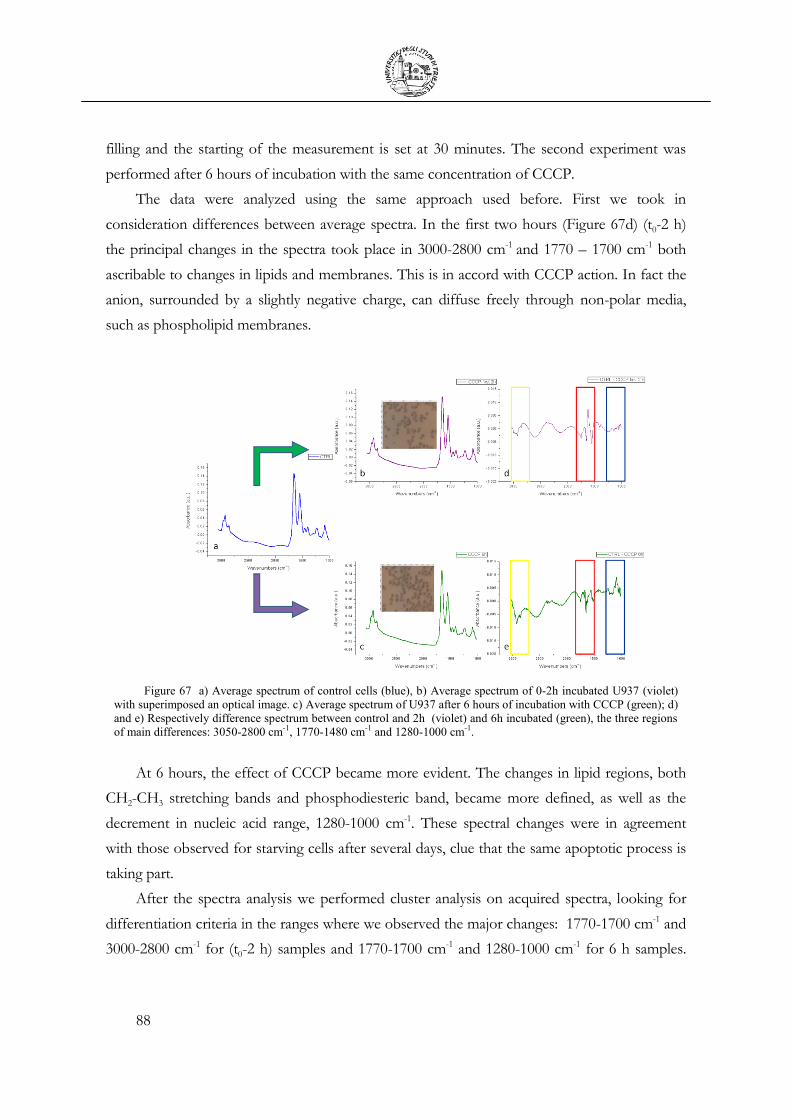
88
filling and the starting of the measurement is set at 30 minutes. The second experiment was
performed after 6 hours of incubation with the same concentration of CCCP.
The data were analyzed using the same approach used before. First we took in
consideration differences between average spectra. In the first two hours (Figure 67d) (t0-2 h)
the principal changes in the spectra took place in 3000-2800 cm-1 and 1770 – 1700 cm-1 both
ascribable to changes in lipids and membranes. This is in accord with CCCP action. In fact the
anion, surrounded by a slightly negative charge, can diffuse freely through non-polar media,
such as phospholipid membranes.
Figure 67 a) Average spectrum of control cells (blue), b) Average spectrum of 0-2h incubated U937 (violet)
with superimposed an optical image. c) Average spectrum of U937 after 6 hours of incubation with CCCP (green); d)
and e) Respectively difference spectrum between control and 2h (violet) and 6h incubated (green), the three regions
of main differences: 3050-2800 cm-1, 1770-1480 cm-1 and 1280-1000 cm-1.
At 6 hours, the effect of CCCP became more evident. The changes in lipid regions, both
CH2-CH3 stretching bands and phosphodiesteric band, became more defined, as well as the
decrement in nucleic acid range, 1280-1000 cm-1. These spectral changes were in agreement
with those observed for starving cells after several days, clue that the same apoptotic process is
taking part.
After the spectra analysis we performed cluster analysis on acquired spectra, looking for
differentiation criteria in the ranges where we observed the major changes: 1770-1700 cm-1 and
3000-2800 cm-1 for (t0-2 h) samples and 1770-1700 cm-1 and 1280-1000 cm-1 for 6 h samples.
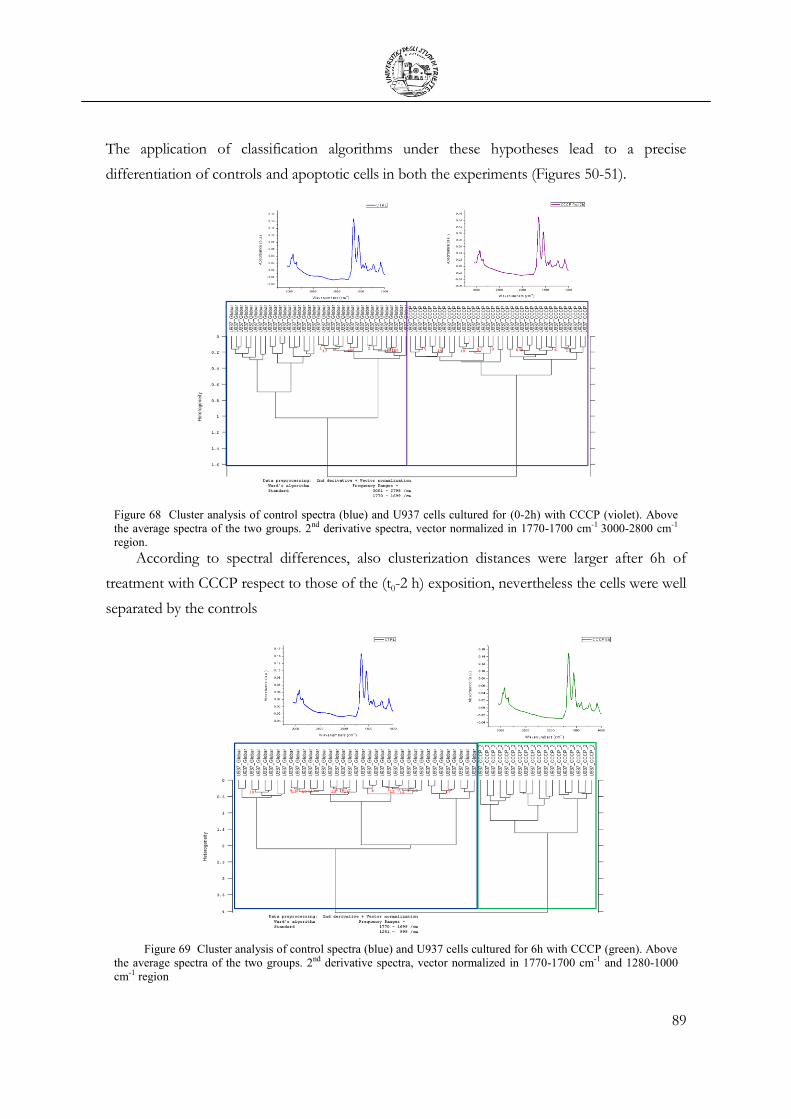
89
The application of classification algorithms under these hypotheses lead to a precise
differentiation of controls and apoptotic cells in both the experiments (Figures 50-51).
Figure 68 Cluster analysis of control spectra (blue) and U937 cells cultured for (0-2h) with CCCP (violet). Above
the average spectra of the two groups. 2nd derivative spectra, vector normalized in 1770-1700 cm-1 3000-2800 cm-1
region.
According to spectral differences, also clusterization distances were larger after 6h of
treatment with CCCP respect to those of the (t0-2 h) exposition, nevertheless the cells were well
separated by the controls
Figure 69 Cluster analysis of control spectra (blue) and U937 cells cultured for 6h with CCCP (green). Above
the average spectra of the two groups. 2nd derivative spectra, vector normalized in 1770-1700 cm-1 and 1280-1000
cm-1 region
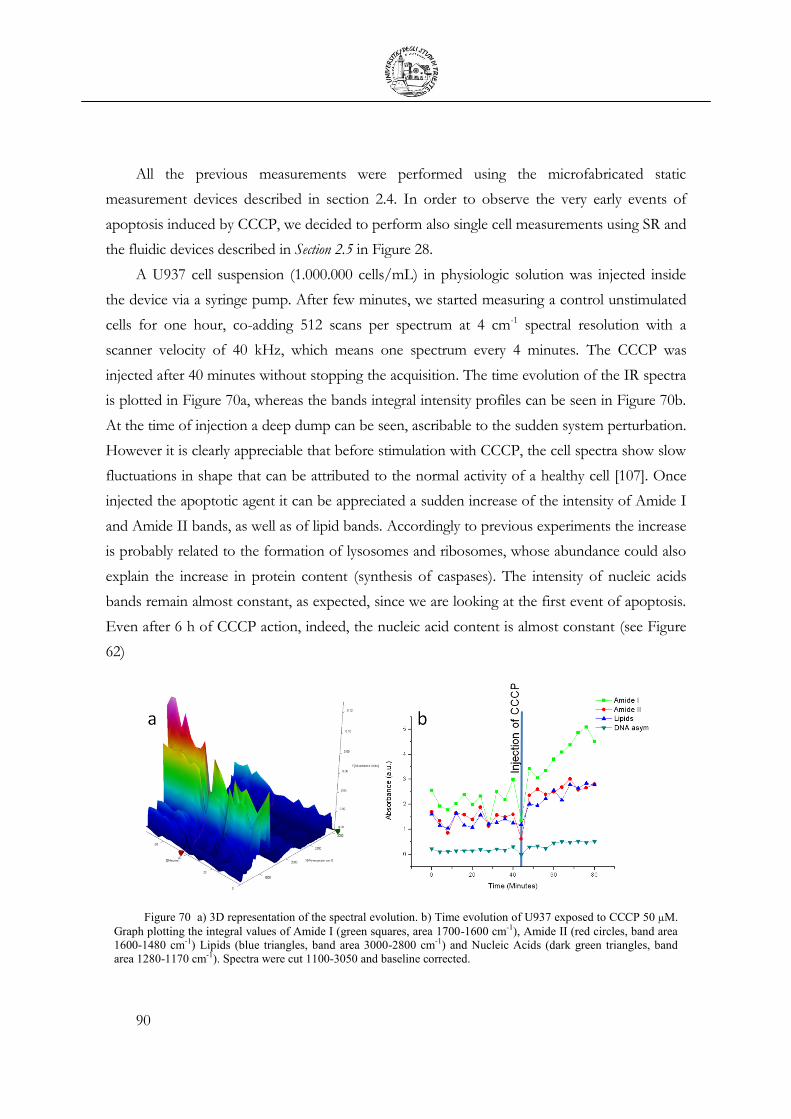
90
All the previous measurements were performed using the microfabricated static
measurement devices described in section 2.4. In order to observe the very early events of
apoptosis induced by CCCP, we decided to perform also single cell measurements using SR and
the fluidic devices described in Section 2.5 in Figure 28.
A U937 cell suspension (1.000.000 cells/mL) in physiologic solution was injected inside
the device via a syringe pump. After few minutes, we started measuring a control unstimulated
cells for one hour, co-adding 512 scans per spectrum at 4 cm-1 spectral resolution with a
scanner velocity of 40 kHz, which means one spectrum every 4 minutes. The CCCP was
injected after 40 minutes without stopping the acquisition. The time evolution of the IR spectra
is plotted in Figure 70a, whereas the bands integral intensity profiles can be seen in Figure 70b.
At the time of injection a deep dump can be seen, ascribable to the sudden system perturbation.
However it is clearly appreciable that before stimulation with CCCP, the cell spectra show slow
fluctuations in shape that can be attributed to the normal activity of a healthy cell [107]. Once
injected the apoptotic agent it can be appreciated a sudden increase of the intensity of Amide I
and Amide II bands, as well as of lipid bands. Accordingly to previous experiments the increase
is probably related to the formation of lysosomes and ribosomes, whose abundance could also
explain the increase in protein content (synthesis of caspases). The intensity of nucleic acids
bands remain almost constant, as expected, since we are looking at the first event of apoptosis.
Even after 6 h of CCCP action, indeed, the nucleic acid content is almost constant (see Figure
62)
Figure 70 a) 3D representation of the spectral evolution. b) Time evolution of U937 exposed to CCCP 50 µM.
Graph plotting the integral values of Amide I (green squares, area 1700-1600 cm-1), Amide II (red circles, band area
1600-1480 cm-1) Lipids (blue triangles, band area 3000-2800 cm-1) and Nucleic Acids (dark green triangles, band
area 1280-1170 cm-1). Spectra were cut 1100-3050 and baseline corrected.
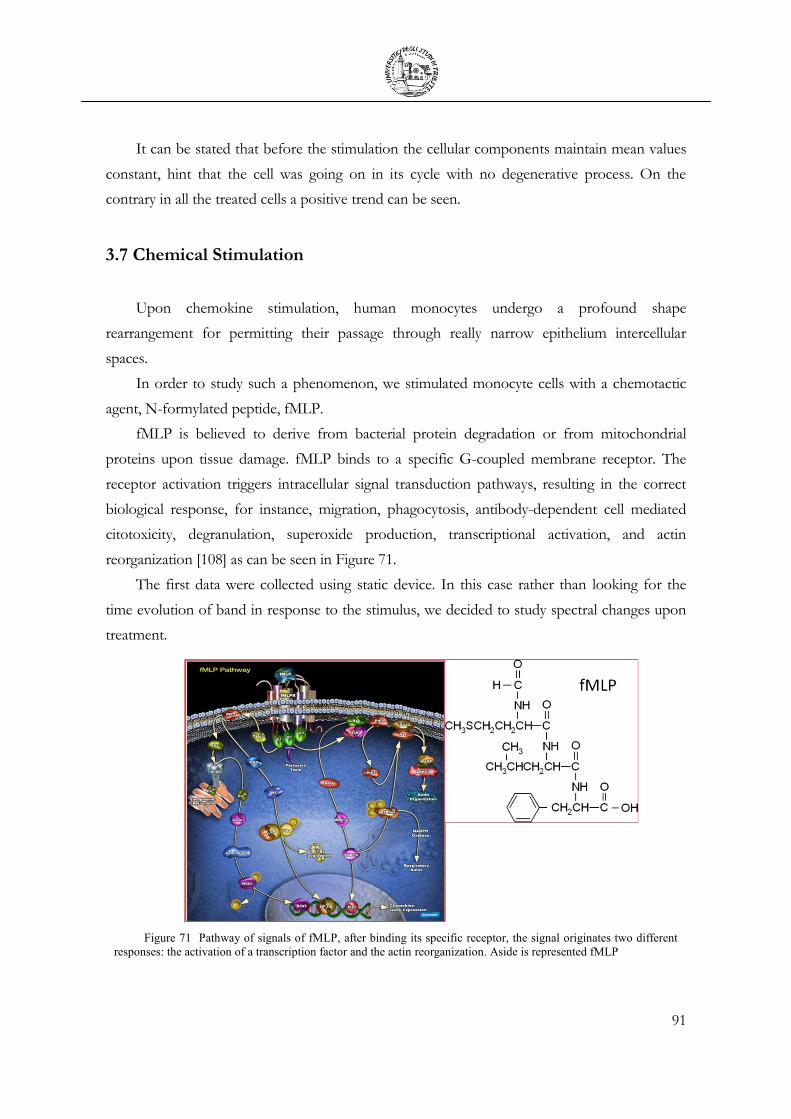
91
It can be stated that before the stimulation the cellular components maintain mean values
constant, hint that the cell was going on in its cycle with no degenerative process. On the
contrary in all the treated cells a positive trend can be seen.
3.7 Chemical Stimulation
Upon chemokine stimulation, human monocytes undergo a profound shape
rearrangement for permitting their passage through really narrow epithelium intercellular
spaces.
In order to study such a phenomenon, we stimulated monocyte cells with a chemotactic
agent, N-formylated peptide, fMLP.
fMLP is believed to derive from bacterial protein degradation or from mitochondrial
proteins upon tissue damage. fMLP binds to a specific G-coupled membrane receptor. The
receptor activation triggers intracellular signal transduction pathways, resulting in the correct
biological response, for instance, migration, phagocytosis, antibody-dependent cell mediated
citotoxicity, degranulation, superoxide production, transcriptional activation, and actin
reorganization [108] as can be seen in Figure 71.
The first data were collected using static device. In this case rather than looking for the
time evolution of band in response to the stimulus, we decided to study spectral changes upon
treatment.
Figure 71 Pathway of signals of fMLP, after binding its specific receptor, the signal originates two different
responses: the activation of a transcription factor and the actin reorganization. Aside is represented fMLP

92
IR microspectra of living THP1 unstimulated and fMLP stimulated cells have been
measured using a 9 µm thick device, using conventional source. Knife edge apertures have been
set to 50x50 µm2, therefore collecting each time a group of 25-30 cells.
For each condition at least 25 regions were sampled. The obtained average spectra are
plotted in Figure 72a, b, where line thickness is proportional to the standard deviation.
Figure 72 a) b) Respectively infrared subtracted spectrum of a group of cells un-treated (blue) and one treated
with fMLP (red), collected with globar source in a 9 micron thick microfabricated liquid cell, c) Comparison between
THP1 mean spectra with s.d. in lipid region in un-stimulated (blue) and stimulated (red) states. d) THP1 phosphate
region of control (blue) and upon fMLP stimulation (red).
fMLP effects were more pronounced in the nucleic acids region, according to the
activation of NF-kB. (Figure 72d). The phosphate asymmetric stretching band changed in
composition: it can be noticed a increase in 1245 cm-1 band, attributed to RNA PO2-, and 1225
cm-1 band. The asymmetric stretching shifted from 1084 to 1087 cm-1. The appearance of a
shoulder at 1120 cm-1, attributed to RNA C-O symmetric stretching, demonstrated an increased
content of RNA molecules, in accordance to the activation of transcriptional phenomena. This
hypothesis was also supported by the appearance of a shoulder at 1122 cm-1, a contribution
tentatively assigned to Z-DNA form, which is strongly enhanced when transcription processes
are ongoing. Moreover, the shoulder at 1209-1211 cm-1 assigned to PO2- stretching of DNA in
Z form and the increasing of bands’ contributions at 1060 and 1057 cm-1 (C-O stretching
tentatively assigned to furanose C-O backbone stretching, strongly enhanced in Z-form
DNA)[9], are all signals related to RNA transcription and Z conformation of DNA, commonly
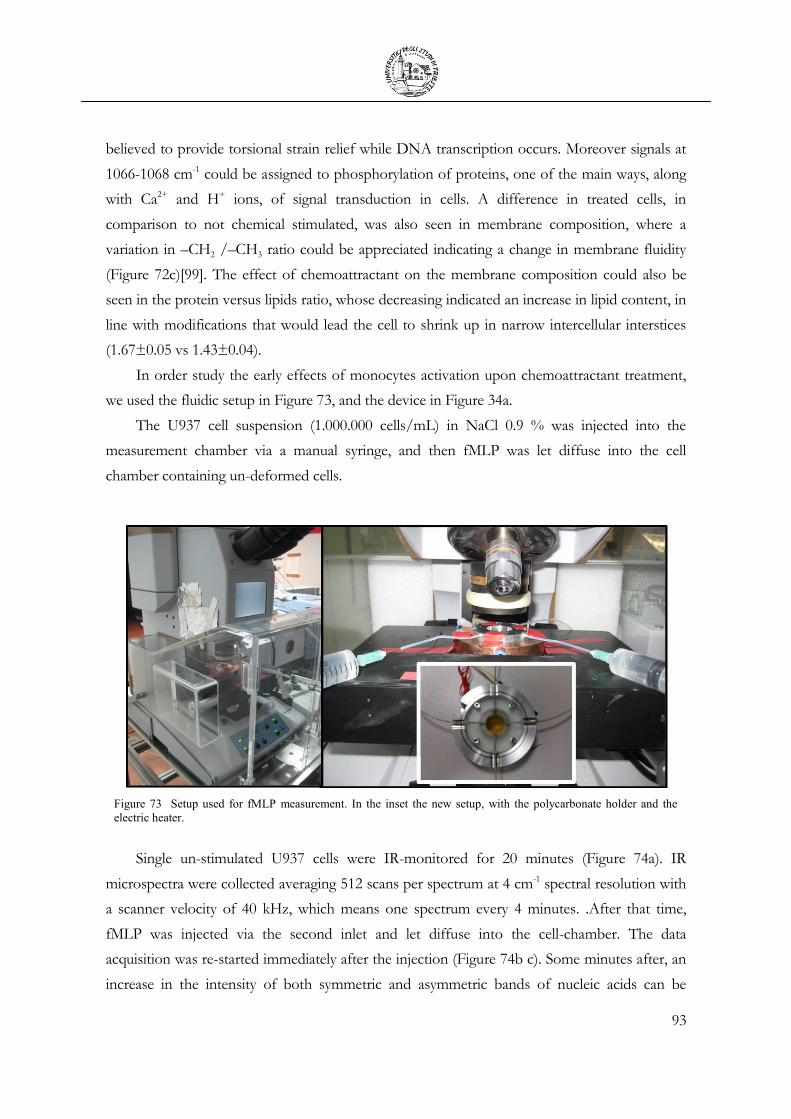
93
believed to provide torsional strain relief while DNA transcription occurs. Moreover signals at
1066-1068 cm-1 could be assigned to phosphorylation of proteins, one of the main ways, along
with Ca2+ and H+ ions, of signal transduction in cells. A difference in treated cells, in
comparison to not chemical stimulated, was also seen in membrane composition, where a
variation in –CH2 /–CH3 ratio could be appreciated indicating a change in membrane fluidity
(Figure 72c)[99]. The effect of chemoattractant on the membrane composition could also be
seen in the protein versus lipids ratio, whose decreasing indicated an increase in lipid content, in
line with modifications that would lead the cell to shrink up in narrow intercellular interstices
(1.67±0.05 vs 1.43±0.04).
In order study the early effects of monocytes activation upon chemoattractant treatment,
we used the fluidic setup in Figure 73, and the device in Figure 34a.
The U937 cell suspension (1.000.000 cells/mL) in NaCl 0.9 % was injected into the
measurement chamber via a manual syringe, and then fMLP was let diffuse into the cell
chamber containing un-deformed cells.
Figure 73 Setup used for fMLP measurement. In the inset the new setup, with the polycarbonate holder and the
electric heater.
Single un-stimulated U937 cells were IR-monitored for 20 minutes (Figure 74a). IR
microspectra were collected averaging 512 scans per spectrum at 4 cm-1 spectral resolution with
a scanner velocity of 40 kHz, which means one spectrum every 4 minutes. .After that time,
fMLP was injected via the second inlet and let diffuse into the cell-chamber. The data
acquisition was re-started immediately after the injection (Figure 74b c). Some minutes after, an
increase in the intensity of both symmetric and asymmetric bands of nucleic acids can be

94
appreciated (see Figure 75). In particular the RNA contribution increases [108], along with the
signal of Amide II, related to newly synthesized proteins [98]. Such trend indicates the
activation of biochemical processes of transcription and synthesis within the cell upon fMLP
stimulation. The appreciable rise of methyl band it is harder to interpret, but it is for sure
reviling the induction of deep variations in cellular membrane composition, probably related to
superior cell motility upon activation.
Figure 74 Three spectra respectively acquired: a. at t = 8 min. (red) before fMLP injection, b. at t = 58 min. (orange) after fMLP injection and during cell response to the stimulus, and c. at t = 112 min. (black) after the end of cellular response to the cytokine.
Figure 75 a) A 3D plot representing the time evolution of the whole single cell spectrum during the experiment; b. Graph plotting the integral values of Amide I (green squares, area 1700-1600 cm-1), Amide II (red circles, band area 1600-1480 cm-1) Lipids (blue triangles, band area 3000-2800 cm-1) and Nucleic Acids (dark green triangles, band area 1280-1000 cm-1) Starting from an un-stimulated condition (t=0), the cell was monitored for 20 minutes, then the fMLP was injected and let diffuse into the cell-chamber. A rapid increase in the values of Amide II, Lipids and Nucleic acids, along with a diminishing in the values of Amide I band can be appreciated. c-d) Same experiment on another cell in another device, same band variations could be appreciated.

95
It is known by literature that leukocytes retract their pseudopods and detach from
substrates after exposure to physiological fluid shear stresses (~1.5 dyn/cm2) [109], but if the
flux is low enough to not alter its equilibrium they will remain adherent. Moreover it has been
reported that shear stress affects more epithelial cells [110, 111] and in general cells used to
grow in adhesion [112].
Nevertheless in order to confirm that in our setup we do not impose any shear stress to
the investigated cells, and what we observed it was their real response to the chemical, we also
monitored in time U937 exposed to a constant low flux of NaCl physiologic solution. The
resulting time profile of this experiment is shown in Figure 76: no significant variations can
be noticed, and the low shear stress level induced is also testified by the fact that leucocytes
remained attached onto the window during all the measurement time.
Figure 76 Shear Stress Test on monocytes U937 in fluidic device: maintaining low and constant the flux (0.01
mL/hr) the cell seems not to respond to this stimulation.
As far as we know, these were among the first experiments demonstrating the suitability
of label-free SR-IRMS for the investigation of on-going eukaryotic cell biochemical processes.
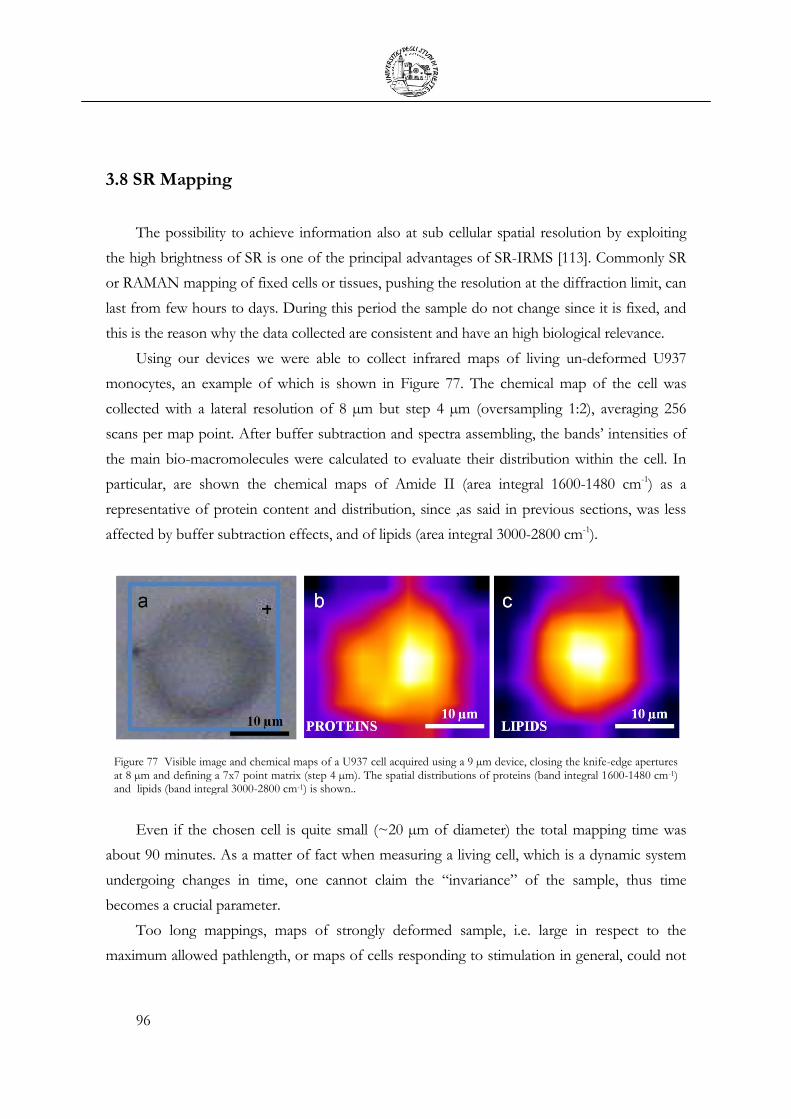
96
3.8 SR Mapping
The possibility to achieve information also at sub cellular spatial resolution by exploiting
the high brightness of SR is one of the principal advantages of SR-IRMS [113]. Commonly SR
or RAMAN mapping of fixed cells or tissues, pushing the resolution at the diffraction limit, can
last from few hours to days. During this period the sample do not change since it is fixed, and
this is the reason why the data collected are consistent and have an high biological relevance.
Using our devices we were able to collect infrared maps of living un-deformed U937
monocytes, an example of which is shown in Figure 77. The chemical map of the cell was
collected with a lateral resolution of 8 µm but step 4 µm (oversampling 1:2), averaging 256
scans per map point. After buffer subtraction and spectra assembling, the bands’ intensities of
the main bio-macromolecules were calculated to evaluate their distribution within the cell. In
particular, are shown the chemical maps of Amide II (area integral 1600-1480 cm-1) as a
representative of protein content and distribution, since ,as said in previous sections, was less
affected by buffer subtraction effects, and of lipids (area integral 3000-2800 cm-1).
Figure 77 Visible image and chemical maps of a U937 cell acquired using a 9 µm device, closing the knife-edge apertures at 8 µm and defining a 7x7 point matrix (step 4 µm). The spatial distributions of proteins (band integral 1600-1480 cm-1) and lipids (band integral 3000-2800 cm-1) is shown..
Even if the chosen cell is quite small (~20 µm of diameter) the total mapping time was
about 90 minutes. As a matter of fact when measuring a living cell, which is a dynamic system
undergoing changes in time, one cannot claim the “invariance” of the sample, thus time
becomes a crucial parameter.
Too long mappings, maps of strongly deformed sample, i.e. large in respect to the
maximum allowed pathlength, or maps of cells responding to stimulation in general, could not

97
ensure the stability in time necessary for these measurement procedures, and, the risk, not so far
from reality, is to start measuring one object and finishing with a completely modified one.

98

99
CHAPTER 4
Conclusions
My PhD work, carried on in the collaboration using the resources of ELETTRA
Synchrotron and the Italian National Research Council, has resulted in the development of an
advanced approach to handle and control the living cells for the exploitation of IRMS for bio-
medical applications.
This required an interdisciplinary approach, which brought me to combine micro and
nanofabrication techniques, mid-infrared spectroscopy know-how and biological expertise. I
laid the basis on the development and validation of a methodology for monitoring biochemical
processes in living cells during their normal functioning, at least in a in-vitro simulation, using
IRMS.
I am fully aware that there are many other unexplored issues, but in this pioneering work
the advantages of studying living cells (Figures 49 and 50) has been demonstrated. In particular,
we show that different states of a cell can be observed, like apoptosis, and recognise them
(Figure 70), and we are able to induce and measure the response of a cell to specific signal
(Figure 75), without any kind of molecular marker.
Many challenges were faced during the Thesis advance, either regarding the measurement
setup, data acquisition and analysis, either in the interpretation of the results. The main reason is

100
that we are among the first groups having tempted and succeeded to obtain infrared spectra of
an ongoing biological process in a living cell.
At the beginning of this project the realization of a new relatively simple static fluidic
device IR-Vis transparent allowed us to demonstrate the real gain in measuring living samples
compared to the commonly used fixed ones. We have been highlighted the dramatic effects of
some fixatives, like ethanol, on cellular biochemistry as well as the specific spectral features
observable only in fully hydrated cells. In particular this is important for the study of nucleic
acid conformation and phenomena associated to changes in their spectral region (1280-1000
cm-1).
The employment of the same static device has opened the opportunity to execute the first
studies of immune system by IRMS and to shed some light on the way living cells sustain and
respond to imposed mechanical deformation, subject of study at the interface of immunology
and mechanobiology.
These devices turned out to be robust, reusable and recyclable after usage; moreover their
flexibility also permitted performing other kinds of experiments, i.e. the study of apoptotic
processes and the initial studies on chemotaxis. By carrying out chemotaxis experiments we
have evaluated the intrinsic limitations of these static fluidic cells: the unavoidable dead time
from the initial chemical stimulation (done in vial) to the effective first measurement point,
therefore loosing the detection of early stimulation events.
Thanks to the contemporarily improvements achieved in fabrication protocols we were
able to provide fully working microfluidic devices with different layouts and to carry out one of
the first real time experiments on single living cell and SR-IRMS mapping at sub cellular spatial
resolution.
The results reported in this Thesis represent my activities during the PhD years, and they
can be regarded as the first brick in the establishment of a widely and commonly used setup for
investigation of biological specimens under physiological conditions: living cells and hydrated
tissues.
Undoubtedly both from the fabrication and the measurement point of view there are
several other issues to be addressed in the future, some are: the production of more complex
devices capable to sustain cellular cultures for a long period (days) (I), or the possibility of
measuring cells in full growth medium (II), developing data analysis processes able to remove
its spectral features from cells’ spectra (III), or the size reduction of the heating element to
allow the employment of higher magnification objectives (IV).

101
Nevertheless, the extensive exploitation of the present set up and the already developed
strategies in measurement and analysis for living cells will undoubtedly increase the IRMS
potential and expand its applications in many fields of biomedical relevance, such as drug-
screening, toxicology, immunology and many others. It is noteworthy that the produced devices
have been already used by other research groups in doing beamtime at SISSI beamline at
Elettra, and several other groups around the world are following our approach.
In the next future our methodology shall be improved and results checked and confirmed,
but we think that the work done by us, as part of the efforts of the Mid-IR community,
together with the new advances in the IR source development [114], is giving rise to a new
dawn for IR spectroscopy as a diagnostic and explorative tool.

102
BIBLIOGRAPHY
1. Snoep, J. And H. Westerhoff, From Isolation To Integration, A Systems Biology Approach For Building The Silicon Cell, In Systems Biology, L. Alberghina And H.V. Westerhoff, Editors. 2005, Springer Berlin / Heidelberg. P. 13-30.
2. Swenson, E.S., Price, J. G., Brazelton, T. And Krause, D. S. , Limitations Of Green Fluorescent Protein As A Cell Lineage Marker. Stem Cells, 2007. 25: P. 2593-2600.
3. Hirschfeld, T. And B. Chase, Ft-Raman Spectroscopy: Development And Justification. Appl. Spectrosc., 1986. 40(2): P. 133-137.
4. Notingher, I., Et Al., In Situ Characterisation Of Living Cells By Raman Spectroscopy. Spectroscopy, 2002. 16: P. 43-51.
5. Jr, E.B.W., J.C. Decius, And P.C. Cross, Molecular Vibrations. The Theory Of Infrared And Raman Vibrational Spectra, Ed. E.B.W. Jr, J.C. Decius, And P.C. Cross. 1955, New York: Dover Publication, Inc.
6. Miller, L.M., G.D. Smith, And G.L. Carr, Synchrotron-Based Biological Microspectroscopy : From The Mid-Infrared Through The Far-Infrared Regimes. Journal Of Biological Physics.
7. Mantsch, H.H. And D. Chapman, Infrared Spectroscopy Of Biomolecules, Ed. H.H. Mantsch And D. Chapman. 1996, New York:: Wiley-Liss, Inc. 279.
8. Kolter, T., Methods In Molecular Biology, Vol. 400: Methods In Membrane Lipids. Edited By Alex Dopico. Chembiochem, 2008. 9(4): P. 645-645.
9. Banyay, M., M. Sarkar, And A. Graslund, A Library Of Ir Bands Of Nucleic Acids In Solution. Biophysical Chemistry, 2003. 104: P. 477-488.
10. Alberts, B., Et Al., Molecular Biology Of The Cell, Ed. B. Alberts, Johnson, A., Lewis, J., Raff, M., K., R. & Walter, Eds. 2008, New York, Ny: Garland Science.
11. Naumann, D., Ft-Ir And Ft-Nir Raman Spectroscopy In Biomedical Research. Aip Conference Proceedings, 1998. 430: P. 96-109.
12. Riddle, J.W., Et Al., Bacterial Identification By Infrared Spectrophotometry. Journal Of Bacteriology 1956 72(5): P. 593–603.
13. Kenner, B., Et Al., Bacterial Identification By Infrared Spectrophotometry. Ii. Effect Of Instrumental And Environmental Variables. Journal Of Bacteriology, 1958 75(1): P. 16-20.
14. Al-Khaldi, S.F., Et Al., Differentiation Of Whole Bacterial Cells Based On High-Throughput Microarray Chip Printing And Infrared Microspectroscopic Readout. Foodborne Pathogens And Disease, 2009. 6(8): P. 1001-1007.
15. Conti, C., Et Al., Ft-Ir Microimaging Spectroscopy: A Comparison Between Healthy And Neoplastic Human Colon Tissues. . Journal Of Molecular Structure, 2008. 881(1-3): P. 46-51.
16. Liu, K.Z., Et Al., Infrared Spectroscopic Study Of Bryostatin 1-Induced Membrane Alterations In A B-Cll Cell Line. Ratio, 1999: P. 1273-1280.
17. Reiner Salzer And Heinz W. Siesler, E., Infrared And Raman Spectroscopic Imaging. 2009, Weinheim, De: Wiley-Vch Verlag Gmbh & Co.
18. P. Lasch And J. Kneipp, E., Biomedical Vibrational Spectroscopy., Ed. E. P. Lasch And J. Kneipp. 2008, Hoboken, Nj: John Wiley & Sons.
19. Lasch, P. And D. Naumann, Spatial Resolution In Infrared Microspectroscopic Imaging Of Tissues. Review Literature And Arts Of The Americas, 2006. 1758: P. 814 - 829.

103
20. Carr, G.L., Resolution Limits For Infrared Microspectroscopy Explored With Synchrotron Radiation. Review Of Scientific Instruments, 2001. 72: P. 1613-1619.
21. Gardiel, P. And M. Boese, Non-Invasive Fourier Transform Infrared Microspectroscopy And Imaging Techniques: Basic Principles And Application., In Modern Research And Educational Topics In Microscopy, E. A. Méndez-Vilas And J. Diaz, Editor. 2007, Formatex: Badajoz, Spain. P. 132-143.
22. Bhargava, R., Et Al., High Throughput Assessment Of Cells And Tissues : Bayesian Classification Of Spectral Metrics From Infrared Vibrational Spectroscopic Imaging Data. Cancer, 2006. 1758: P. 830 - 845.
23. Dumas, P., G. Carr, L., And G. Williams, P., Enhancing The Lateral Resolution In Infrared Microspectrometry By Using Synchrotron Radiation: Applications And Perspectives. Analusis, 2000. 28(1): P. 68.
24. Lewis, E.N., Et Al., Fourier Transform Spectroscopic Imaging Using An Infrared Focal-Plane Array Detector. Analytical Chemistry, 1995. 67: P. 3377-81.
25. Miller, L. And R. Smith, Synchrotrons Versus Globars, Point-Detectors Versus Focal Plane Arrays: Selecting The Best Source And Detector For Specific Infrared Microspectroscopy And Imaging Applications. Vibrational Spectroscopy, 2005. 38: P. 237-240.
26. Moss, D., B. Gasharova, And Y. Mathis, Practical Tests Of A Focal Plane Array Detector Microscope At The Anka-Ir Beamline. Infrared Physics & Technology, 2006. 49: P. 53-56.
27. Holman, H.N., M.C. Martin, And W.R. Mckinney, Synchrotron-Based Ftir Spectromicroscopy : Cytotoxicity And Heating Considerations. Journal Of Biological Physics, 2003: P. 275-286.
28. Carr, G.L. And G.P. Williams, Infrared Microspectroscopy With Synchrotron Radiation Source Point. Transform, 1997. 51.
29. Duncan, W.D. And G.P. Williams, Infrared Synchrotron Radiation From Electron Storage Rings. Appl. Opt., 1983. 22(18): P. 2914-2923.
30. Schade, U. And W.B. Peatman, The Synchrotron Infrared Activities At Bessy. Journal Of Biological Physics, 2003. 29(2): P. 309-312.
31. Lobo, R.P.S.M., Et Al., Performance Of New Infrared Beamline U12ir At The National Synchrotron Light Source. Review Of Scientific Instruments, 1999. 70(7): P. 2899-2904.
32. Lupi, S., Et Al., Performance Of Sissi , The Infrared Beamline Of The Elettra Storage Ring. America, 2007. 24: P. 959-964.
33. Holman, H.-Y.N., Et Al., Real-Time Chemical Imaging Of Bacterial Activity In Biofilms Using Open-Channel Microfluidics And Synchrotron Ftir Spectromicroscopy. October, 2009. 81: P. 8564-8570.
34. Rahmelow, K.I.M. And W. Hu, Infrared Spectroscopy In Aqueous Solution: Difficulties And Accuracy Of Water Subtraction. Applied Spectroscopy, 1997. 51: P. 160-170.
35. Venyaminov, S.Y. And F.G. Prendergast, Water ( H 2 O And D 2 O ) Molar Absorptivity In The 1000 – 4000 Cm 01 Range And Quantitative Infrared Spectroscopy Of Aqueous Solutions 1. 1997. 245: P. 234-245.
36. Venyaminov, S.Y. And N.N. Kalnin, Quantitative Ir Spectroscopy Of Peptide Compounds In Water (H2o) Solutions. Ii. Amide Absorption Bands Of Polypeptides And Fibrous Proteins In Alpha-, Beta-, And Random Coil Conformations. Biopolymers, 1990. 30: P. 1259–1271.
37. Dousseau, F., M. Therrien, And M. Pézolet, On The Spectral Subtraction Of Water From The Ft-Ir Spectra Of Aqueous Solutions Of Proteins. Applied Spectroscopy, 1989. 43(3): P. 538-542.

104
38. Valeri P. Tolstoy, I.C., Valeri A. Skryshevsky, Handbook Of Infrared Spectroscopy Of Ultrathin Films, Ed. I.C. Valeri P. Tolstoy, Valeri A. Skryshevsky, Eds. 2003, Hoboken, Nj: John Wiley & Sons.
39. Kuimova, M.K., K.L.A. Chan, And S.G. Kazarian, Chemical Imaging Of Live Cancer Cells In The Natural Aqueous Environment. Applied Spectroscopy, 2009. 63: P. 164-71.
40. Arsov, Z. And L. Quaroni, Detection Of Lipid Phase Coexistence And Lipid Interactions In Sphingomyelin / Cholesterol Membranes By Atr-Ftir Spectroscopy. Analysis, 2008.
41. Bassan, P., Et Al., Reflection Contributions To The Dispersion Artefact In Ftir Spectra Of Single Biological Cells †. Cancer Research, 2009: P. 1171-1175.
42. Heraud, P., Et Al., Mapping Of Nutrient-Induced Biochemical Changes In Living Algal Cells Using Synchrotron Infrared Microspectroscopy. Fems Microbiology Letters, 2005. 249: P. 219-25.
43. Gierlinger, N., Et Al., In Situ Ft-Ir Microscopic Study On Enzymatic Treatment Of Poplar Wood Cross-Sections In Situ Ft-Ir Microscopic Study On Enzymatic Treatment Of Poplar Wood Cross-Sections. Biomacromolecules 2008. 9(8): P. 2194–2201.
44. Moss, D., M. Keese, And R. Pepperkok, Ir Microspectroscopy Of Live Cells. Vibrational Spectroscopy, 2005. 38: P. 185-191.
45. Nasse, M.J., Et Al., Spectroscopic Techniques Demountable Liquid / Flow Cell For In Vivo Infrared Microspectroscopy Of Biological Specimens. Applied Spectroscopy, 2009. 63: P. 1181-1186.
46. Schwille, P.S.D.A.P., An Integrated Microfluidic System For Reaction, High-Sensitivity Detection, And Sorting Of Fluorescent Cells And Particles. Analytical Chemistry, 2003. 75(21): P. 5767-5774.
47. Amatore, C., Et Al., Electrochemical Detection In A Microfluidic Device Of Oxidative Stress Generated By Macrophage Cells. Lab On A Chip, 2007. 7: P. 233-238.
48. Whitesides, G.M., The Origins And The Future Of Microfluidics. Nature, 2006. 442. 49. Lee Pj, H.P., Shaw R, Jan L, And Lee Lp, Microfluidic Application-Specific Integrated Device
For Monitoring Direct Cell-Cell Communication Via Gap Junctions Between Individual Cell Pairs. Applied Physic Letters, 2005. 86: P. 223902-223905.
50. Madou, M.J., Fundamentals Of Microfabrication: The Science Of Miniaturization, Ed. E. Marc J. Madou. 2002 Boca Raton, Fl:: Crc Press - Taylor And Francis.
51. Polyanskiy, M. Refractive Index Database. Available From: Http://Refractiveindex.Info/. 52. Su, J.B.A.G.-J., Interpretation Of The Infrared Spectra Of Fused Silica. Journal Of The
American Ceramic Society, 1970. 53(2): P. 69 - 73. 53. Ptak, E.E.A.W.S., Infrared Studies Of Silicon Nitride. Journal Of Molecular Structure, 1986.
143: P. 5-8. 54. Wang, X.H., L.Pilone, And W. Zhu, Infrared Optical Properties Of Cvd Diamond Films.
Journal Of Materials Research, 1990. 5(11): P. 2345-2350. 55. Wang, J.H.-C. And B.P. Thampatty, An Introductory Review Of Cell Mechanobiology.
Biomechanics And Modeling In Mechanobiology, 2006. 5: P. 1-16. 56. Koning, A.J., Et Al., Dioc6 Staining Reveals Organelle Structure And Dynamics In Living Yeast
Cells. Cell Motility And The Cytoskeleton, 1993. 25(2): P. 111-128. 57. Romanato, F., Et Al., Lilit Beamline For Soft And Deep X-Ray Lithography At Elettra.
Microelectronic Engineering, 2001. 57-58: P. 101-107. 58. Di Fabrizio, E., Et Al., Design Of A Beamline For Soft And Deep Lithography On Third
Generation Synchrotron Radiation Source. Review Of Scientific Instruments, 1999. 70(3): P. 1605-1613.

105
59. Busscher, H.J., H.P.D. Jong, And J. Arends, Surface Free Energies Of Hydroxyapatite, Fluorapatite And Calcium Fluoride. Materials Chemistry And Physics, 1987. 17(6): P. 553-558.
60. Pan, T., Et Al., Fabrication Of Calcium Fluoride Capillary Electrophoresis Microdevices For On-Chip Infrared Detection. Journal Of Chromatography A, 2004. 1027: P. 231-235.
61. Birarda, G., Et Al., Fabrication Of A Microfluidic Platform For Investigating Dynamic Biochemical Processes In Living Samples By Ftir Microspectroscopy. Microelectronic Engineering, 2010. 87(5-8): P. 806-809.
62. Moser, B. And K. Willimann, Chemokines: Role In Inflammation And Immune Surveillance. Annals Of The Rheumatic Diseases, 2004. 63(Suppl 2): P. Ii84-Ii89.
63. Wang, S.Y., Et Al., Heterogeneity Of Human Blood Monocyte: Two Subpopulations With Different Sizes, Phenotypes And Functions. Immunology, 1992. 77(2): P. 298-303.
64. Sundström, C. And K. Nilsson, Establishment And Characterization Of A Human Histiocytic Lymphoma Cell Line (U-937). International Journal Of Cancer, 1976. 17(5): P. 565-577.
65. Tsuchiya, S., Et Al., Establishment And Characterization Of A Human Acute Monocytic Leukemia Cell Line (Thp-1). Int J Cancer, 1980. 26(2): P. 171-6.
66. Marcsisin, E.J., Et Al., Infrared Microspectroscopy Of Live Cells In Aqueous Media. Analyst, 2010. 135(12): P. 3227-3232.
67. Bassan, P., Et Al., Resonant Mie Scattering In Infrared Spectroscopy Of Biological Materials--Understanding The 'Dispersion Artefact'. Analyst, 2009. 134(8): P. 1586-93.
68. Mohlenhoff, B., Et Al., Mie-Type Scattering And Non-Beer-Lambert Absorption Behavior Of Human Cells In Infrared Microspectroscopy. Biophysical Journal, 2005. 88: P. 3635-3640.
69. Romeo, M., B. Mohlenhoff, And M. Diem, Infrared Micro-Spectroscopy Of Human Cells : Causes For The Spectral Variance Of Oral Mucosa ( Buccal ) Cells. Vibrational Spectroscopy, 2006. 42: P. 9-14.
70. Querry, M.R. And B. Curnutte, Passive And Dynamic Absorption Refractive Index Of Water In The Infrared *. Journal Of The Optical Society Of America, 1969.
71. Schiebener, P., Et Al., Refractive Index Of Water And Steam As Function Of Wavelength, Temperature And Density. Journal Of Physical And Chemical Reference Data, 1990. 19(3): P. 677-717.
72. Lee, J., Et Al., Optical Artefacts In Transflection Mode Ftir Microspectroscopic Images Of Single Cells On A Biological Support: The Effect Of Back-Scattering Into Collection Optics. Analyst, 2007. 132(8): P. 750-5.
73. Mariani, M.M., Et Al., Impact Of Fixation On In Vitro Cell Culture Lines Monitored With Raman Spectroscopy †. Society, 2009: P. 1154-1161.
74. Huang, Z., Et Al., Near-Infrared Raman Spectroscopy For Optical Diagnosis Of Lung Cancer. International Journal Of Cancer, 2003. 107(6): P. 1047-1052.
75. Huang, Z., Et Al., Effect Of Formalin Fixation On The Near-Infrared Raman Spectroscopy Of Normal And Cancerous Human Bronchial Tissues. Int J Oncol, 2003. 23(3): P. 649-655.
76. Shim, M.G. And B.C. Wilson, The Effects Of Ex Vivo Handling Procedures On The Near-Infrared Raman Spectra Of Normal Mammalian Tissues. Photochemistry And Photobiology, 1996. 63(5): P. 662-671.
77. Faoláin, E.Ó., Et Al., Raman Spectroscopic Evaluation Of Efficacy Of Current Paraffin Wax Section Dewaxing Agents. Journal Of Histochemistry And Cytochemistry, 2005. 53(1): P. 121-129.
78. Pleshko, N.L., A.L. Boskey, And R. Mendelsohn, An Ft-Ir Microscopic Investigation Of The Effects Of Tissue Preservation On Bone. Calcified Tissue International, 1992. 51(1): P. 72-77.

106
79. Hastings, G., Et Al., Infrared Microscopy For The Study Of Biological Cell Monolayers. I. Spectral Effects Of Acetone And Formalin Fixation. Biopolymers, 2008. 89(11): P. 921-930.
80. Gazi, E., Et Al., Fixation Protocols For Subcellular Imaging By Synchrotron-Based Fourier Transform Infrared Microspectroscopy. Biopolymers, 2005. 77: P. 18-30.
81. Dumas, P., Et Al., Synchrotron Infrared Microscopy At The French Synchrotron Facility Soleil. Infrared Physics & Technology, 2006. 49(1-2): P. 152-160.
82. Phipps, J.B., Dendrogram Topology. Systematic Biology, 1971. 20(3): P. 306-308. 83. Ward, J.H., Hierarchical Grouping To Optimize An Objective Function. Journal Of The
American Statistical Association, 1963. 58: P. 236-244. 84. Casal, H.L. And H.H. Mantsch, Polymorphic Phase Behaviour Of Phospholipid Membranes
Studied By Infrared Spectroscopy. Biochim Biophys Acta, 1984. 779(4): P. 381-401. 85. Mantsch, H.H. And R.N. Mcelhaney, Phospholipid Phase Transitions In Model And Biological
Membranes As Studied By Infrared Spectroscopy. Chemistry And Physics Of Lipids, 1991. 57(2-3): P. 213-226.
86. Kiernan, J.A., Histological And Histochemical Methods: Theory And Practice, Ed. J.A. Kiernan. 1981, Oxford: Pergamon.
87. Birarda, G., Et Al., Infrared Microspectroscopy Of Biochemical Response Of Living Cells In Microfabricated Devices. Vibrational Spectroscopy, 2010. 53: P. 6-11.
88. Ghosh, A. And M. Bansal, A Glossary Of Dna Structures From A To Z. Acta Crystallographica Section D, 2003. 59(4): P. 620-626.
89. Zacharias, W., Et Al., The B- To Z-Dna Equilibrium In Vivo Is Perturbed By Biological Processes. Proceedings Of The National Academy Of Sciences, 1988. 85: P. 7069-7073.
90. Zacharias, W., A. Jaworski, And R.D. Wells, Cytosine Methylation Enhances Z-Dna Formation In Vivo. Biochemistry, 1990. 172: P. 3278-3283.
91. Lindsay, S.M., Et Al., The Origin Of The A To B Transition In Dna Fibers And Films. Biopolymers, 1988. 27(6): P. 1015-1043.
92. Rich, A. And S. Zhang, Z-Dna : The Long Road To Biological Function. Nature Genetics, 2003. 4: P. 566-572.
93. Bassan, P., Et Al., Rmies-Emsc Correction For Infrared Spectra Of Biological Cells: Extension Using Full Mie Theory And Gpu Computing. Journal Of Biophotonics, 2010. 3(8-9): P. 609-620.
94. The Spatial Variation Of The Refractive Index In Biological Cells. Search, 1996. 369. 95. Stillman, B., Cell Cycle Control Of Dna Replication. Science, 1996. 274(5293): P. 1659-1663. 96. Holman, H.-Y.N., Et Al., Ir Spectroscopic Characteristics Of Cell Cycle And Cell Death Probed
By Synchrotron Radiation Based Fourier Transform Ir Spectromicroscopy. Biospectroscopy, 2000: P. 329-335.
97. Uemura, S., Et Al., Single-Molecule Imaging Of Full Protein Synthesis By Immobilized Ribosomes. Nucleic Acids Res, 2008. 36(12): P. E70.
98. Diem, M., L. Chiriboga, And H. Yee, Infrared Spectroscopy Of Human Cells And Tissue. Viii. Strategies For Analysis Of Infrared Tissue Mapping Data And Applications To Liver Tissue. Biopolymers, 2000. 57: P. 282-90.
99. Dreissig, I., Et Al., Quantification Of Brain Lipids By Ftir Spectroscopy And Partial Least Squares Regression. Spectrochimica Acta Part A: Molecular And Biomolecular Spectroscopy, 2009. 71(5): P. 2069-2075.
100. H, N.W. And S.J. F., Uv Resonance Raman Spectroscopic Detection And Identification Of Bacteria And Other Microorganisms, In Modern Techniques For Rapid Microbiological Analysis, N. W., Editor. 1991, Vch Publishers: New York, N.Y. P. 97-143.

107
101. Zhizhina, G.P. And E.F. Oleinik, Infrared Spectroscopy Of Nucleic Acids. Russian Chemical Reviews, 1972. 41(3).
102. Martens, S. And H.T. Mcmahon, Mechanisms Of Membrane Fusion: Disparate Players And Common Principles. Nat Rev Mol Cell Biol, 2008. 9(7): P. 543-556.
103. Wyllie, A.H., Glucocorticoid-Induced Thymocyte Apoptosis Is Associated With Endogenous Endonuclease Activation. Nature, 1980. 284(5756): P. 555-556.
104. Popov, S.G., Et Al., Lethal Toxin Of Bacillus Anthracis Causes Apoptosis Of Macrophages. Biochemical And Biophysical Research Communications, 2002. 293(1): P. 349-355.
105. Brune, B., Nitric Oxide: No Apoptosis Or Turning It On? Cell Death Differ, 0000. 10(8): P. 864-869.
106. Martin, J., K. Mahlke, And N. Pfanner, Role Of An Energized Inner Membrane In Mitochondrial Protein Import. Delta Psi Drives The Movement Of Presequences. Journal Of Biological Chemistry, 1991. 266(27): P. 18051-18057.
107. Uemura, S., Et Al., Single-Molecule Imaging Of Full Protein Synthesis By Immobilized Ribosomes. Nucleic Acids Research, 2008. 36(12): P. E70.
108. Chen, L.-Y., A. Ptasznik, And Z.K. Pan, Rhoa And Rac1 Signals In Fmlp-Induced Nf-Jb Activation In Human Blood Monocytes. Biochemical And Biophysical Research Communications, 2004. 319: P. 629-635.
109. Moazzam, F., Et Al., The Leukocyte Response To Fluid Stress. Proceedings Of The National Academy Of Sciences Of The United States Of America, 1997. 94(10): P. 5338-5343.
110. Niebauer, M.D.J. And M.D.P.F.J.P. Cooke, Cardiovascular Effects Of Exercise: Role Of Endothelial Shear Stress. Journal Of The American College Of Cardiology, 1996. 28(7): P. 1652-1660.
111. Chiang, Y.-Y., Et Al., Microfluidic Shear Stress-Induced Differentiation Of Human Stem Cells Into Endothelial Cells . American Journal Of Physiology, 2009: P. 20-22.
112. Chappell, D.C., Et Al., Oscillatory Shear Stress Stimulates Adhesion Molecule Expression In Cultured Human Endothelium. Circ Res, 1998. 82(5): P. 532-539.
113. Dumas, P. And L. Miller, The Use Of Synchrotron Infrared Microspectroscopy In Biological And Biomedical Investigations. Vibrational Spectroscopy, 2003. 32: P. 3-21.
114. Faist, J., Et Al., Quantum Cascade Laser. Science, 1994. 264(5158): P. 553-556.

108
List of Publications
• Half-sandwich RuII-[9]anes3 complexes with dicarboxylate ligands: synthesis,
characterization and chemical behavior. Dalton trans., 2007, issue 28, 36, 4048 – 4058
• Cadmium-halide and mixed cadmium-halide-dicyanamide polymers mediated by
ancillary 2-aminoalkyl-pyridine ligands: synthesis, X-ray single crystal structures and
luminescence property. Polyhedron volume 27, issue 11, 4, 2008, 2452-2458
• Fabrication of a microfluidic platform for investigating dynamic biochemical processes
in living samples by FTIR microspectroscopy. Microelectronic engineering volume 87,
issue 5-8, 2010, 806-809
• Infrared microspectroscopy of biochemical response of living cells in microfabricated
devices. Vibrational spectroscopy volume 53, issue 1, 26 may 2010, 6-11
• Tracking infrared signatures of drugs in cancer cells by fourier transform
microspectroscopy. Analyst, 2010, 135, 3077-3086
• Evaluation of a novolac based positive tone photoresist as nanoimprint lithography
resist. Doi: 10.1016/j.mee.2011.01.018
• “Synchrotron radiation infrared microspectroscopy (SR-IRMS) of living-cells in
physiological environment”. In “Microscopy: Science, Technology, Applications And
Education”. Volume 1 ISBN (13): 978-84-614-6189-9
109
CONFERENCES:
• Poster Presentation in the 5th International Conference on Advanced Vibrational
Spectroscopy, Melbourne (Australia) from 12-17 July 2009
• Poster Presentation in the 2nd PhD Workshop Wittenberg 10-11 September 2009
• Oral Presentation in NNC2009. Pavia, 21-22 September 2009
• Poster Presentation in the 35th International Conference on Micro & Nano
Engineering, Ghent (Belgium) from 28 September - 1 October 2009.
• Poster Presentation in the 13th International Conference on Miniaturized Systems for
Chemistry and Life Sciences (MicroTAS 2009), Jeju (South Korea) from 1-5 November
2009.
• The Proceedings of Conference on Miniaturized Systems for Chemistry and Life
Sciences (MicroTAS 2009), Giovanni Birarda,Gianluca Grenci, Luca Businaro,
Benedetta Marmiroli, Giuseppe Bellisola and Lisa Vaccari, Single Living Cell
Biochemical Rearrangements Investigated By Infrared Microspectroscopy In
Microfluidic Devices - 978-0-9798064-2-1/μTAS2009/$20ⓒ2009CBMS pp 338-341.
• Poster and Flash Oral Presentation in Spec2010. Manchester, UK, 26th June – 02 July
2010
• •Oral Presentation in Spec2010. Manchester, UK, 26th June – 02 July 2010
• Poster Presentation in the 36th International Conference on Micro & Nano
Engineering, Genova (Italy).
• Poster Presentation in the 14th International Conference on Miniaturized Systems for
Chemistry and Life Sciences (MicroTAS 2010), Gronigen (Netherlands) from 3-7
October 2010.
• Oral Presentation at “I Giovani e la Chimica in Friuli Venezia Giulia”, Udine (Italy)
24th of September 2010
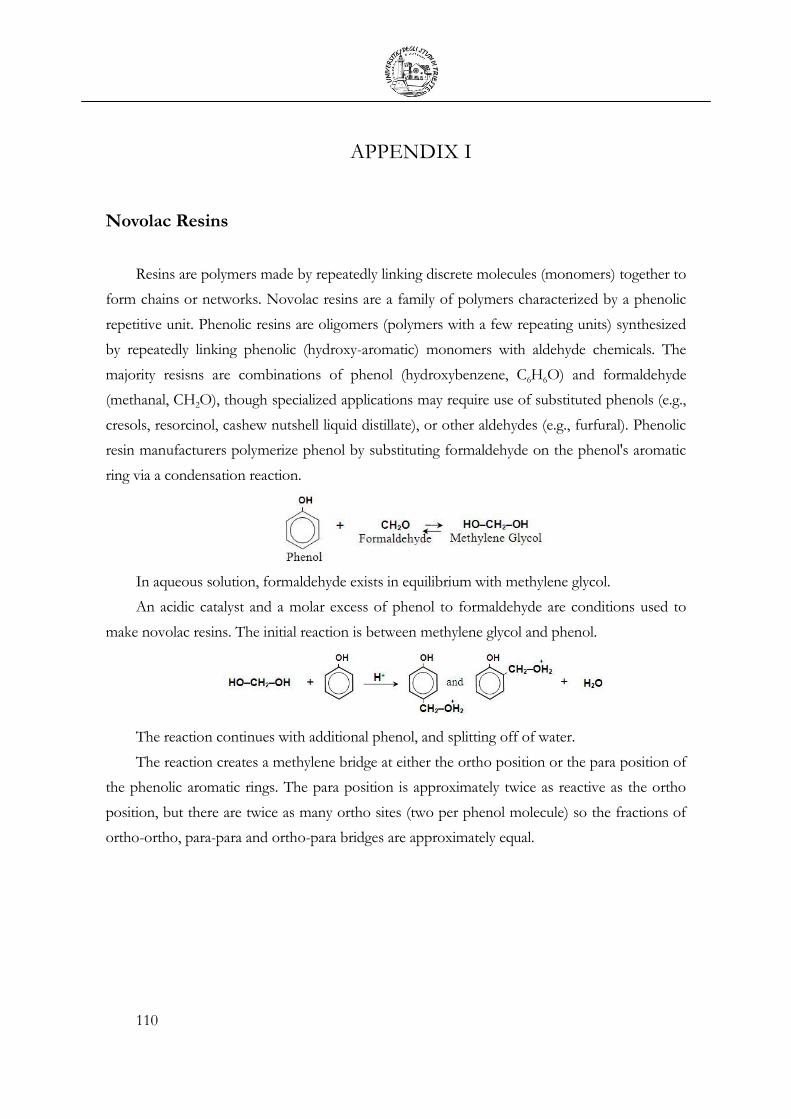
110
APPENDIX I
Novolac Resins
Resins are polymers made by repeatedly linking discrete molecules (monomers) together to
form chains or networks. Novolac resins are a family of polymers characterized by a phenolic
repetitive unit. Phenolic resins are oligomers (polymers with a few repeating units) synthesized
by repeatedly linking phenolic (hydroxy-aromatic) monomers with aldehyde chemicals. The
majority resisns are combinations of phenol (hydroxybenzene, C6H6O) and formaldehyde
(methanal, CH2O), though specialized applications may require use of substituted phenols (e.g.,
cresols, resorcinol, cashew nutshell liquid distillate), or other aldehydes (e.g., furfural). Phenolic
resin manufacturers polymerize phenol by substituting formaldehyde on the phenol's aromatic
ring via a condensation reaction.
In aqueous solution, formaldehyde exists in equilibrium with methylene glycol.
An acidic catalyst and a molar excess of phenol to formaldehyde are conditions used to
make novolac resins. The initial reaction is between methylene glycol and phenol.
The reaction continues with additional phenol, and splitting off of water.
The reaction creates a methylene bridge at either the ortho position or the para position of
the phenolic aromatic rings. The para position is approximately twice as reactive as the ortho
position, but there are twice as many ortho sites (two per phenol molecule) so the fractions of
ortho-ortho, para-para and ortho-para bridges are approximately equal.
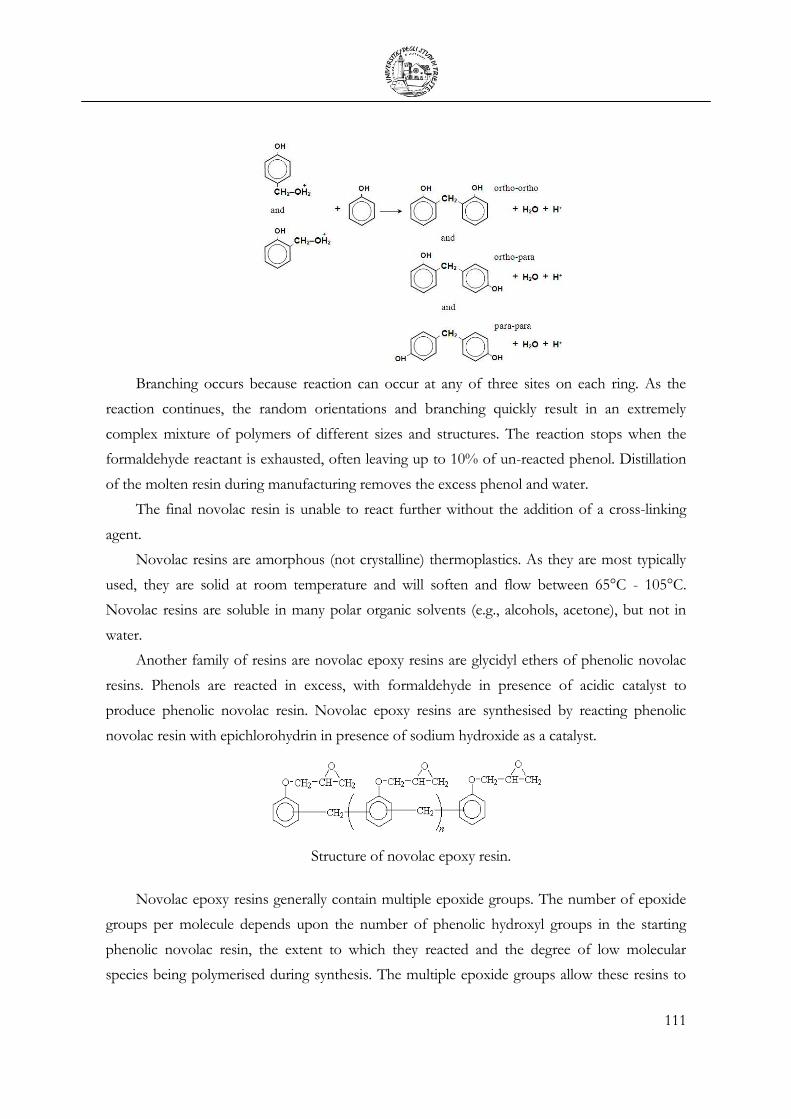
111
Branching occurs because reaction can occur at any of three sites on each ring. As the
reaction continues, the random orientations and branching quickly result in an extremely
complex mixture of polymers of different sizes and structures. The reaction stops when the
formaldehyde reactant is exhausted, often leaving up to 10% of un-reacted phenol. Distillation
of the molten resin during manufacturing removes the excess phenol and water.
The final novolac resin is unable to react further without the addition of a cross-linking
agent.
Novolac resins are amorphous (not crystalline) thermoplastics. As they are most typically
used, they are solid at room temperature and will soften and flow between 65°C - 105°C.
Novolac resins are soluble in many polar organic solvents (e.g., alcohols, acetone), but not in
water.
Another family of resins are novolac epoxy resins are glycidyl ethers of phenolic novolac
resins. Phenols are reacted in excess, with formaldehyde in presence of acidic catalyst to
produce phenolic novolac resin. Novolac epoxy resins are synthesised by reacting phenolic
novolac resin with epichlorohydrin in presence of sodium hydroxide as a catalyst.
Structure of novolac epoxy resin.
Novolac epoxy resins generally contain multiple epoxide groups. The number of epoxide
groups per molecule depends upon the number of phenolic hydroxyl groups in the starting
phenolic novolac resin, the extent to which they reacted and the degree of low molecular
species being polymerised during synthesis. The multiple epoxide groups allow these resins to

112
achieve high cross-link density resulting in excellent temperature, chemical and solvent
resistance. Novolac epoxy resins are widely used to formulate the moulding compounds for
microelectronics packaging because of their superior performance at elevated temperature,
excellent mouldability, and mechanical properties, superior electrical properties, and heat and
humidity resistance.