Development of an Oat Based Tofu
100
UNIVERSITÀ DEGLI STUDI DI MILANO Facoltà di Agraria Corso di Laurea in Scienze e Tecnologie Alimentari SVILUPPO DI UN PRODOTTO ANALOGO AL TOFU A BASE AVENA DEVELOPMENT OF AN OAT BASED TOFU Relatore: Prof.ssa Mara LUCISANO Elaborato finale di: Filippo ACERBI Matricola: 689263 Anno Accademico 2007 / 2008
description
Development of an innovative food product: oat tofu with healthy properties (blood cholesterol lowering)
Transcript of Development of an Oat Based Tofu
UNIVERSITÀ DEGLI STUDI DI MILANO
Facoltà di Agraria
Corso di Laurea in Scienze e Tecnologie Alimentari
SVILUPPO DI UN PRODOTTO ANALOGO AL TOFU A BASE
AVENA
DEVELOPMENT OF AN OAT BASED TOFU
Relatore: Prof.ssa Mara LUCISANO
Elaborato finale di:
Filippo ACERBI
Matricola: 689263
Anno Accademico 2007 / 2008
Riassunto
- 2 -
Riassunto
Lo scopo della ricerca svolta è stato quello di produrre un nuovo alimento simile al tofu di soia,
ma utilizzando come materia prima l’avena. Il progetto si è sviluppato nell’ambito del corso
Integrated Food Project che ho seguito durante il soggiorno di studio all’estero nell’università
svedese di Lund, nel semestre Gennaio/Giugno 2008.
Il gruppo di ricerca, composto da nove studenti di diverse nazionalità, doveva raggiungere in 5
mesi i seguenti obiettivi:
il prodotto doveva presentare un gusto neutro, da poter essere consumato in abbinamento
ad alimenti dolci o salati;
doveva essere venduto come prodotto funzionale, capace di ridurre i tassi ematici di
colesterolo, secondo quanto specificato dalla legislazione americana;
Inoltre, al termine della sperimentazione, doveva essere preparata una relazione dettagliata
riguardante la composizione chimica, il processo di produzione, l’analisi sensoriale, il calcolo dei
costi e le condizioni necessarie per una produzione industriale annua di 100 tonnellate.
Per la realizzazione di questo progetto, il gruppo di studenti ha assunto una precisa
organizzazione con un project leader e più sottogruppi che si sono divisi i compiti; le lezioni e le
ricerche bibliografiche sono state effettuate nella prima fase e gli esperimenti in laboratorio negli
ultimi due mesi.
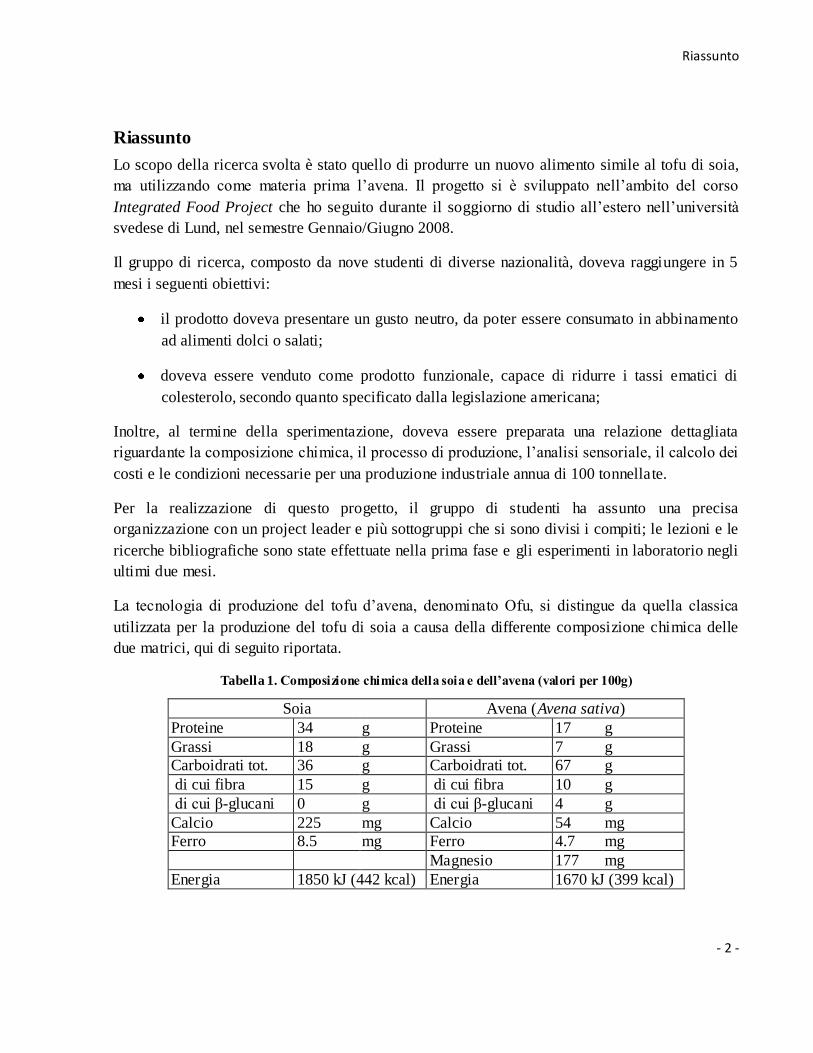
La tecnologia di produzione del tofu d’avena, denominato Ofu, si distingue da quella classica
utilizzata per la produzione del tofu di soia a causa della differente composizione chimica delle
due matrici, qui di seguito riportata.
Tabella 1. Composizione chimica della soia e dell’avena (valori per 100g)
Soia Avena (Avena sativa)
Proteine 34 g Proteine 17 g
Grassi 18 g Grassi 7 g
Carboidrati tot. 36 g Carboidrati tot. 67
g
g
di cui fibra 15 g di cui fibra 10 g
di cui β-glucani 0 g di cui β-glucani 4 g
Calcio 225 mg Calcio 54 mg
Ferro 8.5 mg Ferro 4.7 mg
Magnesio 177 mg
Energia 1850 kJ (442 kcal) Energia 1670 kJ (399 kcal)
Riassunto
- 3 -
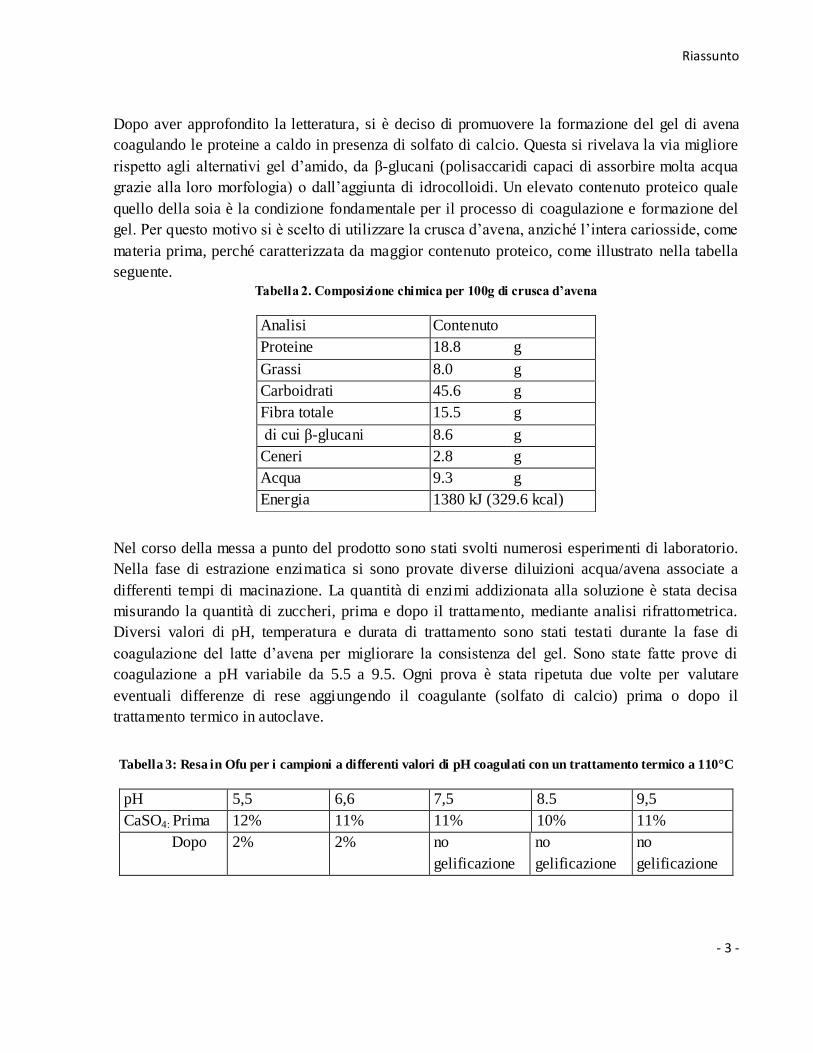
Dopo aver approfondito la letteratura, si è deciso di promuovere la formazione del gel di avena
coagulando le proteine a caldo in presenza di solfato di calcio. Questa si rivelava la via migliore
rispetto agli alternativi gel d’amido, da β-glucani (polisaccaridi capaci di assorbire molta acqua
grazie alla loro morfologia) o dall’aggiunta di idrocolloidi. Un elevato contenuto proteico quale
quello della soia è la condizione fondamentale per il processo di coagulazione e formazione del
gel. Per questo motivo si è scelto di utilizzare la crusca d’avena, anziché l’intera cariosside, come
materia prima, perché caratterizzata da maggior contenuto proteico, come illustrato nella tabella
seguente.
Tabella 2. Composizione chimica per 100g di crusca d’avena
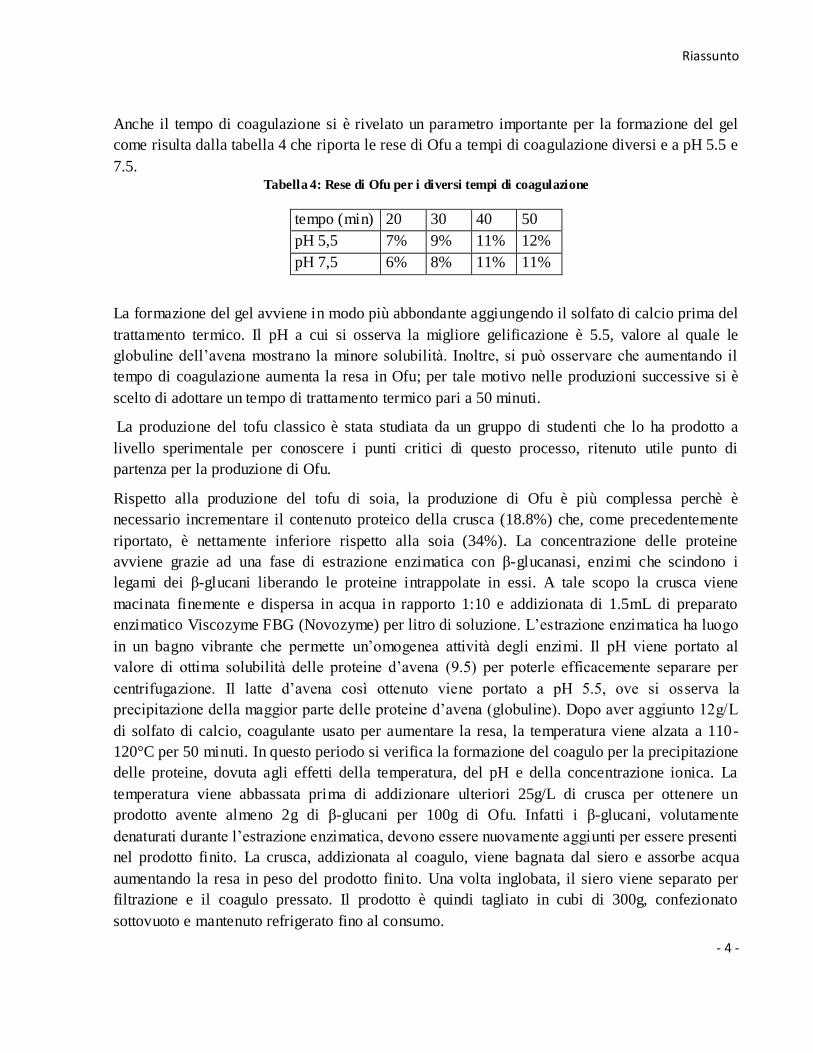
Nel corso della messa a punto del prodotto sono stati svolti numerosi esperimenti di laboratorio.
Nella fase di estrazione enzimatica si sono provate diverse diluizioni acqua/avena associate a
differenti tempi di macinazione. La quantità di enzimi addizionata alla soluzione è stata decisa
misurando la quantità di zuccheri, prima e dopo il trattamento, mediante analisi rifrattometrica.
Diversi valori di pH, temperatura e durata di trattamento sono stati testati durante la fase di
coagulazione del latte d’avena per migliorare la consistenza del gel. Sono state fatte prove di
coagulazione a pH variabile da 5.5 a 9.5. Ogni prova è stata ripetuta due volte per valutare
eventuali differenze di rese aggiungendo il coagulante (solfato di calcio) prima o dopo il
trattamento termico in autoclave.
Tabella 3: Resa in Ofu per i campioni a differenti valori di pH coagulati con un trattamento termico a 110°C
pH 5,5 6,6 7,5 8.5 9,5
CaSO4: Prima 12% 11% 11% 10% 11%
Dopo 2% 2% no
gelificazione
no
gelificazione
no
gelificazione
Analisi Contenuto
Proteine 18.8 g
Grassi 8.0 g
Carboidrati 45.6 g
Fibra totale 15.5 g
di cui β-glucani 8.6 g
Ceneri 2.8 g
Acqua 9.3 g
Energia 1380 kJ (329.6 kcal)
Riassunto
- 4 -
Anche il tempo di coagulazione si è rivelato un parametro importante per la formazione del gel
come risulta dalla tabella 4 che riporta le rese di Ofu a tempi di coagulazione diversi e a pH 5.5 e
7.5. Tabella 4: Rese di Ofu per i diversi tempi di coagulazione
tempo (min) 20 30 40 50
pH 5,5 7% 9% 11% 12%
pH 7,5 6% 8% 11% 11%
La formazione del gel avviene in modo più abbondante aggiungendo il solfato di calcio prima del
trattamento termico. Il pH a cui si osserva la migliore gelificazione è 5.5, valore al quale le
globuline dell’avena mostrano la minore solubilità. Inoltre, si può osservare che aumentando il
tempo di coagulazione aumenta la resa in Ofu; per tale motivo nelle produzioni successive si è
scelto di adottare un tempo di trattamento termico pari a 50 minuti.
La produzione del tofu classico è stata studiata da un gruppo di studenti che lo ha prodotto a
livello sperimentale per conoscere i punti critici di questo processo, ritenuto utile punto di
partenza per la produzione di Ofu.
Rispetto alla produzione del tofu di soia, la produzione di Ofu è più complessa perchè è
necessario incrementare il contenuto proteico della crusca (18.8%) che, come precedentemente
riportato, è nettamente inferiore rispetto alla soia (34%). La concentrazione delle proteine
avviene grazie ad una fase di estrazione enzimatica con β-glucanasi, enzimi che scindono i
legami dei β-glucani liberando le proteine intrappolate in essi. A tale scopo la crusca viene
macinata finemente e dispersa in acqua in rapporto 1:10 e addizionata di 1.5mL di preparato
enzimatico Viscozyme FBG (Novozyme) per litro di soluzione. L’estrazione enzimatica ha luogo
in un bagno vibrante che permette un’omogenea attività degli enzimi. Il pH viene portato al
valore di ottima solubilità delle proteine d’avena (9.5) per poterle efficacemente separare per
centrifugazione. Il latte d’avena così ottenuto viene portato a pH 5.5, ove si osserva la
precipitazione della maggior parte delle proteine d’avena (globuline). Dopo aver aggiunto 12g/L
di solfato di calcio, coagulante usato per aumentare la resa, la temperatura viene alzata a 110-
120°C per 50 minuti. In questo periodo si verifica la formazione del coagulo per la precipitazione
delle proteine, dovuta agli effetti della temperatura, del pH e della concentrazione ionica. La
temperatura viene abbassata prima di addizionare ulteriori 25g/L di crusca per ottenere un
prodotto avente almeno 2g di β-glucani per 100g di Ofu. Infatti i β-glucani, volutamente
denaturati durante l’estrazione enzimatica, devono essere nuovamente aggiunti per essere presenti
nel prodotto finito. La crusca, addizionata al coagulo, viene bagnata dal siero e assorbe acqua
aumentando la resa in peso del prodotto finito. Una volta inglobata, il siero viene separato per
filtrazione e il coagulo pressato. Il prodotto è quindi tagliato in cubi di 300g, confezionato
sottovuoto e mantenuto refrigerato fino al consumo.
Riassunto
- 5 -
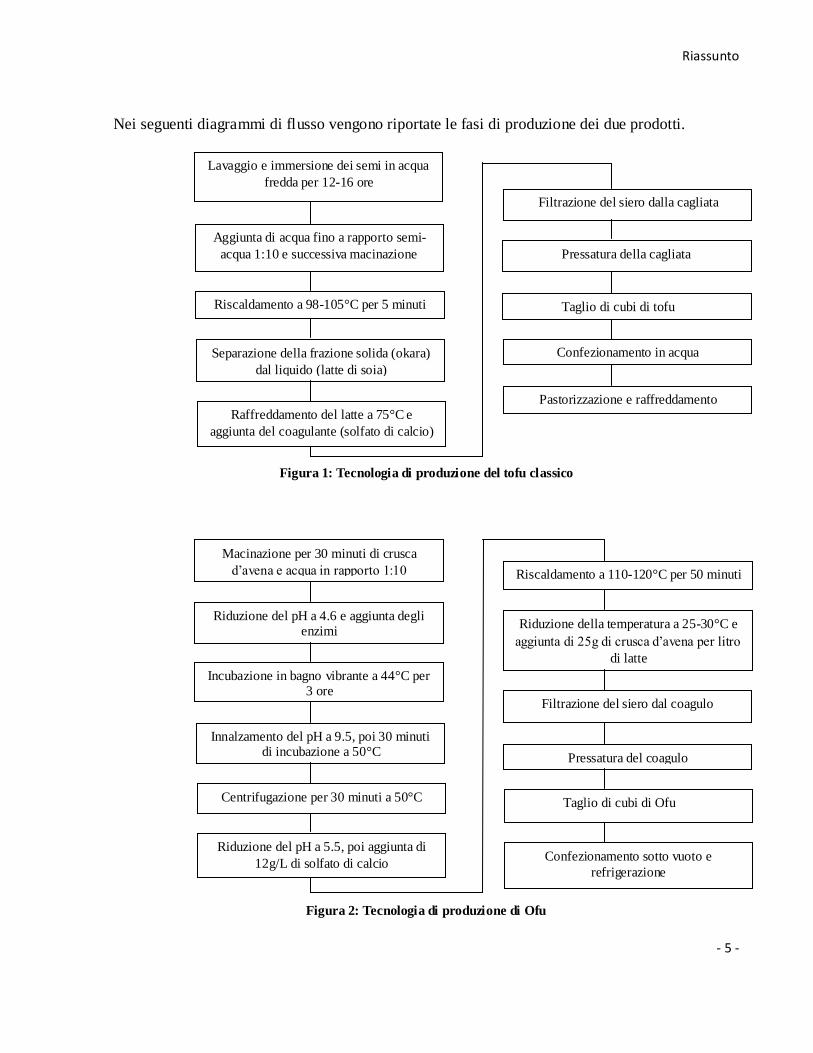
Nei seguenti diagrammi di flusso vengono riportate le fasi di produzione dei due prodotti.
Figura 1: Tecnologia di produzione del tofu classico
Figura 2: Tecnologia di produzione di Ofu
Lavaggio e immersione dei semi in acqua
fredda per 12-16 ore
Aggiunta di acqua fino a rapporto semi-
acqua 1:10 e successiva macinazione
Riscaldamento a 98-105°C per 5 minuti
Separazione della frazione solida (okara)
dal liquido (latte di soia)
Raffreddamento del latte a 75°C e
aggiunta del coagulante (solfato di calcio)
Filtrazione del siero dalla cagliata
Pressatura della cagliata
Taglio di cubi di tofu
Confezionamento in acqua
Pastorizzazione e raffreddamento
Macinazione per 30 minuti di crusca
d’avena e acqua in rapporto 1:10
Riduzione del pH a 4.6 e aggiunta degli enzimi
Incubazione in bagno vibrante a 44°C per 3 ore
Innalzamento del pH a 9.5, poi 30 minuti di incubazione a 50°C
Centrifugazione per 30 minuti a 50°C
Riduzione del pH a 5.5, poi aggiunta di
12g/L di solfato di calcio
Riscaldamento a 110-120°C per 50 minuti
Riduzione della temperatura a 25-30°C e
aggiunta di 25g di crusca d’avena per litro
di latte
Filtrazione del siero dal coagulo
Pressatura del coagulo
Taglio di cubi di Ofu
Confezionamento sotto vuoto e
refrigerazione
Riassunto
- 6 -
Sono state svolte alcune analisi sensoriali sul prodotto intermedio per definire possibili difetti ed
intervenire con azioni correttive durante le fasi di messa a punto del prodotto. Le analisi
sensoriali sono state effettuate mediante l’utilizzo di 14 descrittori della consistenza e condotte in
laboratorio dal gruppo di studenti per notare eventuali differenze tra un campione di tofu
commerciale e campioni di Ofu pressati e non pressati, senza l’aggiunta di crusca. L’Ofu pressato
è risultato molto simile al derivato della soia, tranne che per i seguenti descrittori: iniziale
adesività alle labbra, elasticità, durezza. Per quanto riguarda la differenza di gusto tra i due
prodotti (Ofu pressato e tofu), l’Ofu è risultato avere un sapore d’avena significativamen te più
forte rispetto al tofu. Tutti i giudici hanno trovato nell’Ofu un aroma più forte. Questo aroma è
stato ritenuto gradevole dal 50% circa delle persone che hanno assaggiato il prodotto finito a base
d’avena e il tofu classico.
Sul prodotto finito è stato determinato il contenuto di sostanza secca equivalente al 35%,
maggiore rispetto al tofu classico (23%). Il contenuto proteico analizzato mediante metodo
Kjeldahl corrisponde all’ 11%, inferiore rispetto a quello del tofu. Di fondamentale importanza è
la presenza del 2.3% di β-glucani nell’Ofu, corrispondente a più del 50% dell’ assunzione
giornaliera raccomandata di fibra.
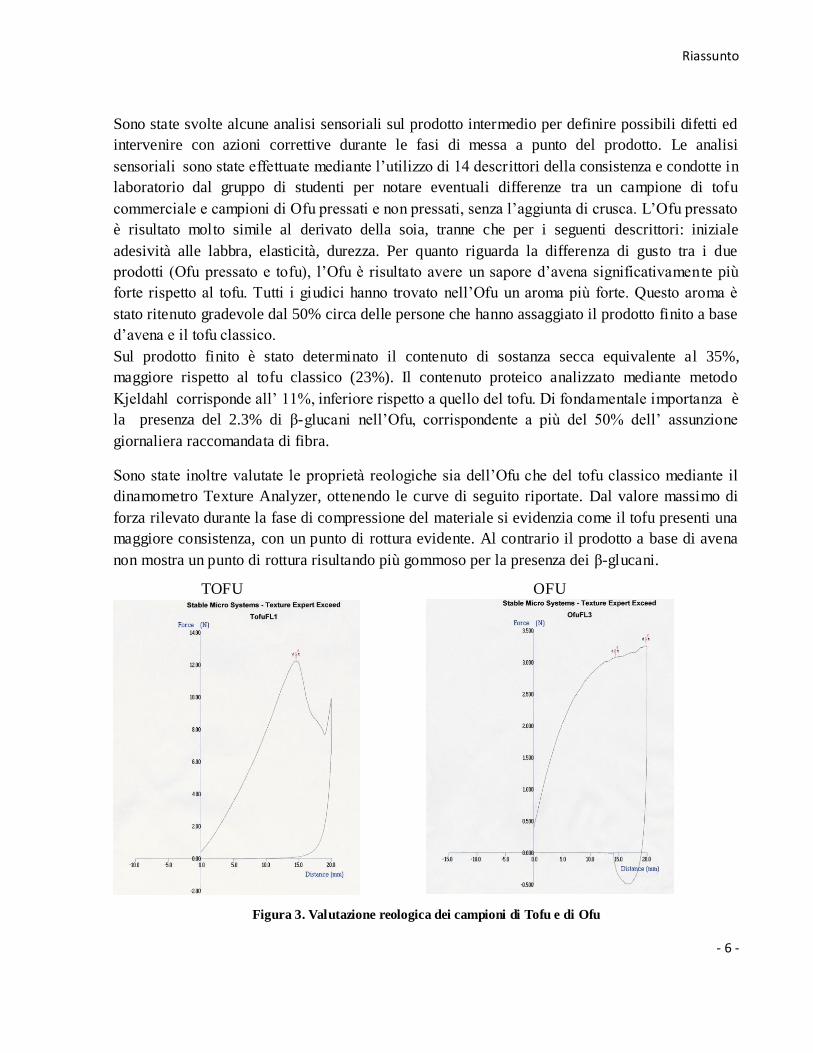
Sono state inoltre valutate le proprietà reologiche sia dell’Ofu che del tofu classico mediante il
dinamometro Texture Analyzer, ottenendo le curve di seguito riportate. Dal valore massimo di
forza rilevato durante la fase di compressione del materiale si evidenzia come il tofu presenti una
maggiore consistenza, con un punto di rottura evidente. Al contrario il prodotto a base di avena
non mostra un punto di rottura risultando più gommoso per la presenza dei β-glucani.
TOFU OFU
Figura 3. Valutazione reologica dei campioni di Tofu e di Ofu
Riassunto
- 7 -
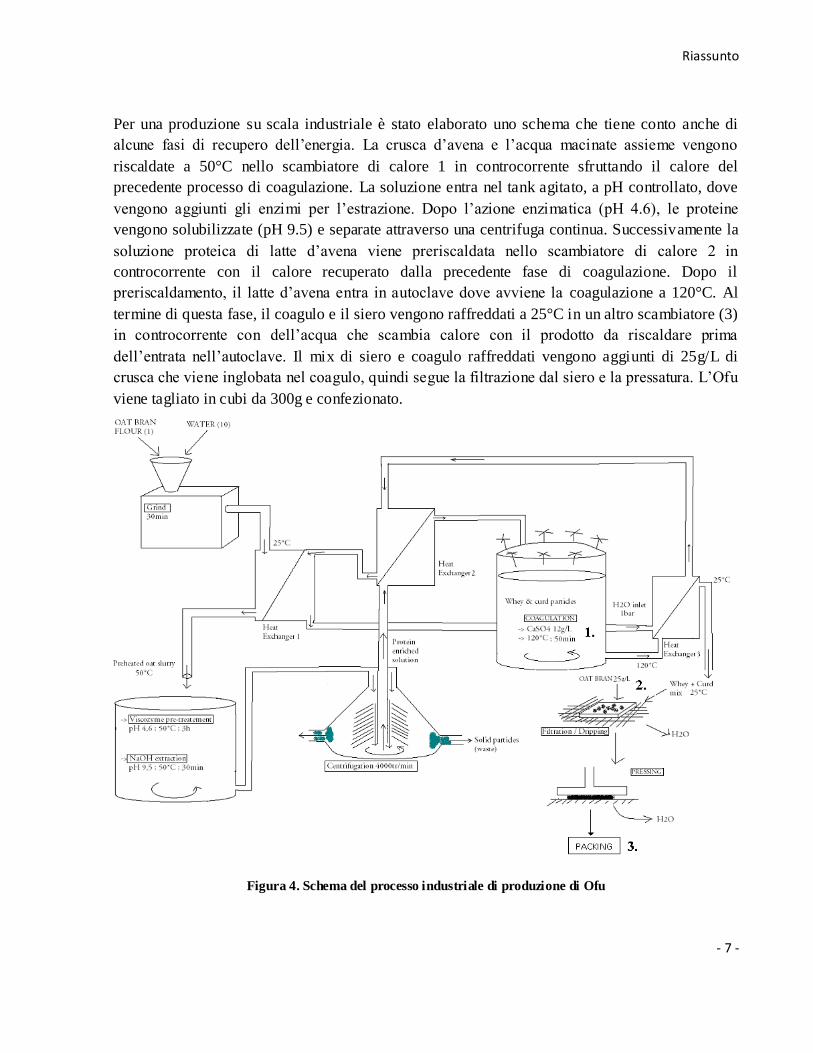
Per una produzione su scala industriale è stato elaborato uno schema che tiene conto anche di
alcune fasi di recupero dell’energia. La crusca d’avena e l’acqua macinate assieme vengono
riscaldate a 50°C nello scambiatore di calore 1 in controcorrente sfruttando il calore del
precedente processo di coagulazione. La soluzione entra nel tank agitato, a pH controllato, dove
vengono aggiunti gli enzimi per l’estrazione. Dopo l’azione enzimatica (pH 4.6), le proteine
vengono solubilizzate (pH 9.5) e separate attraverso una centrifuga continua. Successivamente la
soluzione proteica di latte d’avena viene preriscaldata nello scambiatore di calore 2 in
controcorrente con il calore recuperato dalla precedente fase di coagulazione. Dopo il
preriscaldamento, il latte d’avena entra in autoclave dove avviene la coagulazione a 120°C. Al
termine di questa fase, il coagulo e il siero vengono raffreddati a 25°C in un altro scambiatore (3)
in controcorrente con dell’acqua che scambia calore con il prodotto da riscaldare prima
dell’entrata nell’autoclave. Il mix di siero e coagulo raffreddati vengono aggiunti di 25g/L di
crusca che viene inglobata nel coagulo, quindi segue la filtrazione dal siero e la pressatura. L’Ofu
viene tagliato in cubi da 300g e confezionato.
Figura 4. Schema del processo industriale di produzione di Ofu
Riassunto
- 8 -
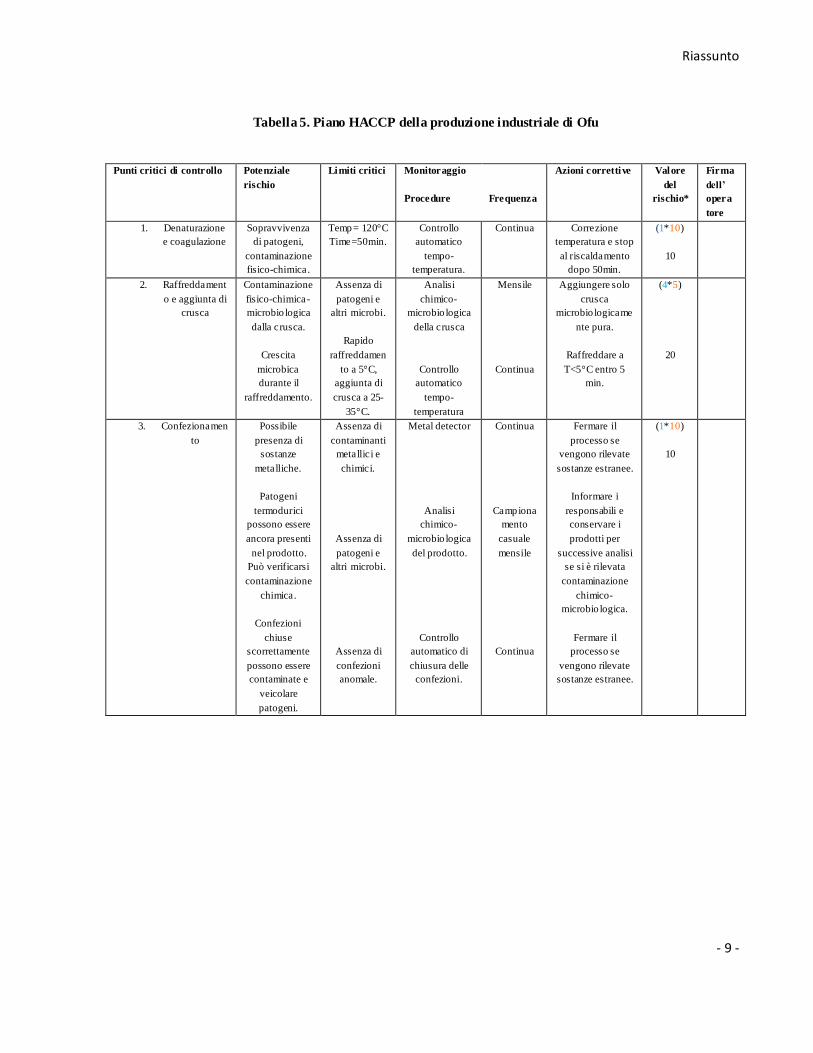
Lo schema di produzione di Ofu a livello industriale è stato completato con un’analisi dei rischi e
dei punti critici di controllo (HACCP). Dall’elaborazione di questa analisi, sono emersi 3 punti
critici che bisogna monitorare attraverso specifici strumenti per evitare possibili danni durante il
processo. I punti critici riguardano rispettivamente la temperatura di denaturazione e
coagulazione delle proteine del latte d’avena in autoclave, il raffreddamento del coagulo,
l’aggiunta di crusca a 25-30°C ed il confezionamento e stoccaggio del prodotto. Tempo e
temperatura di denaturazione sono controllate automaticamente nell’autoclave. Per la fase di
confezionamento punti critici sono l’ermeticità della confezione e la presenza di sostanze
metalliche. Il punto più critico da controllare è probabilmente rappresentato dall’aggiunta di
crusca al coagulo. Questa deve essere il più possibile non contaminata perchè viene unita al
coagulo precedentemente trattato termicamente e non è previsto alcun trattamento termico dopo
tale integrazione. L’aggiunta di crusca non sterilizzata al coagulo influenza fortemente la
conservabilità del prodotto, rendendo necessario un confezionamento sottovuoto in atmosfera
modificata.
*Il valore del rischio è calcolato moltiplicando la frequenza del rischio per la sua gravità. La
frequenza è rappresentata da una scala numerica da 1 (evento raro) a 5 (rischio molto frequente).
La gravità è anch’essa descritta da una scala numerica da 1 (il problema non compromette la
commercializzazione del prodotto e può essere facilmente risolto) a 10 (la presenza del problema
compromette la commercializzazione del prodotto che deve essere scartato). Questo sistema di
identificazione del rischio aiuta l’azienda a focalizzare l’attenzione sui rischi più significativi.
Infine, è stato effettuato il calcolo dei costi in modo semplificato per avere un’idea della fattibilità
della produzione di Ofu su scala industriale e soprattutto per ipotizzare un costo del prodotto
finito alla produzione e al consumo. I costi di produzione sono risultati maggiori rispetto a quelli
del tofu per il fatto che la quantità di prodotto da immettere sul mercato è limitata, la produzione
è più complicata (estrazione enzimatica) e i costi per il lancio di nuovi prodotti sono sempre alti
nel primo periodo in cui si cerca di acquisire quote di mercato. Il prezzo ipotizzato per l’Ofu alla
produzione è di 100SEK/kg (11€/kg) e al consumo è di circa 225SEK/kg (24€/kg), valore troppo
elevato rispetto al prezzo di tofu al consumo che è di circa 75SEK/kg ovvero 8€/kg. In un
secondo periodo, al diminuire dei costi di produzione, i guadagni per l’azienda potrebbero
diventare interessanti pur vendendo l’Ofu a prezzi competitivi rispetto al tofu, grazie al minor
costo della materia prima (l’avena costa circa la metà rispetto alla soia).
Riassunto
- 9 -
Tabella 5. Piano HACCP della produzione industriale di Ofu
Punti critici di controllo Potenziale
rischio
Limiti critici Monitoraggio
Procedure
Frequenza
Azioni correttive Valore
del
rischio*
Firma
dell’
opera
tore
1. Denaturazione
e coagulazione
Sopravvivenza
di patogeni,
contaminazione
fisico-chimica.
Temp= 120°C
Time=50min.
Controllo
automatico
tempo-
temperatura.
Continua Correzione
temperatura e stop
al riscaldamento
dopo 50min.
(1*10)
10
2. Raffreddament
o e aggiunta di
crusca
Contaminazione
fisico-chimica-
microbio logica
dalla crusca.
Crescita
microbica
durante il
raffreddamento.
Assenza di
patogeni e
altri microbi.
Rapido
raffreddamen
to a 5°C,
aggiunta di
crusca a 25-
35°C.
Analisi
chimico-
microbio logica
della crusca
Controllo
automatico
tempo-
temperatura
Mensile
Continua
Aggiungere solo
crusca
microbio logicame
nte pura.
Raffreddare a
T<5°C entro 5
min.
(4*5)
20
3. Confezionamen
to
Possibile
presenza di
sostanze
metalliche.
Patogeni
termodurici
possono essere
ancora presenti
nel prodotto.
Può verificarsi
contaminazione
chimica.
Confezioni
chiuse
scorrettamente
possono essere
contaminate e
veicolare
patogeni.
Assenza di
contaminanti
metallici e
chimici.
Assenza di
patogeni e
altri microbi.
Assenza di
confezioni
anomale.
Metal detector
Analisi
chimico-
microbio logica
del prodotto.
Controllo
automatico di
chiusura delle
confezioni.
Continua
Campiona
mento
casuale
mensile
Continua
Fermare il
processo se
vengono rilevate
sostanze estranee.
Informare i
responsabili e
conservare i
prodotti per
successive analisi
se si è rilevata
contaminazione
chimico-
microbio logica.
Fermare il
processo se
vengono rilevate
sostanze estranee.
(1*10)
10
Index
- 10 -
Index
Riassunto 1
1. Introduction 11
2. Review of the Project 12
3. Raw materials 15
3.1 Soy beans 15
3.2 Oat 15
3.3 Chemical composition 16
4. Proteins 18
4.1 Background 18
4.2 Isoelectric point and pH 19
4.3 Solubility of proteins 19
4.4 Denaturation of proteins 21
4.5 Coagulation of proteins 21
4.6 Oat protein properties 21
5. Gel formation 24
5.1 Protein gels 24
5.1.1 Heat induced 24
5.1.2 Ionic induced (salts) 24
5.1.3 Acid induced 26
5.2 Gums and Hydrocolloids 26
5.3 β-glucan gels and health effects 27
5.4 Starch gel formation 28
6. Concentration and separation techniques 30
6.1 Evaporation 30
6.2 Centrifugation 30
6.3 Membrane Filtration 30
6.4 Ultra-Filtration 30
6.4.1 Lab Experiment 31
7. Unit Operations 34
7.1 Extraction of oat protein 34
Index
- 11 -
7.1.1 Material & Method 35
7.1.2 Performed tests 35
7.1.3 Results & Discussion 39
7.2 Denaturation, Coagulation and Pressing 39
7.2.1 Material & Method 39
7.2.2 Performed tests 40
7.2.3 Results & Discussion 49
8. Kjeldahl method 50
9. Ofu process line 52
10. Industrial process line 54
11. HACCP 55
12. Sensorial & Rheological Analysis 58
13. Marketing and Product Formulation 64
14. Cost calculations 69
15. Conclusions 75
Acknowledgements 76
Appendix 77
References 96
Introduction
- 12 -
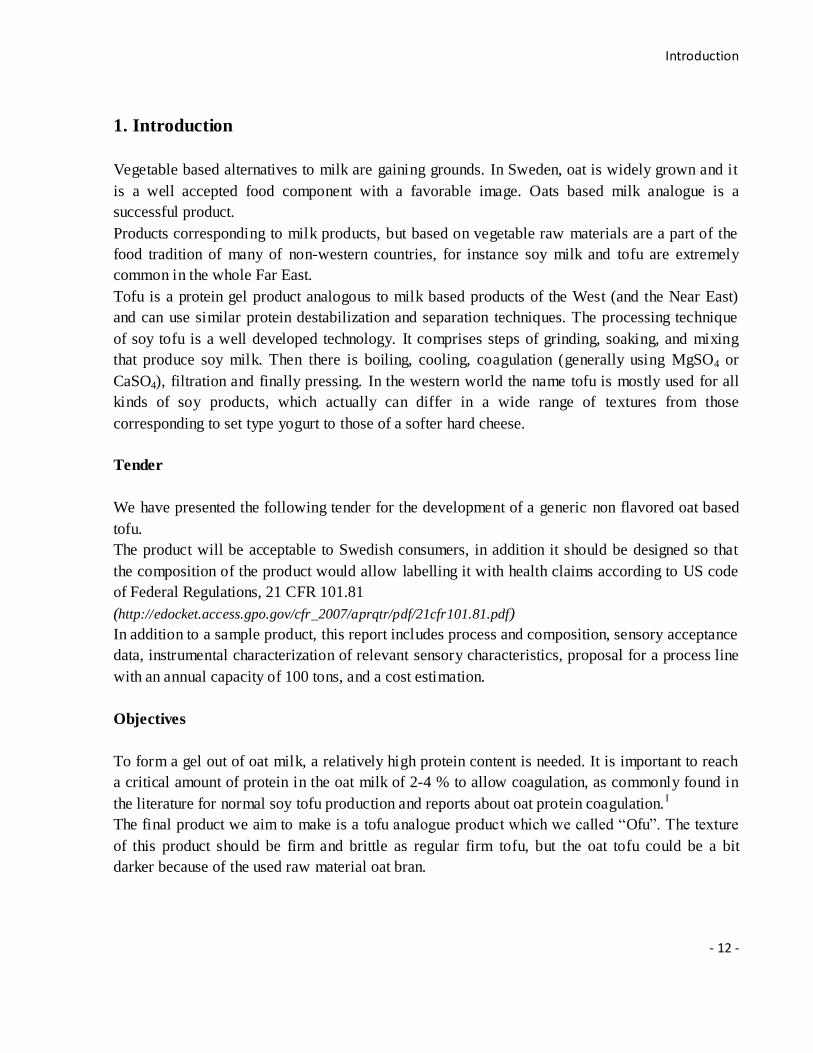
1. Introduction
Vegetable based alternatives to milk are gaining grounds. In Sweden, oat is widely grown and it
is a well accepted food component with a favorable image. Oats based milk analogue is a
successful product.
Products corresponding to milk products, but based on vegetable raw materials are a part of the
food tradition of many of non-western countries, for instance soy milk and tofu are extremely
common in the whole Far East.
Tofu is a protein gel product analogous to milk based products of the West (and the Near East)
and can use similar protein destabilization and separation techniques. The processing technique
of soy tofu is a well developed technology. It comprises steps of grinding, soaking, and mixing
that produce soy milk. Then there is boiling, cooling, coagulation (generally using MgSO4 or
CaSO4), filtration and finally pressing. In the western world the name tofu is mostly used for all
kinds of soy products, which actually can differ in a wide range of textures from those
corresponding to set type yogurt to those of a softer hard cheese.
Tender
We have presented the following tender for the development of a generic non flavored oat based
tofu.
The product will be acceptable to Swedish consumers, in addition it should be designed so that
the composition of the product would allow labelling it with health claims according to US code
of Federal Regulations, 21 CFR 101.81
(http://edocket.access.gpo.gov/cfr_2007/aprqtr/pdf/21cfr101.81.pdf)
In addition to a sample product, this report includes process and composition, sensory acceptance
data, instrumental characterization of relevant sensory characteristics, proposal for a process line
with an annual capacity of 100 tons, and a cost estimation.
Objectives
To form a gel out of oat milk, a relatively high protein content is needed. It is important to reach
a critical amount of protein in the oat milk of 2-4 % to allow coagulation, as commonly found in
the literature for normal soy tofu production and reports about oat protein coagulation. I
The final product we aim to make is a tofu analogue product which we called “Ofu”. The texture
of this product should be firm and brittle as regular firm tofu, but the oat tofu could be a bit
darker because of the used raw material oat bran.
Review of the Project
- 13 -
2. Review of the Project
On the 14th of January 2008 the group consisting of 11 students and 3 teachers got together for
the first time within the course. During this day the task was handed out and the project started
with selecting a project leader during the first meeting. Because of the fact that the entire group
was until this date unfamiliar with regular soy tofu from the taste to the way of processing it, we
decided to buy a package of regular soy tofu, which is commonly known by the single name tofu,
to test the taste. The first tasks consisted in doing research on finding out all about processing the
normal tofu, but also how it is consumed.
During the first weeks the focus was on studying the basic knowledge needed in order to work all
together in a faster way. At the same time we visited some food factories such as Oatly AB (oat
milk producer), Norfoods AB (food additives consultancy) and AarhusKarlshamn AB (fatty acids
producer) in order to help open minds and thinking outside the square. The companies also
offered to support the project with raw material and other ingredients.
We started with comparing the ingredients soybeans with oat grain, looking at the texture of
regular tofu and trying to match it together into a similar process with the raw material oat. The
main problem was soon defined as: “How can we make a protein gel out of oat?”
As already done in the first weeks, human resources were divided by arranging subgroups which
focused their attention on one single subject, in order to work in a more efficient way.
The group managed to have an accurate knowledge about very particular subject such as starch
gel formation, protein coagulation and denaturation, using a majority of references concerning
soy amino acids, because it has been found out that the soy chemical composition is quite similar
to oat. Every week each sub-group uploaded on the apposite webpage their studies in order to
allow the entire group to achieve knowledge about it. It was a tough start before the group
harmonized with this facility in the best way, but after a while it was a very useful platform;
everybody using his own blog and chatting almost every day for discussions and solving
problems.
In the very beginning of the project we thought to process the product, by trying to use all the
three main components contained in oat that were suspected to be able to create a gel: sta rch, β-
glucans and proteins. The group gave up forming a gel with starch because its textural properties
are much more different from the ones of a protein based gel and referenced to the task of making
a starch gel is the gelification temperature wich rounds about 50 and 60°C much lower than the
temperature needed for the protein gel denaturation and coagulation. Another idea for making a
gel structure was to coagulate the β-glucans. Several ways to coagulate it were found: it starts to
make a gel (like a porridge) storing in a water solution, but the maximum gelation rate was
observed at 45 °C; the coagulation also happens after several cycles of freezing and thawing.
Because of this difficult coagulation of fibers and because it was impossible to extract them
without losing or denaturizing the proteins (because of the ethanol used to inhibit the β-
Review of the Project
- 14 -
glucanase, intrinsic enzyme of the grain), the group decided to give up the β-glucan coagulation. II
Since we thought that the oat tofu process should not greatly differ from those of soy tofu, one
subgroup focused on the production of soy tofu also in an experimental kitchen to achieve more
information about the critical points and hazards of this process. The group also tried making oat
tofu starting both, once from oat milk from Oatly factory and once from oat flakes, but without
reaching the formation of a curd (we used the references of soy proteins such as denaturation
temperature and time). By analyzing this failing of gelification with oat flakes we recognized that
there must be something wrong with the proteins, so a literature study on oat proteins was done
once again. The amount of protein was mainly found as critical point. Focusing on the raw
material properties, the extraction method and the loss of protein during processing we decided to
use oat bran as raw material which consists in a higher amount of protein than in the grinding
body (some less than 20 %). One subgroup focused its attention on the extraction method and so
the soaking procedure was exchanged within a chemical-enzymatic extraction. More peculiar
information about the properties of oat proteins such as the denaturation temperature and the pI
(isoelectric point) were found. With all this information gathered the project group was
reorganized and divided into several subgroups in order to write the laboratory manuals of each
operations of the whole Ofu process (extraction; separation; denaturation-coagulation &
pressing.)
The literature work had almost finished in the first term before the break so that all the needed
raw material could be ordered in the break so as to start directly at the beginning of the second
term with the tests. Some complications appeared within the ordering and delivering of the raw
material, resulting in late delivery.
The oat bran sponsored by Nord Mills had only 18.8% protein; less concentrated than the
minimum expected 20%. Because of this the process had to be adapted to increase the protein
content again.
The first week after the break was used to get the process back in perspective, solve the last small
questions and looking for the required equipment available at the university. During planning, the
experiments and last important settings were checked again, so as to avoid the permanence of
problems which could be hard to solve in the later scheduling of the project. The enzymes needed
for the extraction step did not arrived until the fourth week of the second term.
In the second term, the first experiments performed were testing the ultra-filtration with Oatly oat
milk, which consumed a lot of time and the yield was not as good as expected. After around three
weeks of work without any usable result for the later denaturation and coagulation, the time was
running out, so the group decided to change ultra-filtration process into the faster and easier
evaporation process. This was already improved during the same three weeks by using Oatly oat
milk for denaturation and coagulation tests. In the week, after this decision, the enzymes needed
for the extraction finally arrived. The first tests went well and the protein yield was so high, that a
concentration step was no longer needed, that saved much more time, which was rare. With the
first oat milk, produced by the group, trials were also performed with alginate, a hydrocolloid,

Review of the Project
- 15 -
supplied by ISP Company, in order to form a better gel and increase the yield of product. Since
the extraction process was acceptable we decided to make big amount of oat milk in order to use
it for several denaturation and coagulation experiments with different working conditions (mostly
varying pH, temperature and time). At the very end of our project we succeeded in obtaining a
gel by using certain conditions explained in the following chapters.
Raw materials
- 16 -
3. Raw materials
3.1 Soybean
The amino acid composition of soybean is similar to animal sources and because of this,
soybeans can be a good protein source for vegetarians. The relatively low cost of soybean protein
compared with-animal proteins makes its use as a protein source in developing countries
particularly relevant. III
Approximately 90% of the proteins in soybeans exist as storage proteins, which mostly consist of
β-conglycinin and glycinin. They are mainly responsible for the physicochemical functional
properties of tofu gel. Whereby the β-conglycinin forms a transparent, soft, but rather elastic gel
and glycinin forms a turbid, hard, and elastic gel in 100°C heating. IV
3.2 Oat
Whole oats (retaining the hull) are generally used for animal feed. Although oats are dehulled
before human consumption, the bran remains on the grain and they retain the sources of their
nutrients and fiber. After dehulling they are processed into many forms such as rolled oats, oat
bran and oat flour.
Oats have a low level of gluten, which is found out to be tolerable in a diet for people with celiac
disease, which is an intolerance to gluten. However, oats contain gluten and wheat-sensitive
individuals are recommended to avoid them in their diet. In comparison to other grains oat has
slightly higher lipid content so that it will turn rancid more quickly. The fatty acid composition is
rich in oleic and linolenic acids and the major saturated fatty acid is palmitic acid. Oat has the
highest amount of protein compared with other cereals, with a level between 12 to 24%, which is
nearly equivalent in quality to soy protein, which has been shown by the World Health
Organization to be equal to meat, milk, and egg protein and so it represents a great source
especially for vegetarians.V The major storage protein is a globulin or legume-like protein,
avenalin, within an amount of 80% of the total protein content. This is unique in comparison to
other cereals. Globulins are characterized by water solubility; because of this property, oats may
be turned into milk but not into bread. The more typical cereal proteins are prolamines such as
gluten and zein. The group of prolamines (avenin in oat) is the minor protein group of oat. VI, VII
Varieties
Oats are part of the grasses family, the Gramineae. Varieties of common white oats, Avena
sativa, are the most widely grown and are sown in the spring and harvested in the summer. In
warmer climates where winters are mild, varieties of red oats, Avena byzantina, are sown in the
autumn and harvested in the following summer. There are a lot of different varieties of common
white and red oats available such as: Clinton, Cherokee, Bonda, Andrew, Clintford, Otee, Noble,
Stout, Dal, Orbit, Garland, Astro, or Pennfield just to name a few of them.
Raw materials
- 17 -
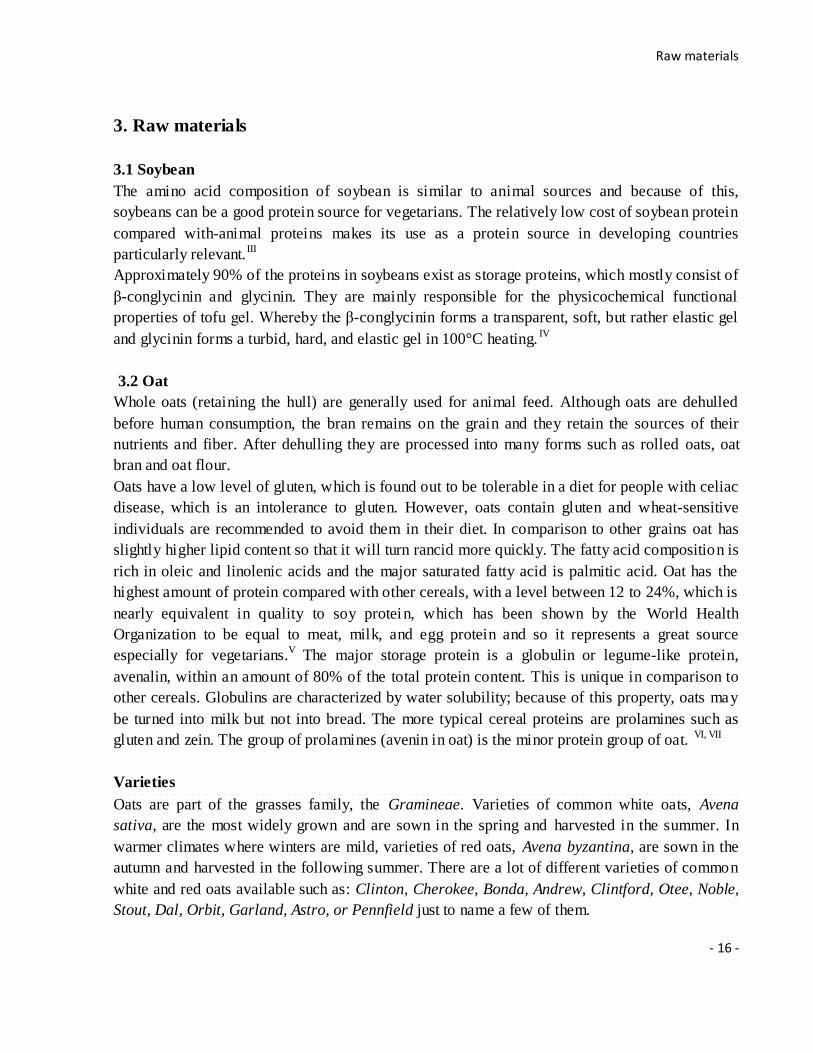
Oat is rich in dietary fibers, building up cell wall structures, which are a source of non-starch
polysaccharides (NSP). The highest concentrations are found in the outer bran layers of the grain
and falls very rapidly when the extraction rate falls below 85%. A significant amount of the
composition of NSP in oat is build up by β-glucans located in thickened layers below the
aleuronic layer. The NSP are known having some cholesterol-lowering properties.VIII
Table 2: Composition of non-starch polysaccharides (NSP) in oat VIII
Total NSP
[g/100 g dry matter]
Non-cellulosic
polysaccharides
[% of total NSP]
Cellulose
[% of total NSP]
Soluble Insoluble
7,22 55 41 4
During thermal processing there is a loss of the more labile vitamins: the B vitamin group losses
are around 40% and for folates around 50%. VIII
Oat is also rich in phytochemicals, which protect against chronic diseases such as heart disease
and cancer. This and other antioxidants such as vitamin E or β-carotene are also non-heat
resistant substances and are inactivated or destroyed during heat processing. IX
3.3 Chemical compositon
The following tables show the chemical composition in soy beans and oat grain.
Table 3 Chemical composition of soy beans and oat grains (for 100g of product) X
Soybean Oat grain (Avena sativa)
Protein 34 g Protein 16.89 g
Starch 19 g Carbohydrates 66.7 g
Fiber 15 g Dietary fiber 10.6 g
Fat 18 g Fat 6.9 g
Polyunsaturated 10 g β-Glucan
Soluble
4 g
Calcium 225 mg Iron 4.72 mg
Iron 8.5 mg Magnesium 177 mg
Calcium 54 mg
Energy 1850 kJ (442 kcal) Energy 1670 kJ (399 kcal)
The composition of the oat bran used in the project was provided by Lantmännen Food R&D. It
has a higher protein content than the full oat grain, as expected.
Raw materials
- 18 -
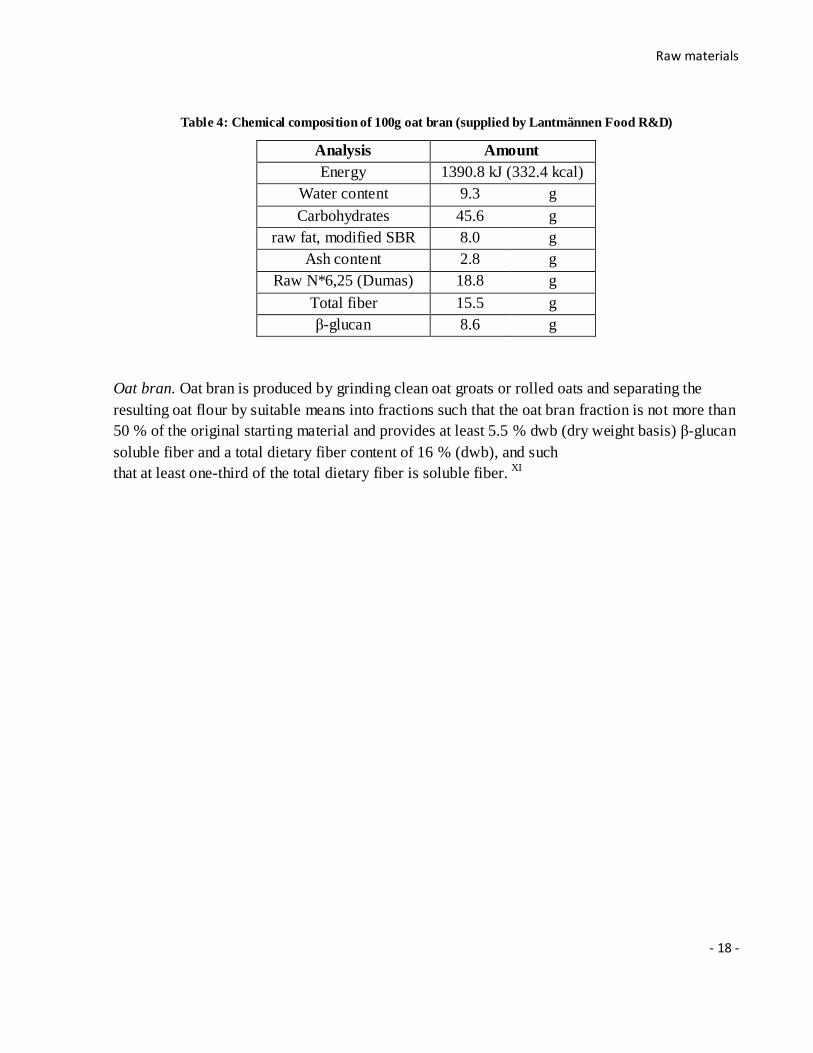
Table 4: Chemical composition of 100g oat bran (supplied by Lantmännen Food R&D)
Analysis Amount
Energy 1390.8 kJ (332.4 kcal)
Water content 9.3 g
Carbohydrates 45.6 g
raw fat, modified SBR 8.0 g
Ash content 2.8 g
Raw N*6,25 (Dumas) 18.8 g
Total fiber 15.5 g
β-glucan 8.6 g
Oat bran. Oat bran is produced by grinding clean oat groats or rolled oats and separating the
resulting oat flour by suitable means into fractions such that the oat bran fraction is not more than
50 % of the original starting material and provides at least 5.5 % dwb (dry weight basis) β-glucan
soluble fiber and a total dietary fiber content of 16 % (dwb), and such
that at least one-third of the total dietary fiber is soluble fiber. XI
Proteins
- 19 -
4. Proteins
4.1 Background
Proteins are polymers of amino acids joined together by peptide bonds.
Amino acids
There are 20 amino acids which make up almost all proteins on earth. All amino acids have a
basic structure consisting of a central carbon (alpha carbon) bonded to a hydrogen, a carboxyl
group, an amino group and for each amino acid a unique chain or R-group. The characteristic that
distinguishes one amino acid from another is given by its unique side chain and it is responsible
for the chemical properties of the amino acid.
There is an asymmetry about the alpha carbon in amino acids except for glycine, which has a
hydrogen as its R-group. Hence there exist for each amino acid two mirror-image forms, the D
and L stereoisomers. With rare exceptions, all of the amino acids in proteins are L amino acids.
In a protein all amino acids interact with each other dependent on the chemical properties given
by the side chain. The amino acids can be classified due to their side chain character istics as
being hydrophobic versus hydrophilic, and uncharged versus positively-charged versus
negatively-charged.
Peptide bond
By joining amino acids together to a chain a water-molecule is given away during the formation
of the peptide bond. These peptide bonds have amide structure, within the electrons of the
carbonyl group are delocalized which gives the C-N bond considerable double bond character
and no free rotation around the C-N bond is possible.
If the chain length is longer than 30 amino acids it is called protein or polypeptide otherwise it is
called peptide. XII, XIII
Proteins can be divided into two main groups: proteins consisting just out of amino acids (e.g.
albumin, globulin, prolamine, glutelin, collagen, myosin, creatine) and those which consist also
of other molecules (e.g. glycoprotein, lipoprotein, phosphor protein, chromo-protein,
nucleoprotein). XIV
Folding of polypeptide chain
Proteins can consist out of different structural parts like loops, helixes and β-sheets. This can
interact within the protein chain itself or with other proteins.
Proteins have often a relatively rigid compact (globular) structure in aqueous solution due to
well-defined folding of the polypeptide chain. Globular proteins are generally present in the form
of monomers or small oligomers and are stabilised by electrostatic repulsion. In addition, proteins
Proteins
- 20 -
may feel a short range attractive interaction, the origin of which is not fully understood. Van der
Waals, opposite charge, hydrophobic and hydrogen interaction may all be involved.
4.2 Isoelectric point and pH
The amino acids are amphoteric molecules, which mean that they are solved in a solution,
depending on the H+ concentration, as cations, zwitterions or anions.
Each amino acid or protein has an isoelectric point (pI) where the molecule is in the zwitterion
formation. Due to a preponderance of weakly acid residues in almost all proteins, they are nearly
all negatively charged at neutral pH.
At the pI, the total charge (the sum of all positive and negative charges) reaches a maximum and
the net charge (the charge of a protein depending on the pH of the solution) is zero. Because of
having a net charge of null, the isoelectric point is the pH of a buffer, at which the proteins do not
migrate in an electric field (e.g. gel electrophoreses).
The solubility, viscosity and swelling ability at the pI is minimal, but the precipitation and the
crystallization are maximal.
Proteins can keep in contact with protons but also with other ions which leads to the distinction
between the isoelectric point and the isoionic point. The isoionic point is defined as the pH at
which the basic groups take up as many protons as the acid groups have given away. This is the
pH at which a zwitterion has an equal number of positive and negative charges (in the absence of
other solutes it is in water equal to the isoelectric point). The isoionic point can differ quite a bit
from the pI, depending on the salt concentration.
The stability of proteins depends on the pH, if peptides are mixed with acids or alkalis they can
be cleaved into amino acids. XV, XVI,
4.3 Solubility of proteins
The solubility of proteins depends on the amount of non-polar (hydrophobic) and polar
(hydrophilic) groups in the protein. Thereby the hydrophilic groups play a bigger role leading to
the fact that proteins are just soluble in polar solutions like water.
The most common cereal protein groups are albumins, which are soluble in salt free and neutral
water and harder to salt-out than globulins and prolamines, their molecular weight is often
smaller than those of globulins. Globulins are soluble in salt neutral solutions (e.g. 10%-NaCl
solution) and also in diluted acids and alkali soluble. Prolamines are soluble in 50-90% ethanol
and other diluted alcohols, but they are insoluble in 100% ethanol and water. Glutelins are
insoluble in water, salt neutral solutions and alcohols, but soluble as a salt. The salts of Prolamine
and Gluteline are highly soluble in water.
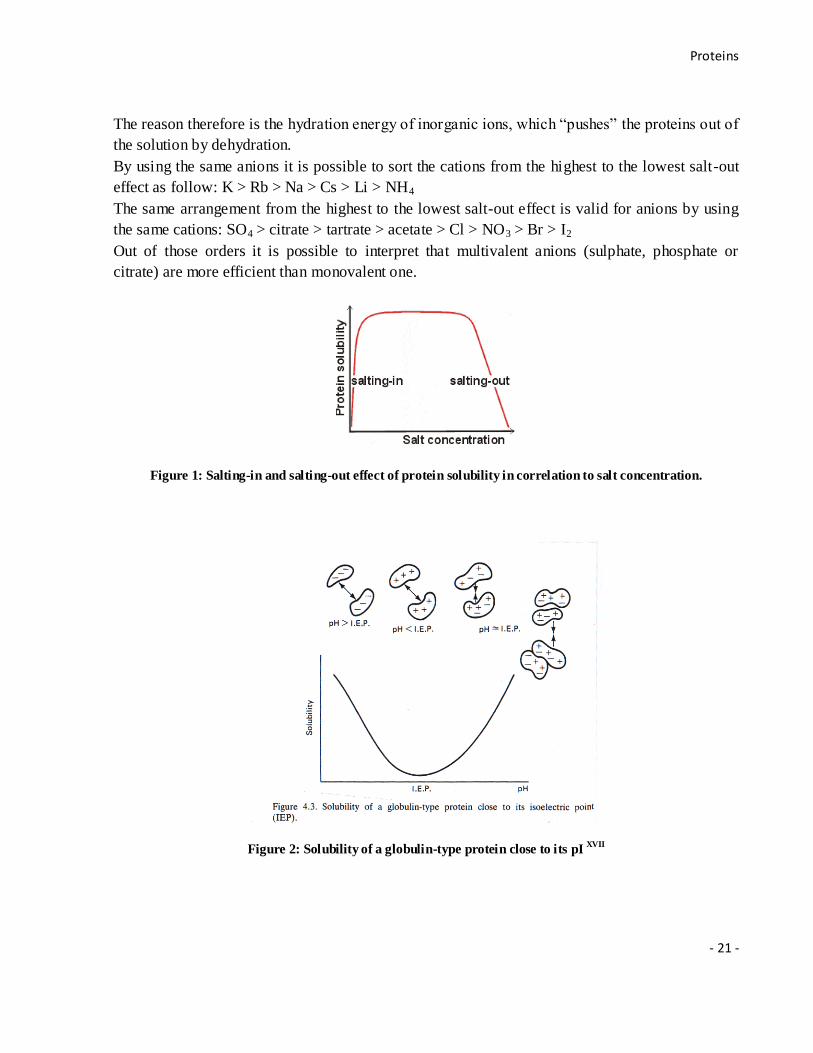
Neutral salts have a doubled influence on the solubility of proteins; on the one hand they increase
in small amounts the solubility of proteins (salt-in effect) and on the other hand they decrease the
solubility by using high amounts of neutral salts, which leads to accumulation (salt-out effect).
Proteins
- 21 -
The reason therefore is the hydration energy of inorganic ions, which “pushes” the proteins out of
the solution by dehydration.
By using the same anions it is possible to sort the cations from the highest to the lowest salt-out
effect as follow: K > Rb > Na > Cs > Li > NH4
The same arrangement from the highest to the lowest salt-out effect is valid for anions by using
the same cations: SO4 > citrate > tartrate > acetate > Cl > NO3 > Br > I2
Out of those orders it is possible to interpret that multivalent anions (sulphate, phosphate or
citrate) are more efficient than monovalent one.
Figure 1: Salting-in and salting-out effect of protein solubility in correlation to salt concentration.
Figure 2: Solubility of a globulin-type protein close to its pI
XVII
Proteins
- 22 -
4.4 Denaturation of proteins
Before proteins coagulate they have to pass through the step of denaturation, however it is
possible to perform just a denaturation without coagulating. Extremes of pH and temperature
disrupt forces that maintain folding/unfolding or uncoiling into a random shape. XVIII
During heat induced denaturation, which is the most common, a number of bonds in the protein
molecule are weakened. The proteins get a more flexible structure and the groups are exposed to
solvent. If heating is stopped at this stage the protein should be able to readily refold to the native
structure. As heating continues, some of the cooperative hydrogen bonds that stabilize helical
structure will begin to break. As these bonds are broken, water can interact with amide nitrogen
and carbonyl oxygen peptide bonds and form new hydrogen “bridges”. The presence of water
further weakens nearby hydrogen bonds by causing an increase in the effective dielectric constant
near them. As the helical structure is broken, hydrophobic groups are exposed to the solvent.
These changes into a more unorganized state will lead to changes of physical properties and the
chemical reactivity such as viscosity. Moreover it leads to loss of bioactivity and to a higher
digestibility of the proteins.XIX
Used methods for denaturizing proteins are UV-rays, ionic-rays (α-, β-, γ –rays), ultrasonic wave
treatment, organic solutions (alcohol, acetone), enzymes, precipitants and by increasing the
surface of the proteins in foams. Possible undesired changes of the denaturation of proteins are
decrease and loss of essential amino acids, the possibility to bind toxic products due to chemical
reactions, change of color, taste and smell. One of the biggest problems resulting during
denaturation such as during heat treatment of proteins is that free amino acids can react with
reducing sugars leading to the formation of toxic molecules (e.g. Maillard-reaction). XIII, XIV
4.5 Coagulation of proteins
The reduction of the electrical repulsion between the proteins is important to bring the protein
molecules closer together so that they can precipitate. Therefore the temperature, pH or salt
concentration may be modified. The most proteins coagulate during a heat treatment at 60°C next
to their isoelectric point where the protein charge density is reduced. If the repulsion is decreased
dominant short range attraction between the proteins can cause phase separation into a low
density phase and a high density liquid or crystalline phase. XIV, XX
4.6 Oat protein properties
The differences between soy and oat proteins are not only about the quantity, it is also about the
composition. The quantity of amino acid in oat is lower than in legume except for the
Phenylalanine, which is higher in oat, but the protein quality is higher (see appendix Errore.
L'origine riferimento non è stata trovata.).
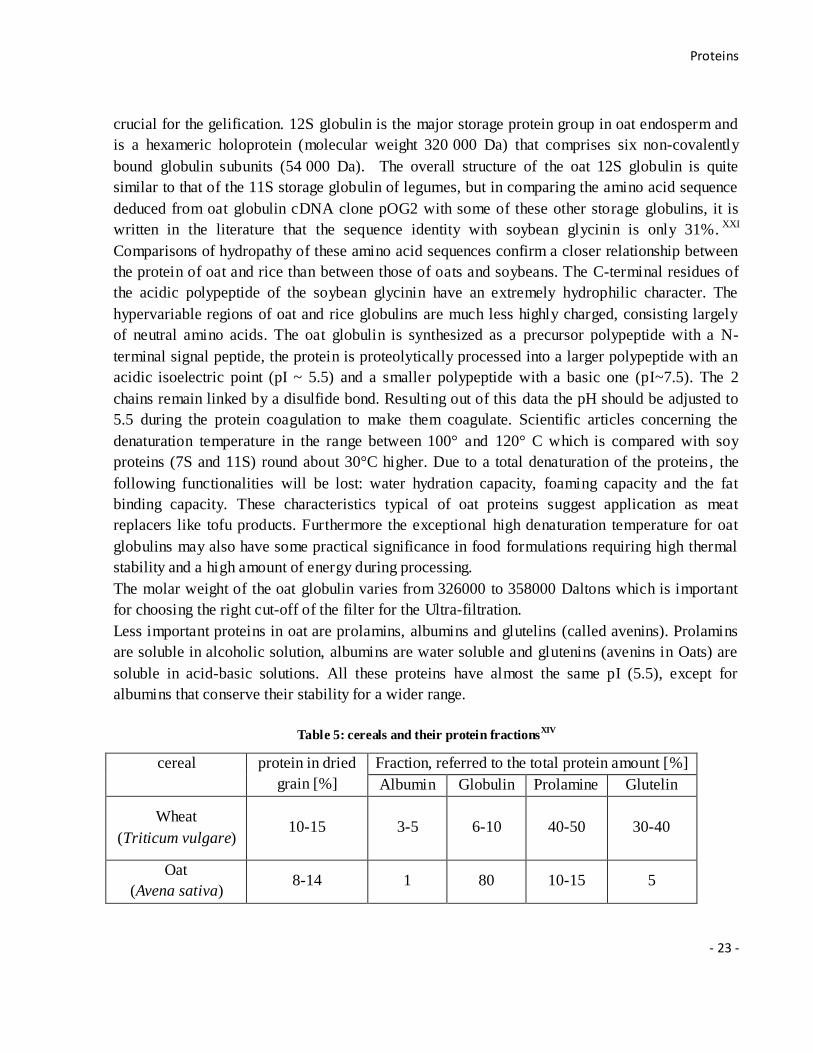
The representative proteins in oats are out of the protein group of the globulins: β-conglycinin
and β-glycinin, these proteins are more soluble in saline solution. In this protein groups the 7S
and 12S proteins (grouped by their sedimentation coefficients) are the principal constituents and
Proteins
- 23 -
crucial for the gelification. 12S globulin is the major storage protein group in oat endosperm and
is a hexameric holoprotein (molecular weight 320 000 Da) that comprises six non-covalently
bound globulin subunits (54 000 Da). The overall structure of the oat 12S globulin is quite
similar to that of the 11S storage globulin of legumes, but in comparing the amino acid sequence
deduced from oat globulin cDNA clone pOG2 with some of these other storage globulins, it is
written in the literature that the sequence identity with soybean glycinin is only 31%. XXI
Comparisons of hydropathy of these amino acid sequences confirm a closer relationship between
the protein of oat and rice than between those of oats and soybeans. The C-terminal residues of
the acidic polypeptide of the soybean glycinin have an extremely hydrophilic character. The
hypervariable regions of oat and rice globulins are much less highly charged, consisting largely
of neutral amino acids. The oat globulin is synthesized as a precursor polypeptide with a N-
terminal signal peptide, the protein is proteolytically processed into a larger polypeptide with an
acidic isoelectric point (pI ~ 5.5) and a smaller polypeptide with a basic one (pI~7.5). The 2
chains remain linked by a disulfide bond. Resulting out of this data the pH should be adjusted to
5.5 during the protein coagulation to make them coagulate. Scientific articles concerning the
denaturation temperature in the range between 100° and 120° C which is compared with soy
proteins (7S and 11S) round about 30°C higher. Due to a total denaturation of the proteins, the
following functionalities will be lost: water hydration capacity, foaming capacity and the fat
binding capacity. These characteristics typical of oat proteins suggest application as meat
replacers like tofu products. Furthermore the exceptional high denaturation temperature for oat
globulins may also have some practical significance in food formulations requiring high thermal
stability and a high amount of energy during processing.
The molar weight of the oat globulin varies from 326000 to 358000 Daltons which is important
for choosing the right cut-off of the filter for the Ultra-filtration.
Less important proteins in oat are prolamins, albumins and glutelins (called avenins). Prolamins
are soluble in alcoholic solution, albumins are water soluble and glutenins (avenins in Oats) are
soluble in acid-basic solutions. All these proteins have almost the same pI (5.5), except for
albumins that conserve their stability for a wider range.
Table 5: cereals and their protein fractionsXIV
cereal protein in dried
grain [%]
Fraction, referred to the total protein amount [%]
Albumin Globulin Prolamine Glutelin
Wheat
(Triticum vulgare) 10-15 3-5 6-10 40-50 30-40
Oat
(Avena sativa) 8-14 1 80 10-15 5
Proteins
- 24 -
Figure 3: Solubility of oat protein at different pH
XXII
7S, 11S, 12S = S stands for Svedberg which is a non-SI physical unit used to characterize the
behavior of a particle type in ultracentrifugation. Bigger particles have higher Svedberg values. It
is a unit of time amounting to 10-13 s or 100 fs. It is named after the Swedish chemist Theodor
Svedberg (1884-1971), winner of the Nobel Prize in chemistry in 1926 for his work in the
chemistry of colloids and his invention of the ultracentrifuge. XXIII
Gel Formation
- 25 -
5. Gel Formation
5.1 Protein gel formation
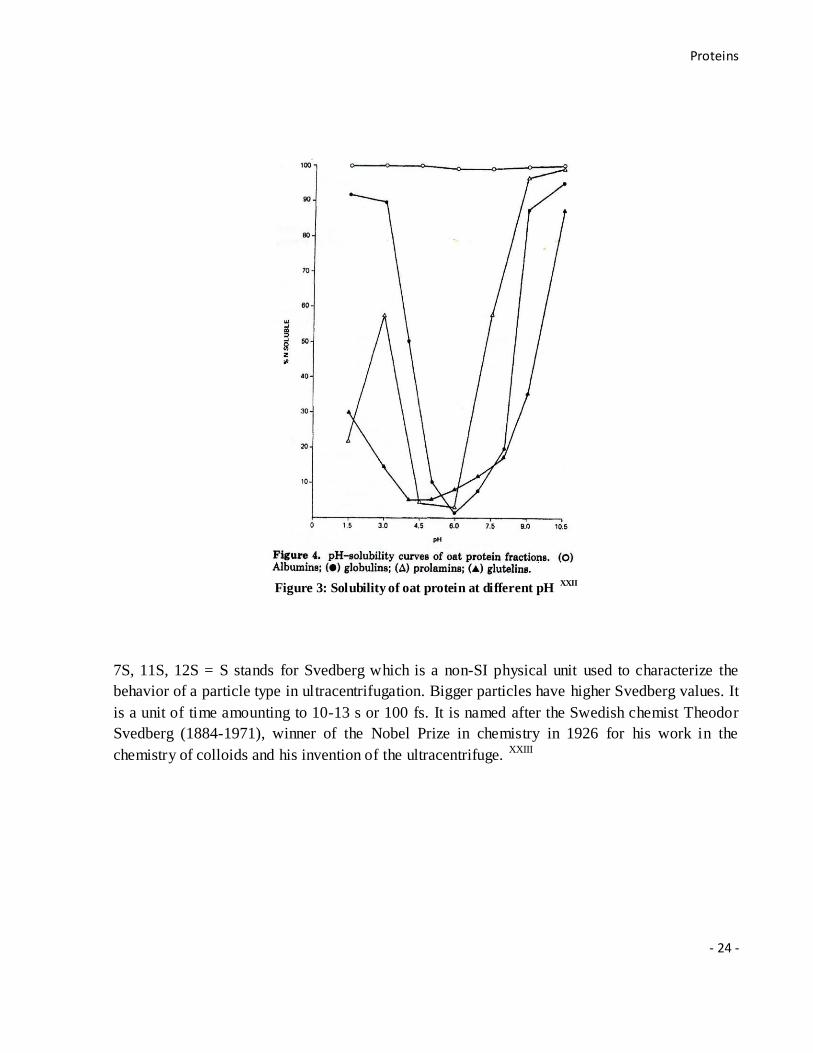
If the protein concentration is sufficiently high, the aggregation of denatured globular proteins
leads to gel formation. Unfolding of the globular proteins can lead to the formation of strong
bonds between proteins. These bonds are not necessarily covalent although disulfide bonds are
often involved, but they are sufficiently strong so that they can be considered as irreversible.
However, if the interaction between the protein clusters is reduced by addition of salt or a change
of the pH, they will continue to aggregate and may even gel. This process happens even at room
temperature and is often called cold-gelation to distinguish it from the heat-induced aggregation
of proteins. XX
r
5.1.1 Heat induced
Heat-induced gelation is done in a two-step process. Firstly, an unfolding or dissociation of the
protein molecule due to the energy input takes place which may expose reactive sites of the
molecule for further reaction. The second step is the association and aggregation of unfolded
molecules which leads to the formation of higher molecular weight complexes. Gelation follows
if the protein concentration is above a critical value, if at least part of the protein has been heat
denatured and if environmental conditions are adequate.XXIV
5.1.2 Ionic induced (salts)
By increasing the salt concentration in a protein solution the ionic strength is enhanced (e.g. by
adding NaCl or CaCl) which can block and decrease electrostatic charges on the surface of
molecules or aggregates. As a result, the electrostatic repulsive forces between the molecules are
Figure 4: Structural elements formed during gelation of different proteins XX
scale only as reference)
Gel Formation
- 26 -
reduced or neutralized and gelation can occur. In addition, divalent cations like calcium can
promote aggregation of proteins by formation of intermolecular calcium bridges provided that the
pH is above the pI.
Before processing ionic induced coagulation, a denaturation which causes unfolding of the
globular proteins in solution at a low ionic strength is performed by heat, pressure or enzymatic
treatment leading to formation of aggregates. In the second step gels are formed by adding a salt
or lowering the pH, to favor the interaction between aggregates.XXIV
Before adding the salts-acids, the fats are bound to the proteins. After adding the coagulant, the
proteins are denaturized, thus releasing the fat. As they are hydrophobic, the fat plus the insoluble
proteins will form the curd, the rest forming the whey.
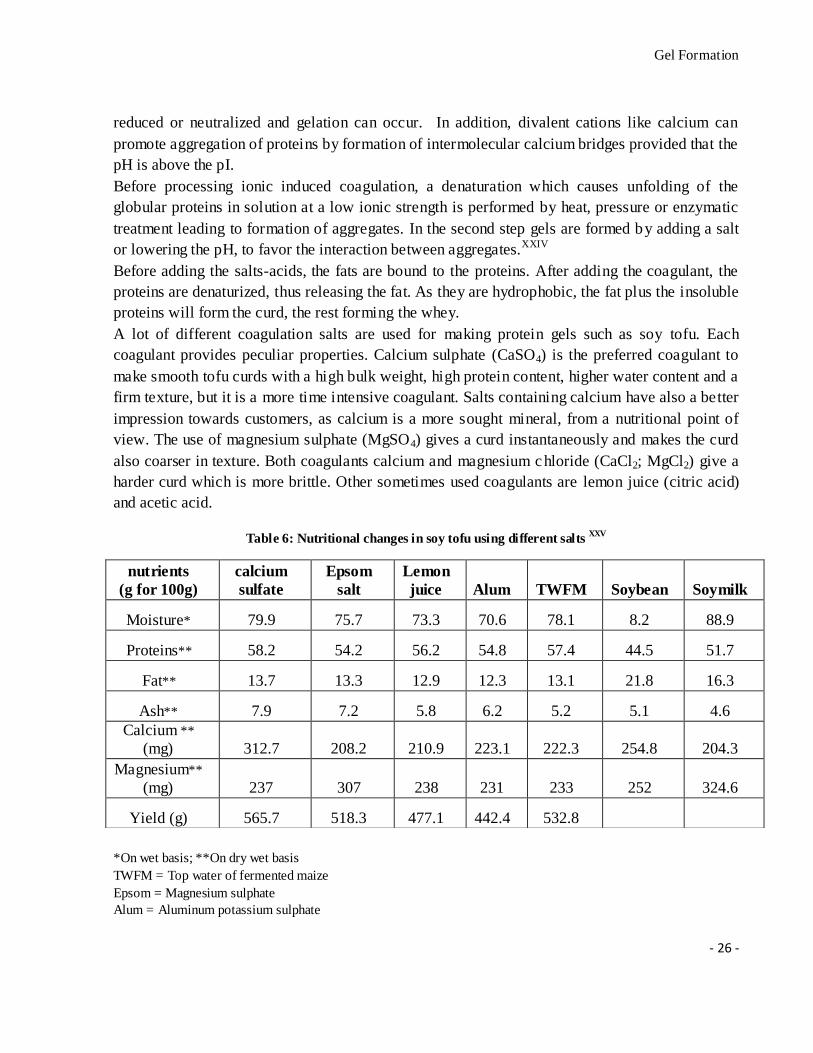
A lot of different coagulation salts are used for making protein gels such as soy tofu. Each
coagulant provides peculiar properties. Calcium sulphate (CaSO4) is the preferred coagulant to
make smooth tofu curds with a high bulk weight, high protein content, higher water content and a
firm texture, but it is a more time intensive coagulant. Salts containing calcium have also a better
impression towards customers, as calcium is a more sought mineral, from a nutritional point of
view. The use of magnesium sulphate (MgSO4) gives a curd instantaneously and makes the curd
also coarser in texture. Both coagulants calcium and magnesium chloride (CaCl2; MgCl2) give a
harder curd which is more brittle. Other sometimes used coagulants are lemon juice (citric acid)
and acetic acid.
Table 6: Nutritional changes in soy tofu using different salts XXV
*On wet basis; **On dry wet basis
TWFM = Top water of fermented maize
Epsom = Magnesium sulphate
Alum = Aluminum potassium sulphate
nutrients
(g for 100g)
calcium
sulfate
Epsom
salt
Lemon
juice Alum TWFM Soybean Soymilk
Moisture* 79.9 75.7 73.3 70.6 78.1 8.2 88.9
Proteins** 58.2 54.2 56.2 54.8 57.4 44.5 51.7
Fat** 13.7 13.3 12.9 12.3 13.1 21.8 16.3
Ash** 7.9 7.2 5.8 6.2 5.2 5.1 4.6
Calcium **
(mg) 312.7 208.2 210.9 223.1 222.3 254.8 204.3
Magnesium**
(mg) 237 307 238 231 233 252 324.6
Yield (g) 565.7 518.3 477.1 442.4 532.8
Gel Formation
- 27 -
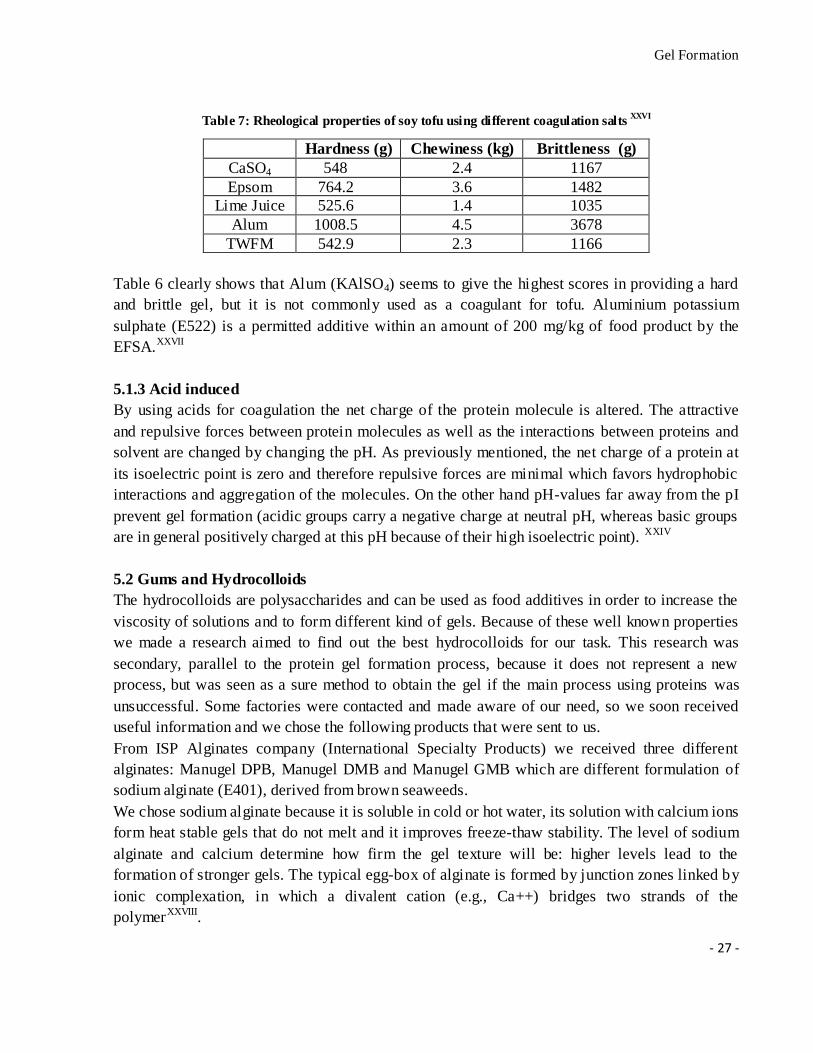
Table 7: Rheological properties of soy tofu using different coagulation salts XXVI
Hardness (g) Chewiness (kg) Brittleness (g)
CaSO4 548 2.4 1167
Epsom 764.2 3.6 1482
Lime Juice 525.6 1.4 1035
Alum 1008.5 4.5 3678
TWFM 542.9 2.3 1166
Table 6 clearly shows that Alum (KAlSO4) seems to give the highest scores in providing a hard
and brittle gel, but it is not commonly used as a coagulant for tofu. Aluminium potassium
sulphate (E522) is a permitted additive within an amount of 200 mg/kg of food product by the
EFSA.XXVII
5.1.3 Acid induced
By using acids for coagulation the net charge of the protein molecule is altered. The attractive
and repulsive forces between protein molecules as well as the interactions between proteins and
solvent are changed by changing the pH. As previously mentioned, the net charge of a protein at
its isoelectric point is zero and therefore repulsive forces are minimal which favors hydrophobic
interactions and aggregation of the molecules. On the other hand pH-values far away from the pI
prevent gel formation (acidic groups carry a negative charge at neutral pH, whereas basic groups
are in general positively charged at this pH because of their high isoelectric point). XXIV
5.2 Gums and Hydrocolloids
The hydrocolloids are polysaccharides and can be used as food additives in order to increase the
viscosity of solutions and to form different kind of gels. Because of these well known properties
we made a research aimed to find out the best hydrocolloids for our task. This research was
secondary, parallel to the protein gel formation process, because it does not represent a new
process, but was seen as a sure method to obtain the gel if the main process using proteins was
unsuccessful. Some factories were contacted and made aware of our need, so we soon received
useful information and we chose the following products that were sent to us.
From ISP Alginates company (International Specialty Products) we received three different
alginates: Manugel DPB, Manugel DMB and Manugel GMB which are different formulation of
sodium alginate (E401), derived from brown seaweeds.
We chose sodium alginate because it is soluble in cold or hot water, its solution with calcium ions
form heat stable gels that do not melt and it improves freeze-thaw stability. The level of sodium
alginate and calcium determine how firm the gel texture will be: higher levels lead to the
formation of stronger gels. The typical egg-box of alginate is formed by junction zones linked by
ionic complexation, in which a divalent cation (e.g., Ca++) bridges two strands of the
polymerXXVIII.
Gel Formation
- 28 -
The critical point of using these hydrocolloids in our process was represented by the high
concentration of calcium that sped the reaction leading to the formation of transparent gel
particles immediately when in contact with water. If a gel sets while it is being mixed, it may be
damaged and does not work properly in the final food product. In order to avoid this, there is the
possibility of adding a mix of alginates and sequestrants, such as trisodium citrate or sodium
phosphate, to control the setting rate of the gel. The latter works competing with the sodium
alginate for the calcium, causing the gel setting more slowly. Obviously, if the sequestrant is
added in higher amount, it will remove too much calcium from the gel making it too soft or even
preventing it from forming.
The last hydrocolloid sample ordered from CPKelco company was Kelcogel F, a food grade
gellan gum. Since we received it later and we already reached the gel formation with protein we
did not use it.
5.3 β-glucan gels and health effects
β-Glucans are non-starch polysaccharides present in the cell-wall of cereals such as oats and
barley. They are soluble dietary fibers, at the boundary between hemicelluloses and gums.XIII,
XXIX
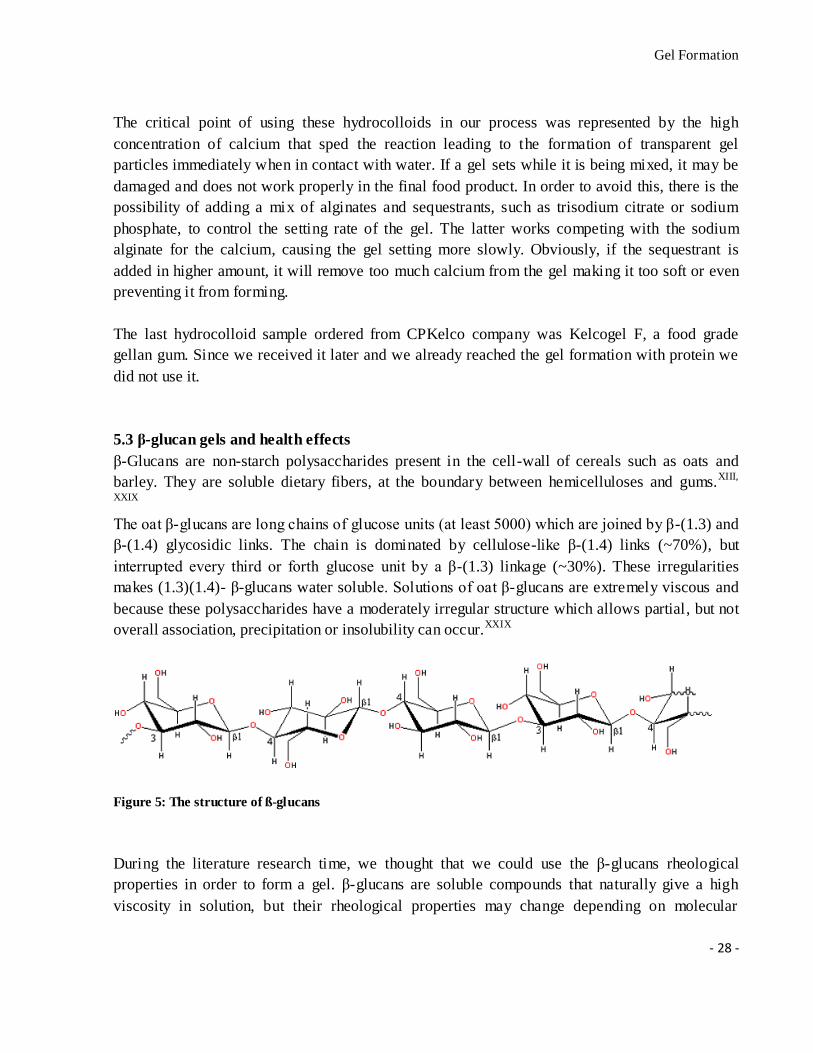
The oat β-glucans are long chains of glucose units (at least 5000) which are joined by β-(1.3) and
β-(1.4) glycosidic links. The chain is dominated by cellulose-like β-(1.4) links (~70%), but
interrupted every third or forth glucose unit by a β-(1.3) linkage (~30%). These irregularities
makes (1.3)(1.4)- β-glucans water soluble. Solutions of oat β-glucans are extremely viscous and
because these polysaccharides have a moderately irregular structure which allows partial, but not
overall association, precipitation or insolubility can occur.XXIX
Figure 5: The structure of ß-glucans
During the literature research time, we thought that we could use the β-glucans rheological
properties in order to form a gel. β-glucans are soluble compounds that naturally give a high
viscosity in solution, but their rheological properties may change depending on molecular
Gel Formation
- 29 -
characteristics (size, structure: proportion of cellotriosyl / cellotetraosyl units) storage time, and
temperature history.
In addition to increased solution viscosity on storage, they can also form gels under certain
conditions. Thus cereal β-glucans hydrogels with different properties can be obtained under
isothermal conditions (5-45 °C ; 4-12% concentration), as well as after repeated freezing and
thawing cycles. “Isothermal” and “cryo” gels belong to the category of cross linked gels, their
structure being stabilized mainly by multiple inter and intra chain hydrogen bonds in the junction
zones of the polymeric network. For this reason, the molecular characteristics, especially the
number of junction zones and the proportion of cellotriosyl / cellotetraosyl units affect quite
significantly the physical properties of the gel.
Due to the difficulty to master the gelling conditions of these compounds, after the literature
review, we gave up the idea of using β-glucans to form the gel and we concentrated mainly on
creating a protein structure. XXXXXXI, XXXII
Health effects
Cardiovascular heart disease is a major public health concern in the United States. It accounts for
more deaths than any other disease or group of diseases. XXXIII
Scientific evidence demonstrates that β-glucans have different beneficial effects in the body.
The β-glucans have an action on the heart, indeed, they decrease the absorption of cholesterol,
fatty acids and bile acids by forming a highly viscous solution in the small intestine. They also
decrease the blood glucose (indirectly the level of insulin) so they have a role on satiety and
diabetes. Moreover, β-glucans play the part of prebiotics in the large intestine, by stimulating
the growth of desirable bacteria and limiting the growth of potentially harmful organisms. They
can also be fermented by beneficial bacteria to produce volatile fatty acids used to protect the
cells against bowel disease.
Β-glucans can bind and activate specialized cells (macrophages and natural killer cells)
involved in immune response and thus increase the body’s ability to fight infections and limit
cancers. XXXIV,XXXV
The daily dietary intake level of soluble fiber that have been associated with reduced risk of
coronary heart disease is 3 g or more per day of β-glucan soluble fiber from either whole oats or
barley, or a combination of whole oats and barley. XXXVI
5.4 Starch gel formation
Starch is present as granules in the endosperm of grains such as oat. Those in oat are the smallest
cereal starch granules known. The starch agglomerates are complex polysaccharides made of two
different chains, amylose and amylopectine, which are both consisting out of the same monomer
α-D-glucose. The amylase is a linear chain in which the glucose monomers are bounded α-1,4
and the amylopectine contains additionally cross links within α-1,6.
Gel Formation
- 30 -
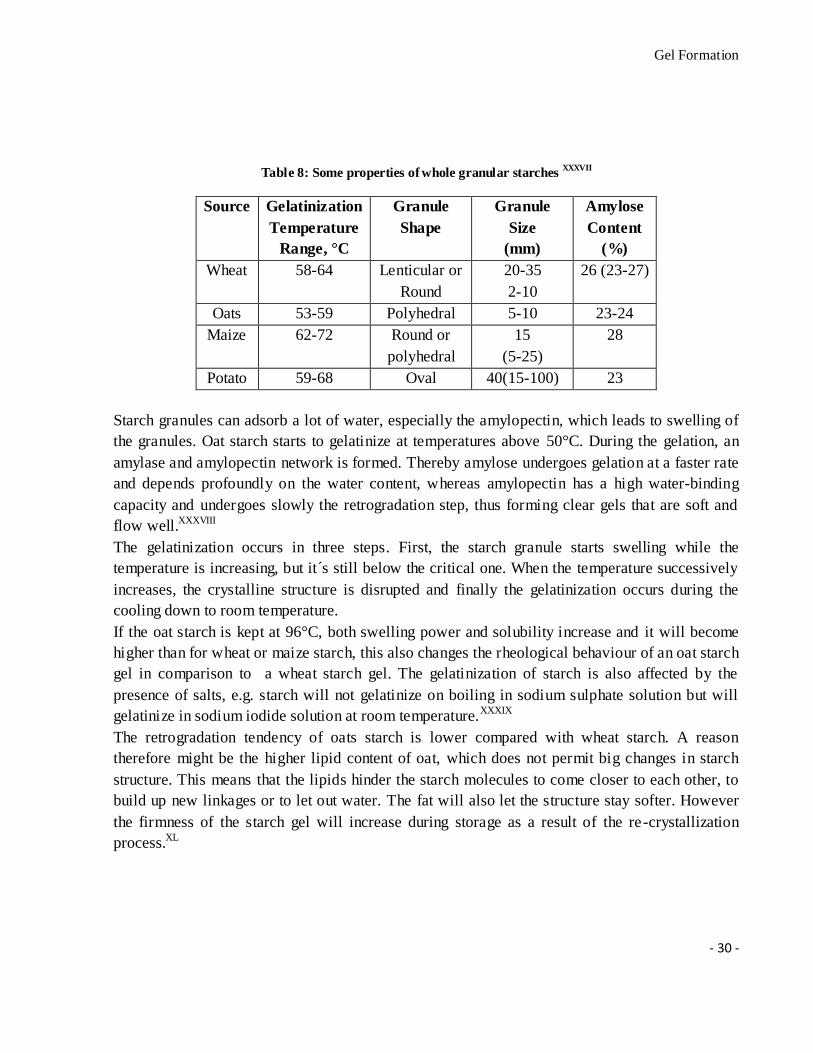
Table 8: Some properties of whole granular starches XXXVII
Source Gelatinization
Temperature
Range, °C
Granule
Shape
Granule
Size
(mm)
Amylose
Content
(%)
Wheat 58-64 Lenticular or
Round
20-35
2-10
26 (23-27)
Oats 53-59 Polyhedral 5-10 23-24
Maize 62-72 Round or
polyhedral
15
(5-25)
28
Potato 59-68 Oval 40(15-100) 23
Starch granules can adsorb a lot of water, especially the amylopectin, which leads to swelling of
the granules. Oat starch starts to gelatinize at temperatures above 50°C. During the gelation, an
amylase and amylopectin network is formed. Thereby amylose undergoes gelation at a faster rate
and depends profoundly on the water content, whereas amylopectin has a high water-binding
capacity and undergoes slowly the retrogradation step, thus forming clear gels that are soft and
flow well.XXXVIII
The gelatinization occurs in three steps. First, the starch granule starts swelling while the
temperature is increasing, but it´s still below the critical one. When the temperature successively
increases, the crystalline structure is disrupted and finally the gelatinization occurs during the
cooling down to room temperature.
If the oat starch is kept at 96°C, both swelling power and solubility increase and it will become
higher than for wheat or maize starch, this also changes the rheological behaviour of an oat starch
gel in comparison to a wheat starch gel. The gelatinization of starch is also affected by the
presence of salts, e.g. starch will not gelatinize on boiling in sodium sulphate solution but will
gelatinize in sodium iodide solution at room temperature.XXXIX
The retrogradation tendency of oats starch is lower compared with wheat starch. A reason
therefore might be the higher lipid content of oat, which does not permit big changes in starch
structure. This means that the lipids hinder the starch molecules to come closer to each other, to
build up new linkages or to let out water. The fat will also let the structure stay softer. However
the firmness of the starch gel will increase during storage as a result of the re-crystallization
process.XL
Concentration and separation techniques
- 31 -
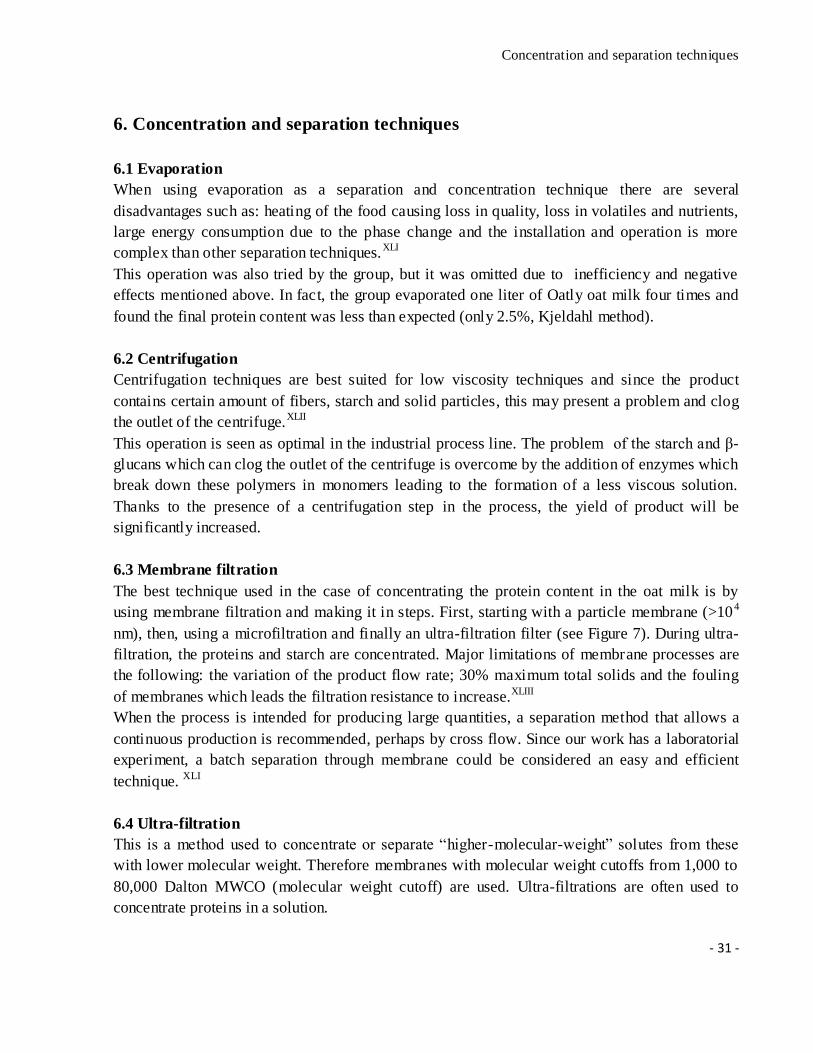
6. Concentration and separation techniques
6.1 Evaporation
When using evaporation as a separation and concentration technique there are several
disadvantages such as: heating of the food causing loss in quality, loss in volatiles and nutrients,
large energy consumption due to the phase change and the installation and operation is more
complex than other separation techniques.XLI
This operation was also tried by the group, but it was omitted due to inefficiency and negative
effects mentioned above. In fact, the group evaporated one liter of Oatly oat milk four times and
found the final protein content was less than expected (only 2.5%, Kjeldahl method).
6.2 Centrifugation
Centrifugation techniques are best suited for low viscosity techniques and since the product
contains certain amount of fibers, starch and solid particles, this may present a problem and clog
the outlet of the centrifuge.XLII
This operation is seen as optimal in the industrial process line. The problem of the starch and β-
glucans which can clog the outlet of the centrifuge is overcome by the addition of enzymes which
break down these polymers in monomers leading to the formation of a less viscous solution.
Thanks to the presence of a centrifugation step in the process, the yield of product will be
significantly increased.
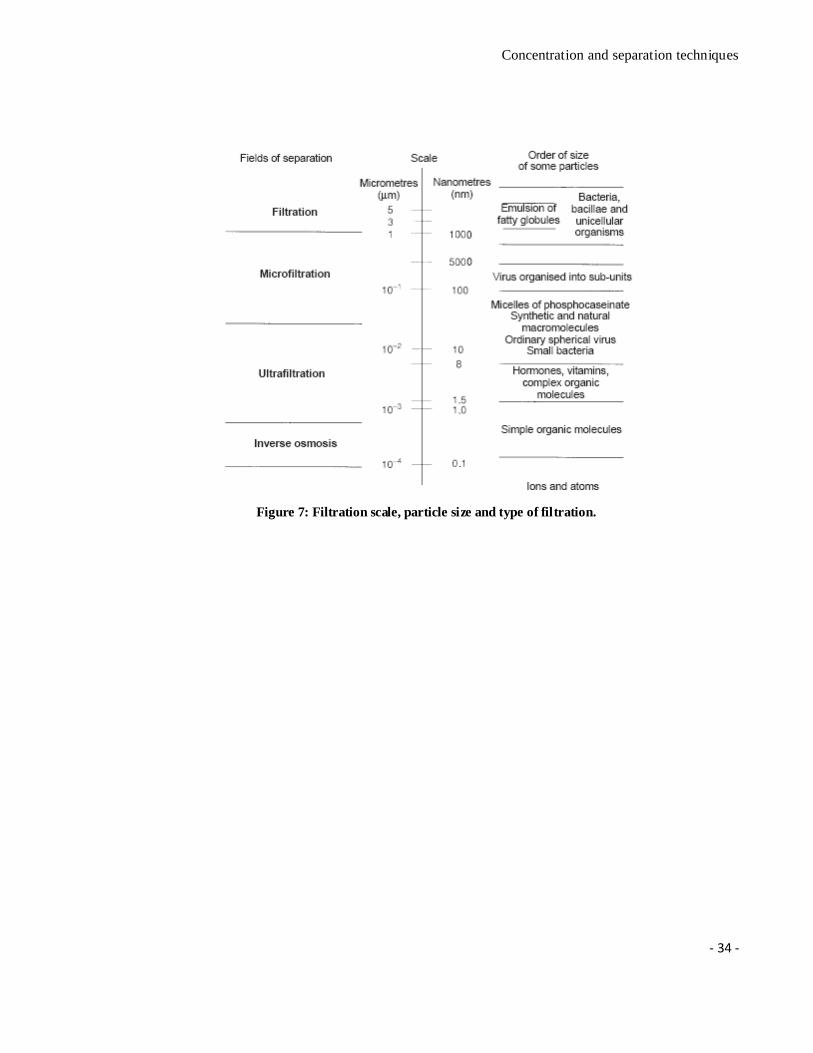
6.3 Membrane filtration
The best technique used in the case of concentrating the protein content in the oat milk is by
using membrane filtration and making it in steps. First, starting with a particle membrane (>104
nm), then, using a microfiltration and finally an ultra-filtration filter (see Figure 7). During ultra-
filtration, the proteins and starch are concentrated. Major limitations of membrane processes are
the following: the variation of the product flow rate; 30% maximum total solids and the fouling
of membranes which leads the filtration resistance to increase.XLIII
When the process is intended for producing large quantities, a separation method that allows a
continuous production is recommended, perhaps by cross flow. Since our work has a laboratorial
experiment, a batch separation through membrane could be considered an easy and efficient
technique. XLI
6.4 Ultra-filtration
This is a method used to concentrate or separate “higher-molecular-weight” solutes from these
with lower molecular weight. Therefore membranes with molecular weight cutoffs from 1,000 to
80,000 Dalton MWCO (molecular weight cutoff) are used. Ultra-filtrations are often used to
concentrate proteins in a solution.
Concentration and separation techniques
- 32 -
6.4.1 Lab Experiment
Equipment:
DSS Module, Type: Labstak® M10 Module (see Appendix)
Introduction:
Good equipment for small scale production for separating high and small molecular weight
solutes. It is very easy to operate. We need only one pump, module, filters and connecting pipes.
Operation:
For operating this equipment we need some parameters such as temperature and pressure. The
operating temperature and pressure can be selected; depending upon which type of membrane is
used. In this project we selected GR70PP designation and 20 000 MWCO. Here the membrane
with a MWCO is too low compared with the molecular weight of target protein. Oat protein size
is in between 326 000 and 358 000 Dalton, according to this rule we did not have that weight of
MWCO membrane.
The recommended operation limits for this membrane are the following
1. For production
pH range 1-13
Pressure (bar) 1-10
Temperature (°C) 0-75
2. For cleaning
pH range 1-13
Pressure (bar) 1-5
Temperature (°C) 0-75
Concentration and separation techniques
- 33 -
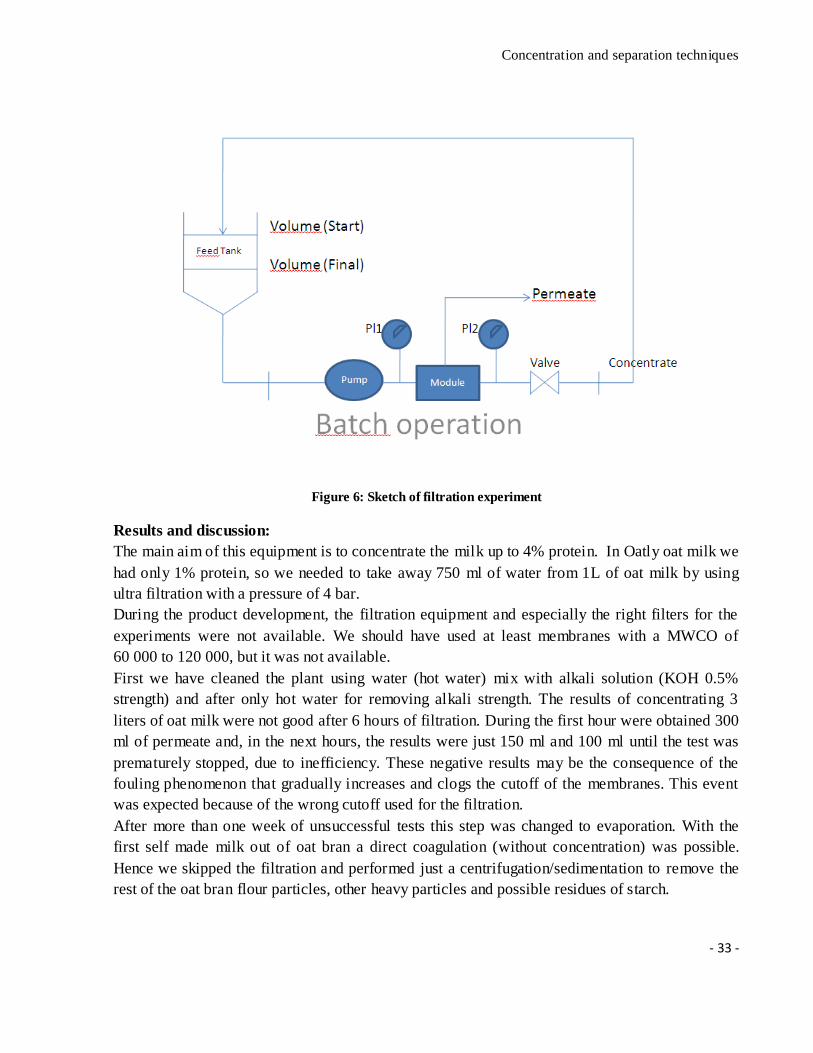
Figure 6: Sketch of filtration experiment
Results and discussion:
The main aim of this equipment is to concentrate the milk up to 4% protein. In Oatly oat milk we
had only 1% protein, so we needed to take away 750 ml of water from 1L of oat milk by using
ultra filtration with a pressure of 4 bar.
During the product development, the filtration equipment and especially the right filters for the
experiments were not available. We should have used at least membranes with a MWCO of
60 000 to 120 000, but it was not available.
First we have cleaned the plant using water (hot water) mix with alkali solution (KOH 0.5%
strength) and after only hot water for removing alkali strength. The results of concentrating 3
liters of oat milk were not good after 6 hours of filtration. During the first hour were obtained 300
ml of permeate and, in the next hours, the results were just 150 ml and 100 ml until the test was
prematurely stopped, due to inefficiency. These negative results may be the consequence of the
fouling phenomenon that gradually increases and clogs the cutoff of the membranes. This event
was expected because of the wrong cutoff used for the filtration.
After more than one week of unsuccessful tests this step was changed to evaporation. With the
first self made milk out of oat bran a direct coagulation (without concentration) was possible.
Hence we skipped the filtration and performed just a centrifugation/sedimentation to remove the
rest of the oat bran flour particles, other heavy particles and possible residues of starch.
Concentration and separation techniques
- 34 -
Figure 7: Filtration scale, particle size and type of filtration.
Unit Operations
- 35 -
7. Unit operations
7.1 Extraction of oat protein
The oatmilk used as an intermediate product for the oat tofu production is obtained thanks to the
mechanism of enzymatic extraction of the proteins out of the oat bran. The oat bran proteins play
a quite important structural role, as they are found in the cell wall of the plant, where they are
surrounded by polysaccharides. To extract them it is necessary to break the β-glucan linkages,
which is easily done by the Viscozyme (a purified fungal β-glucanase used mainly in the bio-fuel
industry, to diminish the viscosity of cereal solutions). In order to obtain a better yield of the
enzymatic extraction, a prior milling process is needed. The grinder action increases the surface
of extraction by reducing the particle size and the great presence of water (1:10 dilution) will
increase the activity of Viscozyme. The enzymes best operate at pH 4.6, cutting both the β 1-3
and β 1-4 linkages leading to the formation of water soluble fragments (reducing carbohydrates).
According to this enzymatic method we´ll decrease the viscosity and thus extract more easily the
proteins, using NaOH in order to adjust the pH to 9.5 w hich corresponds to the best oat protein
solubility. By using this type of extraction the resulting amount of released oat protein is high,
but the amount of β-glucans is almost zero. In order to respect the objectives, which implies the
possibility of having the health claim on the product according to the US Code of Federal
Regulations 21 CFR 101.81 we´ll add the right amount of oat bran just before pressing in order to
bring via the enclosing of the oat bran flour the β-glucans into the tofu like oat protein gel. After
extracting the proteins out of the oat bran, a centrifugation step is done to separate the remaining
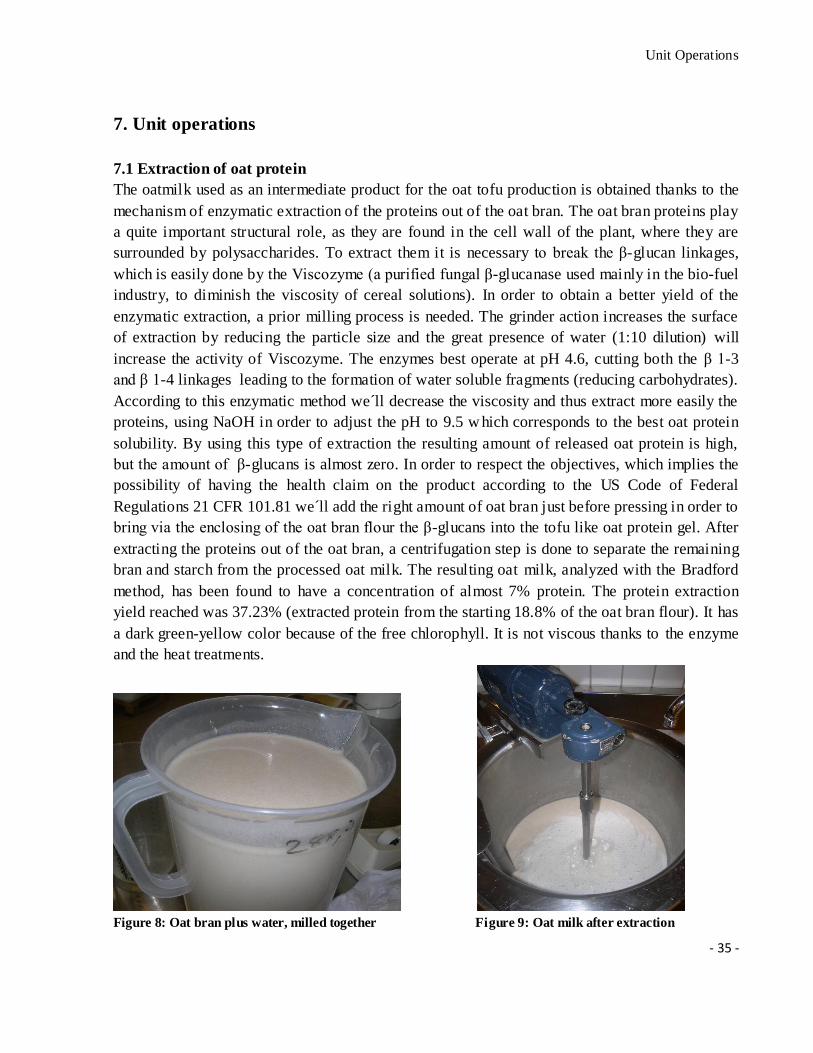
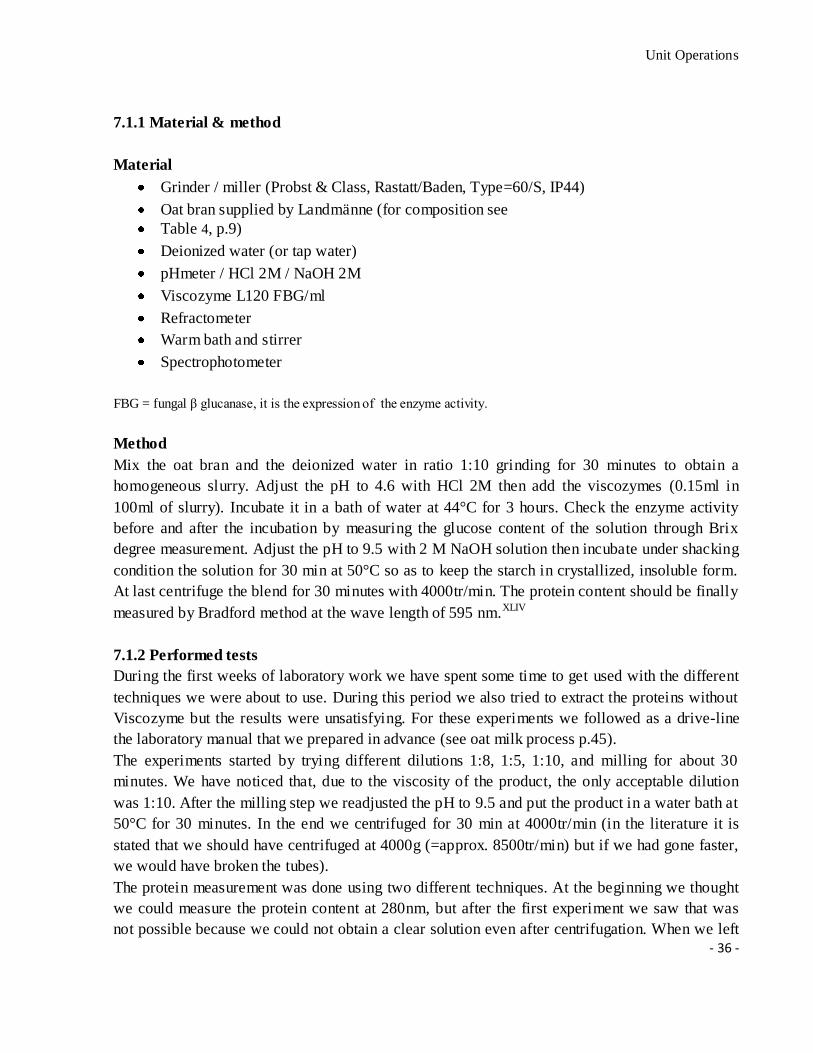
bran and starch from the processed oat milk. The resulting oat milk, analyzed with the Bradford
method, has been found to have a concentration of almost 7% protein. The protein extraction
yield reached was 37.23% (extracted protein from the starting 18.8% of the oat bran flour). It has
a dark green-yellow color because of the free chlorophyll. It is not viscous thanks to the enzyme
and the heat treatments.
Figure 8: Oat bran plus water, milled together Figure 9: Oat milk after extraction
Unit Operations
- 36 -
7.1.1 Material & method
Material
Grinder / miller (Probst & Class, Rastatt/Baden, Type=60/S, IP44)
Oat bran supplied by Landmänne (for composition see
Table 4, p.9)
Deionized water (or tap water)
pHmeter / HCl 2M / NaOH 2M
Viscozyme L120 FBG/ml
Refractometer
Warm bath and stirrer
Spectrophotometer
FBG = fungal β glucanase, it is the expression of the enzyme activity.
Method
Mix the oat bran and the deionized water in ratio 1:10 grinding for 30 minutes to obtain a
homogeneous slurry. Adjust the pH to 4.6 with HCl 2M then add the viscozymes (0.15ml in
100ml of slurry). Incubate it in a bath of water at 44°C for 3 hours. Check the enzyme activity
before and after the incubation by measuring the glucose content of the solution through Brix
degree measurement. Adjust the pH to 9.5 with 2 M NaOH solution then incubate under shacking
condition the solution for 30 min at 50°C so as to keep the starch in crystallized, insoluble form.
At last centrifuge the blend for 30 minutes with 4000tr/min. The protein content should be finally
measured by Bradford method at the wave length of 595 nm.XLIV
7.1.2 Performed tests
During the first weeks of laboratory work we have spent some time to get used with the different
techniques we were about to use. During this period we also tried to extract the proteins without
Viscozyme but the results were unsatisfying. For these experiments we followed as a drive-line
the laboratory manual that we prepared in advance (see oat milk process p.45).
The experiments started by trying different dilutions 1:8, 1:5, 1:10, and milling for about 30
minutes. We have noticed that, due to the viscosity of the product, the only acceptable dilution
was 1:10. After the milling step we readjusted the pH to 9.5 and put the product in a water bath at
50°C for 30 minutes. In the end we centrifuged for 30 min at 4000tr/min (in the literature it is
stated that we should have centrifuged at 4000g (=approx. 8500tr/min) but if we had gone faster,
we would have broken the tubes).
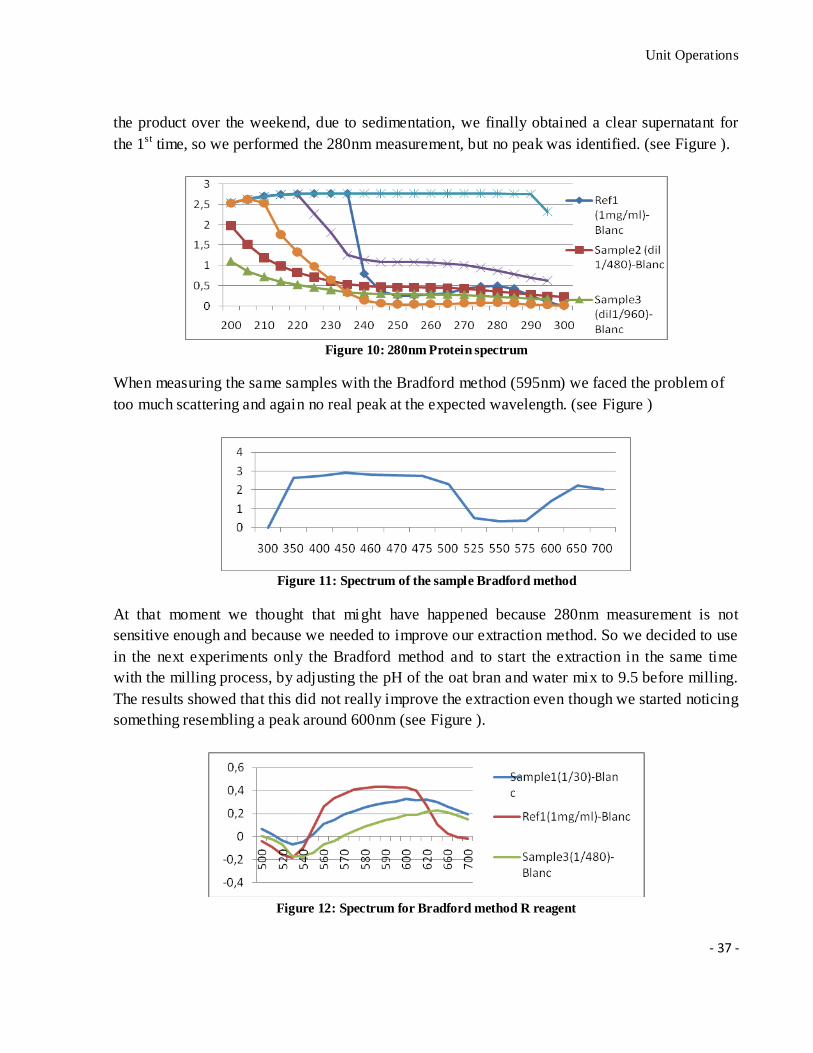
The protein measurement was done using two different techniques. At the beginning we thought
we could measure the protein content at 280nm, but after the first experiment we saw that was
not possible because we could not obtain a clear solution even after centrifugation. When we left
Unit Operations
- 37 -
the product over the weekend, due to sedimentation, we finally obtained a clear supernatant for
the 1st time, so we performed the 280nm measurement, but no peak was identified. (see Figure ).
Figure 10: 280nm Protein spectrum
When measuring the same samples with the Bradford method (595nm) we faced the problem of
too much scattering and again no real peak at the expected wavelength. (see Figure )
Figure 11: Spectrum of the sample Bradford method
At that moment we thought that might have happened because 280nm measurement is not
sensitive enough and because we needed to improve our extraction method. So we decided to use
in the next experiments only the Bradford method and to start the extraction in the same time
with the milling process, by adjusting the pH of the oat bran and water mix to 9.5 before milling.
The results showed that this did not really improve the extraction even though we started noticing
something resembling a peak around 600nm (see Figure ).
Figure 12: Spectrum for Bradford method R reagent
Unit Operations
- 38 -
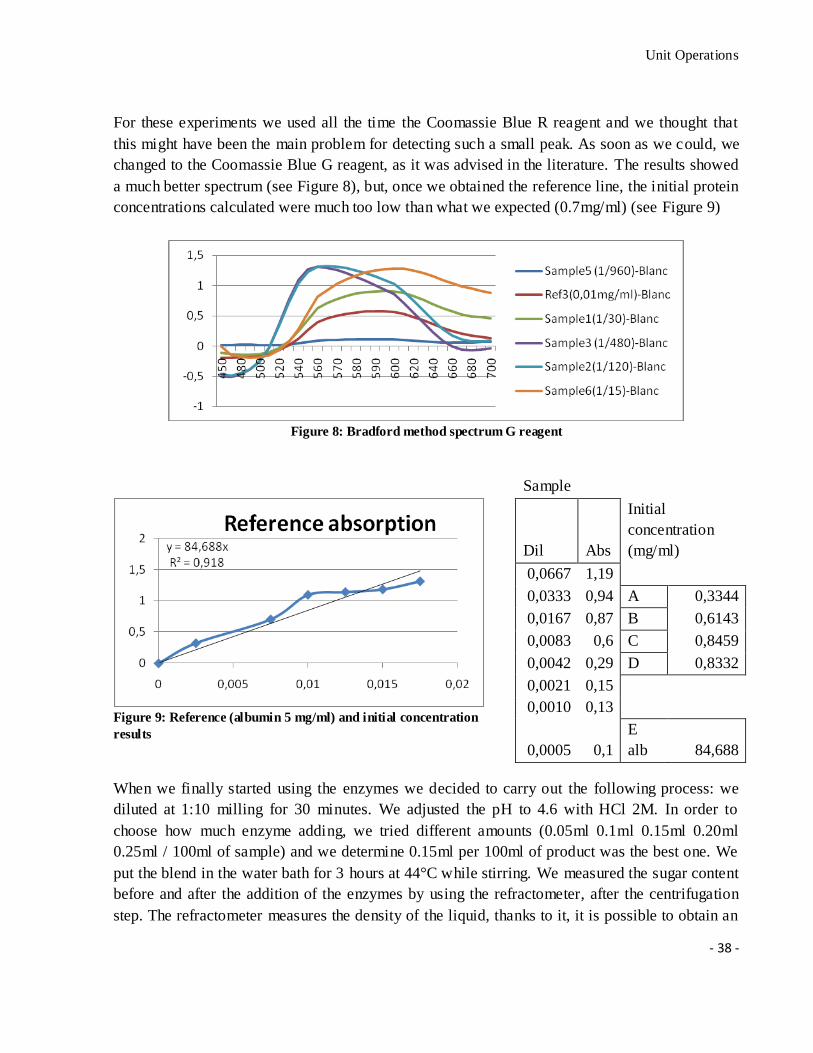
For these experiments we used all the time the Coomassie Blue R reagent and we thought that
this might have been the main problem for detecting such a small peak. As soon as we could, we
changed to the Coomassie Blue G reagent, as it was advised in the literature. The results showed
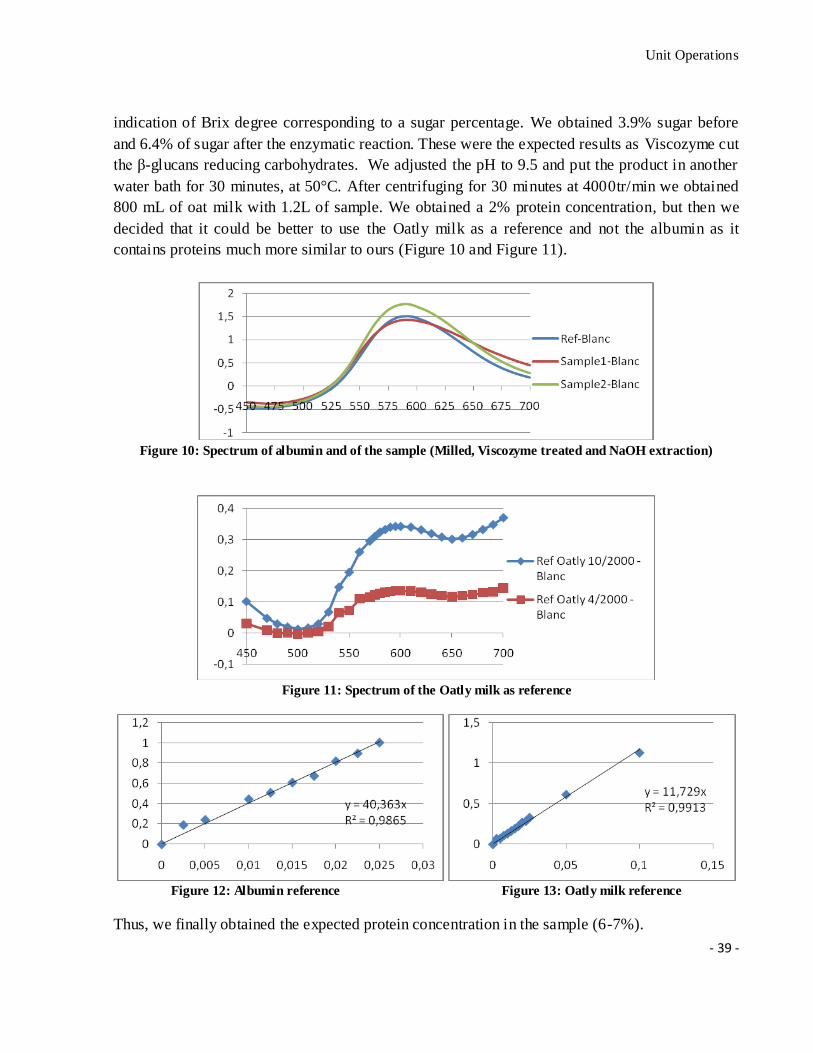
a much better spectrum (see Figure 8), but, once we obtained the reference line, the initial protein
concentrations calculated were much too low than what we expected (0.7mg/ml) (see Figure 9)
Figure 8: Bradford method spectrum G reagent
Figure 9: Reference (albumin 5 mg/ml) and initial concentration
results
When we finally started using the enzymes we decided to carry out the following process: we
diluted at 1:10 milling for 30 minutes. We adjusted the pH to 4.6 with HCl 2M. In order to
choose how much enzyme adding, we tried different amounts (0.05ml 0.1ml 0.15ml 0.20ml
0.25ml / 100ml of sample) and we determine 0.15ml per 100ml of product was the best one. We
put the blend in the water bath for 3 hours at 44°C while stirring. We measured the sugar content
before and after the addition of the enzymes by using the refractometer, after the centrifugation
step. The refractometer measures the density of the liquid, thanks to it, it is possible to obtain an
Sample
Dil Abs
Initial
concentration
(mg/ml)
0,0667 1,19
0,0333 0,94 A 0,3344
0,0167 0,87 B 0,6143
0,0083 0,6 C 0,8459
0,0042 0,29 D 0,8332
0,0021 0,15
0,0010 0,13
0,0005 0,1
E
alb 84,688
Unit Operations
- 39 -
indication of Brix degree corresponding to a sugar percentage. We obtained 3.9% sugar before
and 6.4% of sugar after the enzymatic reaction. These were the expected results as Viscozyme cut
the β-glucans reducing carbohydrates. We adjusted the pH to 9.5 and put the product in another
water bath for 30 minutes, at 50°C. After centrifuging for 30 minutes at 4000tr/min we obtained
800 mL of oat milk with 1.2L of sample. We obtained a 2% protein concentration, but then we
decided that it could be better to use the Oatly milk as a reference and not the albumin as it
contains proteins much more similar to ours (Figure 10 and Figure 11).
Figure 10: Spectrum of albumin and of the sample (Milled, Viscozyme treated and NaOH extraction)
Figure 11: Spectrum of the Oatly milk as reference
Figure 12: Albumin reference Figure 13: Oatly milk reference
Thus, we finally obtained the expected protein concentration in the sample (6-7%).
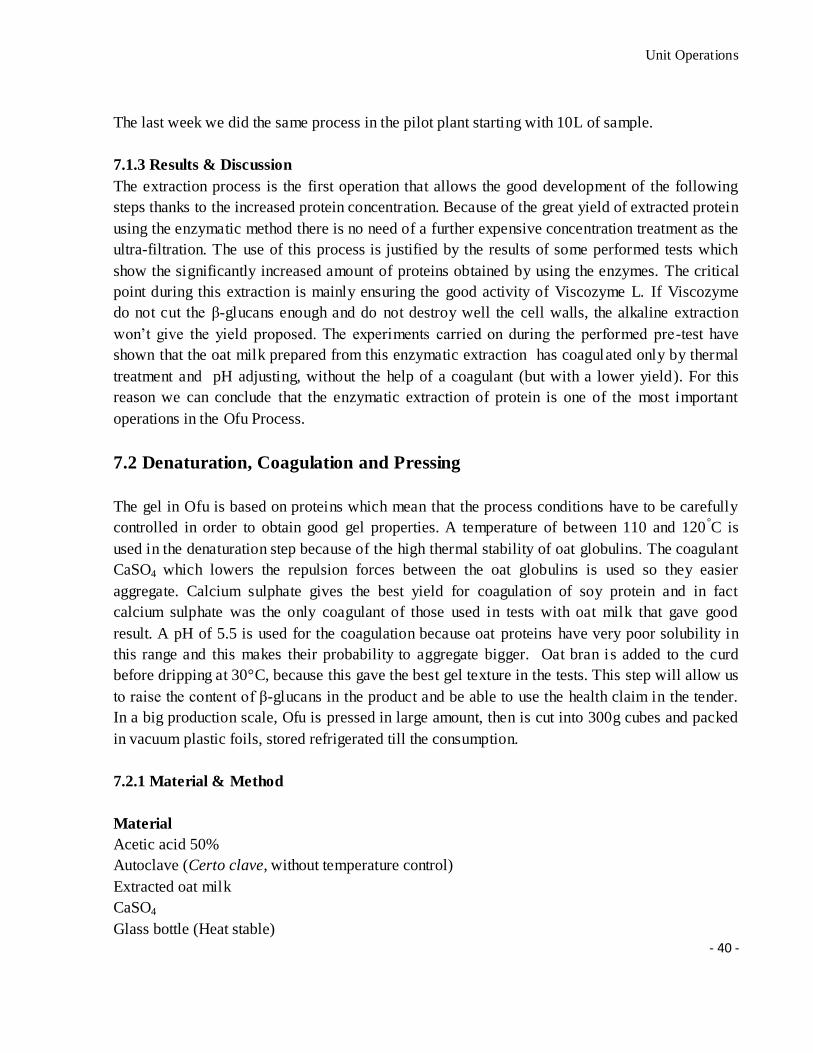
Unit Operations
- 40 -
The last week we did the same process in the pilot plant starting with 10L of sample.
7.1.3 Results & Discussion
The extraction process is the first operation that allows the good development of the following
steps thanks to the increased protein concentration. Because of the great yield of extracted protein
using the enzymatic method there is no need of a further expensive concentration treatment as the
ultra-filtration. The use of this process is justified by the results of some performed tests which
show the significantly increased amount of proteins obtained by using the enzymes. The critical
point during this extraction is mainly ensuring the good activity of Viscozyme L. If Viscozyme
do not cut the β-glucans enough and do not destroy well the cell walls, the alkaline extraction
won’t give the yield proposed. The experiments carried on during the performed pre-test have
shown that the oat milk prepared from this enzymatic extraction has coagulated only by thermal
treatment and pH adjusting, without the help of a coagulant (but with a lower yield). For this
reason we can conclude that the enzymatic extraction of protein is one of the most important
operations in the Ofu Process.
7.2 Denaturation, Coagulation and Pressing
The gel in Ofu is based on proteins which mean that the process conditions have to be carefully
controlled in order to obtain good gel properties. A temperature of between 110 and 120 °C is
used in the denaturation step because of the high thermal stability of oat globulins. The coagulant
CaSO4 which lowers the repulsion forces between the oat globulins is used so they easier
aggregate. Calcium sulphate gives the best yield for coagulation of soy protein and in fact
calcium sulphate was the only coagulant of those used in tests with oat milk that gave good
result. A pH of 5.5 is used for the coagulation because oat proteins have very poor solubility in
this range and this makes their probability to aggregate bigger. Oat bran is added to the curd
before dripping at 30°C, because this gave the best gel texture in the tests. This step will allow us
to raise the content of β-glucans in the product and be able to use the health claim in the tender.
In a big production scale, Ofu is pressed in large amount, then is cut into 300g cubes and packed
in vacuum plastic foils, stored refrigerated till the consumption.
7.2.1 Material & Method
Material
Acetic acid 50%
Autoclave (Certo clave, without temperature control)
Extracted oat milk
CaSO4
Glass bottle (Heat stable)
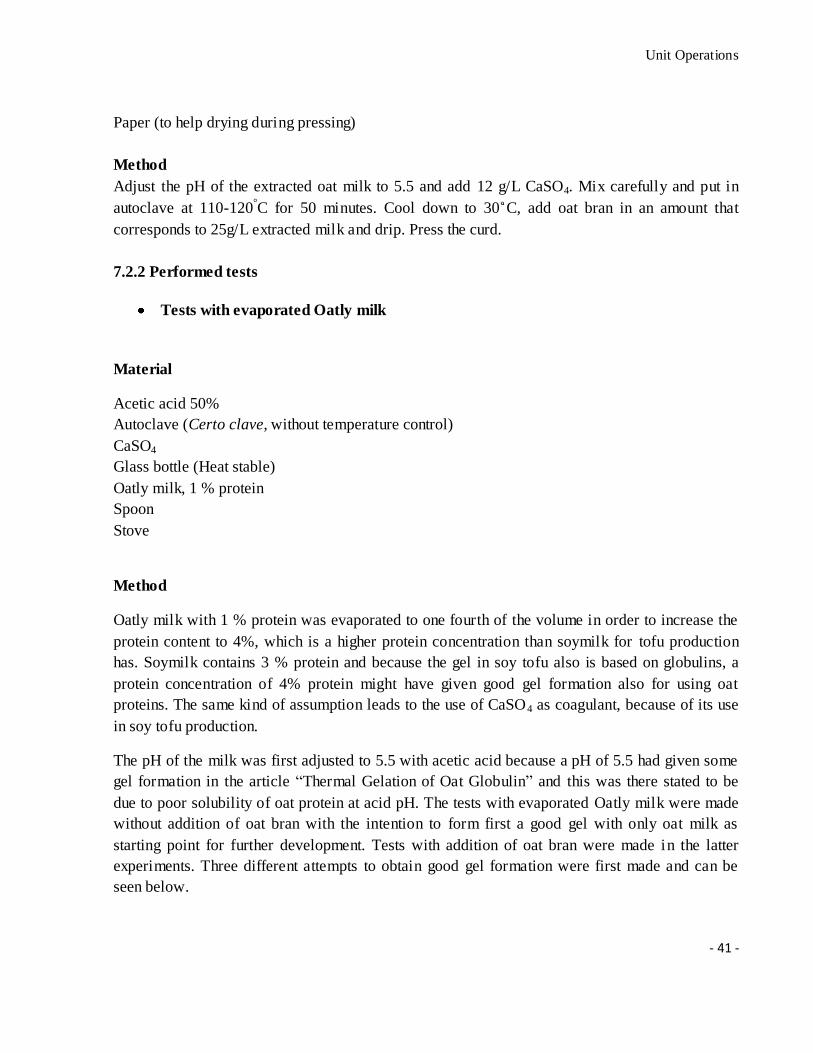
Unit Operations
- 41 -
Paper (to help drying during pressing)
Method
Adjust the pH of the extracted oat milk to 5.5 and add 12 g/L CaSO4. Mix carefully and put in
autoclave at 110-120°C for 50 minutes. Cool down to 30 C, add oat bran in an amount that
corresponds to 25g/L extracted milk and drip. Press the curd.
7.2.2 Performed tests
Tests with evaporated Oatly milk
Material
Acetic acid 50%
Autoclave (Certo clave, without temperature control)
CaSO4
Glass bottle (Heat stable)
Oatly milk, 1 % protein
Spoon
Stove
Method
Oatly milk with 1 % protein was evaporated to one fourth of the volume in order to increase the
protein content to 4%, which is a higher protein concentration than soymilk for tofu production
has. Soymilk contains 3 % protein and because the gel in soy tofu also is based on globulins, a
protein concentration of 4% protein might have given good gel formation also for using oat
proteins. The same kind of assumption leads to the use of CaSO4 as coagulant, because of its use
in soy tofu production.
The pH of the milk was first adjusted to 5.5 with acetic acid because a pH of 5.5 had given some
gel formation in the article “Thermal Gelation of Oat Globulin” and this was there stated to be
due to poor solubility of oat protein at acid pH. The tests with evaporated Oatly milk were made
without addition of oat bran with the intention to form first a good gel with only oat milk as
starting point for further development. Tests with addition of oat bran were made in the latter
experiments. Three different attempts to obtain good gel formation were first made and can be
seen below.
Unit Operations
- 42 -
a) Two samples were used; in one were added 12g/L CaSO4 and the double amount in the
second sample. No gel formation could be seen and because pH was thought to be an
important factor for the coagulation more samples were made with the following pH 5.5,
6.5, 7.5, 8.5 and 9.5 by addition of sodium hydroxide. The samples were kept at 95°C for
10 minutes after the CaSO4 had been added and then cooled down to room temperature.
b) The evaporated oat milk with pH5.5 was put in autoclave at 110-120oC for 10 minutes
and then 12g/L CaSO4 were added. The temperature of 110oC had been used successfully
in the article “Thermal Denaturation of oat globulin”XLV. It was not possible to control the
temperature in the autoclave in another way than turning it on and off and this is why the
interval 110-120oC was used.
c) The time in autoclave at 110oC was increased to 30 minutes and then 24g/L CaSO4 were
added to the milk, which was separated in five samples with pH 5.5, 6.5, 7.5, 8.5, 9.5. The
high level of CaSO4 was used to be sure that the maximum gel formation was obtained at
each pH.
Tests with MgCl, KSO4 and NaCl were also made with Oatly oat milk the same way as for
CaSO4, but since they didn’t show any gel formation at all, the project group chose not to use
them in the tests with extracted milk.
Results and discussion
a) No gel formation occurred in this sample and the milk looked as it was before.
b) Some gel formation could be seen in this sample.
c) More gel formation than in sample (b) was visible in all of the different pH values, but
the most stable gel was observed at pH 5.5. This gel structure was the closest to the
product goal so far and was therefore the new starting point for further development.
The evaporated oat milk was assumed to have a protein concentration of 4 %, but the Kjeldahl
analyses (See appendix) gave the result 2.5%.
Conclusion:
The pH should be maintained to 5.5 and a temperature of 110 o C should be used for the
denaturation.
Unit Operations
- 43 -
Tests with extracted Oat milk
Material
Autoclave (Certo Clave, without temperature control)
Extracted oat milk, 6.8% protein (Bradford method)
CaSO4
Glass bottle (Heat stable)
Spoon
Stove
Method
There was no need to evaporate the extracted oat milk because of the high protein content and the
milk was used directly in the experiments with the hope that the higher protein content would
have given better gel formation.
Sample 1.
Attempts to coagulate the extracted oat milk were done the same way as showed successful for
Oatly oat milk. The pH was adjusted to 5.5 and it was put in autoclave at 110 o C for 20 minutes.
After that 12 g/L calcium sulphate was added to the milk which was held in boiling water. The
gel was separated by filtration.
Sample 2.
The milk was heated at 110 o C for 30 minutes after the pH had been adjusted to 5.5. After the
milk was taken out of the autoclave 12 g/L CaSO4 were added to the bottle. The pH was
gradually increased.
Sample 3.
The milk was prepared the same way as for sample 2, but the milk was then divided in three
samples. To each of the samples (a, b, c) was added a different type of sodium alginate.
a) Manugel GMB
b) Manugel DMB
c) Manugel DPB
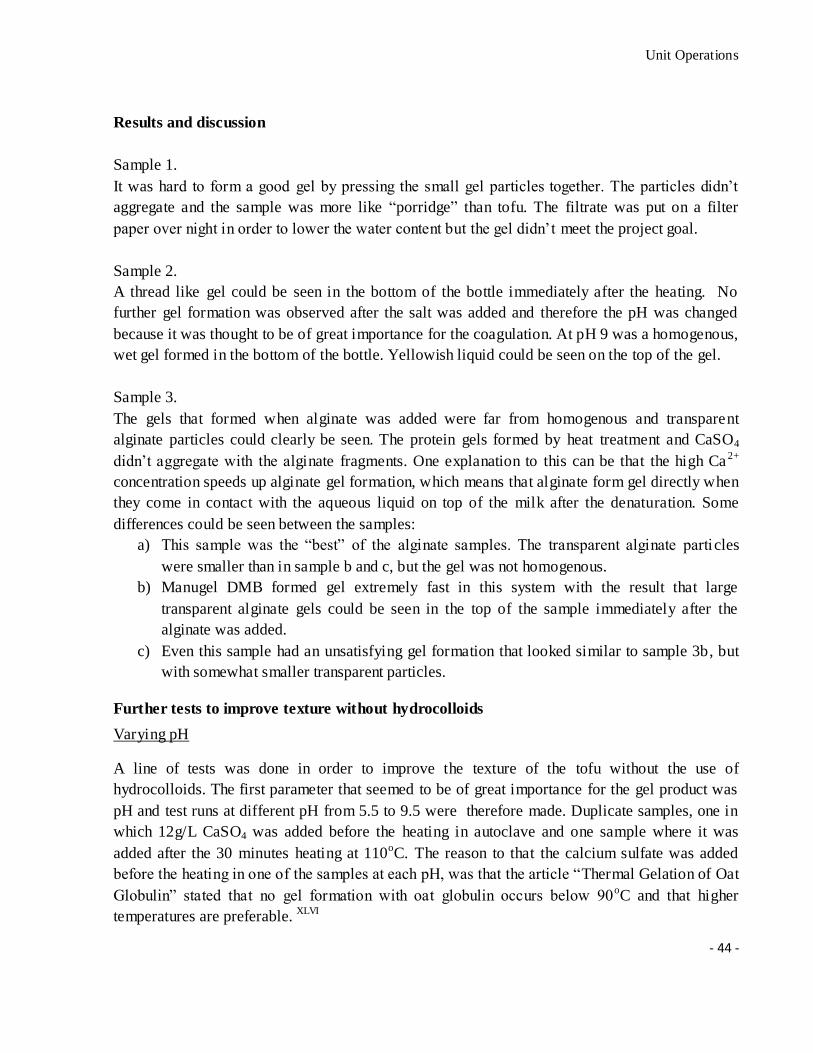
Unit Operations
- 44 -
Results and discussion
Sample 1.
It was hard to form a good gel by pressing the small gel particles together. The particles didn’t
aggregate and the sample was more like “porridge” than tofu. The filtrate was put on a filter
paper over night in order to lower the water content but the gel didn’t meet the project goal.
Sample 2.
A thread like gel could be seen in the bottom of the bottle immediately after the heating. No
further gel formation was observed after the salt was added and therefore the pH was changed
because it was thought to be of great importance for the coagulation. At pH 9 was a homogenous,
wet gel formed in the bottom of the bottle. Yellowish liquid could be seen on the top of the gel.
Sample 3.
The gels that formed when alginate was added were far from homogenous and transparent
alginate particles could clearly be seen. The protein gels formed by heat treatment and CaSO4
didn’t aggregate with the alginate fragments. One explanation to this can be that the high Ca 2+
concentration speeds up alginate gel formation, which means that alginate form gel directly when
they come in contact with the aqueous liquid on top of the milk after the denaturation. Some
differences could be seen between the samples:
a) This sample was the “best” of the alginate samples. The transparent alginate particles
were smaller than in sample b and c, but the gel was not homogenous.
b) Manugel DMB formed gel extremely fast in this system with the result that large
transparent alginate gels could be seen in the top of the sample immediately after the
alginate was added.
c) Even this sample had an unsatisfying gel formation that looked similar to sample 3b, but
with somewhat smaller transparent particles.
Further tests to improve texture without hydrocolloids
Varying pH
A line of tests was done in order to improve the texture of the tofu without the use of
hydrocolloids. The first parameter that seemed to be of great importance for the gel product was
pH and test runs at different pH from 5.5 to 9.5 were therefore made. Duplicate samples, one in
which 12g/L CaSO4 was added before the heating in autoclave and one sample where it was
added after the 30 minutes heating at 110oC. The reason to that the calcium sulfate was added
before the heating in one of the samples at each pH, was that the article “Thermal Gelation of Oat
Globulin” stated that no gel formation with oat globulin occurs below 90oC and that higher
temperatures are preferable. XLVI
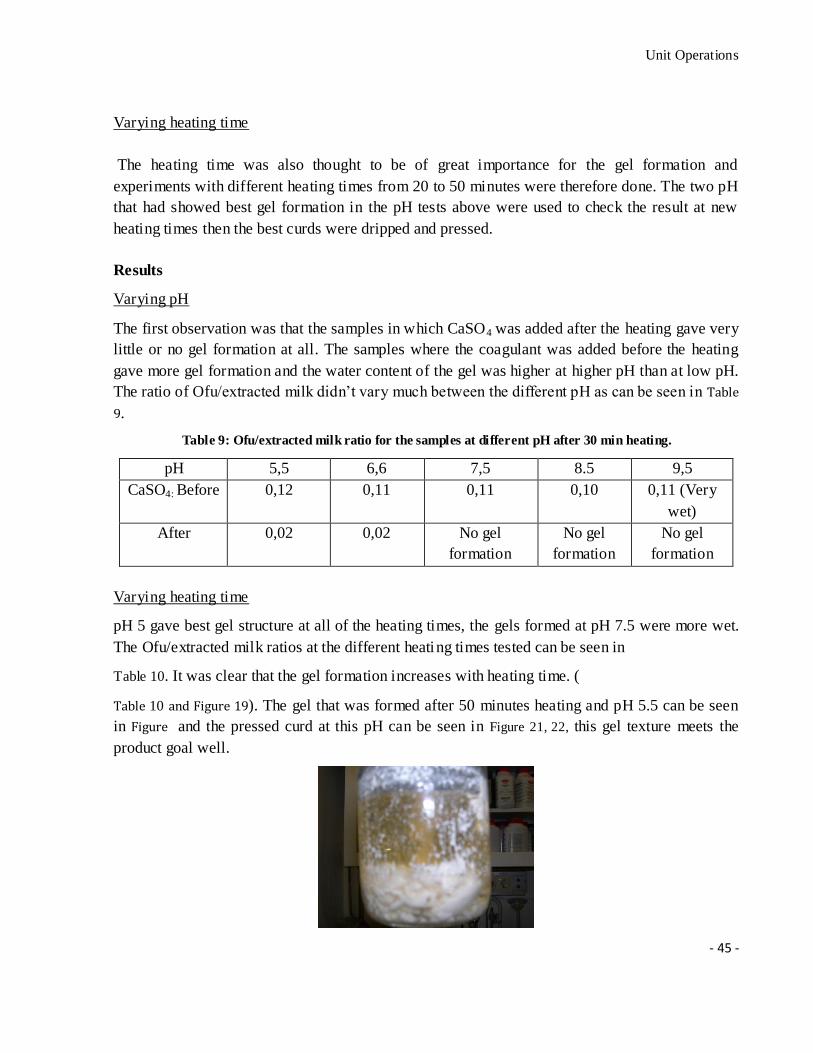
Unit Operations
- 45 -
Varying heating time
The heating time was also thought to be of great importance for the gel formation and
experiments with different heating times from 20 to 50 minutes were therefore done. The two pH
that had showed best gel formation in the pH tests above were used to check the result at new
heating times then the best curds were dripped and pressed.
Results
Varying pH
The first observation was that the samples in which CaSO4 was added after the heating gave very
little or no gel formation at all. The samples where the coagulant was added before the heating
gave more gel formation and the water content of the gel was higher at higher pH than at low pH.
The ratio of Ofu/extracted milk didn’t vary much between the different pH as can be seen in Table
9.
Table 9: Ofu/extracted milk ratio for the samples at different pH after 30 min heating.
pH 5,5 6,6 7,5 8.5 9,5
CaSO4: Before 0,12 0,11 0,11 0,10 0,11 (Very
wet)
After 0,02 0,02 No gel
formation
No gel
formation
No gel
formation
Varying heating time
pH 5 gave best gel structure at all of the heating times, the gels formed at pH 7.5 were more wet.
The Ofu/extracted milk ratios at the different heating times tested can be seen in
Table 10. It was clear that the gel formation increases with heating time. (
Table 10 and Figure 19). The gel that was formed after 50 minutes heating and pH 5.5 can be seen
in Figure and the pressed curd at this pH can be seen in Figure 21, 22, this gel texture meets the
product goal well.
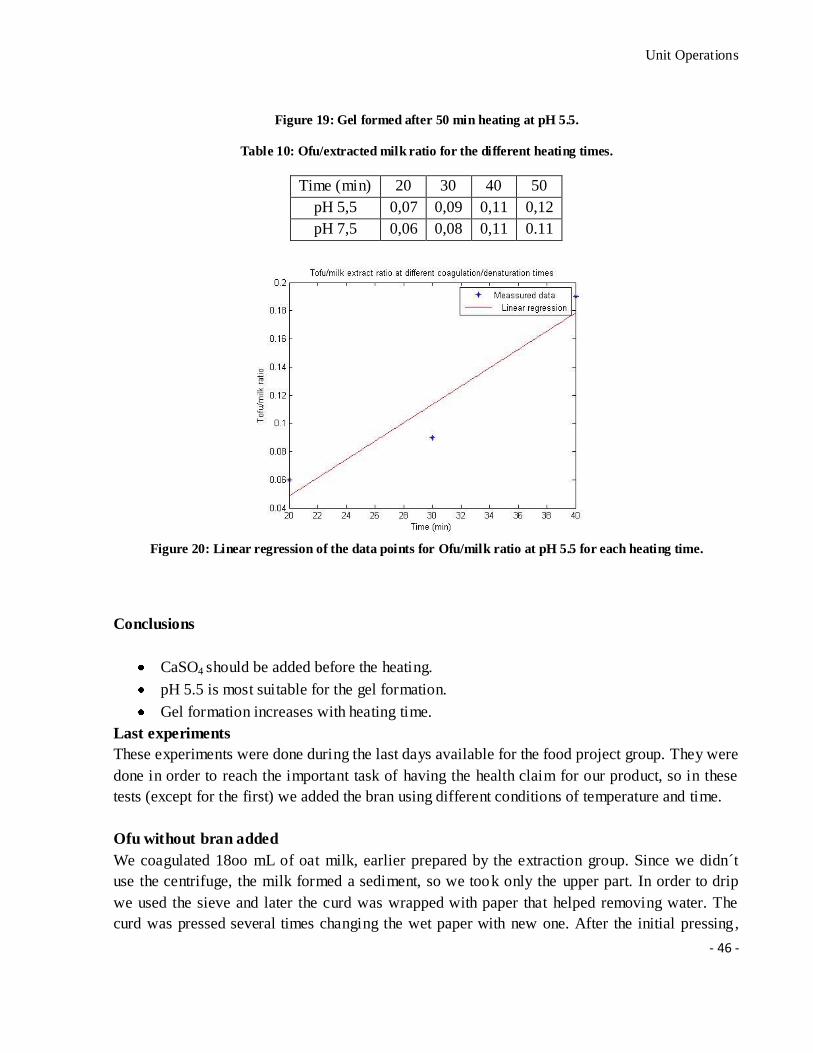
Unit Operations
- 46 -
Figure 19: Gel formed after 50 min heating at pH 5.5.
Table 10: Ofu/extracted milk ratio for the different heating times.
Time (min) 20 30 40 50
pH 5,5 0,07 0,09 0,11 0,12
pH 7,5 0,06 0,08 0,11 0.11
Figure 20: Linear regression of the data points for Ofu/milk ratio at pH 5.5 for each heating time.
Conclusions
CaSO4 should be added before the heating.
pH 5.5 is most suitable for the gel formation.
Gel formation increases with heating time.
Last experiments
These experiments were done during the last days available for the food project group. They were
done in order to reach the important task of having the health claim for our product, so in these
tests (except for the first) we added the bran using different conditions of temperature and time.
Ofu without bran added
We coagulated 18oo mL of oat milk, earlier prepared by the extraction group. Since we didn´t
use the centrifuge, the milk formed a sediment, so we took only the upper part. In order to drip
we used the sieve and later the curd was wrapped with paper that helped removing water. The
curd was pressed several times changing the wet paper with new one. After the initial pressing,
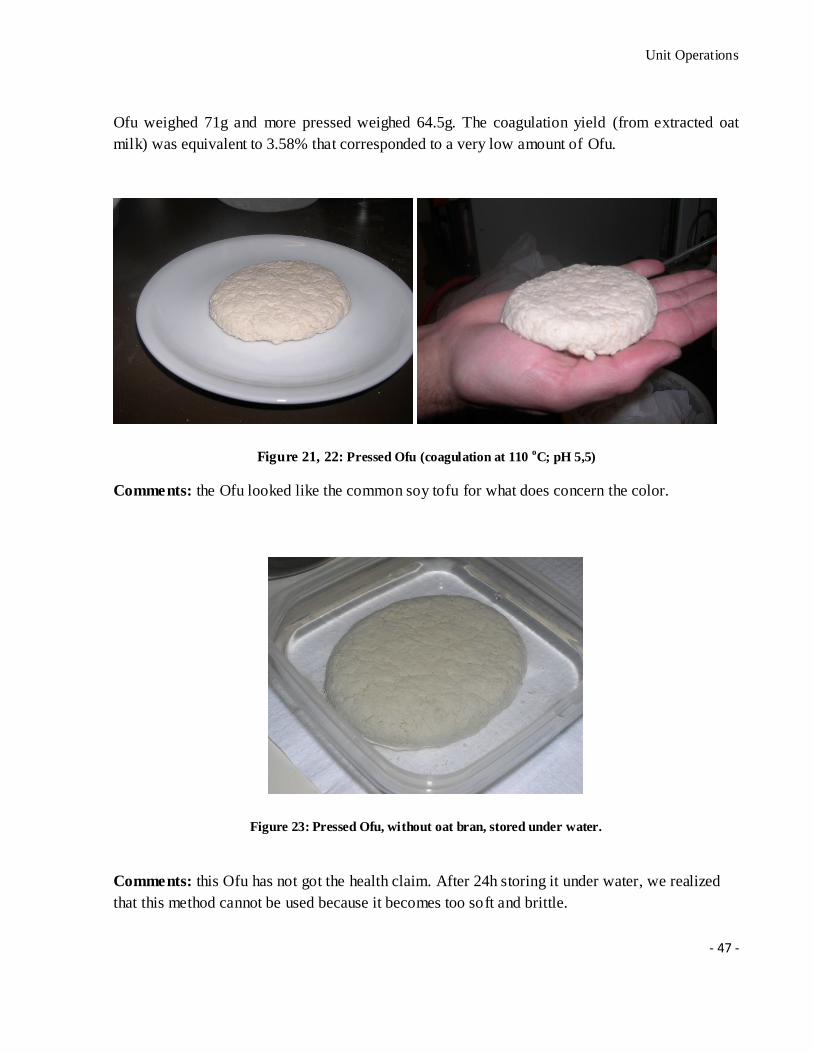
Unit Operations
- 47 -
Ofu weighed 71g and more pressed weighed 64.5g. The coagulation yield (from extracted oat
milk) was equivalent to 3.58% that corresponded to a very low amount of Ofu.
Figure 21, 22: Pressed Ofu (coagulation at 110 oC; pH 5,5)
Comments: the Ofu looked like the common soy tofu for what does concern the color.
Figure 23: Pressed Ofu, without oat bran, stored under water.
Comments: this Ofu has not got the health claim. After 24h storing it under water, we realized
that this method cannot be used because it becomes too soft and brittle.
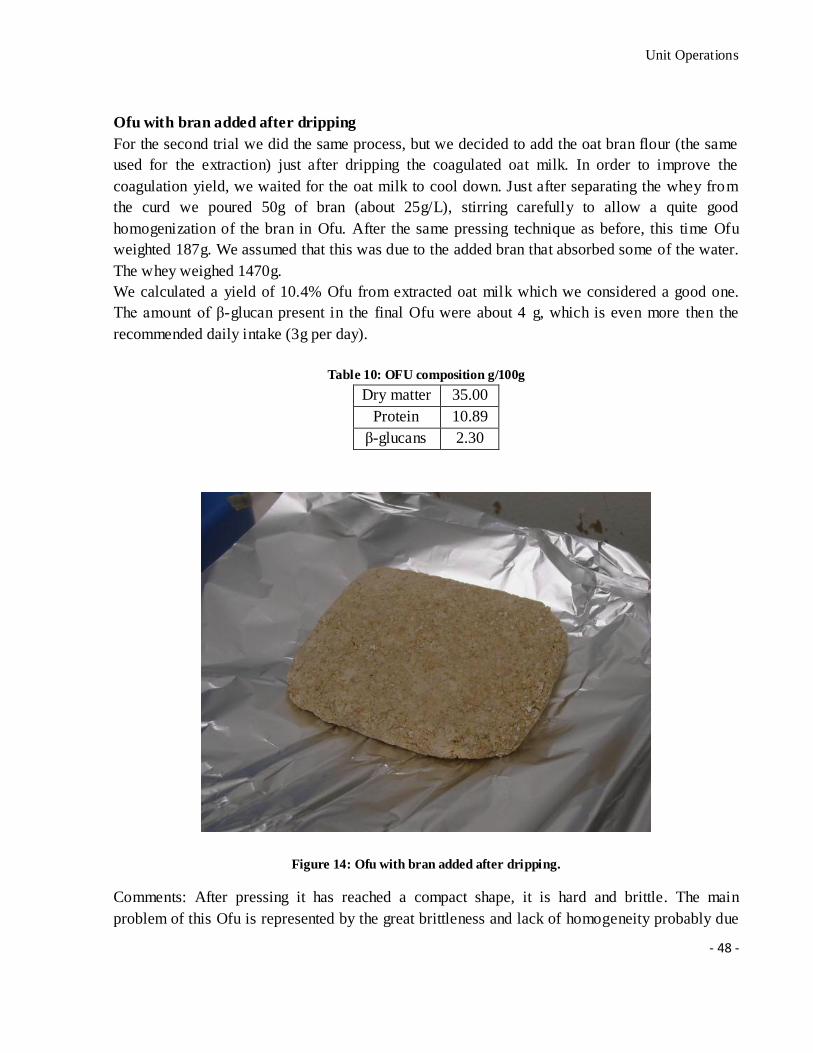
Unit Operations
- 48 -
Ofu with bran added after dripping
For the second trial we did the same process, but we decided to add the oat bran flour (the same
used for the extraction) just after dripping the coagulated oat milk. In order to improve the
coagulation yield, we waited for the oat milk to cool down. Just after separating the whey from
the curd we poured 50g of bran (about 25g/L), stirring carefully to allow a quite good
homogenization of the bran in Ofu. After the same pressing technique as before, this time Ofu
weighted 187g. We assumed that this was due to the added bran that absorbed some of the water.
The whey weighed 1470g.
We calculated a yield of 10.4% Ofu from extracted oat milk which we considered a good one.
The amount of β-glucan present in the final Ofu were about 4 g, which is even more then the
recommended daily intake (3g per day).
Table 10: OFU composition g/100g
Dry matter 35.00
Protein 10.89
β-glucans 2.30
Figure 14: Ofu with bran added after dripping.
Comments: After pressing it has reached a compact shape, it is hard and brittle. The main
problem of this Ofu is represented by the great brittleness and lack of homogeneity probably due
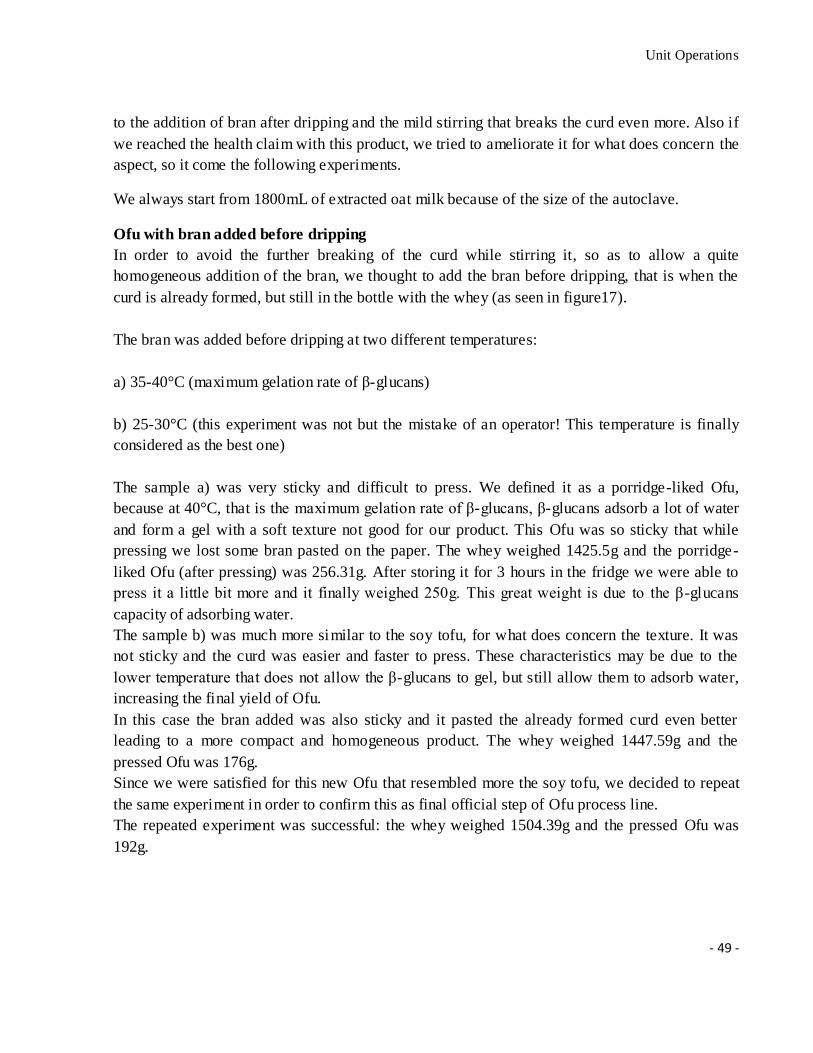
Unit Operations
- 49 -
to the addition of bran after dripping and the mild stirring that breaks the curd even more. Also if
we reached the health claim with this product, we tried to ameliorate it for what does concern the
aspect, so it come the following experiments.
We always start from 1800mL of extracted oat milk because of the size of the autoclave.
Ofu with bran added before dripping
In order to avoid the further breaking of the curd while stirring it, so as to allow a quite
homogeneous addition of the bran, we thought to add the bran before dripping, that is when the
curd is already formed, but still in the bottle with the whey (as seen in figure17).
The bran was added before dripping at two different temperatures:
a) 35-40°C (maximum gelation rate of β-glucans)
b) 25-30°C (this experiment was not but the mistake of an operator! This temperature is finally
considered as the best one)
The sample a) was very sticky and difficult to press. We defined it as a porridge-liked Ofu,
because at 40°C, that is the maximum gelation rate of β-glucans, β-glucans adsorb a lot of water
and form a gel with a soft texture not good for our product. This Ofu was so sticky that while
pressing we lost some bran pasted on the paper. The whey weighed 1425.5g and the porridge-
liked Ofu (after pressing) was 256.31g. After storing it for 3 hours in the fridge we were able to
press it a little bit more and it finally weighed 250g. This great weight is due to the β-glucans
capacity of adsorbing water.
The sample b) was much more similar to the soy tofu, for what does concern the texture. It was
not sticky and the curd was easier and faster to press. These characteristics may be due to the
lower temperature that does not allow the β-glucans to gel, but still allow them to adsorb water,
increasing the final yield of Ofu.
In this case the bran added was also sticky and it pasted the already formed curd even better
leading to a more compact and homogeneous product. The whey weighed 1447.59g and the
pressed Ofu was 176g.
Since we were satisfied for this new Ofu that resembled more the soy tofu, we decided to repeat
the same experiment in order to confirm this as final official step of Ofu process line.
The repeated experiment was successful: the whey weighed 1504.39g and the pressed Ofu was
192g.
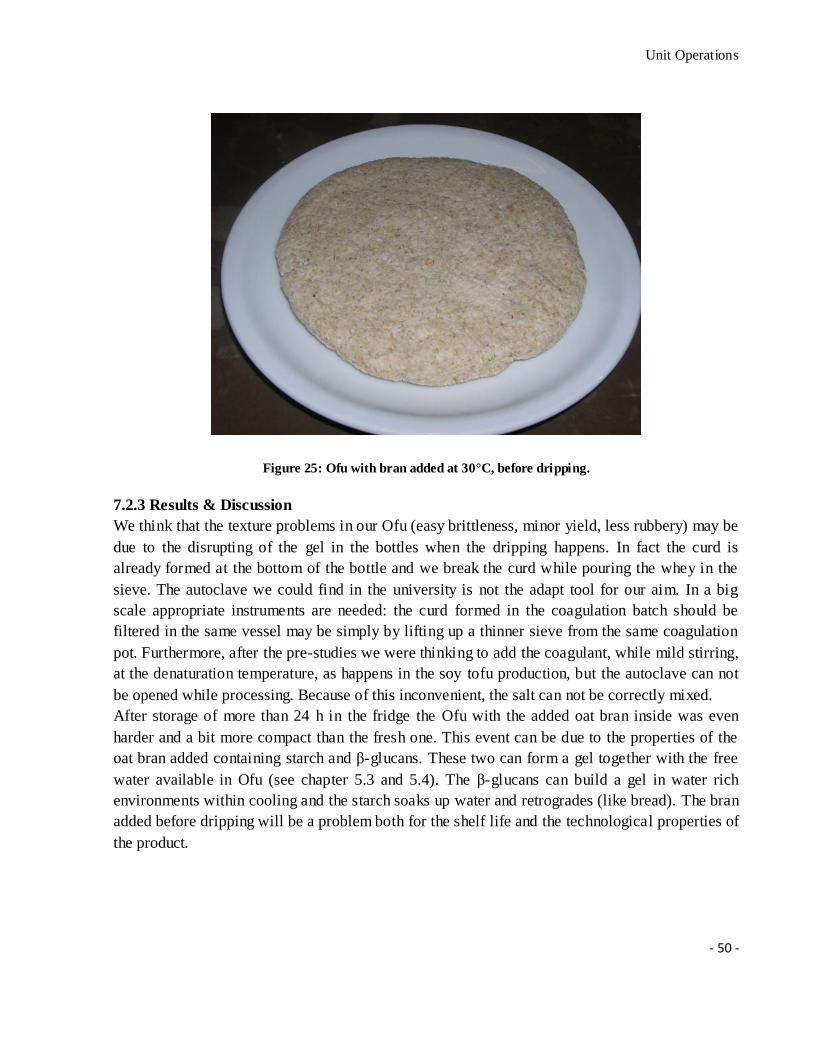
Unit Operations
- 50 -
Figure 25: Ofu with bran added at 30°C, before dripping.
7.2.3 Results & Discussion
We think that the texture problems in our Ofu (easy brittleness, minor yield, less rubbery) may be
due to the disrupting of the gel in the bottles when the dripping happens. In fact the curd is
already formed at the bottom of the bottle and we break the curd while pouring the whey in the
sieve. The autoclave we could find in the university is not the adapt tool for our aim. In a big
scale appropriate instruments are needed: the curd formed in the coagulation batch should be
filtered in the same vessel may be simply by lifting up a thinner sieve from the same coagulation
pot. Furthermore, after the pre-studies we were thinking to add the coagulant, while mild stirring,
at the denaturation temperature, as happens in the soy tofu production, but the autoclave can not
be opened while processing. Because of this inconvenient, the salt can not be correctly mixed.
After storage of more than 24 h in the fridge the Ofu with the added oat bran inside was even
harder and a bit more compact than the fresh one. This event can be due to the properties of the
oat bran added containing starch and β-glucans. These two can form a gel together with the free
water available in Ofu (see chapter 5.3 and 5.4). The β-glucans can build a gel in water rich
environments within cooling and the starch soaks up water and retrogrades (like bread). The bran
added before dripping will be a problem both for the shelf life and the technological properties of
the product.
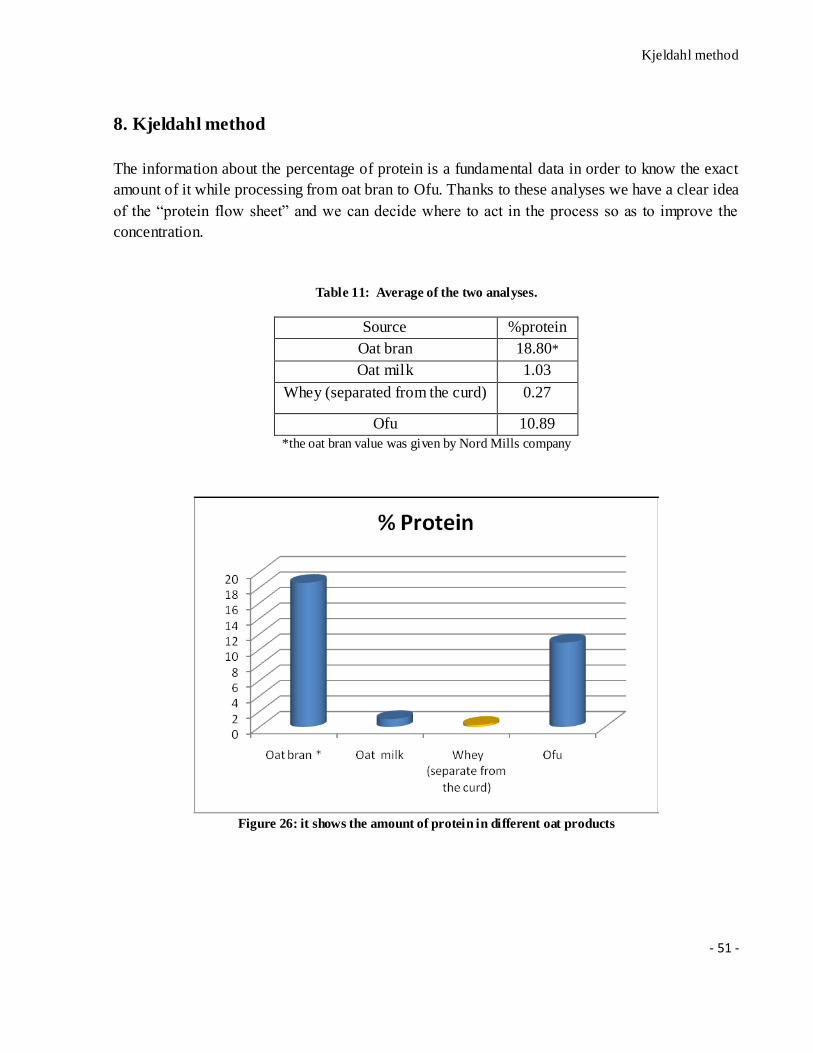
Kjeldahl method
- 51 -
8. Kjeldahl method
The information about the percentage of protein is a fundamental data in order to know the exact
amount of it while processing from oat bran to Ofu. Thanks to these analyses we have a clear idea
of the “protein flow sheet” and we can decide where to act in the process so as to improve the
concentration.
Table 11: Average of the two analyses.
Source %protein
Oat bran 18.80*
Oat milk 1.03
Whey (separated from the curd) 0.27
Ofu 10.89
*the oat bran value was given by Nord Mills company
Figure 26: it shows the amount of protein in different oat products
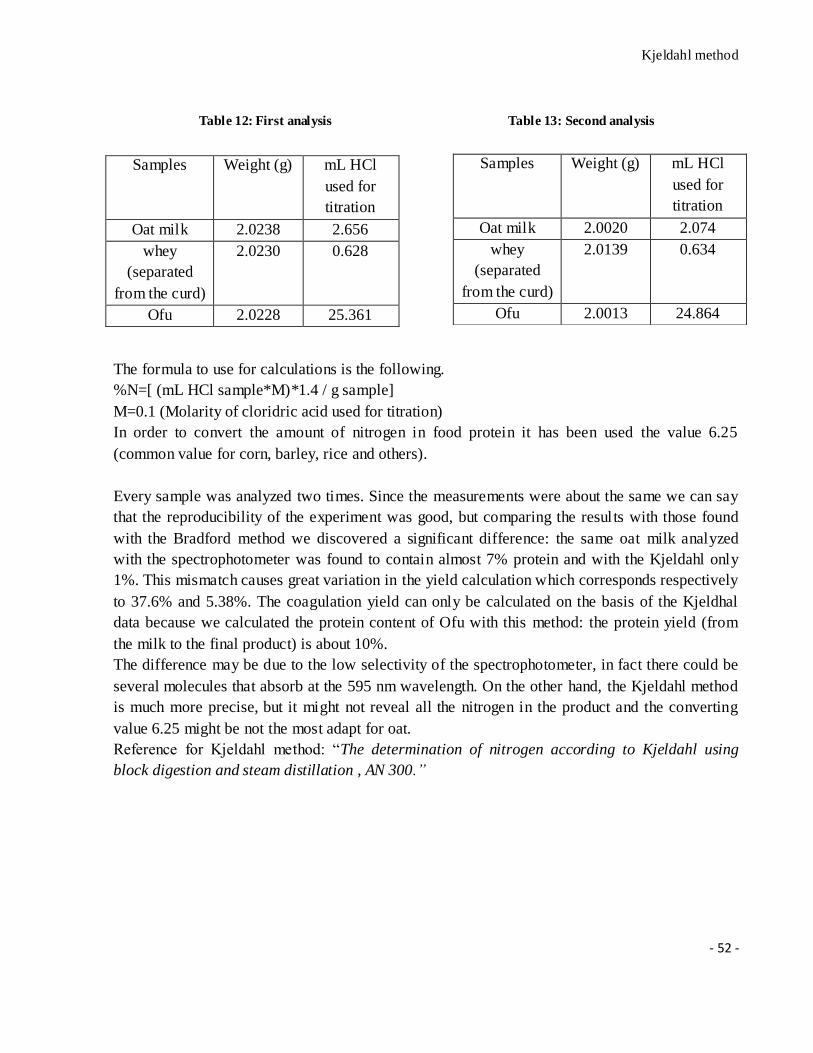
Kjeldahl method
- 52 -
Table 12: First analysis Table 13: Second analysis
The formula to use for calculations is the following.
%N=[ (mL HCl sample*M)*1.4 / g sample]
M=0.1 (Molarity of cloridric acid used for titration)
In order to convert the amount of nitrogen in food protein it has been used the value 6.25
(common value for corn, barley, rice and others).
Every sample was analyzed two times. Since the measurements were about the same we can say
that the reproducibility of the experiment was good, but comparing the results with those found
with the Bradford method we discovered a significant difference: the same oat milk analyzed
with the spectrophotometer was found to contain almost 7% protein and with the Kjeldahl only
1%. This mismatch causes great variation in the yield calculation which corresponds respectively
to 37.6% and 5.38%. The coagulation yield can only be calculated on the basis of the Kjeldhal
data because we calculated the protein content of Ofu with this method: the protein yield (from
the milk to the final product) is about 10%.
The difference may be due to the low selectivity of the spectrophotometer, in fact there could be
several molecules that absorb at the 595 nm wavelength. On the other hand, the Kjeldahl method
is much more precise, but it might not reveal all the nitrogen in the product and the converting
value 6.25 might be not the most adapt for oat.
Reference for Kjeldahl method: “The determination of nitrogen according to Kjeldahl using
block digestion and steam distillation , AN 300.”
Samples Weight (g) mL HCl
used for
titration
Oat milk 2.0238 2.656
whey
(separated
from the curd)
2.0230 0.628
Ofu 2.0228 25.361
Samples Weight (g) mL HCl
used for
titration
Oat milk 2.0020 2.074
whey
(separated
from the curd)
2.0139 0.634
Ofu 2.0013 24.864
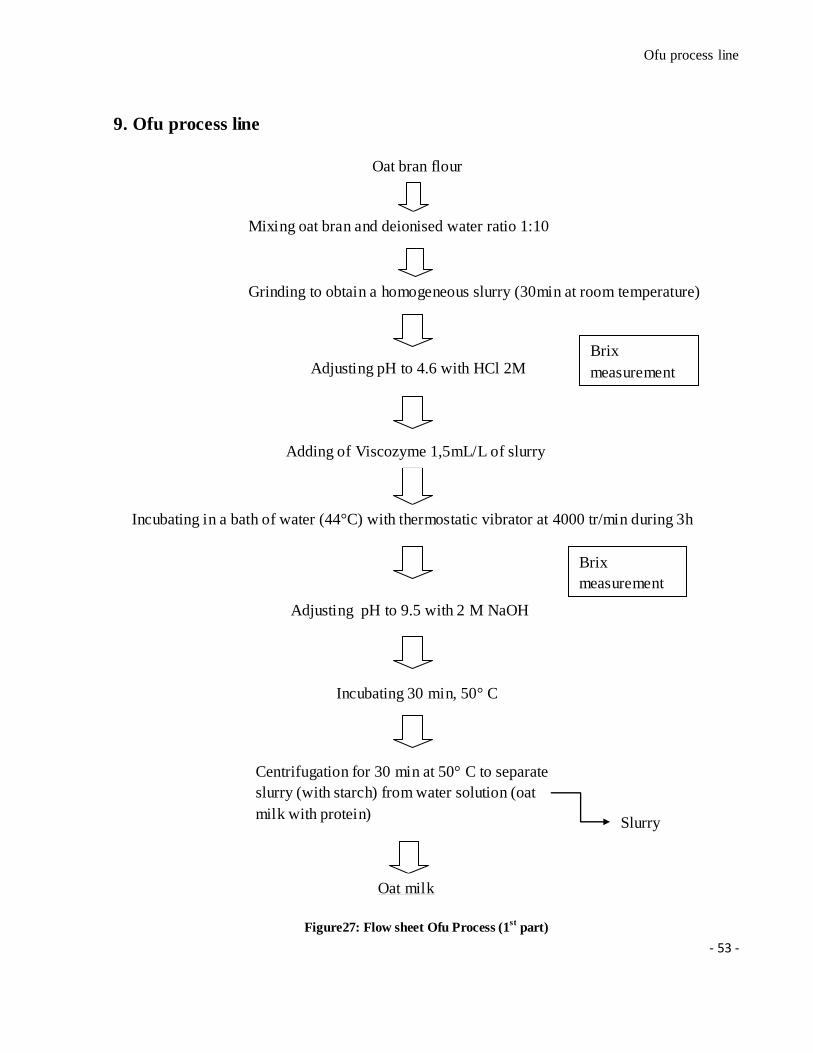
Ofu process line
- 53 -
9. Ofu process line
Figure27: Flow sheet Ofu Process (1st
part)
Brix
measurement
Oat bran flour
Mixing oat bran and deionised water ratio 1:10
Grinding to obtain a homogeneous slurry (30min at room temperature)
Centrifugation for 30 min at 50° C to separate
slurry (with starch) from water solution (oat
milk with protein)
Adjusting pH to 4.6 with HCl 2M
Incubating 30 min, 50° C
Adjusting pH to 9.5 with 2 M NaOH solution
Incubating in a bath of water (44°C) with thermostatic vibrator at 4000 tr/min during 3h
Adding of Viscozyme 1,5mL/L of slurry
Brix
measurement
Oat milk
Slurry
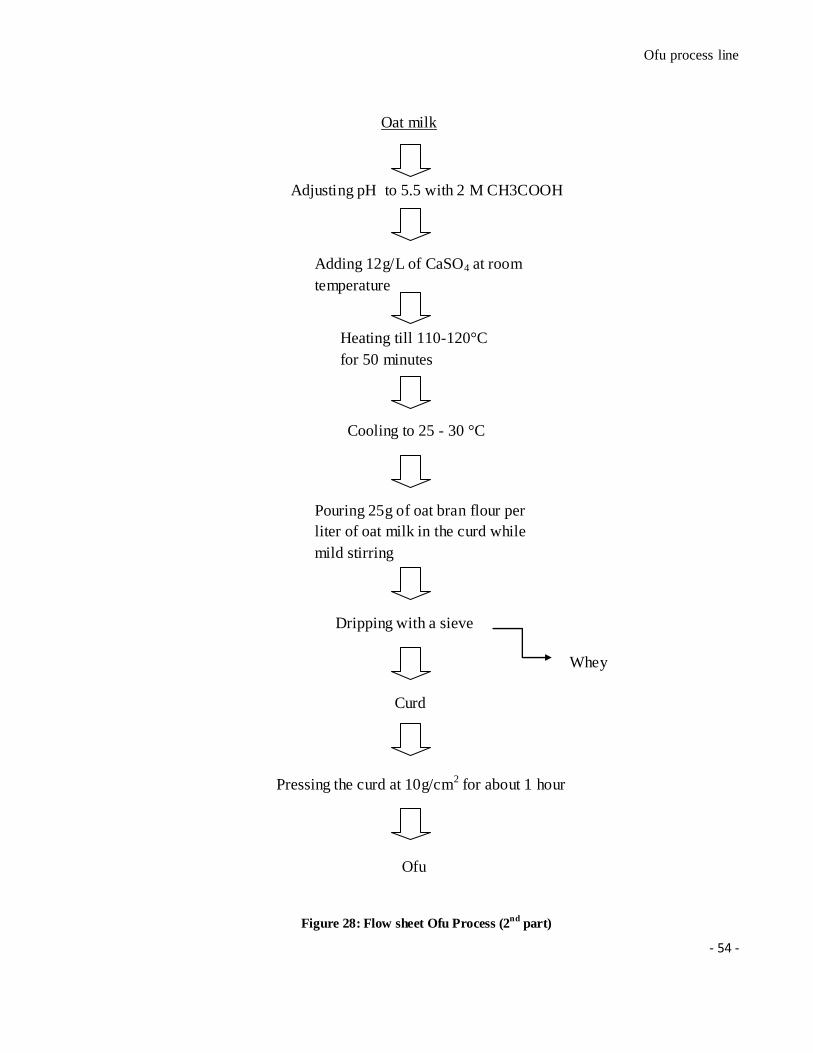
Ofu process line
- 54 -
Oat milk
Figure 28: Flow sheet Ofu Process (2nd
part)
Adjusting pH to 5.5 with 2 M CH3COOH
Adding 12g/L of CaSO4 at room
temperature
Heating till 110-120°C
for 50 minutes
Pouring 25g of oat bran flour per
liter of oat milk in the curd while
mild stirring
Dripping with a sieve
Pressing the curd at 10g/cm2 for about 1 hour
Ofu
Cooling to 25 - 30 °C
Whey
Curd
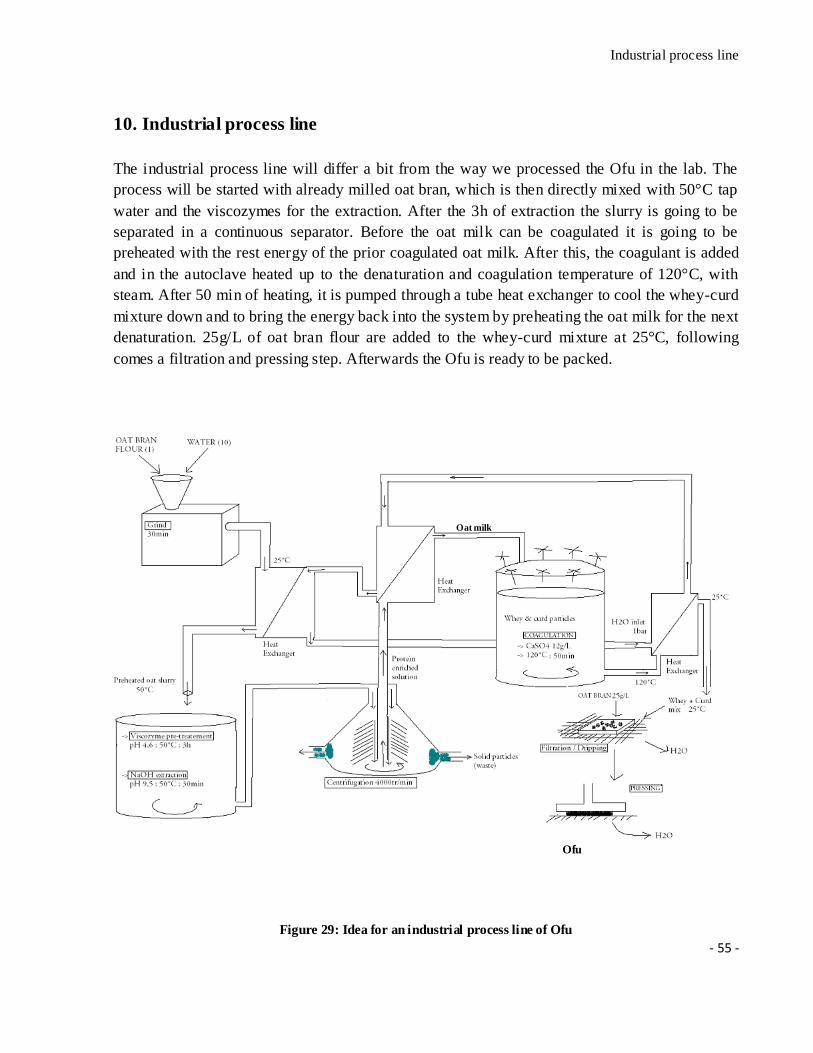
Industrial process line
- 55 -
10. Industrial process line
The industrial process line will differ a bit from the way we processed the Ofu in the lab. The
process will be started with already milled oat bran, which is then directly mixed with 50°C tap
water and the viscozymes for the extraction. After the 3h of extraction the slurry is going to be
separated in a continuous separator. Before the oat milk can be coagulated it is going to be
preheated with the rest energy of the prior coagulated oat milk. After this, the coagulant is added
and in the autoclave heated up to the denaturation and coagulation temperature of 120°C, with
steam. After 50 min of heating, it is pumped through a tube heat exchanger to cool the whey-curd
mixture down and to bring the energy back into the system by preheating the oat milk for the next
denaturation. 25g/L of oat bran flour are added to the whey-curd mixture at 25°C, following
comes a filtration and pressing step. Afterwards the Ofu is ready to be packed.
Figure 29: Idea for an industrial process line of Ofu
Oat milk
Ofu
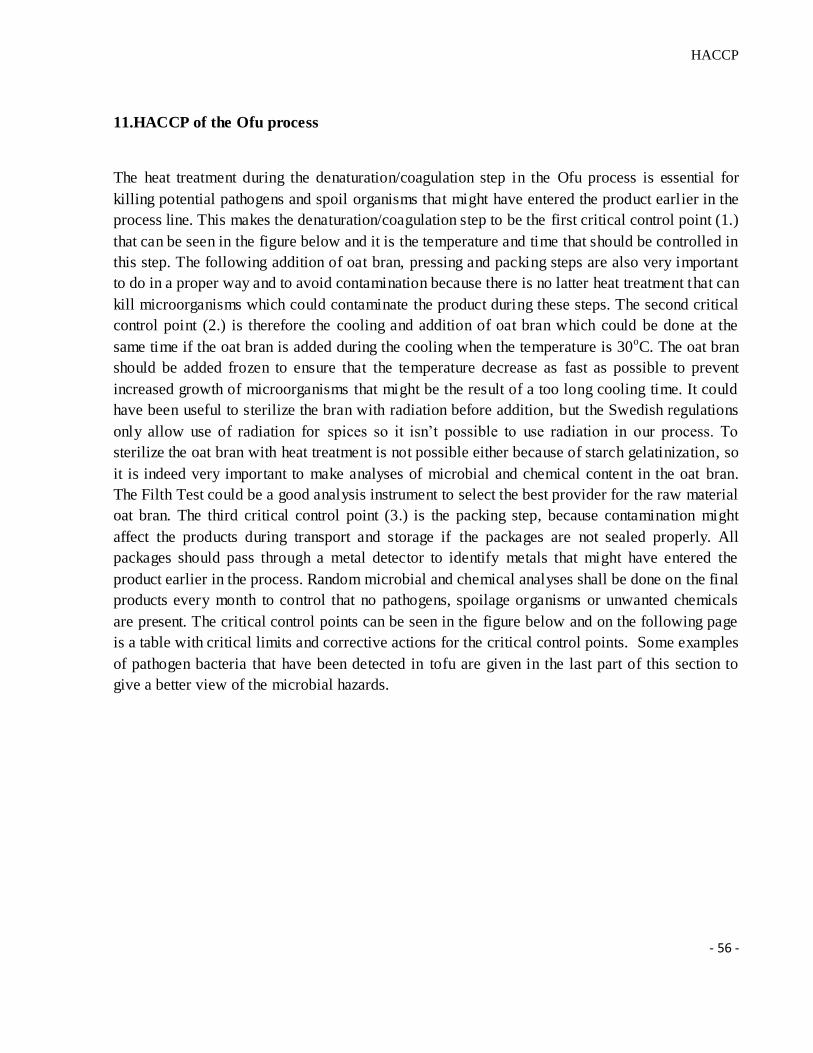
HACCP
- 56 -
11.HACCP of the Ofu process
The heat treatment during the denaturation/coagulation step in the Ofu process is essential for
killing potential pathogens and spoil organisms that might have entered the product earlier in the
process line. This makes the denaturation/coagulation step to be the first critical control point (1.)
that can be seen in the figure below and it is the temperature and time that should be controlled in
this step. The following addition of oat bran, pressing and packing steps are also very important
to do in a proper way and to avoid contamination because there is no latter heat treatment that can
kill microorganisms which could contaminate the product during these steps. The second critical
control point (2.) is therefore the cooling and addition of oat bran which could be done at the
same time if the oat bran is added during the cooling when the temperature is 30oC. The oat bran
should be added frozen to ensure that the temperature decrease as fast as possible to prevent
increased growth of microorganisms that might be the result of a too long cooling time. It could
have been useful to sterilize the bran with radiation before addition, but the Swedish regulations
only allow use of radiation for spices so it isn’t possible to use radiation in our process. To
sterilize the oat bran with heat treatment is not possible either because of starch gelatinization, so
it is indeed very important to make analyses of microbial and chemical content in the oat bran.
The Filth Test could be a good analysis instrument to select the best provider for the raw material
oat bran. The third critical control point (3.) is the packing step, because contamination might
affect the products during transport and storage if the packages are not sealed properly. All
packages should pass through a metal detector to identify metals that might have entered the
product earlier in the process. Random microbial and chemical analyses shall be done on the final
products every month to control that no pathogens, spoilage organisms or unwanted chemicals
are present. The critical control points can be seen in the figure below and on the following page
is a table with critical limits and corrective actions for the critical control points. Some examples
of pathogen bacteria that have been detected in tofu are given in the last part of this section to
give a better view of the microbial hazards.
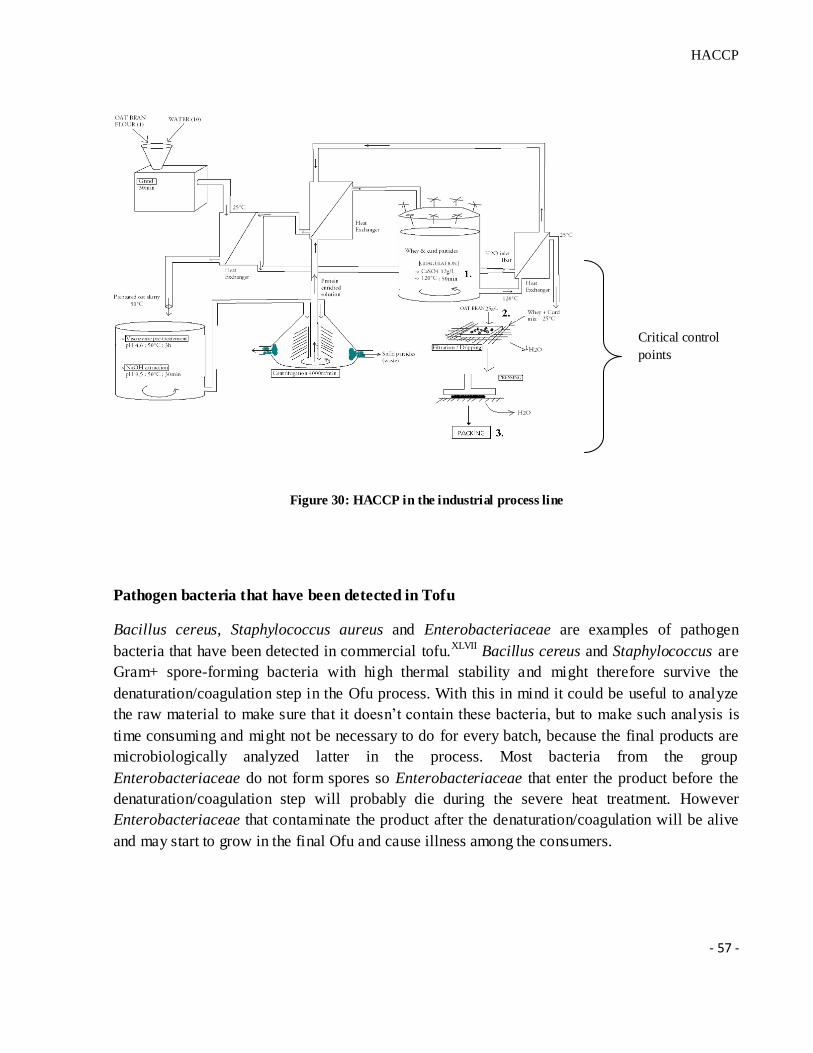
HACCP
- 57 -
Figure 30: HACCP in the industrial process line
Pathogen bacteria that have been detected in Tofu
Bacillus cereus, Staphylococcus aureus and Enterobacteriaceae are examples of pathogen
bacteria that have been detected in commercial tofu.XLVII Bacillus cereus and Staphylococcus are
Gram+ spore-forming bacteria with high thermal stability and might therefore survive the
denaturation/coagulation step in the Ofu process. With this in mind it could be useful to analyze
the raw material to make sure that it doesn’t contain these bacteria, but to make such analysis is
time consuming and might not be necessary to do for every batch, because the final products are
microbiologically analyzed latter in the process. Most bacteria from the group
Enterobacteriaceae do not form spores so Enterobacteriaceae that enter the product before the
denaturation/coagulation step will probably die during the severe heat treatment. However
Enterobacteriaceae that contaminate the product after the denaturation/coagulation will be alive
and may start to grow in the final Ofu and cause illness among the consumers.
Critical control
points
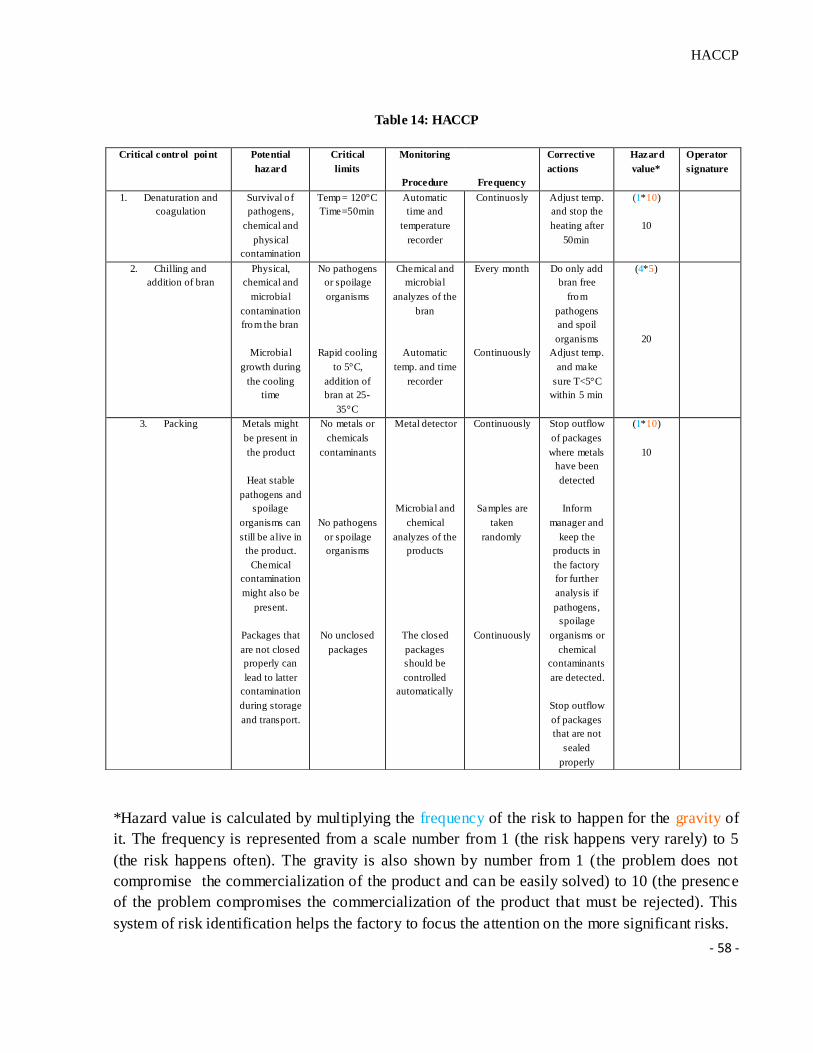
HACCP
- 58 -
Table 14: HACCP
*Hazard value is calculated by multiplying the frequency of the risk to happen for the gravity of
it. The frequency is represented from a scale number from 1 (the risk happens very rarely) to 5
(the risk happens often). The gravity is also shown by number from 1 (the problem does not
compromise the commercialization of the product and can be easily solved) to 10 (the presence
of the problem compromises the commercialization of the product that must be rejected). This
system of risk identification helps the factory to focus the attention on the more significant risks.
Critical control point Potential
hazard
Critical
limits
Monitoring
Procedure
Frequency
Corrective
actions
Hazard
value*
Operator
signature
1. Denaturation and
coagulation
Survival o f
pathogens,
chemical and
physical
contamination
Temp= 120°C
Time=50min
Automatic
time and
temperature
recorder
Continuosly Adjust temp.
and stop the
heating after
50min
(1*10)
10
2. Chilling and
addition of bran
Physical,
chemical and
microbial
contamination
from the bran
Microbial
growth during
the cooling
time
No pathogens
or spoilage
organisms
Rapid cooling
to 5°C,
addition of
bran at 25-
35°C
Chemical and
microbial
analyzes of the
bran
Automatic
temp. and time
recorder
Every month
Continuously
Do only add
bran free
from
pathogens
and spoil
organisms
Adjust temp.
and make
sure T<5°C
within 5 min
(4*5)
20
3. Packing Metals might
be present in
the product
Heat stable
pathogens and
spoilage
organisms can
still be alive in
the product.
Chemical
contamination
might also be
present.
Packages that
are not closed
properly can
lead to latter
contamination
during storage
and transport.
No metals or
chemicals
contaminants
No pathogens
or spoilage
organisms
No unclosed
packages
Metal detector
Microbial and
chemical
analyzes of the
products
The closed
packages
should be
controlled
automatically
Continuously
Samples are
taken
randomly
Continuously
Stop outflow
of packages
where metals
have been
detected
Inform
manager and
keep the
products in
the factory
for further
analysis if
pathogens,
spoilage
organisms or
chemical
contaminants
are detected.
Stop outflow
of packages
that are not
sealed
properly
(1*10)
10
Sensorial & Rheological Analysis
- 59 -
12. Sensorial & Rheological Analysis
Sensorial analyses are the most important analyses to be done before launching new food
products on the market. These analyses should be done also before processing a new food in
order to know what the most of the consumers expect from it and what they dislike about the
products already found on the shelves. There are several tests available for the sensorial analyses,
but since we managed to obtain the product at the very end of our time plan we only did two
descriptive analyses in the sensorial laboratory.
First, we decided to compare our Ofu, obtained with the final process without bran added and not
pressed, with the most common type of tofu found in the supermarket (“Tofu Naturell Kung
Markatta”)* and to evaluate the textural attributes of it. Then we compared the same Ofu, but
pressed and the same soy tofu.
*Ingredients: water, soybeans, nigari (magnesium chloride)
Table 15: Nutritional composition for 100g of Tofu*
Energy 510kJ/122kcal
Protein 14.2 g
Carbohydrate 1.0 g
Fat 7.2 g
First, we sit together in order to describe the attributes and give examples so as to make sure that
everybody understood the same meaning for each of it. This step took the most of the time
because the components of the Ofu project come from different countries with different food
habits, but at the end we reach the task.
The attributes were chosen among the most common for tofu panellists. We use the 0 to 10 scale,
where 0 = absence of attribute and 10 = maximum of attribute. After the texture analysis
everybody wrote comments about taste and ideas in order to change something in the process
line.
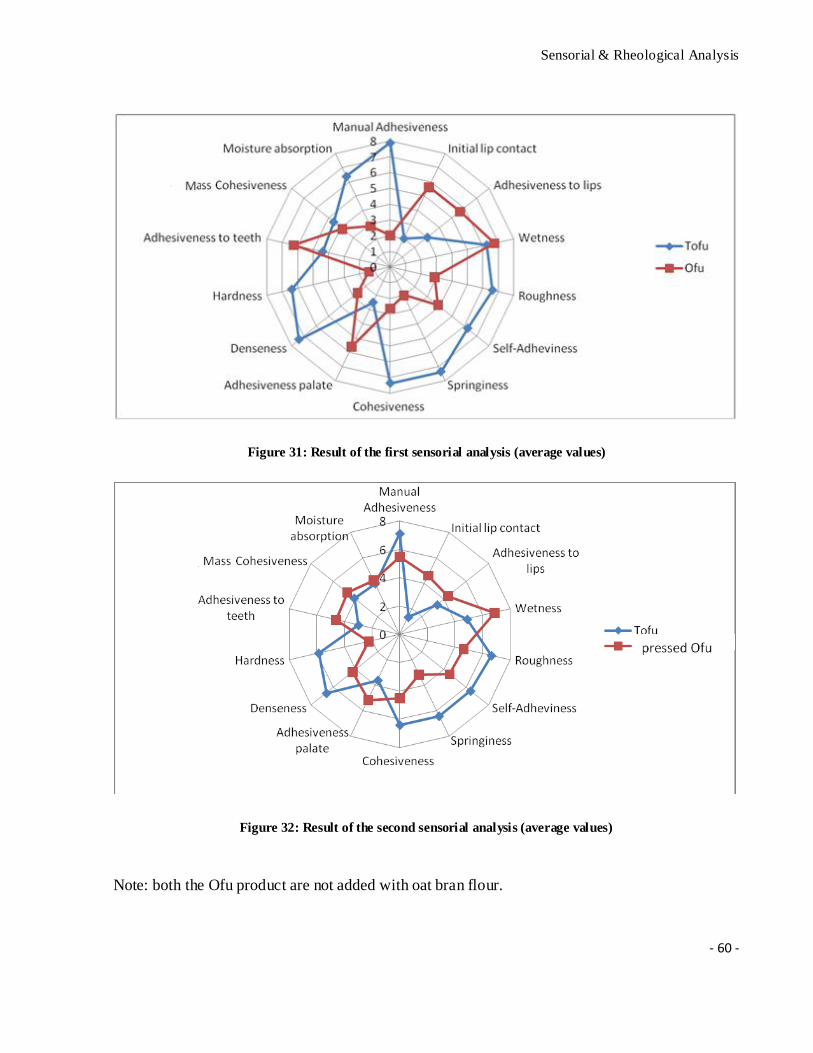
Sensorial & Rheological Analysis
- 60 -
Figure 31: Result of the first sensorial analysis (average values)
Figure 32: Result of the second sensorial analysis (average values)
Note: both the Ofu product are not added with oat bran flour.
Sensorial & Rheological Analysis
- 61 -
Results and discussion
Main differences between Tofu and Ofu
The differences between Tofu and Ofu are relevant for every attributes except for wetness and
mass cohesiveness, in fact the two products looked very different. Almost all the panellists
recognized a sour-bitter taste in Ofu probably due to the whey (containing calcium sulphate) still
present in the product because of the missing pressing operation.
Main differences between Tofu and pressed Ofu
As we can see from the spider plots (average values), there is much more similarity between the
pressed Ofu and the Tofu compared with the first analysis. All the attributes have quite similar
values except for hardness, springiness and initial lip contact. It is good to highlight that our Ofu
is always more wet, but if the wetness in the first experiment was depending on the missing
pressing operation, the pressed Ofu is still too wet because it was stored 24h under water in the
fridge. In fact the Ofu after pressing was hard and almost dry, surely drier than the normal tofu.
This kind of storing is common for tofu, but cannot be used in our case. The gel out of oat is not
so compact to be stored under water probably because of its composition higher in
polysaccharides and lower in protein.
We can observe that the panellists gave almost the same values for the normal tofu during the two
experiments, except for the attribute moisture absorption. This non conformity may be a mistake,
but we think it must be due to the will of the panellists to show the great difference between the
two Ofu products. These tests have highlighted the importance of pressing the Ofu in a correct
way that can be considered a critical and fundamental operation.
During the second experiment the panellists had also to evaluate the bitterness and oatness/cereal
taste of the samples. These two descriptors were chosen after the first experiment and well
explained to all the panellists.
We chose two different kinds of parameters for sensorial evaluation: “bitterness” and
“oatness/cereal” because they seem to be the most intensive flavors present in both products.
We decided not to consider the classic “wet-paper taste” because this aroma is present only in the
tofu based on soybean and not in ours, so it would have been useless take this flavoring if it is not
present in our product. Moreover we consider the “paper” taste like a negative characteristic and
so for us it is just important to know that in our product there is not any trace.
The results show that between the two samples, tofu and our product Ofu, the latter seems to be
more tasted. Hence we don´t want to say that our product is better or should be more pleasant. On
the other hand we think that producing something with an aroma it could be easier to change it in
order to raise or reduce the characteristic which we wish.
The panellists decided to focus only on two descriptors because of the difficulty of evaluating a
product like tofu, which has an almost neutral taste.
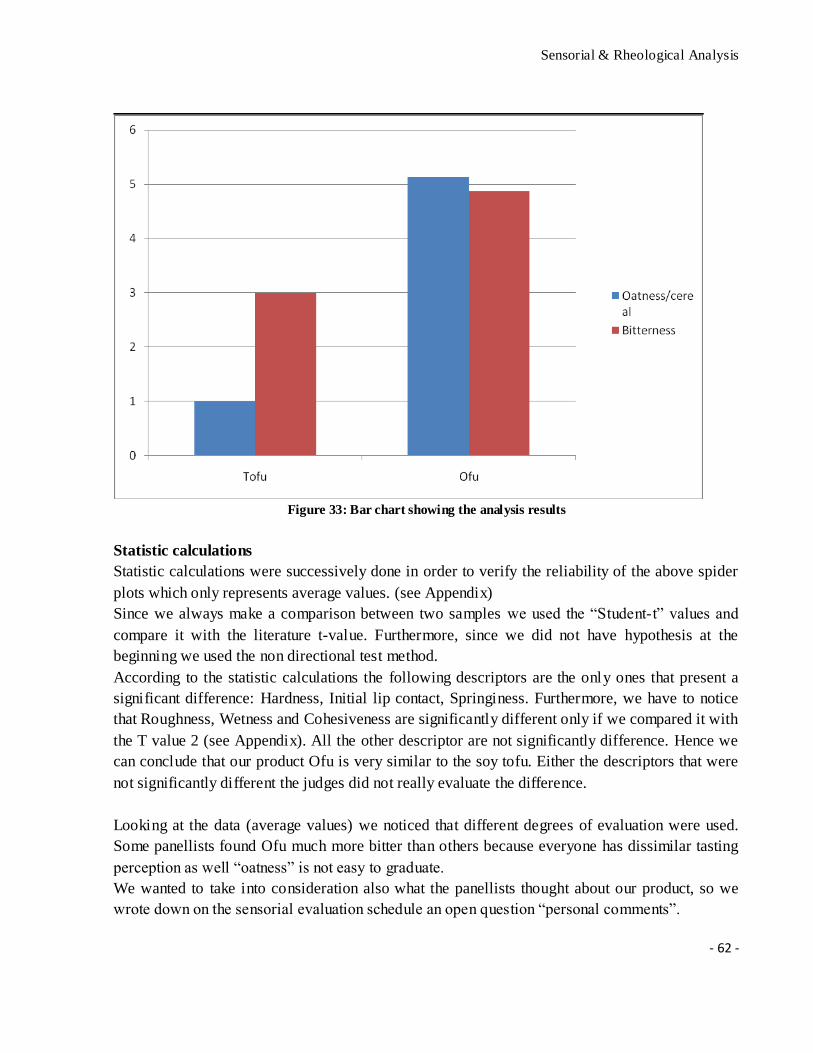
Sensorial & Rheological Analysis
- 62 -
Figure 33: Bar chart showing the analysis results
Statistic calculations
Statistic calculations were successively done in order to verify the reliability of the above spider
plots which only represents average values. (see Appendix)
Since we always make a comparison between two samples we used the “Student-t” values and
compare it with the literature t-value. Furthermore, since we did not have hypothesis at the
beginning we used the non directional test method.
According to the statistic calculations the following descriptors are the only ones that present a
significant difference: Hardness, Initial lip contact, Springiness. Furthermore, we have to notice
that Roughness, Wetness and Cohesiveness are significantly different only if we compared it with
the T value 2 (see Appendix). All the other descriptor are not significantly difference. Hence we
can conclude that our product Ofu is very similar to the soy tofu. Either the descriptors that were
not significantly different the judges did not really evaluate the difference.
Looking at the data (average values) we noticed that different degrees of evaluation were used.
Some panellists found Ofu much more bitter than others because everyone has dissimilar tasting
perception as well “oatness” is not easy to graduate.
We wanted to take into consideration also what the panellists thought about our product, so we
wrote down on the sensorial evaluation schedule an open question “personal comments”.
Sensorial & Rheological Analysis
- 63 -
In this way, every member of the group had the possibility to take down their own opinions about
Ofu. It was perceived a bit rough, with a sandy taste/texture. This kind of question and the
following notes are very important in order to improve both the quality and the marketing
strategy (advertising, distribution, etc.)
Sensorial analysis statistic interpretations
In order to verify the reliability of our sensorial analysis we elaborated the results by using the
statistic calculations. (see Appendix)
We observed that it doesn’t exist a significance difference between the two samples for what does
concern the bitterness, while it exists for the oatness, in fact Ofu is made of oat.
Rheological analysis
We have analyzed both soy tofu and our final product, Ofu with bran added at 30°C before
dripping, in order to compare their texture and how they respond when a force is applied. We
have used “Stable Micro System – Texture Expert Exceed” machine, “TAXT2i®” (see
Appendix). The two samples were prepared making sure that they had the same shape: 1cm width
and 3 cm height. The aim of this analysis is to notice how much force (N = Newton) should be
applied in order to break the sample. The distance (mm) represents the path run from the weight
while pressing.
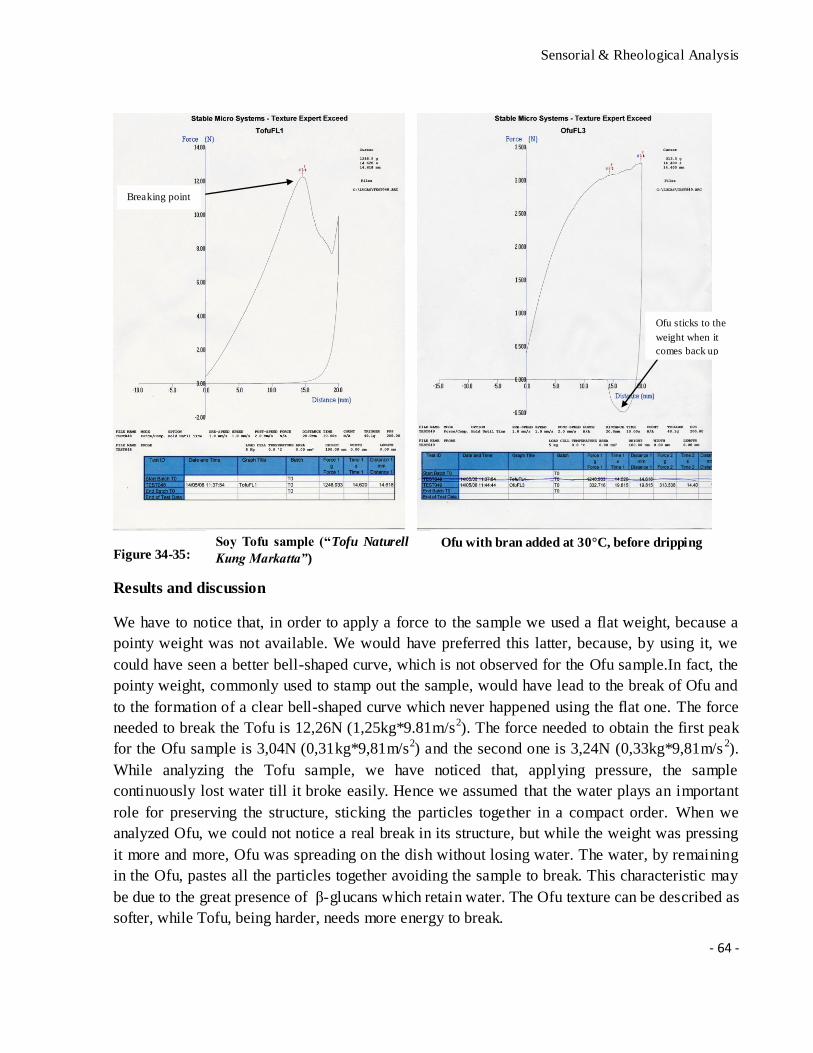
Sensorial & Rheological Analysis
- 64 -
Figure 34-35:
Results and discussion
We have to notice that, in order to apply a force to the sample we used a flat weight, because a
pointy weight was not available. We would have preferred this latter, because, by using it, we
could have seen a better bell-shaped curve, which is not observed for the Ofu sample.In fact, the
pointy weight, commonly used to stamp out the sample, would have lead to the break of Ofu and
to the formation of a clear bell-shaped curve which never happened using the flat one. The force
needed to break the Tofu is 12,26N (1,25kg*9.81m/s2). The force needed to obtain the first peak
for the Ofu sample is 3,04N (0,31kg*9,81m/s2) and the second one is 3,24N (0,33kg*9,81m/s 2).
While analyzing the Tofu sample, we have noticed that, applying pressure, the sample
continuously lost water till it broke easily. Hence we assumed that the water plays an important
role for preserving the structure, sticking the particles together in a compact order. When we
analyzed Ofu, we could not notice a real break in its structure, but while the weight was pressing
it more and more, Ofu was spreading on the dish without losing water. The water, by remaining
in the Ofu, pastes all the particles together avoiding the sample to break. This characteristic may
be due to the great presence of β-glucans which retain water. The Ofu texture can be described as
softer, while Tofu, being harder, needs more energy to break.
Ofu sticks to the
weight when it
comes back up
Breaking point
Soy Tofu sample (“Tofu Naturell
Kung Markatta”) Ofu with bran added at 30°C, before dripping
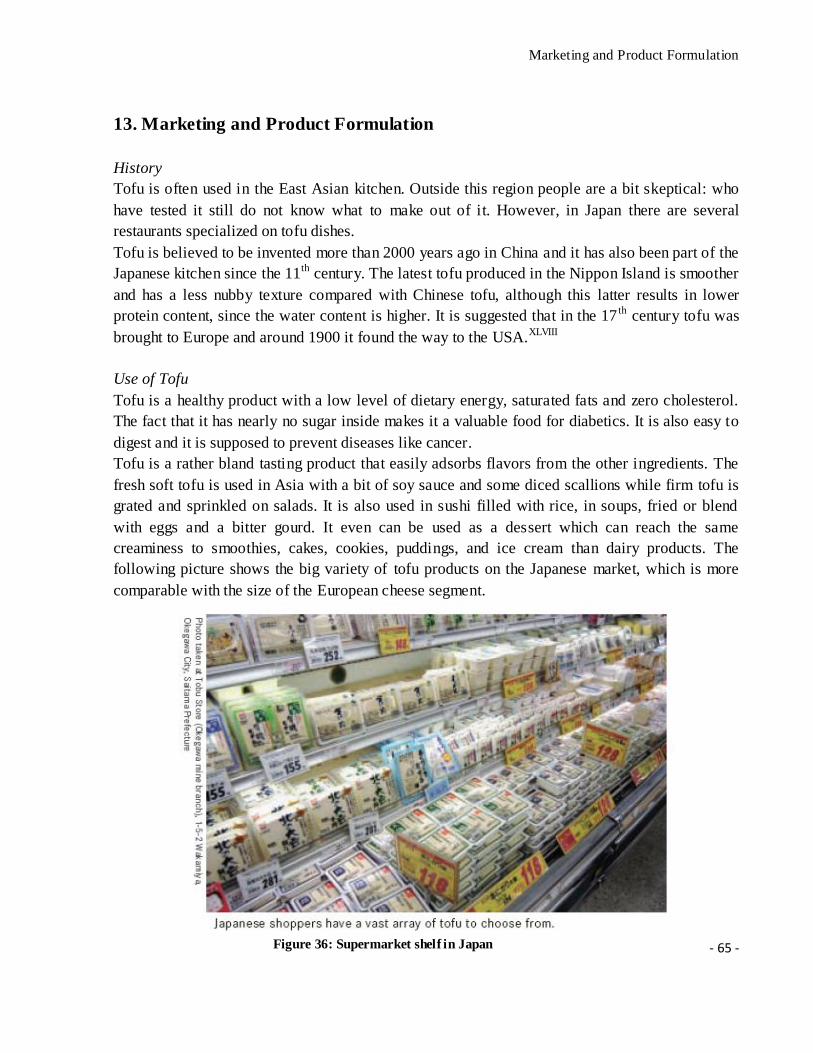
Marketing and Product Formulation
- 65 -
13. Marketing and Product Formulation
History
Tofu is often used in the East Asian kitchen. Outside this region people are a bit skeptical: who
have tested it still do not know what to make out of it. However, in Japan there are several
restaurants specialized on tofu dishes.
Tofu is believed to be invented more than 2000 years ago in China and it has also been part of the
Japanese kitchen since the 11th century. The latest tofu produced in the Nippon Island is smoother
and has a less nubby texture compared with Chinese tofu, although this latter results in lower
protein content, since the water content is higher. It is suggested that in the 17 th century tofu was
brought to Europe and around 1900 it found the way to the USA.XLVIII
Use of Tofu
Tofu is a healthy product with a low level of dietary energy, saturated fats and zero cholesterol.
The fact that it has nearly no sugar inside makes it a valuable food for diabetics. It is also easy to
digest and it is supposed to prevent diseases like cancer.
Tofu is a rather bland tasting product that easily adsorbs flavors from the other ingredients. The
fresh soft tofu is used in Asia with a bit of soy sauce and some diced scallions while firm tofu is
grated and sprinkled on salads. It is also used in sushi filled with rice, in soups, fried or blend
with eggs and a bitter gourd. It even can be used as a dessert which can reach the same
creaminess to smoothies, cakes, cookies, puddings, and ice cream than dairy products. The
following picture shows the big variety of tofu products on the Japanese market, which is more
comparable with the size of the European cheese segment.
Figure 36: Supermarket shelf in Japan
Marketing and Product Formulation
- 66 -
Package on the European market
Tofu can be found rather rare in supermarket shelves in Europe in the segment of dietary
products mostly next to cheese. It might be a reason that the traditional soy milk has a beany taste
which is well accepted in Asia, but less by the Western palate. It is mostly sold in water -filled
packs or in aseptic cartons and should be refrigerated until use. By using fresh tofu the water
should be drained and changed daily, so the tofu lasts for one week. Tofu can be frozen for up to
three months. Freezing will change its texture making the tofu slightly chewier.
Ofu
Our product, made of oat has a lot of healthy similarities with the established soy tofu, but at the
same time it is a totally different product. First of all the raw material oat can be cultivated in
almost all European countries which reduces the transport costs respecting the environment.
Furthermore oat is much cheaper than soy beans with 0.16 € per kg oat (336 USc/US bushel date:
16.01.2008) and 0.32 € per kg soybean (1286 USc /US bushel date: 16.01.2008).
The costumers feel important that oat grows in Europe and is not genetically modified unlike
soybeans which have the trait of herbicide tolerance.XLIX Soy tofu sold in EU is nearly one
hundred % bonded (just Italy cultivates soya), because of the fact that almost all soybeans used
for processing in Europe are imported).L
Oat is known as non-allergic (see chapter 3.2), unlike to soy, known as a strong allergen with
estimated prevalence of about 0.5% in the general population. Soy allergy can affect all common
allergy target organs such as the gastrointestinal tract, respiratory tract and the skin and can also
cause systemic anaphylaxis.LI
The protein quality of oats is, with a chemical score of 57, greatly higher than a score of 47
within soya beans compared to the reference of egg with a score of 100. (Hereby compare the
essential amino acid profile of a number of proteins to the amount of each essential amino acid in
egg albumen. The essential amino acid which is lowest in quantity in the protein of interest is
compared to the quantity of that amino acid in egg protein, and its chemical score is then
calculated.) Our product should also be easy to digest because it has a similarity to soy protein in
tofu and egg protein, which have the following digestibility: egg 98 and soy bean 95. LII It
consists also the indigestible component β-glucan which is a dietary fiber (see chapter 5.3). This
dietary fibers are in an amount of 2,30g per 100g Ofu product which is correspondent to the
health claims of US Code of Federal Regulations, 21 CFR 101.81.
Product Claims, Labeling & Packaging
Claim for β-glucans
The claim on the package for β-glucans as soluble fibers as described in US Code 21 CFR
101.81, can be done in different ways. We decided to have the following words on the package:
Marketing and Product Formulation
- 67 -
“Diets low in saturated fat and cholesterol that includes 3 grams of soluble fiber per day from β-
glucans may reduce the risk of heart disease. One serving (150g) of OFU provides more than 3
grams of this soluble fiber.” LIII
Claim for calcium content
To be allowed to label a product high in calcium it needs to contain at least 15% of the daily
recommended calcium intake of 800mg, which are at least 120 mg per portion of the labeling
product. The claim should be fulfilled within Ofu, because of using an amount of 12g of calcium
sulfate for the coagulation of one liter oat milk. To find out how much calcium is in the Ofu gel
and not left in the whey a test must be performed.LIV
A possible claim to use is:
“Regular exercise and a healthy diet with enough calcium helps teen and young adult to maintain
good bone health and may reduce their high risk of osteoporosis later in life.” LV
Gluten free claim
Claim for being gluten free might be possible, but therefore further studies must be done to
estimate the amount of gluten in the Ofu product as in the raw material. By changing the oat
variety it might be possible to be able to get a gluten free claim.
For the purpose of this standard, gluten-free means that the total nitrogen content of the gluten-
containing cereal grains used in the product does not exceed 0.05 g per 100 g of these grains on a
dry matter basis. LVI
Labeling with the keyhole symbol
Ofu is low in fat, low in sugar, low in sodium and rich in dietary fibers so that should be allowed
to label our product with the keyhole symbol. The problem hereby is that it is hard to put it into
one of the foodstuff categories concerning to the public papers from SLV (Livsmedelverket). The
most suitable category is “Fermented milk products and the equivalent products wholly or
partially of vegetable origin and not covered under items 1 – 3” (items 1-3: Skimmed milk and
other low-fat milk | Flavored fermented milk products without sweeteners | Vegetable products
without sweeteners intended).
“The products may contain added flavorings and shall primarily be intended for cooking.”
The allowed nutritional values for within this foodstuff are a maximum fat content of 5 g/100g,
no refined mono- and disaccharides added and no added sodium.
The Ofu product fulfils all these characteristics. LVII
Labeling with KRAV eco-label
It would be good to label the product with the KRAV eco-label, which guarantees that the
product is organically produced. To get this Swedish well accepted label it is most important to
get the right raw material.
Marketing and Product Formulation
- 68 -
The Keyhole symbol and the Krav eco-label are two Swedish symbols recognized by the Swedish
food authorities. Since the product was meant to be launched in the Scandinavian market, it is
important to consider them.
Kosher certification
The Jewish Halacha says that a food product is kosher, if it is produced in a certain way, mostly
animal product clean. Due to the fact that during Ofu processing no animal products are used, we
should be able to obtain also this label. The oat milk produced from Oatly AB has this
certification and it can be considered one of the most similar processed kosher oat products on
the market.
Marketing of OFU – products
Ofu will be a complete new product on the market which open the floodgates to place it on the
shelves. It is just in the beginning of its development, so that not all the possible products and
processing options are used. For instance it is possible to change the hardness of the tofu gel
which leads to several totally different possibilities of products.
Here are several examples to show how Ofu products can be placed into several market segments
as a healthy product in the medium-upper price segment to get advertisement from the customer:
- As “oat protein balls” mainly as a snack, may be designed for children
- As protein bars or also balls for sportsman may covered with chocolate
- As an alternative to normal harder soy tofu
- Flavored with cinnamon, raisins, honey or nuts as a snack
- For astronauts or outdoor sports to get proteins may be also in a freeze-dried form
- Added in Muesli in form of small freeze-dried balls or cubes
The idea within having it in balls is simply explained within several words. First of all , it is a
shape not commonly used within the food industry and makes it thereby to a special product (e.g.
pralines). Moreover, since fruits are quite often in a round shape, Ofu could easily be associated
with health. The “Chockladbullar” is very spread in the Swedish market: it is a well appreciated
chocolate ball fill with oat. In this case the chocolate Ofu can be a valid competitive product for
the sweet snacks, but with the additional health effects. The Ofu has a slightly taste of oat, which
places Ofu more in the cereal segment or in the category of healthy products. If it is flavored, it
could also be possible to process it softer with a similar texture to yogurt.
Shelf-life
The Product is initially high temperature processed (denaturation, coagulation step), but the
added oat bran (and/ or other products like raisins) for the fulfilling of the health claim (US Code
21 CFR 101.81) gives to the product a high risk of bacterial growth. The oat bran is added at a
time where the almost ready Ofu has a temperature of about 30°C, so it will be a hazard point for
Marketing and Product Formulation
- 69 -
our process (see HACCP). Depending on the desirable texture the water content can be another
factor for a decreased shelf-life (high water activity).
For simulating the storage time, a shelf-life test should be performed such as in several heating
and cooling cycles. A shelf-life of 1 month (as it is for normal soy tofu) can be reasonable to
expect by using adequate under vacuum package and refrigerated conditions. Depending on
placing the product in the market it would be good to shorten the shelf-life due to the fact that it
simulates a fresher and also healthier product.
Labeling of the package
Nutrition facts will fit on the backside of the package as well as the health claims. On the front
side of the package will fit the brand, the keyhole symbol, the KRAV symbol and all other
possible claims we are not sure that Ofu will achieve.
Servings per package: around 2
Grams per package: 300 g
Cost Calculations
- 70 -
14. Cost Calculations
Mass Flows and protein yields
We took the data from the laboratory results to calculate mass flows and protein yields in our
process.
We start with 1000g of water and 100g of oat bran = 1100g of slurry
In the oat bran we have 18.8 g of proteins, thus in the 1100g of slurry we have only 1,71% of
protein (they are diluted). After the extraction we obtain 733g of oat milk. In this oat milk we
obtained 1,03% proteins (Kjeldahl measure) 7,55g proteins in 733g oat milk.
Thus the protein extraction yield is: 5,5% (18,8:100=1,03:X).
After coagulation, out of these 733g of oat milk we obtain 28,51g of gel (We had 70g gel out of
1,8L of oat milk). We added 45g of oat bran flour (because we wanted 4g β-glucans in our
product) in 1,8L of oat milk => 18,33g bran in 0,733L oat milk => 18,33g bran in 28,51g of gel.
In the end we obtained 187g of Ofu with bran out of 1.8L of oat milk => 76,15g Ofu out of
0,733L oat milk.
In our final product we measured with the Kjeldahl method: 10,9g proteins per 100g product =>
In 76.15g we have: 76,15*10,9/100 = 8,3g proteins in the 76,15g OFU with bran.
The bran brings proteins: 18,8*18,33/100 = 3,45g proteins in the 18,33g of added oat bran. This
means that in the Ofu gel without bran we had 8,3g – 3,45g = 4,85 g proteins
This gives a coagulation yield of: 4,85/8,3 = 58,4% proteins have coagulated.
Energy calculations
We calculated how much Ofu we needed to produce per day knowing that per year we produced
100t. Our company shall work 50 weeks per year => 250 days. Thus we need to produce 400 kg
of OFU per day. Knowing that out of 1L water and 118,33g bran (the later added oat bran is
already included) we obtain 76,15g OFU => we need 400 000g Ofu / 76,15g Ofu = 5 253 times
more raw material per day => 5 253 L of water and 5253*118,33g bran = 621 587g bran = 622kg
bran per day.
Daily consumption of raw material: 5 875kg approx 6000L of slurry => Volume: 6m³
Extraction
Raw material to process per day: 5253kg water ; 622kg bran.
If we do 2 batches per day:
- Batch volume: 3 m³
- m(water)= 5 253/2 = 2 627kg
- m(bran)= 622/2 = 311 kg
- Cp(water)=4,19 kJ*kg-1K-1
- mass bran + water: 311+2627 = 2 938kg slurry
Cost Calculations
- 71 -
Estimations:
o Cp(bran) is considered to be 1,672Kj/kg*K (general specific heat capacity used for
solids)
o calculation of energy need to heat batch from 18°C (tap water temperature) to
50°C
o energy lost: 20% per hour to keep the temperature at 50°C for 3.5h lose of 35K
during the whole extraction
o total time for extraction step are 4h because the time to fill the batch with the
preheated water needs 0.5h
Calculation (for 1 batch of 2 938kg):
E(to heat from 18°C to 50°C) = m*Cp(water ) + m*Cp (bran) x dT=(311kg x 1,672 Kj/kg*K) +
(2627kg x 4.19kJ*kg-1K-1) x 32K =368 868kJ
E(20% losses equal to 35K) = m*Cp(water ) + m*Cp (bran) x dT ==(311kg x 1,672 Kj/kg*K) +
(2627kg x 4.19kJ*kg-1K-1) x 35K =403 450 kJ
E(total extraction)=772 318kJ
Separation
Estimations
o the separator should run with a capacity of 6 m³/h doing it in a short time helps
to prevent the temperature losses
o Speed of the centrifuge: 4 000 tr/min for 1h
o Estimation of energy needed: 55kWh
Coagulation & Denaturation:
- Autoclave volume: 2m³ [because 2/3 of slurry are milk]
- Temperature: 120°C
- Time: 50 min
- m(oat milk)=1963kg (because we obtain 2/3 of the slurry as oat milk)
Estimations:
o Cp(oat milk)= estimation that it is similar to water (4,19 kJ*kg-1K-1)
Calculation:
Energy to heat 1963kg from 30°C to 120°C 90K
From the Mollies diagram of water, h’(30°C) 125,7 kJ/kg ; h’(120°C) = 503,7 kJ/kg
E(to heat the oat milk from 30°C to 120°C)=(503,7-125,7)*1963 = 742 014 Kj
Cost Calculations
- 72 -
Energy lost in 50min (20% losses per hour= 18K/h) = m(oat milk) x Cp(water) x dT =
1963*4,19*18=148 049kJ
E(coagulation) = 148 049 + 742 014 = 890 063kJ
Cost estimations
Direct costs
The processes were carried out 2 batches of 2200kg each per day, the energy calculations are per
year (50 weeks, 5days per week).
Raw material : 622kg bran per day & 5 253kg of water per day.
1. Oat bran (from Nord Mills): 622kg bran/day 622*50*5= approx 155 500 kg bran/year
10.90 SEK/kg we need 155 500 kg of oat bran per year:
155 500*10,90= approx 1 694 950 SEK
2. Water: 5 253kg water/day 5253*50*5= 1 313 250kg water/year = approx. 1 314t H2O/year
0,052sek/kg of water
1 314 000*0,052= 68 328SEK
Water for cleaning can be estimated being the same amount as the production volume: 68
328SEK
3. Viscozyme (from Novozymes): 0,15% enzyme/L in the slurry
(1 314 t water/year + 155 500 kg bran/year = approx 1 470t slurry/year)
1 470*0,0015 = approx 2 204 Kg enzyme/year
Price of enzyme: 1230SEK/kg 1230*2 204 = 2 710 920SEK
On the internet we have found 1230SEK for 250ml, but seen that it is a retailers price, normally
our estimation should be 75% lower 1230SEK/L
4. Sodium hydroxide (NaOH): 8ml/L of slurry 1 470*1000*8 = approx 11 800L/year =
11,8t/year
Price: 155sek/kg 11,8*1000*155=1 829 000SEK (retailers price)
Non retailer => 25% less => 1 371 000SEK
5. Hydrochlorid acid (HCl): 4ml/L of slurry 1 470 000*0,004= 5 876 L/year = approx 5,9
t/year
Price: 110SEK/Kg 5,9*1000*110 = 649 000SEK
6. Calcium sulphate (CaSO4): 12g/L of oat milk
We obtain 0,733L of oat milk with 1,1L of slurry so we add 0,733*12= 8,796g of CaSO4 in 1,1L
Cost Calculations
- 73 -
Seen that we use 1 470t slurry/year (1 470 000*8,796*0,001)/1,1=12,9t CaSO4/year
Estimated price: 30 SEK/Kg --> 30*12 900 = 387 903SEK
7. Acetic acid (CH3COOH): 10 ml/L of oat milk
So we add 0,733*0,01= 7,33ml of acetic acid in 733 mL of oat milk.
So we need (1 470 000*7,33*0,001)/1,1=9,8t acetic acid/year
Price: 35sek/kg 9 800*35= 343 000SEK
Total raw material cost = 7 225 101 SEK per year
Packaging material:
1,1 SEK/package
300g/package 100 000 000g/year / 300g = 333 333 Packs/year. Thus packaging shall cost:
366 666SEK
Building:
We decided to rent a place to produce Ofu, it will be cheaper.
Surface needed = 120m2
Price 2000SEK/m2
Rent price / year = 2000*120 = 240 000SEK
Manpower:
Total of hours in a year for one manpower : 169hours per month 169*12= 2028hours/year
So a manpower cost 2028*120 = 243 360SEK/year/pers 20 280SEK/month/pers
In our process we need 3 manpowers 3*223080= 730 080SEK/year
Tax 33% = 223 080SEK
Total cost = 953 160SEK
Electricity:
In Sweden, 1 kWh = 0,60SEK
For 1 batch (2 batches per day)
E(total extraction)=772 318kJ
E(coagulation) = 890 063kJ
E(centrifuge) = 200 000kJ
Total energy consumed = 772 318 + 890 063 + 200 000 = 1 862 388 kJ 517,33 kWh
Electricity cost: 0,6 * 573,1 = 344 SEK / batch
We shall do in one year, 2*250days = 500 batches
TOTAL ENERGY COST: 344 * 500 = 172 000 SEK/year
TOTAL DIRECT COST: 172 000 + 953 160 + 240 000 + 366 666 + 7 225 101 = 8 965 927 SEK
for 100t. Approx 86 SEK/kg of OFU
Cost Calculations
- 74 -
Material:
Tank approx 20 000 SEK
Centrifuge approx 500 000 SEK
Autoclave approx 500 000 SEK
Total material cost: 1 020 000 SEK
Our development costs:
Total working time: 2035 h equal to the working time of 3 workers working for 4 months
during a full time job (169h/month)
Development costs workers:
3 workers x 4 months x 20 000 SEK/month = 240 000 SEK
Material costs during the development: 5000SEK (rough approximation)
Selling price:
The production costs
Profit of turnover: 20 % of production costs
Retailer margin: 50 %
Additional taxes: 25 %
Production costs: 8 965 927 + 1/3 x 1 020 000 (machine costs over three years) +
953 160SEK (manpower costs) = 9 955 082SEK approx 100 SEK/kg
120SEK price when sold to the retailer (20% profit)
180SEK plus 25%taxes price in the supermarket = 225 SEK/kg
Discussion/conclusion:
All the calculations for the energy consumption during the process, direct and indirect costs are
approximated values. For a better cost estimation of the needed energy within the process a lot of
parameters need to be set and therefore good practical experiences or a lot of trial s and wrong
calculations are needed.
We argue that it should be possible to produce Ofu much cheaper than we estimated, for several
reasons. First of all, with a low production volume of 100 t per year it is not possible to run a
more continuous process, but we imagine a good chance to re-use the heat of the denaturation
using heat exchangers. This is the most energy consuming part in the process which is heat we
can use to preheat the oat milk before the denaturation step. However, by reducing the energy
costs the product costs will still stay high due to the fact that more than 80 % of the total costs are
build up by the raw material costs. We are doubtful if the estimated prices are correct because we
could not find vendor prices for the industry. The price of the oat bran (10,9SEK/kg = 1,15€) we
got directly from Nord Mills, but if we compare it with the oat price on the cereal market: 0,16 €
per kg oat (336 USc/US bushel date: 16.01.2008) we find that the costs for the oat bran will be
about 240 000 SEK. The price for the sodium hydroxide is almost half of the viscozyme costs,
Cost Calculations
- 75 -
which should be the most expensive raw material used. This must be a wrong estimation, also
due to the fact that NaOH is a common and cheap chemical. It might be half of that price.
The machinery costs can differ a lot by choosing second hand or new material. We think that a
start up with second hand material will be better and cheaper so we believe that our cost
estimation are much too high and can finally reach in the range of soy tofu (retailer price:
75SEK/kg).
The production costs amount to 100 SEK/kg of Ofu. With adding a profit of 20%, a retailer
margin of 50% and 25% taxes we get a customer’s price of 225 SEK/kg, which is compared to
soy tofu, with around 75 SEK/kg, 3-fold higher. As mentioned above, the price is much too high
and could be around 100 SEK/kg, if the production costs are in the range.
Conclusions
- 76 -
15. Conclusions
It is possible to form gels with oat proteins at acidic pH if the temperature condition is high
enough to denaturate the globulins. Protein extraction is a delicate procedure where enzymes can
or need to be used. It is good to centrifuge the oat milk before processing the gel, to decrease the
slightly sandy texture in the Ofu product. The pressing step in tofu production has a great impact
on the final product in order to get a harder and denser structure by lower the water content.
Ultra-filtration may be insufficient for use in large scale production because of a too low rate and
delivery volume to the next step in the production line, but we found out that a concentration step
is not mandatory due to the fact that the protein content reached with an enzymatic extraction is
high enough. To receive raw material in time is a critical factor in food development because of
the importance to get pre-products that can be analyzed well before the deadline (no hedonistic
test were managed to be done).
Despite all the difficulties we faced during our project, we managed to find new ways to
overcome the different problems for each step of the process.
Thanks to the big number of people making the group, we had a bigger work capacity and we
could share the work easily. Due to our different nationalities and universities, we had different
approaches of this scientific work and thus we all learned new analysis and working methods.
This project was a very interesting task to accomplish, not only on the theoretical plan, in the first
period, with all the literature research, but also on the practical plan with the experiments in the
laboratories. Moreover, the group work gave us the chance to propose our own ideas and discuss
about them and also to listen to the others.
Future
Some things we could not test because of a lack of time. They might be important for a good Ofu
formation. These are a concentration or dilution of the oat milk to different concentrations before
the denaturation/coagulation step. This can also be the use of different water to oat bran ration
during the extraction. The time at which the oat bran is added to the curd can have a great impact
on the later developed texture of the Ofu; should it be added at a certain time after denaturation or
a certain temperature? Researches on the connection between the used force and time during
pressing could give important conclusions. Furthermore, a study for using the “okara” (solid part
after the centrifugation step) or the possibility for selling it should be considered.
Aknowledgements
- 77 -
Acknowledgements
I thank professor Mara Lucisano who allowed me to spend this study period in Sweden. The
other members of the group who took part in the development of the product were the followings:
Amandine Dony, Giovanni Sogari, Grigore Samoilà, Lise Gerola, Ludvig Nilsson, Nagaraju
Konuri, Raphael Naring, Sriram Karuturi. The group thank for their support the professor of
Lund University Gun Trädgårdh, Petr Dejmek, Bjorn Bergenståhl; Margareta Johansson for the
availability of the laboratories in Lund University and Dan Johansson for the helpfulness working
in the laboratories of Helsingbor Campus. We further thank Jonas Borjesson who was a member
of the group during the first three months. The food project group is also grateful to the factories
which provided us with knowledge and raw materials: Nord Mills AB, Novozymes, Oatly AB,
Norfoods AB, AarhusKarlshamn AB, CP Kelko and ISP Alginates company.
Appendix
- 78 -
Appendix
1. Nutritional values of soymilk & Soy tofu 78
2. Oat Amino acid composition 79
3. Viscosity and particle size of alginates 79
4. Ultra-filtration equipment 80
5. Kjeldahl protein analyses 80
6. Soymilk process 82
7. Soy tofu process 83
8. Project plan 84
9. Texture attributes 85
10. Sensorial analysis statistic calculations 86
11. Texture analyzer 95
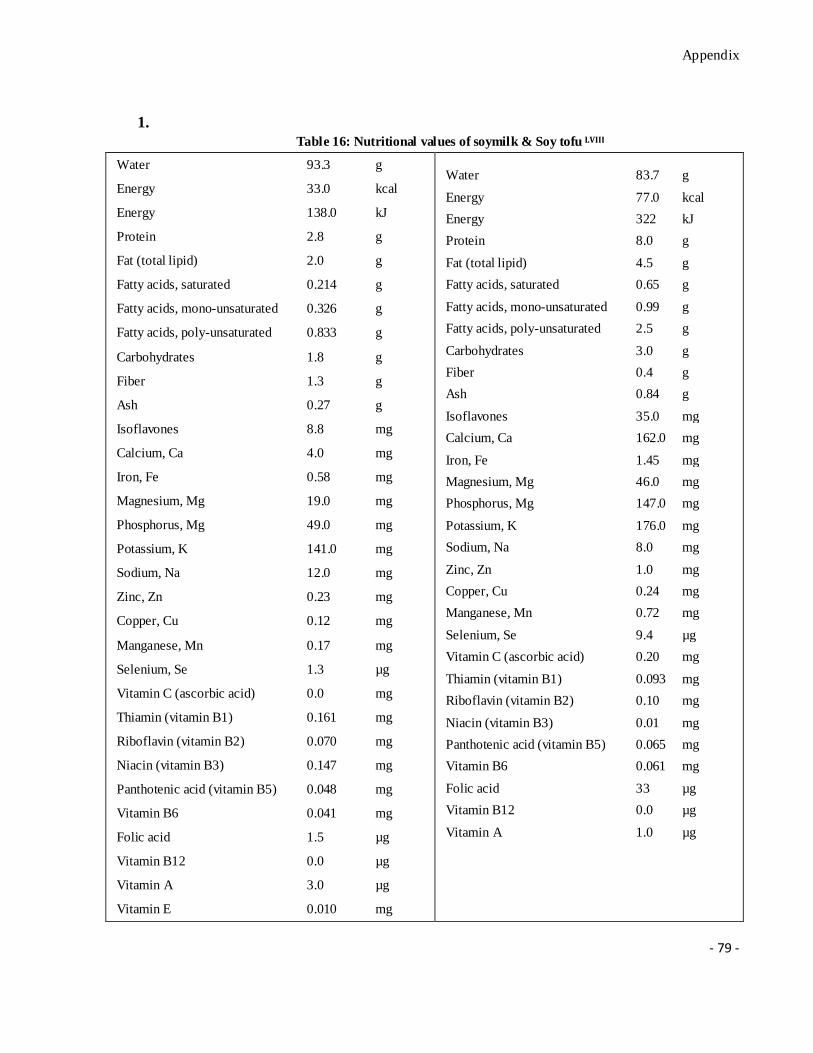
Appendix
- 79 -
1.
Table 16: Nutritional values of soymilk & Soy tofu LVIII
Water 93.3 g
Energy 33.0 kcal
Energy 138.0 kJ
Protein 2.8 g
Fat (total lipid) 2.0 g
Fatty acids, saturated 0.214 g
Fatty acids, mono-unsaturated 0.326 g
Fatty acids, poly-unsaturated 0.833 g
Carbohydrates 1.8 g
Fiber 1.3 g
Ash 0.27 g
Isoflavones 8.8 mg
Calcium, Ca 4.0 mg
Iron, Fe 0.58 mg
Magnesium, Mg 19.0 mg
Phosphorus, Mg 49.0 mg
Potassium, K 141.0 mg
Sodium, Na 12.0 mg
Zinc, Zn 0.23 mg
Copper, Cu 0.12 mg
Manganese, Mn 0.17 mg
Selenium, Se 1.3 µg
Vitamin C (ascorbic acid) 0.0 mg
Thiamin (vitamin B1) 0.161 mg
Riboflavin (vitamin B2) 0.070 mg
Niacin (vitamin B3) 0.147 mg
Panthotenic acid (vitamin B5) 0.048 mg
Vitamin B6 0.041 mg
Folic acid 1.5 µg
Vitamin B12 0.0 µg
Vitamin A 3.0 µg
Vitamin E 0.010 mg
Water 83.7 g
Energy 77.0 kcal
Energy 322 kJ
Protein 8.0 g
Fat (total lipid) 4.5 g
Fatty acids, saturated 0.65 g
Fatty acids, mono-unsaturated 0.99 g
Fatty acids, poly-unsaturated 2.5 g
Carbohydrates 3.0 g
Fiber 0.4 g
Ash 0.84 g
Isoflavones 35.0 mg
Calcium, Ca 162.0 mg
Iron, Fe 1.45 mg
Magnesium, Mg 46.0 mg
Phosphorus, Mg 147.0 mg
Potassium, K 176.0 mg
Sodium, Na 8.0 mg
Zinc, Zn 1.0 mg
Copper, Cu 0.24 mg
Manganese, Mn 0.72 mg
Selenium, Se 9.4 µg
Vitamin C (ascorbic acid) 0.20 mg
Thiamin (vitamin B1) 0.093 mg
Riboflavin (vitamin B2) 0.10 mg
Niacin (vitamin B3) 0.01 mg
Panthotenic acid (vitamin B5) 0.065 mg
Vitamin B6 0.061 mg
Folic acid 33 µg
Vitamin B12 0.0 µg
Vitamin A 1.0 µg
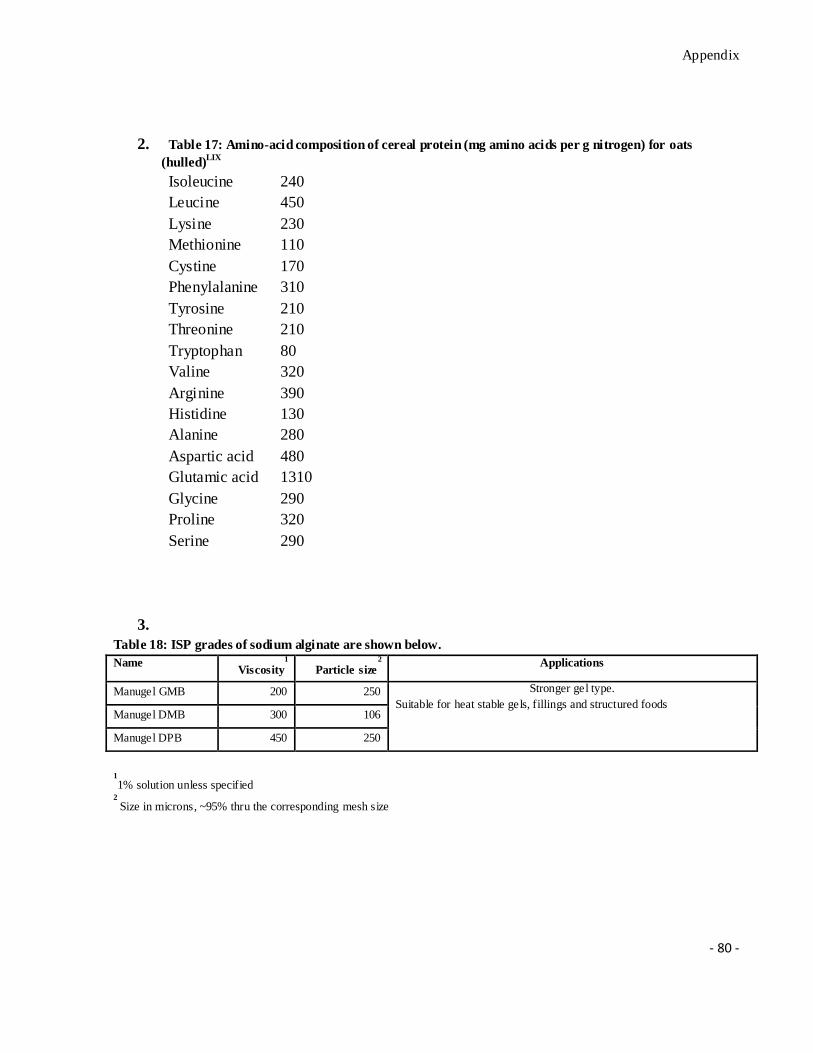
Appendix
- 80 -
2. Table 17: Amino-acid composition of cereal protein (mg amino acids per g nitrogen) for oats
(hulled)LIX
Isoleucine
Leucine
Lysine
Methionine
Cystine
Phenylalanine
Tyrosine
Threonine
Tryptophan
Valine
Arginine
Histidine
Alanine
Aspartic acid
Glutamic acid
Glycine
Proline
Serine
240
450
230
110
170
310
210
210
80
320
390
130
280
480
1310
290
320
290
3.
Table 18: ISP grades of sodium alginate are shown below.
Name Viscosity
1
Particle size2
Applications
Manugel GMB 200 250 Stronger gel type.
Suitable for heat stable gels, fillings and structured foods Manugel DMB 300 106
Manugel DPB 450 250
1
1% solution unless specified 2
Size in microns, ~95% thru the corresponding mesh size
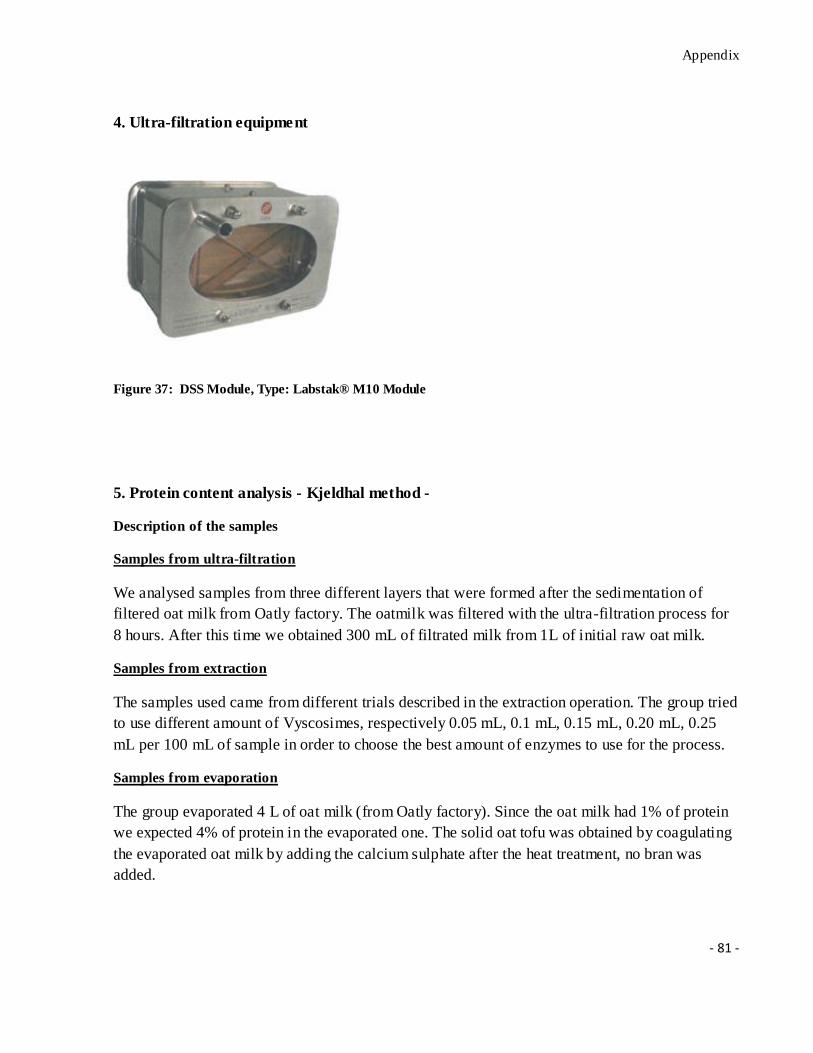
Appendix
- 81 -
4. Ultra-filtration equipment
Figure 37: DSS Module, Type: Labstak® M10 Module
5. Protein content analysis - Kjeldhal method -
Description of the samples
Samples from ultra-filtration
We analysed samples from three different layers that were formed after the sedimentation of
filtered oat milk from Oatly factory. The oatmilk was filtered with the ultra-filtration process for
8 hours. After this time we obtained 300 mL of filtrated milk from 1L of initial raw oat milk.
Samples from extraction
The samples used came from different trials described in the extraction operation. The group tried
to use different amount of Vyscosimes, respectively 0.05 mL, 0.1 mL, 0.15 mL, 0.20 mL, 0.25
mL per 100 mL of sample in order to choose the best amount of enzymes to use for the process.
Samples from evaporation
The group evaporated 4 L of oat milk (from Oatly factory). Since the oat milk had 1% of protein
we expected 4% of protein in the evaporated one. The solid oat tofu was obtained by coagulating
the evaporated oat milk by adding the calcium sulphate after the heat treatment, no bran was
added.
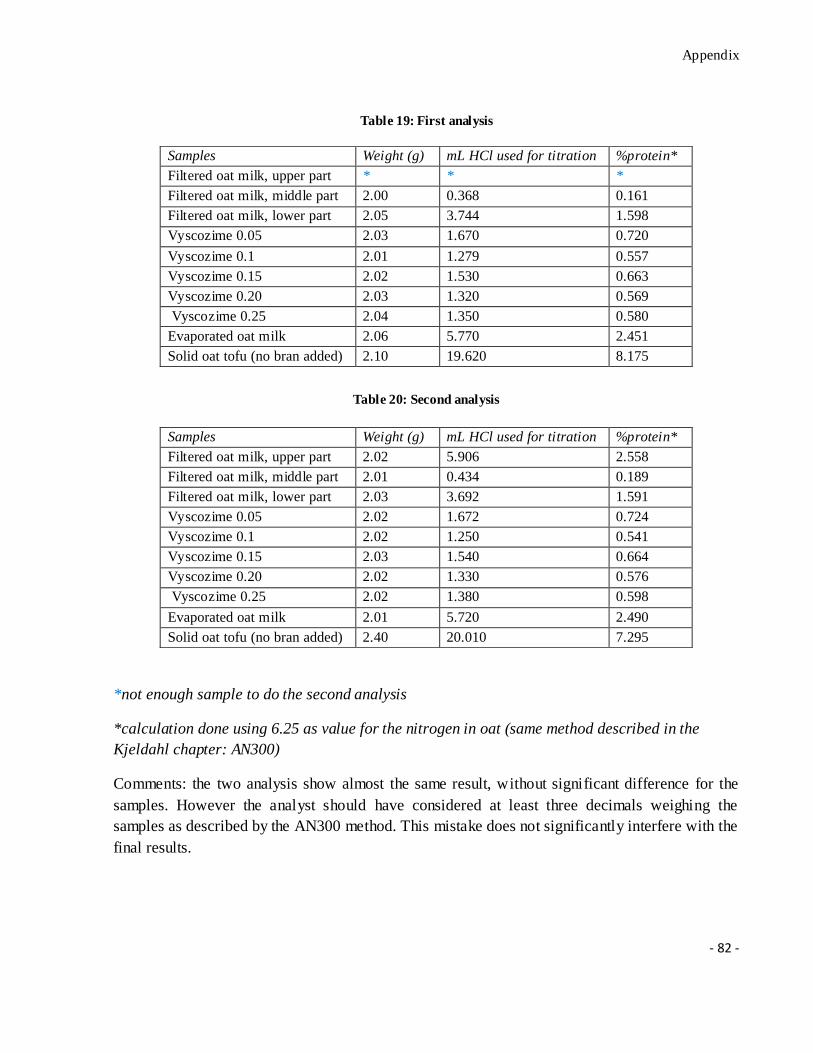
Appendix
- 82 -
Table 19: First analysis
Table 20: Second analysis
*not enough sample to do the second analysis
*calculation done using 6.25 as value for the nitrogen in oat (same method described in the
Kjeldahl chapter: AN300)
Comments: the two analysis show almost the same result, without significant difference for the
samples. However the analyst should have considered at least three decimals weighing the
samples as described by the AN300 method. This mistake does not significantly interfere with the
final results.
Samples Weight (g) mL HCl used for titration %protein*
Filtered oat milk, upper part * * *
Filtered oat milk, middle part 2.00 0.368 0.161
Filtered oat milk, lower part 2.05 3.744 1.598
Vyscozime 0.05 2.03 1.670 0.720
Vyscozime 0.1 2.01 1.279 0.557
Vyscozime 0.15 2.02 1.530 0.663
Vyscozime 0.20 2.03 1.320 0.569
Vyscozime 0.25 2.04 1.350 0.580
Evaporated oat milk 2.06 5.770 2.451
Solid oat tofu (no bran added) 2.10 19.620 8.175
Samples Weight (g) mL HCl used for titration %protein*
Filtered oat milk, upper part 2.02 5.906 2.558
Filtered oat milk, middle part 2.01 0.434 0.189
Filtered oat milk, lower part 2.03 3.692 1.591
Vyscozime 0.05 2.02 1.672 0.724
Vyscozime 0.1 2.02 1.250 0.541
Vyscozime 0.15 2.03 1.540 0.664
Vyscozime 0.20 2.02 1.330 0.576
Vyscozime 0.25 2.02 1.380 0.598
Evaporated oat milk 2.01 5.720 2.490
Solid oat tofu (no bran added) 2.40 20.010 7.295
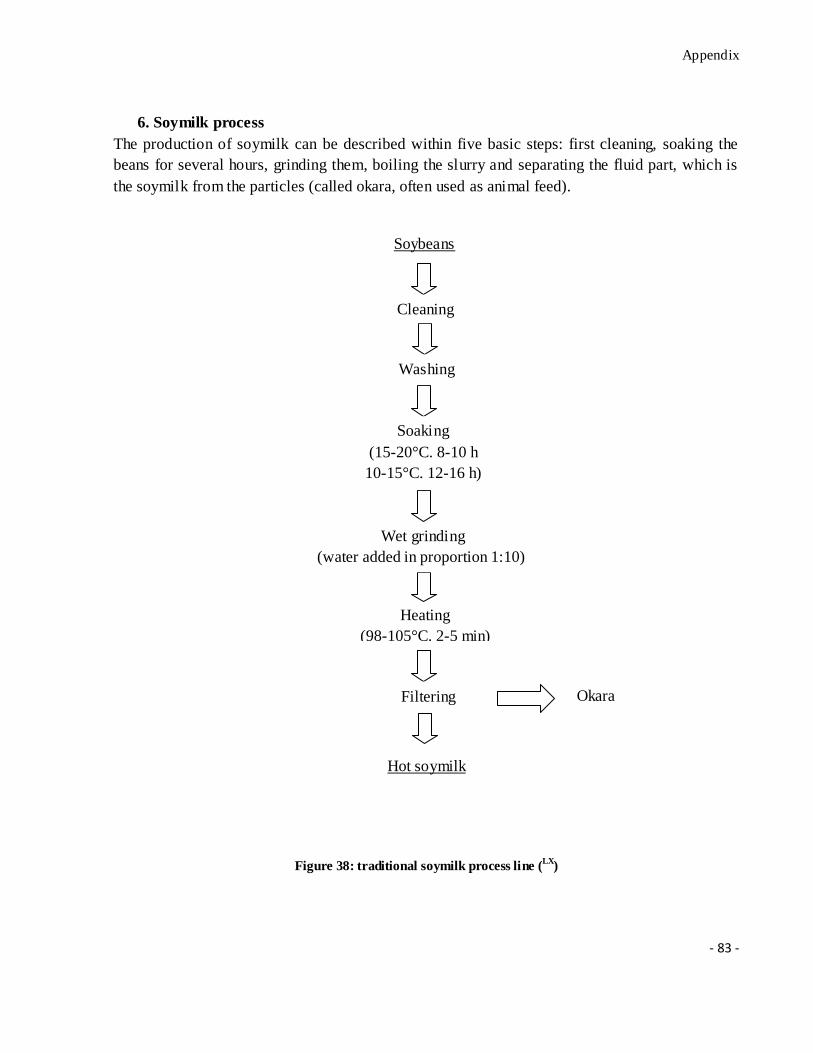
Appendix
- 83 -
6. Soymilk process
The production of soymilk can be described within five basic steps: first cleaning, soaking the
beans for several hours, grinding them, boiling the slurry and separating the fluid part, which is
the soymilk from the particles (called okara, often used as animal feed).
Hot soymilk
Figure 38: traditional soymilk process line (LX
)
Okara Filtering
Heating
(98-105°C. 2-5 min)
Wet grinding
(water added in proportion 1:10)
Soaking
(15-20°C. 8-10 h
10-15°C. 12-16 h)
Washing
Cleaning
Soybeans
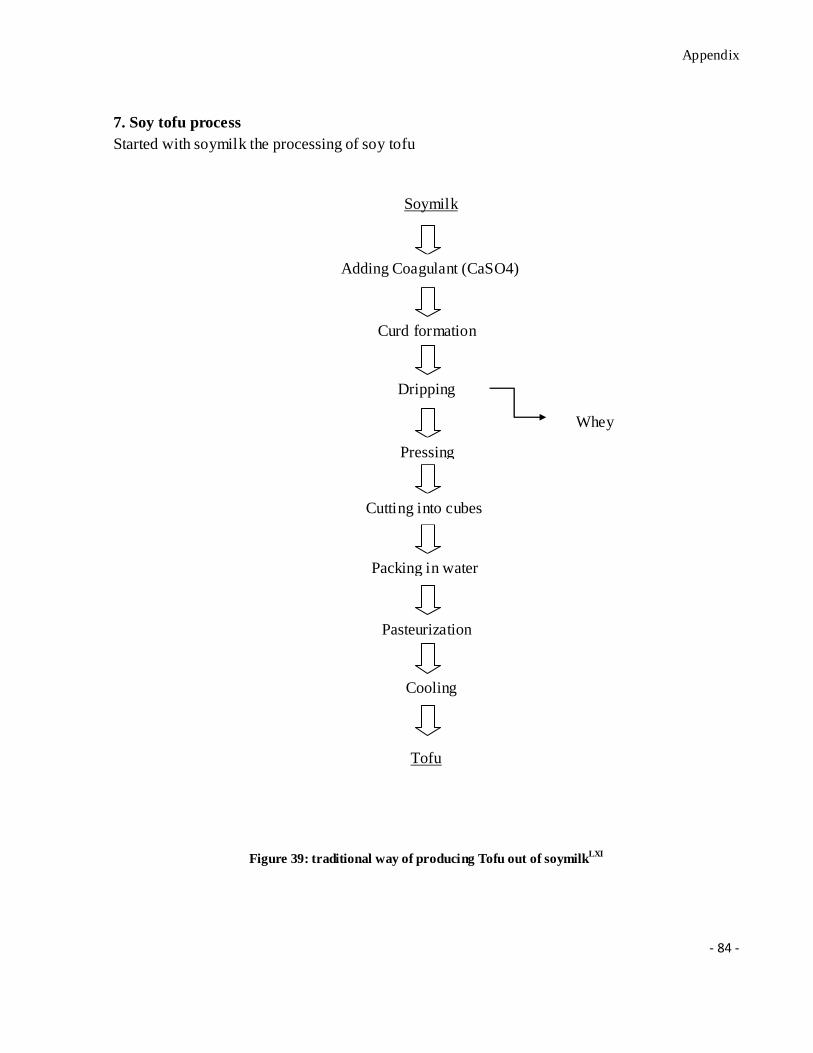
Appendix
- 84 -
7. Soy tofu process
Started with soymilk the processing of soy tofu
Tofu
Figure 39: traditional way of producing Tofu out of soymilkLXI
Whey
Curd formation
Pasteurization
Cooling
Pressing
Cutting into cubes
Dripping
Packing in water
Soymilk
(75°C)
Adding Coagulant (CaSO4)
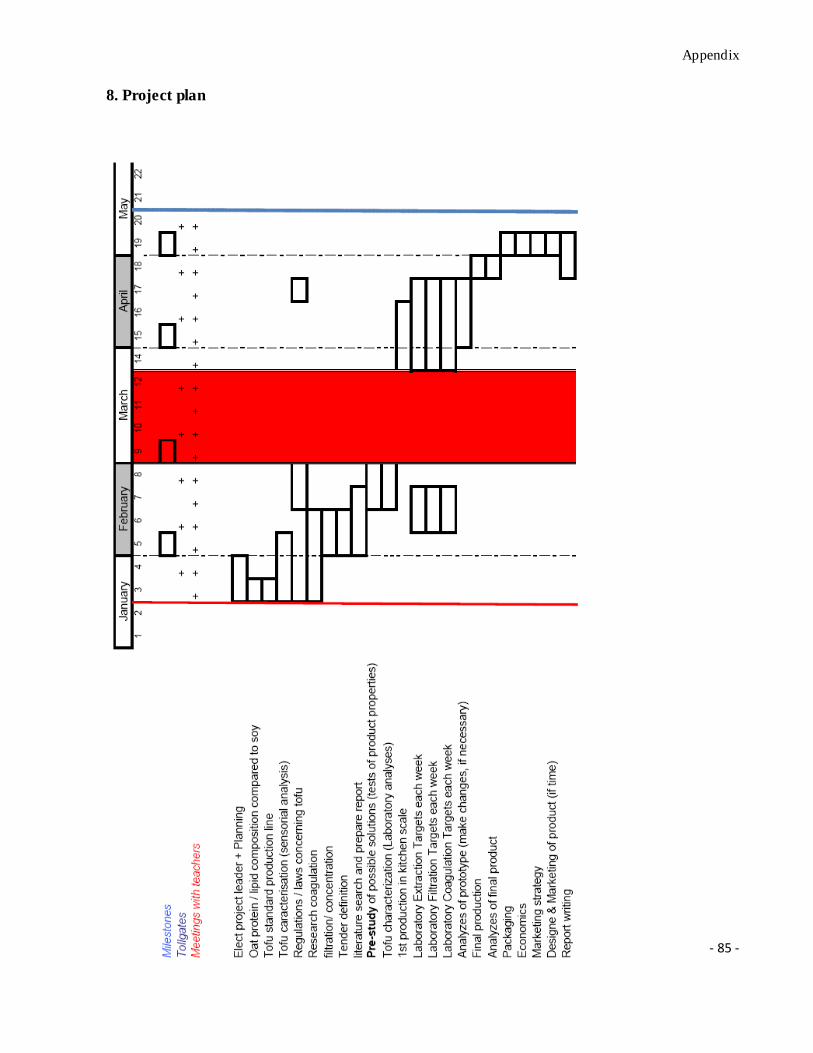
Appendix
- 85 -
8. Planning
8. Project plan
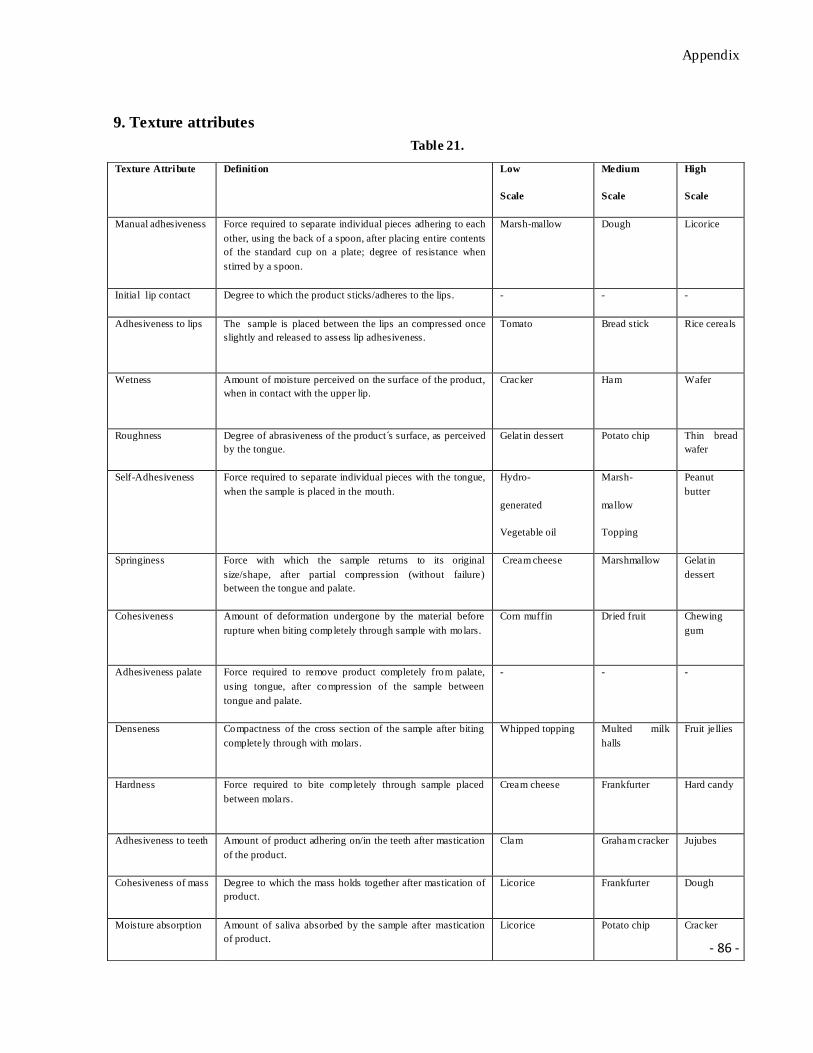
Appendix
- 86 -
9. Texture attributes
Texture Attribute Definition Low
Scale
Medium
Scale
High
Scale
Manual adhesiveness Force required to separate individual pieces adhering to each
other, using the back of a spoon, after placing entire contents
of the standard cup on a plate; degree of resistance when
stirred by a spoon.
Marsh-mallow Dough Licorice
Initial lip contact Degree to which the product sticks/adheres to the lips. - - -
Adhesiveness to lips
The sample is placed between the lips an compressed once
slightly and released to assess lip adhesiveness.
Tomato Bread stick Rice cereals
Wetness
Amount of moisture perceived on the surface of the product,
when in contact with the upper lip.
Cracker Ham Wafer
Roughness Degree of abrasiveness of the product s surface, as perceived
by the tongue.
Gelat in dessert Potato chip Thin bread
wafer
Self-Adhesiveness
Force required to separate individual pieces with the tongue,
when the sample is placed in the mouth.
Hydro-
generated
Vegetable oil
Marsh-
mallow
Topping
Peanut
butter
Springiness
Force with which the sample returns to its original
size/shape, after partial compression (without failure)
between the tongue and palate.
Cream cheese Marshmallow Gelat in
dessert
Cohesiveness
Amount of deformation undergone by the material before
rupture when biting completely through sample with molars.
Corn muffin Dried fruit Chewing
gum
Adhesiveness palate Force required to remove product completely from palate,
using tongue, after compression of the sample between
tongue and palate.
- - -
Denseness
Compactness of the cross section of the sample after biting
completely through with molars.
Whipped topping Multed milk
halls
Fruit jellies
Hardness
Force required to bite completely through sample placed
between molars.
Cream cheese Frankfurter Hard candy
Adhesiveness to teeth Amount of product adhering on/in the teeth after mastication
of the product.
Clam Graham cracker Jujubes
Cohesiveness of mass Degree to which the mass holds together after mastication of
product.
Licorice Frankfurter Dough
Moisture absorption Amount of saliva absorbed by the sample after mastication
of product.
Licorice Potato chip Cracker
Table 21.
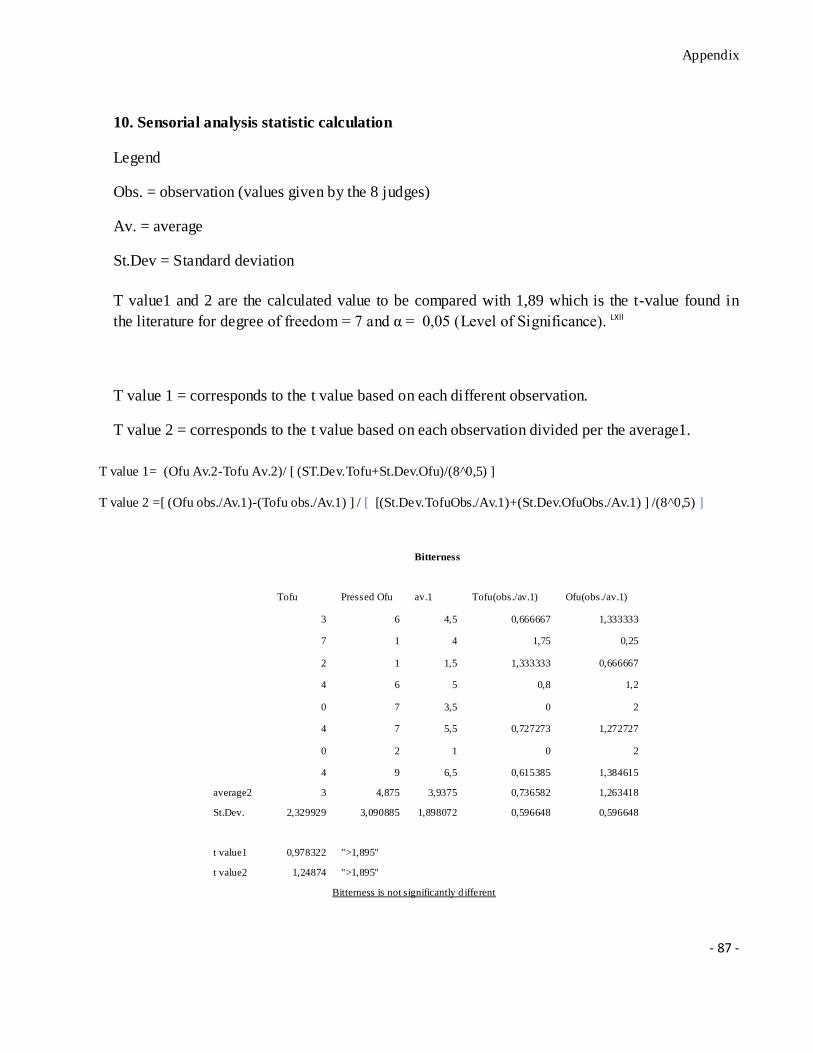
Appendix
- 87 -
10. Sensorial analysis statistic calculation
Legend
Obs. = observation (values given by the 8 judges)
Av. = average
St.Dev = Standard deviation
T value1 and 2 are the calculated value to be compared with 1,89 which is the t-value found in
the literature for degree of freedom = 7 and α = 0,05 (Level of Significance). LXII
T value 1 = corresponds to the t value based on each different observation.
T value 2 = corresponds to the t value based on each observation divided per the average1.
Bitterness
Tofu Pressed Ofu av.1 Tofu(obs./av.1) Ofu(obs./av.1)
3 6 4,5 0,666667 1,333333
7 1 4 1,75 0,25
2 1 1,5 1,333333 0,666667
4 6 5 0,8 1,2
0 7 3,5 0 2
4 7 5,5 0,727273 1,272727
0 2 1 0 2
4 9 6,5 0,615385 1,384615
average2 3 4,875 3,9375 0,736582 1,263418
St.Dev. 2,329929 3,090885 1,898072 0,596648 0,596648
t value1 0,978322 ">1,895"
t value2 1,24874 ">1,895"
Bitterness is not significantly d ifferent
T value 1= (Ofu Av.2-Tofu Av.2)/ [ (ST.Dev.Tofu+St.Dev.Ofu)/(8^0,5) ]
T value 2 =[ (Ofu obs./Av.1)-(Tofu obs./Av.1) ] / [ [(St.Dev.TofuObs./Av.1)+(St.Dev.OfuObs./Av.1) ] /(8^0,5) ]
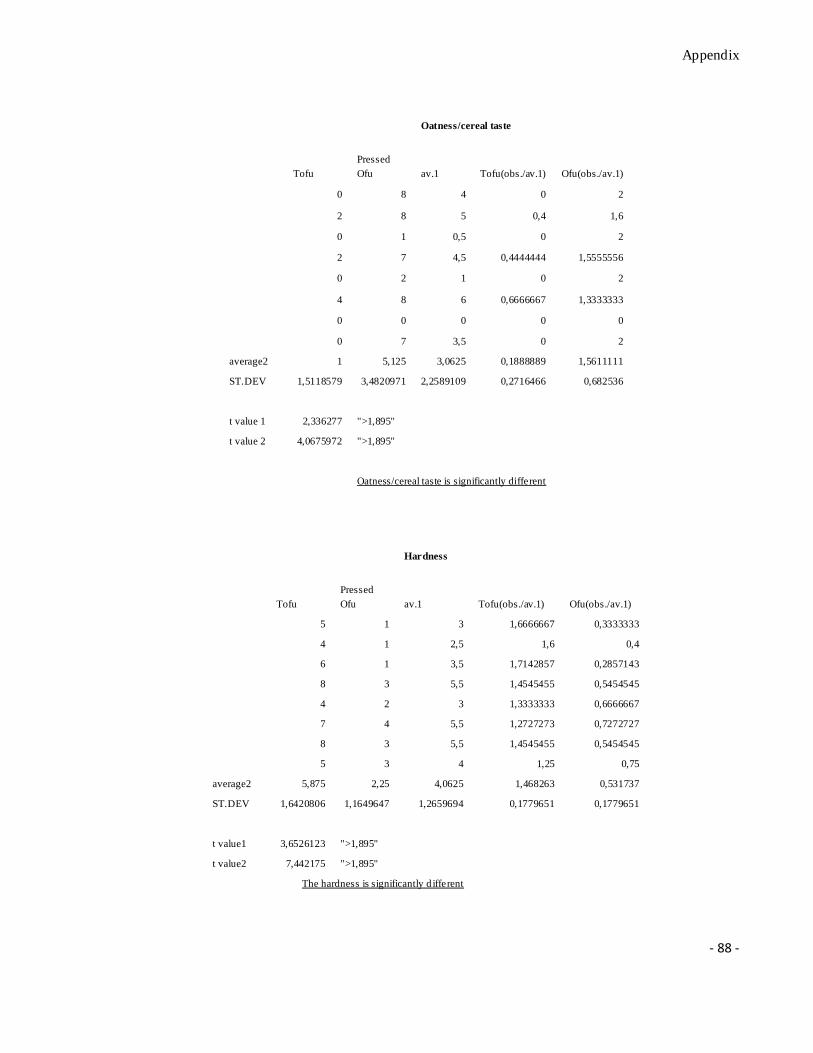
Appendix
- 88 -
Oatness/cereal taste
Tofu
Pressed
Ofu av.1 Tofu(obs./av.1) Ofu(obs./av.1)
0 8 4 0 2
2 8 5 0,4 1,6
0 1 0,5 0 2
2 7 4,5 0,4444444 1,5555556
0 2 1 0 2
4 8 6 0,6666667 1,3333333
0 0 0 0 0
0 7 3,5 0 2
average2 1 5,125 3,0625 0,1888889 1,5611111
ST.DEV 1,5118579 3,4820971 2,2589109 0,2716466 0,682536
t value 1 2,336277 ">1,895"
t value 2 4,0675972 ">1,895"
Oatness/cereal taste is significantly different
Hardness
Tofu
Pressed
Ofu av.1 Tofu(obs./av.1) Ofu(obs./av.1)
5 1 3 1,6666667 0,3333333
4 1 2,5 1,6 0,4
6 1 3,5 1,7142857 0,2857143
8 3 5,5 1,4545455 0,5454545
4 2 3 1,3333333 0,6666667
7 4 5,5 1,2727273 0,7272727
8 3 5,5 1,4545455 0,5454545
5 3 4 1,25 0,75
average2 5,875 2,25 4,0625 1,468263 0,531737
ST.DEV 1,6420806 1,1649647 1,2659694 0,1779651 0,1779651
t value1 3,6526123 ">1,895"
t value2 7,442175 ">1,895"
The hardness is significantly d ifferent
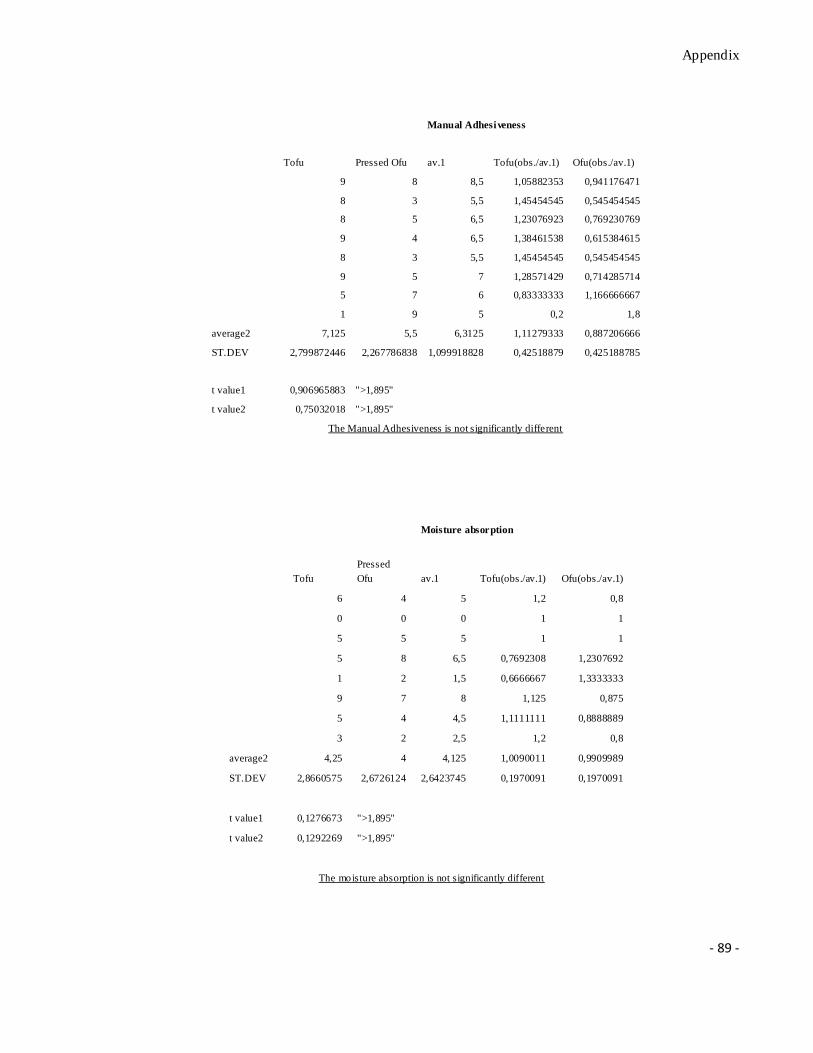
Appendix
- 89 -
Manual Adhesiveness
Tofu Pressed Ofu av.1 Tofu(obs./av.1) Ofu(obs./av.1)
9 8 8,5 1,05882353 0,941176471
8 3 5,5 1,45454545 0,545454545
8 5 6,5 1,23076923 0,769230769
9 4 6,5 1,38461538 0,615384615
8 3 5,5 1,45454545 0,545454545
9 5 7 1,28571429 0,714285714
5 7 6 0,83333333 1,166666667
1 9 5 0,2 1,8
average2 7,125 5,5 6,3125 1,11279333 0,887206666
ST.DEV 2,799872446 2,267786838 1,099918828 0,42518879 0,425188785
t value1 0,906965883 ">1,895"
t value2 0,75032018 ">1,895"
The Manual Adhesiveness is not significantly different
Moisture absorption
Tofu
Pressed
Ofu av.1 Tofu(obs./av.1) Ofu(obs./av.1)
6 4 5 1,2 0,8
0 0 0 1 1
5 5 5 1 1
5 8 6,5 0,7692308 1,2307692
1 2 1,5 0,6666667 1,3333333
9 7 8 1,125 0,875
5 4 4,5 1,1111111 0,8888889
3 2 2,5 1,2 0,8
average2 4,25 4 4,125 1,0090011 0,9909989
ST.DEV 2,8660575 2,6726124 2,6423745 0,1970091 0,1970091
t value1 0,1276673 ">1,895"
t value2 0,1292269 ">1,895"
The moisture absorption is not significantly different
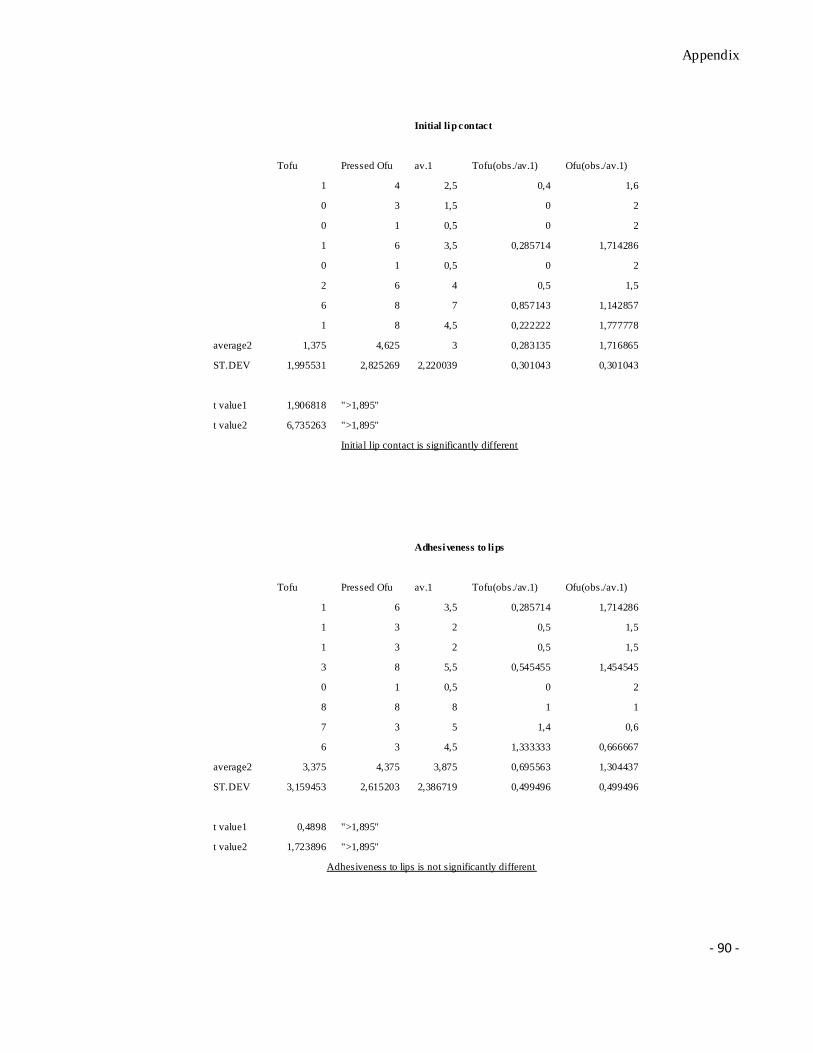
Appendix
- 90 -
Initial lip contact
Tofu Pressed Ofu av.1 Tofu(obs./av.1) Ofu(obs./av.1)
1 4 2,5 0,4 1,6
0 3 1,5 0 2
0 1 0,5 0 2
1 6 3,5 0,285714 1,714286
0 1 0,5 0 2
2 6 4 0,5 1,5
6 8 7 0,857143 1,142857
1 8 4,5 0,222222 1,777778
average2 1,375 4,625 3 0,283135 1,716865
ST.DEV 1,995531 2,825269 2,220039 0,301043 0,301043
t value1 1,906818 ">1,895"
t value2 6,735263 ">1,895"
Initial lip contact is significantly different
Adhesiveness to lips
Tofu Pressed Ofu av.1 Tofu(obs./av.1) Ofu(obs./av.1)
1 6 3,5 0,285714 1,714286
1 3 2 0,5 1,5
1 3 2 0,5 1,5
3 8 5,5 0,545455 1,454545
0 1 0,5 0 2
8 8 8 1 1
7 3 5 1,4 0,6
6 3 4,5 1,333333 0,666667
average2 3,375 4,375 3,875 0,695563 1,304437
ST.DEV 3,159453 2,615203 2,386719 0,499496 0,499496
t value1 0,4898 ">1,895"
t value2 1,723896 ">1,895"
Adhesiveness to lips is not significantly different
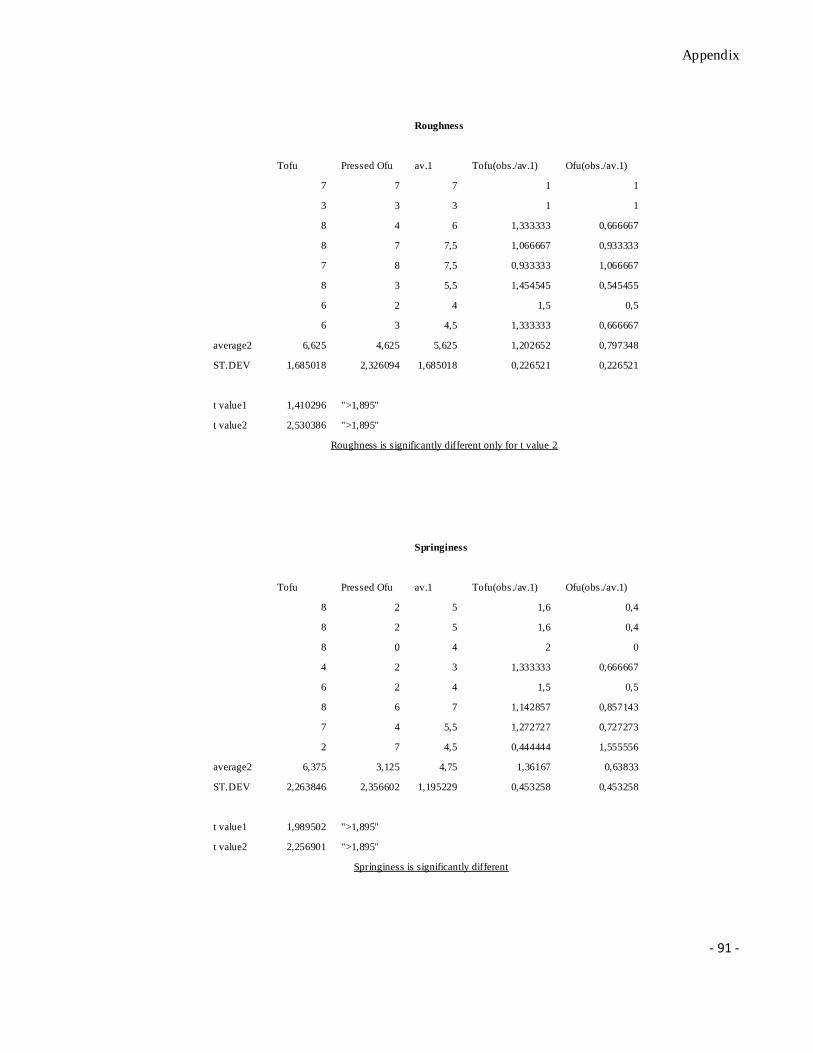
Appendix
- 91 -
Roughness
Tofu Pressed Ofu av.1 Tofu(obs./av.1) Ofu(obs./av.1)
7 7 7 1 1
3 3 3 1 1
8 4 6 1,333333 0,666667
8 7 7,5 1,066667 0,933333
7 8 7,5 0,933333 1,066667
8 3 5,5 1,454545 0,545455
6 2 4 1,5 0,5
6 3 4,5 1,333333 0,666667
average2 6,625 4,625 5,625 1,202652 0,797348
ST.DEV 1,685018 2,326094 1,685018 0,226521 0,226521
t value1 1,410296 ">1,895"
t value2 2,530386 ">1,895"
Roughness is significantly different only for t value 2
Springiness
Tofu Pressed Ofu av.1 Tofu(obs./av.1) Ofu(obs./av.1)
8 2 5 1,6 0,4
8 2 5 1,6 0,4
8 0 4 2 0
4 2 3 1,333333 0,666667
6 2 4 1,5 0,5
8 6 7 1,142857 0,857143
7 4 5,5 1,272727 0,727273
2 7 4,5 0,444444 1,555556
average2 6,375 3,125 4,75 1,36167 0,63833
ST.DEV 2,263846 2,356602 1,195229 0,453258 0,453258
t value1 1,989502 ">1,895"
t value2 2,256901 ">1,895"
Springiness is significantly different
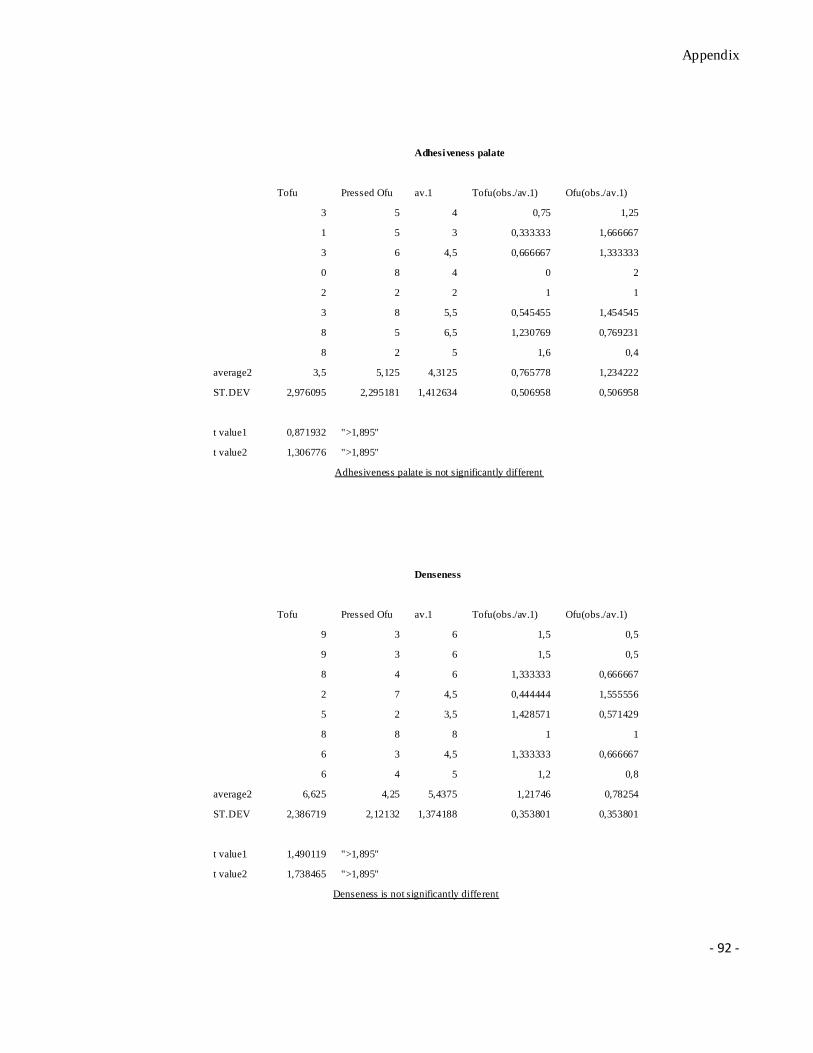
Appendix
- 92 -
Adhesiveness palate
Tofu Pressed Ofu av.1 Tofu(obs./av.1) Ofu(obs./av.1)
3 5 4 0,75 1,25
1 5 3 0,333333 1,666667
3 6 4,5 0,666667 1,333333
0 8 4 0 2
2 2 2 1 1
3 8 5,5 0,545455 1,454545
8 5 6,5 1,230769 0,769231
8 2 5 1,6 0,4
average2 3,5 5,125 4,3125 0,765778 1,234222
ST.DEV 2,976095 2,295181 1,412634 0,506958 0,506958
t value1 0,871932 ">1,895"
t value2 1,306776 ">1,895"
Adhesiveness palate is not significantly different
Denseness
Tofu Pressed Ofu av.1 Tofu(obs./av.1) Ofu(obs./av.1)
9 3 6 1,5 0,5
9 3 6 1,5 0,5
8 4 6 1,333333 0,666667
2 7 4,5 0,444444 1,555556
5 2 3,5 1,428571 0,571429
8 8 8 1 1
6 3 4,5 1,333333 0,666667
6 4 5 1,2 0,8
average2 6,625 4,25 5,4375 1,21746 0,78254
ST.DEV 2,386719 2,12132 1,374188 0,353801 0,353801
t value1 1,490119 ">1,895"
t value2 1,738465 ">1,895"
Denseness is not significantly different
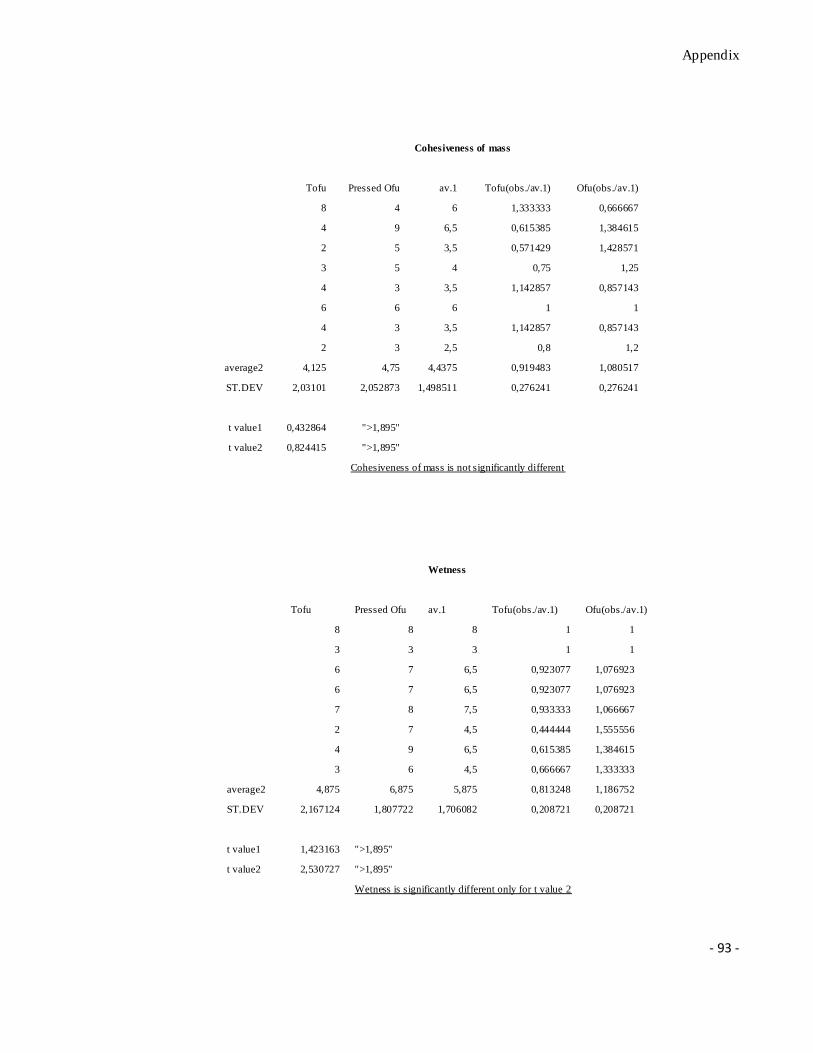
Appendix
- 93 -
Cohesiveness of mass
Tofu Pressed Ofu av.1 Tofu(obs./av.1) Ofu(obs./av.1)
8 4 6 1,333333 0,666667
4 9 6,5 0,615385 1,384615
2 5 3,5 0,571429 1,428571
3 5 4 0,75 1,25
4 3 3,5 1,142857 0,857143
6 6 6 1 1
4 3 3,5 1,142857 0,857143
2 3 2,5 0,8 1,2
average2 4,125 4,75 4,4375 0,919483 1,080517
ST.DEV 2,03101 2,052873 1,498511 0,276241 0,276241
t value1 0,432864 ">1,895"
t value2 0,824415 ">1,895"
Cohesiveness of mass is not significantly different
Wetness
Tofu Pressed Ofu av.1 Tofu(obs./av.1) Ofu(obs./av.1)
8 8 8 1 1
3 3 3 1 1
6 7 6,5 0,923077 1,076923
6 7 6,5 0,923077 1,076923
7 8 7,5 0,933333 1,066667
2 7 4,5 0,444444 1,555556
4 9 6,5 0,615385 1,384615
3 6 4,5 0,666667 1,333333
average2 4,875 6,875 5,875 0,813248 1,186752
ST.DEV 2,167124 1,807722 1,706082 0,208721 0,208721
t value1 1,423163 ">1,895"
t value2 2,530727 ">1,895"
Wetness is significantly different only for t value 2
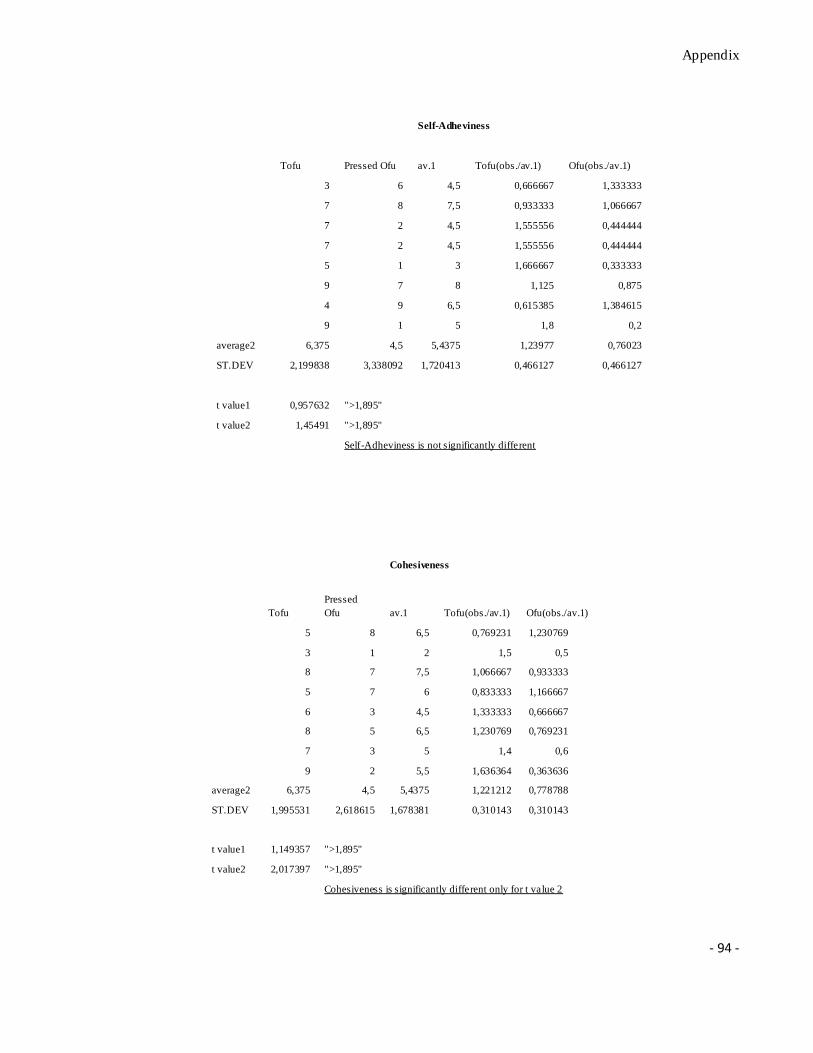
Appendix
- 94 -
Self-Adheviness
Tofu Pressed Ofu av.1 Tofu(obs./av.1) Ofu(obs./av.1)
3 6 4,5 0,666667 1,333333
7 8 7,5 0,933333 1,066667
7 2 4,5 1,555556 0,444444
7 2 4,5 1,555556 0,444444
5 1 3 1,666667 0,333333
9 7 8 1,125 0,875
4 9 6,5 0,615385 1,384615
9 1 5 1,8 0,2
average2 6,375 4,5 5,4375 1,23977 0,76023
ST.DEV 2,199838 3,338092 1,720413 0,466127 0,466127
t value1 0,957632 ">1,895"
t value2 1,45491 ">1,895"
Self-Adheviness is not significantly different
Cohesiveness
Tofu
Pressed
Ofu av.1 Tofu(obs./av.1) Ofu(obs./av.1)
5 8 6,5 0,769231 1,230769
3 1 2 1,5 0,5
8 7 7,5 1,066667 0,933333
5 7 6 0,833333 1,166667
6 3 4,5 1,333333 0,666667
8 5 6,5 1,230769 0,769231
7 3 5 1,4 0,6
9 2 5,5 1,636364 0,363636
average2 6,375 4,5 5,4375 1,221212 0,778788
ST.DEV 1,995531 2,618615 1,678381 0,310143 0,310143
t value1 1,149357 ">1,895"
t value2 2,017397 ">1,895"
Cohesiveness is significantly different only for t value 2
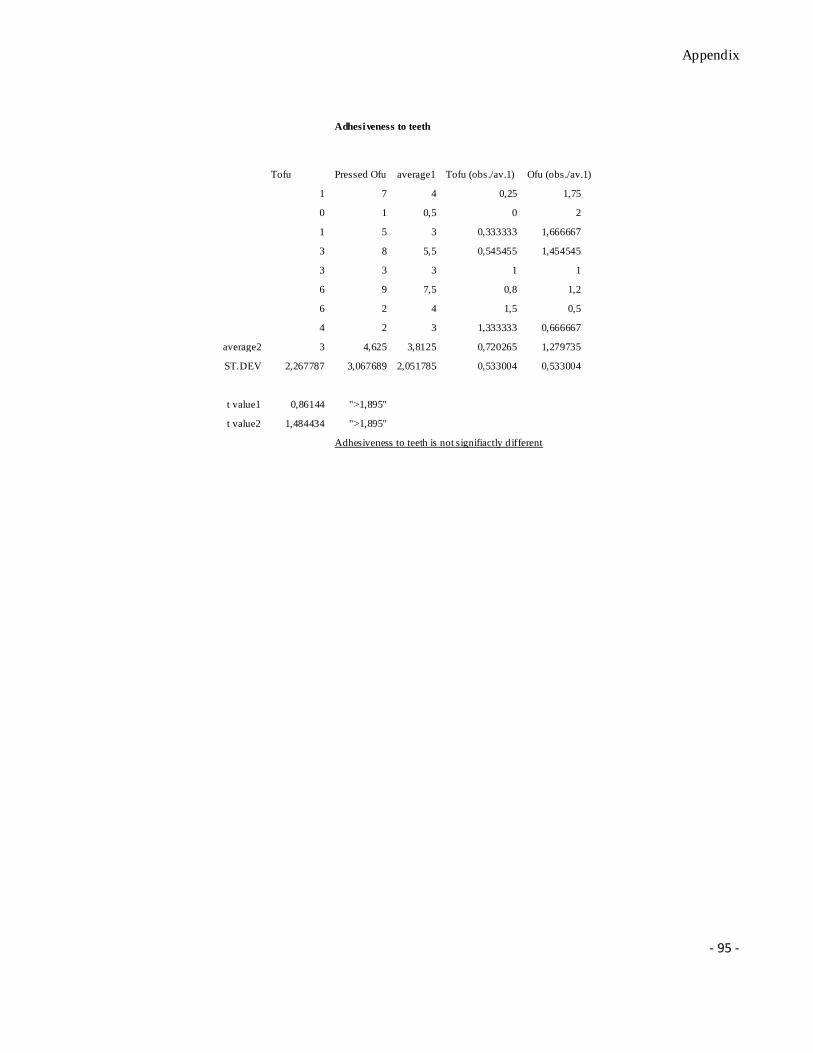
Appendix
- 95 -
Adhesiveness to teeth
Tofu Pressed Ofu average1 Tofu (obs./av.1) Ofu (obs./av.1)
1 7 4 0,25 1,75
0 1 0,5 0 2
1 5 3 0,333333 1,666667
3 8 5,5 0,545455 1,454545
3 3 3 1 1
6 9 7,5 0,8 1,2
6 2 4 1,5 0,5
4 2 3 1,333333 0,666667
average2 3 4,625 3,8125 0,720265 1,279735
ST.DEV 2,267787 3,067689 2,051785 0,533004 0,533004
t value1 0,86144 ">1,895"
t value2 1,484434 ">1,895"
Adhesiveness to teeth is not signifiactly d ifferent
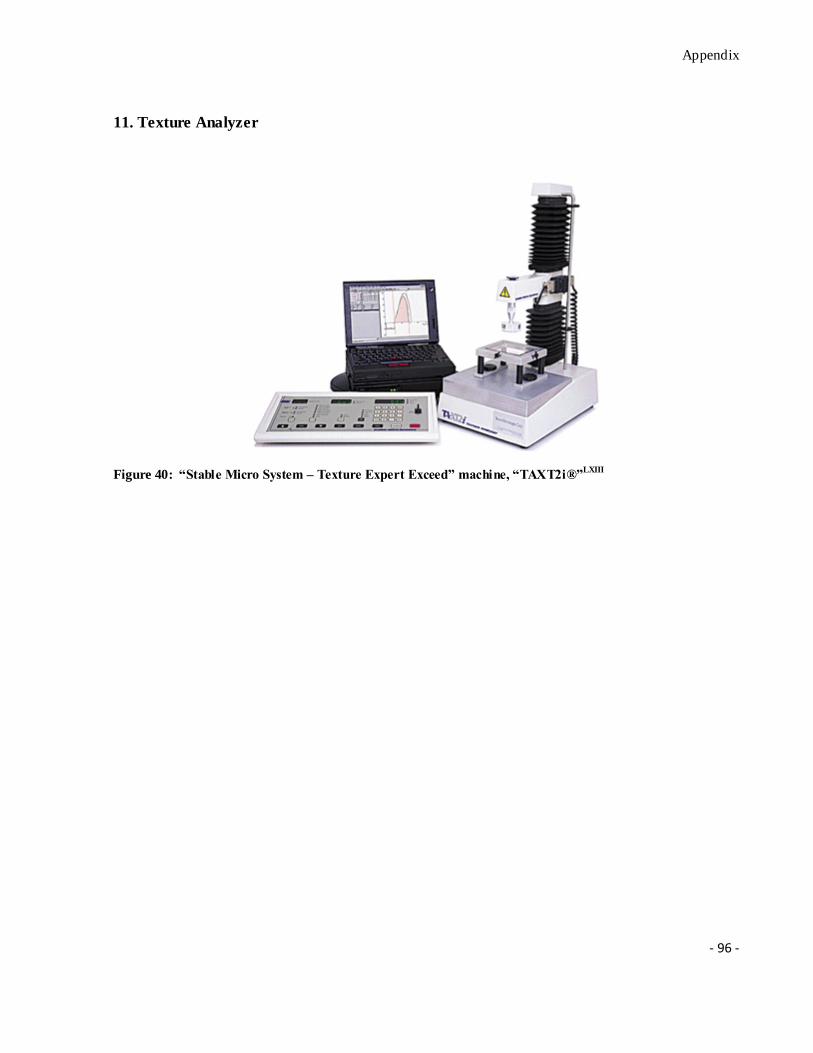
Appendix
- 96 -
11. Texture Analyzer
Figure 40: “Stable Micro System – Texture Expert Exceed” machine, “TAXT2i®”LXIII
References
- 97 -
References
I William Shurtleff and Akiko Aoyagi , “The book of tofu”, copyright 1975 p24.
II Skendi, A.Biliaderis, C.G. Lazaridou, A. Izydorczyk, M.S. “Structure and rheological properties of water soluble
β-glucans from oat cultivars of Avena sativa and Avena byzantina”, Journal of Cereal Science; Publisher: Academic
Press; Issn: 07335210; Year: 2003; Volume: 38; Issue: 1; Pages: 15-31.
III Mcraw-Hill, “Soybean encyclopaedia of science and technology”, pth edition 2002, book 17.
IV D. Futushima, Noda Institute for Scientific Research, Japan "6 Soy Proteins"
http://www.foodnetbase.com//books/1592/WP2536_CH_06.pdf#xml=http://www.foodnetbase.com/ejournals/search/
searchquery.asp?cmd=pdfhits&DocId=1274&Index=\\crcfs01\SearchIndices\Applications\1025&HitCount=4&hits=
2423+2424+2425+2426+&indexParentId=1025&hc=180&req=proteins+on+food+processing
V “Anonymous”, Oat nutrition, http://www.gramene.org/species/avena/oat_nutrition.html.
VI Leon H. Rottmann, Ph.D., Professor Emeritus, University of Nebraska-Lincoln
Lifeline, Winter 1996, Vol XIV, No 1, pp 1-2 “On the Use of Oats in the Gluten-Free Diet”,
http://www.csaceliacs.org/library/useofoats.php.
VII “Anonymous”, Oat Foods: “A Smart Choice Nutritional Properties of Oats and Oat Products” ,
http://www.namamillers.org/prd_o.html.
VIII
JS Garrow, WPT James, A Ralph; “Human Nutrition and Dietetics”, 10th
edition 2003 by Churchill Livingstone;
pages: “Oats” 333, 336, 340; “Oats products” 341; “Oat bran” 710, 344
IX “Anonymous”, “The worlds healthiest foods”, http://www.whfoods.com/genpage.php?tname=foodspice&dbid=54.
X sojabönor “AB Risenta”, Box 7411, 10391 Stockholm, Sverige
XI US code of Federal Regulations, 21 CFR 101.81
(http://edocket.access.gpo.gov/cfr_2007/aprqtr/pdf/21cfr101.81.pdf)
XII
R. A. Bowen, “Molecular tool kit”, http://www.vivo.colostate.edu/molkit/index.html .
XIII T. P. Coultate, “Food: The chemistry of its components”, 4th edition”, pages: 66; 130
XIV J. Schornmüller, „Handbuch der Lebensmittelchemie erster Band“; Springer-Verlag; Berlin (Germany); 1965
XV “anonymous“, “Isoionic point”, http://www.biology-online.org/dictionary/Isoionic_point,.
XVI “anonymous“, “Iso electric point”, http://cancerweb.ncl.ac.uk/cgi-bin/omd?isoelectric+point.
XVII Lena Olken, Thesis study: “Analysis of soybean-proteins (Glycine max) by two-dimensional electrophoresis and
MALDI-TOF”, Swedish University of Agricultural Science, Uppsala, 2006.
XVIII Charles E orphardt,” Denaturation of proteins”,
http://www.elmhurst.edu/~chm/vchembook/568denaturation.html.
XIX“anonymous“, “Biochemistry movement”, http://science.uniserve.edu.au/school/curric/stage6/chem/biochem.html
References
- 98 -
XX Taco Nicolai, Dominique Durand, “Protein aggregation and gel formation studied with scattering methods and
computer simulations”, Current Opinion in Colloid & Interface Science 12 (2007) 23–28
XXI Mark A. Shotwell, Claudio Alfonso, Eric Davies, Ruth S. Chesnut, and Brian A. Larkins; “Molecular
Characterization of Oat Seed Globulins, Plant Physiology”, (1988) 87, pp698-704
XXII Ching-Yung Ma and Venktesh R. Harwalkar, “Chemical Characterization and Functionality Assesment of Oat
Protein Fractions”, p.144 in Journal of Agriculture Chemistry, Vol.32, No.1, 1984.
XXIII Svedberg unit, noble prize.org, http://en.wikipedia.org/wiki/Svedberg
XXIV J. M. Aguilera and B. Rademacher. “Protein gels” in “Protein in food processing”, Woodhead Publishing
Limited and CRC Press. 2004
XXV Veronica A. Obatolu, “Effect of different coagulants on yield and quality of tofu from soymilk”, p.469, in Eur
Food Res. Technol. (2008)
XXVI Veronica A. Obatolu, “Effect of different coagulants on yield and quality of tofu from soymilk”, p.470, in Eur
Food Res. Technol. (2008)
XXVII EUROPEAN PARLIAMENT AND COUNCIL DIRECTIVE No 95/2/EC of 20 February 1995; "on food
additives other than colours and sweeteners" (OJ No L 61, 18. 3. 1995, p. 1), link to the web page pdf:
http://ec.europa.eu/food/fs/sfp/addit_flavor/flav11_en.pdf
XXVIII J. M. Aguilera and B. Rademacher. “Protein gels” in “Protein in food processing”. Woodhead Publishing
Limited and CRC Press. 2004
XXIX Nicolai Böhm, Werner-Michael Kulicke , “Rheological studies of barley (1.3)(1.4)-β-glucan in concentrated
solution: mechanistic and kinetic investigation of the gel formation”, Carbohydrate Research 315 (1999) 302–
311Carbohydrate Research 315 (1999) 302–311
XXX Lazaridou, A.; Biliaderis, C.G.; “Cryogelation of cereal β-glucans: structure and molecular size effects”, Journal
of Food Hydrocolloids Year: 2004 Volume: 18 Issue: 6 Pages: 933-947
XXXI Tosh, S.M.; Wood, P.J.; Wang, Q.; Weisz, J.; “Structural characteristics and rheological properties of partially
hydrolyzed oat β-glucan: the effects of molecular weight and hydrolysis method”, Journal of Carbohydrate Polymers
Year: 2004 Volume: 55 Issue: 4 Pages: 425-436
XXXII Lazaridou, A.; Biliaderis, C.G; “Molecular aspects of cereal β-glucan functionality: Physical properties,
technological applications and physiological effects”, Journal of Cereal Science Year: 2007 Volume: 46 Issue: 2
Pages: 101-118.
XXXIII US code of Federal Regulations, 21 CFR 101.81
(http://edocket.access.gpo.gov/cfr_2007/aprqtr/pdf/21cfr101.81.pdf)
XXXIV
Nygaart_Lehtinen, Norden, Nordic innovation center; “Granity Rye and oats for health”,
www.vtt.fi/liitetiedostot/muut/Grainity_Beta-glucan_Nygaart_Lehtinen.pdf .
XXXV Glucagel;”Naturally extracting the goodness of barley”, http://www.glucagel.com/faq.htm
XXXVI US code of Federal Regulations, 21 CFR 101.81
(http://edocket.access.gpo.gov/cfr_2007/aprqtr/pdf/21cfr101.81.pdf)
References
- 99 -
XXXVII
FAO corporate respiratory documentation: “Dietary carbohydrate composition”
http://www.fao.org/docrep/W8079E/w8079e0h.htm
XXXVIII Salem Sassi Shamekh; "Effects of lipids, heating and enzymatic treatment on starches"; Espoo 2002;
Technical Research Centre of Finland VTT Publications 460.44p. + app. 33 p.
XXXIX W.Banks and C.T.Greenwood; “Starch and its components”; Edinburgh University Press; 1975
XL Ann-Charlotte Eliasson and Kare Larsson,“Cereals in Breadmaking, a molecular approach” , Library of
Chemistry and Chemical Engineering, Lund University.
XLI Taylor & Francis Group, “Separation and Concentration” in “Food Processing: Principles and Applications”,
London, 2006.
XLII H.G. Kessler, “Centrifugation – Separation – Cyclone Separation” in “Food and Bio Process Engineering:
Dairy technology”, Publishing house of A. Kessler, München, 2002, pp: 42-52.
XLIII Guy Linden and Denis Lorient, “Extraction and texturisation processes” in “New ingredients in food
processing: Biochemistry and agriculture”, Dr M J Lewis (eds), Woodhead Publishing Limited, Cambridge, 1999,
ch:3
XLIV Guan, X.; Yao, H.; “Optimization of Viscozyme L-assisted extraction of oat bran protein using response surface
methodology” Journal of Food Chemistry, Year: 2008, Volume: 106, Issue: 1, Pages: 345-351 Provider: Elsevier.
XLV Ching-Yung Ma and Ventktesh R. Harwalkar,“Study of Thermal Denaturation of Oat Globulin by Ultraviolet
and Fluorescence Spectrophotometer”, Journal of agricultural food chemistry 1088, 36, p 157.
XLVI Ching-Yung Ma, Ghanikhan Khanzada, and Venktesh R. Harwalkar; “Thermal Gelation of Oat Globulin”, J.
Agric. Food Chem. 1988, 36; 276
XLVII
Bei-Zhong Han, Rijkelt R.Beumer, Frans M. Romboutous, M.J Robert Nout, “Microbial safety and quality of
commercial sufu – a chinese fermented soybean food”, Food control 12 2001, 541-547
XLVIII
William Shurtleff and Akiko Aoyagi; “A Chapter from the Unpublished Manuscript, History of Soybeans and
Soyfoods, 1100 b.C. to the 1980s” http://www.soyinfocenter.com/HSS/tofu4.php.
XLIX WHO - WHO; 20 QUESTIONS ON GENETICALLY MODIFIED (GM) FOODS,
http://www.who.int/foodsafety/publications/biotech/20questions/en/
L Food and agriculture organization of the united nations; “The static divisions”
http://www.fao.org/es/ess/top/commodity.html?lang=en&item=236&year=2005.
LI European food safety authority,
http://www.efsa.europa.eu/EFSA/efsa_locale-1178620753812_1178620763910.htm%20Date:%2028.04.2008.
LII Jacob Wilson; "Protein Composition & Quality" http://www.abcbodybuilding.com/proteinanalysis6.pdf
References
- 100 -
LIII US Code of Federal Regulations, 21 CFR
101.81http://edocket.access.gpo.gov/cfr_2007/aprqtr/PDF/21cfr101.81.pdf acessed on 24th jan 2008
LIV Heléne Enghardt Barbieri and Cecilia Lindvall for Swedish Nutrition Recommendations Objectified
(SNO);"Basis for general advices on food consumption for healthy adults"; Rapport 20 – 2005
http://www.slv.se/upload/dokument/rapporter/mat_naring/Report_20_2005_SNO_eng.pdf
LV e-CFR Data 101.72 Health claims: calcium and osteoporosis" e-CFR Data is current as of May 8, 2008
http://ecfr.gpoaccess.gov/cgi/t/text/text-
idx?c=ecfr&sid=8c5344f04a8ae103e5b0ff5a17c7fa97&rgn=div8&view=text&node=21:2.0.1.1.2.5.1.3&idno=21
LVI CODEX STANDARD FOR "GLUTEN-FREE FOODS" CODEX STAN 118-1981
www.codexalimentarius.net/download/standards/291/CXS_118e.pdf
LVII
National Food Administration’s Regulations on the Use of a Particular Symbol;
LIVSFS 2005:9 http://www.slv.se/upload/nfa/documents/food_regulations/Keyhole_2005_9.pdf
LVIII USDA Nutrient Database for Standard Reference
LIX JS Garrow, WPT James, A Ralph, “Human Nutrition and Dietetics” 10
th edition 2003 by Churchill Livingstone;
page 342; table 18.7
LX K.C.Chang and H.J.Hou, “Science and technology of Tofu Making”, 2004
LXI K.C. Chang and H.J. Hou, “Science and Technology of Tofu Making”, in“Handbook of Vegetable Preservation
and Processing”, edited by Yiu H. Hui, Sue Ghazala, Dee M Graham, K.D.Murrel, Wai-Kit Nip, CRC Press 2004,
pp 443.
LXII James J. Filliben; “Critical Values of the Student's-t Distribution in Engineering Statistic Handbook”,
http://www.itl.nist.gov/div898/handbook/eda/section3/eda3672.htm
LXIII Stable Micro Systems, Ltd, http://www.texturetechnologies.com/TAXT2_Texture_Analyzer.htm