Data Mining - unipi.itdidawiki.cli.di.unipi.it/lib/exe/fetch.php/dm/dm_intro-2011.pdf · Data...
122
Data Mining Knowledge Discovery in Databases Dino Pedreschi, Fosca Giannotti, Mirco Nanni Dino Pedreschi, Fosca Giannotti, Mirco Nanni Pisa KDD Lab, ISTI-CNR & Univ. Pisa http://www-kdd.isti.cnr.it/ Laurea Magistrale in Business Informatics A.A. 2010-2011
Transcript of Data Mining - unipi.itdidawiki.cli.di.unipi.it/lib/exe/fetch.php/dm/dm_intro-2011.pdf · Data...
Data Mining
Knowledge Discovery in Databases
Dino Pedreschi, Fosca Giannotti, Mirco NanniDino Pedreschi, Fosca Giannotti, Mirco Nanni
Pisa KDD Lab, ISTI-CNR & Univ. Pisa
http://www-kdd.isti.cnr.it/
Laurea Magistrale in Business InformaticsA.A. 2010-2011
� Primo modulo: Data Mining Fondamenti
Dino Pedreschi, [email protected]
� Secondo modulo: Data Mining Aspetti Avanzati e
Applicazioni
Fosca Giannotti, [email protected]
Docenti
� Assistente:
Mirco Nanni, [email protected]
� Web: http://www.cli.di.unipi.it/doku/doku.php/dm/start
� KDD LAB: http://www-kdd.isti.cnr.it
Giannotti & PedreschiDM – Business Informatics 2

Outline
�Motivations
�Application Areas
�KDD Decisional Context
�KDD Process
Giannotti & PedreschiData Mining x MAINS - Seminar 1 3
�KDD Process
�Architecture of a KDD system
�The KDD steps in short
�Some examples in short

Evolution of Database Technology:
from data management to data analysis
� 1960s:
Data collection, database creation, IMS and network DBMS.
� 1970s:
Relational data model, relational DBMS implementation.
� 1980s:
Giannotti & PedreschiData Mining x MAINS - Seminar 1 4
� 1980s:
RDBMS, advanced data models (extended-relational, OO, deductive,
etc.) and application-oriented DBMS (spatial, scientific, engineering,
etc.).
� 1990s:
Data mining and data warehousing, multimedia databases, and Web
technology.
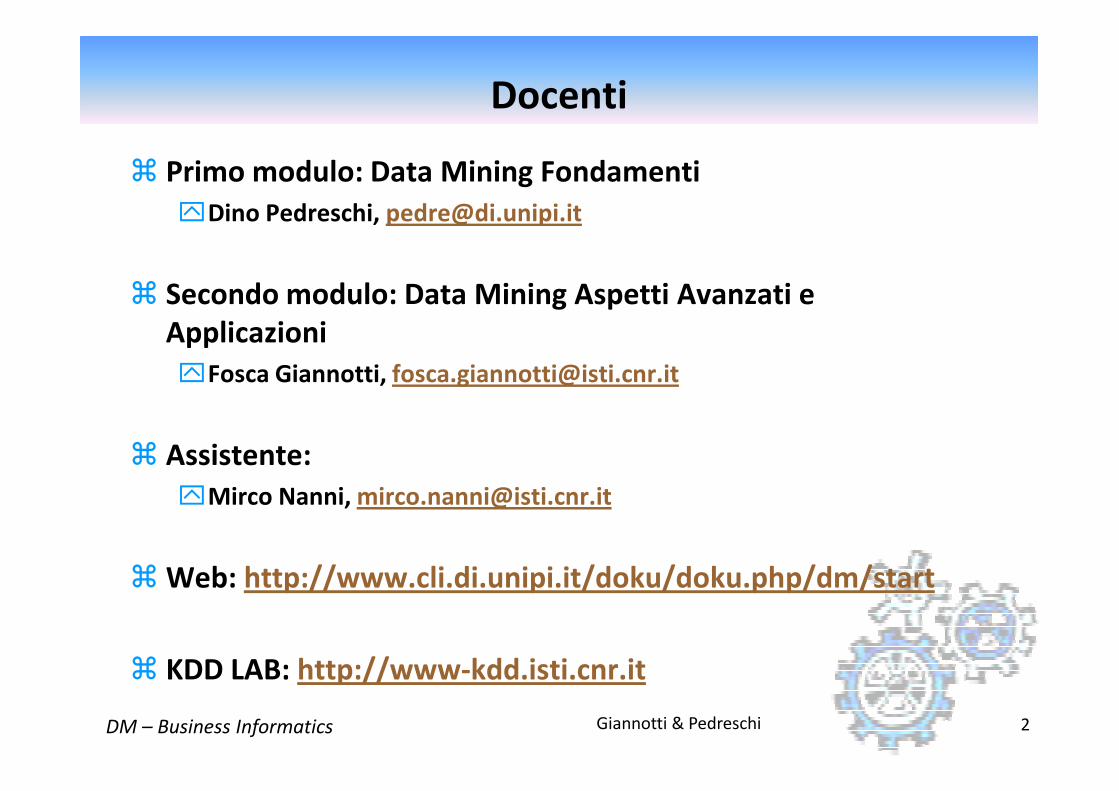
�Lots of data is being collected and warehoused
Web data, e-commerce
purchases at department/grocery stores
Bank/Credit Card
Why Mine Data? Commercial Viewpoint
Giannotti & PedreschiData Mining x MAINS - Seminar 1 5
Bank/Credit Card transactions
�Computers have become cheaper and more powerful
�Competitive Pressure is Strong
Provide better, customized services for an edge (e.g. in Customer Relationship Management)
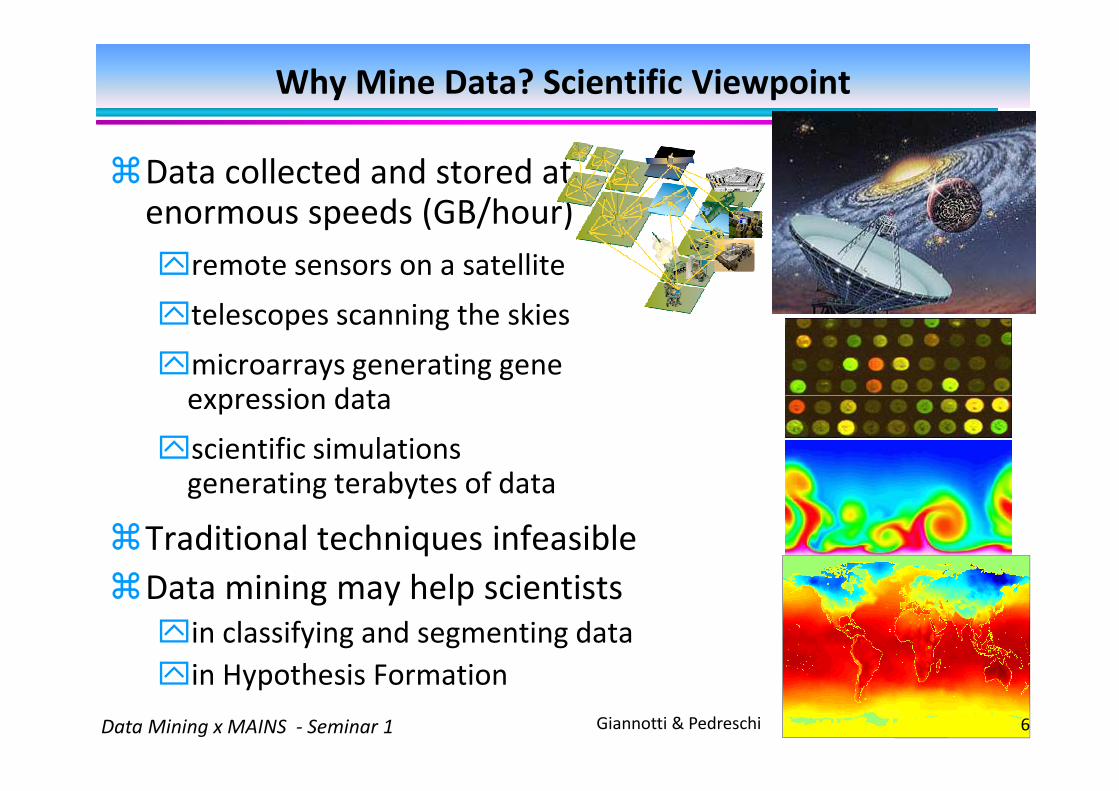
Why Mine Data? Scientific Viewpoint
�Data collected and stored at enormous speeds (GB/hour)
remote sensors on a satellite
telescopes scanning the skies
microarrays generating gene expression dataexpression data
scientific simulations generating terabytes of data
�Traditional techniques infeasible
�Data mining may help scientists
in classifying and segmenting data
in Hypothesis Formation
Giannotti & Pedreschi 6Data Mining x MAINS - Seminar 1
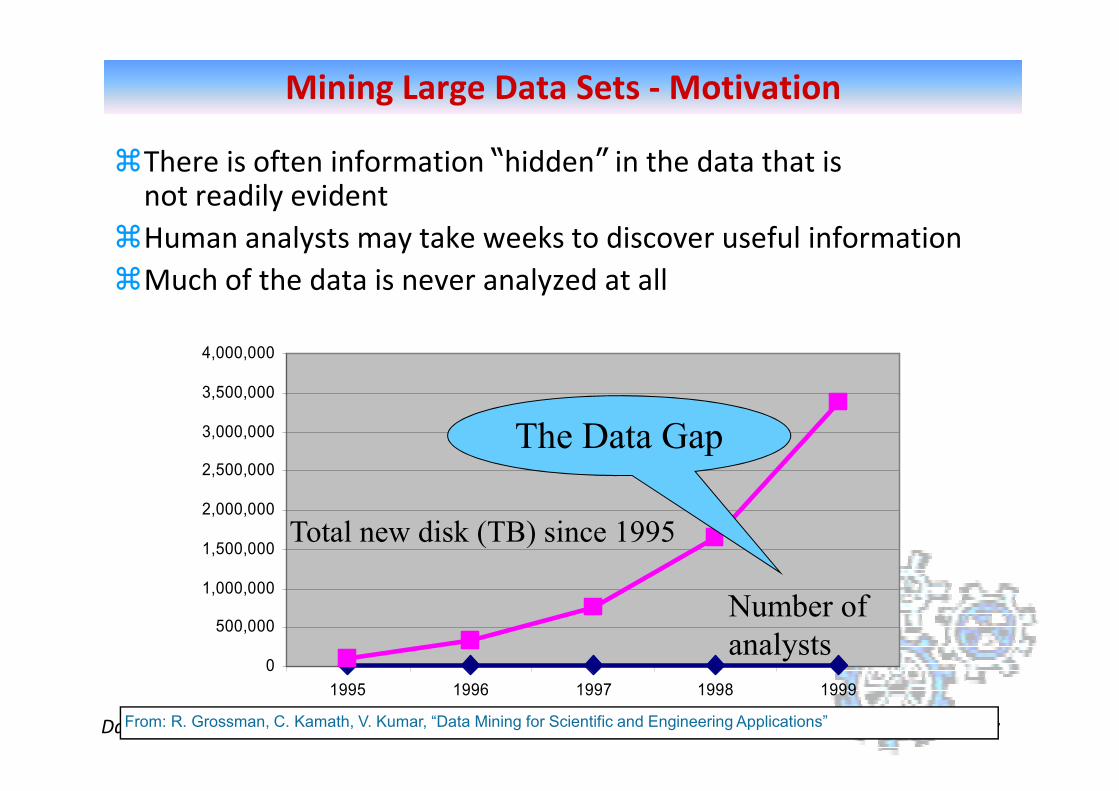
Mining Large Data Sets - Motivation
�There is often information “hidden” in the data that is not readily evident
�Human analysts may take weeks to discover useful information
�Much of the data is never analyzed at all
3,500,000
4,000,000
Giannotti & PedreschiData Mining x MAINS - Seminar 1 7
0
500,000
1,000,000
1,500,000
2,000,000
2,500,000
3,000,000
3,500,000
1995 1996 1997 1998 1999
The Data Gap
Total new disk (TB) since 1995
Number of
analysts
From: R. Grossman, C. Kamath, V. Kumar, “Data Mining for Scientific and Engineering Applications”
Motivations
“Necessity is the Mother of Invention”� Data explosion problem:
Automated data collection tools, mature database technology
and internet lead to tremendous amounts of data stored in
databases, data warehouses and other information repositories.
� We are drowning in information, but starving for
knowledge! (John Naisbett)
Giannotti & PedreschiData Mining x MAINS - Seminar 1 8
knowledge! (John Naisbett)
� Data warehousing and data mining :
On-line analytical processing
Extraction of interesting knowledge (rules, regularities, patterns,
constraints) from data in large databases.
Why Data Mining
� Increased Availability of Huge Amounts of Datapoint-of-sale customer data
digitization of text, images, video, voice, etc.
World Wide Web and Online collections
� Data Too Large or Complex for Classical or Manual Analysisnumber of records in millions or billions
high dimensional data (too many fields/features/attributes)
often too sparse for rudimentary observations
Giannotti & PedreschiData Mining x MAINS - Seminar 1 9
often too sparse for rudimentary observations
high rate of growth (e.g., through logging or automatic data collection)
heterogeneous data sources
� Business Necessitye-commerce
high degree of competition
personalization, customer loyalty, market segmentation
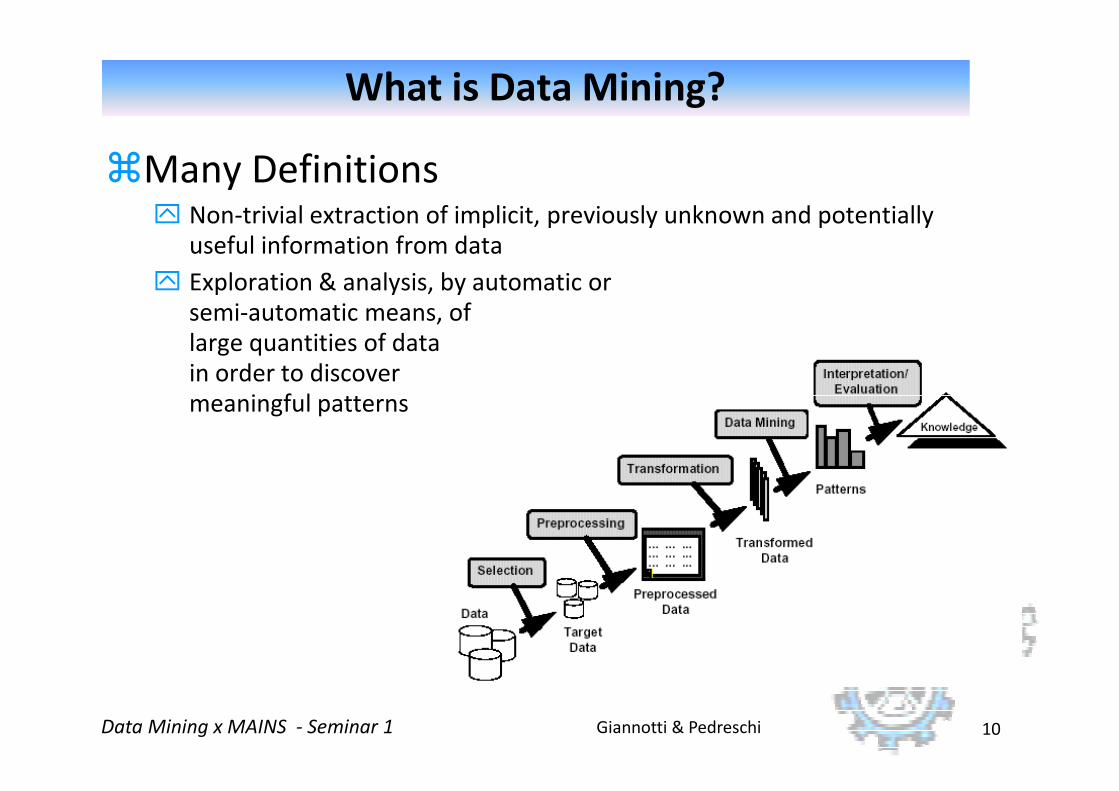
What is Data Mining?
�Many Definitions Non-trivial extraction of implicit, previously unknown and potentially
useful information from data
Exploration & analysis, by automatic or semi-automatic means, of large quantities of data in order to discover meaningful patterns
Giannotti & PedreschiData Mining x MAINS - Seminar 1 10
meaningful patterns

What is (not) Data Mining?
� What is Data Mining?
– Certain names are more prevalent in certain US locations (O’Brien, O’Rurke,
� What is not Data Mining?
– Look up phone number in phone directory
Giannotti & PedreschiData Mining x MAINS - Seminar 1 11
locations (O’Brien, O’Rurke, O’Reilly8 in Boston area)
– Group together similar documents returned by search engine according to their context (e.g. Amazon rainforest, Amazon.com,)
directory
– Query a Web search engine for information about “Amazon”
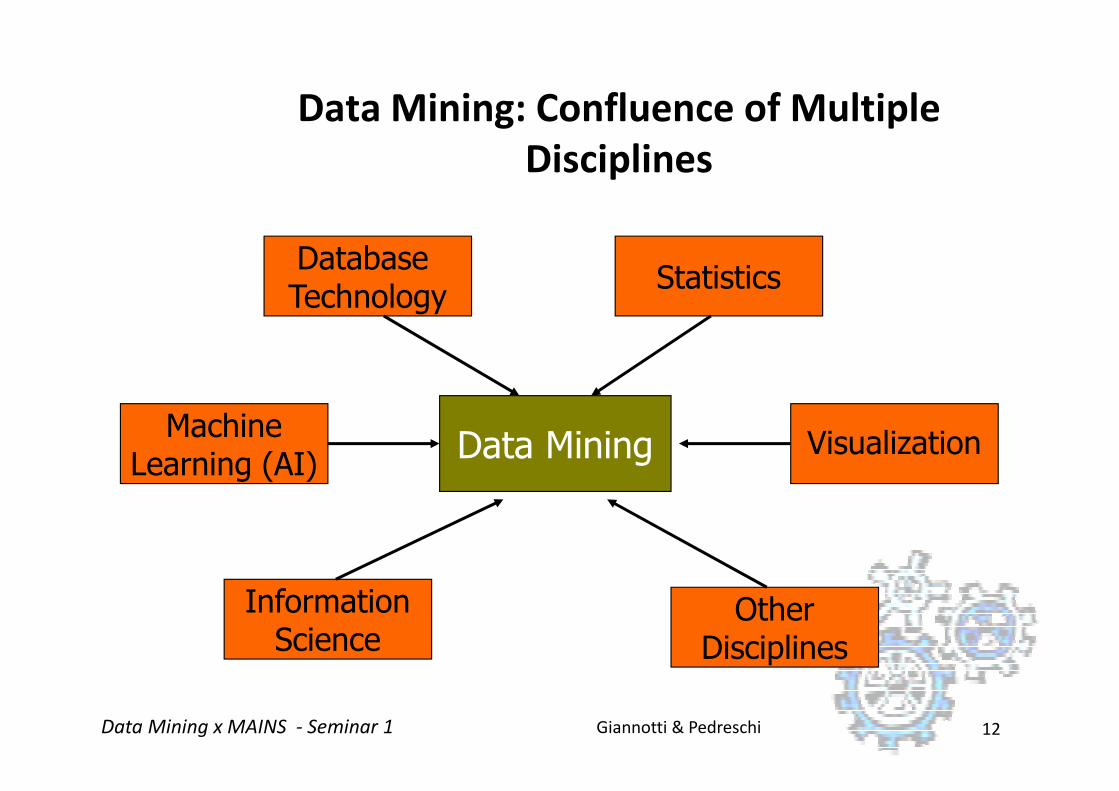
Data Mining: Confluence of Multiple
Disciplines
Database Technology
Statistics
Giannotti & PedreschiData Mining x MAINS - Seminar 1 12
Data Mining
OtherDisciplines
InformationScience
MachineLearning (AI)
Visualization
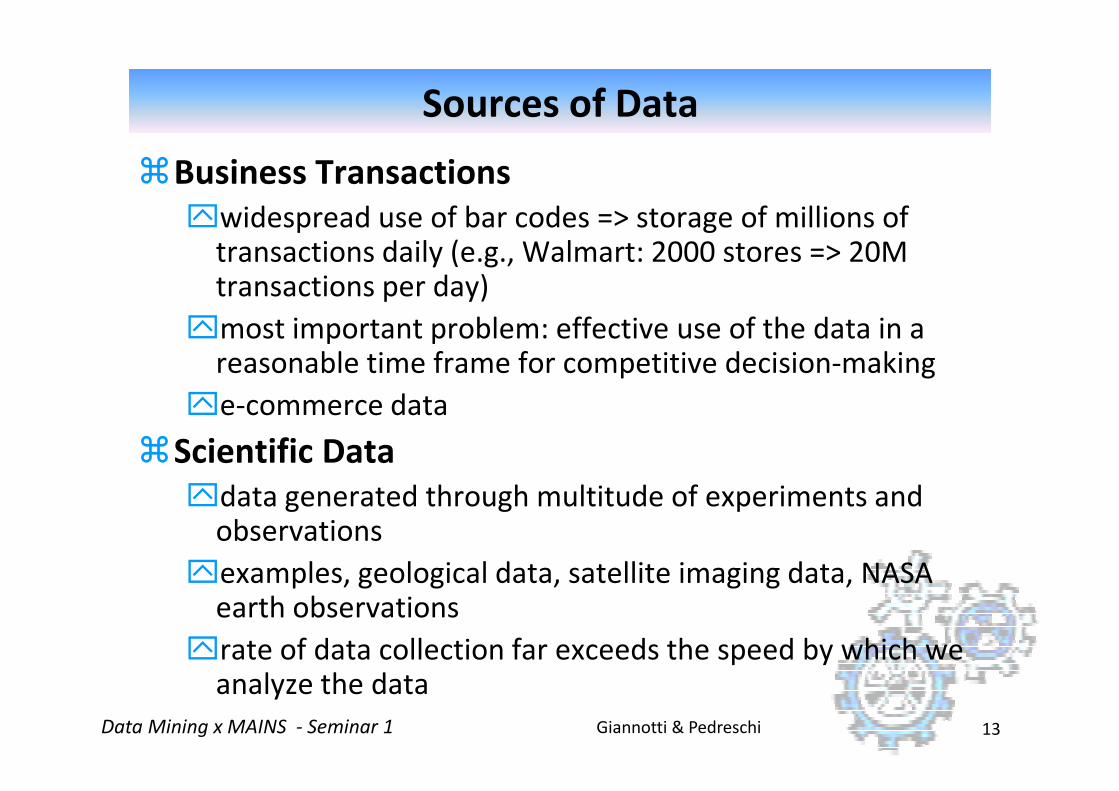
Sources of Data
�Business Transactions
widespread use of bar codes => storage of millions of transactions daily (e.g., Walmart: 2000 stores => 20M transactions per day)
most important problem: effective use of the data in a reasonable time frame for competitive decision-making
e-commerce data
Giannotti & PedreschiData Mining x MAINS - Seminar 1 13
e-commerce data
�Scientific Data
data generated through multitude of experiments and observations
examples, geological data, satellite imaging data, NASA earth observations
rate of data collection far exceeds the speed by which we analyze the data
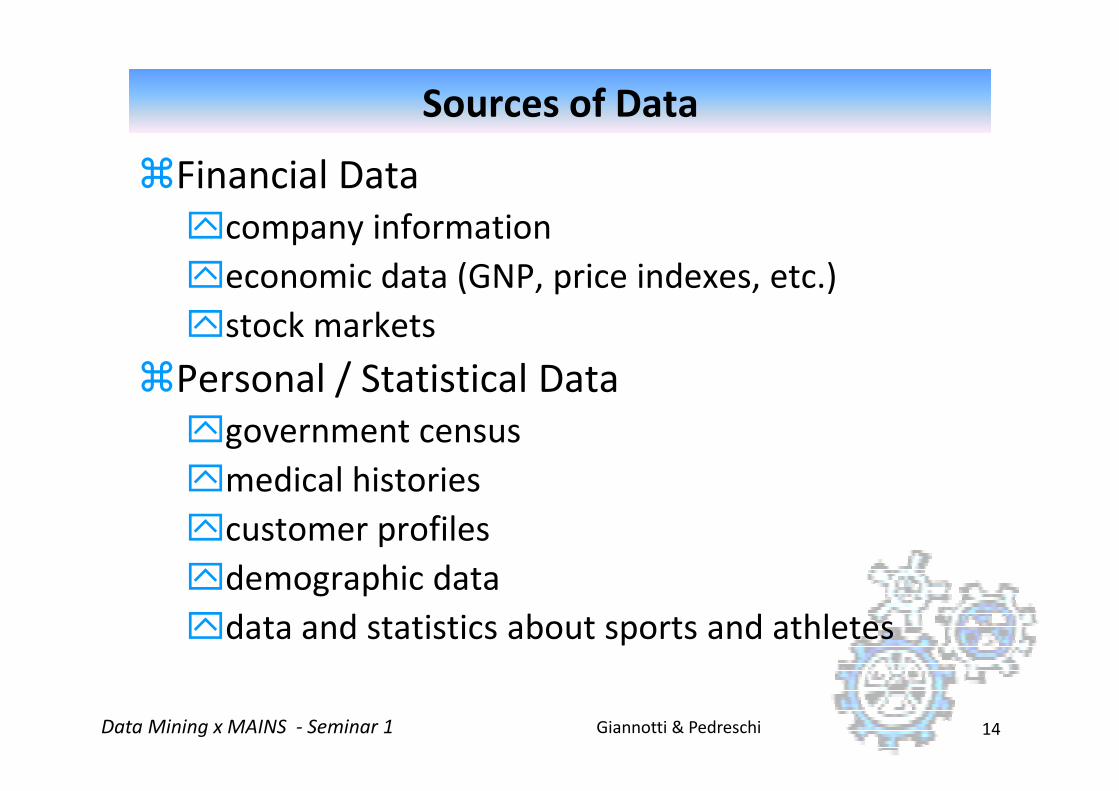
Sources of Data
�Financial Data
company information
economic data (GNP, price indexes, etc.)
stock markets
�Personal / Statistical Data
Giannotti & PedreschiData Mining x MAINS - Seminar 1 14
�Personal / Statistical Data
government census
medical histories
customer profiles
demographic data
data and statistics about sports and athletes
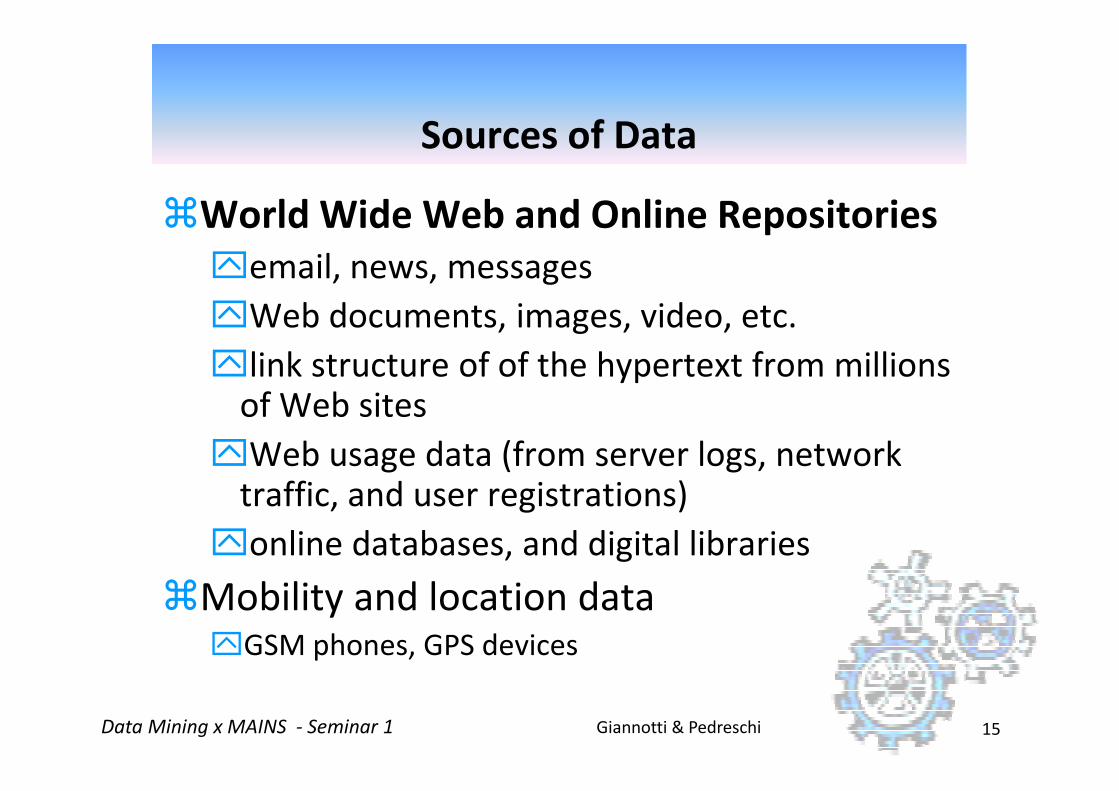
Sources of Data
�World Wide Web and Online Repositories
email, news, messages
Web documents, images, video, etc.
link structure of of the hypertext from millions of Web sites
Giannotti & PedreschiData Mining x MAINS - Seminar 1 15
of Web sites
Web usage data (from server logs, network traffic, and user registrations)
online databases, and digital libraries
�Mobility and location dataGSM phones, GPS devices

Classes of applications
� Database analysis and decision support
Market analysis
• target marketing, customer relation management, market
basket analysis, cross selling, market segmentation.
Risk analysis
• Forecasting, customer retention, improved underwriting,
Giannotti & PedreschiData Mining x MAINS - Seminar 1 16
• Forecasting, customer retention, improved underwriting,
quality control, competitive analysis.
Fraud detection
� New Applications from New sources of data
Text (news group, email, documents)
Web analysis and intelligent search
Mobility analysis
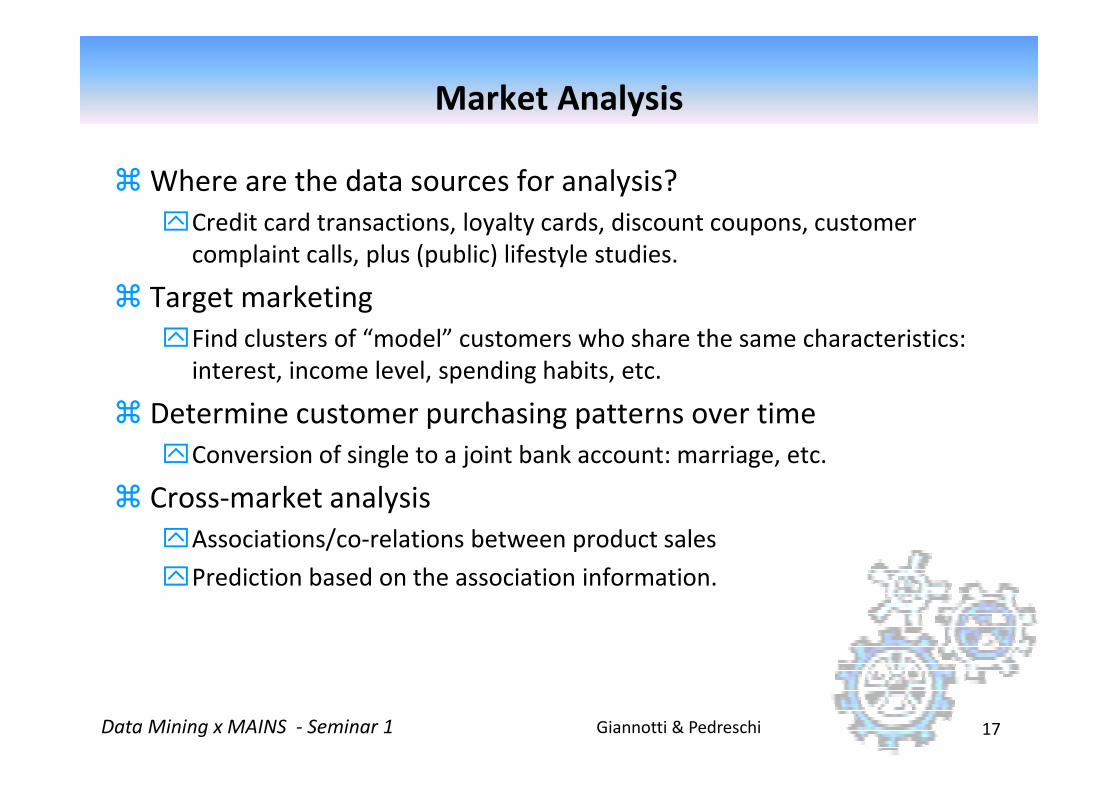
� Where are the data sources for analysis?
Credit card transactions, loyalty cards, discount coupons, customer
complaint calls, plus (public) lifestyle studies.
� Target marketing
Find clusters of “model” customers who share the same characteristics:
interest, income level, spending habits, etc.
� Determine customer purchasing patterns over time
Market Analysis
Giannotti & PedreschiData Mining x MAINS - Seminar 1 17
� Determine customer purchasing patterns over time
Conversion of single to a joint bank account: marriage, etc.
� Cross-market analysis
Associations/co-relations between product sales
Prediction based on the association information.
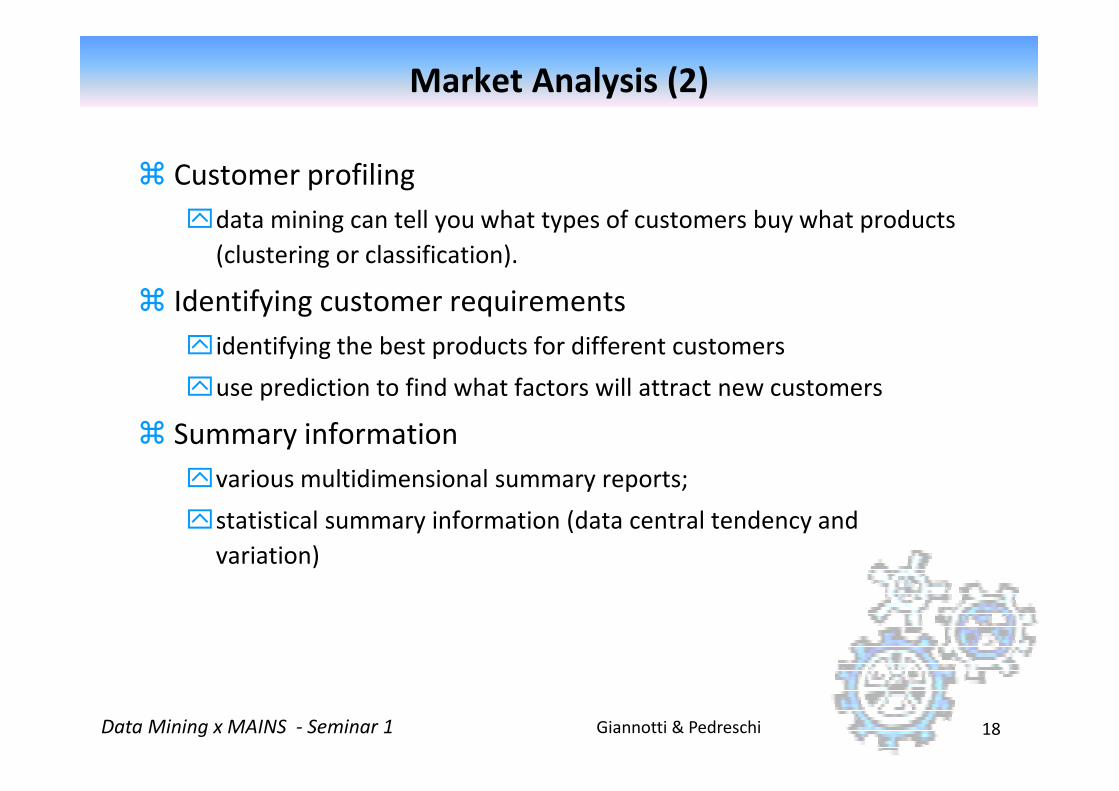
� Customer profiling
data mining can tell you what types of customers buy what products
(clustering or classification).
� Identifying customer requirements
identifying the best products for different customers
use prediction to find what factors will attract new customers
Market Analysis (2)
Giannotti & PedreschiData Mining x MAINS - Seminar 1 18
use prediction to find what factors will attract new customers
� Summary information
various multidimensional summary reports;
statistical summary information (data central tendency and
variation)

�Finance planning and asset evaluation:
cash flow analysis and prediction
contingent claim analysis to evaluate assets
trend analysis
�Resource planning:
Risk Analysis
Giannotti & PedreschiData Mining x MAINS - Seminar 1 19
summarize and compare the resources and spending
�Competition:
monitor competitors and market directions (CI: competitive intelligence).
group customers into classes and class-based pricing procedures
set pricing strategy in a highly competitive market
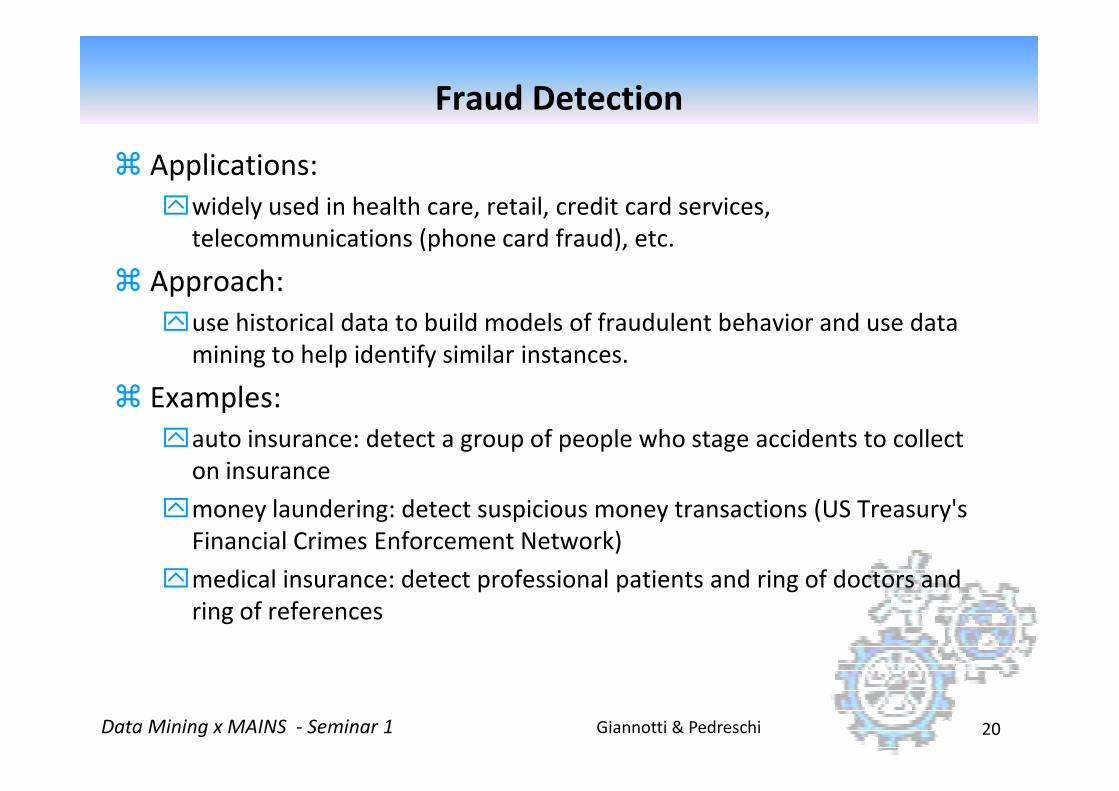
� Applications:
widely used in health care, retail, credit card services,
telecommunications (phone card fraud), etc.
� Approach:
use historical data to build models of fraudulent behavior and use data
mining to help identify similar instances.
� Examples:
Fraud Detection
Giannotti & PedreschiData Mining x MAINS - Seminar 1 20
� Examples:
auto insurance: detect a group of people who stage accidents to collect
on insurance
money laundering: detect suspicious money transactions (US Treasury's
Financial Crimes Enforcement Network)
medical insurance: detect professional patients and ring of doctors and
ring of references
� More examples:
Detecting inappropriate medical treatment:
Australian Health Insurance Commission identifies that in many cases
blanket screening tests were requested (save Australian $1m/yr).
Detecting telephone fraud:
Fraud Detection (2)
Giannotti & PedreschiData Mining x MAINS - Seminar 1 21
Telephone call model: destination of the call, duration, time of day or
week. Analyze patterns that deviate from an expected norm.
Retail: Analysts estimate that 38% of retail shrink is due to dishonest
employees.
� Sports
IBM Advanced Scout analyzed NBA game statistics (shots blocked,
assists, and fouls) to gain competitive advantage for New York Knicks
and Miami Heat.
� Astronomy
JPL and the Palomar Observatory discovered 22 quasars with the help
Other applications
Giannotti & PedreschiData Mining x MAINS - Seminar 1 22
JPL and the Palomar Observatory discovered 22 quasars with the help
of data mining
� Internet Web Surf-Aid
IBM Surf-Aid applies data mining algorithms to Web access logs for
market-related pages to discover customer preference and behavior
pages, analyzing effectiveness of Web marketing, improving Web site
organization, etc.
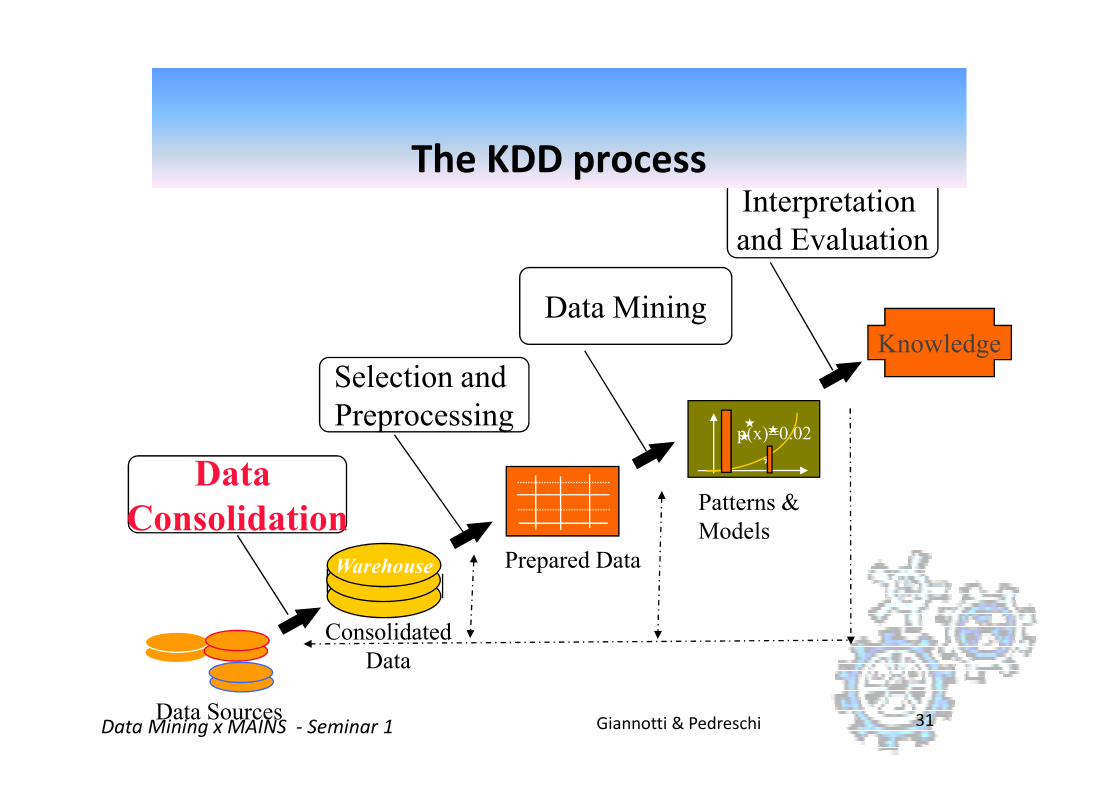
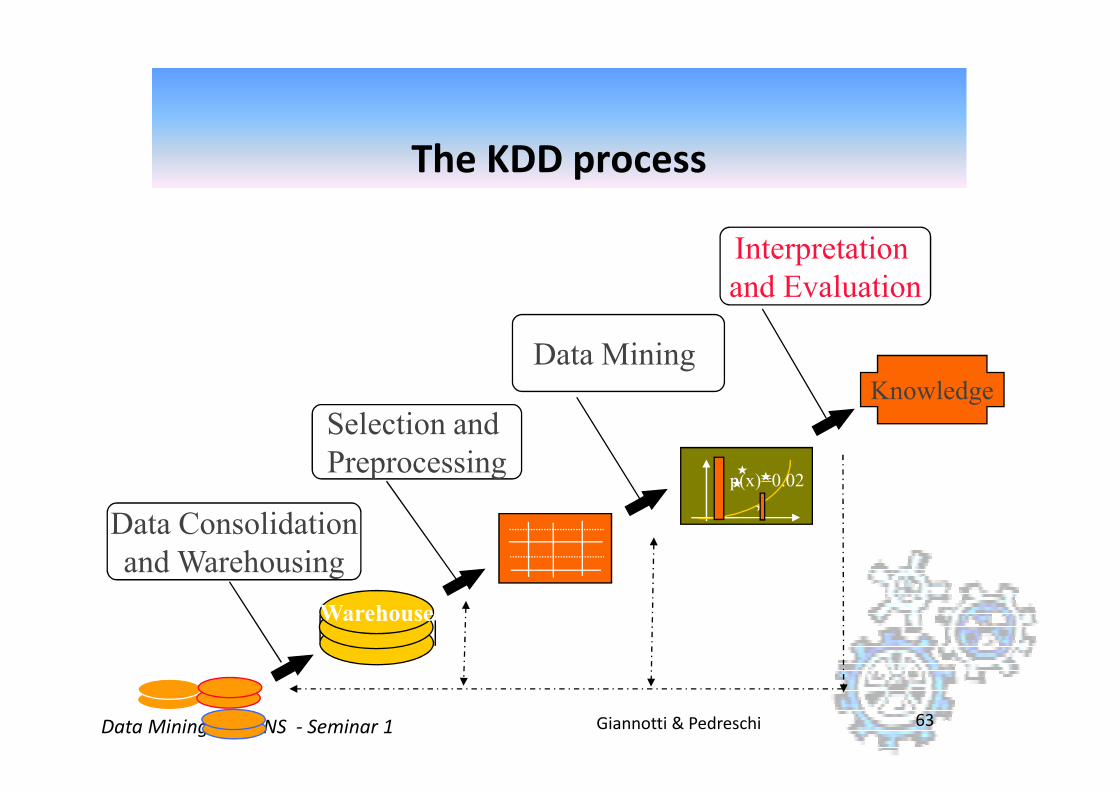
�The selection and processing of data for:
the identification of novel, accurate, and usefulpatterns, and
the modeling of real-world phenomena.
What is Knowledge Discovery in Databases (KDD)?
A process!
Giannotti & PedreschiData Mining x MAINS - Seminar 1 23
�Data mining is a major component of the KDD process - automated discovery of patterns and the development of predictive and explanatory models.
Selection and
Data Mining
Interpretation
and Evaluation
Knowledge
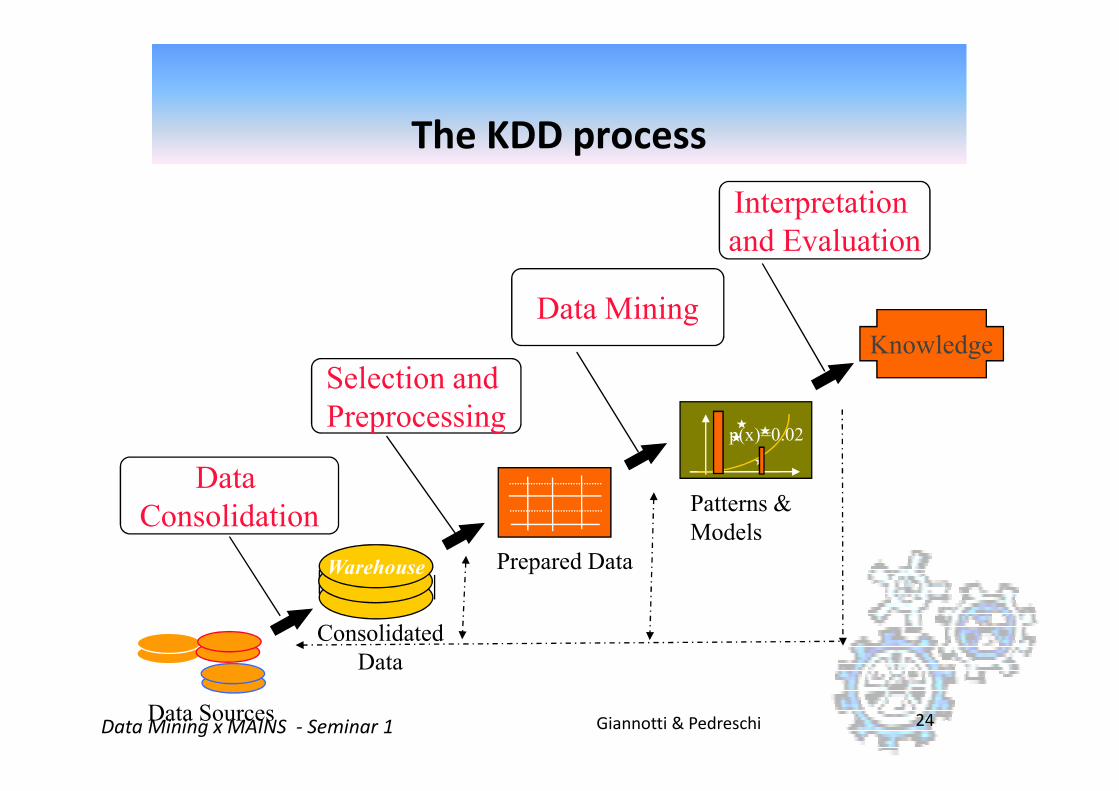
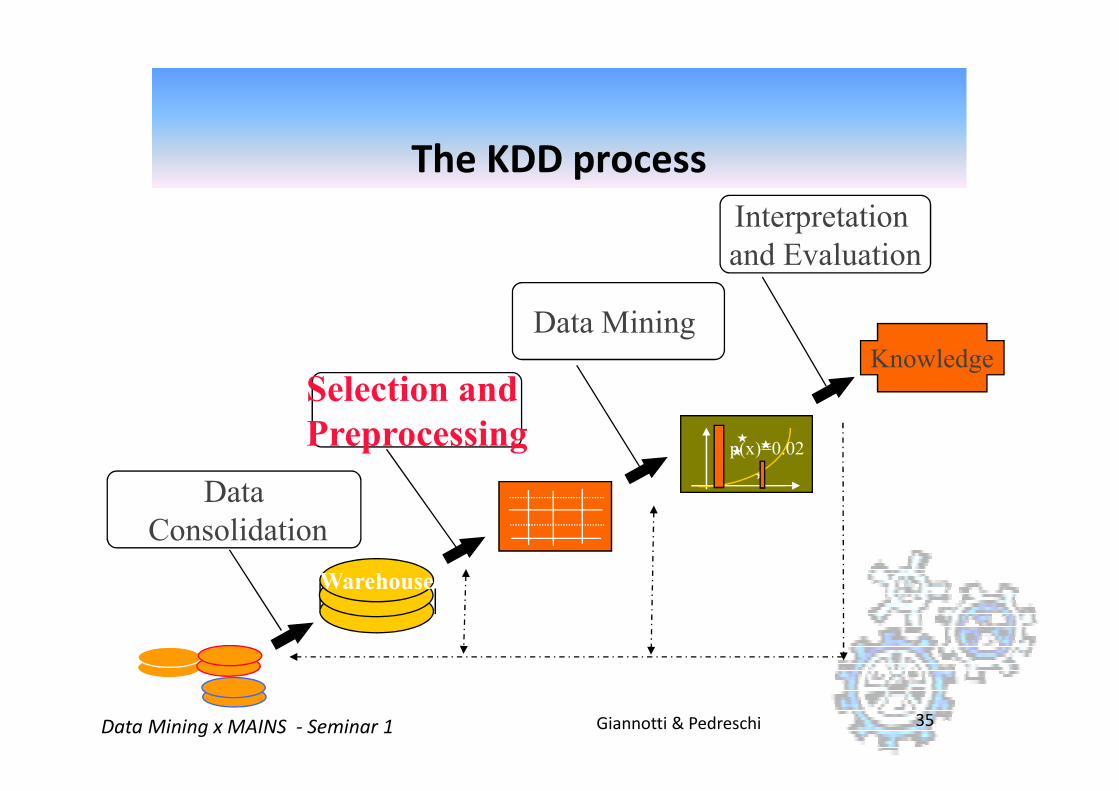
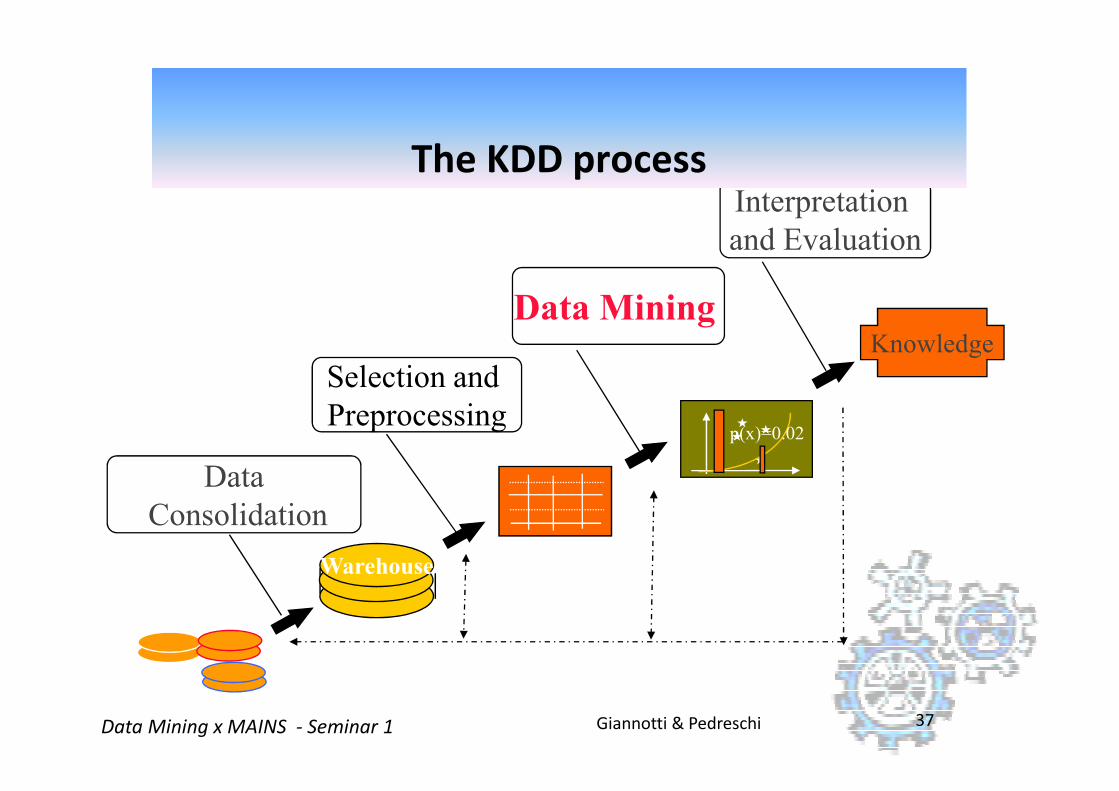
The KDD process
Giannotti & PedreschiData Mining x MAINS - Seminar 1 24
Preprocessing
Data
Consolidation
p(x)=0.02
Warehouse
Data Sources
Patterns &
Models
Prepared Data
Consolidated
Data
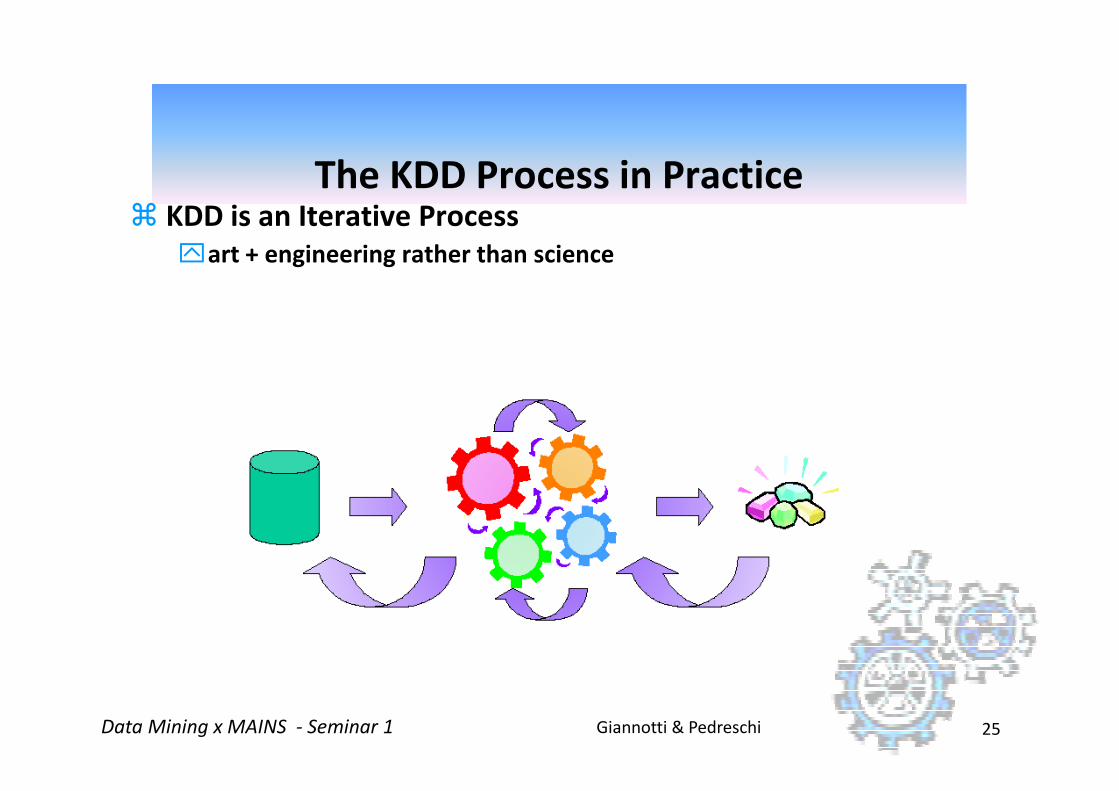
The KDD Process in Practice � KDD is an Iterative Process
art + engineering rather than science
Giannotti & PedreschiData Mining x MAINS - Seminar 1 25

� Learning the application domain:
relevant prior knowledge and goals of application
� Data consolidation: Creating a target data set
� Selection and Preprocessing
Data cleaning : (may take 60% of effort!)
Data reduction and projection:
find useful features, dimensionality/variable reduction, invariant representation.
� Choosing functions of data mining
The steps of the KDD process
Giannotti & PedreschiData Mining x MAINS - Seminar 1 26
� Choosing functions of data mining
summarization, classification, regression, association, clustering.
� Choosing the mining algorithm(s)
� Data mining: search for patterns of interest
� Interpretation and evaluation: analysis of results.
visualization, transformation, removing redundant patterns, …
� Use of discovered knowledge
CogNovaTechnologies
9
The KDD ProcessThe KDD Process
Selection and
Preprocessing
Data Mining
Interpretation
and Evaluation
Data
Consolidation
Knowledge
p(x)=0.02
Warehouse
Data Sources
Patterns &
Models
Prepared Data
Consolidated
Data
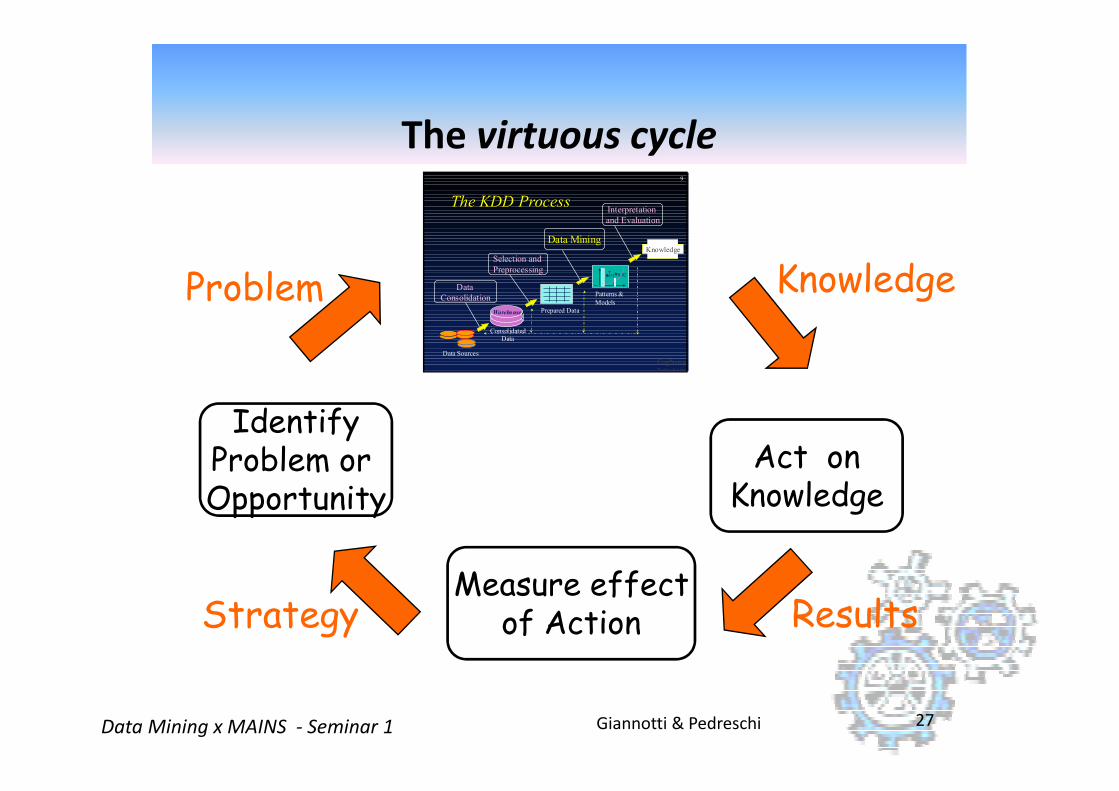
KnowledgeProblem
The virtuous cycle
Giannotti & PedreschiData Mining x MAINS - Seminar 1 27
IdentifyProblem or Opportunity
Measure effectof Action
Act onKnowledge
ResultsStrategy
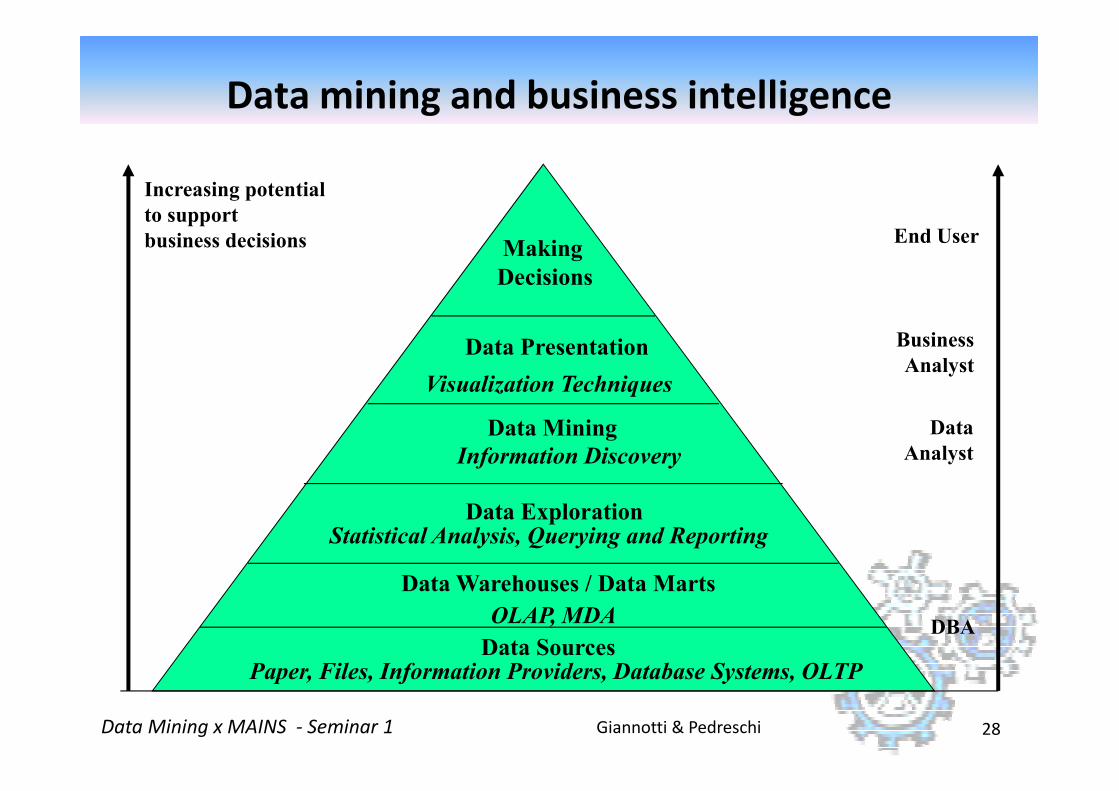
Increasing potential
to support
business decisions End User
Business
Analyst
Making
Decisions
Data Presentation
Visualization Techniques
Data mining and business intelligence
Giannotti & PedreschiData Mining x MAINS - Seminar 1 28
Data
Analyst
DBA
Visualization Techniques
Data Mining
Information Discovery
Data Exploration
OLAP, MDA
Statistical Analysis, Querying and Reporting
Data Warehouses / Data Marts
Data SourcesPaper, Files, Information Providers, Database Systems, OLTP
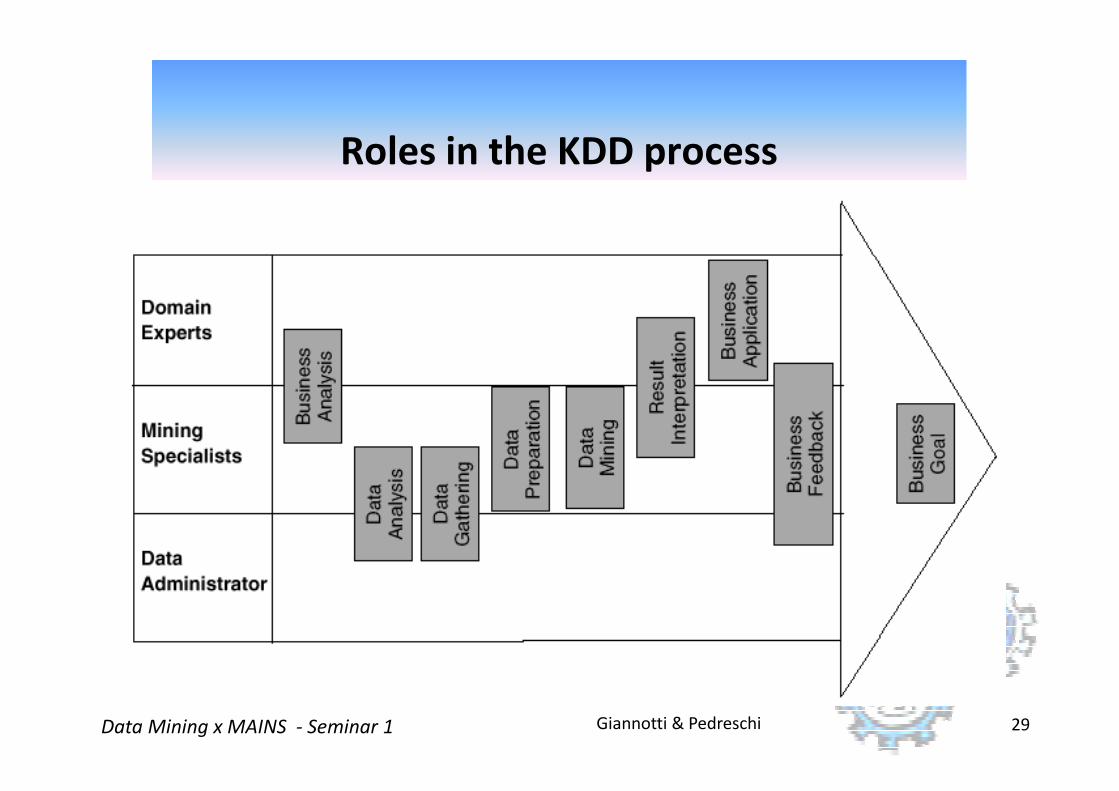
Roles in the KDD process
Giannotti & PedreschiData Mining x MAINS - Seminar 1 29

A business intelligence environment
Giannotti & PedreschiData Mining x MAINS - Seminar 1 30
Selection and
Data Mining
Interpretation
and Evaluation
Knowledge
The KDD process
Giannotti & PedreschiData Mining x MAINS - Seminar 1 31
Preprocessing
Data
Consolidation
p(x)=0.02
Warehouse
Data Sources
Patterns &
Models
Prepared Data
Consolidated
Data
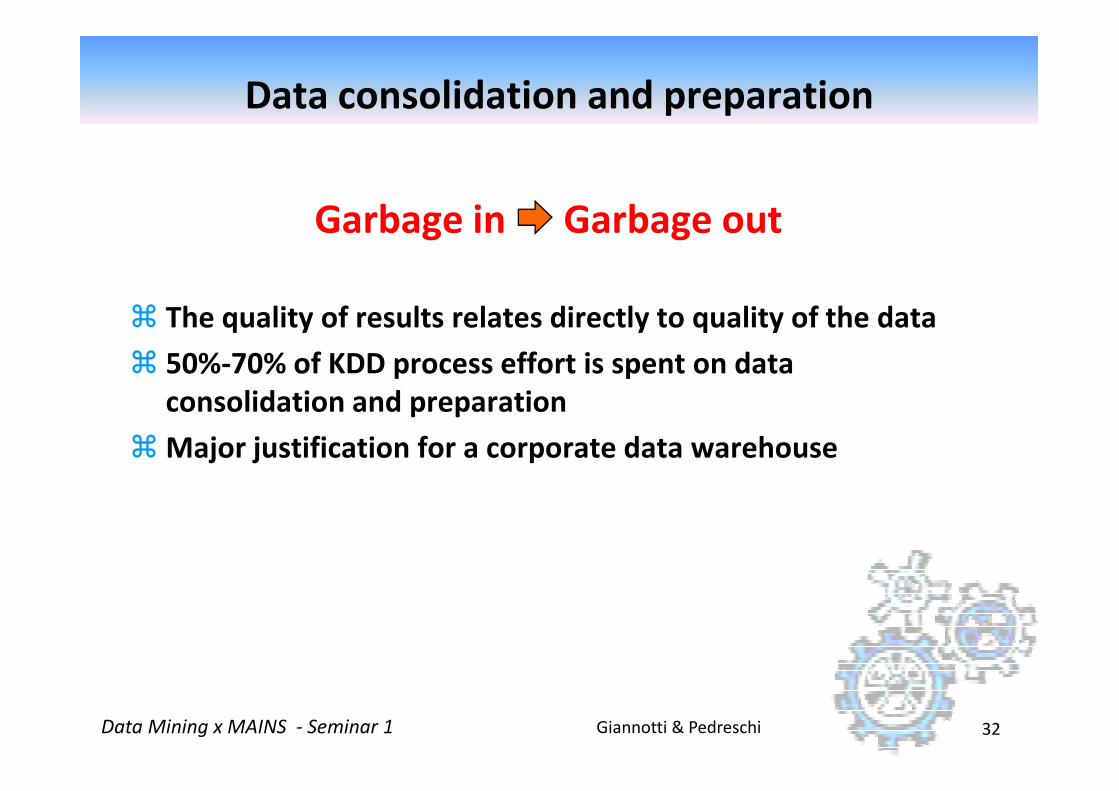
Garbage in Garbage out
� The quality of results relates directly to quality of the data
� 50%-70% of KDD process effort is spent on data
consolidation and preparation
Data consolidation and preparation
Giannotti & PedreschiData Mining x MAINS - Seminar 1 32
consolidation and preparation
� Major justification for a corporate data warehouse
From data sources to consolidated data repository
RDBMS
Data consolidation
Giannotti & PedreschiData Mining x MAINS - Seminar 1 33
Legacy
DBMS
Flat Files
Data
Consolidation
and Cleansing
Warehouse
Object/Relation DBMS Object/Relation DBMS
Multidimensional DBMS Multidimensional DBMS
Deductive Database Deductive Database
Flat files Flat files External
� Determine preliminary list of attributes
� Consolidate data into working database
Internal and External sources
� Eliminate or estimate missing values
Data consolidation
Giannotti & PedreschiData Mining x MAINS - Seminar 1 34
� Remove outliers (obvious exceptions)
� Determine prior probabilities of categories and deal with
volume bias
Selection and
Data Mining
Interpretation
and Evaluation
Knowledge
The KDD process
Giannotti & PedreschiData Mining x MAINS - Seminar 1 35
Selection and
Preprocessing
Data
Consolidation
p(x)=0.02
Warehouse
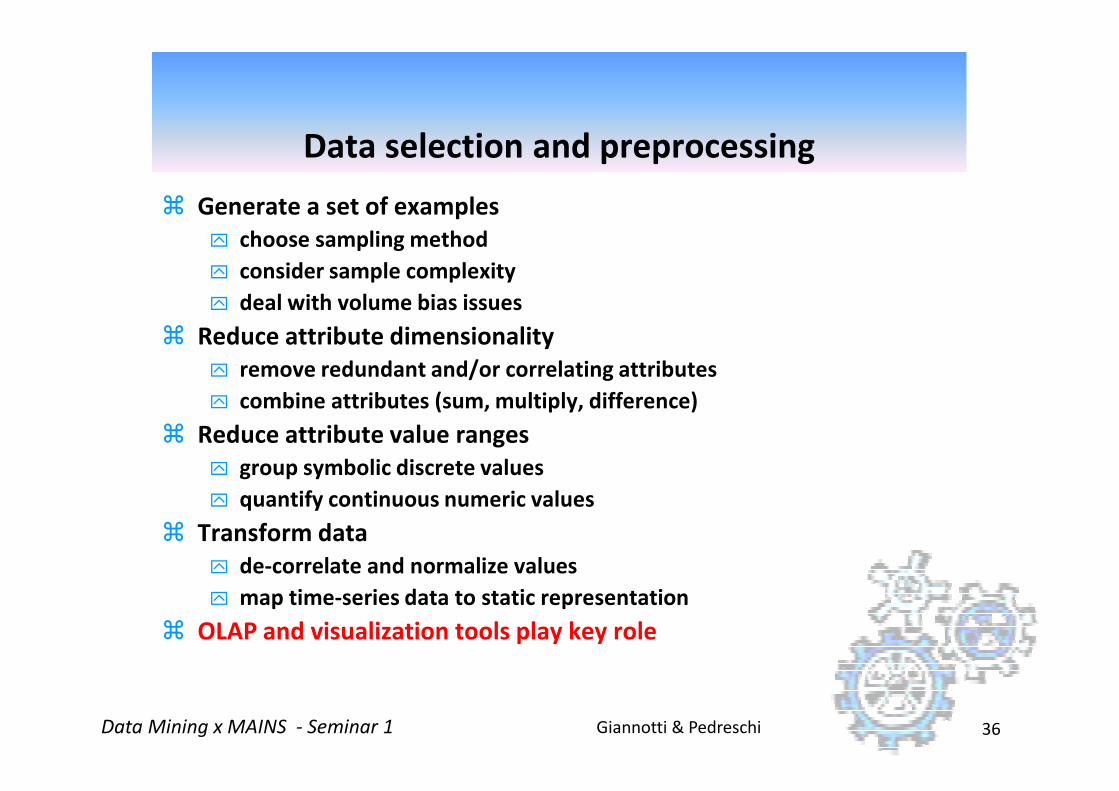
� Generate a set of examples
choose sampling method
consider sample complexity
deal with volume bias issues
� Reduce attribute dimensionality
remove redundant and/or correlating attributes
combine attributes (sum, multiply, difference)
Data selection and preprocessing
Giannotti & PedreschiData Mining x MAINS - Seminar 1 36
combine attributes (sum, multiply, difference)
� Reduce attribute value ranges
group symbolic discrete values
quantify continuous numeric values
� Transform data
de-correlate and normalize values
map time-series data to static representation
� OLAP and visualization tools play key role
Selection and
Data Mining
Interpretation
and Evaluation
Knowledge
The KDD process
Giannotti & PedreschiData Mining x MAINS - Seminar 1 37
Preprocessing
Data
Consolidation
p(x)=0.02
Warehouse
Data mining tasks and methods
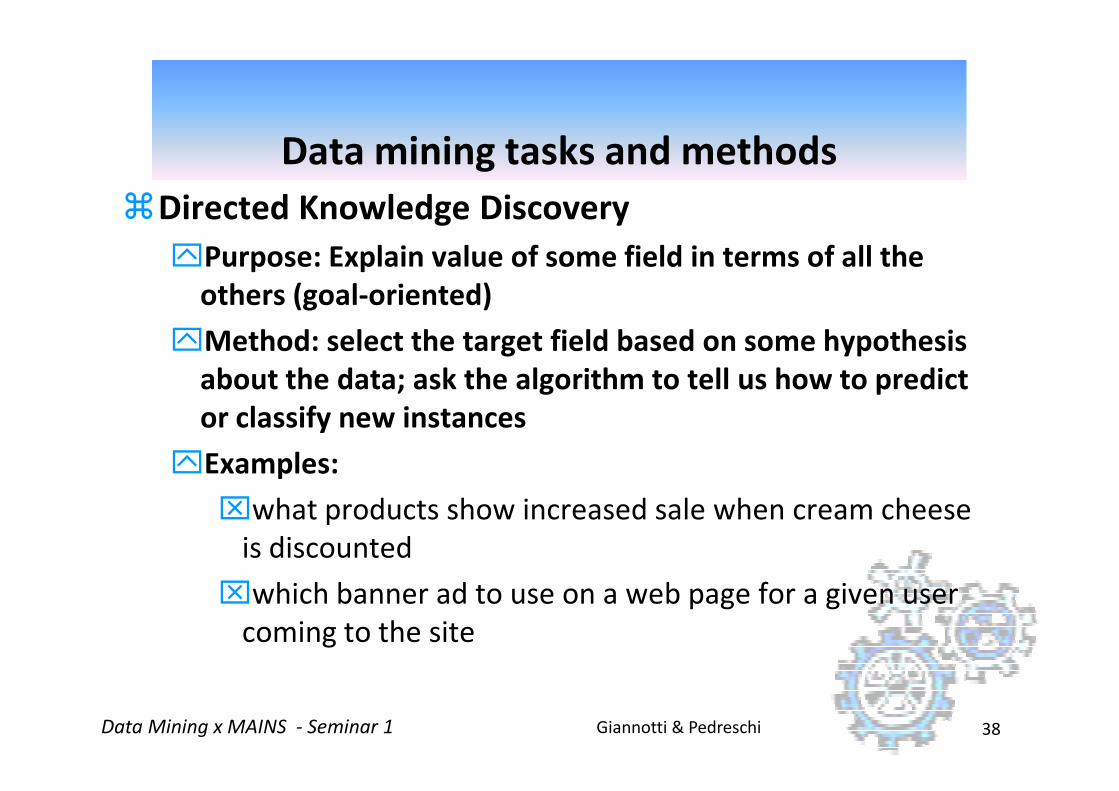
�Directed Knowledge Discovery
Purpose: Explain value of some field in terms of all the
others (goal-oriented)
Method: select the target field based on some hypothesis
about the data; ask the algorithm to tell us how to predict
Giannotti & PedreschiData Mining x MAINS - Seminar 1 38
or classify new instances
Examples:
what products show increased sale when cream cheese
is discounted
which banner ad to use on a web page for a given user
coming to the site

Data mining tasks and methods
�Undirected Knowledge Discovery (Explorative
Methods)Purpose: Find patterns in the data that may be interesting (no
target specified)
Method: clustering, association rules (affinity grouping)
Giannotti & PedreschiData Mining x MAINS - Seminar 1 39
Method: clustering, association rules (affinity grouping)
Examples:
which products in the catalog often sell together
market segmentation (groups of customers/users with similar
characteristics)

Data Mining Tasks
�Prediction Methods
Use some variables to predict unknown or future
values of other variables.
�Description Methods
Giannotti & PedreschiData Mining x MAINS - Seminar 1 40
�Description Methods
Find human-interpretable patterns that describe the
data.
From [Fayyad, et.al.] Advances in Knowledge Discovery and Data Mining, 1996

Data Mining Tasks...
�Classification [Predictive]
�Clustering [Descriptive]
�Association Rule Discovery [Descriptive]
�Sequential Pattern Discovery [Descriptive]
Giannotti & PedreschiData Mining x MAINS - Seminar 1 41
�Sequential Pattern Discovery
�Regression [Predictive]
�Deviation Detection [Predictive]
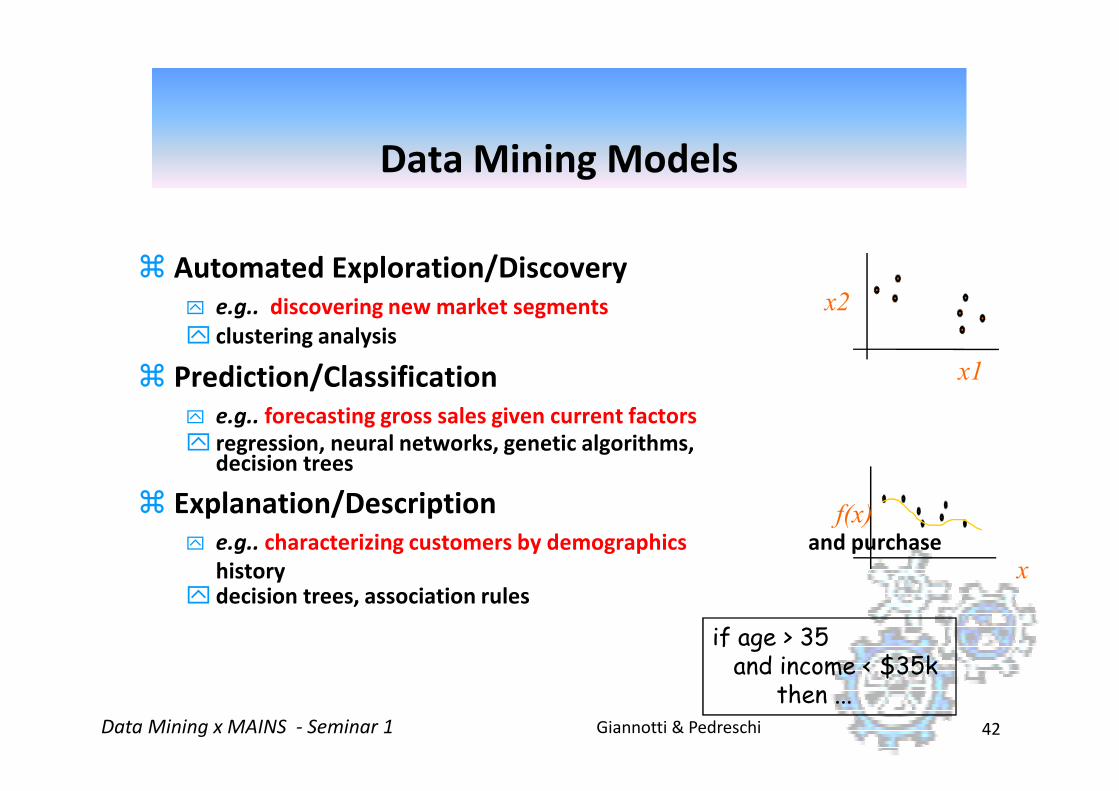
Data Mining Models
� Automated Exploration/Discovery
e.g.. discovering new market segments
clustering analysis
� Prediction/Classification x1
x2
Giannotti & PedreschiData Mining x MAINS - Seminar 1 42
e.g.. forecasting gross sales given current factors
regression, neural networks, genetic algorithms, decision trees
� Explanation/Description
e.g.. characterizing customers by demographics and purchase
history decision trees, association rules
f(x)
x
if age > 35and income < $35k
then ...
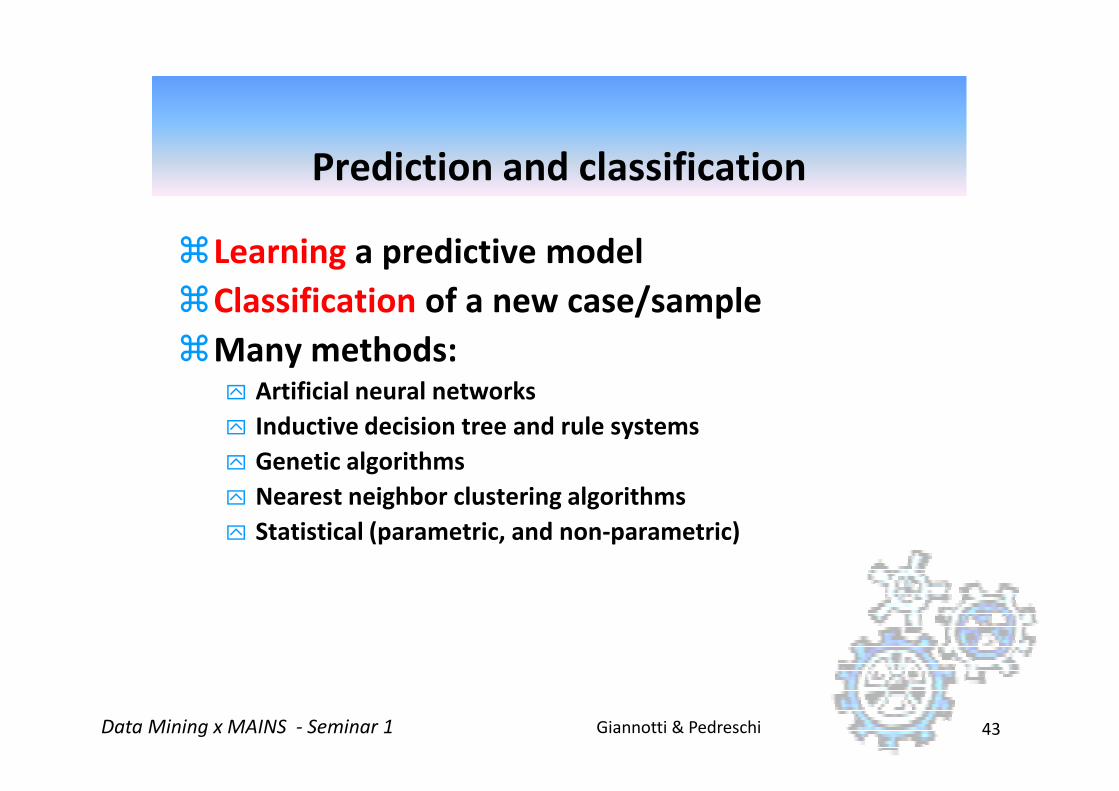
�Learning a predictive model
�Classification of a new case/sample
�Many methods: Artificial neural networks
Prediction and classification
Giannotti & PedreschiData Mining x MAINS - Seminar 1 43
Artificial neural networks
Inductive decision tree and rule systems
Genetic algorithms
Nearest neighbor clustering algorithms
Statistical (parametric, and non-parametric)
Classification: Definition
�Given a collection of records (training set )Each record contains a set of attributes, one of the attributes is
the class.
�Find a model for class attribute as a function of the values of other attributes.
�Goal: previously unseen records should be
Giannotti & PedreschiData Mining x MAINS - Seminar 1 44
�Goal: previously unseen records should be assigned a class as accurately as possible.A test set is used to determine the accuracy of the model.
Usually, the given data set is divided into training and test sets, with training set used to build the model and test set used to validate it.
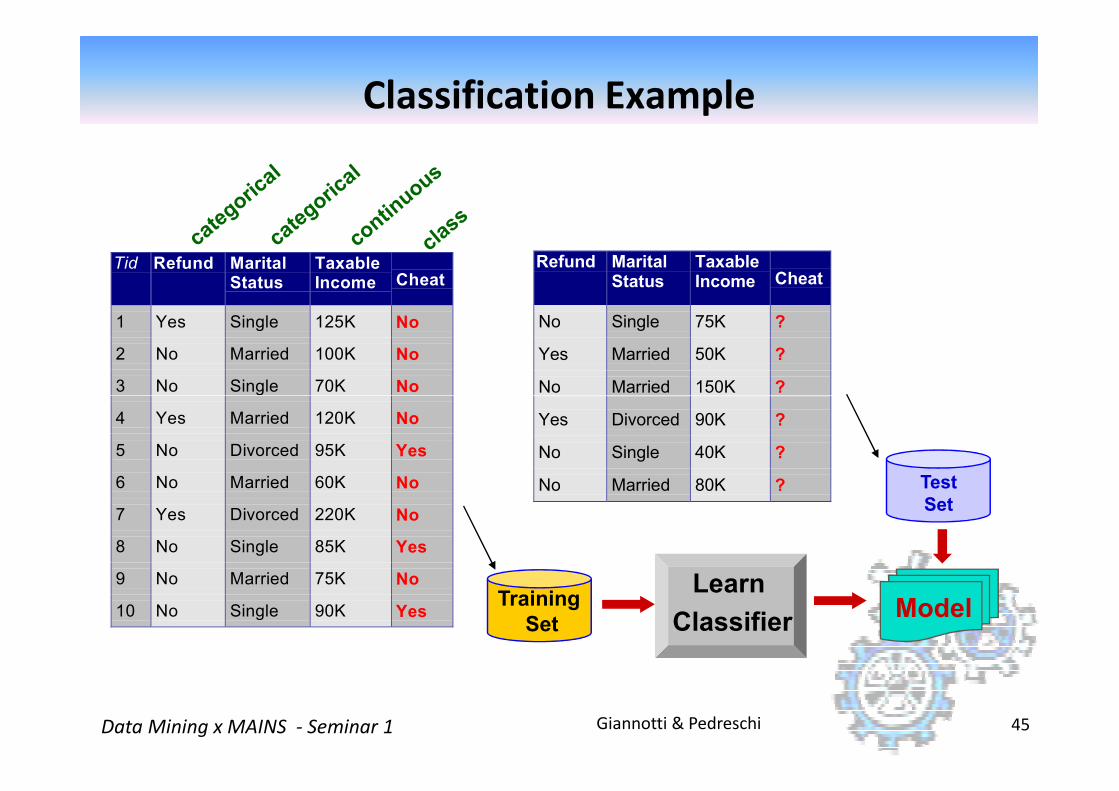
Classification Example
Tid Refund MaritalStatus
TaxableIncome Cheat
1 Yes Single 125K No
2 No Married 100K No
3 No Single 70K No
Refund MaritalStatus
TaxableIncome Cheat
No Single 75K ?
Yes Married 50K ?
No Married 150K ?
Giannotti & PedreschiData Mining x MAINS - Seminar 1 45
No
4 Yes Married 120K No
5 No Divorced 95K Yes
6 No Married 60K No
7 Yes Divorced 220K No
8 No Single 85K Yes
9 No Married 75K No
10 No Single 90K Yes10
No Married 150K ?
Yes Divorced 90K ?
No Single 40K ?
No Married 80K ?10
Test
Set
Training
SetModel
Learn
Classifier
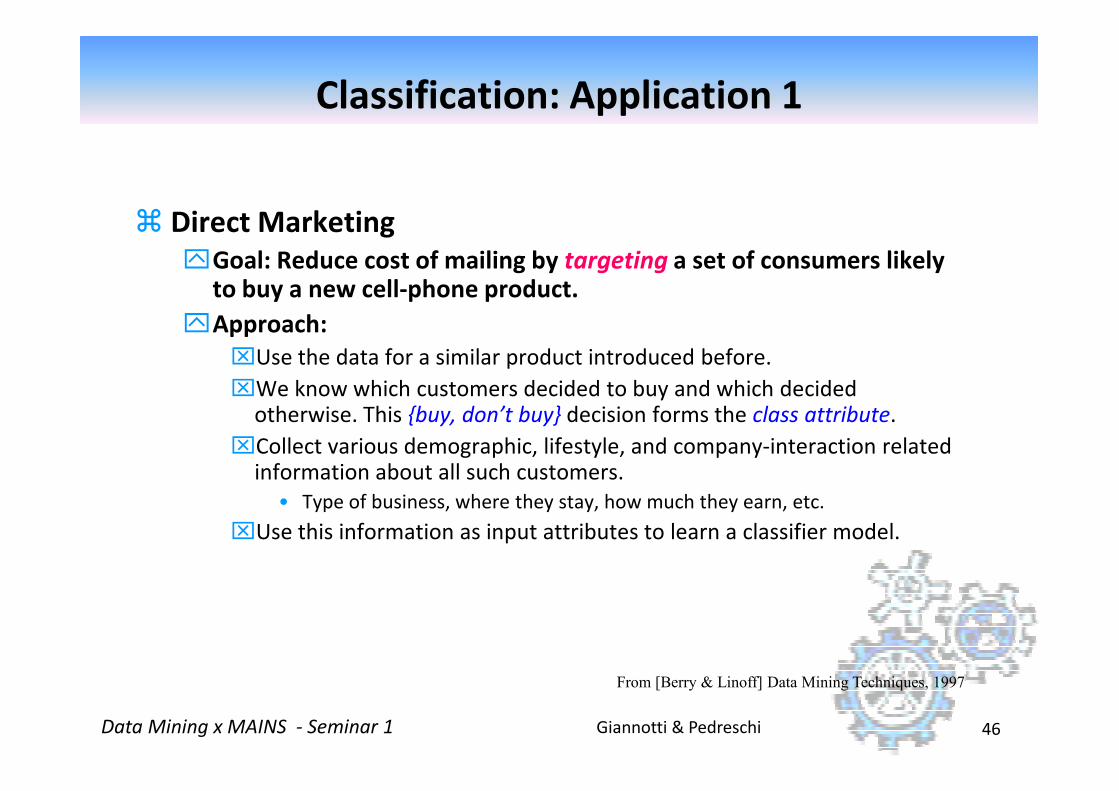
Classification: Application 1
� Direct Marketing
Goal: Reduce cost of mailing by targeting a set of consumers likely to buy a new cell-phone product.
Approach:
Use the data for a similar product introduced before.
We know which customers decided to buy and which decided
Giannotti & PedreschiData Mining x MAINS - Seminar 1 46
We know which customers decided to buy and which decided otherwise. This {buy, don’t buy} decision forms the class attribute.
Collect various demographic, lifestyle, and company-interaction related information about all such customers.
• Type of business, where they stay, how much they earn, etc.
Use this information as input attributes to learn a classifier model.
From [Berry & Linoff] Data Mining Techniques, 1997
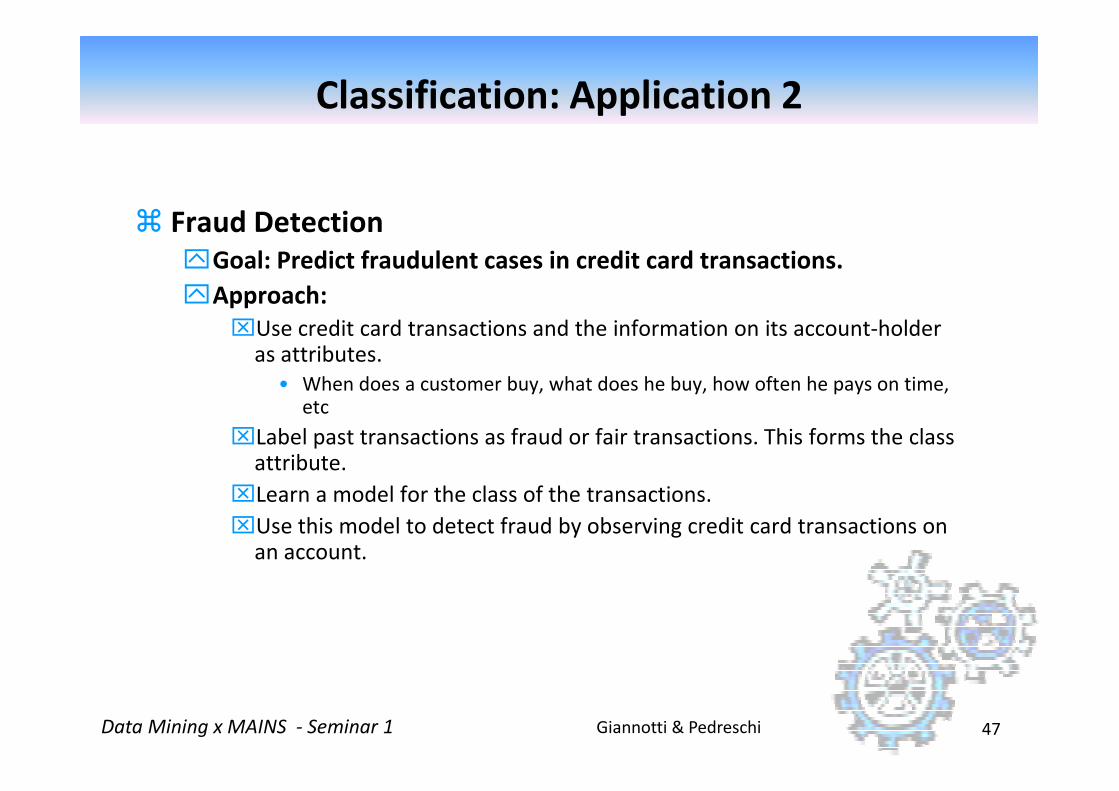
Classification: Application 2
� Fraud Detection
Goal: Predict fraudulent cases in credit card transactions.
Approach:
Use credit card transactions and the information on its account-holder as attributes.
• When does a customer buy, what does he buy, how often he pays on time, etc
Giannotti & PedreschiData Mining x MAINS - Seminar 1 47
etc
Label past transactions as fraud or fair transactions. This forms the class attribute.
Learn a model for the class of the transactions.
Use this model to detect fraud by observing credit card transactions on an account.
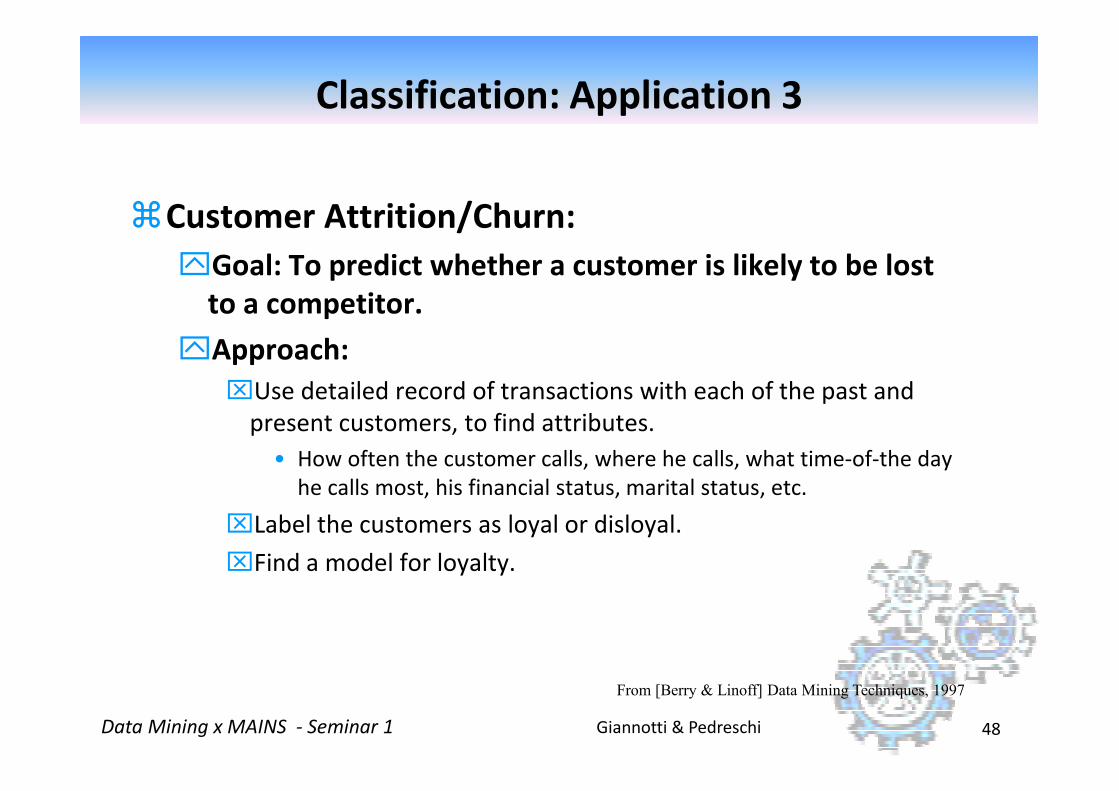
Classification: Application 3
�Customer Attrition/Churn:
Goal: To predict whether a customer is likely to be lost
to a competitor.
Approach:
Use detailed record of transactions with each of the past and
Giannotti & PedreschiData Mining x MAINS - Seminar 1 48
Use detailed record of transactions with each of the past and
present customers, to find attributes.
• How often the customer calls, where he calls, what time-of-the day
he calls most, his financial status, marital status, etc.
Label the customers as loyal or disloyal.
Find a model for loyalty.
From [Berry & Linoff] Data Mining Techniques, 1997

�The objective of learning is to achieve good
generalization to new unseen cases.
�Generalization can be defined as a mathematical
interpolation or regression over a set of training
points
Generalization and regression
Giannotti & PedreschiData Mining x MAINS - Seminar 1 49
points
�Models can be validated with a previously
unseen test set or using cross-validation
methodsf(x)
x

Regression
� Predict a value of a given continuous valued variable based
on the values of other variables, assuming a linear or
nonlinear model of dependency.
� Greatly studied in statistics, neural network fields.
� Examples:
Predicting sales amounts of new product based on advetising
Giannotti & PedreschiData Mining x MAINS - Seminar 1 50
Predicting sales amounts of new product based on advetising
expenditure.
Predicting wind velocities as a function of temperature, humidity, air
pressure, etc.
Time series prediction of stock market indices.
� Clustering: partitioning a set of data into a set of classes, called
clusters, whose members share some interesting common
properties.
� Distance-based numerical clustering
metric grouping of examples (K-NN)
Automated exploration and discovery
Giannotti & PedreschiData Mining x MAINS - Seminar 1 51
metric grouping of examples (K-NN)
graphical visualization can be used
� Bayesian clustering
search for the number of classes which result in best fit of a
probability distribution to the data
AutoClass (NASA) one of best examples
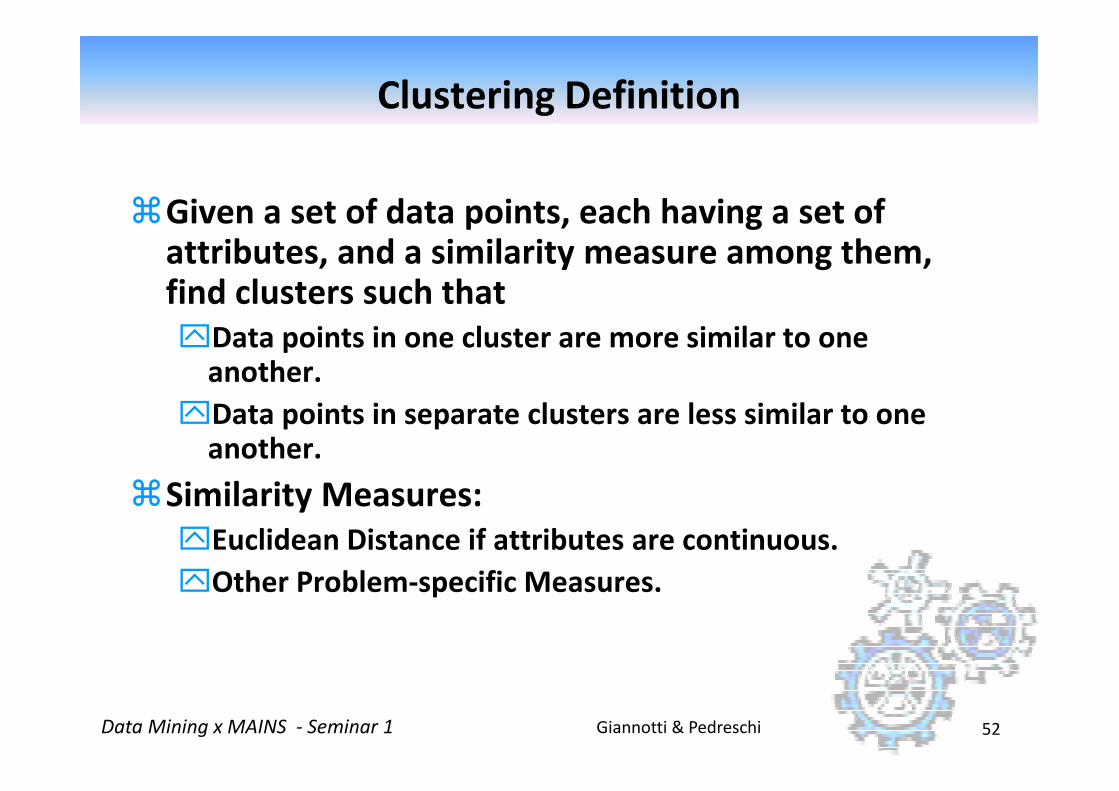
Clustering Definition
�Given a set of data points, each having a set of attributes, and a similarity measure among them, find clusters such that
Data points in one cluster are more similar to one another.
Data points in separate clusters are less similar to one
Giannotti & PedreschiData Mining x MAINS - Seminar 1 52
Data points in separate clusters are less similar to one another.
�Similarity Measures:
Euclidean Distance if attributes are continuous.
Other Problem-specific Measures.

Illustrating Clustering
Euclidean Distance Based Clustering in 3-D space.
Intracluster distances
are minimized
Intracluster distances
are minimized
Intercluster distances
are maximized
Intercluster distances
are maximized
Giannotti & PedreschiData Mining x MAINS - Seminar 1 53
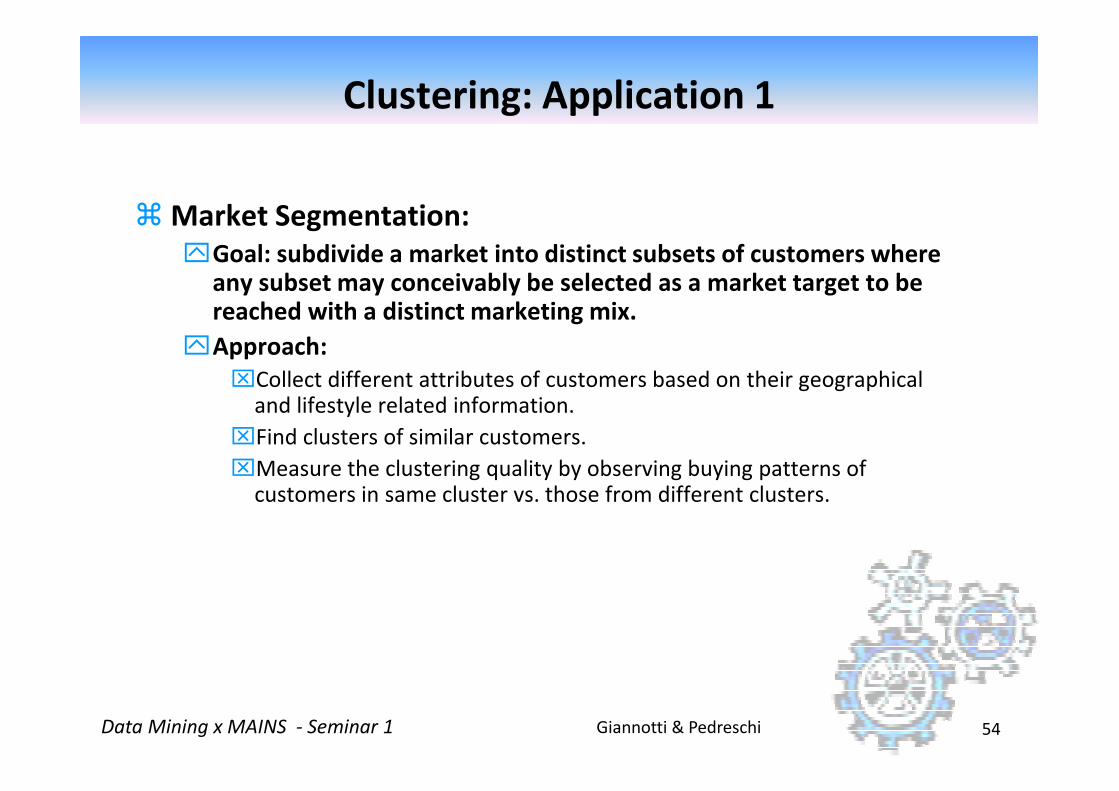
Clustering: Application 1
� Market Segmentation:
Goal: subdivide a market into distinct subsets of customers where any subset may conceivably be selected as a market target to be reached with a distinct marketing mix.
Approach:
Collect different attributes of customers based on their geographical and lifestyle related information.
Giannotti & PedreschiData Mining x MAINS - Seminar 1 54
and lifestyle related information.
Find clusters of similar customers.
Measure the clustering quality by observing buying patterns of customers in same cluster vs. those from different clusters.
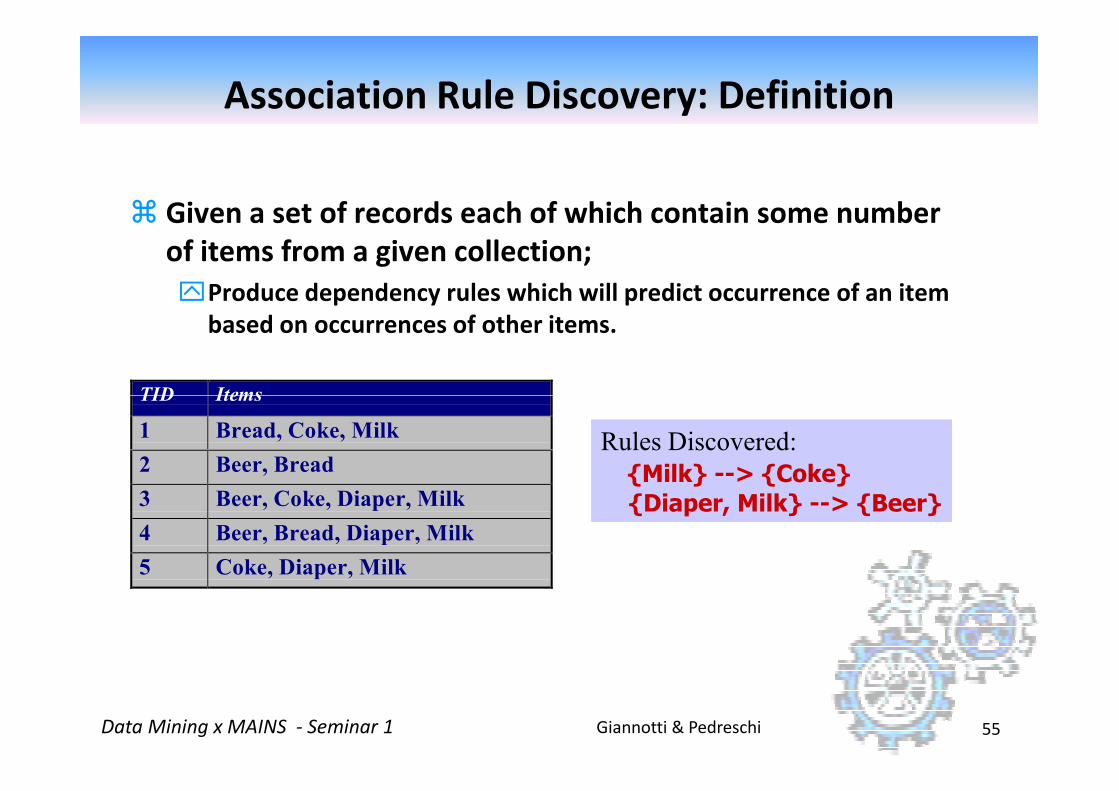
Association Rule Discovery: Definition
� Given a set of records each of which contain some number
of items from a given collection;
Produce dependency rules which will predict occurrence of an item
based on occurrences of other items.
TID Items
Giannotti & PedreschiData Mining x MAINS - Seminar 1 55
TID Items
1 Bread, Coke, Milk
2 Beer, Bread
3 Beer, Coke, Diaper, Milk
4 Beer, Bread, Diaper, Milk
5 Coke, Diaper, Milk
Rules Discovered:
{Milk} --> {Coke}
{Diaper, Milk} --> {Beer}
Rules Discovered:
{Milk} --> {Coke}
{Diaper, Milk} --> {Beer}
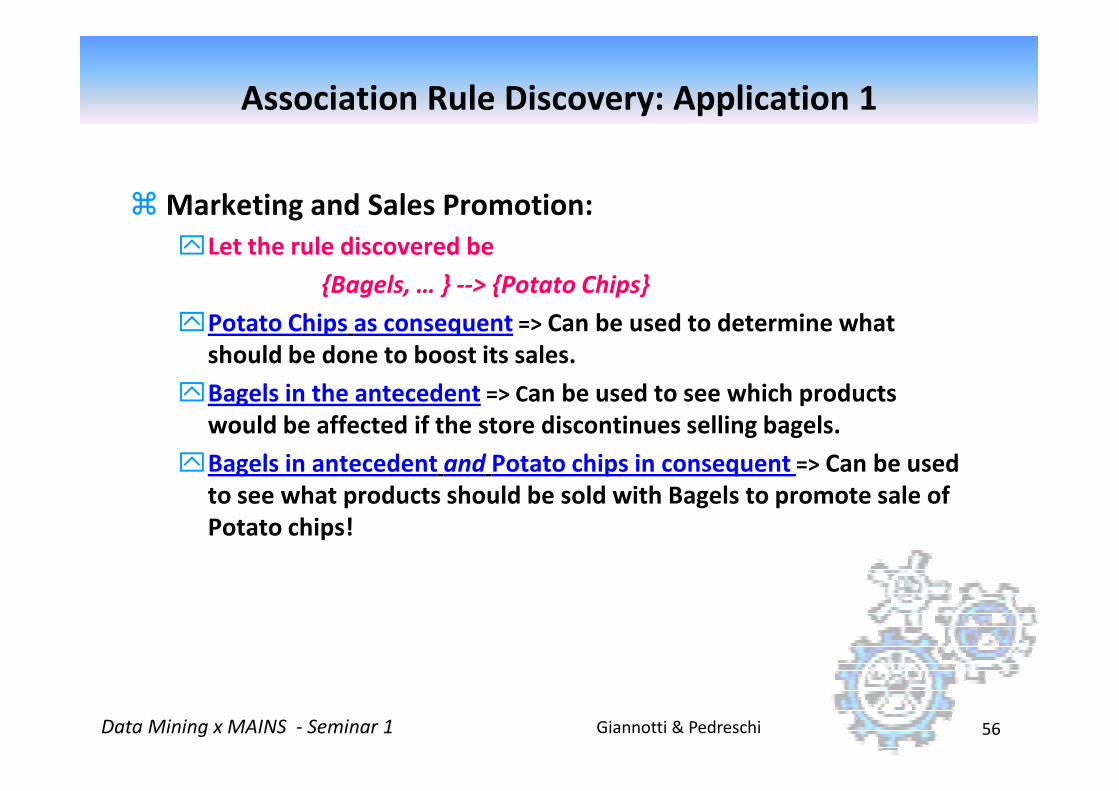
Association Rule Discovery: Application 1
� Marketing and Sales Promotion:
Let the rule discovered be
{Bagels, … } --> {Potato Chips}
Potato Chips as consequent => Can be used to determine what
should be done to boost its sales.
Bagels in the antecedent => Can be used to see which products
Giannotti & PedreschiData Mining x MAINS - Seminar 1 56
Bagels in the antecedent => Can be used to see which products
would be affected if the store discontinues selling bagels.
Bagels in antecedent and Potato chips in consequent => Can be used
to see what products should be sold with Bagels to promote sale of
Potato chips!
Association Rule Discovery: Application 2
�Supermarket shelf management.
Goal: To identify items that are bought together by sufficiently many customers.
Approach: Process the point-of-sale data collected with barcode scanners to find dependencies among items.
A classic rule --
Giannotti & PedreschiData Mining x MAINS - Seminar 1 57
A classic rule --
If a customer buys diaper and milk, then he is very likely to buy beer.
So, don’t be surprised if you find six-packs stacked next to diapers!
Association Rule Discovery: Application 3
� Inventory Management:
Goal: A consumer appliance repair company wants to anticipate the
nature of repairs on its consumer products and keep the service
vehicles equipped with right parts to reduce on number of visits to
consumer households.
Approach: Process the data on tools and parts required in previous
Giannotti & PedreschiData Mining x MAINS - Seminar 1 58
Approach: Process the data on tools and parts required in previous
repairs at different consumer locations and discover the co-
occurrence patterns.

Sequential Pattern Discovery: Definition
� Given is a set of objects, with each object associated with its own timeline of events, find rules that predict strong sequential dependencies among different events.
� Rules are formed by first disovering patterns. Event occurrences in the patterns
(A B) (C) (D E)
Giannotti & PedreschiData Mining x MAINS - Seminar 1 59
� Rules are formed by first disovering patterns. Event occurrences in the patterns are governed by timing constraints.
(A B) (C) (D E)
<= ms
<= xg >ng <= ws
Sequential Pattern Discovery: Examples
� In telecommunications alarm logs,
(Inverter_Problem Excessive_Line_Current)
(Rectifier_Alarm) --> (Fire_Alarm)
� In point-of-sale transaction sequences,
Computer Bookstore:
(Intro_To_Visual_C) (C++_Primer) -->
(Perl_for_dummies,Tcl_Tk)
Giannotti & PedreschiData Mining x MAINS - Seminar 1 60
(Perl_for_dummies,Tcl_Tk)
Athletic Apparel Store:
(Shoes) (Racket, Racketball) --> (Sports_Jacket)
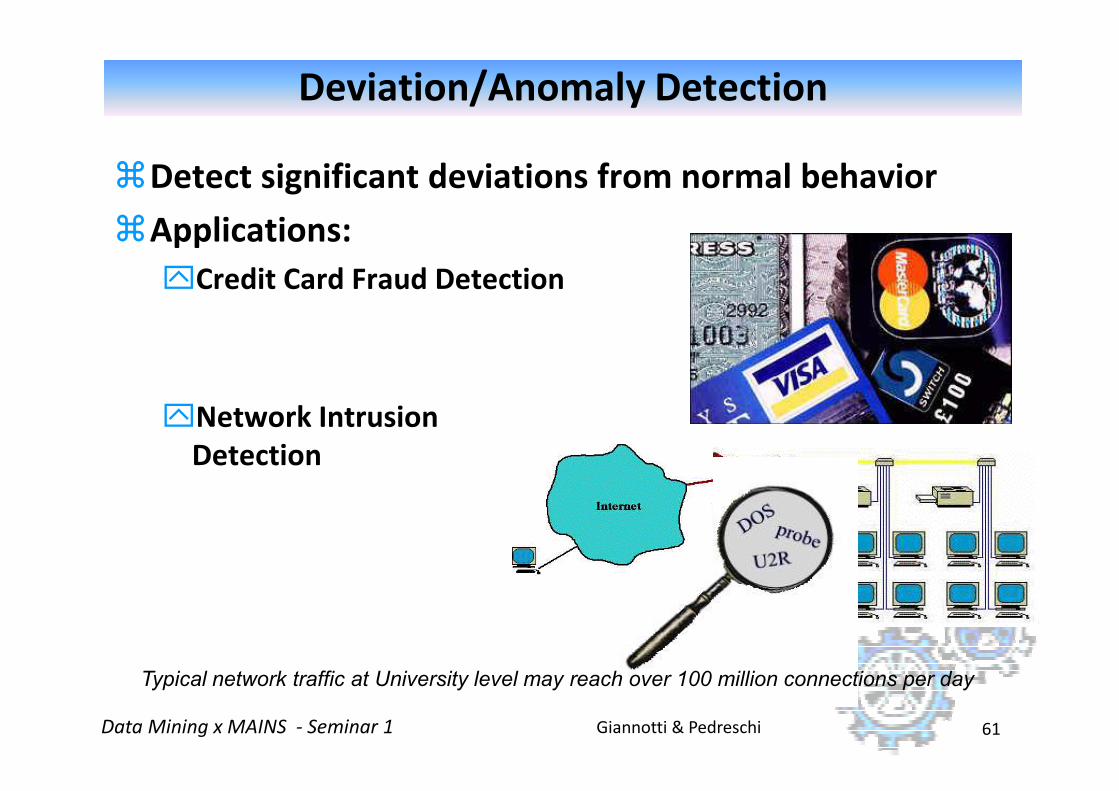
Deviation/Anomaly Detection
�Detect significant deviations from normal behavior
�Applications:
Credit Card Fraud Detection
Giannotti & PedreschiData Mining x MAINS - Seminar 1 61
Network Intrusion
Detection
Typical network traffic at University level may reach over 100 million connections per day
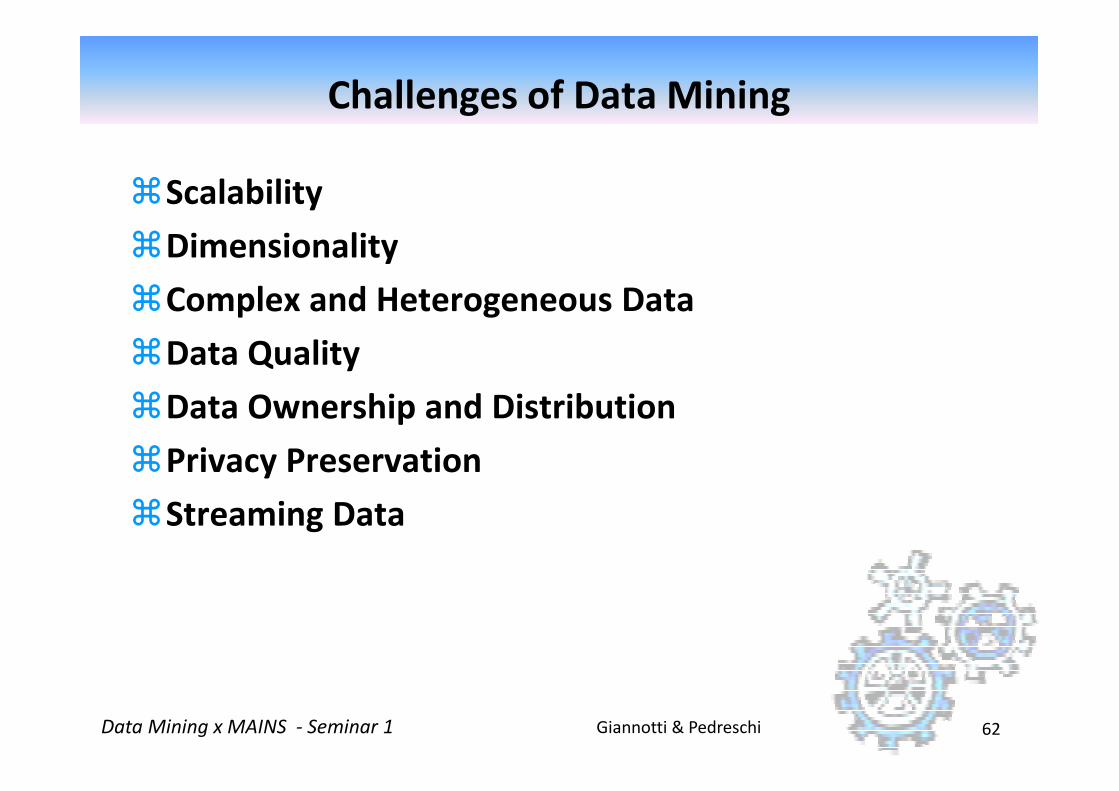
Challenges of Data Mining
�Scalability
�Dimensionality
�Complex and Heterogeneous Data
�Data Quality
�Data Ownership and Distribution
Giannotti & PedreschiData Mining x MAINS - Seminar 1 62
�Data Ownership and Distribution
�Privacy Preservation
�Streaming Data
Data Mining
Interpretation
and Evaluation
Knowledge
The KDD process
Giannotti & PedreschiData Mining x MAINS - Seminar 1 63
Selection and
Preprocessing
Data Consolidation
and Warehousing
Knowledge
p(x)=0.02
Warehouse
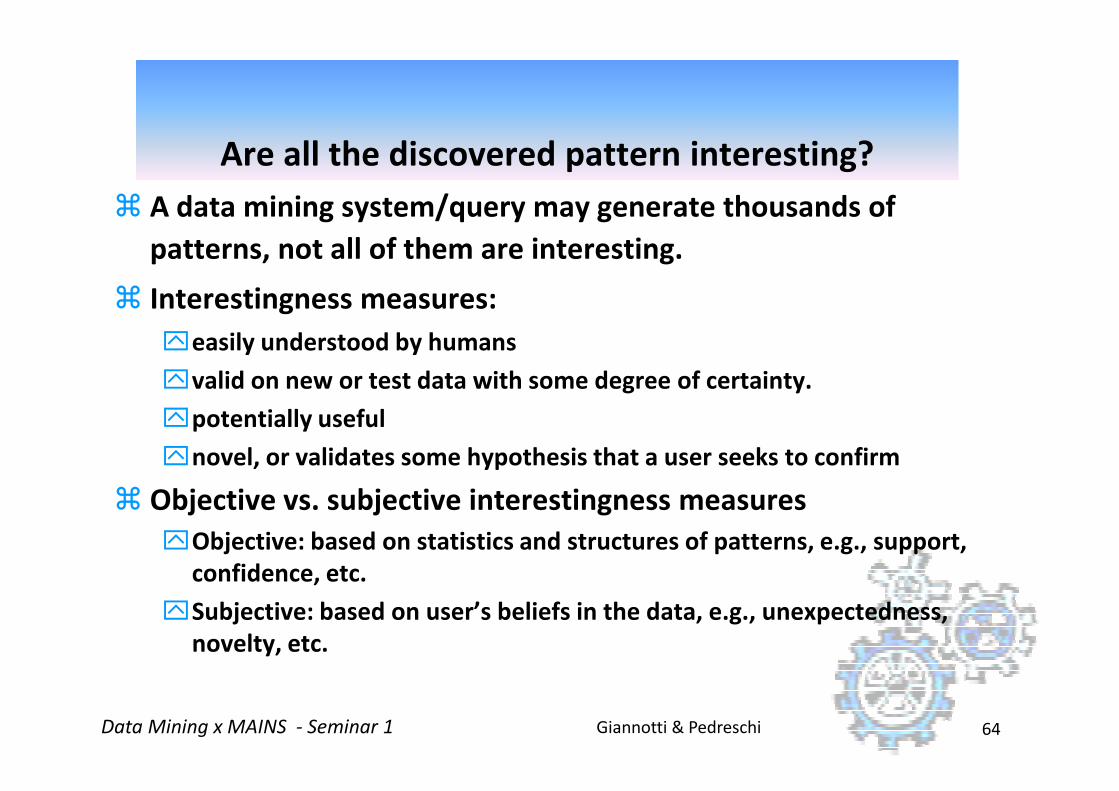
� A data mining system/query may generate thousands of
patterns, not all of them are interesting.
� Interestingness measures:
easily understood by humans
valid on new or test data with some degree of certainty.
Are all the discovered pattern interesting?
Giannotti & PedreschiData Mining x MAINS - Seminar 1 64
potentially useful
novel, or validates some hypothesis that a user seeks to confirm
� Objective vs. subjective interestingness measures
Objective: based on statistics and structures of patterns, e.g., support,
confidence, etc.
Subjective: based on user’s beliefs in the data, e.g., unexpectedness,
novelty, etc.
Evaluation
� Statistical validation and significance testing
� Qualitative review by experts in the field
� Pilot surveys to evaluate model accuracy
Interpretation
Interpretation and evaluation
Giannotti & PedreschiData Mining x MAINS - Seminar 1 65
Interpretation
� Inductive tree and rule models can be read directly
� Clustering results can be graphed and tabled
� Code can be automatically generated by some systems (IDTs, Regression models)
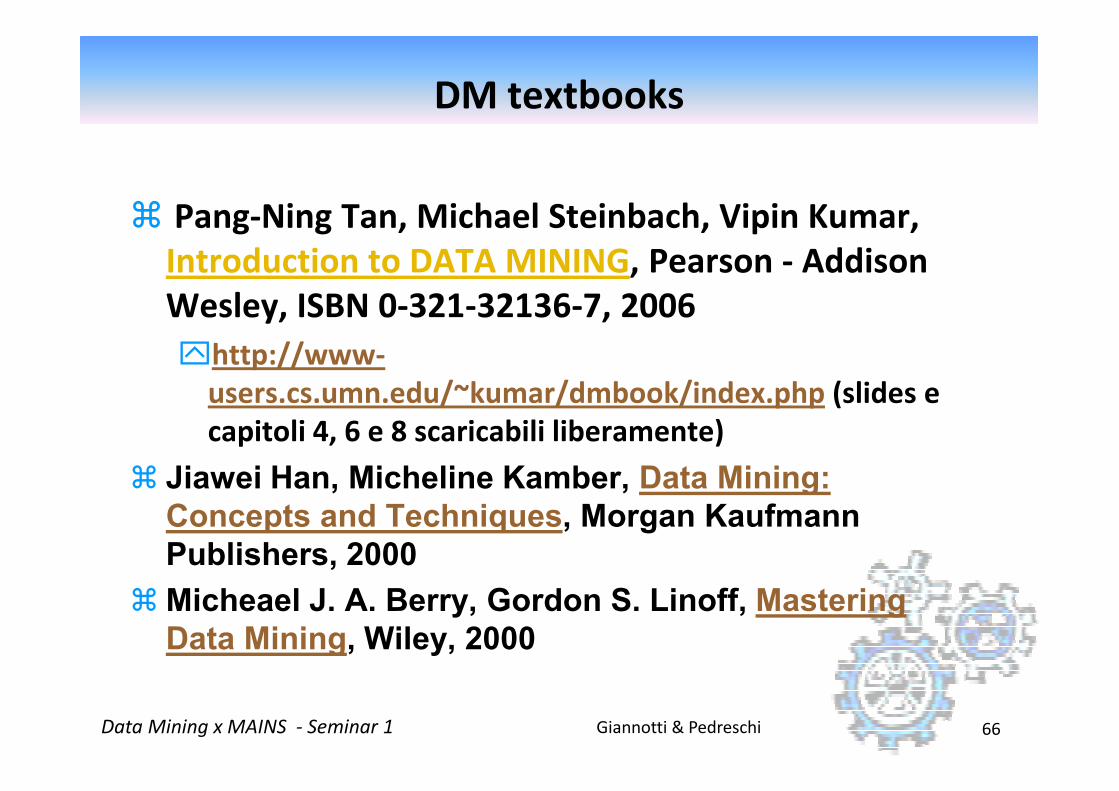
DM textbooks
� Pang-Ning Tan, Michael Steinbach, Vipin Kumar,
Introduction to DATA MINING, Pearson - Addison
Wesley, ISBN 0-321-32136-7, 2006
http://www-
users.cs.umn.edu/~kumar/dmbook/index.php (slides e
Giannotti & PedreschiData Mining x MAINS - Seminar 1 66
users.cs.umn.edu/~kumar/dmbook/index.php (slides e
capitoli 4, 6 e 8 scaricabili liberamente)
� Jiawei Han, Micheline Kamber, Data Mining:
Concepts and Techniques, Morgan Kaufmann
Publishers, 2000
� Micheael J. A. Berry, Gordon S. Linoff, Mastering
Data Mining, Wiley, 2000
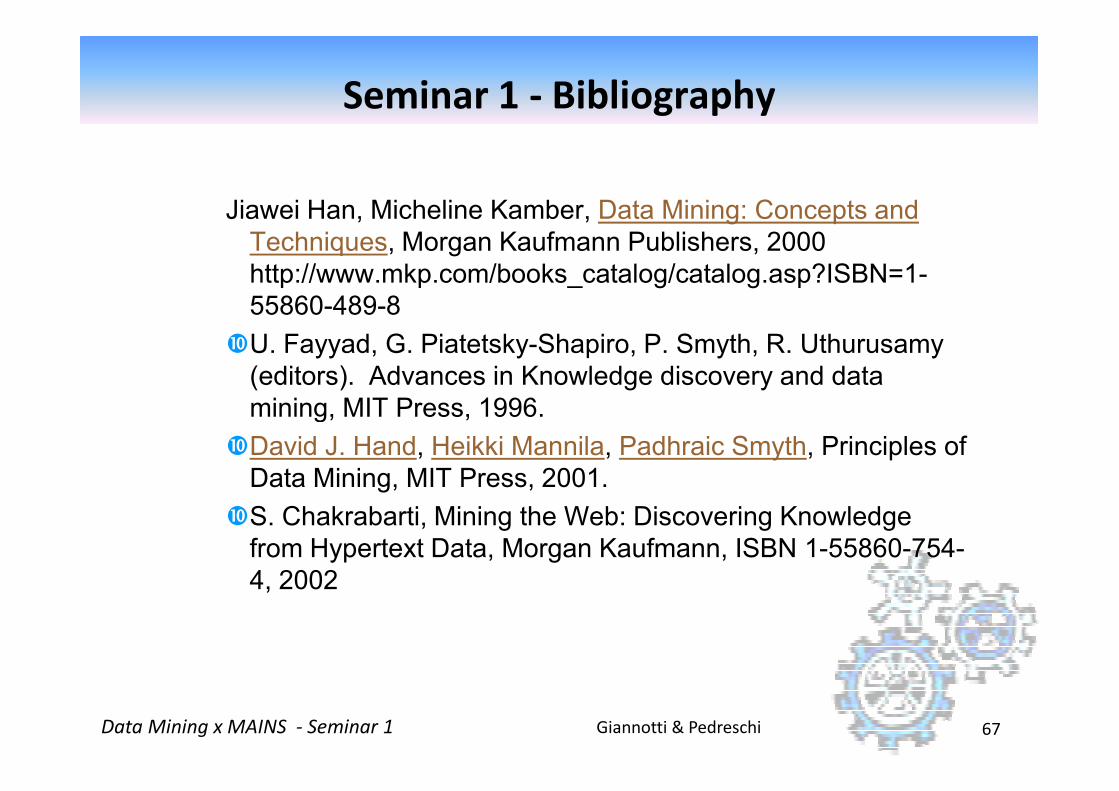
Seminar 1 - Bibliography
Jiawei Han, Micheline Kamber, Data Mining: Concepts and
Techniques, Morgan Kaufmann Publishers, 2000
http://www.mkp.com/books_catalog/catalog.asp?ISBN=1-
55860-489-8
�U. Fayyad, G. Piatetsky-Shapiro, P. Smyth, R. Uthurusamy
(editors). Advances in Knowledge discovery and data
mining, MIT Press, 1996.
Giannotti & PedreschiData Mining x MAINS - Seminar 1 67
mining, MIT Press, 1996.
�David J. Hand, Heikki Mannila, Padhraic Smyth, Principles of
Data Mining, MIT Press, 2001.
�S. Chakrabarti, Mining the Web: Discovering Knowledge
from Hypertext Data, Morgan Kaufmann, ISBN 1-55860-754-
4, 2002
Examples of DM projects
Competitive Intelligence
Fraud Detection
Health care
Traffic Accident Analysis
Moviegoers database
L’Oreal, a case-study on
competitive intelligence:
Source: DM@CINECASource: DM@CINECA
http://open.cineca.it/datamining/dmCineca/
A small example
�Domain: technology watch - a.k.a. competitive
intelligence
Which are the emergent technologies?
Which competitors are investing on them?
In which area are my competitors active?
Giannotti & PedreschiData Mining x MAINS - Seminar 1 70
In which area are my competitors active?
Which area will my competitor drop in the near future?
�Source of data:
public (on-line) databases
The Derwent database
�Contains all patents filed worldwide in last 10 years
�Searching this database by keywords may yield thousands of documents
�Derwent document are semi-structured: many long text fields
Giannotti & PedreschiData Mining x MAINS - Seminar 1 71
text fields
�Goal: analyze Derwent document to build a model of competitors’ strategy
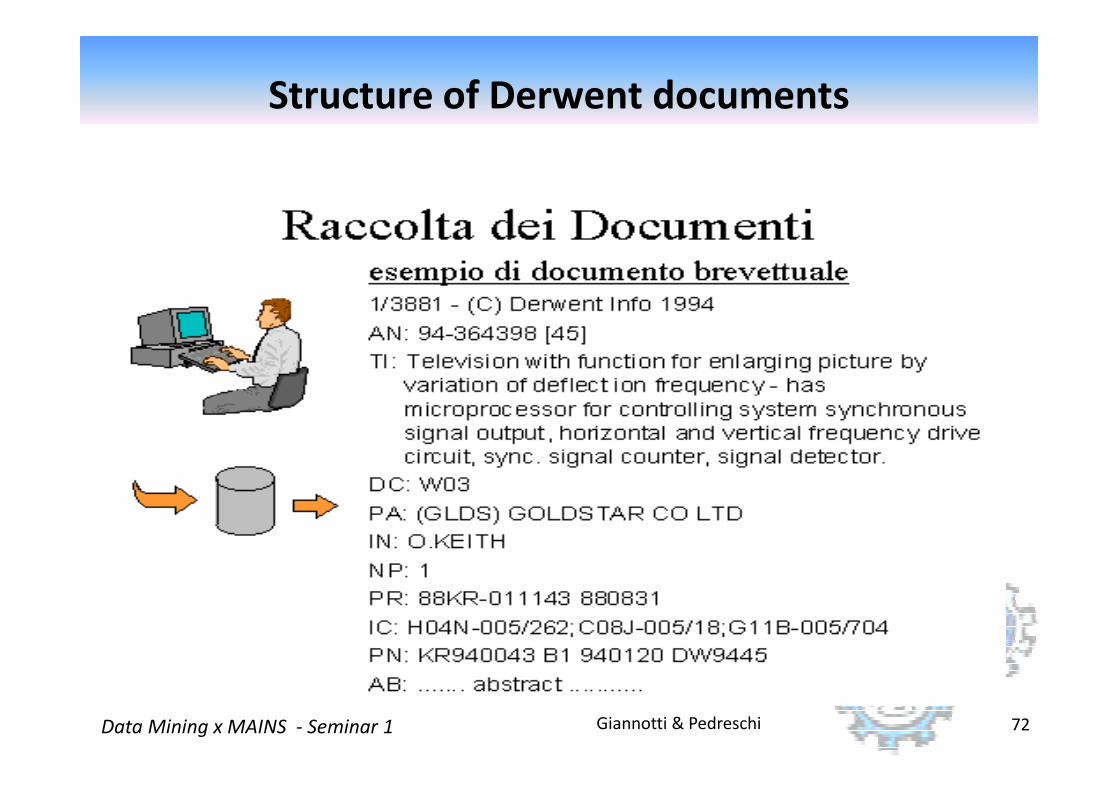
Structure of Derwent documents
Giannotti & PedreschiData Mining x MAINS - Seminar 1 72
Example dataset
�Patents in the area: patch technology (cerotto
medicale)
105 companies from 12 countries
94 classification codes
52 Derwent codes
Giannotti & PedreschiData Mining x MAINS - Seminar 1 73
52 Derwent codes
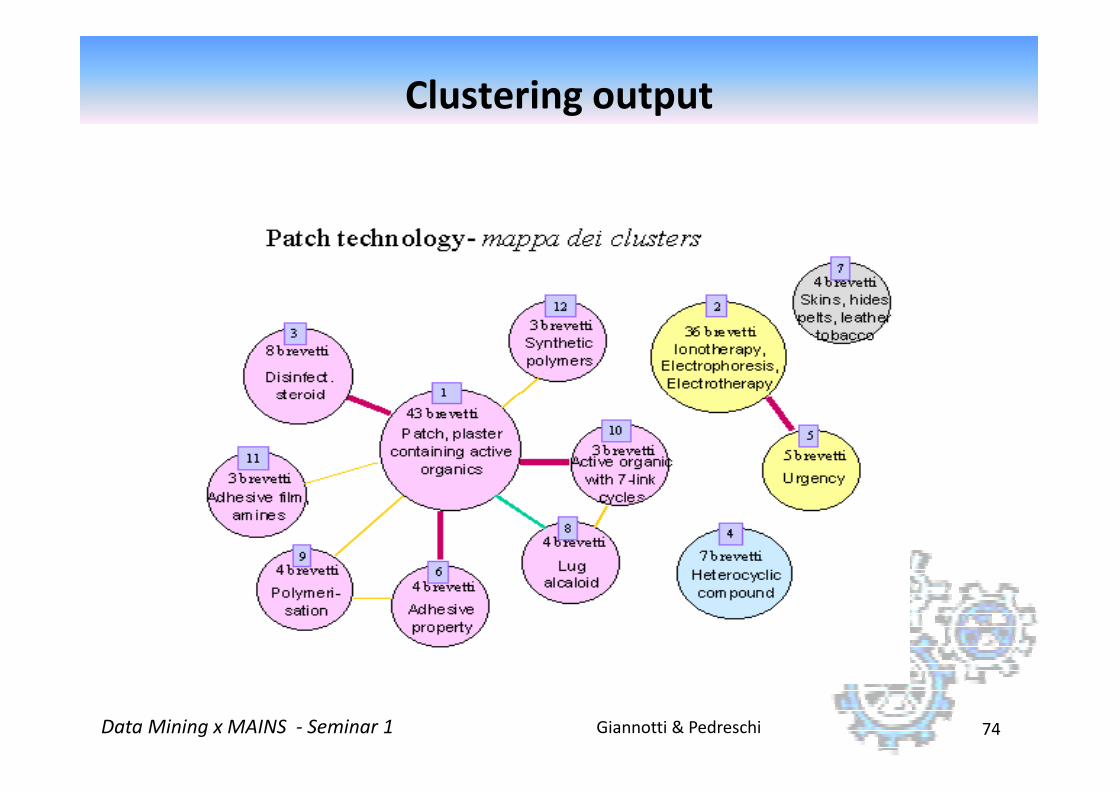
Clustering output
Giannotti & PedreschiData Mining x MAINS - Seminar 1 74

Zoom on cluster 2
Giannotti & PedreschiData Mining x MAINS - Seminar 1 75

Zoom on cluster 2 - profiling competitors
Giannotti & PedreschiData Mining x MAINS - Seminar 1 76

Activity of competitors in the clusters
Giannotti & PedreschiData Mining x MAINS - Seminar 1 77
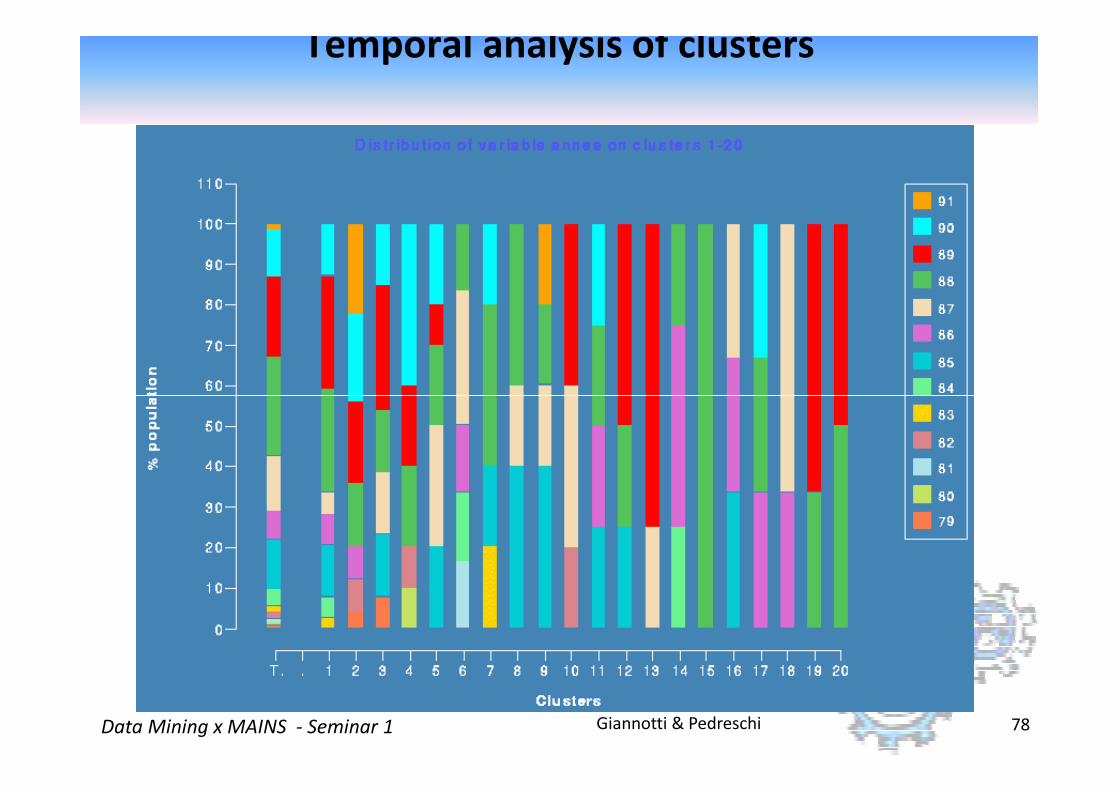
Temporal analysis of clusters
Giannotti & PedreschiData Mining x MAINS - Seminar 1 78

Fraud detection and audit planning
Source: Ministero delle Finanze
Progetto Sogei, KDD Lab. Pisa

�A major task in fraud detection is constructing models
of fraudulent behavior, for:
preventing future frauds (on-line fraud detection)
discovering past frauds (a posteriori fraud detection)
Fraud detection
Giannotti & PedreschiData Mining x MAINS - Seminar 1 80
�analyze historical audit data to plan effective future
audits
Audit planning
�Need to face a trade-off between conflicting
issues:
maximize audit benefits: select subjects to be audited
to maximize the recovery of evaded tax
Giannotti & PedreschiData Mining x MAINS - Seminar 1 81
to maximize the recovery of evaded tax
minimize audit costs: select subjects to be audited to
minimize the resources needed to carry out the
audits.
Available data sources
� Dataset: tax declarations, concerning a targeted class of
Italian companies, integrated with other sources:
social benefits to employees, official budget documents, electricity
and telephone bills.
� Size: 80 K tuples, 175 numeric attributes.
Giannotti & PedreschiData Mining x MAINS - Seminar 1 82
� Size: 80 K tuples, 175 numeric attributes.
� A subset of 4 K tuples corresponds to the audited
companies:
outcome of audits recorded as the recovery attribute (= amount of
evaded tax ascertained )

Data preparation TAX DECLARATION
Codice Attivita'
Debiti Vs banche
Totale Attivita'
Totale Passivita'
Esistenze Iniziali
Rimanenze Finali
Profitti
Ricavi
Costi Funzionamento
Oneri Personale
Costi Totali
Utile o Perdita
originaldataset81 K
data consolidation
Giannotti & PedreschiData Mining x MAINS - Seminar 1 83
Utile o Perdita
Reddito IRPEG
SOCIAL BENEFITS
Numero Dipendenti'
Contributi Totali
Retribuzione Totale
OFFICIAL BUDGET
Volume Affari
Capitale Sociale
ELECTRICITY BILLS
Consumi KWH
AUDIT
Recovery
auditoutcomes
4 K
data consolidationdata cleaning
attribute selection

Cost model
�A derived attribute audit_cost is defined as a
function of other attributes760
Codice Attivita'
Debiti Vs banche
Totale Attivita'
Totale Passivita'
Esistenze Iniziali
Rimanenze Finali
Profitti
Giannotti & PedreschiData Mining x MAINS - Seminar 1 84
Profitti
Ricavi
Costi Funzionamento
Oneri Personale
Costi Totali
Utile o Perdita
Reddito IRPEG
INPS
Numero Dipendenti'
Contributi Totali
Retribuzione Totale
Camere di Commercio
Volume Affari
Capitale Sociale
ENEL
Consumi KWH
Accertamenti
Maggiore ImpostaAccertata
f audit_cost

Cost model and the target variable
� recovery of an audit after the audit cost actual_recovery =
recovery - audit_cost
� target variable (class label) of our analysis is set as the Class
of Actual Recovery (c.a.r.):
Giannotti & PedreschiData Mining x MAINS - Seminar 1 85
of Actual Recovery (c.a.r.):
negative if actual_recovery ≤ 0 � c.a.r. =
positive if actual_recovery > 0.
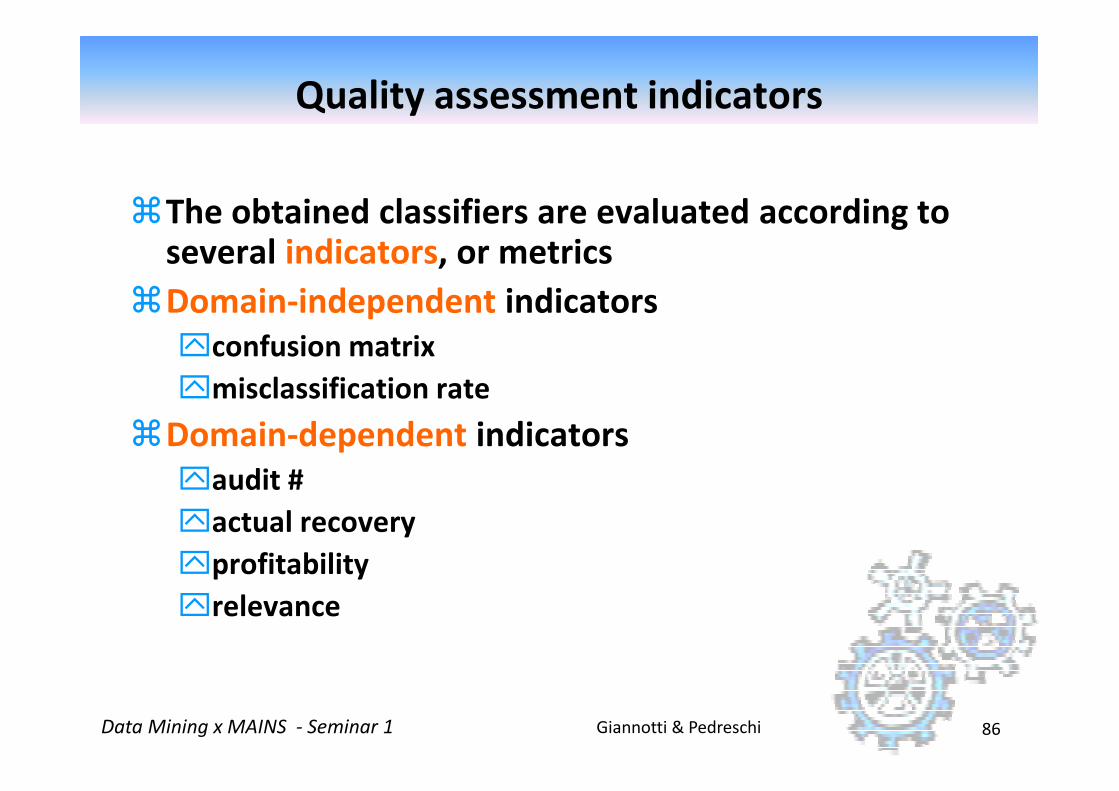
Quality assessment indicators
�The obtained classifiers are evaluated according to several indicators, or metrics
�Domain-independent indicators
confusion matrix
misclassification rate
Giannotti & PedreschiData Mining x MAINS - Seminar 1 86
misclassification rate
�Domain-dependent indicators
audit #
actual recovery
profitability
relevance

Domain-dependent quality indicators
� audit # (of a given classifier): number of tuples classified as positive =
# (FP ∪∪∪∪ TP)
� actual recovery: total amount of actual recovery for all tuples classified as positive
� profitability: average actual recovery per audit
Giannotti & PedreschiData Mining x MAINS - Seminar 1 87
� profitability: average actual recovery per audit
� relevance: ratio between profitability and misclassification rate
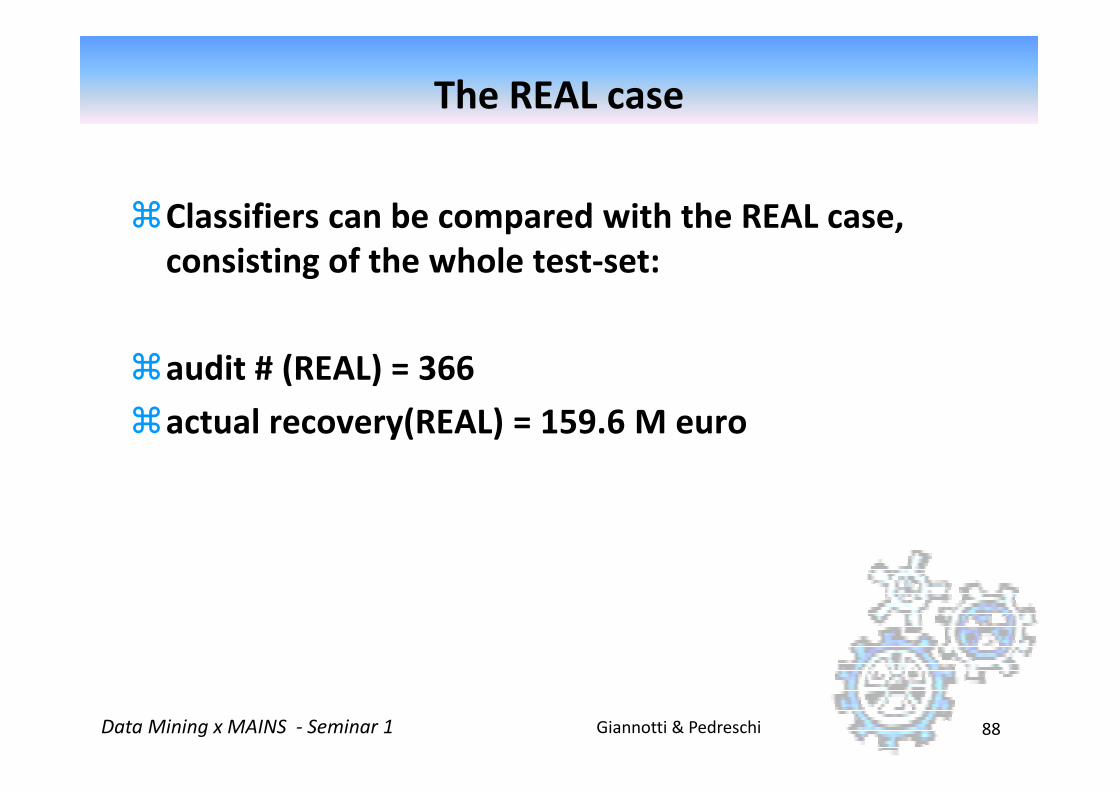
The REAL case
�Classifiers can be compared with the REAL case,
consisting of the whole test-set:
�audit # (REAL) = 366
Giannotti & PedreschiData Mining x MAINS - Seminar 1 88
�actual recovery(REAL) = 159.6 M euro

Model evaluation: classifier 1 (min FP)
no replication in training-set (unbalance towards negative)
10-trees adaptive boosting
misc. rate = 22%
Giannotti & PedreschiData Mining x MAINS - Seminar 1 89
audit # = 59 (11 FP)
actual rec.= 141.7 Meuro
profitability = 2.401
0
100
200
300
400 actual rec
REALactual rec.audit #
REALaudit #
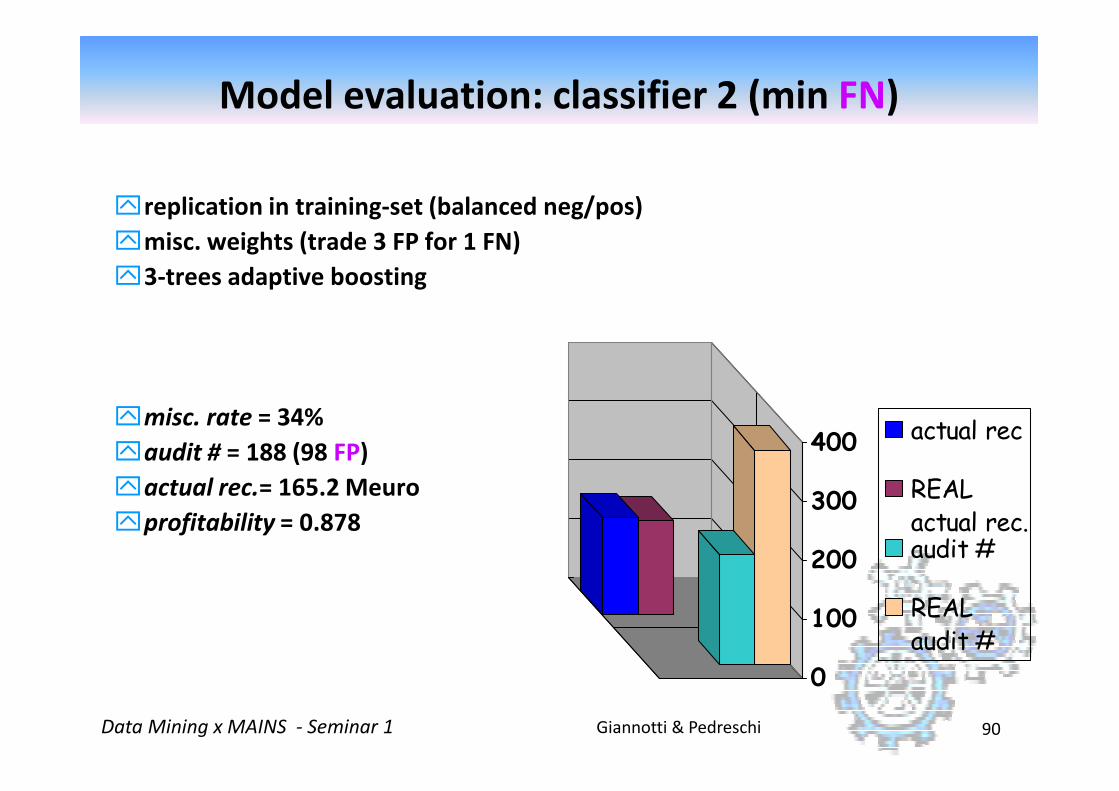
Model evaluation: classifier 2 (min FN)
replication in training-set (balanced neg/pos)
misc. weights (trade 3 FP for 1 FN)
3-trees adaptive boosting
Giannotti & PedreschiData Mining x MAINS - Seminar 1 90
misc. rate = 34%
audit # = 188 (98 FP)
actual rec.= 165.2 Meuro
profitability = 0.878
0
100
200
300
400 actual rec
REALactual rec.audit #
REALaudit #

Atherosclerosis prevention study
2nd Department of Medicine, 1st Faculty of Medicine of Charles University and Charles University Hospital, U nemocnice 2, Prague 2 (head. Prof. M. Aschermann, MD, SDr, FESC)
Atherosclerosis prevention study:
� The STULONG 1 data set is a real database that
keeps information about the study of the
development of atherosclerosis risk factors in a
population of middle aged men.
Giannotti & PedreschiData Mining x MAINS - Seminar 1 92
� Used for Discovery Challenge at PKDD 00-02-03-
04
Atherosclerosis prevention study:
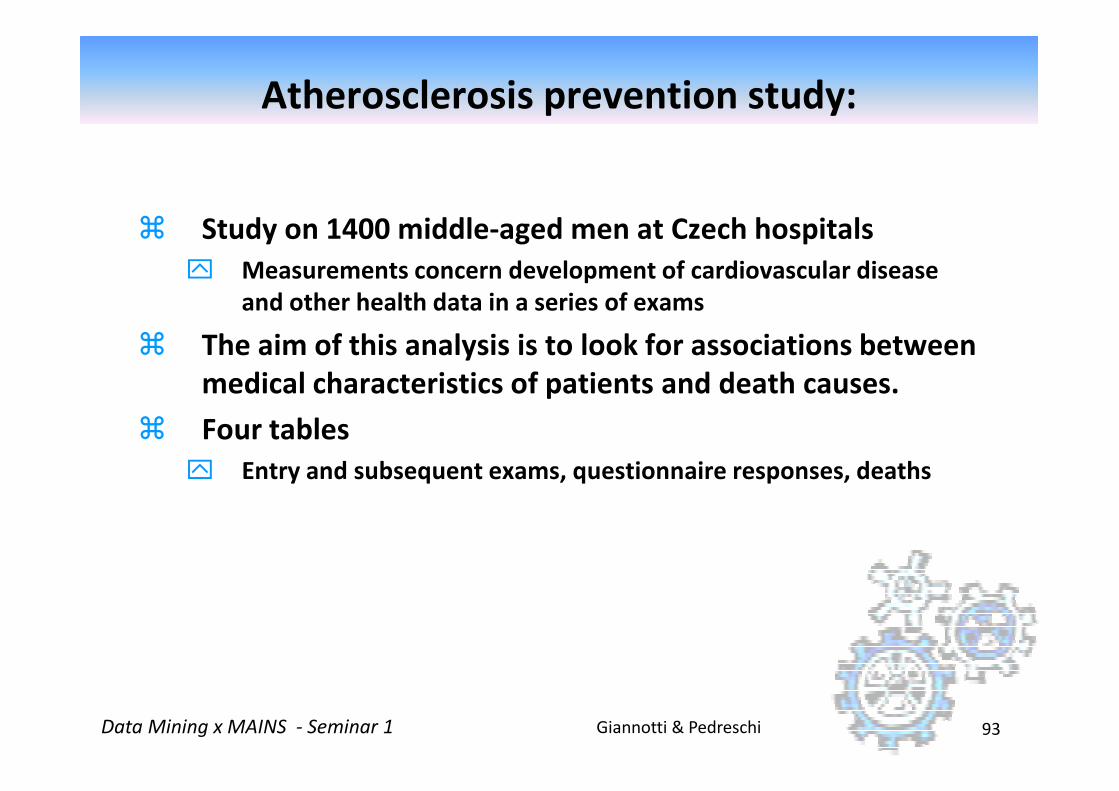
� Study on 1400 middle-aged men at Czech hospitals
Measurements concern development of cardiovascular disease
and other health data in a series of exams
� The aim of this analysis is to look for associations between
medical characteristics of patients and death causes.
Giannotti & PedreschiData Mining x MAINS - Seminar 1 93
medical characteristics of patients and death causes.
� Four tables
Entry and subsequent exams, questionnaire responses, deaths
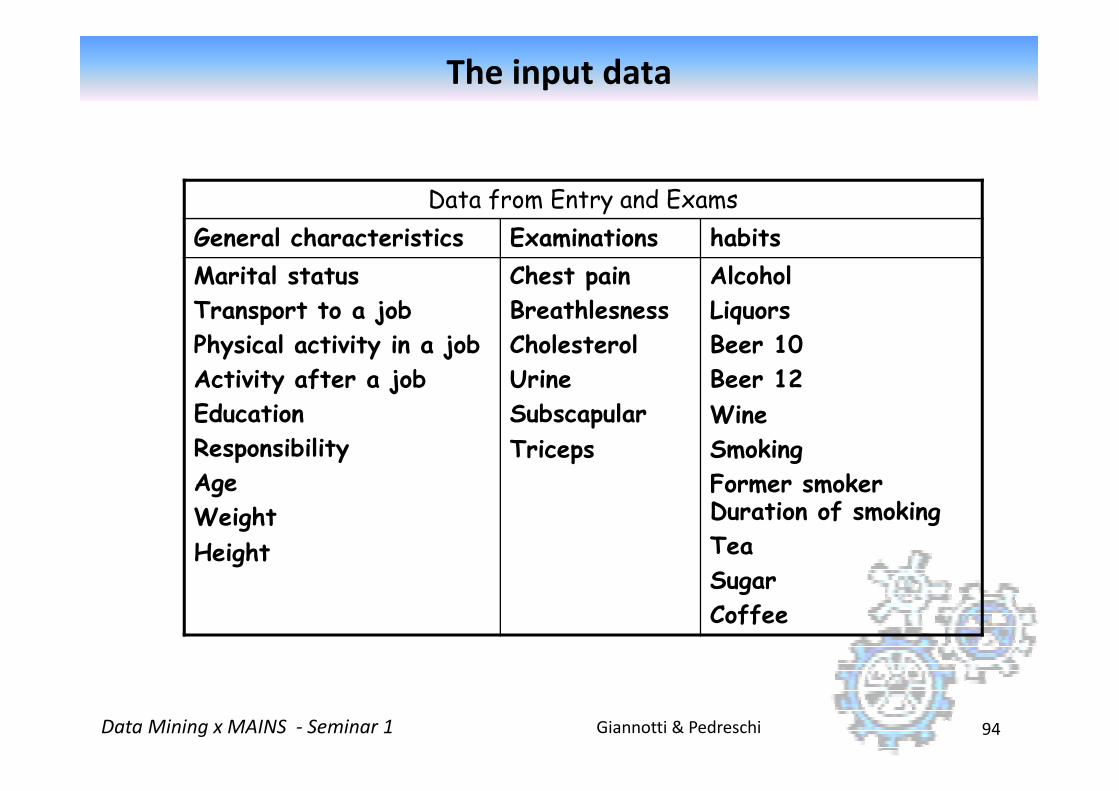
The input data
Data from Entry and Exams
General characteristics Examinations habits
Marital status
Transport to a job
Physical activity in a job
Activity after a job
Education
Chest pain
Breathlesness
Cholesterol
Urine
Subscapular
Alcohol
Liquors
Beer 10
Beer 12
Giannotti & PedreschiData Mining x MAINS - Seminar 1 94
Education
Responsibility
Age
Weight
Height
Subscapular
Triceps
Wine
Smoking
Former smoker Duration of smoking
Tea
Sugar
Coffee
The input data
DEATH CAUSE PATIENTS %
myocardial infarction 80 20.6
coronary heart disease 33 8.5
stroke 30 7.7
other causes 79 20.3
Giannotti & PedreschiData Mining x MAINS - Seminar 1 95
other causes 79 20.3
sudden death 23 5.9
unknown 8 2.0
tumorous disease 114 29.3
general atherosclerosis 22 5.7
TOTAL 389 100.0

Data selection
� When joining “Entry” and “Death” tables we implicitely create
a new attribute “Cause of death”, which is set to “alive” for
subjects present in the “Entry” table but not in the “Death”
table.
� We have only 389 subjects in death table.
Giannotti & PedreschiData Mining x MAINS - Seminar 1 96
� We have only 389 subjects in death table.
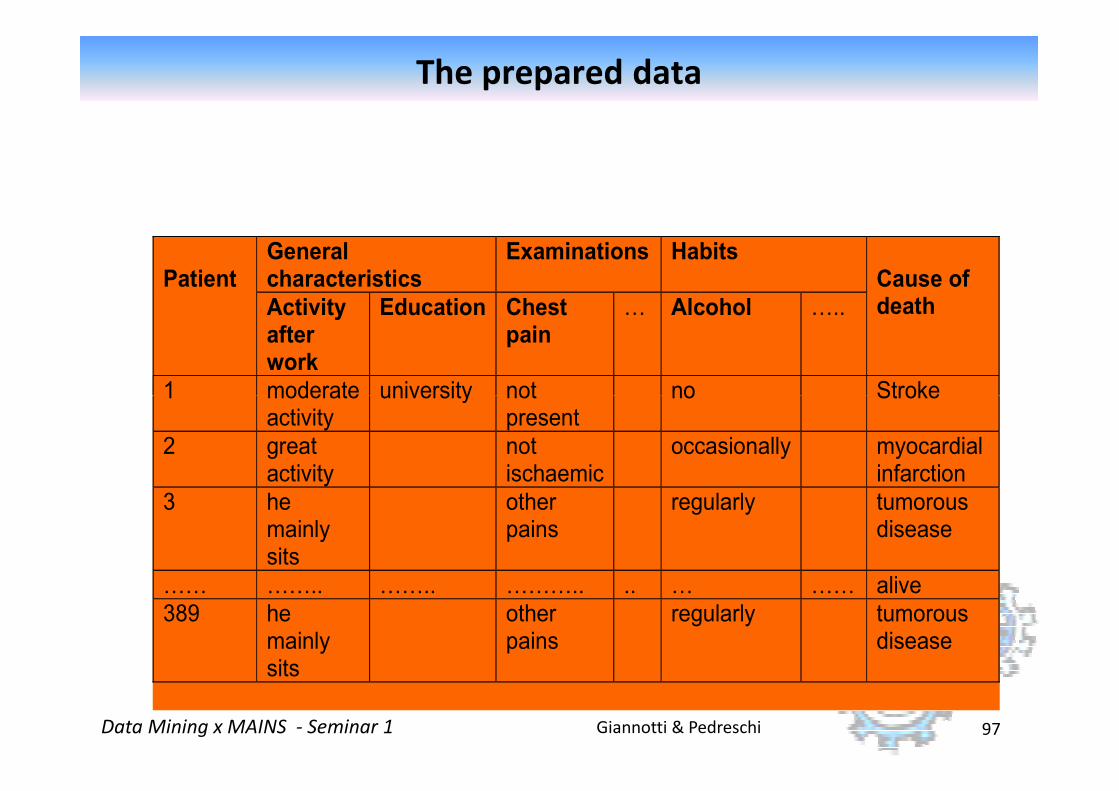
The prepared data
Patient
General characteristics
Examinations Habits Cause of death Activity
after work
Education Chest pain
8 Alcohol 8..
1 moderate university not no Stroke
Giannotti & PedreschiData Mining x MAINS - Seminar 1 97
1
moderate activity
university not present
no Stroke
2
great activity
not ischaemic
occasionally myocardial infarction
3
he mainly sits
other pains
regularly tumorous disease
88 88.. 88.. 888.. .. 8 88 alive
389 he mainly sits
other pains
regularly tumorous disease
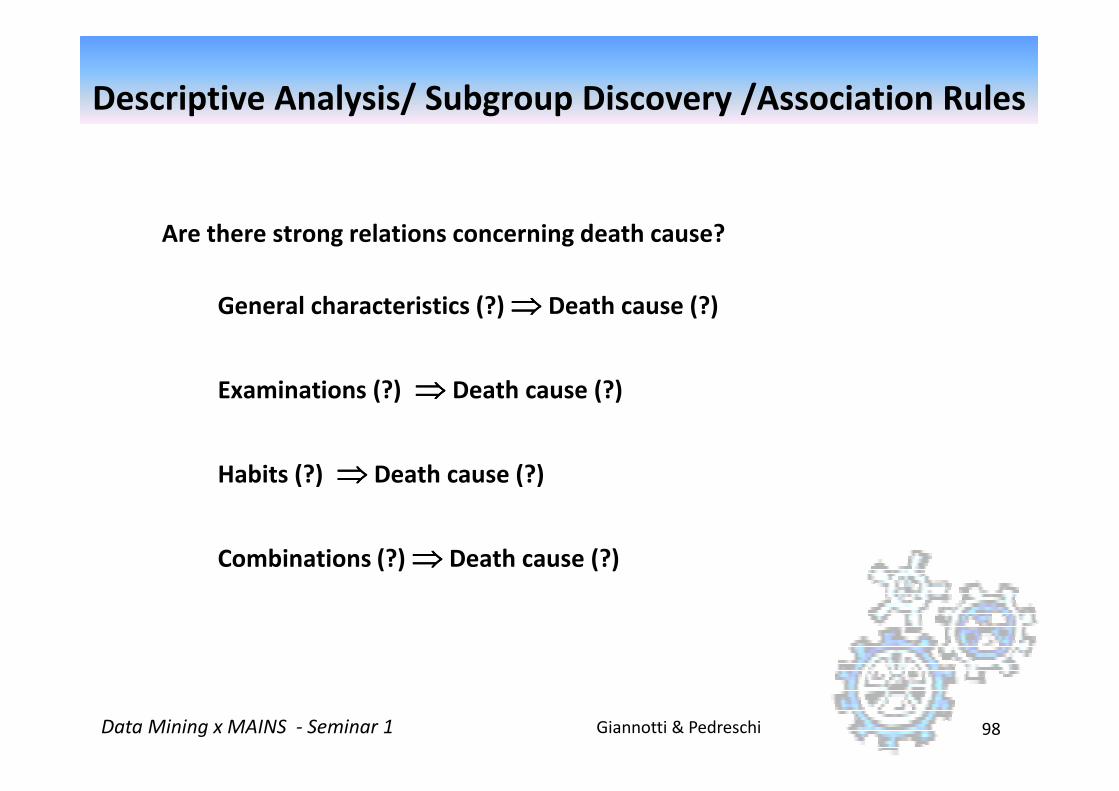
Descriptive Analysis/ Subgroup Discovery /Association Rules
Are there strong relations concerning death cause?
1. General characteristics (?)⇒⇒⇒⇒ Death cause (?)
2. Examinations (?) ⇒⇒⇒⇒ Death cause (?)
Giannotti & PedreschiData Mining x MAINS - Seminar 1 98
2. Examinations (?) ⇒⇒⇒⇒ Death cause (?)
3. Habits (?) ⇒⇒⇒⇒ Death cause (?)
4. Combinations (?)⇒⇒⇒⇒ Death cause (?)
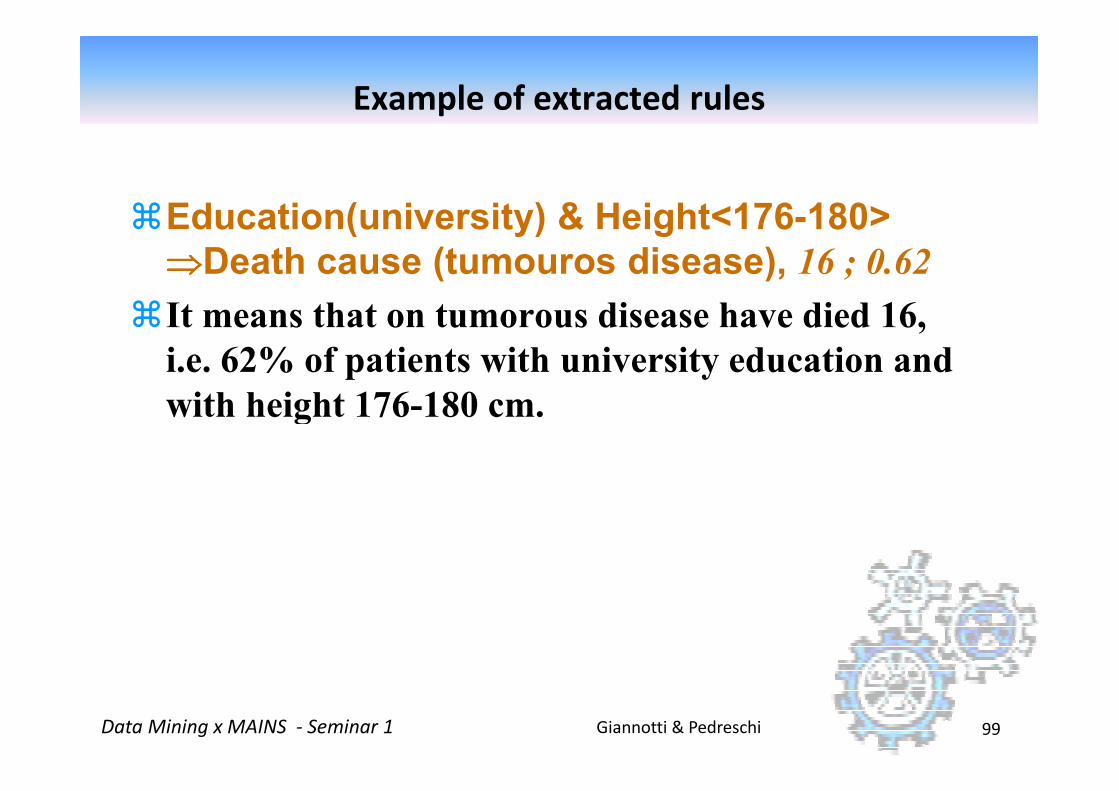
Example of extracted rules
�Education(university) & Height<176-180>
⇒⇒⇒⇒Death cause (tumouros disease), 16 ; 0.62
�It means that on tumorous disease have died 16,
i.e. 62% of patients with university education and
with height 176-180 cm.
Giannotti & PedreschiData Mining x MAINS - Seminar 1 99
with height 176-180 cm.
Example of extracted rules
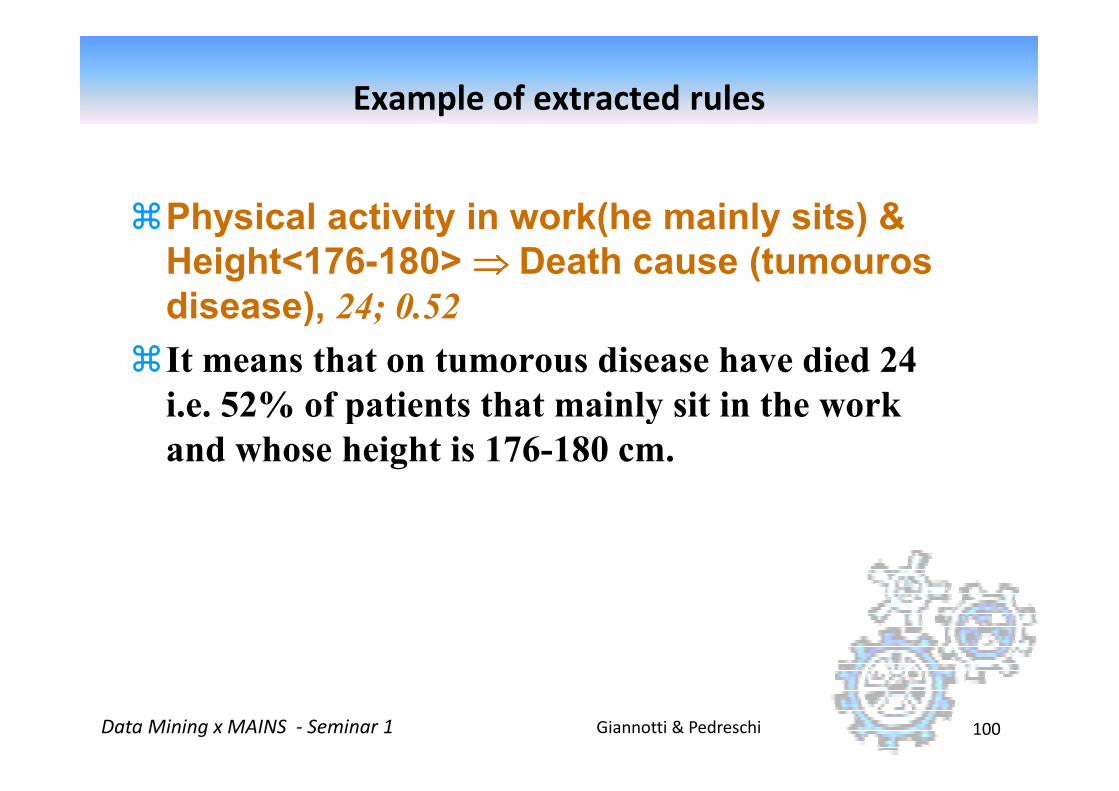
�Physical activity in work(he mainly sits) &
Height<176-180> ⇒⇒⇒⇒ Death cause (tumouros
disease), 24; 0.52
�It means that on tumorous disease have died 24
i.e. 52% of patients that mainly sit in the work
Giannotti & PedreschiData Mining x MAINS - Seminar 1 100
i.e. 52% of patients that mainly sit in the work
and whose height is 176-180 cm.
Example of extracted rules
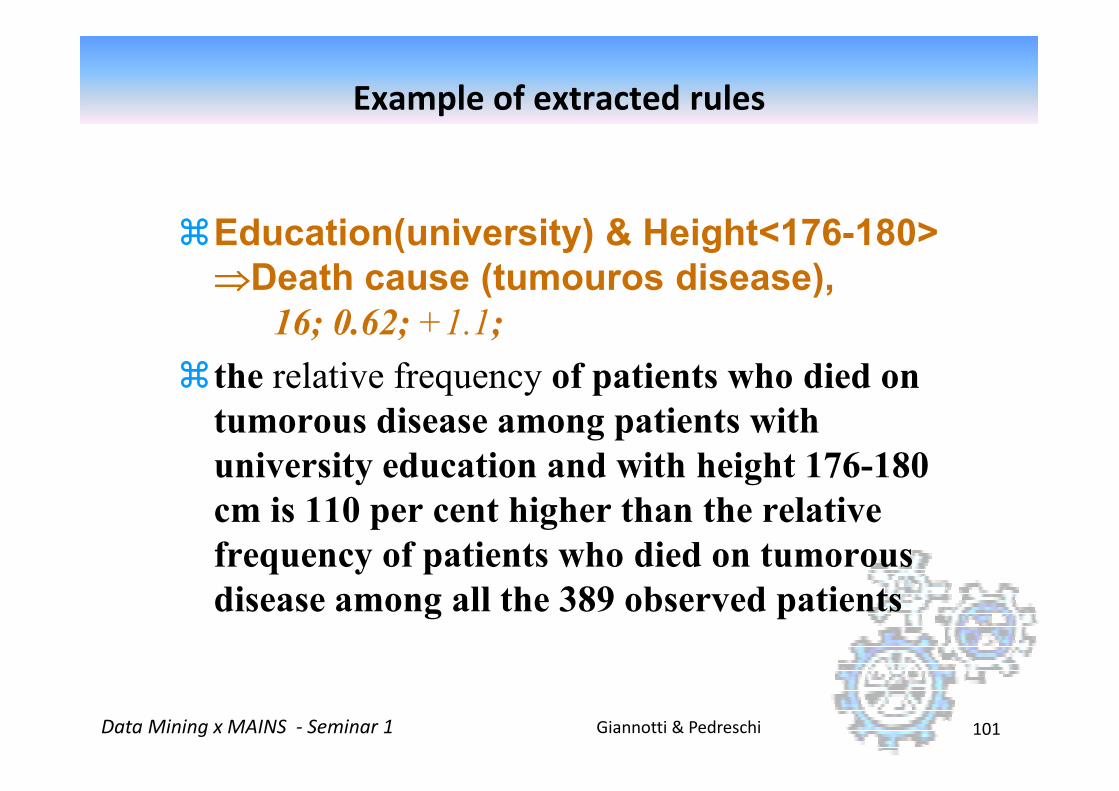
�Education(university) & Height<176-180>
⇒⇒⇒⇒Death cause (tumouros disease),
16; 0.62; +1.1;
�the relative frequency of patients who died on
Giannotti & PedreschiData Mining x MAINS - Seminar 1 101
the relative frequency of patients who died on
tumorous disease among patients with
university education and with height 176-180
cm is 110 per cent higher than the relative
frequency of patients who died on tumorous
disease among all the 389 observed patients

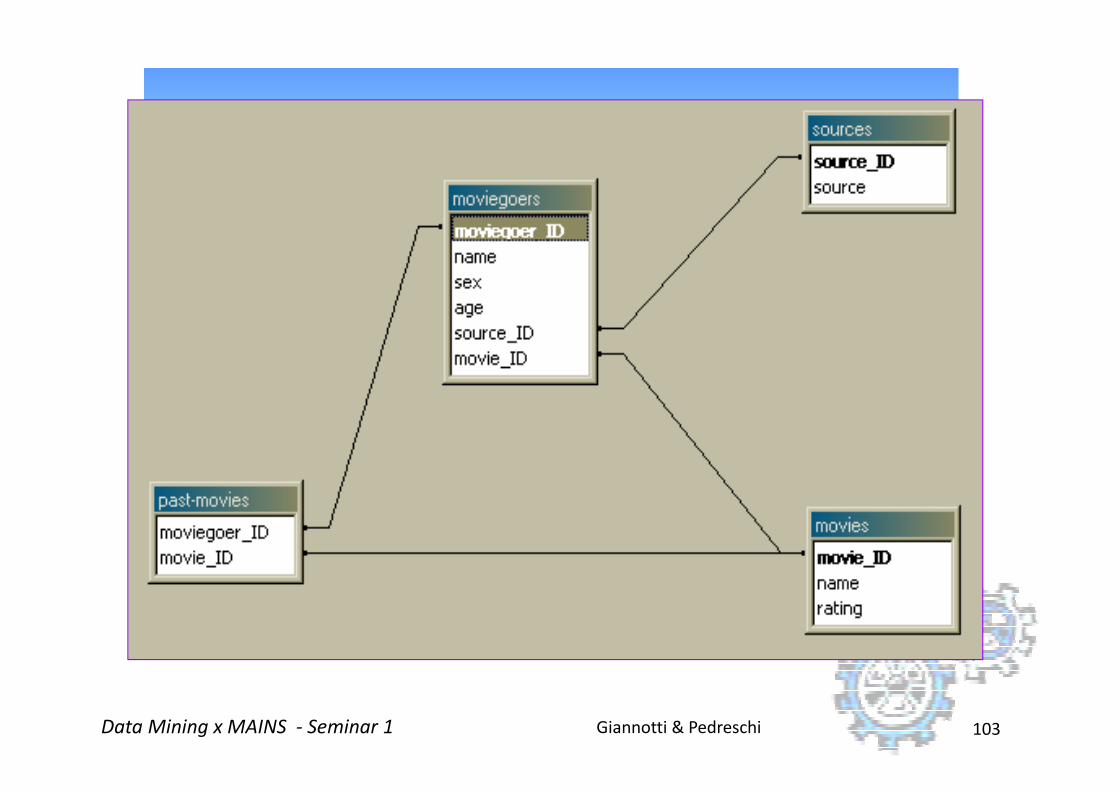
Moviegoer Database :
Giannotti & PedreschiData Mining x MAINS - Seminar 1 103
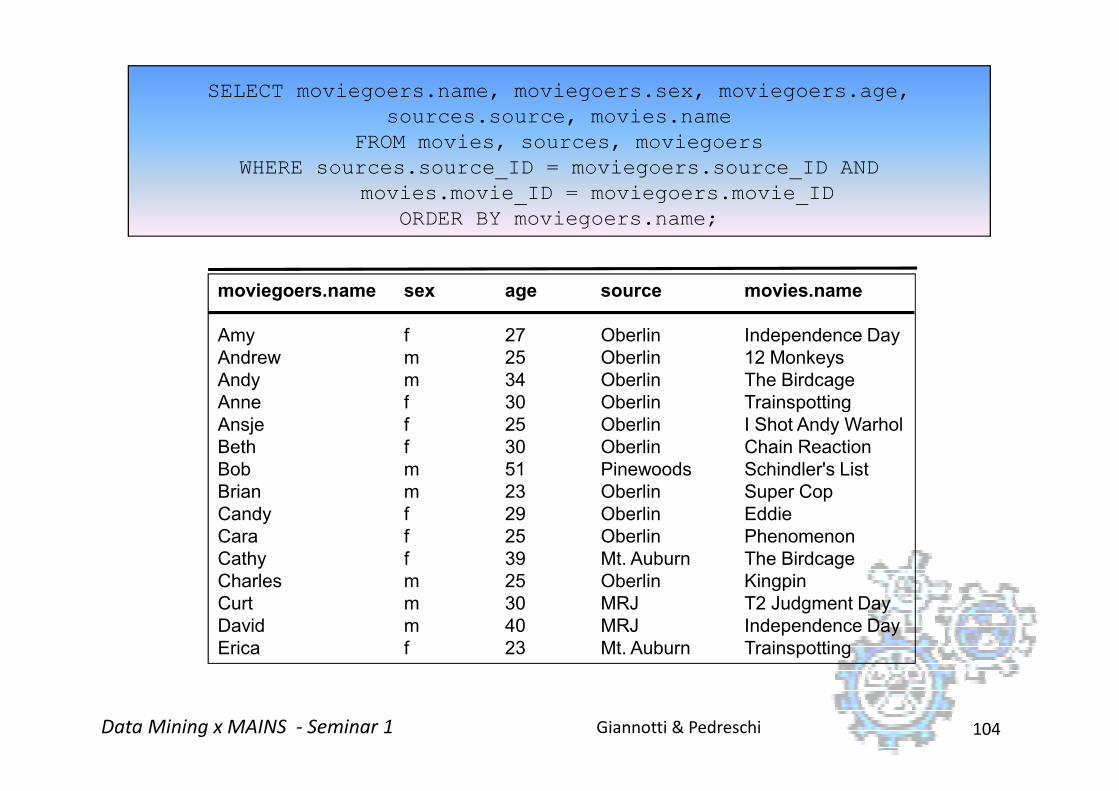
moviegoers.name sex age source movies.name
Amy f 27 Oberlin Independence Day
Andrew m 25 Oberlin 12 Monkeys
Andy m 34 Oberlin The Birdcage
Anne f 30 Oberlin Trainspotting
SELECT moviegoers.name, moviegoers.sex, moviegoers.age,
sources.source, movies.name
FROM movies, sources, moviegoers
WHERE sources.source_ID = moviegoers.source_ID AND
movies.movie_ID = moviegoers.movie_ID
ORDER BY moviegoers.name;
Giannotti & PedreschiData Mining x MAINS - Seminar 1 104
Anne f 30 Oberlin Trainspotting
Ansje f 25 Oberlin I Shot Andy Warhol
Beth f 30 Oberlin Chain Reaction
Bob m 51 Pinewoods Schindler's List
Brian m 23 Oberlin Super Cop
Candy f 29 Oberlin Eddie
Cara f 25 Oberlin Phenomenon
Cathy f 39 Mt. Auburn The Birdcage
Charles m 25 Oberlin Kingpin
Curt m 30 MRJ T2 Judgment Day
David m 40 MRJ Independence Day
Erica f 23 Mt. Auburn Trainspotting
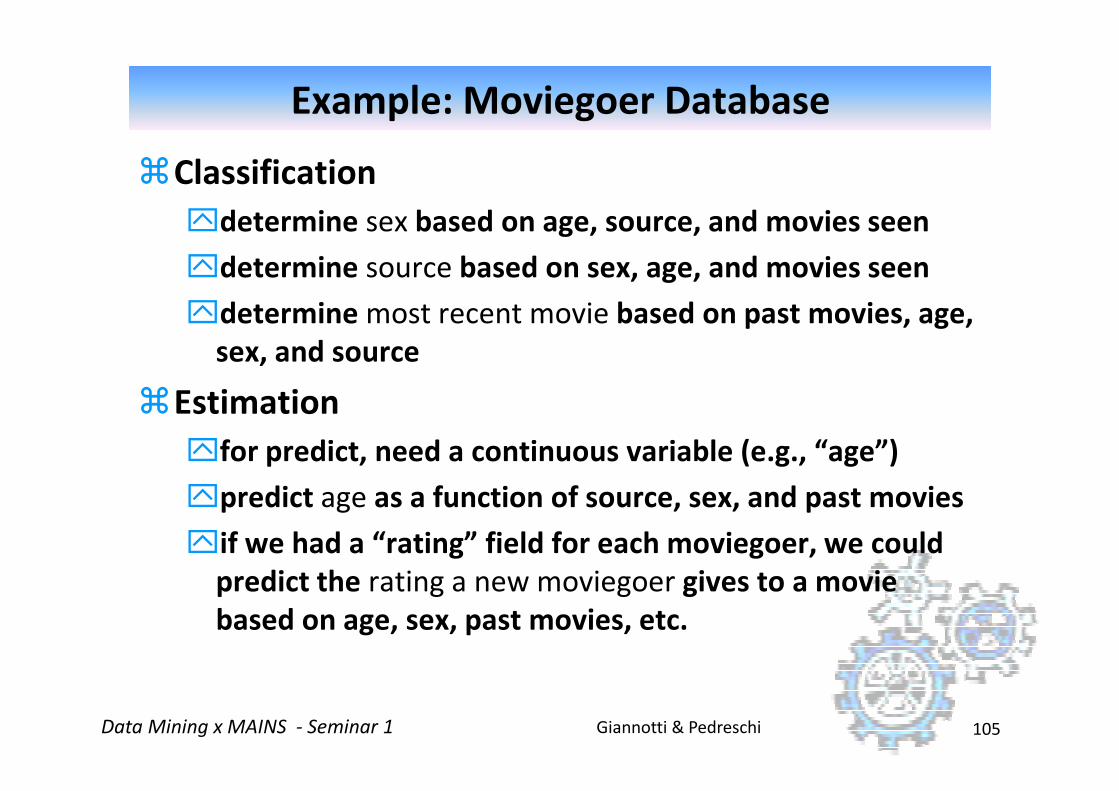
Example: Moviegoer Database
�Classification
determine sex based on age, source, and movies seen
determine source based on sex, age, and movies seen
determine most recent movie based on past movies, age,
sex, and source
�Estimation
Giannotti & PedreschiData Mining x MAINS - Seminar 1 105
�Estimation
for predict, need a continuous variable (e.g., “age”)
predict age as a function of source, sex, and past movies
if we had a “rating” field for each moviegoer, we could
predict the rating a new moviegoer gives to a movie
based on age, sex, past movies, etc.
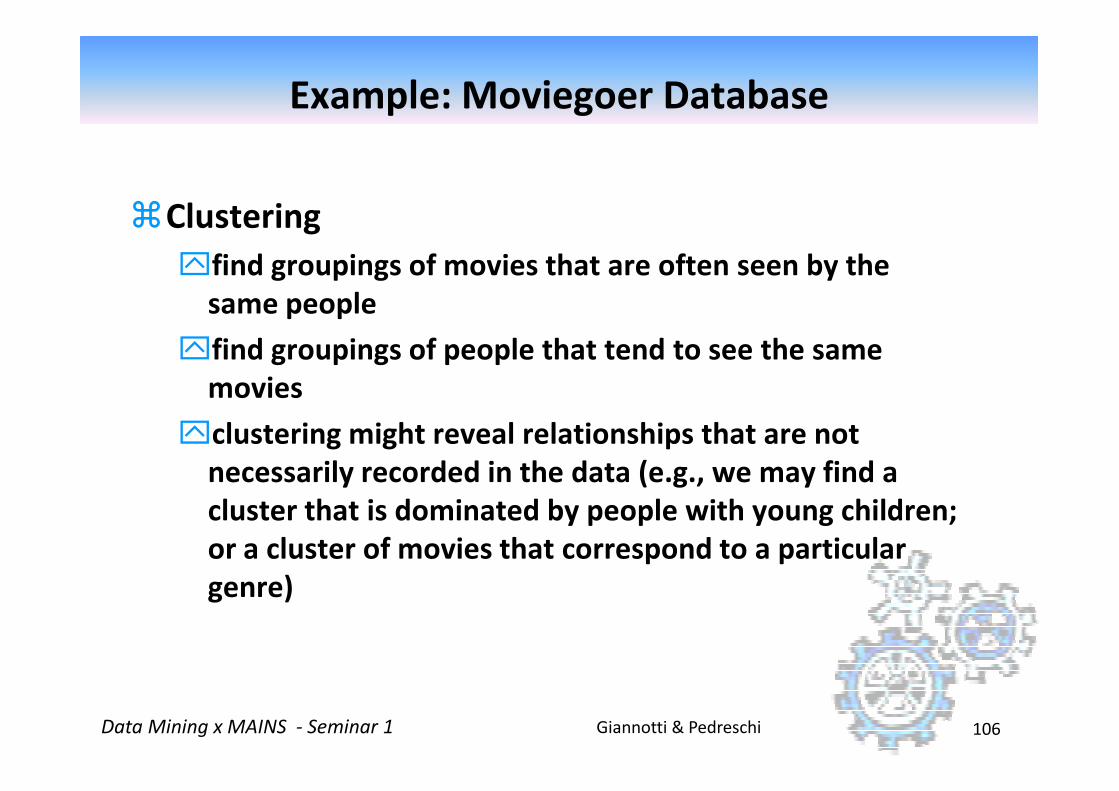
Example: Moviegoer Database
�Clustering
find groupings of movies that are often seen by the
same people
find groupings of people that tend to see the same
movies
Giannotti & PedreschiData Mining x MAINS - Seminar 1 106
movies
clustering might reveal relationships that are not
necessarily recorded in the data (e.g., we may find a
cluster that is dominated by people with young children;
or a cluster of movies that correspond to a particular
genre)

Example: Moviegoer Database� Association Rules
market basket analysis (MBA): “which movies go together?”
need to create “transactions” for each moviegoer containing movies seen by that moviegoer:
name TID Transaction
Amy 001 {Independence Day, Trainspotting}
Andrew 002 {12 Monkeys, The Birdcage, Trainspotting, Phenomenon}
Giannotti & PedreschiData Mining x MAINS - Seminar 1 107
may result in association rules such as:
{“Phenomenon”, “The Birdcage”} ==> {“Trainspotting”}
{“Trainspotting”, “The Birdcage”} ==> {sex = “f”}
Andrew 002 {12 Monkeys, The Birdcage, Trainspotting, Phenomenon}
Andy 003 {Super Cop, Independence Day, Kingpin}
Anne 004 {Trainspotting, Schindler's List}
> > ...
Example: Moviegoer Database
�Sequence Analysis
similar to MBA, but order in which items appear in the
pattern is important
e.g., people who rent “The Birdcage” during a visit tend
to rent “Trainspotting” in the next visit.
Giannotti & PedreschiData Mining x MAINS - Seminar 1 108
to rent “Trainspotting” in the next visit.

On the road to knowledge:
mining 21 years of UK traffic accident reports
Peter Flach et al.
Silnet Network of Excellence
Mining traffic accident reports
� The Hampshire County Council (UK) wanted to obtain a
better insight into how the characteristics of traffic
accidents may have changed over the past 20 years as a
result of improvements in highway design and in vehicle
design.
Giannotti & PedreschiData Mining x MAINS - Seminar 1 110
design.
� The database, contained police traffic accident reports
for all UK accidents that happened in the period 1979-
1999.
Business Understanding
� Understanding of road safety in order to reduce the occurrences and severity of accidents.
influence of road surface condition;
influence of skidding;
influence of location (for example: junction approach);
.
Giannotti & PedreschiData Mining x MAINS - Seminar 1 111
and influence of street lighting.
� trend analysis: long-term overall trends, regional trends, urban trends, and rural trends.
� the comparison of different kinds of locations is interesting: for example, rural versus metropolitan versus suburban.

Data understanding
�Low data quality. Many attribute values
were missing or recorded as unknown.
�Different maps were created to investigate
the effect of several parameters like accident
Giannotti & PedreschiData Mining x MAINS - Seminar 1 112
the effect of several parameters like accident
severity and accident date.
Modelling
�The aim of this effort was to find interesting
associations between road number,
conditions (e.g., weather, and light) and
serious or fatal accidents.
Giannotti & PedreschiData Mining x MAINS - Seminar 1 113
�Certain localities had been selected and
performed the analysis only over the years
1998 and 1999.
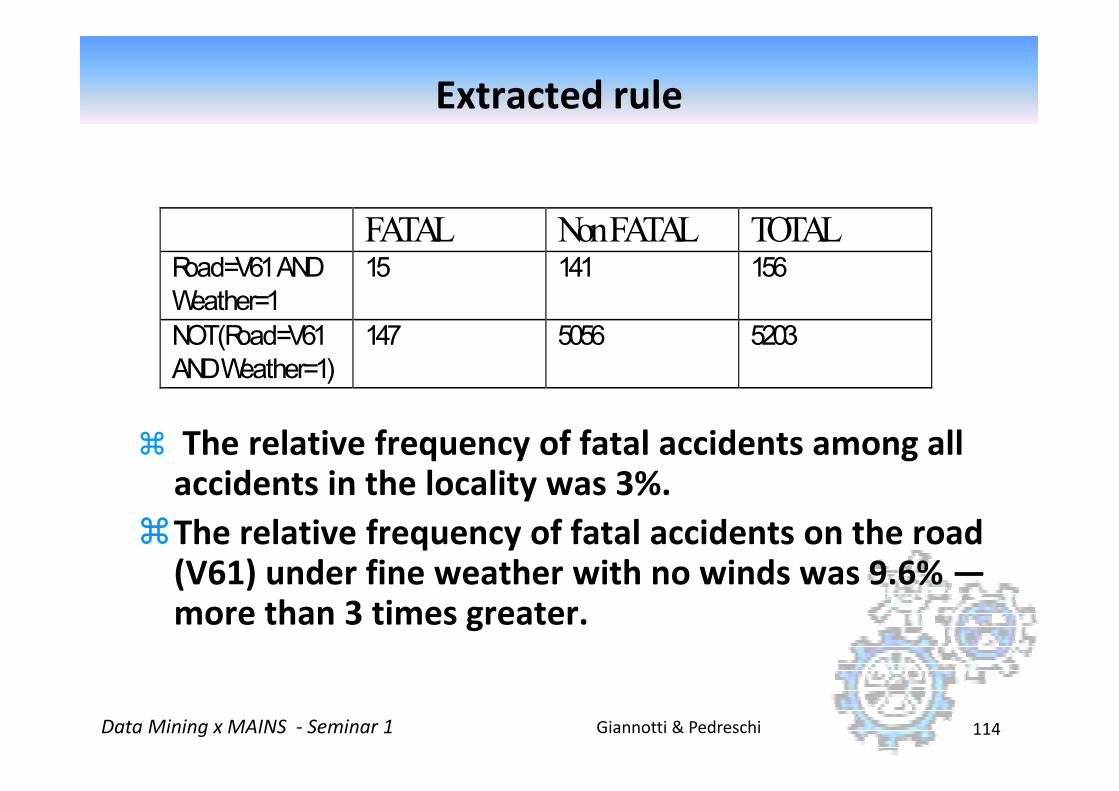
Extracted rule
FATAL Non FATAL TOTAL Road=V61 AND
Weather=1 15 141 156
NOT (Road=V61
AND Weather=1) 147 5056 5203
Giannotti & PedreschiData Mining x MAINS - Seminar 1 114
� The relative frequency of fatal accidents among all
accidents in the locality was 3%.
�The relative frequency of fatal accidents on the road (V61) under fine weather with no winds was 9.6% —more than 3 times greater.
How to develop a Data Mining Project?
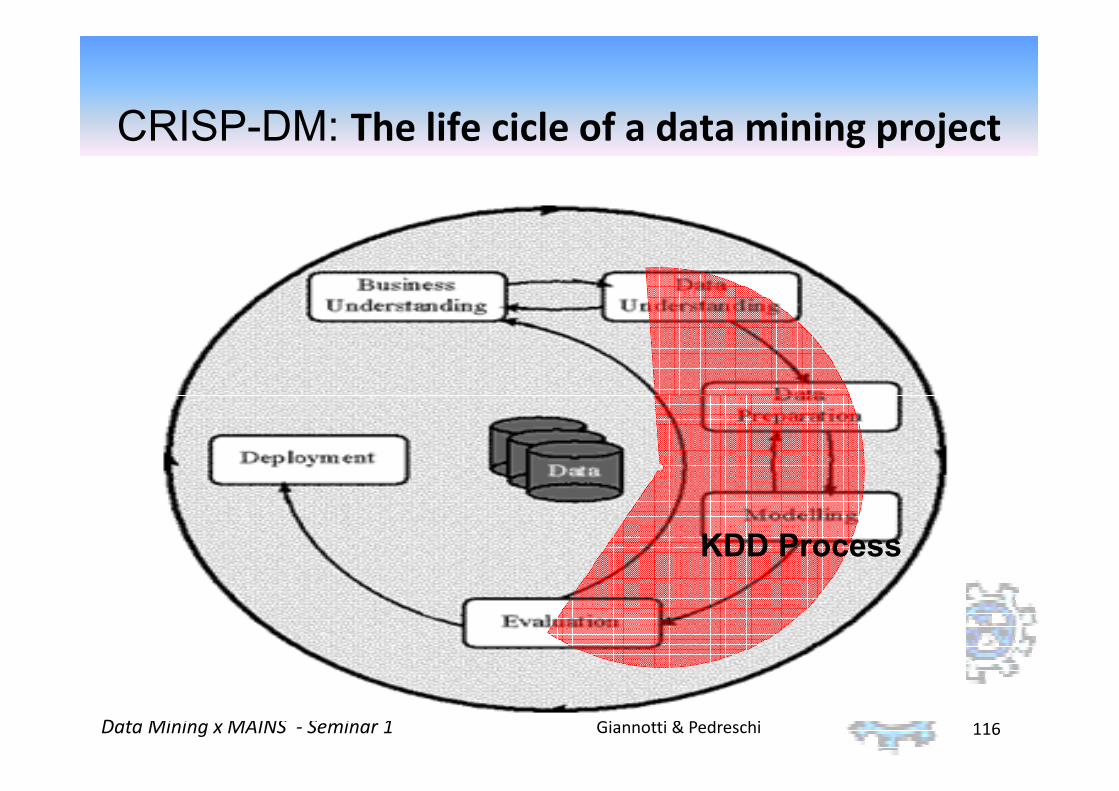
CRISP-DM: The life cicle of a data mining project
Giannotti & PedreschiData Mining x MAINS - Seminar 1 116
KDD Process

Business understanding
�Understanding the project objectives and requirements from a business perspective.
� then converting this knowledge into a data mining problem definition and a preliminary plan.
Giannotti & PedreschiData Mining x MAINS - Seminar 1 117
problem definition and a preliminary plan.
Determine the Business Objectives
Determine Data requirements for Business Objectives
Translate Business questions into Data Mining
Objective
Data understanding
�Data understanding: characterize data available for modelling. Provide assessment and verification for data.
Giannotti & PedreschiData Mining x MAINS - Seminar 1 118
Modeling
�In this phase, various modeling techniques are selected and applied and their parameters are calibrated to optimal values.
�Typically, there are several techniques for the same data mining problem type. Some techniques have
Giannotti & PedreschiData Mining x MAINS - Seminar 1 119
data mining problem type. Some techniques have specific requirements on the form of data.
�Therefore, stepping back to the data preparation phase is often necessary.
Evaluation
�At this stage in the project you have built a model (or models) that appears to have high quality from a data analysis perspective.
�Evaluate the model and review the steps executed to construct the model to be certain it
Giannotti & PedreschiData Mining x MAINS - Seminar 1 120
executed to construct the model to be certain it properly achieves the business objectives.
�A key objective is to determine if there is some important business issue that has not been sufficiently considered.
Deployment
�The knowledge gained will need to be organized and presented in a way that the customer can use it.
�It often involves applying “live” models within an organization’s decision making processes, for example in real-time personalization of Web pages
Giannotti & PedreschiData Mining x MAINS - Seminar 1 121
example in real-time personalization of Web pages or repeated scoring of marketing databases.

Deployment
�It can be as simple as generating a report or as complex as implementing a repeatable data mining process across the enterprise.
Giannotti & PedreschiData Mining x MAINS - Seminar 1 122
�In many cases it is the customer, not the data analyst, who carries out the deployment steps.