cronica da HCV: la progressione verso la...
40
La gestione corrente dell’infezione cronica da HCV: la progressione verso la cirrosi Simona Landonio I Div Mal inf H Sacco Milano
Transcript of cronica da HCV: la progressione verso la...
La gestione corrente dell’infezione cronica da HCV:
la progressione verso la cirrosi
Simona Landonio
I Div Mal inf
H Sacco Milano

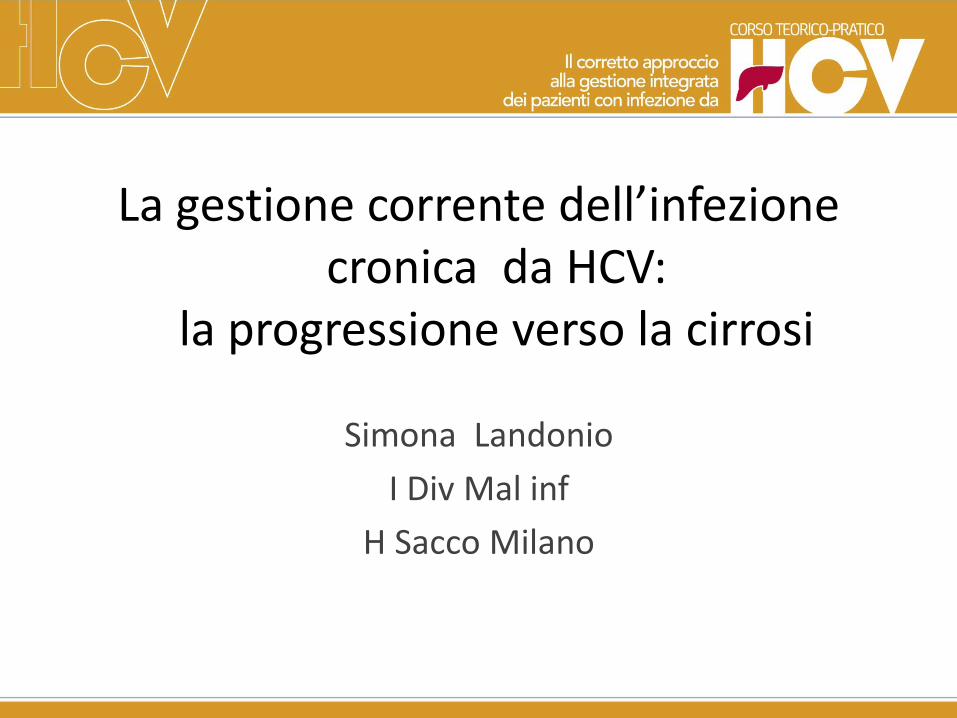
HCV Natural History
Viganò M et al Gastroenterology 2007;133:835-842

Overall survival: cirrhosis at baseline is the only factor associated with reduced
survival
Viganò M et al Gastroenterology 2007;133:835-842
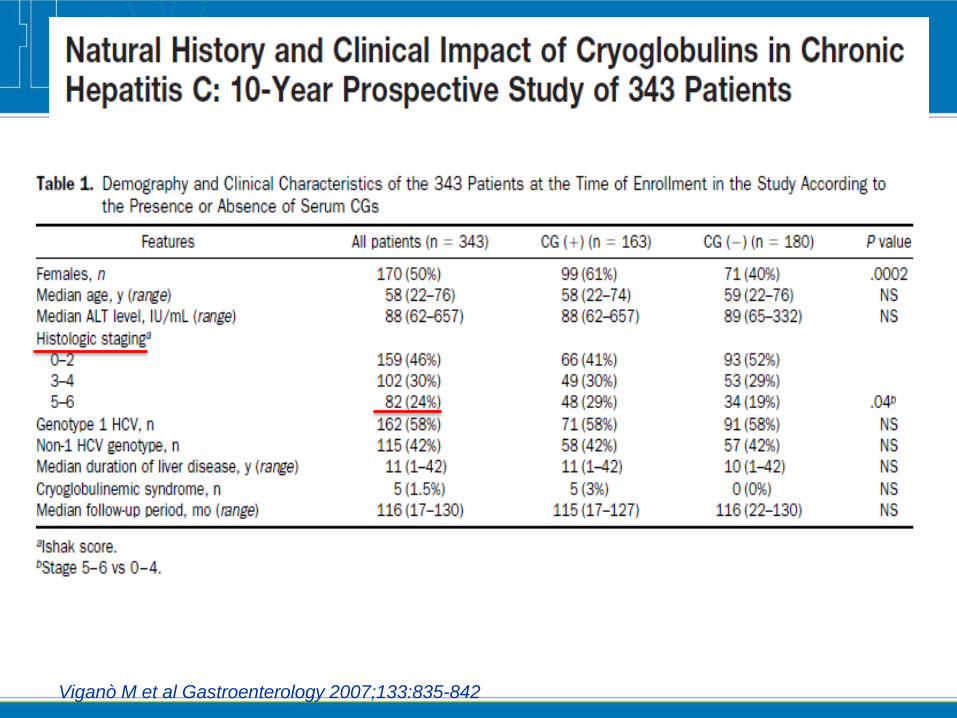
Ten-year Progression Rate of Chronic Hepatitis C to Cirrhosis
Viganò M et al Gastroenterology 2007;133:835-842
Patients
still at risk 8
0
26
0
26
1
25
6
247 23
1
260 19
4
18
3
202 17
2
Months0 24 48 9672 120
Progression rate x yr = 2.4%
100
40
20
0
10
30
• età
•Fibrosi basale
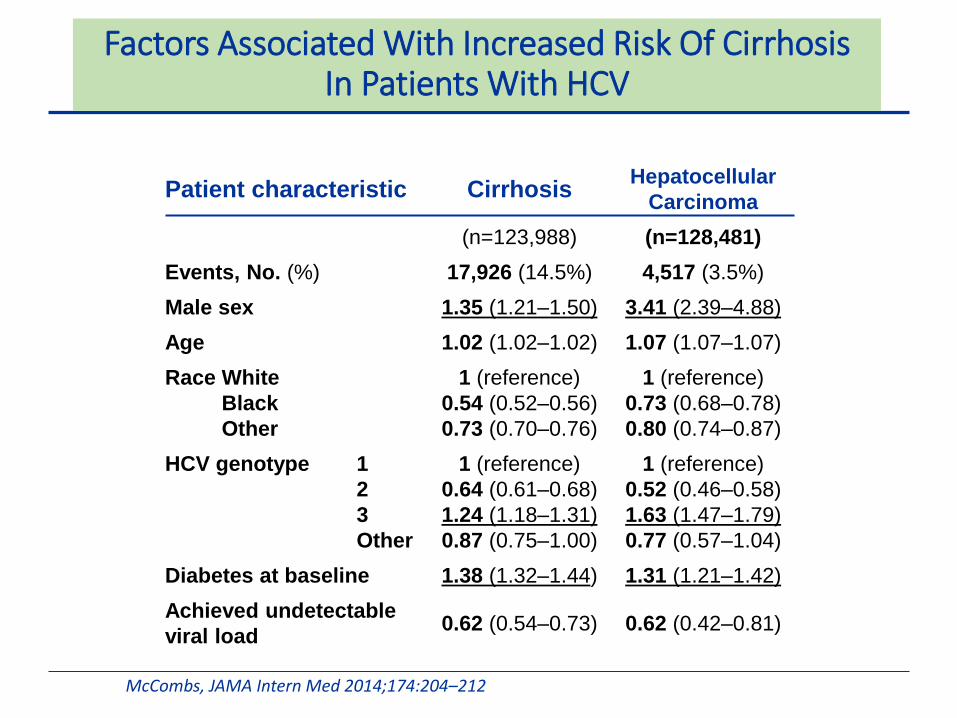
Factors Associated With Increased Risk Of Cirrhosis In Patients With HCV
McCombs, JAMA Intern Med 2014;174:204–212
Patient characteristic CirrhosisHepatocellular
Carcinoma
(n=123,988) (n=128,481)
Events, No. (%) 17,926 (14.5%) 4,517 (3.5%)
Male sex 1.35 (1.21–1.50) 3.41 (2.39–4.88)
Age 1.02 (1.02–1.02) 1.07 (1.07–1.07)
Race White
Black
Other
1 (reference)
0.54 (0.52–0.56)
0.73 (0.70–0.76)
1 (reference)
0.73 (0.68–0.78)
0.80 (0.74–0.87)
HCV genotype 1
2
3
Other
1 (reference)
0.64 (0.61–0.68)
1.24 (1.18–1.31)
0.87 (0.75–1.00)
1 (reference)
0.52 (0.46–0.58)
1.63 (1.47–1.79)
0.77 (0.57–1.04)
Diabetes at baseline 1.38 (1.32–1.44) 1.31 (1.21–1.42)
Achieved undetectable
viral load0.62 (0.54–0.73) 0.62 (0.42–0.81)
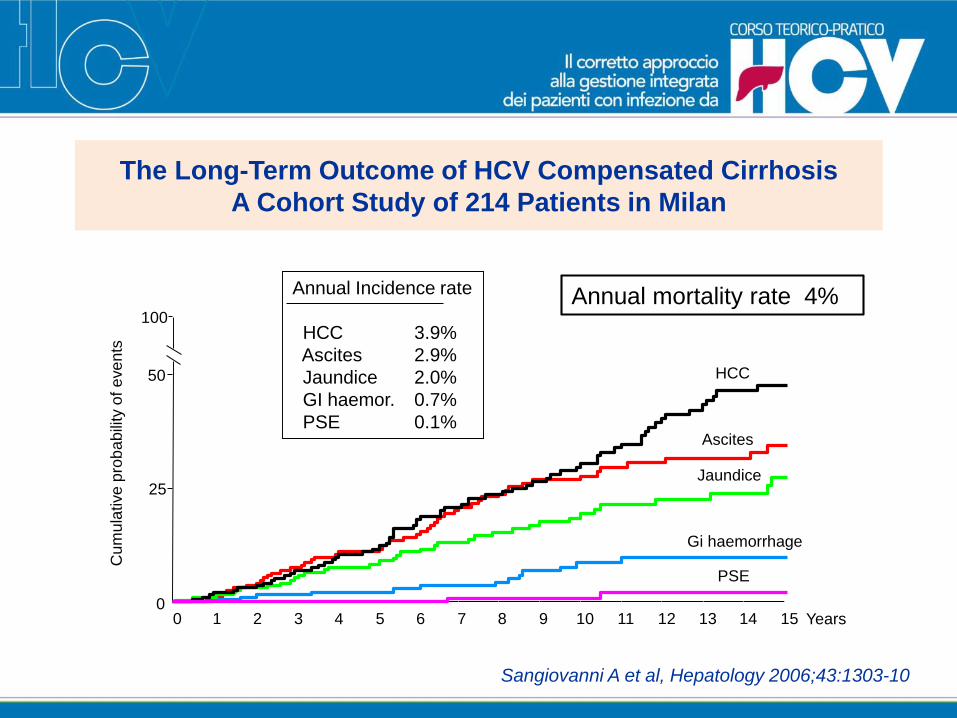
The Long-Term Outcome of HCV Compensated Cirrhosis
A Cohort Study of 214 Patients in Milan
Sangiovanni A et al, Hepatology 2006;43:1303-10
Cu
mu
lative
pro
ba
bili
ty o
f e
ve
nts
0
25
50
100
0 1 32 4 5 6 87 9 10 1211 13 1514 Years
HCC
Gi haemorrhage
Ascites
Jaundice
PSE
Annual Incidence rate
HCC 3.9%
Ascites 2.9%
Jaundice 2.0%
GI haemor. 0.7%
PSE 0.1%
Annual mortality rate 4%
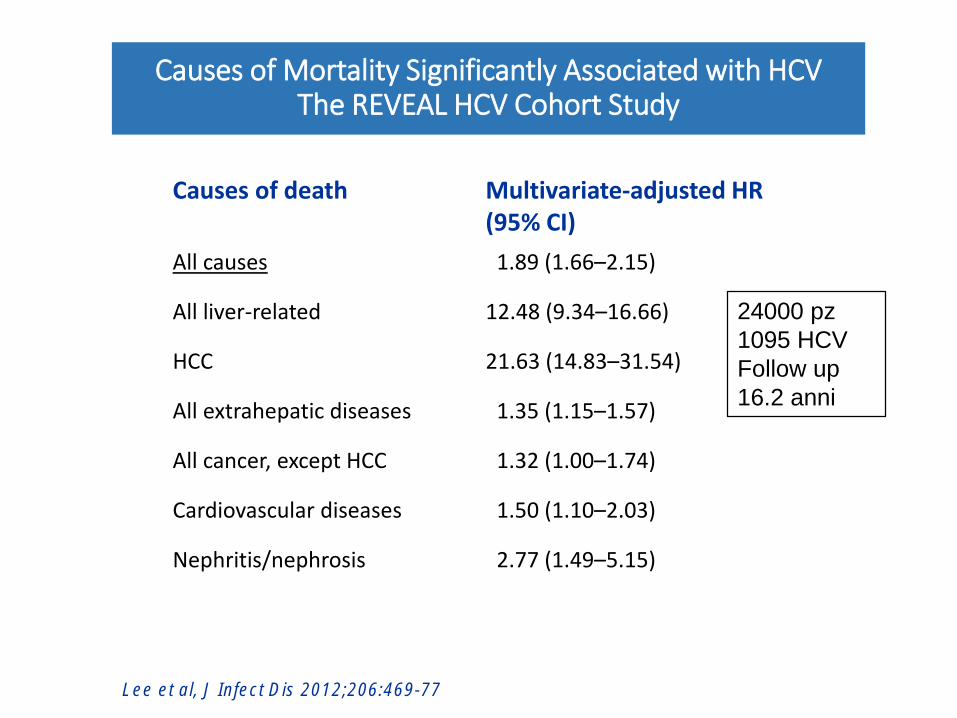
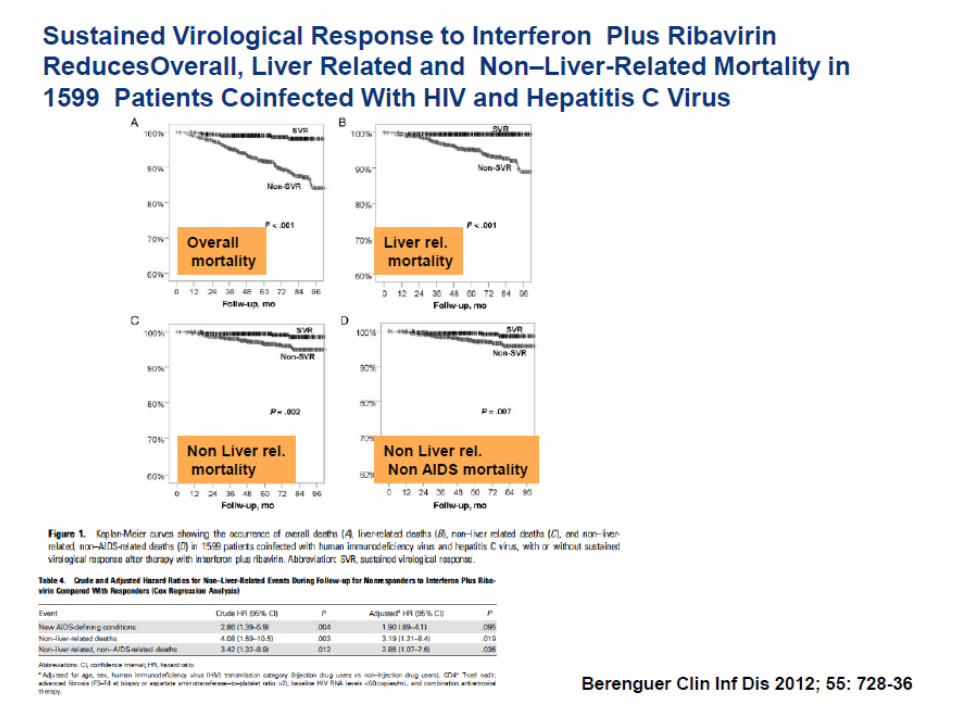
Causes of Mortality Significantly Associated with HCVThe REVEAL HCV Cohort Study
Causes of death Multivariate-adjusted HR (95% CI)
All causes 1.89 (1.66–2.15)
All liver-related 12.48 (9.34–16.66)
HCC 21.63 (14.83–31.54)
All extrahepatic diseases 1.35 (1.15–1.57)
All cancer, except HCC 1.32 (1.00–1.74)
Cardiovascular diseases 1.50 (1.10–2.03)
Nephritis/nephrosis 2.77 (1.49–5.15)
Lee et al, J Infect Dis 2012;206:469-77
24000 pz
1095 HCV
Follow up
16.2 anni
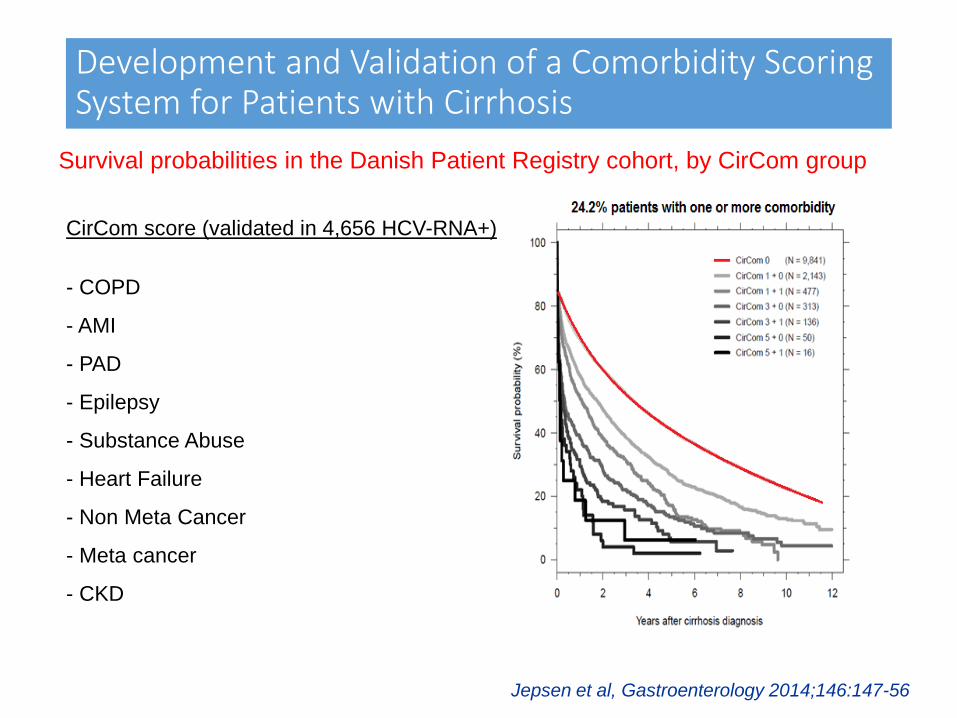
Development and Validation of a Comorbidity Scoring System for Patients with Cirrhosis
Survival probabilities in the Danish Patient Registry cohort, by CirCom group
Jepsen et al, Gastroenterology 2014;146:147-56
CirCom score (validated in 4,656 HCV-RNA+)
- COPD
- AMI
- PAD
- Epilepsy
- Substance Abuse
- Heart Failure
- Non Meta Cancer
- Meta cancer
- CKD
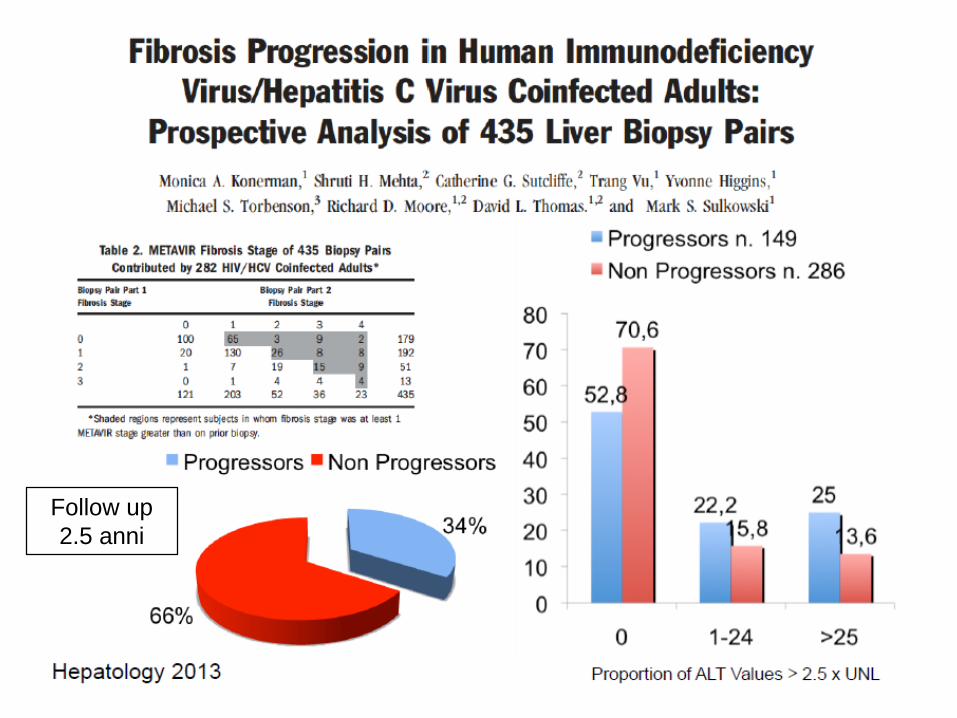
Follow up
2.5 anni
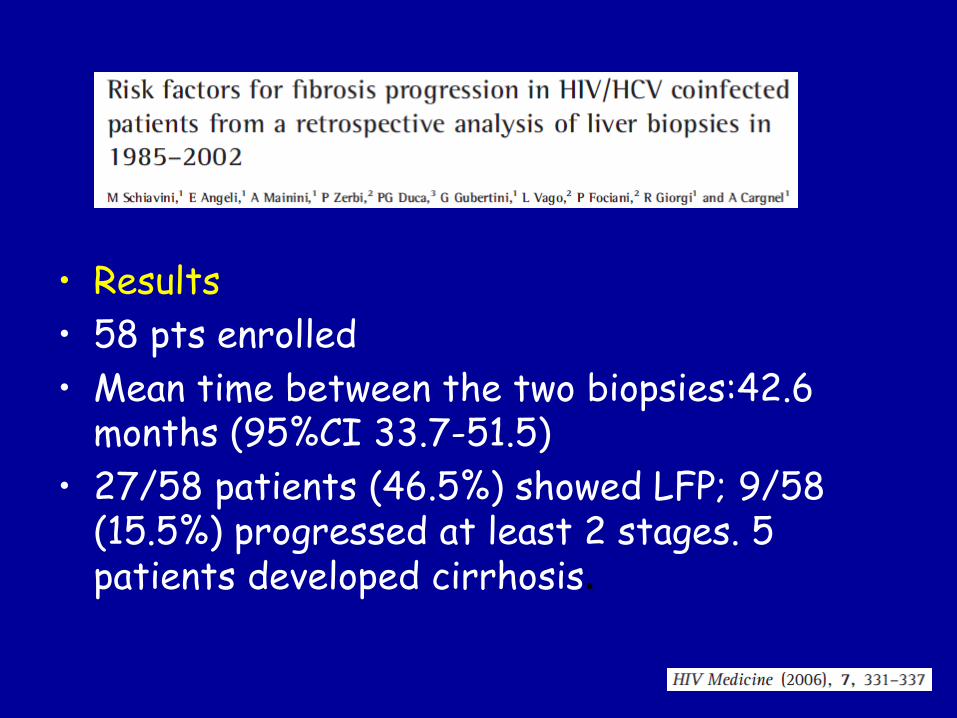
• Results
• 58 pts enrolled
• Mean time between the two biopsies:42.6 months (95%CI 33.7-51.5)
• 27/58 patients (46.5%) showed LFP; 9/58 (15.5%) progressed at least 2 stages. 5 patients developed cirrhosis.
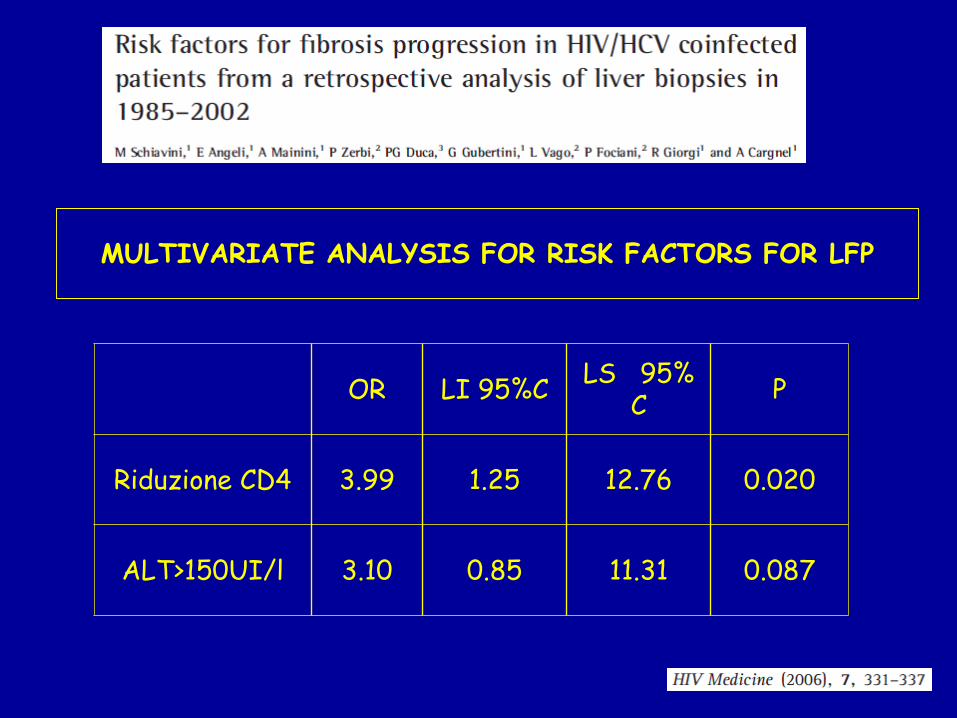
MULTIVARIATE ANALYSIS FOR RISK FACTORS FOR LFP
OR LI 95%CLS 95%
CP
Riduzione CD4 3.99 1.25 12.76 0.020
ALT>150UI/l 3.10 0.85 11.31 0.087
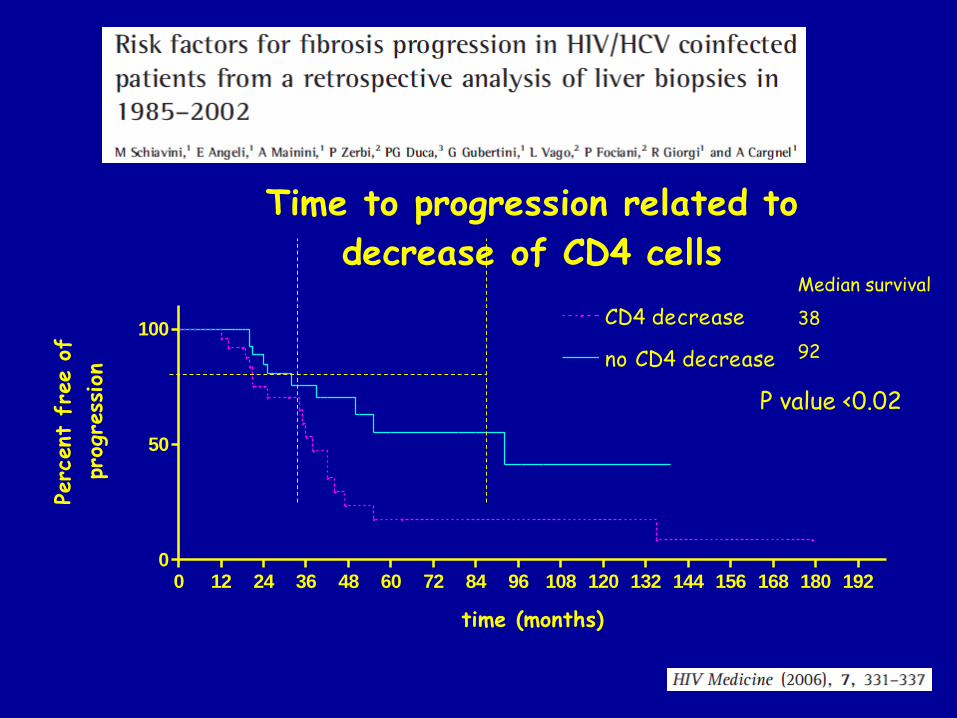
Time to progression related to
decrease of CD4 cells
0 12 24 36 48 60 72 84 96 108 120 132 144 156 168 180 1920
50
100CD4 decrease
no CD4 decrease
time (months)
Perc
ent
fre
e o
f
prog
ress
ion
Median survival
38
92
P value <0.02
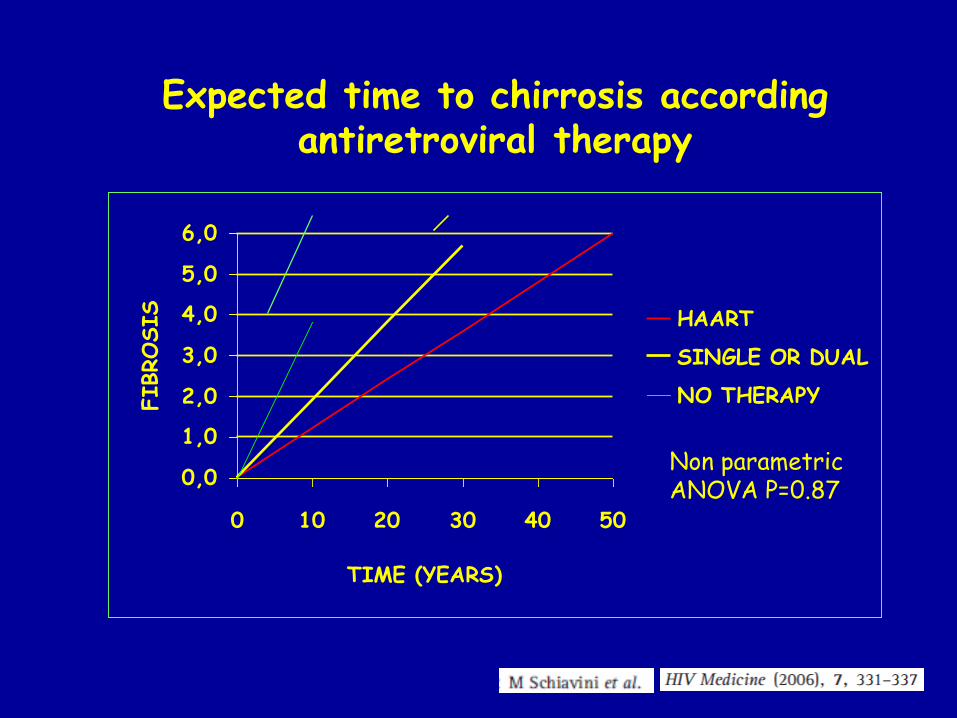
Expected time to chirrosis accordingantiretroviral therapy
0,0
1,0
2,0
3,0
4,0
5,0
6,0
0 10 20 30 40 50
TIME (YEARS)
FIBROSIS HAART
SINGLE OR DUAL
NO THERAPY
Non parametric ANOVA P=0.87
Macias J et al Hepatology 2015; 61 (5): 1503-11
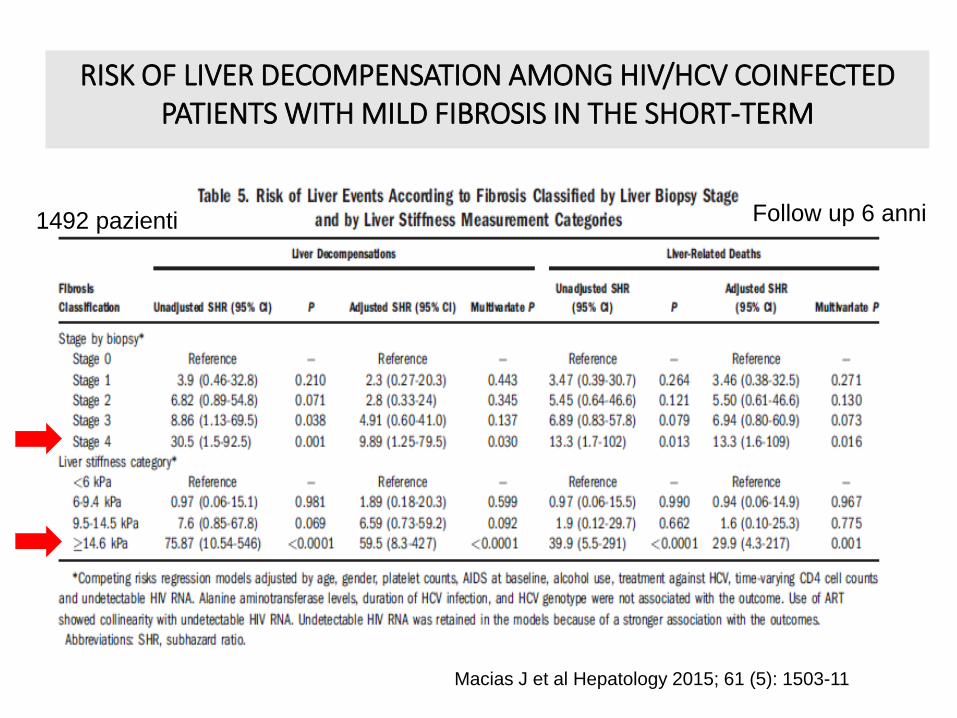
RISK OF LIVER DECOMPENSATION AMONG HIV/HCV COINFECTED PATIENTS WITH MILD FIBROSIS IN THE SHORT-TERM
1492 pazienti Follow up 6 anni
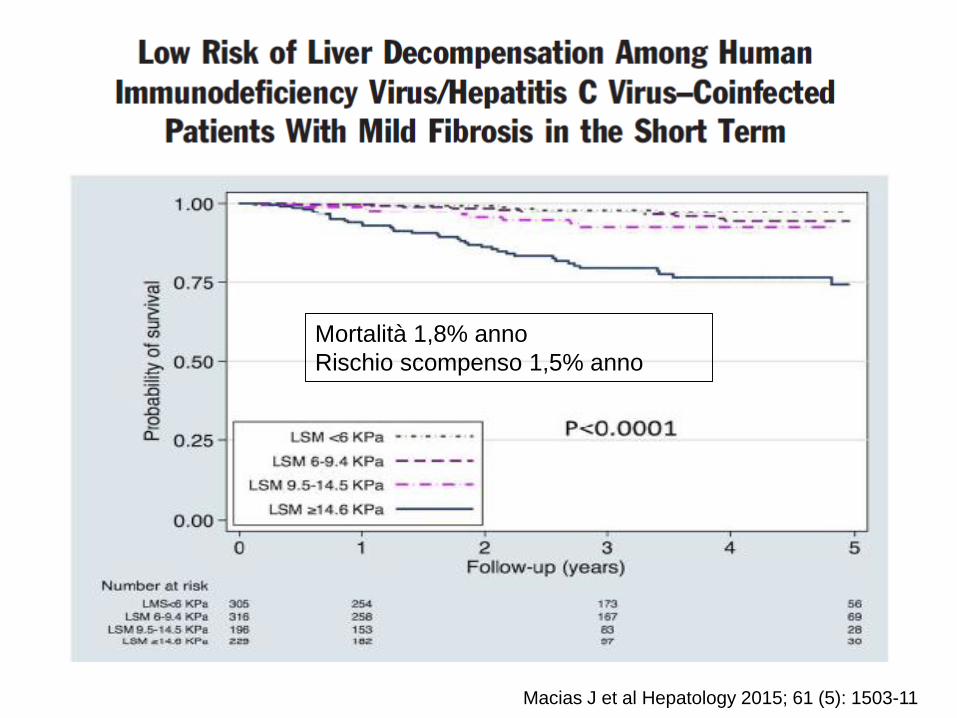
Macias J et al Hepatology 2015; 61 (5): 1503-11
Mortalità 1,8% anno
Rischio scompenso 1,5% anno
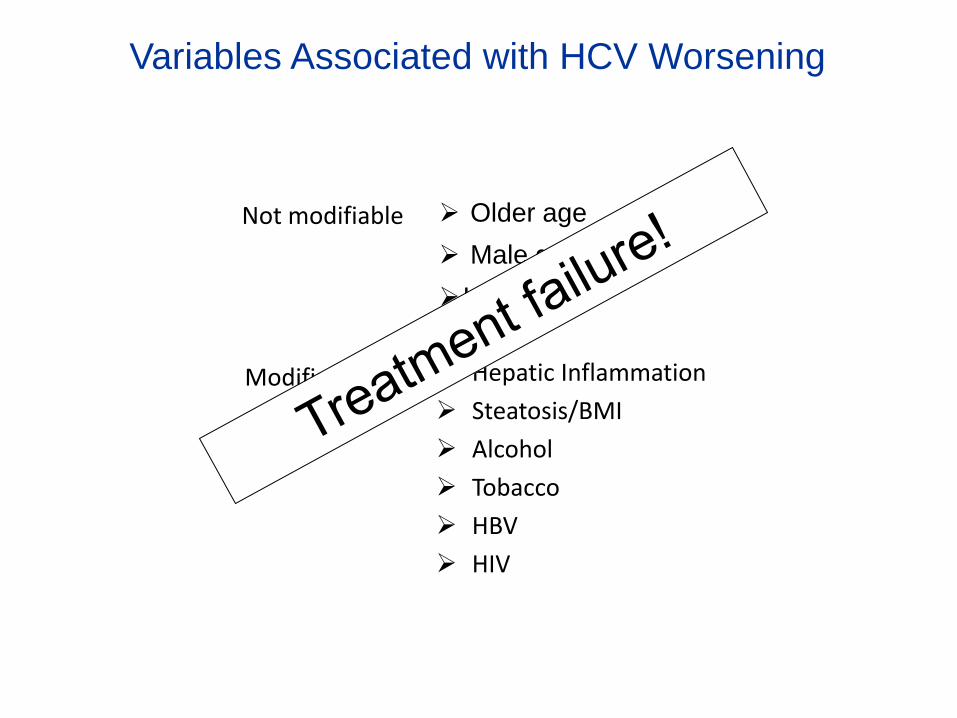
Variables Associated with HCV Worsening
Older age
Male gender
HCV gt
Hepatic Inflammation
Steatosis/BMI
Alcohol
Tobacco
HBV
HIV
Not modifiable
Modifiable
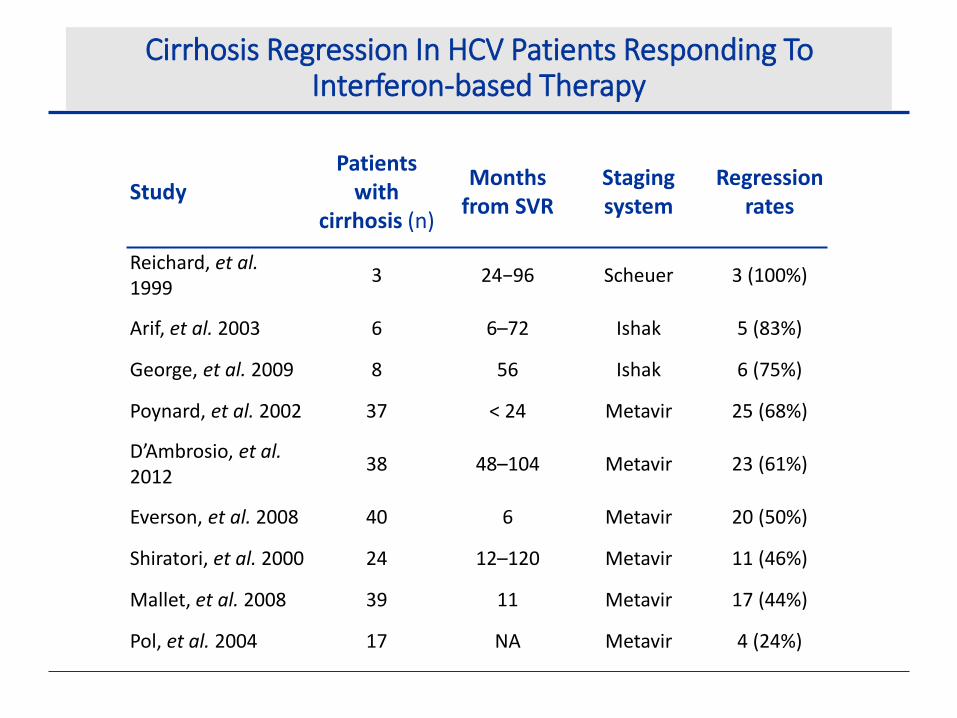
Cirrhosis Regression In HCV Patients Responding To Interferon-based Therapy
StudyPatients
with cirrhosis (n)
Months from SVR
Stagingsystem
Regression rates
Reichard, et al. 1999
3 24−96 Scheuer 3 (100%)
Arif, et al. 2003 6 6–72 Ishak 5 (83%)
George, et al. 2009 8 56 Ishak 6 (75%)
Poynard, et al. 2002 37 < 24 Metavir 25 (68%)
D’Ambrosio, et al. 2012
38 48–104 Metavir 23 (61%)
Everson, et al. 2008 40 6 Metavir 20 (50%)
Shiratori, et al. 2000 24 12–120 Metavir 11 (46%)
Mallet, et al. 2008 39 11 Metavir 17 (44%)
Pol, et al. 2004 17 NA Metavir 4 (24%)

SVR and Mortality: IFN Era Long-term follow-up study of pts with chronic HCV infection and
advanced fibrosis or cirrhosis (N = 530 treated 1990-2003; median follow-up: 8.4 yrs)[1]
Baseline factors significantly associated with all-cause mortality:
– Older age
– Genotype 3 (2-fold increase in mortality and HCC)
– Higher Ishak fibrosis score
– Diabetes
– Severe alcohol use
SVR also reduces all-cause mortalityeven in absence of cirrhosis[2]
1. van der Meer AJ, et al. JAMA. 2012;308:2584-2593. 2. Backus LI, et al. Clin Gastroenterol Hepatol. 2011;9:509-516.
10-Yr Cumulative
Incidence5
04
03
02
01
00
Pts
(%
)
SVR
No SVR
8.9
26.0
1.9
27.4
5.1
21.8
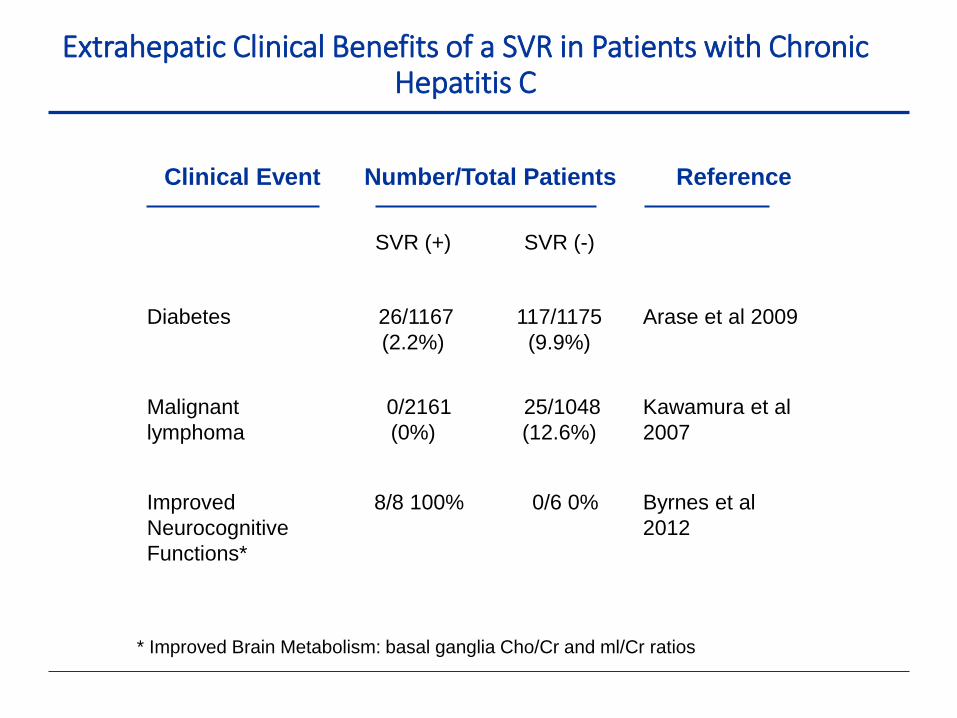
Clinical Event Number/Total Patients Reference
SVR (+) SVR (-)
Diabetes 26/1167
(2.2%)
117/1175
(9.9%)
Arase et al 2009
Malignant
lymphoma
0/2161
(0%)
25/1048
(12.6%)
Kawamura et al
2007
Improved
Neurocognitive
Functions*
8/8 100% 0/6 0% Byrnes et al
2012
* Improved Brain Metabolism: basal ganglia Cho/Cr and ml/Cr ratios
Extrahepatic Clinical Benefits of a SVR in Patients with Chronic Hepatitis C
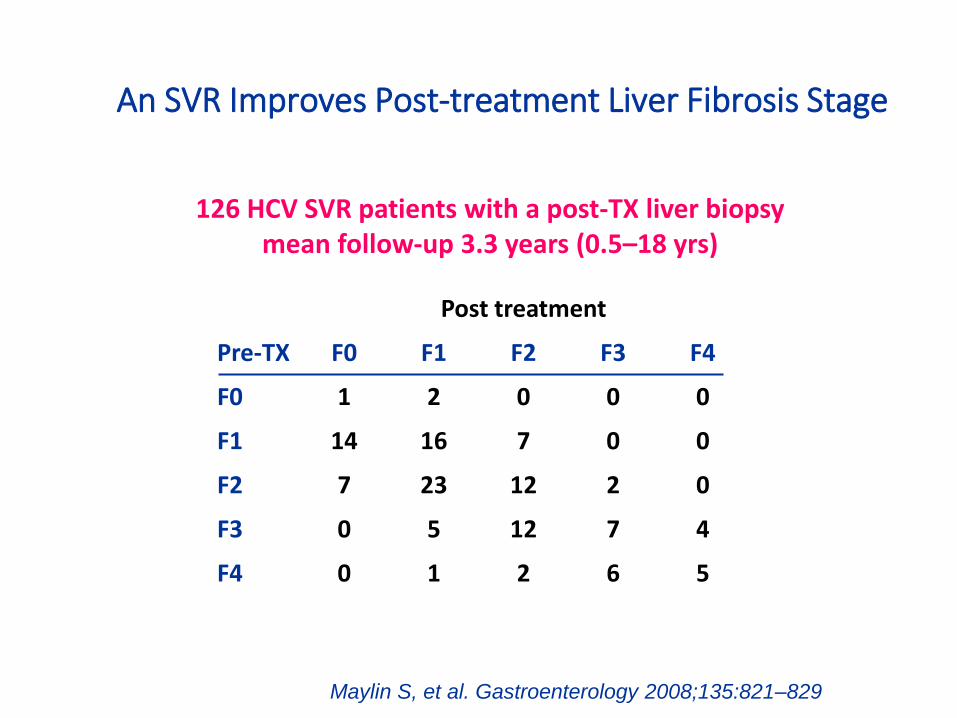
An SVR Improves Post-treatment Liver Fibrosis Stage
Post treatment
Pre-TX F0 F1 F2 F3 F4
F0 1 2 0 0 0
F1 14 16 7 0 0
F2 7 23 12 2 0
F3 0 5 12 7 4
F4 0 1 2 6 5
126 HCV SVR patients with a post-TX liver biopsy mean follow-up 3.3 years (0.5–18 yrs)
Maylin S, et al. Gastroenterology 2008;135:821–829

An SVR Improves Post-treatment Liver Fibrosis Stage
Post treatment
Pre-TX F0 F1 F2 F3 F4
F0 1 2 0 0 0
F1 14 16 7 0 0
F2 7 23 12 2 0
F3 0 5 12 7 4
F4 0 1 2 6 5
126 HCV SVR patients with a post-TX liver biopsymean follow-up 3.3 years (0.5–18 yrs)
Maylin S, et al. Gastroenterology 2008;135:821–829
Fibrosis stage:
-Improve 56%
-Unchange 32%
-Worse 12%
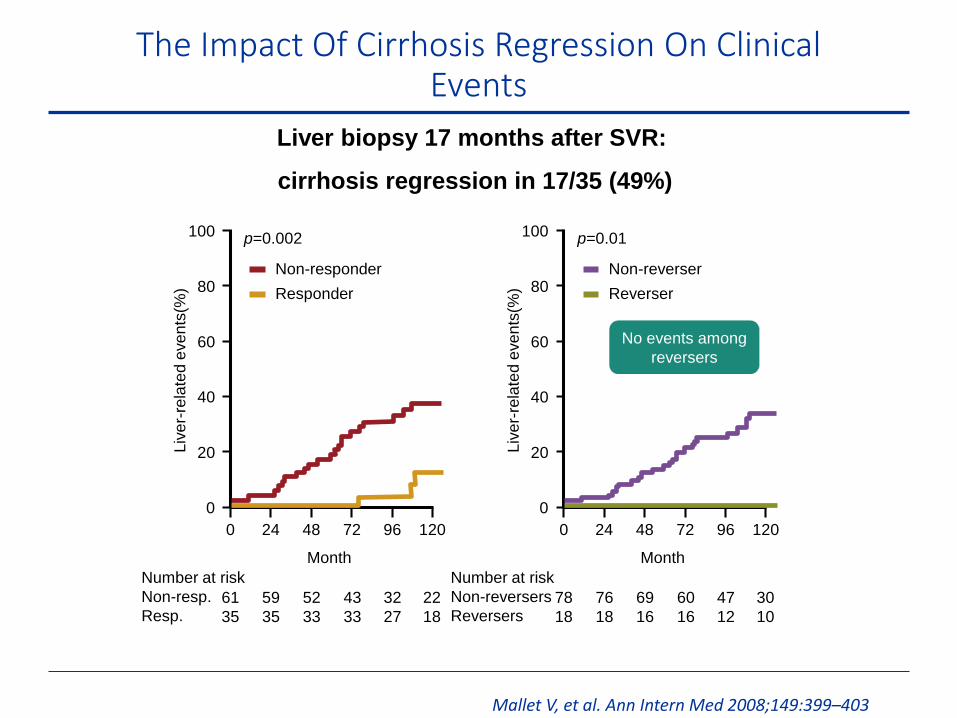
Liver biopsy 17 months after SVR:
cirrhosis regression in 17/35 (49%)
Number at risk
Non-resp.
Resp.
0
0
20
40
60
80
100
24 48 72 96 120
Month
Liv
er-
rela
ted
eve
nts
(%)
p=0.002
61
35
Non-responder
Responder
59
35
52
33
43
33
32
27
22
18
No events among
reversers
Number at risk
Non-reversers
Reversers
0
0
20
40
60
80
100
24 48 72 96 120
Month
Liv
er-
rela
ted
eve
nts
(%)
p=0.01
78
18
Non-reverser
Reverser
76
18
69
16
60
16
47
12
30
10
The Impact Of Cirrhosis Regression On Clinical Events
Mallet V, et al. Ann Intern Med 2008;149:399–403
No. at riskNo SVRSVR
00
5
10
15
20
30
1 2 3 4 5 6 7 8 9 10Time (years)
All-
cau
se m
ort
alit
y (%
)
p<0.001
No SVR
SVR
405192
393181
382168
363162
344155
317144
295125
25088
20756
16440
13528
25
All-cause mortality
No. at riskNo SVRSVR
00
5
10
15
20
30
1 2 3 4 5 6 7 8 9 10Time (years)
Live
r-re
late
d m
ort
alit
y o
rLi
ver
tran
spla
nta
tio
n (
%) p<0.001
No SVR
SVR
405192
392181
380168
358162
334155
305144
277125
22988
18756
14640
11928
25
Liver-related mortalityor liver transplantation
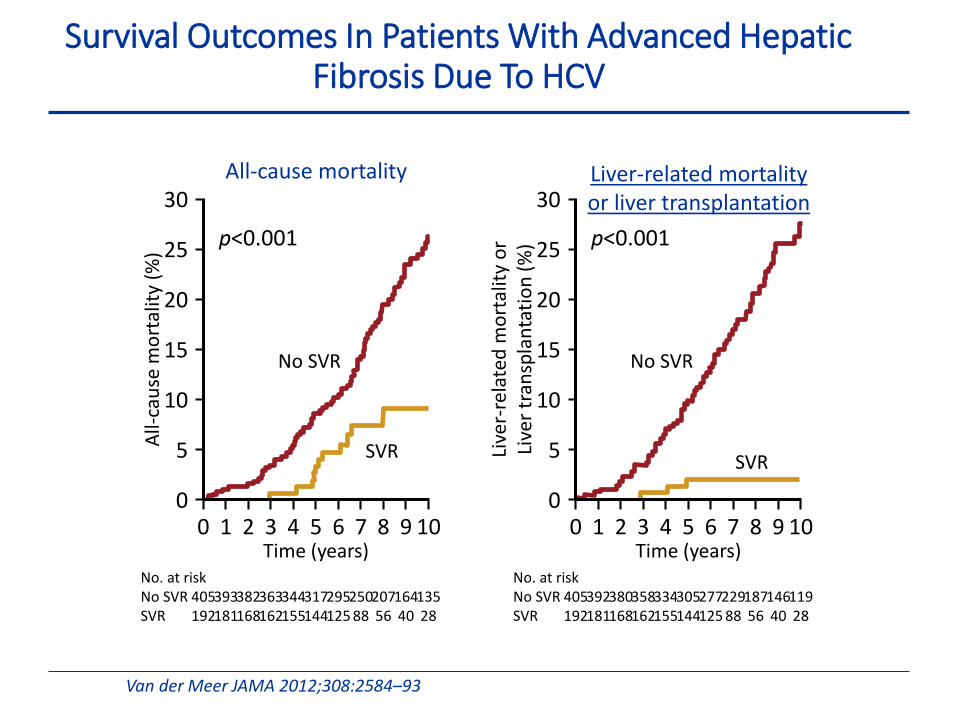
Survival Outcomes In Patients With Advanced Hepatic Fibrosis Due To HCV
Van der Meer JAMA 2012;308:2584–93
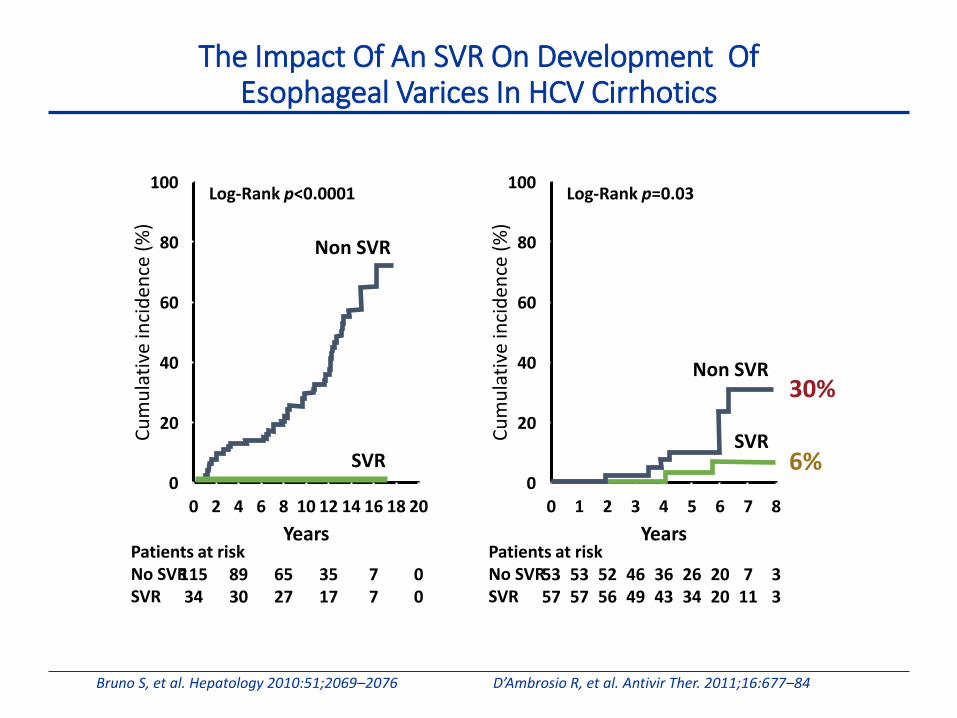
The Impact Of An SVR On Development OfEsophageal Varices In HCV Cirrhotics
Bruno S, et al. Hepatology 2010:51;2069–2076 D’Ambrosio R, et al. Antivir Ther. 2011;16:677–84
Patients at riskNo SVRSVR
00
20
40
60
80
100
2 4 6 8 10 12 14 16 18 20
Years
Cu
mu
lati
ve in
cid
ence
(%
)
Log-Rank p<0.0001
11534
8930
6527
3517
77
00
Patients at riskNo SVRSVR
00
20
40
60
80
100
1 2 3 4 5 6 7 8
Years
Cu
mu
lati
ve in
cid
ence
(%
)
Log-Rank p=0.03
5357
5357
5256
4649
3643
2634
2020
711
33
6%
30%
Non SVR
SVR
Non SVR
SVR
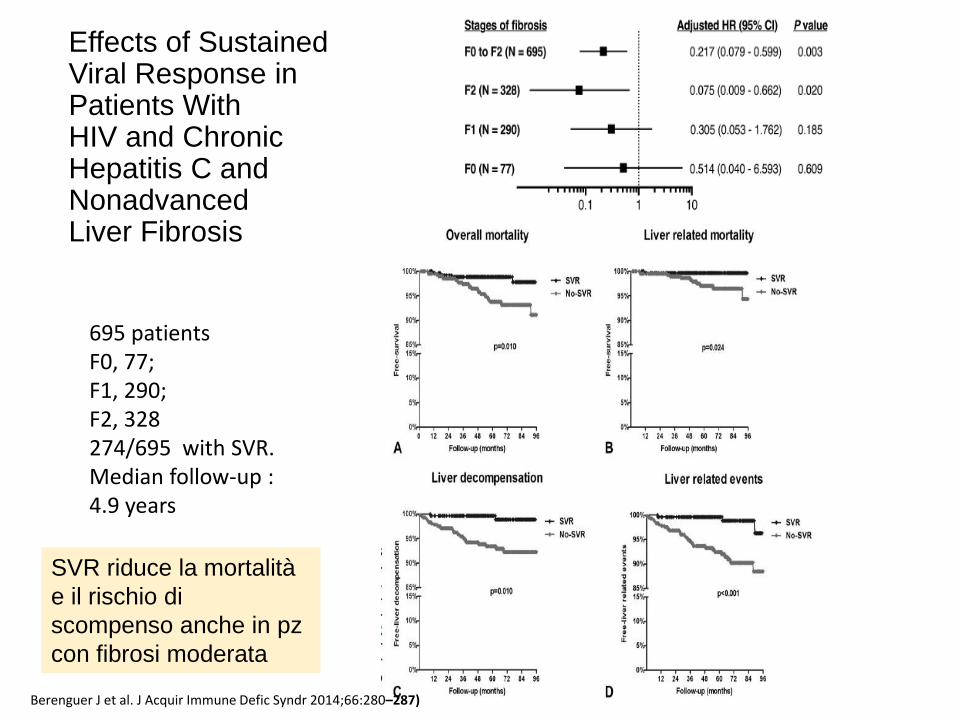
Effects of SustainedViral Response in Patients WithHIV and ChronicHepatitis C and NonadvancedLiver Fibrosis
Berenguer J et al. J Acquir Immune Defic Syndr 2014;66:280–287)
695 patientsF0, 77; F1, 290; F2, 328274/695 with SVR. Median follow-up : 4.9 years
SVR riduce la mortalità
e il rischio di
scompenso anche in pz
con fibrosi moderata
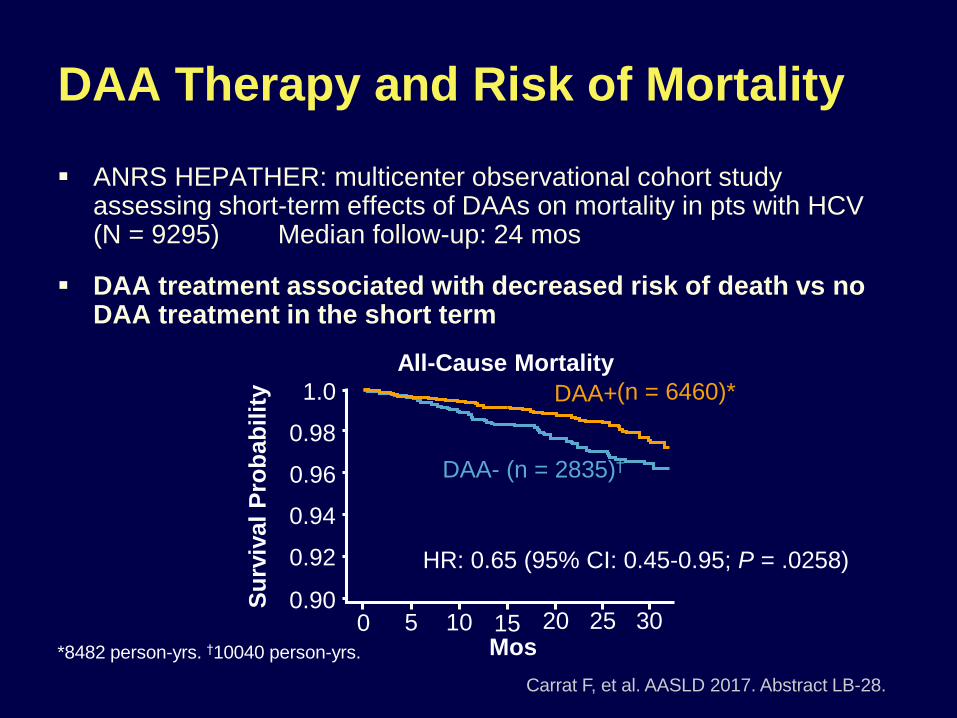
ANRS HEPATHER: multicenter observational cohort study assessing short-term effects of DAAs on mortality in pts with HCV (N = 9295) Median follow-up: 24 mos
DAA treatment associated with decreased risk of death vs no DAA treatment in the short term
DAA Therapy and Risk of Mortality
Carrat F, et al. AASLD 2017. Abstract LB-28.
*8482 person-yrs. †10040 person-yrs.
All-Cause Mortality
(n = 6460)*
DAA- (n = 2835)†
1.0
0.98
0.96
0.94
0.92
0.90Su
rviv
al
Pro
bab
ilit
y
250 5 10 15 20 30Mos
DAA+
HR: 0.65 (95% CI: 0.45-0.95; P = .0258)
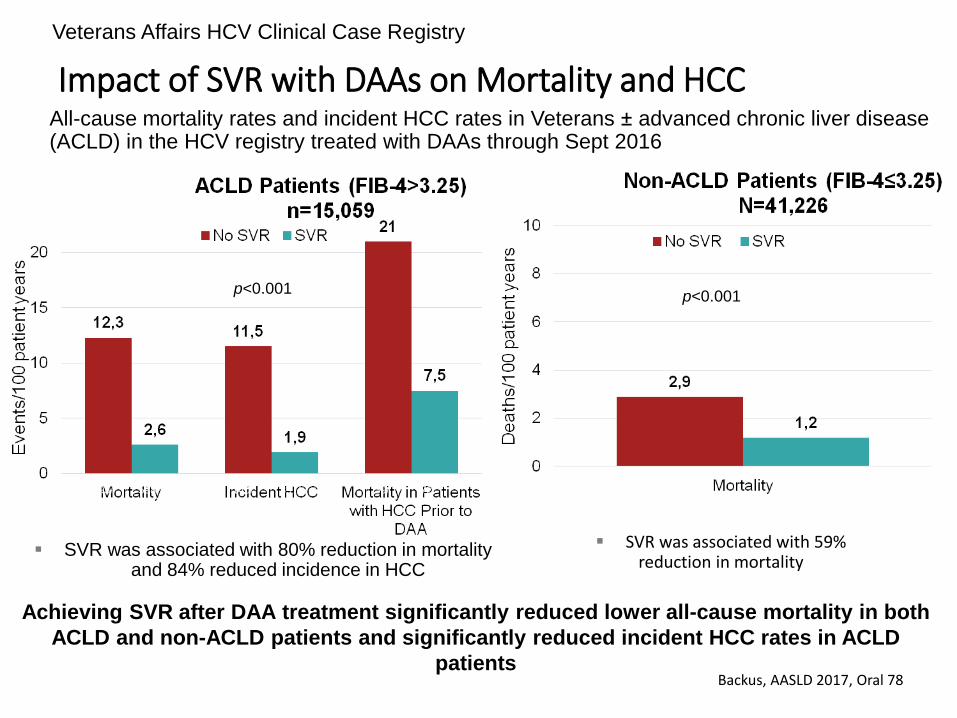
Impact of SVR with DAAs on Mortality and HCC
Backus, AASLD 2017, Oral 78
All-cause mortality rates and incident HCC rates in Veterans ± advanced chronic liver disease (ACLD) in the HCV registry treated with DAAs through Sept 2016
Achieving SVR after DAA treatment significantly reduced lower all-cause mortality in both
ACLD and non-ACLD patients and significantly reduced incident HCC rates in ACLD
patients
p<0.001p<0.001
SVR was associated with 80% reduction in mortality and 84% reduced incidence in HCC
SVR was associated with 59% reduction in mortality
Veterans Affairs HCV Clinical Case Registry
47/1308
644/39,918
39/135
72/597
140/871
397/13,153
195/1067
598/13,992
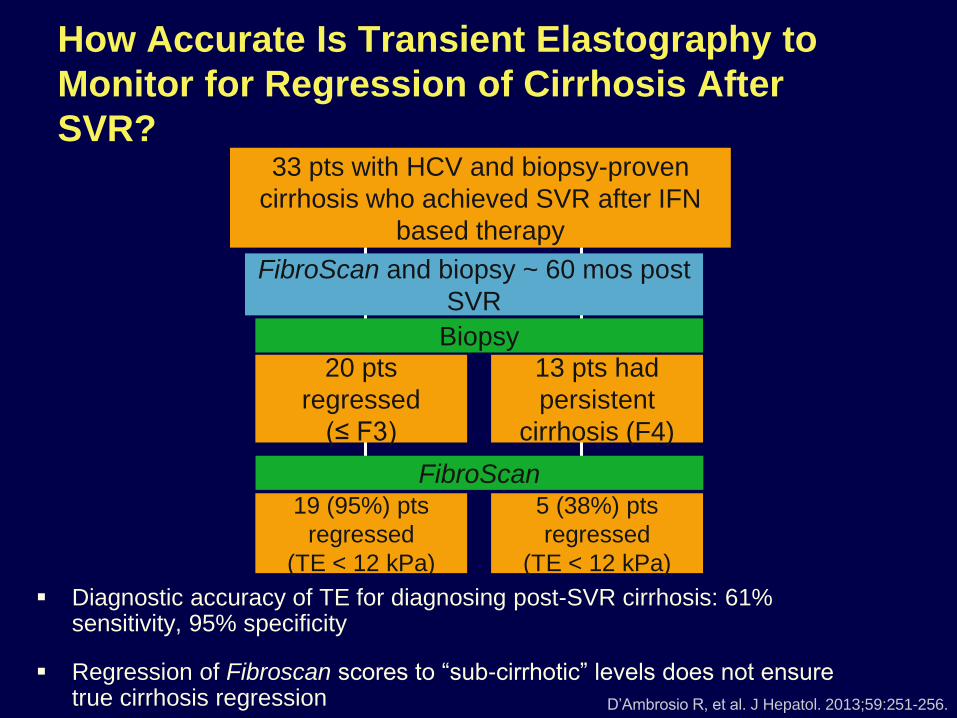
How Accurate Is Transient Elastography to
Monitor for Regression of Cirrhosis After
SVR?
D’Ambrosio R, et al. J Hepatol. 2013;59:251-256.
33 pts with HCV and biopsy-proven
cirrhosis who achieved SVR after IFN
based therapy
5 (38%) pts
regressed
(TE < 12 kPa)
19 (95%) pts
regressed
(TE < 12 kPa)
FibroScan and biopsy ~ 60 mos post
SVR
Biopsy
FibroScan
20 pts
regressed
(≤ F3)
13 pts had
persistent
cirrhosis (F4)
Diagnostic accuracy of TE for diagnosing post-SVR cirrhosis: 61% sensitivity, 95% specificity
Regression of Fibroscan scores to “sub-cirrhotic” levels does not ensure true cirrhosis regression
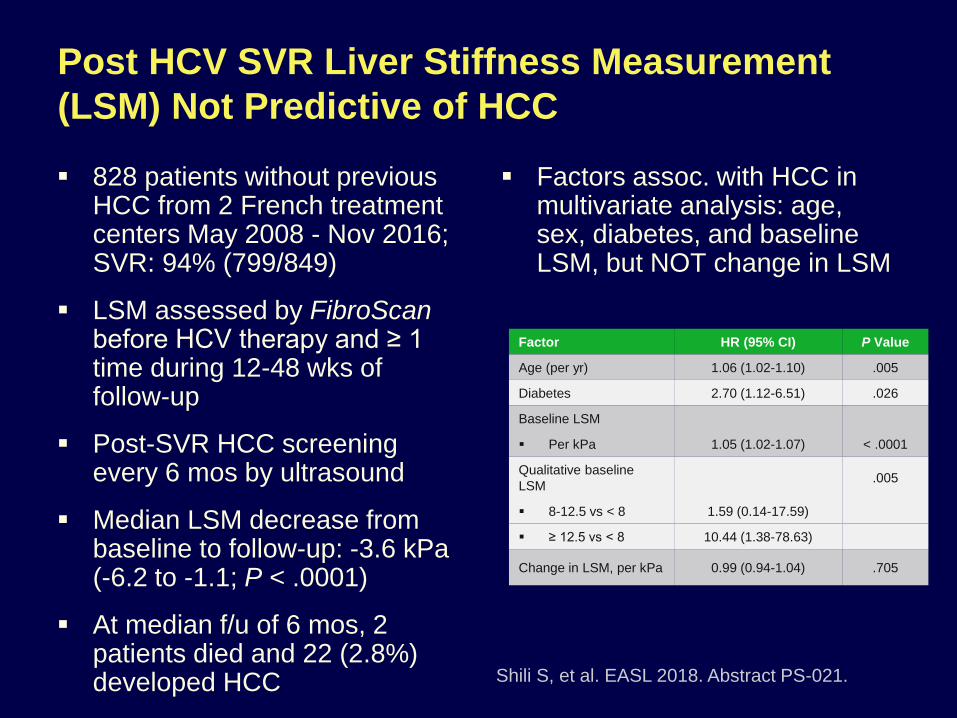
Post HCV SVR Liver Stiffness Measurement
(LSM) Not Predictive of HCC
828 patients without previous HCC from 2 French treatment centers May 2008 - Nov 2016; SVR: 94% (799/849)
LSM assessed by FibroScanbefore HCV therapy and ≥ 1 time during 12-48 wks of follow-up
Post-SVR HCC screening every 6 mos by ultrasound
Median LSM decrease from baseline to follow-up: -3.6 kPa (-6.2 to -1.1; P < .0001)
At median f/u of 6 mos, 2 patients died and 22 (2.8%) developed HCC
Factors assoc. with HCC in multivariate analysis: age, sex, diabetes, and baseline LSM, but NOT change in LSM
Shili S, et al. EASL 2018. Abstract PS-021.
Factor HR (95% CI) P Value
Age (per yr) 1.06 (1.02-1.10) .005
Diabetes 2.70 (1.12-6.51) .026
Baseline LSM
Per kPa 1.05 (1.02-1.07) < .0001
Qualitative baseline
LSM.005
8-12.5 vs < 8 1.59 (0.14-17.59)
≥ 12.5 vs < 8 10.44 (1.38-78.63)
Change in LSM, per kPa 0.99 (0.94-1.04) .705
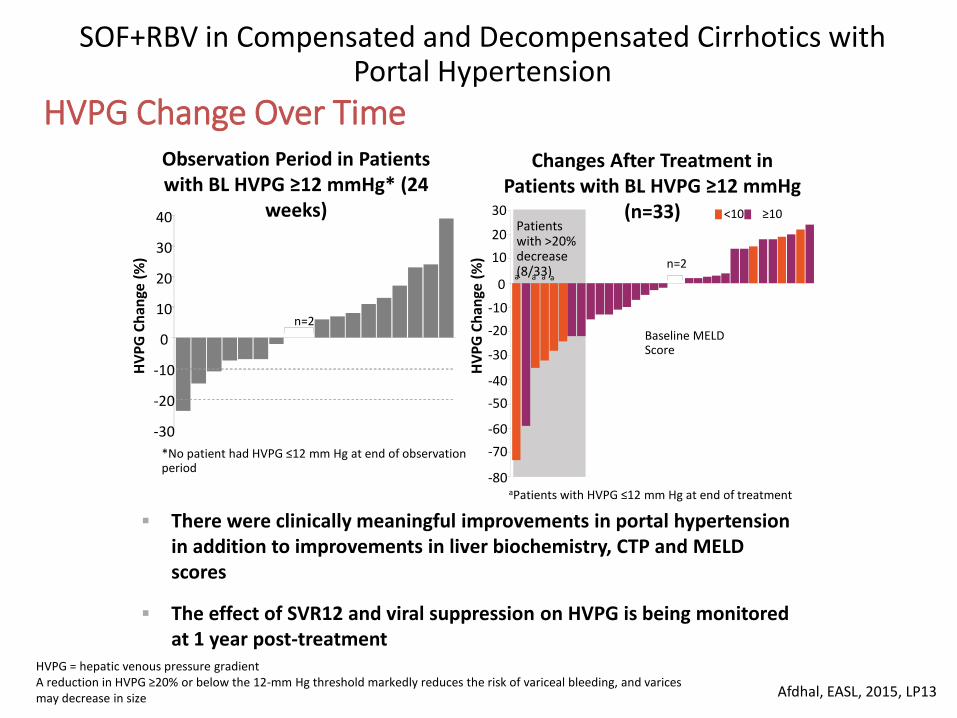
HVPG Change Over Time
Afdhal, EASL, 2015, LP13
There were clinically meaningful improvements in portal hypertension in addition to improvements in liver biochemistry, CTP and MELD scores
The effect of SVR12 and viral suppression on HVPG is being monitored at 1 year post-treatment
Observation Period in Patients with BL HVPG ≥12 mmHg* (24
weeks)
Changes After Treatment in Patients with BL HVPG ≥12 mmHg
(n=33)
SOF+RBV in Compensated and Decompensated Cirrhotics with Portal Hypertension
-30
-20
-10
0
10
20
30
40
n=2
HV
PG
Ch
ange
(%
) n=2a
30
20
10
0
-10
-20
-30
-40
-50
-60
-70
-80H
VP
G C
han
ge (
%)
Patients with >20% decrease (8/33)
Baseline MELD Score
<10 ≥10
aPatients with HVPG ≤12 mm Hg at end of treatment
*No patient had HVPG ≤12 mm Hg at end of observation period
HVPG = hepatic venous pressure gradient A reduction in HVPG ≥20% or below the 12-mm Hg threshold markedly reduces the risk of variceal bleeding, and varicesmay decrease in size
a a a
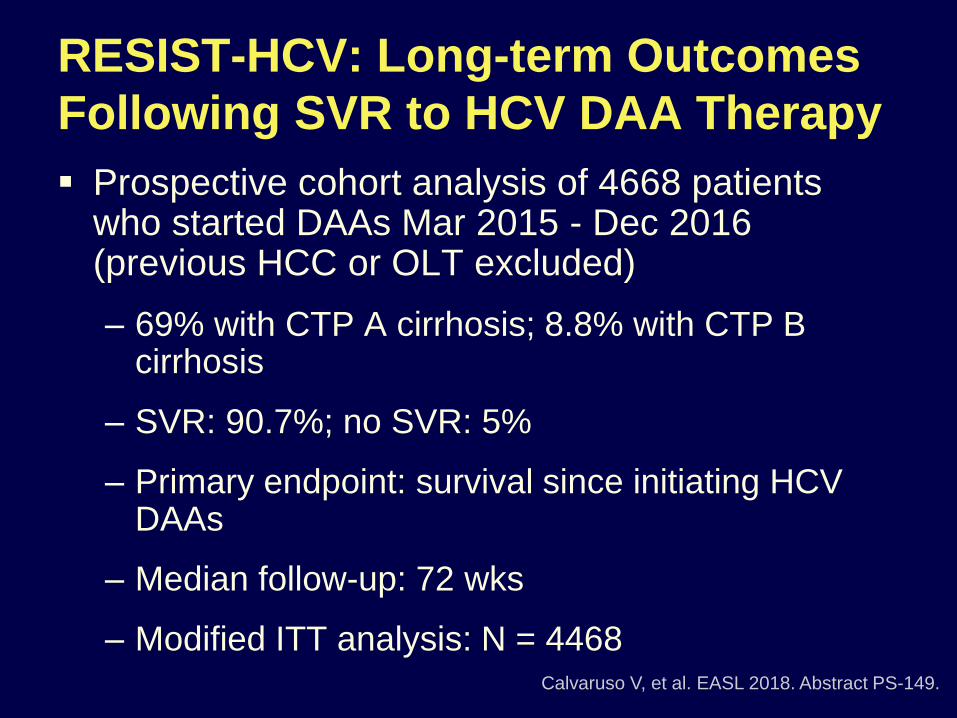
RESIST-HCV: Long-term Outcomes
Following SVR to HCV DAA Therapy
Prospective cohort analysis of 4668 patients who started DAAs Mar 2015 - Dec 2016 (previous HCC or OLT excluded)
– 69% with CTP A cirrhosis; 8.8% with CTP B cirrhosis
– SVR: 90.7%; no SVR: 5%
– Primary endpoint: survival since initiating HCV DAAs
– Median follow-up: 72 wks
– Modified ITT analysis: N = 4468Calvaruso V, et al. EASL 2018. Abstract PS-149.

RESIST-HCV: Predictors of Mortality
in Patients Treated With HCV DAAs
SVR associated with reduced risk of liver-related mortality across disease stages, but benefit lower in CTP B cirrhosis
– Univariate HR for no SVR vs SVR in CTP B: 3.49; P= .036
Multivariate Cox Regression HR (95% CI) P Value
Independent predictors of liver-related mortality in CTP A cirrhosis
No SVR 18.50 (6.75-50.70) < .001
Albumin < 3.5 g/dL 6.01 (2.30-15.73) < .001
Independent predictors of cardiovascular mortality in DAA-treated patients
No SVR 10.56 (3.43-32.46) < .001
Diabetes 4.11 (1.30-12.98) .011
Calvaruso V, et al. EASL 2018. Abstract PS-149.
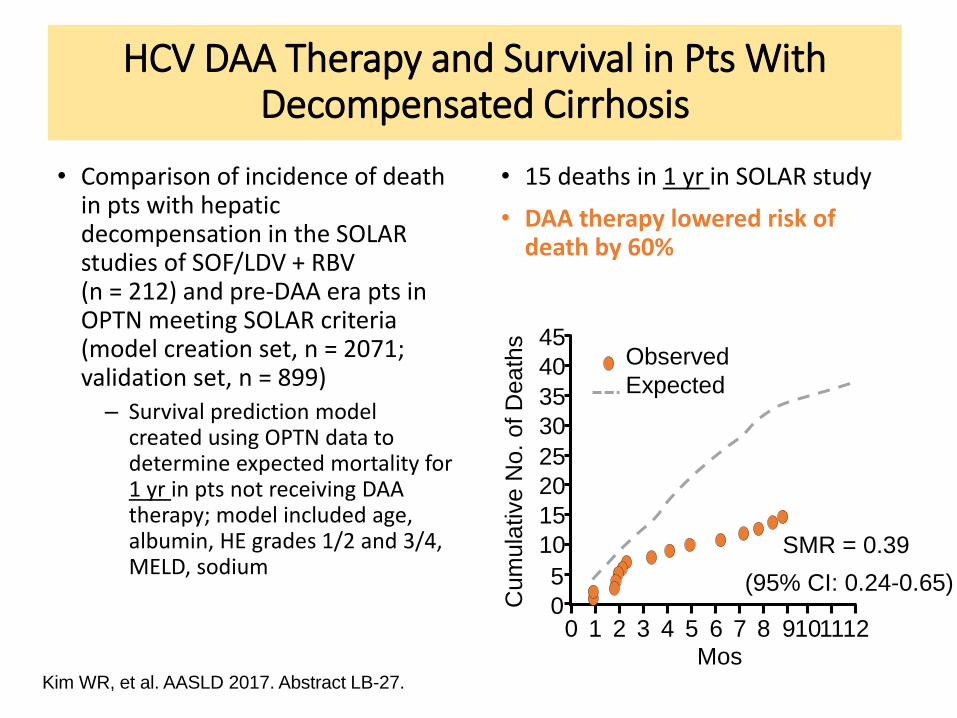
HCV DAA Therapy and Survival in Pts With Decompensated Cirrhosis
• Comparison of incidence of death in pts with hepatic decompensation in the SOLAR studies of SOF/LDV + RBV(n = 212) and pre-DAA era pts in OPTN meeting SOLAR criteria (model creation set, n = 2071; validation set, n = 899)
– Survival prediction model created using OPTN data to determine expected mortality for 1 yr in pts not receiving DAA therapy; model included age, albumin, HE grades 1/2 and 3/4, MELD, sodium
• 15 deaths in 1 yr in SOLAR study
• DAA therapy lowered risk of death by 60%
Kim WR, et al. AASLD 2017. Abstract LB-27.
(95% CI: 0.24-0.65)
45
40
35
30
25
20
15
10
5
0Cum
ula
tive N
o.
of D
eath
s
0 1 2 3 4 5 6 7 8 9101112Mos
SMR = 0.39
Observed
Expected
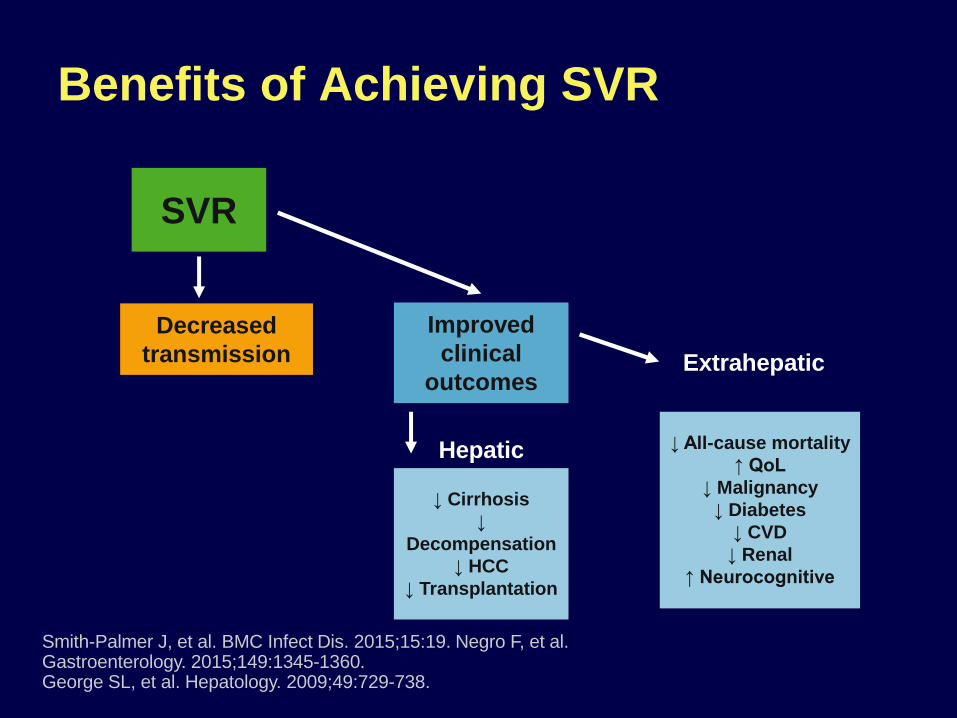
Benefits of Achieving SVR
↓ Cirrhosis
↓
Decompensation
↓ HCC
↓ Transplantation
↓ All-cause mortality
↑ QoL
↓ Malignancy
↓ Diabetes
↓ CVD
↓ Renal
↑ Neurocognitive
SVR
Improved
clinical
outcomes
Hepatic
Extrahepatic
Decreased
transmission
Smith-Palmer J, et al. BMC Infect Dis. 2015;15:19. Negro F, et al. Gastroenterology. 2015;149:1345-1360. George SL, et al. Hepatology. 2009;49:729-738.

…nella speranza di non avervi steso….
GRAZIE PER L’ATTENZIONE!!!!!