CONSIGLIO NAZIONALE RICERCHE ISTITUTO DI SCIENZE DELL’ATMOSFERA ... -...
45
CONSIGLIO NAZIONALE RICERCHE ISTITUTO DI SCIENZE DELL’ATMOSFERA E DEL CLIMA ISTITUTO DI SCIENZE MARINE REPORT ON THE OCEANOGRAPHIC, MORPHOBATHYMETRIC, GEOLOGICAL AND GEOPHYSICAL ACTIVITIES DURING CRUISE ADR0208 (17-28 october 2008, R/V URANIA, ADRICOSM-STAR PROJECT) Francesco Bignami 1 , Bruno Buongiorno Nardelli 1 Giovanni Bortoluzzi 2 , Federico Giglio 2 , Stefano Miserocchi 2 , Mattia Betti 3 , Giuseppe Caccamo 3 Marco Marcelli 4 , Viviana Piermattei 4 , Alice Madonia 4 Vanessa Cardin 5 , Franco Arena 5 , Paolo Mansutti 5 , Zoran Kl ˙ ja ˙ ji´ c 6 , Radomir ˇ Zujovi` c 6 , Alexandar Joviˇ ci´ c 6 Cinzia Pizzi 7 1. CNR, ISAC, Istitute of Atmospheric Sciences and Climate, Roma, Italy 2. CNR, ISMAR, Istitute of Marine Sciences, Bologna, Italy 3. CNR, ISMAR, Istitute of Marine Sciences, Ancona, Italy 4. University of Tuscia, Viterbo, Italy 5. OGS, Trieste, Italy 6. IBMK, Kotor, Montenegro 7. University of Roma 2 ”Tor Vergata”, Italy ISMAR-ISAC-CNR Interim Technical Cruise Report Roma, November 2008
Transcript of CONSIGLIO NAZIONALE RICERCHE ISTITUTO DI SCIENZE DELL’ATMOSFERA ... -...
CONSIGLIO NAZIONALE RICERCHE
ISTITUTO DI SCIENZE DELL’ATMOSFERA E DEL CLIMAISTITUTO DI SCIENZE MARINE
REPORT ON THE OCEANOGRAPHIC,MORPHOBATHYMETRIC, GEOLOGICAL AND GEOPHYSICALACTIVITIES DURING CRUISE ADR0208 (17-28 october 2008, R/V
URANIA, ADRICOSM-STAR PROJECT)
Francesco Bignami 1, Bruno Buongiorno Nardelli 1
Giovanni Bortoluzzi 2, Federico Giglio 2, Stefano Miserocchi 2,Mattia Betti 3, Giuseppe Caccamo 3
Marco Marcelli 4, Viviana Piermattei 4, Alice Madonia 4
Vanessa Cardin 5, Franco Arena5, Paolo Mansutti5,Zoran Kljajic 6, Radomir Zujovic 6, Alexandar Jovicic 6
Cinzia Pizzi 7
1. CNR, ISAC, Istitute of Atmospheric Sciences and Climate, Roma, Italy
2. CNR, ISMAR, Istitute of Marine Sciences, Bologna, Italy
3. CNR, ISMAR, Istitute of Marine Sciences, Ancona, Italy
4. University of Tuscia, Viterbo, Italy
5. OGS, Trieste, Italy
6. IBMK, Kotor, Montenegro
7. University of Roma 2 ”Tor Vergata”, Italy
ISMAR-ISAC-CNR Interim Technical Cruise Report
Roma, November 2008
Many of the designations used by the manufacturers and sellers to promote their products areclaimed as trademarks. Where those designation appear in the Report and authors were awareof a trademark claim the designations have been printed in all caps.In addition, we have reportedsome of them in the Production Notes below in this page and in the ACRONYM table thereinafter.Nothing in this document is meant to imply any endorsement or recommendation,positive or neg-ative, concerning any systems or programs mentioned herein.
The data presented hereafter is the property of the Institutes and of the Project. Unauthorizeduse of the data would be considered unfair.ISMAR-CNR Cataloging-In-Publication data: ISMAR-ISAC-CNR Interim Technical Cruise Re-port
REPORT ON THE OCEANOGRAPHIC, MORPHOBATHYMETRIC, GEOLOGICAL AND GEO-PHYSICAL ACTIVITIES DURING CRUISE ADR0208 (R/V R/V Urania , ADRICOSM-STARPROJECT) , by
F. Bignami, B.Buongiorno Nardelli, G.Bortoluzzi, Federico Giglio, Stefano Miserocchi, MattiaBetti, Giuseppe Caccamo, Marco Marcelli, Viviana Piermattei, Alice Madonia, Vanessa Cardin,Franco Arena, Paolo Mansutti, Zoran Kljajic, Radomir Zujovic, Alexandar Jovicic, C.Pizzi
Includes bibliographical reference and index.
Keywords 1. 2. 3. 4. 5.Abstract - We present the shipboard activities and results of Cruise ADR0208 on R/V Urania (17-28 october 2008) on Southern Adriatic Sea. Oceanographical, geological and geophysical works wereperformed on italian, montenegrinian and albanian margins, other than in the central basin. Thecruise was scheduled to (a) acquire classic hydrological and bio-geochemical data and hyperspectralradiation profiles on the water column, (b) initiate the systematic mapping of the montenegrinianand albanian shelf areas by Multibeam and CHIRP SBP, and (c) recover, service and redeployan instrumented mooring in the center of the South Adriatic Sea. Most of the proposed workhave been performed, and some results are presented hereinafter, alongwith tecnical details onprocedures and instrumentation.Sommario - Vengono presentate le attivita’ ed i risultati preliminari della crociera ADR0208 conR/V Urania , (17-28 ottobre 2008) in Adriatico Meridionale. La campagna era stata progettataper (a) la raccolta di dati oceanografici, biogeochimici e di profili di radiazione iperspettrali nellacolonna d’acqua, (b) l’inizio di rilievi sistematici di batimetria e sottofondo con ’multibeam’ eCHIRP, e (c) recuperare e reinstallare una catena strumentale profonda. La quasi totalita’ dellavoro previsto e’ stato effettuato, e di seguito vengono presentati alcuni dei risultati ottenuti,assieme alle metodologie e alle strumentazioni impiegate.
Published in the WWW at projects.bo.ismar.cnr.it/CRUISE REPORTS. Available in the PDFand in other formats upon request. We apologize for any problems due in the conversion to HTML.The PDF version is considered the verbatimcopy of the document.Copyright © 2008 by ISAC-ISMAR CNR, Italy.Production Notes - The document was edited with standard text editors, typeset with L.Lamport’sLATEX, converted to HTML by N.Drakos’s LATEX2HTML and to PDF by Alladin Ghostscripts’sps2pdf. Most of the maps included were produced by Wessel and Smith’s GMT package. Somedrawings were produced by xfig (www.xfig.org). Non PostScript images were converted by JohnBradley’s xv or other public-domain packages, among them convert.
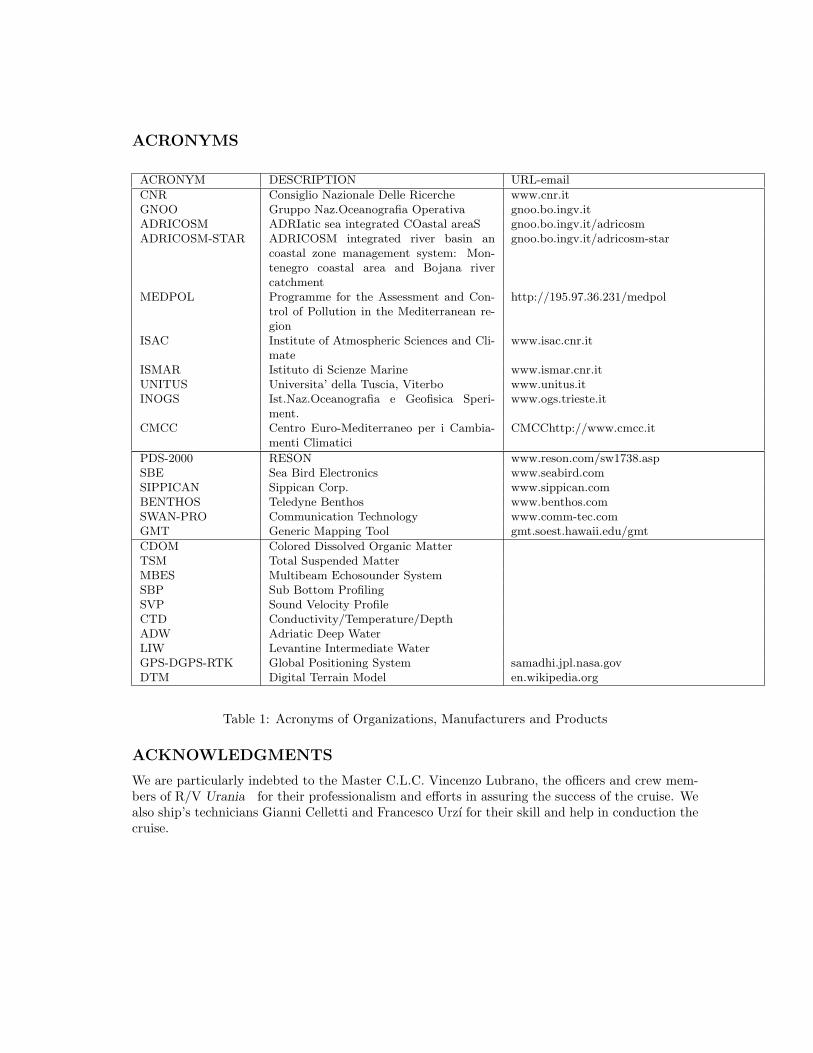
ACRONYMS
ACRONYM DESCRIPTION URL-email
CNR Consiglio Nazionale Delle Ricerche www.cnr.itGNOO Gruppo Naz.Oceanografia Operativa gnoo.bo.ingv.itADRICOSM ADRIatic sea integrated COastal areaS gnoo.bo.ingv.it/adricosmADRICOSM-STAR ADRICOSM integrated river basin an
coastal zone management system: Mon-tenegro coastal area and Bojana rivercatchment
gnoo.bo.ingv.it/adricosm-star
MEDPOL Programme for the Assessment and Con-trol of Pollution in the Mediterranean re-gion
http://195.97.36.231/medpol
ISAC Institute of Atmospheric Sciences and Cli-mate
www.isac.cnr.it
ISMAR Istituto di Scienze Marine www.ismar.cnr.itUNITUS Universita’ della Tuscia, Viterbo www.unitus.itINOGS Ist.Naz.Oceanografia e Geofisica Speri-
ment.www.ogs.trieste.it
CMCC Centro Euro-Mediterraneo per i Cambia-menti Climatici
CMCChttp://www.cmcc.it
PDS-2000 RESON www.reson.com/sw1738.aspSBE Sea Bird Electronics www.seabird.comSIPPICAN Sippican Corp. www.sippican.comBENTHOS Teledyne Benthos www.benthos.comSWAN-PRO Communication Technology www.comm-tec.comGMT Generic Mapping Tool gmt.soest.hawaii.edu/gmt
CDOM Colored Dissolved Organic MatterTSM Total Suspended MatterMBES Multibeam Echosounder SystemSBP Sub Bottom ProfilingSVP Sound Velocity ProfileCTD Conductivity/Temperature/DepthADW Adriatic Deep WaterLIW Levantine Intermediate WaterGPS-DGPS-RTK Global Positioning System samadhi.jpl.nasa.govDTM Digital Terrain Model en.wikipedia.org
Table 1: Acronyms of Organizations, Manufacturers and Products
ACKNOWLEDGMENTS
We are particularly indebted to the Master C.L.C. Vincenzo Lubrano, the officers and crew mem-bers of R/V Urania for their professionalism and efforts in assuring the success of the cruise. Wealso ship’s technicians Gianni Celletti and Francesco Urzı for their skill and help in conduction thecruise.
Contents
1 INTRODUCTION 11.1 Geological and Oceanographical Setting . . . . . . . . . . . . . . . . . . . . . . . . 3
2 CRUISE SUMMARY 5
3 MATERIALS AND METHODS 83.1 NAVIGATION, SWATH BATHYMETRY, CHIRP SBP DATA ACQUISITION . . 93.2 OVERVIEW OF OCEANOGRAPHICAL SAMPLING STRATEGY, SAMPLE TREAT-
MENT AND ONBOARD ANALYSIS . . . . . . . . . . . . . . . . . . . . . . . . . 103.1 CTD CASTS AND WATER SAMPLING . . . . . . . . . . . . . . . . . . . 10
3.3 BOTTOM SAMPLING . . . . . . . . . . . . . . . . . . . . . . . . . . . . . . . . . 133.4 DATA PROCESSING SEQUENCES . . . . . . . . . . . . . . . . . . . . . . . . . . 133.5 MAPPING AND MISCELLANEOUS . . . . . . . . . . . . . . . . . . . . . . . . . 15
4 INITIAL RESULTS 164.1 OCEANOGRAPHICAL PROFILING . . . . . . . . . . . . . . . . . . . . . . . . . 16
4.1 SATELLITE IMAGERY . . . . . . . . . . . . . . . . . . . . . . . . . . . . . 164.2 CTD . . . . . . . . . . . . . . . . . . . . . . . . . . . . . . . . . . . . . . . . 164.3 T-FLAP . . . . . . . . . . . . . . . . . . . . . . . . . . . . . . . . . . . . . . 19
4.2 MOORING MAINTENANCE AND REDEPLOYMENT . . . . . . . . . . . . . . . 194.3 SWATH BATHYMETRY, CHIRP PROFILING AND BOTTOM SAMPLING . . 23
5 CONCLUSIONS 31
6 APPENDIX 336.1 DIARY OF OPERATIONS . . . . . . . . . . . . . . . . . . . . . . . . . . . . . . . 33
List of Figures
1 Geological setting of Montenegro-Albania. . . . . . . . . . . . . . . . . . . . . . . . 42 Ship tracks during cruise ADR0208 in the Southern Adriatic Sea . . . . . . . . . . 53 Ship tracks during cruise ADR0208 in the Montenegro Area . . . . . . . . . . . . . 64 Ship tracks during cruise ADR0208 in the Albania-Montenegro Area . . . . . . . . 75 R/V Urania . . . . . . . . . . . . . . . . . . . . . . . . . . . . . . . . . . . . . . . . 86 Cruise ADR0208. Instrumental Offsets (PDS-2000) on R/V Urania . . . . . . . . 97 Surface chlorophyll field, remotely sensed by MODIS AQUA. . . . . . . . . . . . . 168 Cruise ADR0208. CTD data. . . . . . . . . . . . . . . . . . . . . . . . . . . . . . . 179 Cruise ADR0208. CTD data, transect ADRICOSM 2. From top to bottom: O2,
transmissometer, temperature, salinity. . . . . . . . . . . . . . . . . . . . . . . . . . 1810 Cruise ADR0208. Calibrated Temperature profile of T-FLAP 625. . . . . . . . . . 1911 Mooring VAM1. . . . . . . . . . . . . . . . . . . . . . . . . . . . . . . . . . . . . . . 2012 Mooring VAM1 recovery 2008-10-18. Work done. . . . . . . . . . . . . . . . . . . . 2113 Mooring redeployment 2008-10-25. Work done. . . . . . . . . . . . . . . . . . . . . 2214 Bays of Kotor and Risan. . . . . . . . . . . . . . . . . . . . . . . . . . . . . . . . . 2415 Bay of Kotor, CHIRP image of karstic depressions. . . . . . . . . . . . . . . . . . . 2516 Verige Strais, CHIRP images. . . . . . . . . . . . . . . . . . . . . . . . . . . . . . . 2517 Tivat Bay, CHIRP images. . . . . . . . . . . . . . . . . . . . . . . . . . . . . . . . . 2618 Herzeg-Novi Bay, CHIRP images. . . . . . . . . . . . . . . . . . . . . . . . . . . . . 2619 Outcrops, northern montenegrinian offshore. . . . . . . . . . . . . . . . . . . . . . . 2720 Bar offshore area. . . . . . . . . . . . . . . . . . . . . . . . . . . . . . . . . . . . . . 2721 Southern Montenegrinian shelf, gassy sediments. . . . . . . . . . . . . . . . . . . . 2822 Hard coustic basament draped by holocene sediments, Cape Rodonit, Albania. . . 2823 Compressions, Albanian offshore. . . . . . . . . . . . . . . . . . . . . . . . . . . . . 2924 Compressions, montenegrinian offshore. . . . . . . . . . . . . . . . . . . . . . . . . 2925 Chaotic, gassy sediments, albanian-montenegrinian offshore. . . . . . . . . . . . . . 30
List of Tables
1 Acronyms of Organizations, Manufacturers and Products . . . . . . . . . . . . . . i2 Scientific and technical parties . . . . . . . . . . . . . . . . . . . . . . . . . . . . . 83 Instrumental Offsets of Cruise ADR02 08 R/V Urania . . . . . . . . . . . . . . . . 94 Oceanographic instrumentation on Cruise ADR02 08 . . . . . . . . . . . . . . . . . 115 CTD data from SBE files (asciiout program). . . . . . . . . . . . . . . . . . . . . . 116 T-FLAP launches during Cruise ADR02 08 R/V Urania .along Dubrovnik-Bari tran-
sect. . . . . . . . . . . . . . . . . . . . . . . . . . . . . . . . . . . . . . . . . . . . . 137 Grab Stations positions. Lat/lon data expressed as DDMM.xxxx. Time is UTC.
POS=TRUE, position true on bottom, POS=DGPS, position on DGPS, with heading. 138 Deployment navigation data 2008-10-25. Range measurements and angle reduced
to 1176m (14m Acoustic Release above sea bottom at 1204m, 14m draught of trans-ducer, positioned on point A-Frame ,see 3). Lat/lon data expressed as DDMM.xxxx.Time is UTC. . . . . . . . . . . . . . . . . . . . . . . . . . . . . . . . . . . . . . . 23
1
1 INTRODUCTION
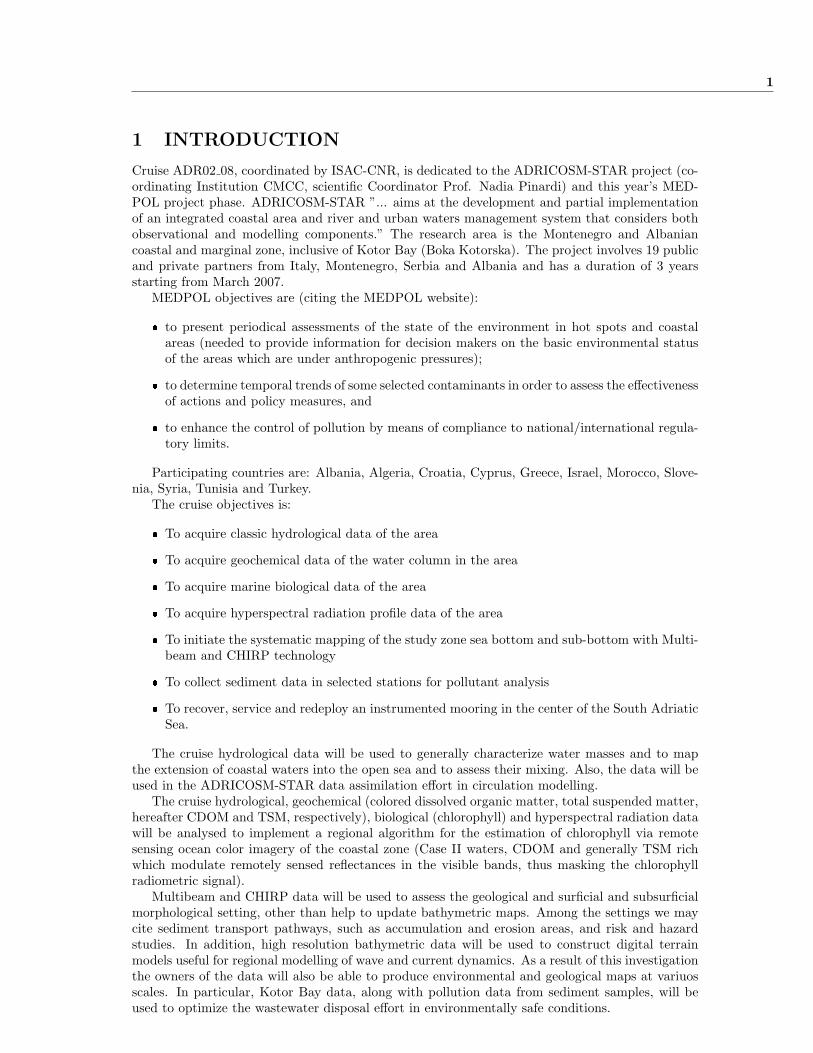
Cruise ADR02 08, coordinated by ISAC-CNR, is dedicated to the ADRICOSM-STAR project (co-ordinating Institution CMCC, scientific Coordinator Prof. Nadia Pinardi) and this year’s MED-POL project phase. ADRICOSM-STAR ”... aims at the development and partial implementationof an integrated coastal area and river and urban waters management system that considers bothobservational and modelling components.” The research area is the Montenegro and Albaniancoastal and marginal zone, inclusive of Kotor Bay (Boka Kotorska). The project involves 19 publicand private partners from Italy, Montenegro, Serbia and Albania and has a duration of 3 yearsstarting from March 2007.
MEDPOL objectives are (citing the MEDPOL website):
� to present periodical assessments of the state of the environment in hot spots and coastalareas (needed to provide information for decision makers on the basic environmental statusof the areas which are under anthropogenic pressures);
� to determine temporal trends of some selected contaminants in order to assess the effectivenessof actions and policy measures, and
� to enhance the control of pollution by means of compliance to national/international regula-tory limits.
Participating countries are: Albania, Algeria, Croatia, Cyprus, Greece, Israel, Morocco, Slove-nia, Syria, Tunisia and Turkey.
The cruise objectives is:
� To acquire classic hydrological data of the area
� To acquire geochemical data of the water column in the area
� To acquire marine biological data of the area
� To acquire hyperspectral radiation profile data of the area
� To initiate the systematic mapping of the study zone sea bottom and sub-bottom with Multi-beam and CHIRP technology
� To collect sediment data in selected stations for pollutant analysis
� To recover, service and redeploy an instrumented mooring in the center of the South AdriaticSea.
The cruise hydrological data will be used to generally characterize water masses and to mapthe extension of coastal waters into the open sea and to assess their mixing. Also, the data will beused in the ADRICOSM-STAR data assimilation effort in circulation modelling.
The cruise hydrological, geochemical (colored dissolved organic matter, total suspended matter,hereafter CDOM and TSM, respectively), biological (chlorophyll) and hyperspectral radiation datawill be analysed to implement a regional algorithm for the estimation of chlorophyll via remotesensing ocean color imagery of the coastal zone (Case II waters, CDOM and generally TSM richwhich modulate remotely sensed reflectances in the visible bands, thus masking the chlorophyllradiometric signal).
Multibeam and CHIRP data will be used to assess the geological and surficial and subsurficialmorphological setting, other than help to update bathymetric maps. Among the settings we maycite sediment transport pathways, such as accumulation and erosion areas, and risk and hazardstudies. In addition, high resolution bathymetric data will be used to construct digital terrainmodels useful for regional modelling of wave and current dynamics. As a result of this investigationthe owners of the data will also be able to produce environmental and geological maps at variuosscales. In particular, Kotor Bay data, along with pollution data from sediment samples, will beused to optimize the wastewater disposal effort in environmentally safe conditions.
Author F.Bignami et al.ISMAR-ISAC-CNR Interim Technical Cruise Report
2
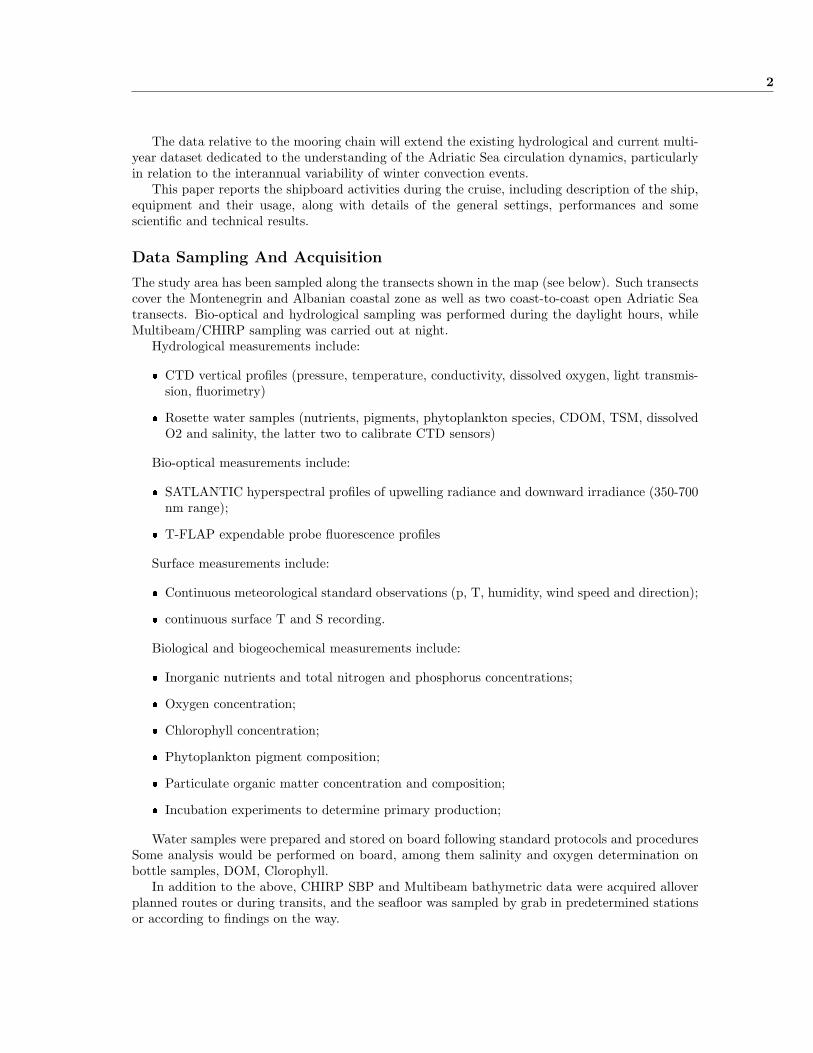
The data relative to the mooring chain will extend the existing hydrological and current multi-year dataset dedicated to the understanding of the Adriatic Sea circulation dynamics, particularlyin relation to the interannual variability of winter convection events.
This paper reports the shipboard activities during the cruise, including description of the ship,equipment and their usage, along with details of the general settings, performances and somescientific and technical results.
Data Sampling And Acquisition
The study area has been sampled along the transects shown in the map (see below). Such transectscover the Montenegrin and Albanian coastal zone as well as two coast-to-coast open Adriatic Seatransects. Bio-optical and hydrological sampling was performed during the daylight hours, whileMultibeam/CHIRP sampling was carried out at night.
Hydrological measurements include:
� CTD vertical profiles (pressure, temperature, conductivity, dissolved oxygen, light transmis-sion, fluorimetry)
� Rosette water samples (nutrients, pigments, phytoplankton species, CDOM, TSM, dissolvedO2 and salinity, the latter two to calibrate CTD sensors)
Bio-optical measurements include:
� SATLANTIC hyperspectral profiles of upwelling radiance and downward irradiance (350-700nm range);
� T-FLAP expendable probe fluorescence profiles
Surface measurements include:
� Continuous meteorological standard observations (p, T, humidity, wind speed and direction);
� continuous surface T and S recording.
Biological and biogeochemical measurements include:
� Inorganic nutrients and total nitrogen and phosphorus concentrations;
� Oxygen concentration;
� Chlorophyll concentration;
� Phytoplankton pigment composition;
� Particulate organic matter concentration and composition;
� Incubation experiments to determine primary production;
Water samples were prepared and stored on board following standard protocols and proceduresSome analysis would be performed on board, among them salinity and oxygen determination onbottle samples, DOM, Clorophyll.
In addition to the above, CHIRP SBP and Multibeam bathymetric data were acquired alloverplanned routes or during transits, and the seafloor was sampled by grab in predetermined stationsor according to findings on the way.
Author F.Bignami et al.ISMAR-ISAC-CNR Interim Technical Cruise Report
3
1.1 Geological and Oceanographical Setting
Geological setting
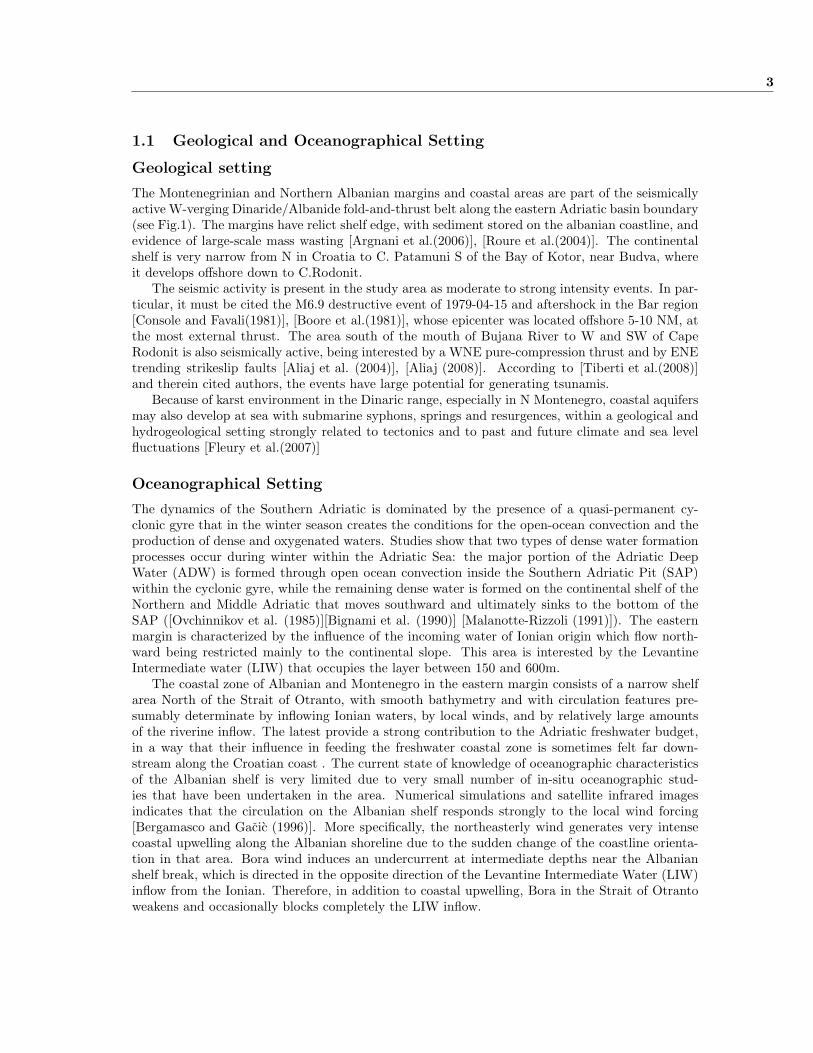
The Montenegrinian and Northern Albanian margins and coastal areas are part of the seismicallyactive W-verging Dinaride/Albanide fold-and-thrust belt along the eastern Adriatic basin boundary(see Fig.1). The margins have relict shelf edge, with sediment stored on the albanian coastline, andevidence of large-scale mass wasting [Argnani et al.(2006)], [Roure et al.(2004)]. The continentalshelf is very narrow from N in Croatia to C. Patamuni S of the Bay of Kotor, near Budva, whereit develops offshore down to C.Rodonit.
The seismic activity is present in the study area as moderate to strong intensity events. In par-ticular, it must be cited the M6.9 destructive event of 1979-04-15 and aftershock in the Bar region[Console and Favali(1981)], [Boore et al.(1981)], whose epicenter was located offshore 5-10 NM, atthe most external thrust. The area south of the mouth of Bujana River to W and SW of CapeRodonit is also seismically active, being interested by a WNE pure-compression thrust and by ENEtrending strikeslip faults [Aliaj et al. (2004)], [Aliaj (2008)]. According to [Tiberti et al.(2008)]and therein cited authors, the events have large potential for generating tsunamis.
Because of karst environment in the Dinaric range, especially in N Montenegro, coastal aquifersmay also develop at sea with submarine syphons, springs and resurgences, within a geological andhydrogeological setting strongly related to tectonics and to past and future climate and sea levelfluctuations [Fleury et al.(2007)]
Oceanographical Setting
The dynamics of the Southern Adriatic is dominated by the presence of a quasi-permanent cy-clonic gyre that in the winter season creates the conditions for the open-ocean convection and theproduction of dense and oxygenated waters. Studies show that two types of dense water formationprocesses occur during winter within the Adriatic Sea: the major portion of the Adriatic DeepWater (ADW) is formed through open ocean convection inside the Southern Adriatic Pit (SAP)within the cyclonic gyre, while the remaining dense water is formed on the continental shelf of theNorthern and Middle Adriatic that moves southward and ultimately sinks to the bottom of theSAP ([Ovchinnikov et al. (1985)][Bignami et al. (1990)] [Malanotte-Rizzoli (1991)]). The easternmargin is characterized by the influence of the incoming water of Ionian origin which flow north-ward being restricted mainly to the continental slope. This area is interested by the LevantineIntermediate water (LIW) that occupies the layer between 150 and 600m.
The coastal zone of Albanian and Montenegro in the eastern margin consists of a narrow shelfarea North of the Strait of Otranto, with smooth bathymetry and with circulation features pre-sumably determinate by inflowing Ionian waters, by local winds, and by relatively large amountsof the riverine inflow. The latest provide a strong contribution to the Adriatic freshwater budget,in a way that their influence in feeding the freshwater coastal zone is sometimes felt far down-stream along the Croatian coast . The current state of knowledge of oceanographic characteristicsof the Albanian shelf is very limited due to very small number of in-situ oceanographic stud-ies that have been undertaken in the area. Numerical simulations and satellite infrared imagesindicates that the circulation on the Albanian shelf responds strongly to the local wind forcing[Bergamasco and Gacic (1996)]. More specifically, the northeasterly wind generates very intensecoastal upwelling along the Albanian shoreline due to the sudden change of the coastline orienta-tion in that area. Bora wind induces an undercurrent at intermediate depths near the Albanianshelf break, which is directed in the opposite direction of the Levantine Intermediate Water (LIW)inflow from the Ionian. Therefore, in addition to coastal upwelling, Bora in the Strait of Otrantoweakens and occasionally blocks completely the LIW inflow.
Author F.Bignami et al.ISMAR-ISAC-CNR Interim Technical Cruise Report
4
18˚30' 19˚00' 19˚30'41˚00'
41˚30'
42˚00'
42˚30'
−1000
−500
−500
Bar
C.Rodonit
Kotor
Risan
TivatHerceg Novi
Budva
C.Ostra
C.Platamuni
Scutari Lake
Bojana R.
Dures
ALBANIA
MONTENEGRO
CROATIA
Figure 1: Geological setting of Montenegro-Albania. Structural lineaments, left and rigth fronts,strike-slip transform fault from [Aliaj et al. (2004)] and [Aliaj (2008)]. Centroid moment tensorsolutions by [Pondrelli et al.(2006)]. Bathymetry by GEBCO.
Author F.Bignami et al.ISMAR-ISAC-CNR Interim Technical Cruise Report
5
2 CRUISE SUMMARY
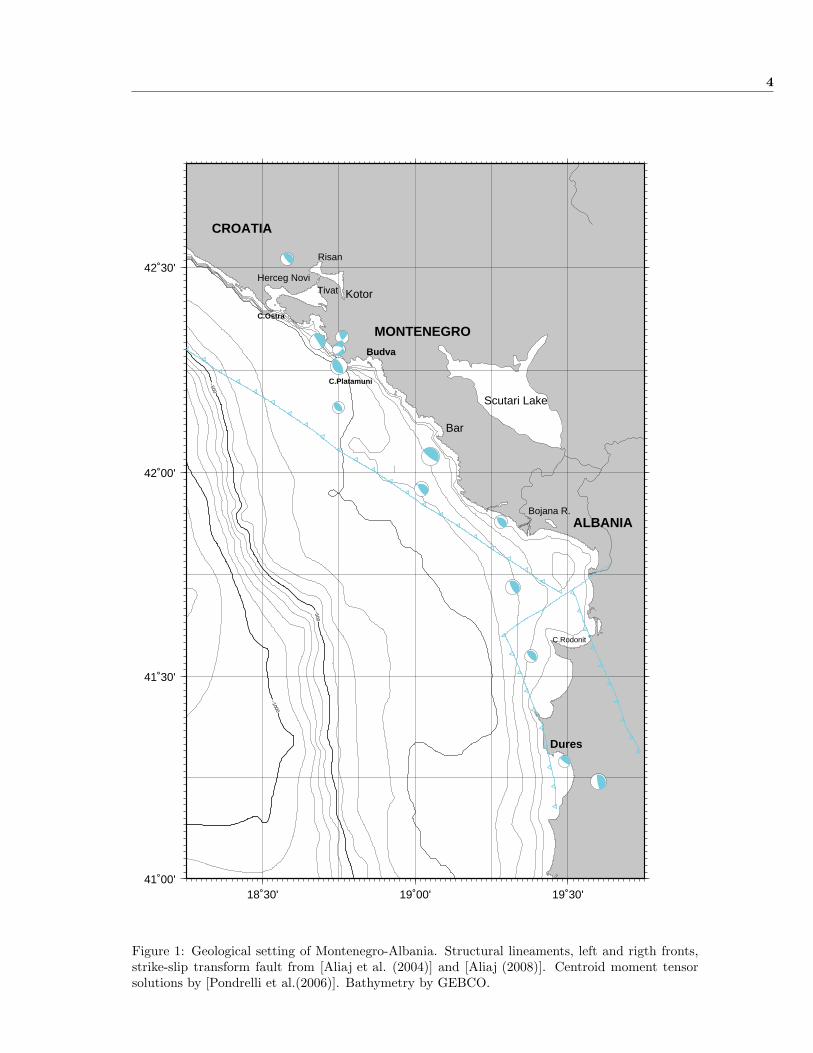
SHIP: R/V UraniaSTART: 2008-10-17 PORT: BariEND: 2008-10-29 PORT: BariSEA/OCEAN: Southern Adriatic Sea, Mediterranean SeaLIMITS: NORTH 43 SOUTH: 40:30 WEST: 17:00 EAST: 19:00OBJECTIVE: HYDROGRAHIC AND GEOLOGICAL SURVEYCOORDINATING BODIES: ISAC-CNRCHIEF OF EXPEDITION: Dr. Francesco BignamiCONTACT: [email protected]: PHYSICAL AND BIO-GEOCHEMICAL OCEANOGRAPHY, SWATH BATHYMETRY,GEOPHYSICSWORK DONE: 77 WATER SAMPLING AND CTD STATIONS, 7 FLAP-XBT LAUNCHES, 26Hyperspectral Profiles11 GRABS, 2600 KM SBP, about 200 KM2 Of SWATH MULTIBEAM.
LOCALIZATION:
17˚ 18˚ 19˚ 20˚
41˚
42˚
−1000
−100
0
−1000
−1000
17˚ 18˚ 19˚ 20˚
41˚
42˚
Figure 2: Whole ship track during Cruise ADR0208 in the Southern Adriatic Sea. Blue circles areCTD stations. Red squares are Grab Stations.
Author F.Bignami et al.ISMAR-ISAC-CNR Interim Technical Cruise Report
6
18˚30' 19˚00'
42˚00'
42˚30'
C006
C007
C008
C011
C016
C017
C018C019
C025
C026
C027
C028
C029
C030
C031
C032
C033
C034
C035
C036
C037
C038
C039
C040
C041
C042
C043
C044C045
C046C047
C048
C049
C050
C051
C052
C053
Cadr_069
C070
−500
18˚30' 19˚00'
42˚00'
42˚30'
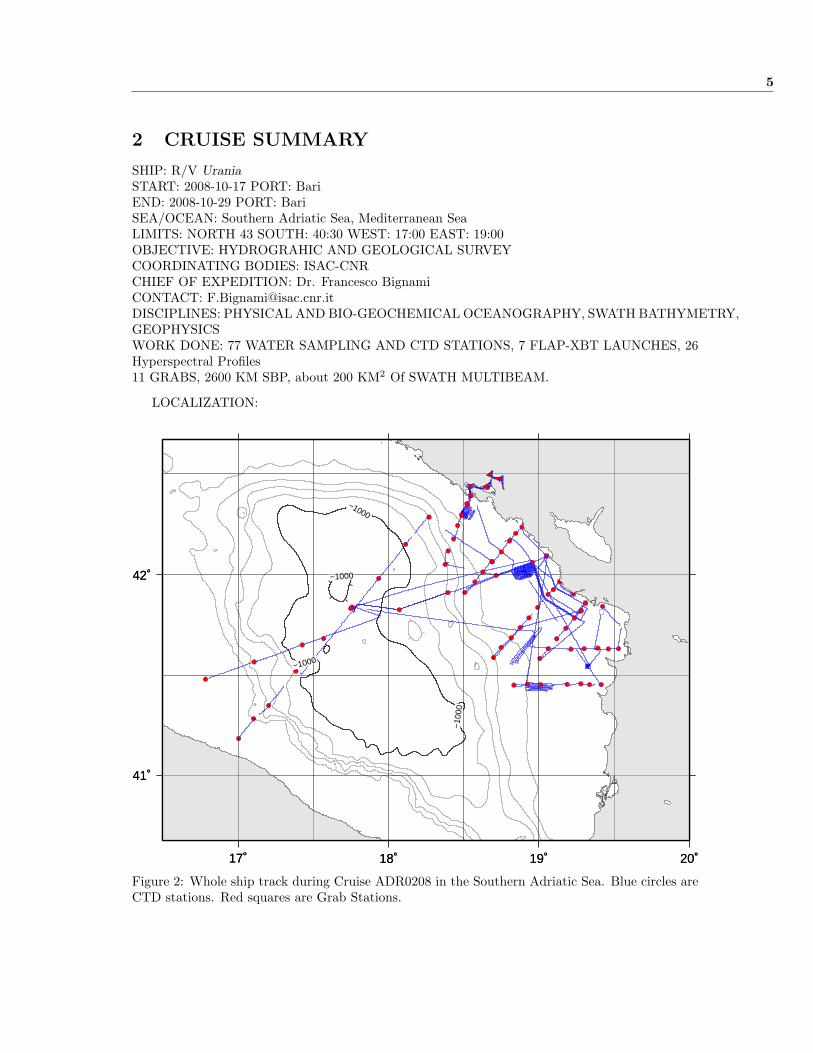
Figure 3: Whole ship track during Cruise ADR0208 in the Montenegro Area. Blue circles are CTDstations. Red squares are Grab Stations.
Author F.Bignami et al.ISMAR-ISAC-CNR Interim Technical Cruise Report
7
18˚30' 19˚00' 19˚30'
41˚30'
42˚00' C007
C008
C009
C010
C011
C012
C013
C014
C015
C016
C017
C018C019
C019
C021
C022
C023
C024
C025
C026
C027C031
C032
C033
C034
C035
C054C055C056C057C059C060C061
C063 C064 C065C066C067
C069
Cadr_069
−500
18˚30' 19˚00' 19˚30'
41˚30'
42˚00'
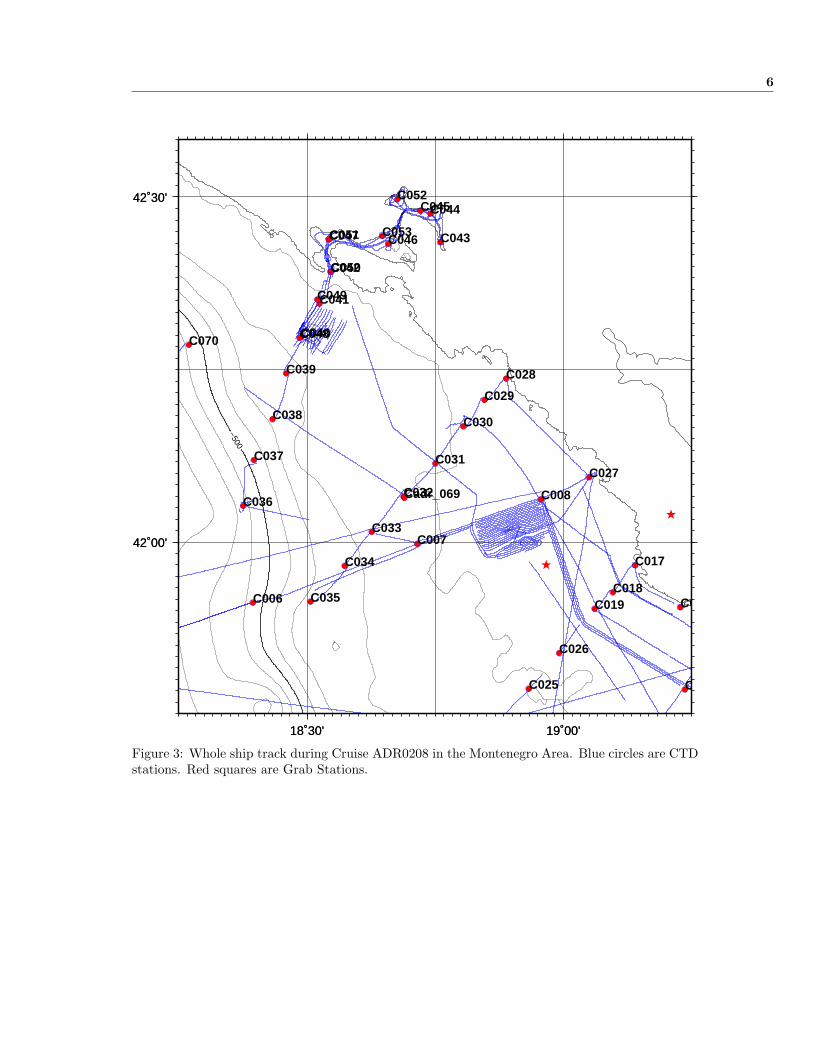
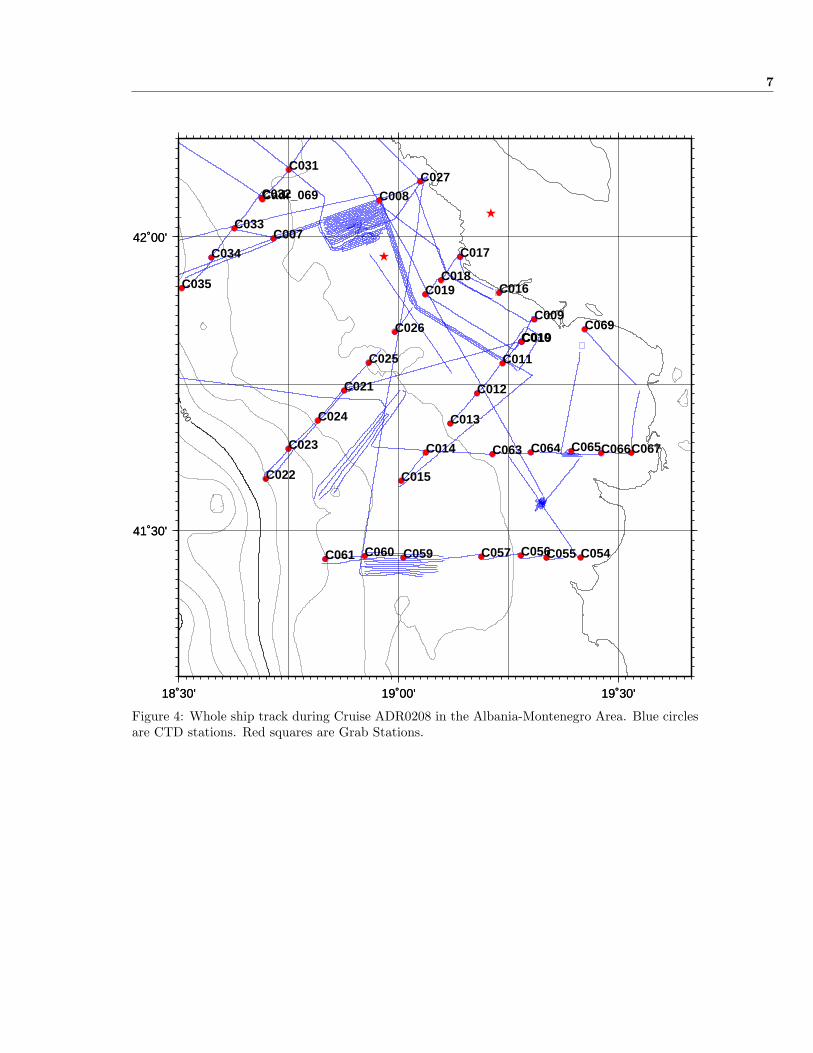
Figure 4: Whole ship track during Cruise ADR0208 in the Albania-Montenegro Area. Blue circlesare CTD stations. Red squares are Grab Stations.
Author F.Bignami et al.ISMAR-ISAC-CNR Interim Technical Cruise Report
8
SCIENTIFIC AND TECHNICAL PARTIES
PARTICIPANTS ORGANIZATION EXPERTISE tel & email & www
SEA EXPERIMENT
Francesco Bignami ISAC, Roma Chief of Expedition [email protected] Buongiorno Nardelli ISAC, RomaGiovanni Bortoluzzi ISMAR,Bologna [email protected] Giglio ISMAR,Bologna [email protected] Miserocchi ISMAR,Bologna [email protected] Marcelli UNITUS, ViterboViviana Piermattei UNITUS, Viterbo [email protected] Madonia UNITUS, ViterboCinzia Pizzi UNIROMA3Vanessa Cardin OGS, TriestePaolo Mansutti OGS, TriesteFranco Arena OGS, TriesteMattia Betti ISMAR, Ancona [email protected] Caccamo ISMAR, Ancona [email protected]
Zoran Kljajic IMB, Kotor [email protected] Zujovic IMB, KotorAlexandar Jovicic IMB, Kotor [email protected]
Table 2: Scientific and technical parties
3 MATERIALS AND METHODS
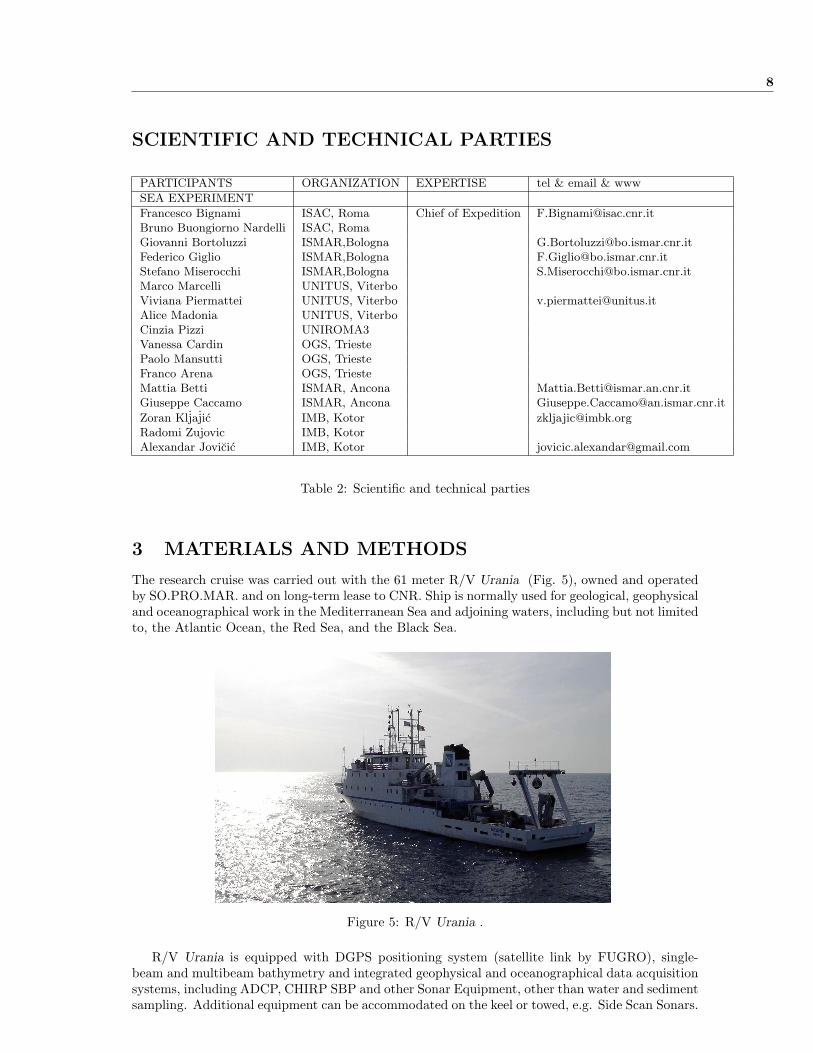
The research cruise was carried out with the 61 meter R/V Urania (Fig. 5), owned and operatedby SO.PRO.MAR. and on long-term lease to CNR. Ship is normally used for geological, geophysicaland oceanographical work in the Mediterranean Sea and adjoining waters, including but not limitedto, the Atlantic Ocean, the Red Sea, and the Black Sea.
Figure 5: R/V Urania .
R/V Urania is equipped with DGPS positioning system (satellite link by FUGRO), single-beam and multibeam bathymetry and integrated geophysical and oceanographical data acquisitionsystems, including ADCP, CHIRP SBP and other Sonar Equipment, other than water and sedimentsampling. Additional equipment can be accommodated on the keel or towed, e.g. Side Scan Sonars.
Author F.Bignami et al.ISMAR-ISAC-CNR Interim Technical Cruise Report
9
3.1 NAVIGATION, SWATH BATHYMETRY, CHIRP SBP DATA AC-QUISITION
The vessel was set-up for multibeam data acquisition and navigation with PDS-2000 software byRESON.
One workstations was used for the acquisition of multibeam data, interfacing by a multiserialand Ethernet link a RESON 8160 P1 processor, an TSS MAHRS MRU and FOG compass, DGPSreceiver (Fugro Omnistar), by a MOXA Multi/serial I/O, TC/P and UDP network sockets. TheMBES was the 50kHz, 126 0.5°, 150°aperture RESON 8160 (5000 m range). The sonar head ispositioned on the ship’s keel using a V-shaped steel frame. A Sound Velocity probe at the SonarHead is interfaced directly to the MBES processor, thus providing the necessary real-time datafor the beam-forming. XBT and CTD casts are normally used for input of the sound velocityprofile to the system. An Anderaa Meteorological Station was also made available, at a rate of onemeasurement every 5 minutes.
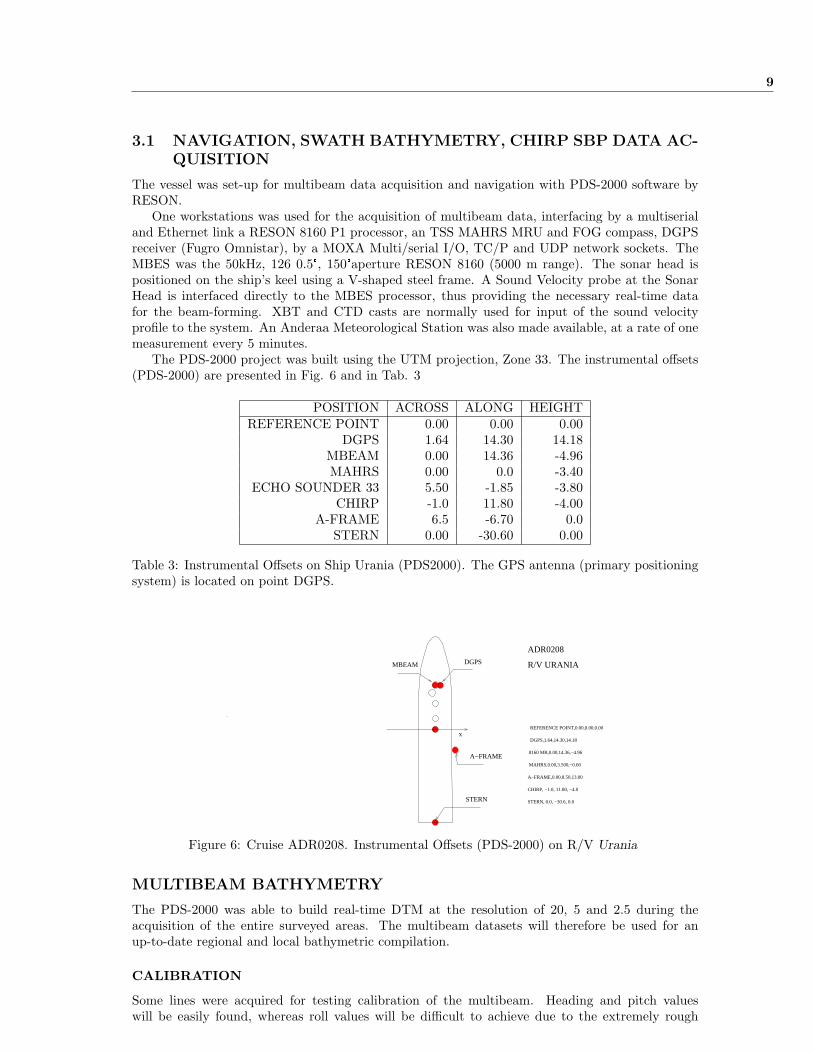
The PDS-2000 project was built using the UTM projection, Zone 33. The instrumental offsets(PDS-2000) are presented in Fig. 6 and in Tab. 3
POSITION ACROSS ALONG HEIGHTREFERENCE POINT 0.00 0.00 0.00
DGPS 1.64 14.30 14.18MBEAM 0.00 14.36 -4.96MAHRS 0.00 0.0 -3.40
ECHO SOUNDER 33 5.50 -1.85 -3.80CHIRP -1.0 11.80 -4.00
A-FRAME 6.5 -6.70 0.0STERN 0.00 -30.60 0.00
Table 3: Instrumental Offsets on Ship Urania (PDS2000). The GPS antenna (primary positioningsystem) is located on point DGPS.
x
DGPSMBEAM
STERN, 0.0, −30.6, 0.0
CHIRP, −1.0, 11.80, −4.0
A−FRAME,0.00,8.50,13.00
MAHRS,0.00,3.500,−0.60
8160 MB,0.00,14.36,−4.96
DGPS,1.64,14.30,14.18
REFERENCE POINT,0.00,0.00,0.00
R/V URANIA
A−FRAME
STERN
ADR0208
Figure 6: Cruise ADR0208. Instrumental Offsets (PDS-2000) on R/V Urania
MULTIBEAM BATHYMETRY
The PDS-2000 was able to build real-time DTM at the resolution of 20, 5 and 2.5 during theacquisition of the entire surveyed areas. The multibeam datasets will therefore be used for anup-to-date regional and local bathymetric compilation.
CALIBRATION
Some lines were acquired for testing calibration of the multibeam. Heading and pitch valueswill be easily found, whereas roll values will be difficult to achieve due to the extremely rough
Author F.Bignami et al.ISMAR-ISAC-CNR Interim Technical Cruise Report
10
bottom morphology. However, we are confident that any misalignement will be found and, possibly,recovered, using the entire data set of lines.
CHIRP SBP
A Teledyne Benthos CHIRP SBP system (16 hull-mounted transducers) was used. The data wereacquired by the SWANPRO software by Communication Technology, with direct interfacing to theDGPS, therefore actual positioning data have to be converted according to the offsets of Tab.3.The system setting (multiping mode) was: power full, length 20ms, trigger rate variyng from 0.5to 0.687 s,gain 9dbm preamp gain ranging from 1.5 to 3 db. The data were recorded in the XTFformat and converted also into the SEG-Y format for processing with ISMAR’s SEISPRHO package[Gasperini and Stanghellini(2008)].
3.2 OVERVIEW OF OCEANOGRAPHICAL SAMPLING STRATEGY,SAMPLE TREATMENT AND ONBOARD ANALYSIS
3.1 CTD CASTS AND WATER SAMPLING
CTD and rosette sampling casts were taken on surveyed area. Conductivity (SBE-4,3x10⁻⁴ S/minitial accuracy), temperature (SBE-3/F, 1.0x10⁻³ °C) and oxygen (SBE-13, 4.3x10µλl−1), PAR(depth < 1000m), light transmission and fluorimetry data were collected by a Seabird SBE 11PLUS using the SEASAVE V5.33 software. The pressure data were measured by a ParoScientificDigiquartz (0-6000m, accuracy 0.1%). Data were acquired at 24Hz and the descent rate wasaproximately 1 m/s, much less when close to bottom or on interesting interfaces.
The conversion from pressure to depth on the SEA-SAVE software was done at latitude 41N.The WHOI-UNESCO package was also used for converting to the 42N for comparison. A GeneralOceanics rosette sampler with 24 10l capacity Niskin bottles was employed for water sampling.DGPS NMEA Position data were interfaced directly to the CTD acquisition systems.
The position of the CTD stations together with some relevant data are reported in Tables 5,and can be viewed in Fig. 2, 3 and 4.
The recorded data were converted to the CNV and ASCIIOUT (for CTD) formats and furtherplotted with the ODV software [Schlitzer(2004)]. The Sound Velocity data from the acquiredprofiles were made available for import into the PDS-2000 software for multibeam data corrections.
Oxygen data on the water samples were verified by Winkler titration method.The slow-descending, free fall Profiler II Ocean profiler by SATLANTIC was used for hyper-
spectral investigation on upper water column.UNITUS’s T-FLAP, a new launchable probe developed to perform temperature and fluorescence
profiles was tested diring the cruise. Five of them were launched in order to study sensors response,at different trophic conditions.
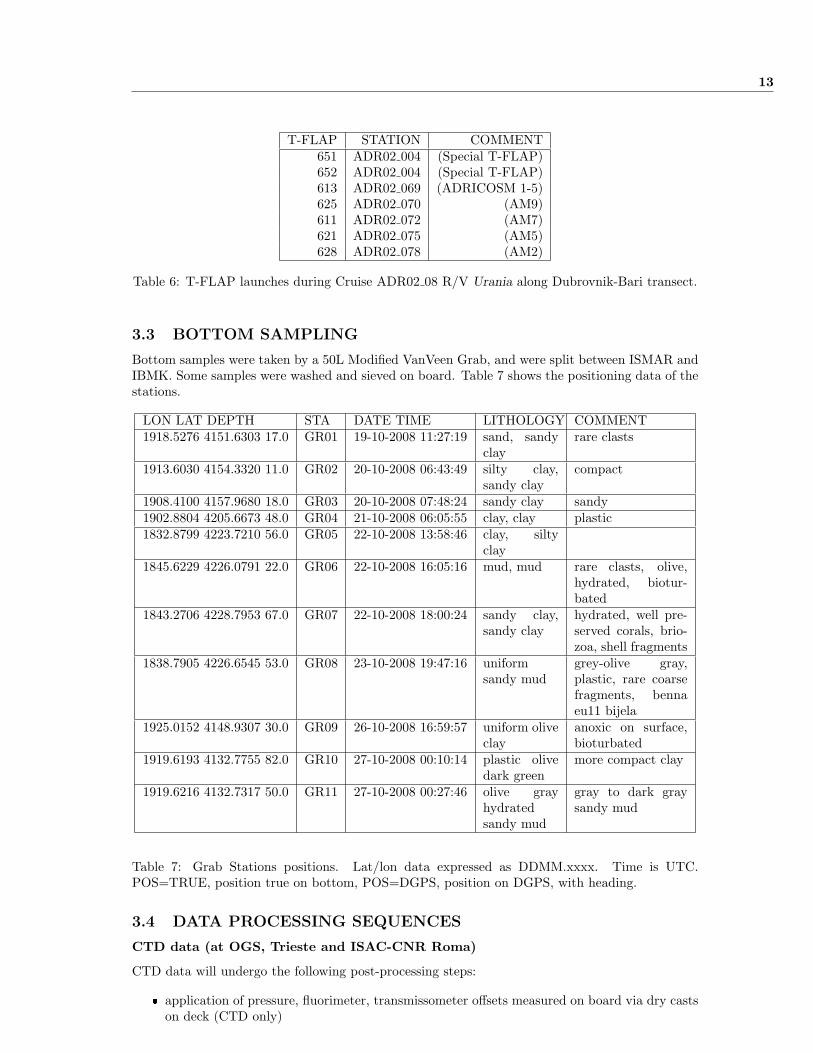
Two special T-FLAP were launched to verify the hydrodynamic behavior in the water column:these probes were equipped with three-axial-accelerometers, pressure transducer, gyroscope. Table6 shows the launch data. Chlorophyll a, TSM and CDOM samples were taken from the CTDbottles at different depths, in order to calibrate probe measures.
During the launch communication problems occurred to the 2 special T-FLAP: we acquireddata till 13m depth.
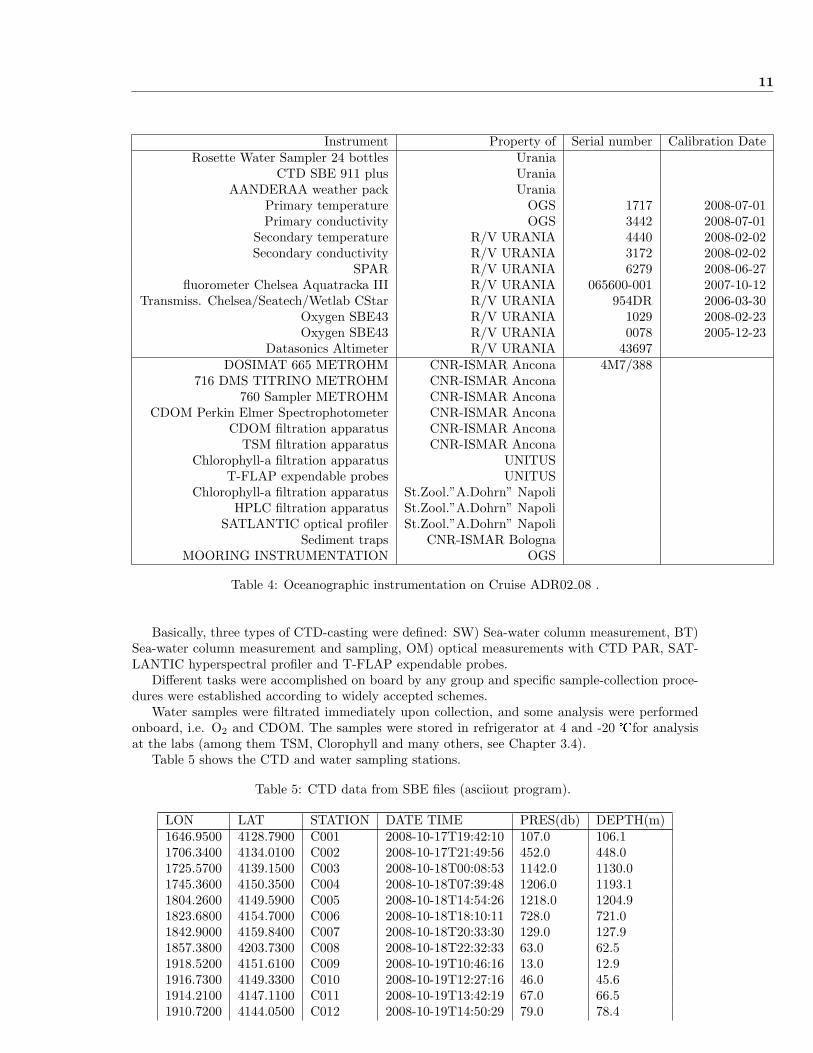
Table 4 shows the oceanographic instrumentation used, recovered and deployed during theCruise.
Author F.Bignami et al.ISMAR-ISAC-CNR Interim Technical Cruise Report
11
Instrument Property of Serial number Calibration DateRosette Water Sampler 24 bottles Urania
CTD SBE 911 plus UraniaAANDERAA weather pack Urania
Primary temperature OGS 1717 2008-07-01Primary conductivity OGS 3442 2008-07-01
Secondary temperature R/V URANIA 4440 2008-02-02Secondary conductivity R/V URANIA 3172 2008-02-02
SPAR R/V URANIA 6279 2008-06-27fluorometer Chelsea Aquatracka III R/V URANIA 065600-001 2007-10-12
Transmiss. Chelsea/Seatech/Wetlab CStar R/V URANIA 954DR 2006-03-30Oxygen SBE43 R/V URANIA 1029 2008-02-23Oxygen SBE43 R/V URANIA 0078 2005-12-23
Datasonics Altimeter R/V URANIA 43697DOSIMAT 665 METROHM CNR-ISMAR Ancona 4M7/388
716 DMS TITRINO METROHM CNR-ISMAR Ancona760 Sampler METROHM CNR-ISMAR Ancona
CDOM Perkin Elmer Spectrophotometer CNR-ISMAR AnconaCDOM filtration apparatus CNR-ISMAR Ancona
TSM filtration apparatus CNR-ISMAR AnconaChlorophyll-a filtration apparatus UNITUS
T-FLAP expendable probes UNITUSChlorophyll-a filtration apparatus St.Zool.”A.Dohrn” Napoli
HPLC filtration apparatus St.Zool.”A.Dohrn” NapoliSATLANTIC optical profiler St.Zool.”A.Dohrn” Napoli
Sediment traps CNR-ISMAR BolognaMOORING INSTRUMENTATION OGS
Table 4: Oceanographic instrumentation on Cruise ADR02 08 .
Basically, three types of CTD-casting were defined: SW) Sea-water column measurement, BT)Sea-water column measurement and sampling, OM) optical measurements with CTD PAR, SAT-LANTIC hyperspectral profiler and T-FLAP expendable probes.
Different tasks were accomplished on board by any group and specific sample-collection proce-dures were established according to widely accepted schemes.
Water samples were filtrated immediately upon collection, and some analysis were performedonboard, i.e. O2 and CDOM. The samples were stored in refrigerator at 4 and -20 �for analysisat the labs (among them TSM, Clorophyll and many others, see Chapter 3.4).
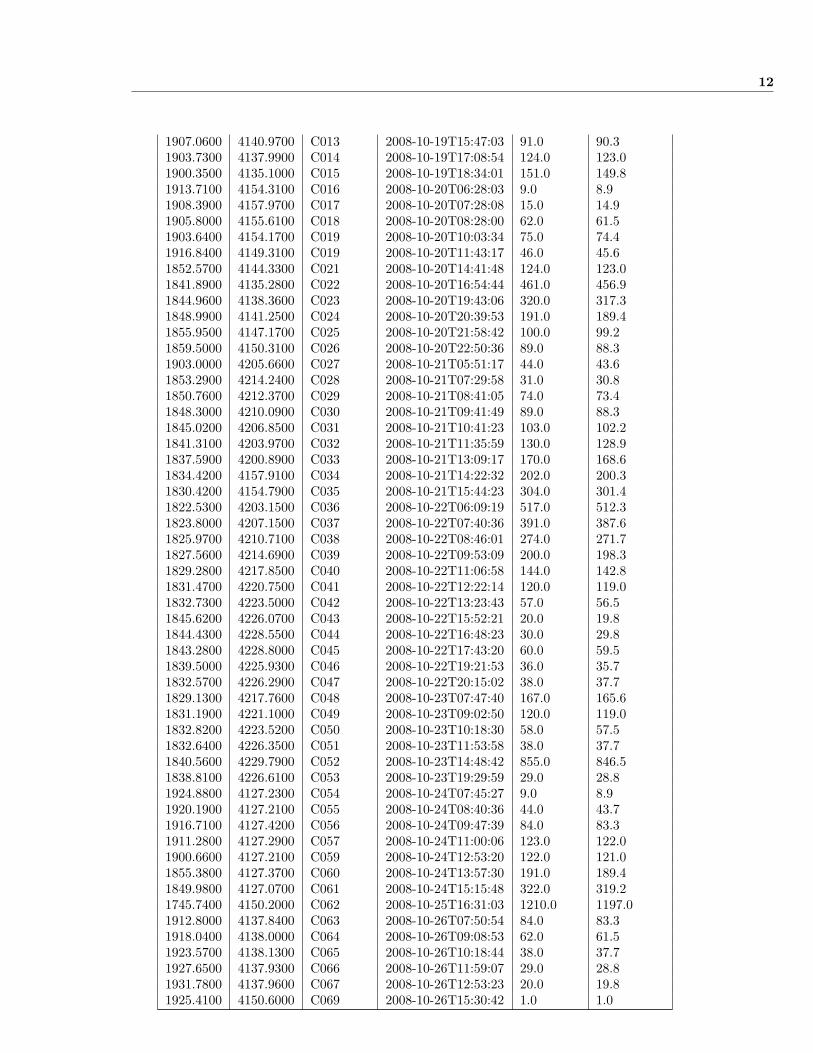
Table 5 shows the CTD and water sampling stations.
Table 5: CTD data from SBE files (asciiout program).
LON LAT STATION DATE TIME PRES(db) DEPTH(m)1646.9500 4128.7900 C001 2008-10-17T19:42:10 107.0 106.11706.3400 4134.0100 C002 2008-10-17T21:49:56 452.0 448.01725.5700 4139.1500 C003 2008-10-18T00:08:53 1142.0 1130.01745.3600 4150.3500 C004 2008-10-18T07:39:48 1206.0 1193.11804.2600 4149.5900 C005 2008-10-18T14:54:26 1218.0 1204.91823.6800 4154.7000 C006 2008-10-18T18:10:11 728.0 721.01842.9000 4159.8400 C007 2008-10-18T20:33:30 129.0 127.91857.3800 4203.7300 C008 2008-10-18T22:32:33 63.0 62.51918.5200 4151.6100 C009 2008-10-19T10:46:16 13.0 12.91916.7300 4149.3300 C010 2008-10-19T12:27:16 46.0 45.61914.2100 4147.1100 C011 2008-10-19T13:42:19 67.0 66.51910.7200 4144.0500 C012 2008-10-19T14:50:29 79.0 78.4
Author F.Bignami et al.ISMAR-ISAC-CNR Interim Technical Cruise Report
12
1907.0600 4140.9700 C013 2008-10-19T15:47:03 91.0 90.31903.7300 4137.9900 C014 2008-10-19T17:08:54 124.0 123.01900.3500 4135.1000 C015 2008-10-19T18:34:01 151.0 149.81913.7100 4154.3100 C016 2008-10-20T06:28:03 9.0 8.91908.3900 4157.9700 C017 2008-10-20T07:28:08 15.0 14.91905.8000 4155.6100 C018 2008-10-20T08:28:00 62.0 61.51903.6400 4154.1700 C019 2008-10-20T10:03:34 75.0 74.41916.8400 4149.3100 C019 2008-10-20T11:43:17 46.0 45.61852.5700 4144.3300 C021 2008-10-20T14:41:48 124.0 123.01841.8900 4135.2800 C022 2008-10-20T16:54:44 461.0 456.91844.9600 4138.3600 C023 2008-10-20T19:43:06 320.0 317.31848.9900 4141.2500 C024 2008-10-20T20:39:53 191.0 189.41855.9500 4147.1700 C025 2008-10-20T21:58:42 100.0 99.21859.5000 4150.3100 C026 2008-10-20T22:50:36 89.0 88.31903.0000 4205.6600 C027 2008-10-21T05:51:17 44.0 43.61853.2900 4214.2400 C028 2008-10-21T07:29:58 31.0 30.81850.7600 4212.3700 C029 2008-10-21T08:41:05 74.0 73.41848.3000 4210.0900 C030 2008-10-21T09:41:49 89.0 88.31845.0200 4206.8500 C031 2008-10-21T10:41:23 103.0 102.21841.3100 4203.9700 C032 2008-10-21T11:35:59 130.0 128.91837.5900 4200.8900 C033 2008-10-21T13:09:17 170.0 168.61834.4200 4157.9100 C034 2008-10-21T14:22:32 202.0 200.31830.4200 4154.7900 C035 2008-10-21T15:44:23 304.0 301.41822.5300 4203.1500 C036 2008-10-22T06:09:19 517.0 512.31823.8000 4207.1500 C037 2008-10-22T07:40:36 391.0 387.61825.9700 4210.7100 C038 2008-10-22T08:46:01 274.0 271.71827.5600 4214.6900 C039 2008-10-22T09:53:09 200.0 198.31829.2800 4217.8500 C040 2008-10-22T11:06:58 144.0 142.81831.4700 4220.7500 C041 2008-10-22T12:22:14 120.0 119.01832.7300 4223.5000 C042 2008-10-22T13:23:43 57.0 56.51845.6200 4226.0700 C043 2008-10-22T15:52:21 20.0 19.81844.4300 4228.5500 C044 2008-10-22T16:48:23 30.0 29.81843.2800 4228.8000 C045 2008-10-22T17:43:20 60.0 59.51839.5000 4225.9300 C046 2008-10-22T19:21:53 36.0 35.71832.5700 4226.2900 C047 2008-10-22T20:15:02 38.0 37.71829.1300 4217.7600 C048 2008-10-23T07:47:40 167.0 165.61831.1900 4221.1000 C049 2008-10-23T09:02:50 120.0 119.01832.8200 4223.5200 C050 2008-10-23T10:18:30 58.0 57.51832.6400 4226.3500 C051 2008-10-23T11:53:58 38.0 37.71840.5600 4229.7900 C052 2008-10-23T14:48:42 855.0 846.51838.8100 4226.6100 C053 2008-10-23T19:29:59 29.0 28.81924.8800 4127.2300 C054 2008-10-24T07:45:27 9.0 8.91920.1900 4127.2100 C055 2008-10-24T08:40:36 44.0 43.71916.7100 4127.4200 C056 2008-10-24T09:47:39 84.0 83.31911.2800 4127.2900 C057 2008-10-24T11:00:06 123.0 122.01900.6600 4127.2100 C059 2008-10-24T12:53:20 122.0 121.01855.3800 4127.3700 C060 2008-10-24T13:57:30 191.0 189.41849.9800 4127.0700 C061 2008-10-24T15:15:48 322.0 319.21745.7400 4150.2000 C062 2008-10-25T16:31:03 1210.0 1197.01912.8000 4137.8400 C063 2008-10-26T07:50:54 84.0 83.31918.0400 4138.0000 C064 2008-10-26T09:08:53 62.0 61.51923.5700 4138.1300 C065 2008-10-26T10:18:44 38.0 37.71927.6500 4137.9300 C066 2008-10-26T11:59:07 29.0 28.81931.7800 4137.9600 C067 2008-10-26T12:53:23 20.0 19.81925.4100 4150.6000 C069 2008-10-26T15:30:42 1.0 1.0
Author F.Bignami et al.ISMAR-ISAC-CNR Interim Technical Cruise Report
13
T-FLAP STATION COMMENT651 ADR02 004 (Special T-FLAP)652 ADR02 004 (Special T-FLAP)613 ADR02 069 (ADRICOSM 1-5)625 ADR02 070 (AM9)611 ADR02 072 (AM7)621 ADR02 075 (AM5)628 ADR02 078 (AM2)
Table 6: T-FLAP launches during Cruise ADR02 08 R/V Urania along Dubrovnik-Bari transect.
3.3 BOTTOM SAMPLING
Bottom samples were taken by a 50L Modified VanVeen Grab, and were split between ISMAR andIBMK. Some samples were washed and sieved on board. Table 7 shows the positioning data of thestations.
LON LAT DEPTH STA DATE TIME LITHOLOGY COMMENT1918.5276 4151.6303 17.0 GR01 19-10-2008 11:27:19 sand, sandy
clayrare clasts
1913.6030 4154.3320 11.0 GR02 20-10-2008 06:43:49 silty clay,sandy clay
compact
1908.4100 4157.9680 18.0 GR03 20-10-2008 07:48:24 sandy clay sandy1902.8804 4205.6673 48.0 GR04 21-10-2008 06:05:55 clay, clay plastic1832.8799 4223.7210 56.0 GR05 22-10-2008 13:58:46 clay, silty
clay1845.6229 4226.0791 22.0 GR06 22-10-2008 16:05:16 mud, mud rare clasts, olive,
hydrated, biotur-bated
1843.2706 4228.7953 67.0 GR07 22-10-2008 18:00:24 sandy clay,sandy clay
hydrated, well pre-served corals, brio-zoa, shell fragments
1838.7905 4226.6545 53.0 GR08 23-10-2008 19:47:16 uniformsandy mud
grey-olive gray,plastic, rare coarsefragments, bennaeu11 bijela
1925.0152 4148.9307 30.0 GR09 26-10-2008 16:59:57 uniform oliveclay
anoxic on surface,bioturbated
1919.6193 4132.7755 82.0 GR10 27-10-2008 00:10:14 plastic olivedark green
more compact clay
1919.6216 4132.7317 50.0 GR11 27-10-2008 00:27:46 olive grayhydratedsandy mud
gray to dark graysandy mud
Table 7: Grab Stations positions. Lat/lon data expressed as DDMM.xxxx. Time is UTC.POS=TRUE, position true on bottom, POS=DGPS, position on DGPS, with heading.
3.4 DATA PROCESSING SEQUENCES
CTD data (at OGS, Trieste and ISAC-CNR Roma)
CTD data will undergo the following post-processing steps:
� application of pressure, fluorimeter, transmissometer offsets measured on board via dry castson deck (CTD only)
Author F.Bignami et al.ISMAR-ISAC-CNR Interim Technical Cruise Report
14
� de-spiking and eventual linear interpolation of missing data in profiles; Winkler - CTD O2regression coefficient calculation and correction of oxygen sensors (CTD only)
� production of final 1 dbar and 1 m averaged CTD downcast database
Meteo-marine data time series (at ISAC-CNR Roma)
Meteorological and sea surface temperature and conductivity recordings will undergo the followingprocessing:
� Extraction of binary data into ASCII format
� de-spiking and linear interpolation of missing data in time series
� production of final low-pass filtered meteo-marine (bandpass to be decided on the basis ofinternational standards and/or scientific requirements).
Bio-optical data
Bio-optical data will be processed to obtain inherent and apparent optical properties.
� Apparent Optical Properties;
– Sub-surface remote sensing reflectance
– Normalized water leaving radiance
– Sub-surface Irradiance reflectance
� Inherent Optical Properties:
– 1-meter binned profiles of absorption, scattering and total attenuation
– 1-meter binned profiles of backscattering
� Biological and biogeochemical data
– Inorganic nutrients are determined with a colorimetric method (Auto-analyzer);
– Total N and P are determined with a colorimetric method (Auto-analyzer);;
– Chlorophyll content is measured with spectrofluorimetric method;
– Pigments are separated and quantyfied by HPLC analysis;
– Particulate N and C is quantified with CHN elemental analyzer;
– Primary production is obtained from 13C assimilation estimates;
– Microzooplankton abundance is estimated from individual count;
– Nanoflagellates concentration is obtained via epifluorescence;
– Grazing and cannibalism of ciliates is estimated performing analyses on phytoplankton,nanoflagellates and microzooplankton on samples from different degrees of dilution;
– Isotopic composition is measured by means of a mass spectrometer.
Multibeam and CHIRP data
Multibeam data will be processed by using the PDS-2000 and other industry-standard software,in addition to the O.S. MB-System package. DTM data will be produced, further analyzed andmapped by the O.S. GMT package [Wessel and Smith (1995)]. The CHIRP data will be processedby the ISMAR’s O.S. SEISPHRO package [Gasperini and Stanghellini(2008)], to produce enhancedimages of the subsurface seafloor, strata geometry, isopachs etc.
Author F.Bignami et al.ISMAR-ISAC-CNR Interim Technical Cruise Report
15
Sediment analysis
The sediments will be analyzed for:
� physical properties (granulometry, density, mineralogy)
� chemical properties (N,C by CHN) and stable isotopes delta 13C and 15N, radionuclides 210Pband 137Cs, heavy metals
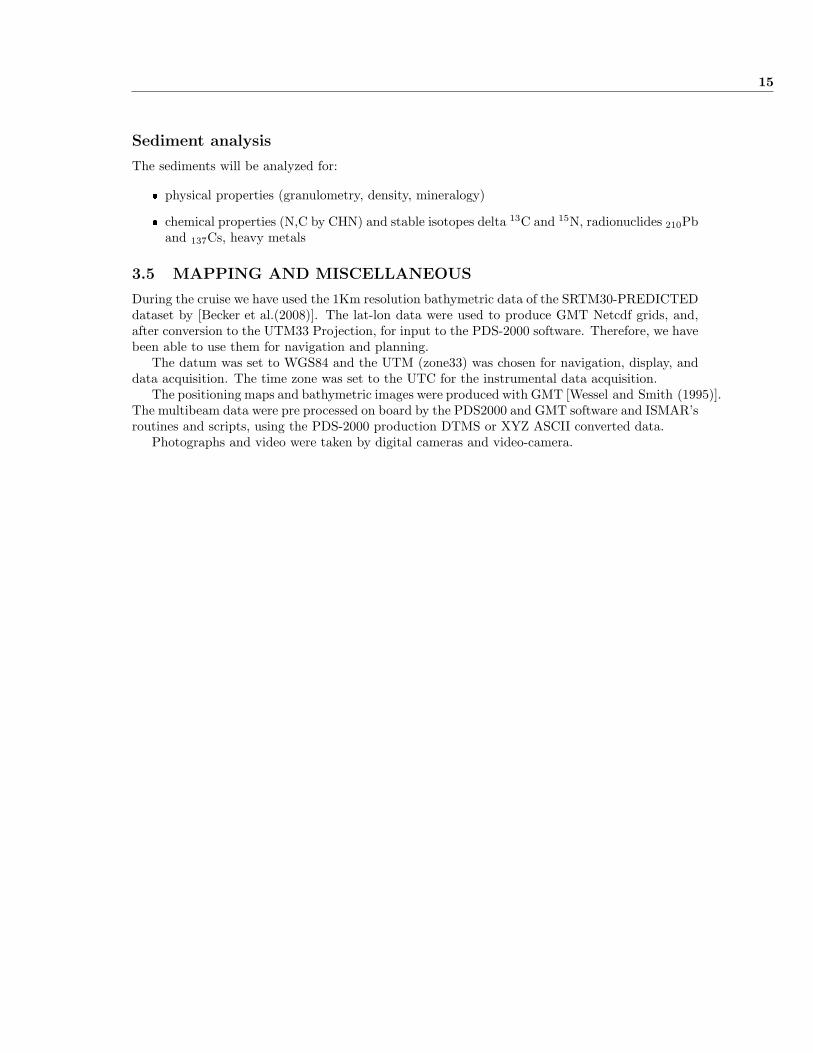
3.5 MAPPING AND MISCELLANEOUS
During the cruise we have used the 1Km resolution bathymetric data of the SRTM30-PREDICTEDdataset by [Becker et al.(2008)]. The lat-lon data were used to produce GMT Netcdf grids, and,after conversion to the UTM33 Projection, for input to the PDS-2000 software. Therefore, we havebeen able to use them for navigation and planning.
The datum was set to WGS84 and the UTM (zone33) was chosen for navigation, display, anddata acquisition. The time zone was set to the UTC for the instrumental data acquisition.
The positioning maps and bathymetric images were produced with GMT [Wessel and Smith (1995)].The multibeam data were pre processed on board by the PDS2000 and GMT software and ISMAR’sroutines and scripts, using the PDS-2000 production DTMS or XYZ ASCII converted data.
Photographs and video were taken by digital cameras and video-camera.
Author F.Bignami et al.ISMAR-ISAC-CNR Interim Technical Cruise Report
16
4 INITIAL RESULTS
Some initial results are presented, in order to address the importance of the preliminary findingsand processing sequence of the data acquired.
4.1 OCEANOGRAPHICAL PROFILING
4.1 SATELLITE IMAGERY
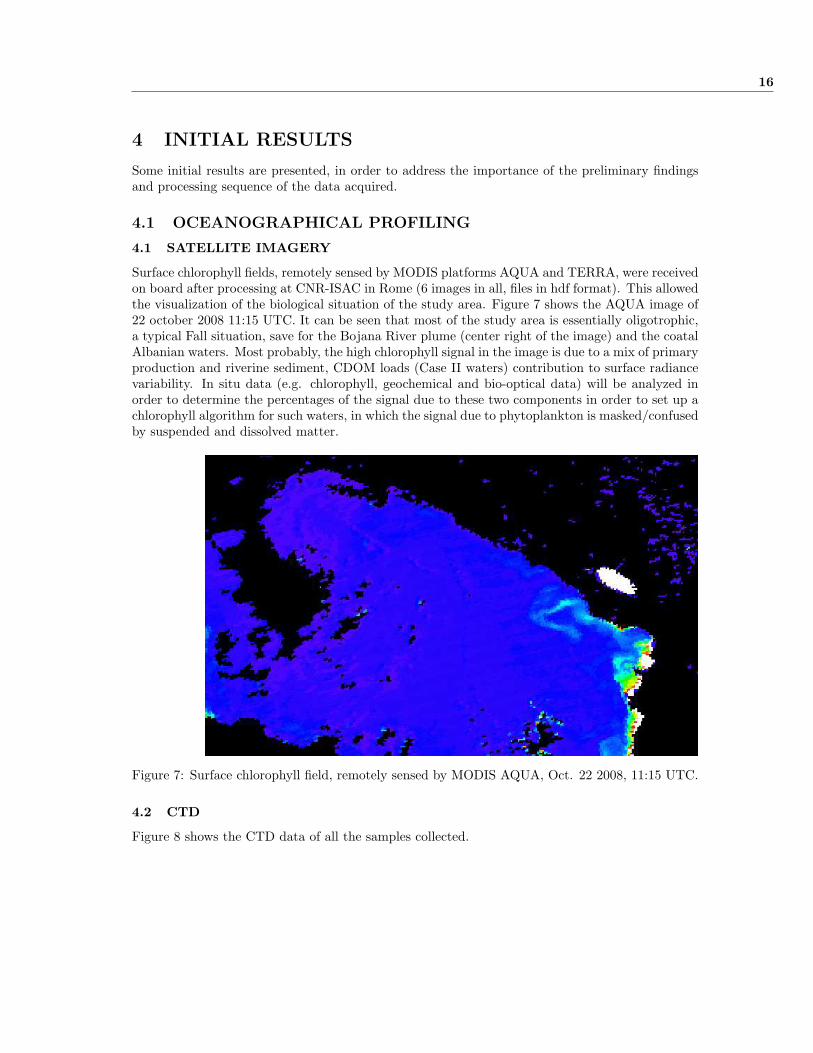
Surface chlorophyll fields, remotely sensed by MODIS platforms AQUA and TERRA, were receivedon board after processing at CNR-ISAC in Rome (6 images in all, files in hdf format). This allowedthe visualization of the biological situation of the study area. Figure 7 shows the AQUA image of22 october 2008 11:15 UTC. It can be seen that most of the study area is essentially oligotrophic,a typical Fall situation, save for the Bojana River plume (center right of the image) and the coatalAlbanian waters. Most probably, the high chlorophyll signal in the image is due to a mix of primaryproduction and riverine sediment, CDOM loads (Case II waters) contribution to surface radiancevariability. In situ data (e.g. chlorophyll, geochemical and bio-optical data) will be analyzed inorder to determine the percentages of the signal due to these two components in order to set up achlorophyll algorithm for such waters, in which the signal due to phytoplankton is masked/confusedby suspended and dissolved matter.
Figure 7: Surface chlorophyll field, remotely sensed by MODIS AQUA, Oct. 22 2008, 11:15 UTC.
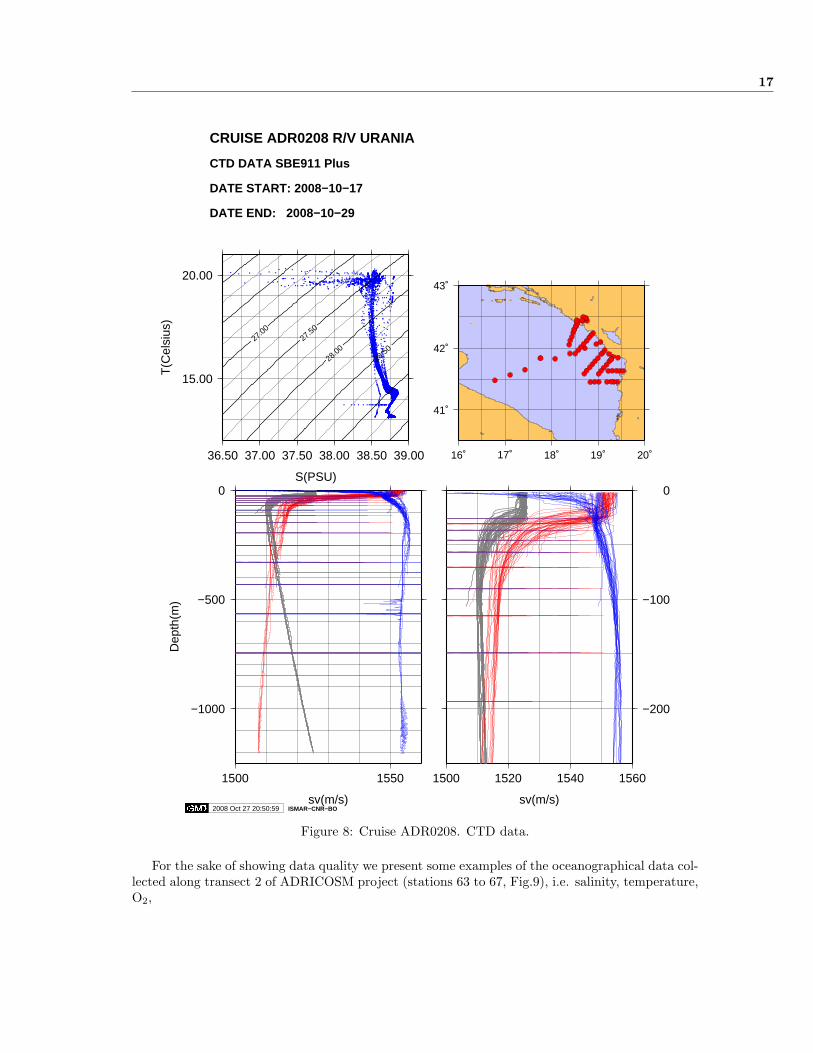
4.2 CTD
Figure 8 shows the CTD data of all the samples collected.
Author F.Bignami et al.ISMAR-ISAC-CNR Interim Technical Cruise Report
17
2008 Oct 27 20:50:59 ISMAR−CNR−BO
−1000
−500
0
Dep
th(m
)
1500 1550
sv(m/s)
−200
−100
0
1500 1520 1540 1560
sv(m/s)
15.00
20.00
T(C
elsi
us)
36.50 37.00 37.50 38.00 38.50 39.00
S(PSU)
27.0027.50
28.00
28.50
16˚ 17˚ 18˚ 19˚ 20˚
41˚
42˚
43˚
CRUISE ADR0208 R/V URANIA
CTD DATA SBE911 Plus
DATE START: 2008−10−17
DATE END: 2008−10−29
Figure 8: Cruise ADR0208. CTD data.
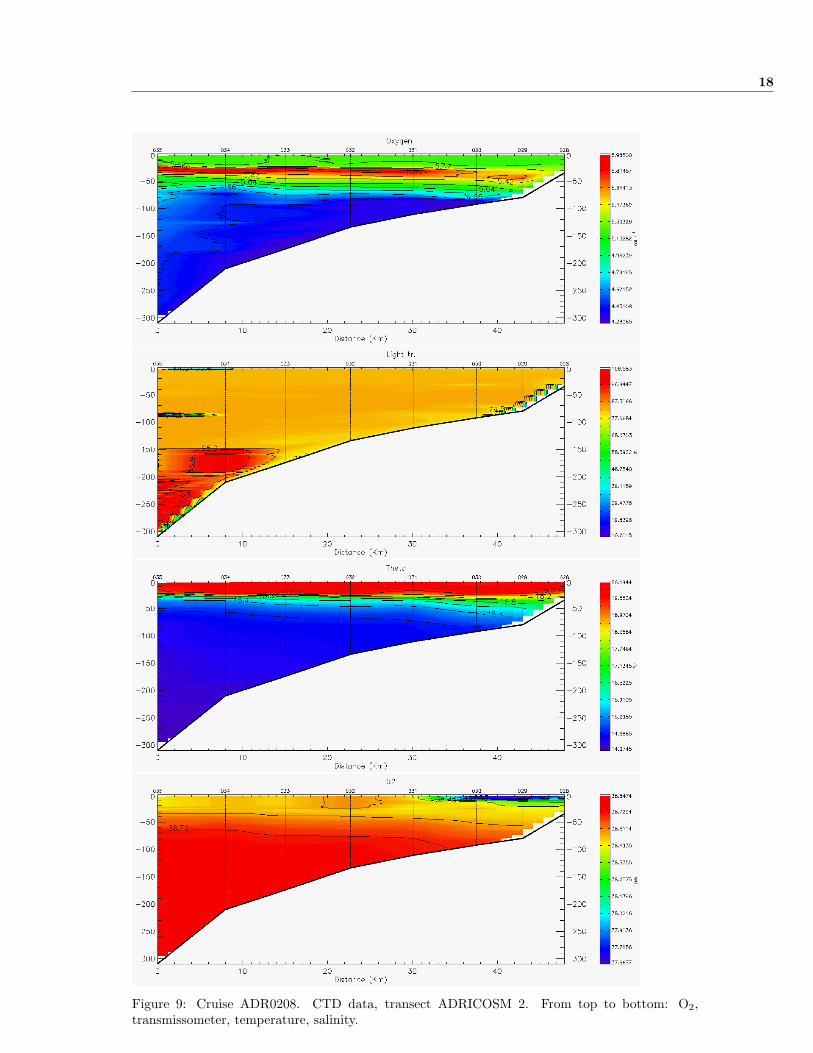
For the sake of showing data quality we present some examples of the oceanographical data col-lected along transect 2 of ADRICOSM project (stations 63 to 67, Fig.9), i.e. salinity, temperature,O2,
Author F.Bignami et al.ISMAR-ISAC-CNR Interim Technical Cruise Report
18
Figure 9: Cruise ADR0208. CTD data, transect ADRICOSM 2. From top to bottom: O2,transmissometer, temperature, salinity.
Author F.Bignami et al.ISMAR-ISAC-CNR Interim Technical Cruise Report
19
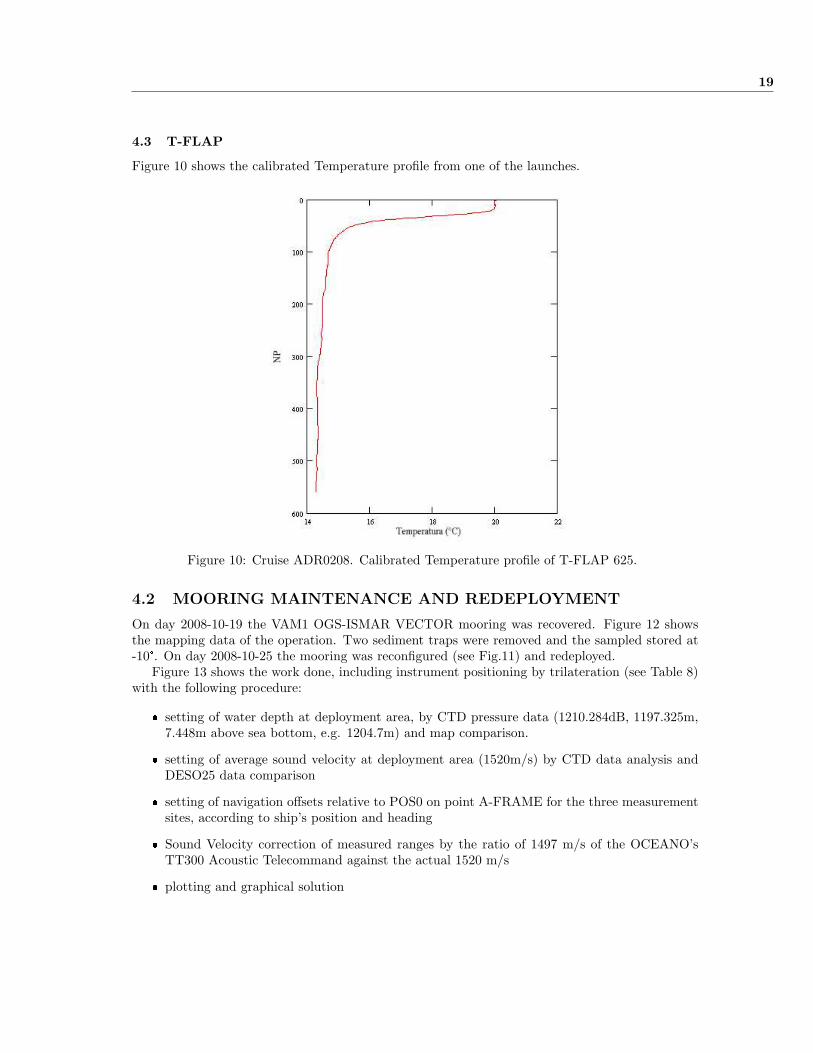
4.3 T-FLAP
Figure 10 shows the calibrated Temperature profile from one of the launches.
Figure 10: Cruise ADR0208. Calibrated Temperature profile of T-FLAP 625.
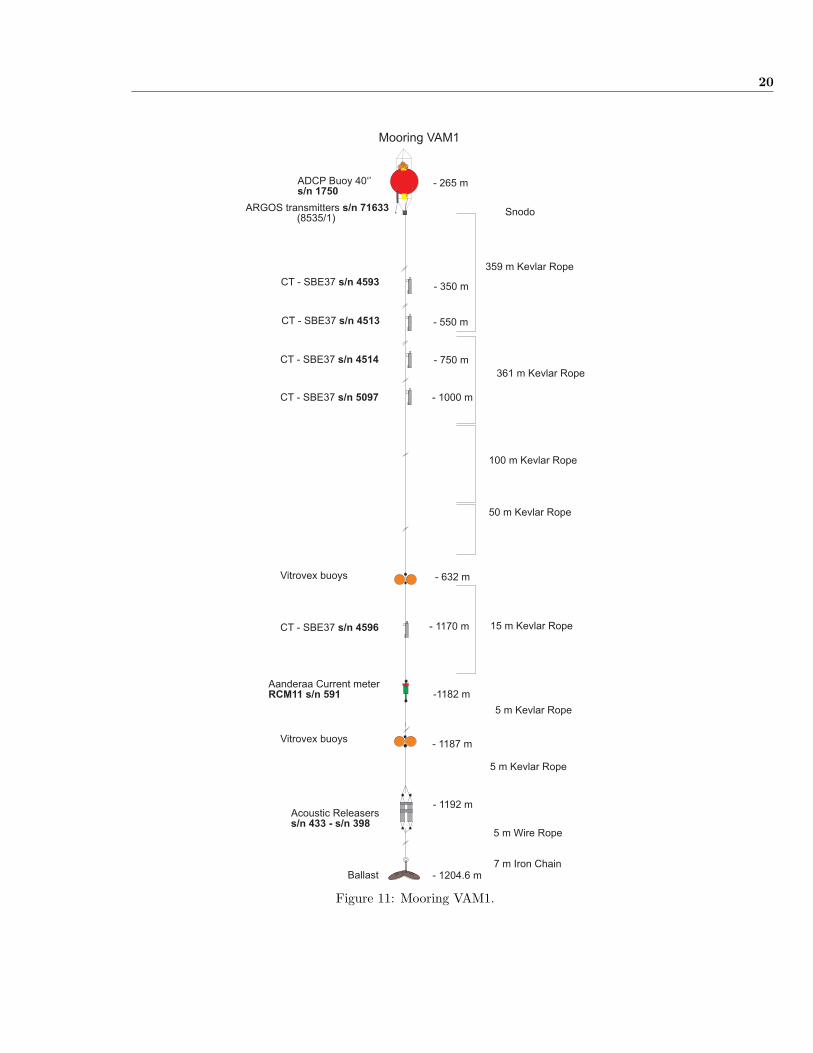
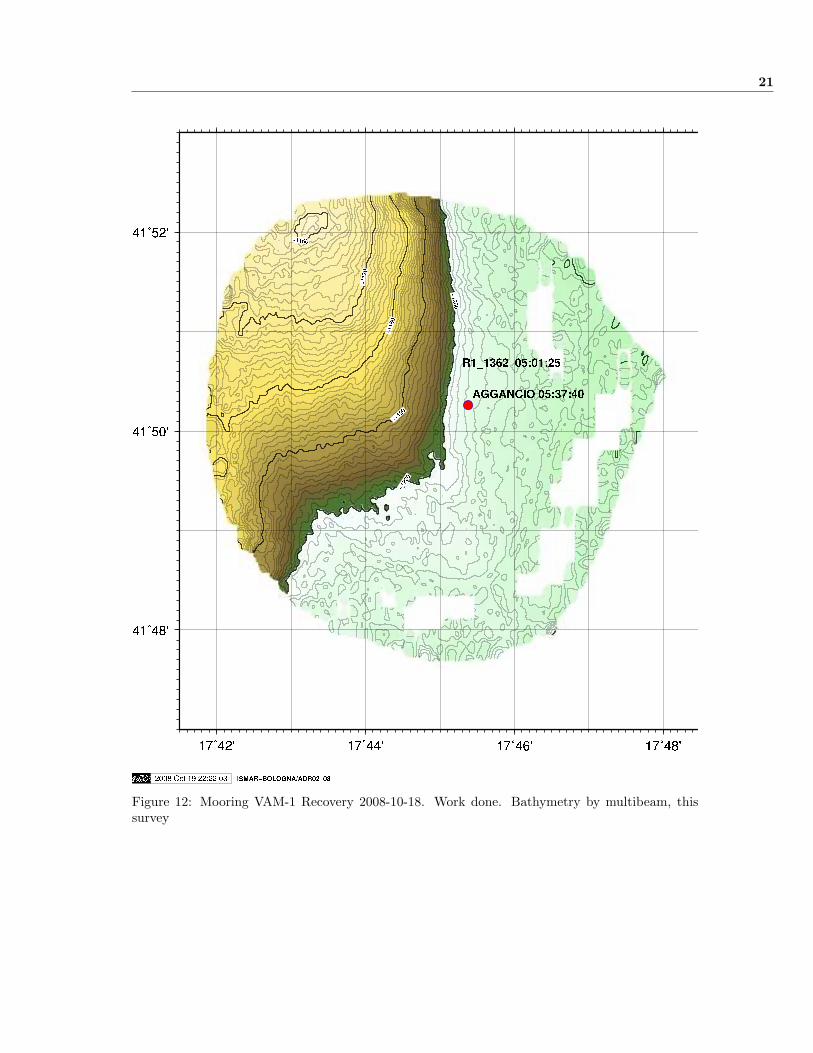
4.2 MOORING MAINTENANCE AND REDEPLOYMENT
On day 2008-10-19 the VAM1 OGS-ISMAR VECTOR mooring was recovered. Figure 12 showsthe mapping data of the operation. Two sediment traps were removed and the sampled stored at-10°. On day 2008-10-25 the mooring was reconfigured (see Fig.11) and redeployed.
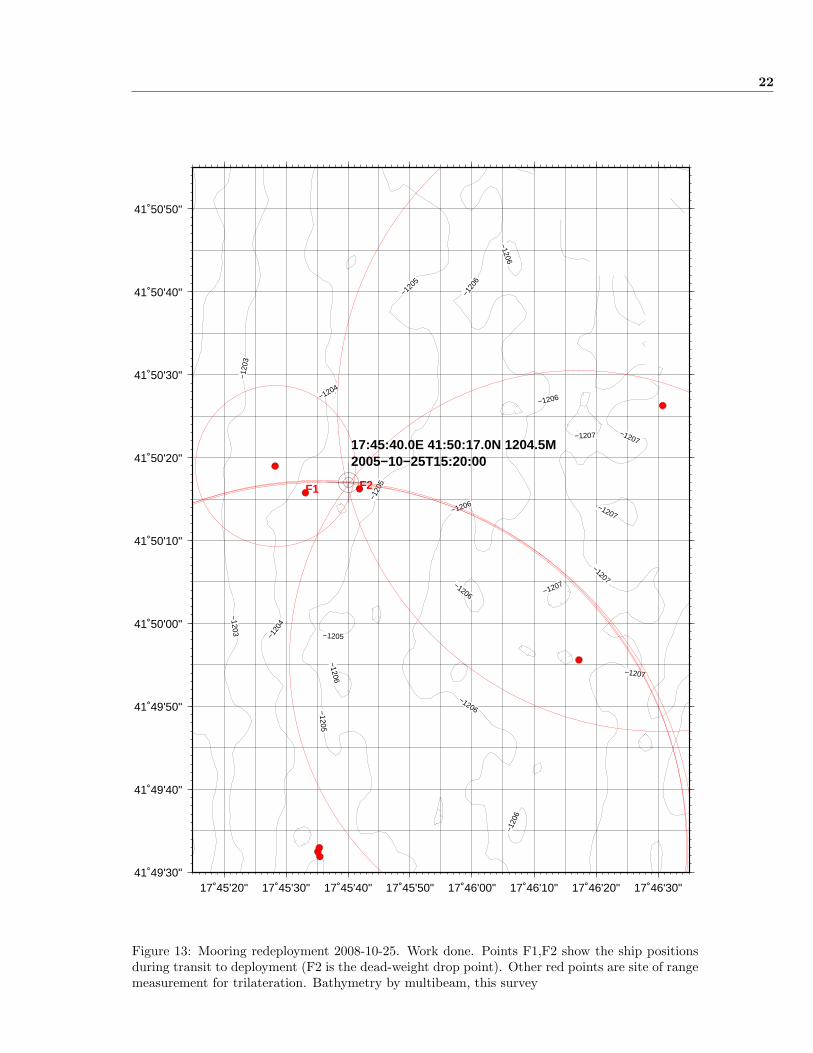
Figure 13 shows the work done, including instrument positioning by trilateration (see Table 8)with the following procedure:
� setting of water depth at deployment area, by CTD pressure data (1210.284dB, 1197.325m,7.448m above sea bottom, e.g. 1204.7m) and map comparison.
� setting of average sound velocity at deployment area (1520m/s) by CTD data analysis andDESO25 data comparison
� setting of navigation offsets relative to POS0 on point A-FRAME for the three measurementsites, according to ship’s position and heading
� Sound Velocity correction of measured ranges by the ratio of 1497 m/s of the OCEANO’sTT300 Acoustic Telecommand against the actual 1520 m/s
� plotting and graphical solution
Author F.Bignami et al.ISMAR-ISAC-CNR Interim Technical Cruise Report
20
ADCP Buoy 40‘’s/n 1750
- 265 m
- 632 m
-1182 m
- 1192 m
- 1187 m
- 550 m
15 m RopeKevlar
5 m RopeKevlar
5 m RopeKevlar
5 m Wire Rope
7 m Iron Chain- 1204.6 m
50 m Kevlar Rope
Aanderaa Current meterRCM11 s/n 591
Acoustic Releaserss/n 433 - s/n 398
Ballast
Mooring VAM1
CT - SBE37 s/n 4593
Snodo
CT - SBE37 s/n 4514
CT - SBE37 s/n 4513
CT - SBE37 s/n 5097
- 350 m
- 1000 m
- 750 m
CT - SBE37 s/n 4596
Vitrovex buoys
Vitrovex buoys
- 1170 m
100 m Kevlar Rope
361 m RopeKevlar
359 m RopeKevlar
ARGOS transmitters(8535/1)
s/n 71633
Figure 11: Mooring VAM1.
Author F.Bignami et al.ISMAR-ISAC-CNR Interim Technical Cruise Report
21
Figure 12: Mooring VAM-1 Recovery 2008-10-18. Work done. Bathymetry by multibeam, thissurvey
Author F.Bignami et al.ISMAR-ISAC-CNR Interim Technical Cruise Report
22
17˚45'20" 17˚45'30" 17˚45'40" 17˚45'50" 17˚46'00" 17˚46'10" 17˚46'20" 17˚46'30"41˚49'30"
41˚49'40"
41˚49'50"
41˚50'00"
41˚50'10"
41˚50'20"
41˚50'30"
41˚50'40"
41˚50'50"
−1207
−1207
−1207−1207
−1207
−1207
−1206
−1206
−1206
−120
6
−1206
−1206
−1206
−120
6
−1205
−120
5
−1205
−1205−120
4
−1204
−1203
−120
3
F1 F2
17:45:40.0E 41:50:17.0N 1204.5M2005−10−25T15:20:00
Figure 13: Mooring redeployment 2008-10-25. Work done. Points F1,F2 show the ship positionsduring transit to deployment (F2 is the dead-weight drop point). Other red points are site of rangemeasurement for trilateration. Bathymetry by multibeam, this survey
Author F.Bignami et al.ISMAR-ISAC-CNR Interim Technical Cruise Report
23
LON LAT PLANAR ANGLE EAST NORTH MEASURED TIME FIXDDMM.xxx S.V.CORRECTED UTM33 OFFSET UTC FIX1745.552 4150.263 0.0 0.0 0.0 729100.5 4635438.6 0 0 15:10:43 F1 PLAN 085N1745.697 4150.270 0.0 0.0 0.0 729300.7 4635459.6 0 0 15:14:37 F2 DROP 090N1745.471 4150.316 297.1 14.2 1213.0 728984.5 4635534.7 1192 5 15:28:20 R1a 1192 013N1745.591 4149.531 1390.3 49.8 1821.0 729197.3 4634086.6 1794 3 15:48:12 R2a 1794 295N1745.585 4149.541 1373.0 49.4 1807.8 729189.2 4634104.0 1780 4 15:50:02 R2b 1780 324N1745.590 4149.549 1363.6 49.2 1800.7 729194.7 4634119.6 1772 5 15:51:27 R2c 1772 354N1746.512 4150.438 1208.4 45.8 1686.2 730418.5 4635805.6 1659 5 16:05:50 R3a 1659 198N1746.287 4149.926 1076.0 42.5 1594.0 730137.8 4634849.2 1570 3 16:17:03 R4a 1570 252N
Table 8: Deployment navigation data 2008-10-25. Range measurements and angle reduced to1176m (14m Acoustic Release above sea bottom at 1204m, 14m draught of transducer, positionedon point A-Frame ,see 3). Lat/lon data expressed as DDMM.xxxx. Time is UTC.
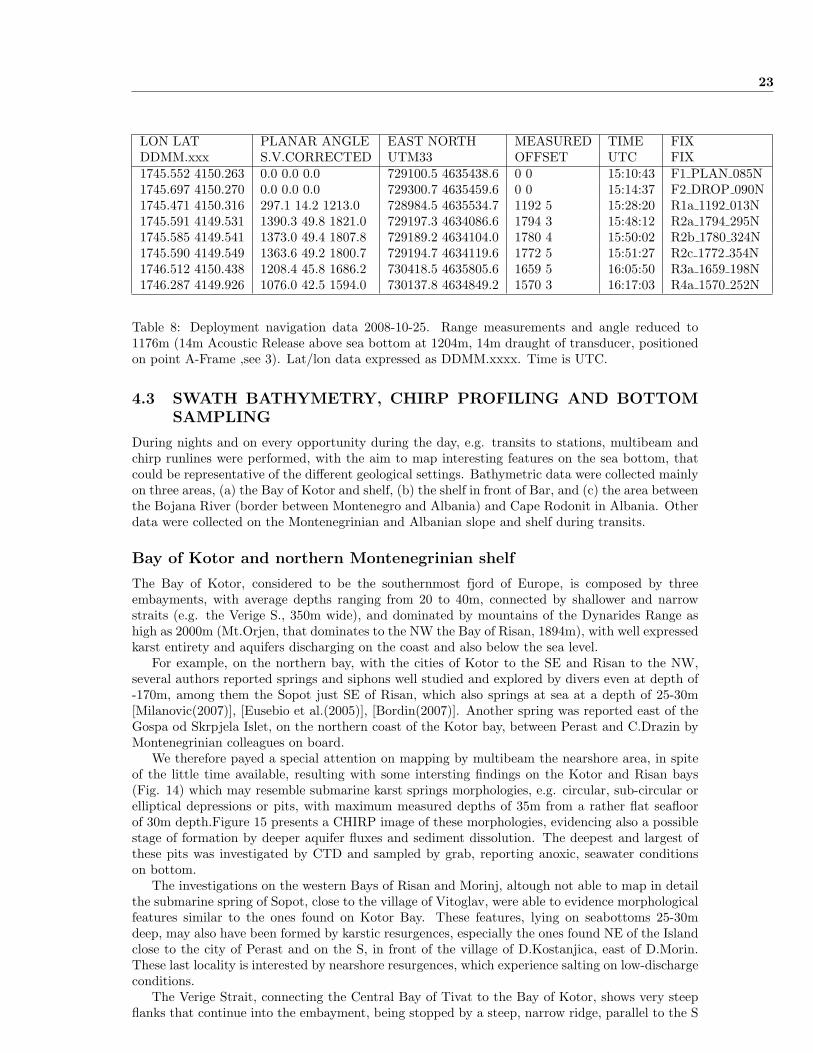
4.3 SWATH BATHYMETRY, CHIRP PROFILING AND BOTTOMSAMPLING
During nights and on every opportunity during the day, e.g. transits to stations, multibeam andchirp runlines were performed, with the aim to map interesting features on the sea bottom, thatcould be representative of the different geological settings. Bathymetric data were collected mainlyon three areas, (a) the Bay of Kotor and shelf, (b) the shelf in front of Bar, and (c) the area betweenthe Bojana River (border between Montenegro and Albania) and Cape Rodonit in Albania. Otherdata were collected on the Montenegrinian and Albanian slope and shelf during transits.
Bay of Kotor and northern Montenegrinian shelf
The Bay of Kotor, considered to be the southernmost fjord of Europe, is composed by threeembayments, with average depths ranging from 20 to 40m, connected by shallower and narrowstraits (e.g. the Verige S., 350m wide), and dominated by mountains of the Dynarides Range ashigh as 2000m (Mt.Orjen, that dominates to the NW the Bay of Risan, 1894m), with well expressedkarst entirety and aquifers discharging on the coast and also below the sea level.
For example, on the northern bay, with the cities of Kotor to the SE and Risan to the NW,several authors reported springs and siphons well studied and explored by divers even at depth of-170m, among them the Sopot just SE of Risan, which also springs at sea at a depth of 25-30m[Milanovic(2007)], [Eusebio et al.(2005)], [Bordin(2007)]. Another spring was reported east of theGospa od Skrpjela Islet, on the northern coast of the Kotor bay, between Perast and C.Drazin byMontenegrinian colleagues on board.
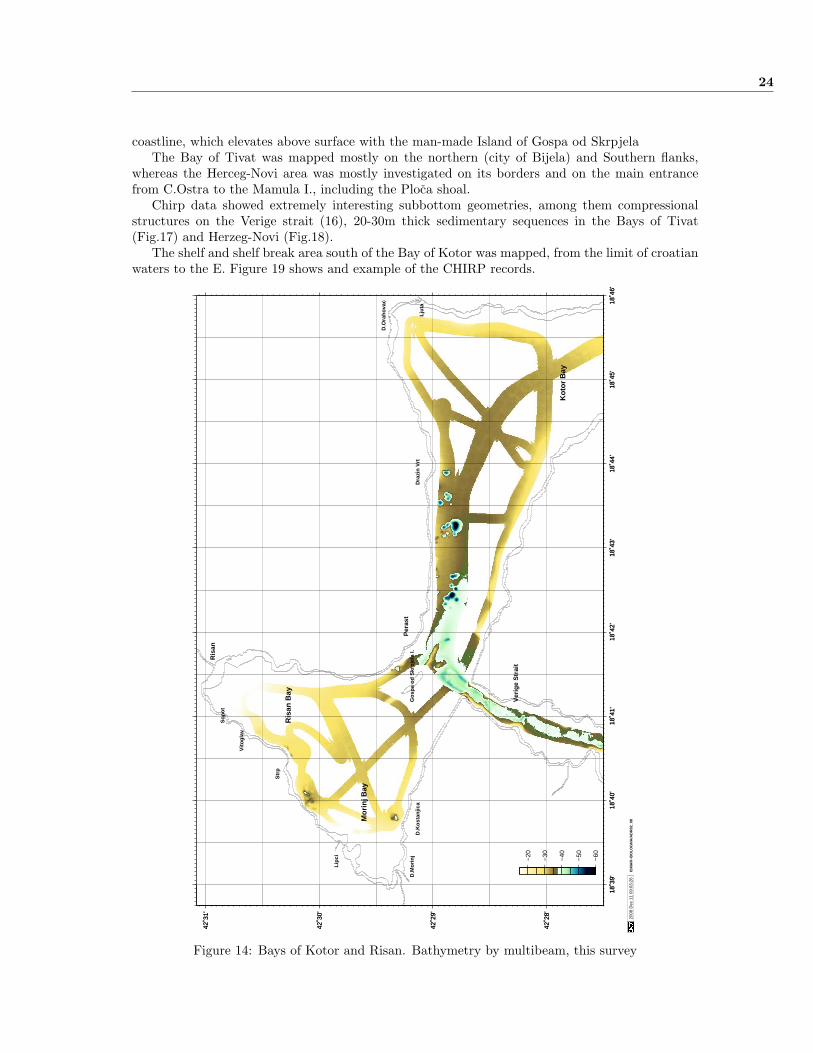
We therefore payed a special attention on mapping by multibeam the nearshore area, in spiteof the little time available, resulting with some intersting findings on the Kotor and Risan bays(Fig. 14) which may resemble submarine karst springs morphologies, e.g. circular, sub-circular orelliptical depressions or pits, with maximum measured depths of 35m from a rather flat seafloorof 30m depth.Figure 15 presents a CHIRP image of these morphologies, evidencing also a possiblestage of formation by deeper aquifer fluxes and sediment dissolution. The deepest and largest ofthese pits was investigated by CTD and sampled by grab, reporting anoxic, seawater conditionson bottom.
The investigations on the western Bays of Risan and Morinj, altough not able to map in detailthe submarine spring of Sopot, close to the village of Vitoglav, were able to evidence morphologicalfeatures similar to the ones found on Kotor Bay. These features, lying on seabottoms 25-30mdeep, may also have been formed by karstic resurgences, especially the ones found NE of the Islandclose to the city of Perast and on the S, in front of the village of D.Kostanjica, east of D.Morin.These last locality is interested by nearshore resurgences, which experience salting on low-dischargeconditions.
The Verige Strait, connecting the Central Bay of Tivat to the Bay of Kotor, shows very steepflanks that continue into the embayment, being stopped by a steep, narrow ridge, parallel to the S
Author F.Bignami et al.ISMAR-ISAC-CNR Interim Technical Cruise Report
24
coastline, which elevates above surface with the man-made Island of Gospa od SkrpjelaThe Bay of Tivat was mapped mostly on the northern (city of Bijela) and Southern flanks,
whereas the Herceg-Novi area was mostly investigated on its borders and on the main entrancefrom C.Ostra to the Mamula I., including the Ploca shoal.
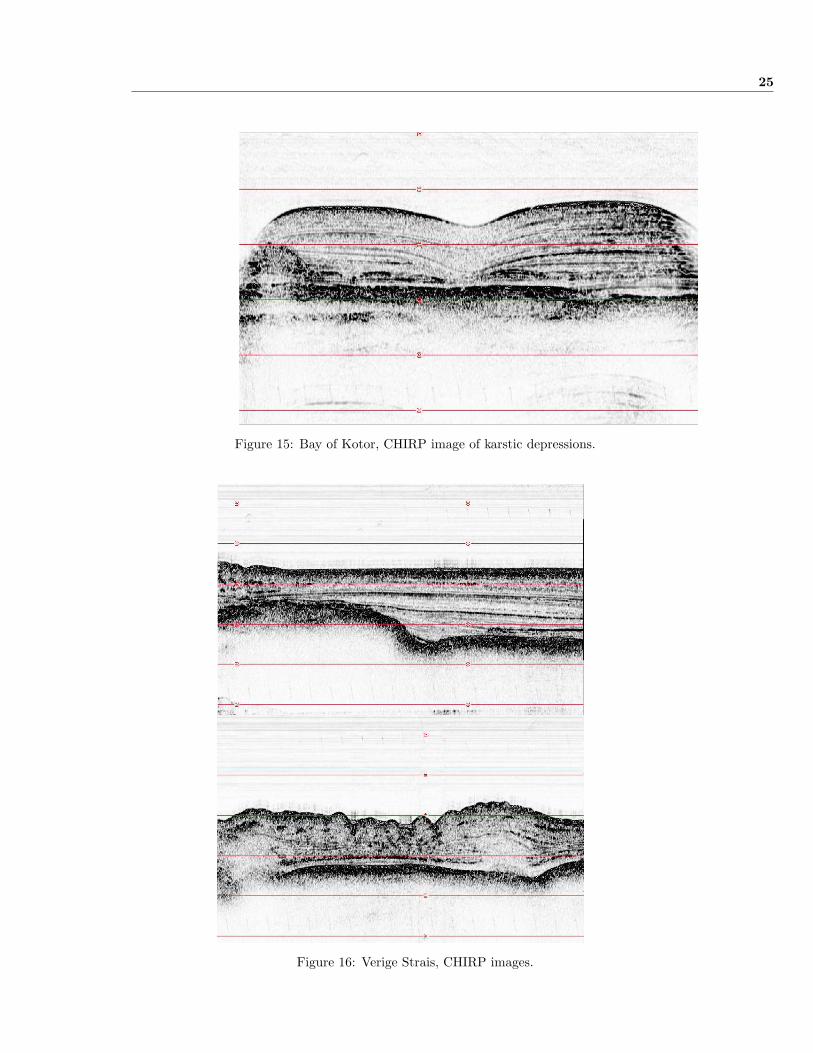
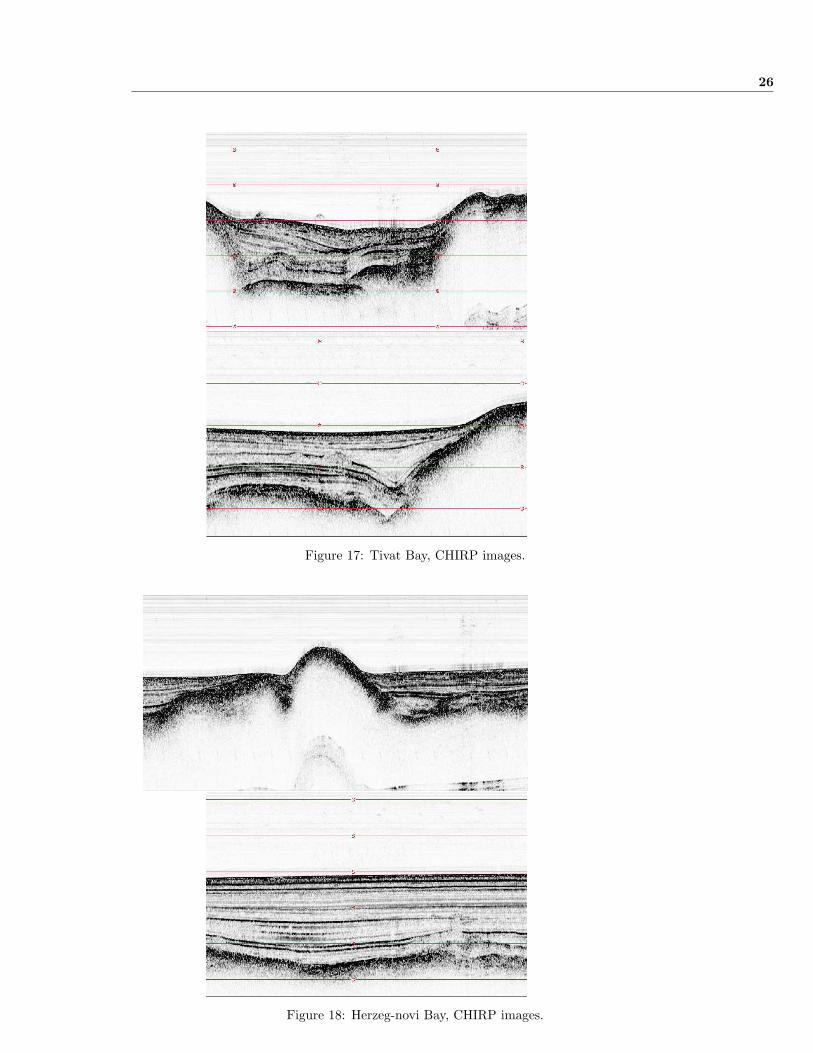
Chirp data showed extremely interesting subbottom geometries, among them compressionalstructures on the Verige strait (16), 20-30m thick sedimentary sequences in the Bays of Tivat(Fig.17) and Herzeg-Novi (Fig.18).
The shelf and shelf break area south of the Bay of Kotor was mapped, from the limit of croatianwaters to the E. Figure 19 shows and example of the CHIRP records.
200
8 D
ec 1
1 09
:03:
26
IS
MA
R−B
OLO
GN
A/A
DR
02_0
8
18˚3
9'18
˚40'
18˚4
1'18
˚42'
18˚4
3'18
˚44'
18˚4
5'18
˚46'
42˚2
8'
42˚2
9'
42˚3
0'
42˚3
1'
18˚3
9'18
˚40'
18˚4
1'18
˚42'
18˚4
3'18
˚44'
18˚4
5'18
˚46'
42˚2
8'
42˚2
9'
42˚3
0'
42˚3
1'
−60
−50
−40
−30
−20
D.M
orin
j
Mor
inj B
ay
Sop
ot
D.K
osta
njic
a
Ris
an
Ris
an B
ay
Vito
glav
Lipc
i
Str
p
Per
ast
Gos
pa o
d S
krpj
ela
I.D
razi
n V
rt
D.O
raho
vac
Kot
or B
ay
Ljut
a
Ver
ige
Str
ait
Figure 14: Bays of Kotor and Risan. Bathymetry by multibeam, this survey
Author F.Bignami et al.ISMAR-ISAC-CNR Interim Technical Cruise Report
25
Figure 15: Bay of Kotor, CHIRP image of karstic depressions.
Figure 16: Verige Strais, CHIRP images.
Author F.Bignami et al.ISMAR-ISAC-CNR Interim Technical Cruise Report
26
Figure 17: Tivat Bay, CHIRP images.
Figure 18: Herzeg-novi Bay, CHIRP images.
Author F.Bignami et al.ISMAR-ISAC-CNR Interim Technical Cruise Report
27
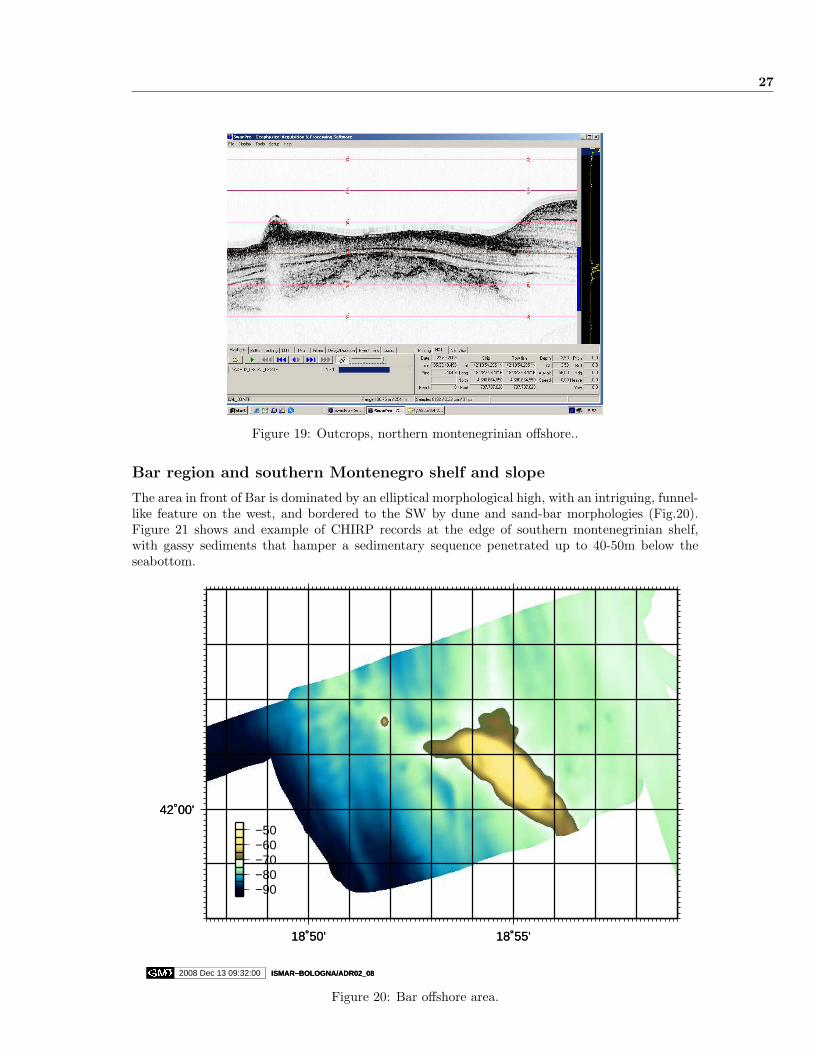
Figure 19: Outcrops, northern montenegrinian offshore..
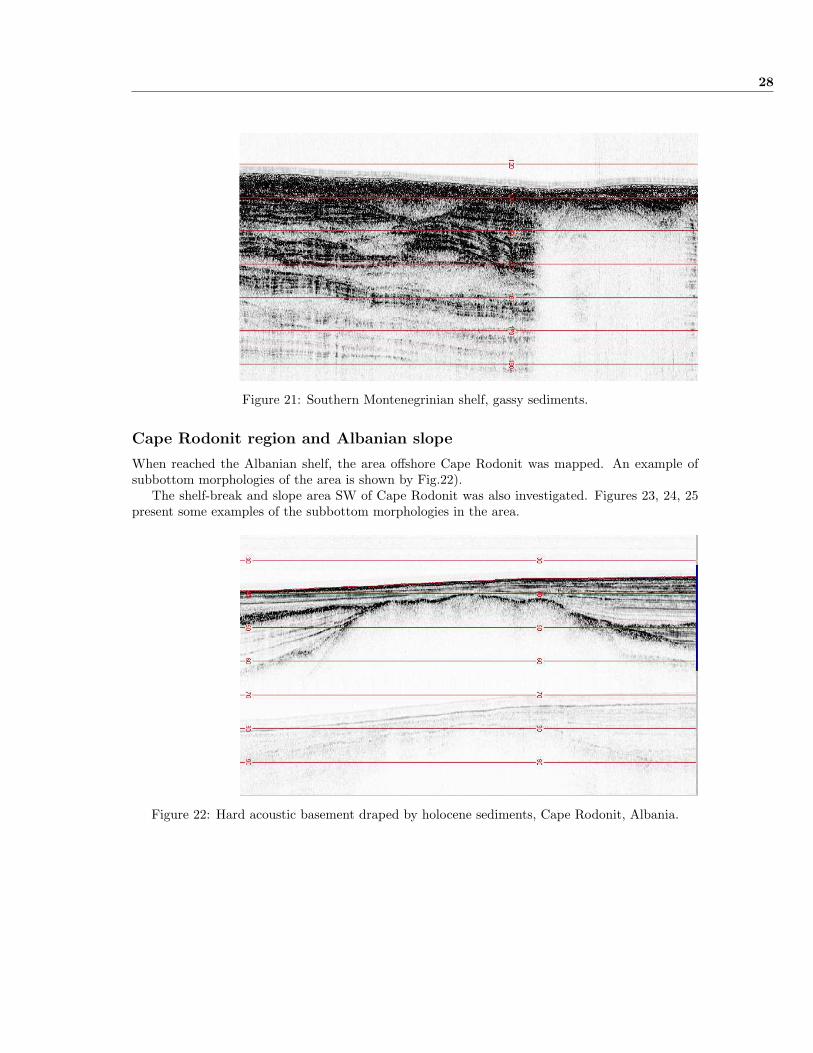
Bar region and southern Montenegro shelf and slope
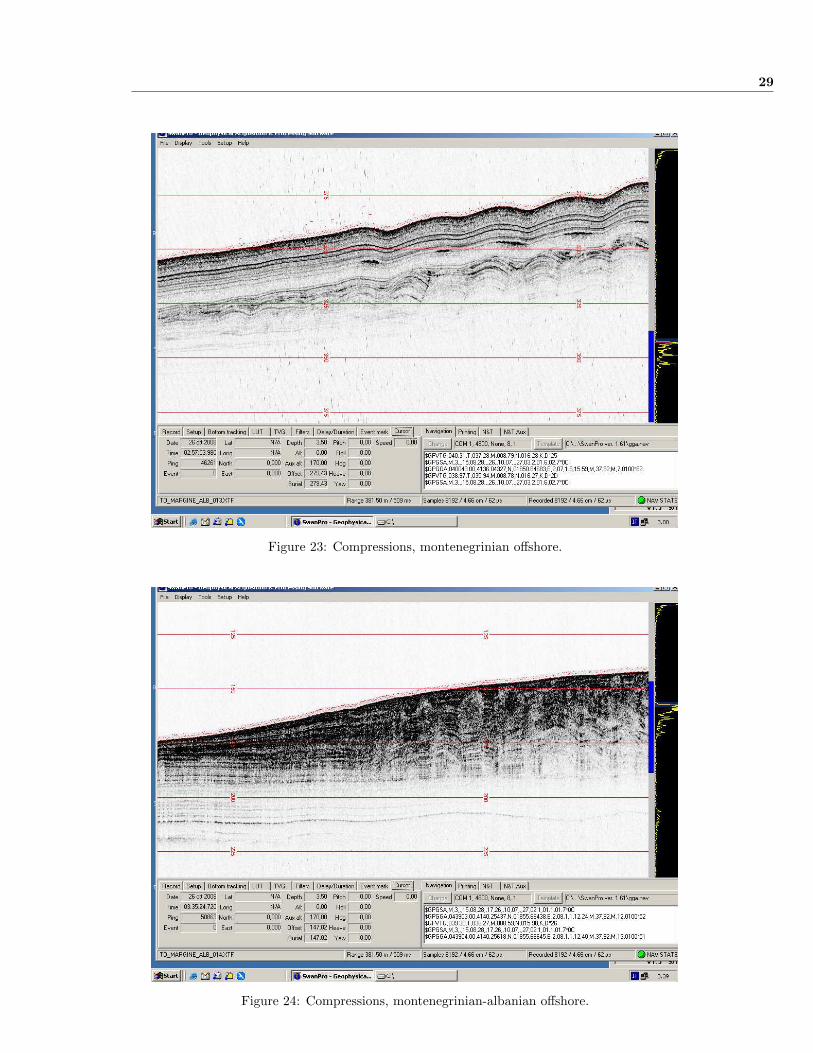
The area in front of Bar is dominated by an elliptical morphological high, with an intriguing, funnel-like feature on the west, and bordered to the SW by dune and sand-bar morphologies (Fig.20).Figure 21 shows and example of CHIRP records at the edge of southern montenegrinian shelf,with gassy sediments that hamper a sedimentary sequence penetrated up to 40-50m below theseabottom.
2008 Dec 13 09:32:00 ISMAR−BOLOGNA/ADR02_08
18˚50' 18˚55'
42˚00'
2008 Dec 13 09:32:00 ISMAR−BOLOGNA/ADR02_08
18˚50' 18˚55'
42˚00'
−90−80−70−60−50
Figure 20: Bar offshore area.
Author F.Bignami et al.ISMAR-ISAC-CNR Interim Technical Cruise Report
28
Figure 21: Southern Montenegrinian shelf, gassy sediments.
Cape Rodonit region and Albanian slope
When reached the Albanian shelf, the area offshore Cape Rodonit was mapped. An example ofsubbottom morphologies of the area is shown by Fig.22).
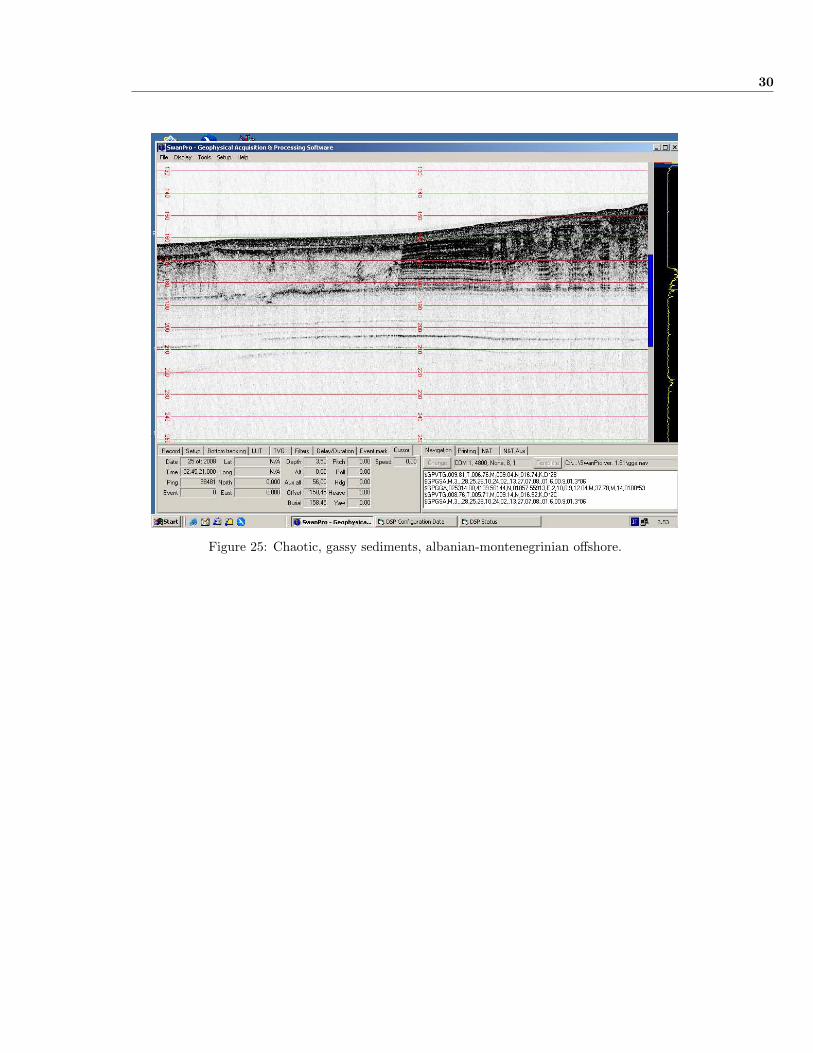
The shelf-break and slope area SW of Cape Rodonit was also investigated. Figures 23, 24, 25present some examples of the subbottom morphologies in the area.
Figure 22: Hard acoustic basement draped by holocene sediments, Cape Rodonit, Albania.
Author F.Bignami et al.ISMAR-ISAC-CNR Interim Technical Cruise Report
29
Figure 23: Compressions, montenegrinian offshore.
Figure 24: Compressions, montenegrinian-albanian offshore.
Author F.Bignami et al.ISMAR-ISAC-CNR Interim Technical Cruise Report
30
Figure 25: Chaotic, gassy sediments, albanian-montenegrinian offshore.
Author F.Bignami et al.ISMAR-ISAC-CNR Interim Technical Cruise Report

31
5 CONCLUSIONS
During the 12 days of cruise ADR0808, including transits and port calls, we obtained:
� measurements of the water column on 77 CTD stations,
� sampling of seawater on a great percentage of the CTD stations
� 26 Hyperspectral profiles and launches of experimental XBT.
� sampling of the sea bottom on 11 stations
� aproximately 200KM2 of swath bathymetry, 2600 KM of high resolution SBP profiles and ofsingle beam bathymetry
The collected physical, bio-geochemical and optical oceanographic data will be useful to study-ing and modelling of the Adriatic circulation, also by mean of the in-situ calibration of satellite-borne instrumentation data.
Several morphological features were revealed by the swath bathymetry and Chirp SBP mapping,providing good chances to further explore, finalize and better detail a very interesting marine area.
Analysis of the data collected during the expedition is under process, and will continue duringthe forthcoming several months.
No problems were encountered regarding neither the people nor the environment during thecruise.
References
[Aliaj et al. (2004)] Aliaj Shyqyri,John Adams, Stephen Halchuk, Eduard Sulstarova, VeronikaPeci, Betim Muco, Probabilistic seismic hazard maps for Albania, 2004, 13th World Conferenceon Earthquake Engineering, Vancouver, B.C., Canada, August 1-6, 2004, Paper No. 2469.
[Aliaj (2008)] Aliaj Shyqyri, The Albanian Orogen: convergence Zone between Eurasia and theAdria microplate, 2008, in The Adria Microplate: GPS Geodesy, Tectonics and Hazards,N.Pinter, G.Gyula, S.Stein and D.Medak eds, NATO Science Series, IY, Earth and Environ-mental Sc., Vol.61, Springer.
[Argnani et al.(2006)] Argnani A., Bonazzi C. and Rovere M., Tectonics and large-scale mass wast-ing along the slope of the southern Adriatic basin, 2006, Geophysical Research Abstracts, Vol.8, 07261, 2006 SRef-ID: 1607-7962/gra/EGU06-A-07261.
[Becker et al.(2008)] J.J.Becker, D.T.Sandwell, W H.F.Smith, J.Braud, B.Binder, J.Depner,D.Fabre, J.Factor, S.Ingalls, S-H.Kim, R.Ladner, K.Marks, S Nelson, A Pharaoh,G.Sharman,R.Trimmer, J.VonRosenburg, G.Wallace, P.Weatherall, Global Bathymetry and Ele-vation Data at 30 Arc Seconds Resolution: SRTM30 PLUS, 2008, (topex.ucsd.edu),www.becker.com/papers/SRTM30 8.pdf.
[Bergamasco and Gacic (1996)] Bergamasco, A. and M. Gacic, Baroclinic response of the AdriaticSea to an episode of bora wind, 1996, J. Phys. Oceanogr., 26, 1354-1369.
[Bignami et al. (1990)] Bignami, F., E. Salusti and S. Schiarini, Observations on a bottom wein ofdense water in the southern Adriatic and Ionian Seas, 1990, J. Geophys. Res., 95, 7249-7259.
[Boore et al.(1981)] D.M. Boore,J.D.Sims, H.Kanamori and S.Harding, The Montenegro, Yu-goslavia, earthquake of April 15, 1979: source orientation and strength, 1981, Physics ofthe Earth and Planetary Interiors, 27, 133-142.
[Bordin(2007)] R.Bordin, Speleosub in Montenegro, 2007. www.ilsubacqueo.it/grotte/speleosub-in-montenegro.
[Console and Favali(1981)] Console, R. and Favali, P., Study of the Montenegro earthquake se-quence (March-July 1979), 1981, Bull.Seismol.Soc.Am., 71: 1233-1248.
Author F.Bignami et al.ISMAR-ISAC-CNR Interim Technical Cruise Report
REFERENCES 32
[Eusebio et al.(2005)] Eusebio A., Bordin R., Jarre R. , G Minciotti, CRNA GORA 2005 speleo-sub in . Montenegro, 2005. Speleologia ? Riv. Soc. Spel. It. Anno XXVI- Giugno 2005.
[Fleury et al.(2007)] P.Fleury. M.Bakalowicz and G.de Marsily, Submarine springs and coastalkarst aquifers: a review, 2007, J.of Hydrology, 339, 79-92.
[Gasperini and Stanghellini(2008)] L.Gasperini and G.Stanghellini, SEISPRO: an interactive com-puter program for processing and interpretation of high-resolution seismic reflection profiles,2008, in press, Computer and Geosciences.
[Malanotte-Rizzoli (1991)] Malanotte-Rizzoli, P., The Northern Adriatic Sea as a prototype ofconvection and water mass formation on the continental shelf, 1991, Deep Convections andDeep Water Formation in the Oceans, P.C. Chu and J.C. Gascard, eds., Elsevier OceanographySeries, 57, 229-239.
[Milanovic(2007)] S.Milanovich,Hydrogeological Characteristics of some deep siphonal springs inSerbia and Montenegro karst, 2007. Environ.Geol., 51, 755-759.
[Pondrelli et al.(2006)] Pondrelli, S., S. Salimbeni, G. Ekstrm, A. Morelli, P. Gasperini and G.Vannucci, 2006, The Italian CMT dataset from 1977 to the present, Phys. Earth Planet. Int.,doi:10.1016/j.pepi.2006.07.008,159/3-4, pp. 286-303.
[Ovchinnikov et al. (1985)] Ovchinnikov, I. M., V. I. Zats, V. G. Krivosheya and A. I. Idodov, Theformation of deep Eastern Mediterranean Waters in the Adriatic Sea, 1985, Okeanologija, 25,911-917. English translation: Oceanology, 25, 704-707.
[Roure et al.(2004)] Roure F., Nazaj S., Mushka K., Fili I., Cadet J.-P. and Bonneau M.,Kinematicevolution and petroleoum systems - an appraisal of the Outer Albanides, 2004, In:K.R.McClay, Thrust tectonics and hydrocarbon systems. AAPG Mem., 82, 474-493.
[Schlitzer(2004)] Schlitzer, R., Ocean Data View, 2004, odv.awi-bremerhaven.de.
[Tiberti et al.(2008)] M. M. Tiberti, S. Lorito, R. Basili, V. Kastelic, A. Piatanesi and G. Valensise,Scenarios of earthquake-generated tsunamis in the Adriatic Sea, 2008, Submitted, Pure andApplied Geophysics, Topical Issue on Tsunamis.
[Wessel and Smith (1995)] Wessel P. and Smith W.H.F., New version of the Generic MappingToolreleased, EOS Trans. AGU, p.329, 1995.
Author F.Bignami et al.ISMAR-ISAC-CNR Interim Technical Cruise Report
33
6 APPENDIX
6.1 DIARY OF OPERATIONS
� 17/10/2008
– 05:30h - 17:00h UTC: In Bari harbour; customs operations, equipment loading, laboratory andinstrumentation setup.
– 17:00h UTC: Leave Bari harbour, steam towards Station 001, located SE of the Garganopromomtory. Gargano - Bar transect.
– 19:31h UTC: Sta. 1, CTD adr02 001, 41°28.76’ N, 16°46.90’ E, bottom 112 m. Gargano - Bartransect. Samples: UNITUS: chl. ISMAR: O2, nuts.
– 21:45h UTC: Sta. 2, CTD adr02 002, 41°34.16’ N, 17°06.36’ E, bottom 460 m. Gargano - Bartransect. Samples: UNITUS: chl. ISMAR: O2, nuts.
� 18/10/2008
– 00:05h UTC: Sta. 3, CTD adr02 006, 41°39.14’ N, 17°25.60’ E, bottom 1140 m. Gargano - Bartransect. Samples: O2, nuts ISMAR.
– 04:30h UTC: sta. 4, OGS MOORING RECOVERY - start operations. 41°50.265’ N 17°45.373’E, bottom 1204.6 m.
– 07:00h UTC: sta. 4, OGS MOORING RECOVERY - end operations. 41°50.265’ N 17°45.373’E.
– 07:36h UTC: Sta. 4, CTD adr02 004, 41°50.36’ N, 17°45.34’ E, bottom 1204.6 m. Gargano- Bar transect. Samples: UNITUS: chl, TSM and TFLAP 651 and 652 launched but launchfailed in that data transmission was interrupted sortly after launch. ISMAR: O2, nuts, CDOM;OGS: salinity.
– 14:50h UTC: Sta. 5, CTD adr02 005, 41°49.61’ N, 18°04.26’ E, bottom 1217 m. Gargano - Bartransect. Samples: UNITUS: chl, TSM; ISMAR: O2, nuts, CDOM ; OGS: salinity.
– 18:08h UTC: Sta. 6, CTD adr02 006, 41°54.72’ N, 18°23.67’ E, bottom 705 m. Gargano - Bartransect. Samples: UNITUS: chl ISMAR: O2, nuts.
– 20:33h UTC: Sta. 7, CTD adr02 007, 41°59.84’ N, 18°42.90’ E, bottom 140 m. Gargano - Bartransect. Samples: UNITUS: chl.; ISMAR: O2, nuts.
– 22:30h UTC: Sta. 8, CTD adr02 008, 42°03.71’ N, 18°57.37’ E, bottom 72 m. End Gargano -Bar transect. Samples: UNITUS: chl. ISMAR: O2, nuts.
� 19/10/2008
– 07:10h UTC: weigh anchor outside Bar port. Montenegrin colleagues boarding and Dr. Mise-rocchi disembarking, using maritime agent’s pilot launch.
– 08:35h UTC: leave Bar to station adr02 009 (Bojana River transect).
– 09:33h UTC: DRY CTD adr02 p tr fl off, 41°54.57’ N, 19°10.27’ E, bottom 57.8 m. CTD forpressure, transmissometer and fluorimeter offsets and other coefficients determination.
– 10:41h UTC: Sta. 9, CTD adr02 009, 41°51.60’ N, 19°18.50’ E, bottom 17.8 m. (BojanaRiver transect, sta. 4-1 on ADRICOSM maps). Samples: UNITUS: chl, TSM; ISMAR: O2,nuts, CDOM; IMBK: nuts, sfc nuts sonde, sed. Rosette, bacteriology, phytoplankton OGS,phytoplankton.
– 11:27h UTC: Sta. 9, GRAB GR01 (sta. ADRICOSM 4-1), 41°51.62’ N, 19°18.54’ E, bottom 17m (Bojana River transect, ADRICOSM sta. 4-1). Samples: ISMAR: granulometry, pollutants;IMBK: heavy metals, PAH, sedimentology.
– 12:51h UTC: AFTER CTD adr02 009, we dismount secondary O2 (ISAC sensor s/n 0078) tomount PAR (Urania sensor s/n ), because SATLANTIC pressure sensor continues not to work.NEW .CON FILE: ADR2 PAR SPAR.CON, starting next CTD (adr02 011).
– 12:26h UTC: Sta. 10, CTD adr02 010, 41°49.36’ N, 19°16.76’ E, bottom 51 m. (Bojana Rivertransect, ADRICOSM sta. 4-2). Samples: UNITUS: chl, TSM; ISMAR: nuts, CDOM. NOTE:THIS CTD WITH NEW .CON FILE ADR2 PAR SPAR.CON.
– 13:45h UTC: Sta. 11, CTD adr02 011, 41°47.12’ N, 19°14.17’ E, bottom 75 m. (Bojana Rivertransect, ADRICOSM sta. 4-3). Samples: UNITUS: chl, TSM; ISMAR: O2, nuts, CDOM.
Author F.Bignami et al.ISMAR-ISAC-CNR Interim Technical Cruise Report
34
– 14:50h UTC: Sta. 12, CTD adr02 012, 41°44.06’ N, 19°10.72’ E, bottom 86 m. (ADRICOSMsta. 4-4). Samples: UNITUS: chl; ISMAR: nuts; IMBK: phytoplankton OGS, phytoplanktonIMBK.
– 15:45h UTC: Sta. 13, CTD adr02 013, 41°40.97’ N, 19°07.08’ E, bottom 98.7 m. (ADRICOSMsta. 4-5). Samples: UNITUS: chl; ISMAR: O2, nuts.
– 17:05h UTC: Sta. 14, CTD adr02 014, 41°37.96’ N, 19°03.75’ E, bottom 132 m. (ADRICOSMsta. 4-6). Samples: UNITUS: chl; ISMAR: nuts.
– 18:25h UTC: Sta. 15, CTD adr02 015, 41°35.12’ N, 19°00.45’ E, bottom 159 m. (ADRICOSMsta. 4-7). Samples: UNITUS: chl; ISMAR: O2, nuts. IMBK: phytoplankton OGS, phytoplank-ton; OGS: salinity.
– 19:00h UTC: Multibeam/chirp until next station in the morning.
� 20/10/2008
– 06:25h UTC: Sta. 16, CTD adr02 016, 41°54.31’ N, 19°13.74’ E, bottom 10 m. (MEDPOL sta.new EU9). Samples: ISMAR: nuts; IMBK: nuts, sfc nuts sonde, sed. Rosette, bacteriology,phytoplankton OGS, phytoplankton IMBK, PAH, total hydrocarbons, heavy metals.
– 06:44h UTC: Sta. 16, GRAB GR02, 41°54.34’ N, 19°13.60’ E, bottom 10 m (MEDPOL sta.EU9). Samples: ISMAR: granulometry, pollutants; IMBK: heavy metals, PAH, sedimentology.
– 07:25h UTC: Sta. 17, CTD adr02 017, 41°57.93’ N, 19°08.40’ E, bottom 19 m. (ADRICOSMsta. 3-1). Samples: UNITUS: chl, TSM; ISMAR: nuts, CDOM; IMBK: nuts, sfc nuts sonde,sed. Rosette, bacteriology, phytoplankton OGS, phytoplankton IMBK.
– 07:49h UTC: Sta. 17, GRAB GR03, 41°57.97’ N, 19°08.41’ E, bottom 19 m (ADRICOSM sta.3-1). Samples: ISMAR: granulometry, pollutants; IMBK: heavy metals, PAH, sedimentology.
– 08:24h UTC: Sta. 18, CTD adr02 018, 41°55.61’ N, 19°05.79’ E, bottom 67.2 m. (ADRICOSMsta. 3-2). Samples: UNITUS: chl, TSM; ISMAR: O2, nuts, CDOM.
– 09:00h UTC: Sta. 18, SATLANTIC ADR02 2008 10-20 S018, 41°55.76’ N, 19°05.57’ E, bottom60 m. (ADRICOSM sta. 3-2). Profile taken to approx. 20 m, counting time during descent (psensor not working). 1 min free fall.
– 09:58h UTC: Sta. 19, CTD adr02 019, 41°54.19’ N, 19°03.67’ E, bottom 79 m. (ADRICOSMsta. 3-3). Samples: UNITUS: chl, TSM; ISMAR: nuts, CDOM.
– 10::03h UTC: Sta. 19, SATLANTIC ADR02 2008 10-20 S019, 41°54.06’ N, 19°03.80’ E, bottom79.5 m. (ADRICOSM sta. 3-3). 1 min free fall.
– 11:38h UTC: Sta. 20, CTD adr02 020, 41°49.32’ N, 19°16.84’ E, bottom 51 m. (ADRICOSMsta. 4-2). Samples: UNITUS: chl, TSM; ISMAR: O2, nuts, CDOM. NOTE: this station isrepeated today so to have CTD and SATLANTIC off Bojana river mouth. We do not repeatsta. 4-1 because too shallow to be safe with ”pressure blind” SATLANTIC.
– 11:54h UTC: Sta. 20, SATLANTIC ADR02 2008 10-20 S020, 41°49.32’ N, 19°16.77’ E, bottom51 m. (ADRICOSM sta. 4-2). 1 min free fall.
– 14:08h UTC: Sta. 21, SATLANTIC ADR02 2008 10-20 S021, 41°44.29’ N, 18°52.43’ E, bottom129 m. (ADRICOSM sta. 3-6). 1 min free fall. NOTE: Dr. E. Vellucci of Obs. Oceanologie ofVillefranche-sur-mer (France) suggested from now on to carry out one free-fall profile and onesurface acquisition (probe mounting float), which is what we’ll do.
– 14:25h UTC: Sta. 21, SATLANTIC ADR02 2008 10-20 S021 sup, 41°44.33’ N, 18°52.42’ E,bottom 129 m. (ADRICOSM sta. 3-6). 2 min acquisition with probe floating on sfc.
– 14:37h UTC: Sta. 21, CTD adr02 021, 41°44.33’ N, 18°52.54’ E, bottom 129 m. (ADRICOSMsta. 3-6). Samples: UNITUS: chl, TSM; ISMAR: nuts, CDOM.
– Transit to station 22 (ADRICOSM sta. 3-9, offshore end of ADRICOSM transect 3) withMULTIBEAM/CHIRP track.
– 16:51h UTC: Sta. 22, CTD adr02 022, 41°35.28’ N, 18°41.87’ E, bottom 467 m. (ADRICOSMsta. 3-9). Samples: UNITUS: chl; ISMAR: O2, nuts; OGS: salinity. NOTE: spike in primaryT and C sensors at 440 m during down cast. T and C values now at 99. �C or S/m. Spikealso on O2 sensor which settles around 2 ml/l incorrect value. Sensors do not recover duringupcast. Techs work on CTD. C sensor cable changed. Trial OK; OGS: salinity.
– 19:43h UTC: Sta. 23, CTD adr02 023, 41°38.37’ N, 18°44.97’ E, bottom 322.4 m. (ADRICOSMsta. 3-8). Samples: ISMAR: nuts.
Author F.Bignami et al.ISMAR-ISAC-CNR Interim Technical Cruise Report
35
– 20:37h UTC: Sta. 24, CTD adr02 024, 41°41.25’ N, 18°48.98’ E, bottom 193 m. (ADRICOSMsta. 3-7). Samples: ISMAR: nuts.
– 20:37h UTC: we opened SATLANTIC lower external casing so to expose pressure sensor (DruckPMP 4010 s/n 2248481) and wiring. Checked wiring, no damage encountered. Cleaned contactsand reassembled lower casing. We will try pressure sensor functionality tomorrow morning.Servicing operation above was authorized via e-mail by Dr. Maurizio Ribera D’Alcala’ who isin charge of instrument owned by SZN Naples.
– 21:51h UTC: Sta. 25, CTD adr02 025, 41°47.21’ N, 18°56.01’ E, bottom 102 m. (ADRICOSMsta. 3-5. Sta. 3-6 was done earlier this afternoon). Samples: ISMAR: nuts.
– 22:48h UTC: Sta. 26, CTD adr02 026, 41°50.31’ N, 18°59.57’ E, bottom 93 m. (ADRICOSMsta. 3-4). No samples.
– 22:48h UTC: start MULTIBEAM/CHIRP operations for the night. Next station planned:MEDPOL station EU4 to be started out at 0530 UTC.
– 21/10/2008
* 05:48h UTC: Sta. 27, CTD adr02 027, 42°05.64’ N, 19°03.01’ E, bottom 47 m. (MED-POL station EU4). Samples: ISMAR: nuts; IMBK: nuts, sfc nuts sonde, sed. Rosette,bacteriology, phytoplankton OGS, phytoplankton.
* 06:04h UTC: Sta. 27, GRAB GR04, 42°05.64’ N, 19°03.01’ E, bottom 47 m (MEDPOLstation EU4). Samples: ISMAR: granulometry, pollutants; IMBK: heavy metals, PAH,sedimentology.
* 07:26h UTC: Sta. 28, CTD adr02 028, 42°14.16’ N, 18°53.33’ E, bottom 35 m. (ADRI-COSM station 2-1). Samples: UNITUS: chl, TSM; ISMAR: O2, nuts, CDOM; IMBK:phytoplankton OGS, phytoplankton.
* 07:45h UTC: Sta. 28, SATLANTIC ADR02 2008 10-20 S028, 42°14.33’ N, 18°53.20’ E,bottom 36.8 m. (ADRICOSM sta. 2-1). 1:36 min free fall. NOTE: forgot to compilestation header in SATVIEW.
* 08:29h UTC: Sta. 29, SATLANTIC ADR02 2008 10-20 S029, 42°12.25’ N, 18°50.92’ E,bottom 80 m. (ADRICOSM sta. 2-2). 2 min free fall. NOTE: colleagues in ISAC Romesuggest tot o one SATLANTIC profile, 1 CTD, 1 SATLANTIC profile from now on in eachoptical station. We proceed this way.
* 08:38h UTC: Sta. 29, CTD adr02 029, 42°12.36’ N, 18°50.78’ E, bottom 80.9 m. (ADRI-COSM station 2-2). Samples: UNITUS: chl, TSM; ISMAR: nuts, CDOM.
* 08:54h UTC: Sta. 29, SATLANTIC ADR02 2008 10-20 S029b (second profile), 42°12.45’N, 18°50.69’ E, bottom 80.7 m. (ADRICOSM sta. 2-2). 2 min free fall.
* 09:30h UTC: Sta. 30, SATLANTIC ADR02 2008 10-20 S030, 42°09.96’ N, 18°48.55’ E,bottom 91 m. (ADRICOSM sta. 2-3). 2 min free fall. NOTE: we activated SATVIEWSATLANTIC PAR vs. T profile display so as to be able to estimate max depth reachedby SATLANTIC via CTD T vs. P profile. Deepest SATLANTIC T = 17.48 �C.
* 09:40h UTC: Sta. 30, CTD adr02 030, 42°10.09’ N, 18°48.37’ E, bottom 92.2 m. (ADRI-COSM station 2-3). Samples: UNITUS: chl, TSM; ISMAR: O2, nuts, CDOM.
* 09:58h UTC: Sta. 30, SATLANTIC ADR02 2008 10-20 S030b (second profile), 42°10.12’N, 18°48.29’ E, bottom 92.5 m. (ADRICOSM sta. 2-3). 2 min free fall. Deepest SAT-LANTIC T = 17.54 �C.
* 10:40h UTC: Sta. 31, CTD adr02 031, 42°06.86’ N, 18°45.02’ E, bottom 111.5 m. (ADRI-COSM station 2-4). Samples: UNITUS: chl, TSM; ISMAR: nuts.
* 11:27h UTC: Sta. 32, SATLANTIC ADR02 2008 10-20 S032, 42°03.87’ N, 18°41.36’ E,bottom 134 m. (ADRICOSM sta. 2-5). 2 min free fall. Deepest SATLANTIC T = 19.79�C.
* 11:34h UTC: Sta. 32, CTD adr02 032, 42°03.95’ N, 18°41.31’ E, bottom 134.7 m. (ADRI-COSM station 2-5). Samples: UNITUS: chl, TSM; ISMAR: O2, nuts, CDOM; IMBK:phytoplankton OGS.
* 11:59h UTC: Sta. 32, SATLANTIC ADR02 2008 10-20 S032b, 42°04.00’ N, 18°41.39’ E,bottom 134 m. (ADRICOSM sta. 2-5). 2 min free fall. Deepest SATLANTIC T = 19.78�C.
* 13:09h UTC: Sta. 33, CTD adr02 033, 42°00.89’ N, 18°37.59’ E, bottom 174.2 m. (ADRI-COSM station 2-6). Samples: UNITUS: chl; ISMAR: nuts.
Author F.Bignami et al.ISMAR-ISAC-CNR Interim Technical Cruise Report
36
* 14:13h UTC: Sta. 34, SATLANTIC ADR02 2008 10-20 S034, 41°57.76’ N, 18°34.10’ E,bottom 211.7 m. (ADRICOSM sta. 2-7). 2 min free fall. Deepest SATLANTIC T = 16.86�C.
* 14:18h UTC: Sta. 34, CTD adr02 034, 41°57.97’ N, 18°34.28’ E, bottom 210 m. (ADRI-COSM station 2-7). Samples: UNITUS: chl, TSM; ISMAR: O2, nuts, CDOM.
* 14:48h UTC: Sta. 34, SATLANTIC ADR02 2008 10-20 S034b, 41°57.85’ N, 18°34.57’ E,bottom 208 m. (ADRICOSM sta. 2-7). 2 min free fall. Deepest SATLANTIC T = 16.70�C.
* 15:45h UTC: Sta. 35, CTD adr02 035, 41°54.79’ N, 18°30.43’ E, bottom 309 m. (ADRI-COSM station 2-8). Samples: UNITUS: chl; ISMAR: nuts; IMBK: phytoplankton OGS;OGS: salinity.
– 22/10/2008
– 06:34h UTC: Sta. 36, CTD adr02 036, 42°03.16’ N, 18°22.54’ E, bottom 517 m. (ADRICOSMstation 1-7). Samples: UNITUS: chl; ISMAR: nuts; IMBK: phytoplankton OGS; OGS: salinity.
– 07:30h UTC: Sta. 37, SATLANTIC ADR02 2008 10-20 S037, 42°06.89’ N, 18°24.13’ E, bottom395 m. (ADRICOSM sta. 1-6).
– 07:37h UTC: Sta. 37, CTD adr02 037, 42°07.13’ N, 18°23.82’ E, bottom 397 m. (ADRICOSMstation 1-6). Samples: UNITUS: chl, TSM; ISMAR: O2, nuts, CDOM.
– 08:05h UTC: Sta. 37, SATLANTIC ADR02 2008 10-20 S037b, 42°07.21’ N, 18°23.85’ E, bot-tom 396 m. (ADRICOSM sta. 1-6).
– 08:46h UTC: Sta. 38, CTD adr02 038, 42°10.67’ N, 18°25.97’ E, bottom 280 m. (ADRICOSMstation 1-5). Samples: UNITUS: chl; ISMAR: nuts..
– 09:35h UTC: Sta. 39, SATLANTIC ADR02 2008 10-20 S039, 42°14.50’ N, 18°27.77’ E, bottom205 m. (ADRICOSM sta. 1-4).
– 09:50h UTC: Sta. 39, CTD adr02 039, 42°14.70’ N, 18°27.61’ E, bottom 205 m. (ADRICOSMstation 1-4). Samples: UNITUS: chl, TSM; ISMAR: O2, nuts, CDOM; IMBK: phytoplanktonOGS.
– 10:13h UTC: Sta. 39, SATLANTIC ADR02 2008 10-20 S039b, 42°14.77’ N, 18°27.45’ E, bot-tom 206 m. (ADRICOSM sta. 1-4).
– 10:52h UTC: Sta. 40, SATLANTIC ADR02 2008 10-20 S040, 42°17.71’ N, 18°29.38’ E, bottom164 m. (ADRICOSM sta. 1-3).
– 11:04h UTC: Sta. 40, CTD adr02 040, 42°17.85’ N, 18°29.26’ E, bottom 154 m. (ADRICOSMstation 1-3). Samples: UNITUS: chl, TSM; ISMAR: nuts, CDOM.
– 11:22h UTC: Sta. 40, SATLANTIC ADR02 2008 10-20 S040b, 42°17.93’ N, 18°29.26’ E, bot-tom 142 m. (ADRICOSM sta. 1-3).
– 12:10h UTC: Sta. 41, SATLANTIC ADR02 2008 10-20 S041, 42°20.64’ N, 18°31.16’ E, bottom128 m. (ADRICOSM sta. 1-2).
– 12:21h UTC: Sta. 41, CTD adr02 041, 42°20.75’ N, 18°31.48’ E, bottom 128.5 m. (ADRICOSMstation 1-2). Samples: UNITUS: chl, TSM; ISMAR: nuts, CDOM.
– 12:38h UTC: Sta. 41, SATLANTIC ADR02 2008 10-20 S041b, 42°20.79’ N, 18°31.55’ E, bot-tom 126 m. (ADRICOSM sta. 1-2).
– 13:10h UTC: Sta. 42, SATLANTIC ADR02 2008 10-20 S042, 42°23.39’ N, 18°32.64’ E, bottom68.8 m. (ADRICOSM sta. 1-1).
– 13:241h UTC: Sta. 42, CTD adr02 042, 42°23.51’ N, 18°32.72’ E, bottom 63.8 m. (ADRICOSMstation 1-1). Samples: UNITUS: chl, TSM; ISMAR: O2, nuts, CDOM; IMBK: nuts, sfc nutssonde, sed. Rosette, bacteriology, phytoplankton OGS, phytoplankton.
– 13:37h UTC: Sta. 42, SATLANTIC ADR02 2008 10-20 S042b, 42°23.49’ N, 18°32.81’ E, bot-tom 63.2 m. (ADRICOSM sta. 1-1).
– 13:58h UTC: Sta. 42, GRAB GR05, 42°23.72’ N, 18°32.88’ E, bottom 63 m (ADRICOSMstation 1-1). Samples: ISMAR: granulometry, pollutants; IMBK: heavy metals, PAH, sedi-mentology.
– 15:51h UTC: Sta. 43, CTD adr02 043, 42°26.11’ N, 18°45.62’ E, bottom 22.5 m. (MEDPOLEU 11 inner Kotor bay, in front of Kotor). Samples: ISMAR: nuts; IMBK: phytoplanktonOGS.
Author F.Bignami et al.ISMAR-ISAC-CNR Interim Technical Cruise Report
37
– 16:05h UTC: Sta. 43, GRAB GR06, 42°26.08’ N, 18°45.62’ E, bottom 22 m (MEDPOL stationEU11). Samples: ISMAR: granulometry, pollutants; IMBK: heavy metals, PAH, sedimentology.
– 16:43h UTC: Sta. 44, CTD adr02 044, 42°28.55’ N, 18°44.45’ E, bottom 34.5 m. (ADRICOSMKO, inner Kotor bay ). Samples: UNITUS: chl; ISMAR: nuts; IMBK: phytoplankton OGS.
– 17:43h UTC: Sta. 45, CTD adr02 045, 42°28.80’ N, 18°43.28’ E, bottom 63 m. (extra sta-tion, in FWS in karst spring, 60 m deep in 30 m bottom surounding, 50 m diameter seen inmultibeam/chirp data). Samples: UNITUS: chl; ISMAR: O2, nuts.
– 18:00h UTC: Sta. 45, GRAB GR07, 42°28.79’ N, 18°43.27’ E, bottom 63 m (extra FWS). Sam-ples: Samples: ISMAR: granulometry, pollutants; IMBK: heavy metals, PAH, sedimentology.
– 19:19h UTC: Sta. 46, CTD adr02 046, 42°25.92’ N, 18°39.49’ E, bottom 39.7 m. (ADRICOSMsta. TV, i.e. off Tivat). Samples: UNITUS: chl; ISMAR: nuts; IMBK: phytoplankton OGS.
– 20:15h UTC: Sta. 47, CTD adr02 047, 42°26.28’ N, 18°32.65’ E, bottom 43.1 m. (ADRICOSMsta. HN, i.e. off Herceg Novi). Samples: UNITUS: chl; ISMAR: nuts; IMBK: phytoplanktonOGS.
� 23/10/2008
– 07:34h UTC: Sta. 48, SATLANTIC ADR02 2008 10-23 S048, 42°17.65’ N, 18°29.39’ E, bottom170 m. (ADRICOSM sta. 1-3, repetition of previously done station).
– 07:46h UTC: Sta. 48, CTD adr02 048, 42°17.76’ N, 18°29.15’ E, bottom 171.7 m. (ADRICOSMstation 1-3). Samples: UNITUS: chl, TSM; ISMAR: nuts, CDOM.
– 08:07h UTC: Sta. 48, SATLANTIC ADR02 2008 10-23 S048b, 42°17.81’ N, 18°28.97’ E, bot-tom 174.5 m. (ADRICOSM sta. 1-3).NOTE: wrong date in filename and file header?need tochange them.
– 08:50h UTC: Sta. 49, SATLANTIC ADR02 2008 10-23 S049, 42°20.89’ N, 18°31.25’ E, bottom129 m. (ADRICOSM sta. 1-2).
– 08:57h UTC: Sta. 49, CTD adr02 049, 42°21.05’ N, 18°31.21’ E, bottom 127 m. (ADRICOSMstation 1-2). Samples: UNITUS: chl; ISMAR: O2, nuts.
– 09:16h UTC: Sta. 49, SATLANTIC ADR02 2008 10-23 S049b, 42°21.17’ N, 18°31.14’ E, bot-tom 128 m. (ADRICOSM sta. 1-2).
– 10:01h UTC: Sta. 50, SATLANTIC ADR02 2008 10-23 S050, 42°23.40’ N, 18°32.70’ E, bottom68.5 m. (ADRICOSM sta. 1-1).
– 10:20h UTC: Sta. 50, CTD adr02 050, 42°23.52’ N, 18°32.81’ E, bottom 62 m. (ADRICOSMstation 1-1). Samples: UNITUS: chl, TSM; ISMAR: O2, nuts, CDOM.
– 10:33h UTC: Sta. 50, SATLANTIC ADR02 2008 10-23 S050b, 42°23.50’ N, 18°32.83’ E, bot-tom 63 m. (ADRICOSM sta. 1-1).
– 11:44h UTC: Sta. 51, SATLANTIC ADR02 2008 10-23 S051, 42°26.29’ N, 18°32.63’ E, bottom41.5 m. (ADRICOSM sta. HN, off Herceg Novi, Kotor Bay).
– 11:50h UTC: Sta. 51, CTD adr02 051, 42°26.35’ N, 18°32.64’ E, bottom 42 m. (ADRICOSMstation HN). Samples: UNITUS: chl; ISMAR: nuts; IBMK: phytoplankton, phytoplankon OGS.
– 12:03h UTC: Sta. 51, SATLANTIC ADR02 2008 10-23 S051b, 42°26.28’ N, 18°32.61’ E, bot-tom 42.8 m. (ADRICOSM sta. HN).
– 14:41h UTC: Sta. 52, SATLANTIC ADR02 2008 10-23 S052, 42°29.78’ N, 18°40.51’ E, bottom30 m. (ADRICOSM sta. RI, Risan Bay, NW branch of inner Kotor Bay).
– 14:45h UTC: Sta. 52, CTD adr02 052, 42°29.79’ N, 18°40.57’ E, bottom 30 m. (ADRICOSMstation RI). Samples: UNITUS: chl; ISMAR: O2, nuts.
– 14:56h UTC: Sta. 52, SATLANTIC ADR02 2008 10-23 S052b, 42°29.80’ N, 18°40.59’ E, bot-tom 30 m. (ADRICOSM sta. RI).
– 15:00h UTC: start Multibeam/CHIRP survey of Kotor Bay, starting from Risan Bay. Wealternate with Kotor Bay stations
– 19:27h UTC: Sta. 53, CTD adr02 053, 42°26.61’ N, 18°38.42’ E, bottom 33 m. (extra ADRI-COSM station EU10N off Bijela shipyard). Samples: UNITUS: chl; ISMAR: nuts; IMBK: nuts,sfc nuts sonde, sed. Rosette, bacteriology, phytoplankton OGS, phytoplankton.
Author F.Bignami et al.ISMAR-ISAC-CNR Interim Technical Cruise Report
38
– 19:47h UTC: Sta. 53, GRAB GR08, 42°26.65’ N, 18°38.69’ E, bottom 33 m (MEDPOL stationEU11N). Samples: ISMAR: granulometry, pollutants; IMBK: heavy metals, PAH, sedimentol-ogy.
� 24/10/2008
– 07:35h UTC: Sta. 54, SATLANTIC ADR02 2008 10-24 S054, 41°27.12’ N, 19°24.94’ E, bottom10.5 m. (ADRICOSM sta. 7-1, Albanian waters).
– 07:40h UTC: Sta. 54, CTD adr02 054, 41°27.20’ N, 19°24.88’ E, bottom 11.1 m. (ADRICOSMstation 7-1). Samples: UNITUS: chl, TSM; ISMAR: nuts, CDOM; IBMK: phytoplankton OGS.
– 07:52h UTC: Sta. 54, SATLANTIC ADR02 2008 10-24 S054b, 41°27.25’ N, 19°24.86’ E, bot-tom 11.5 m. (ADRICOSM sta. 7-1).
– 08:28h UTC: Sta. 55, SATLANTIC ADR02 2008 10-24 S055, 41°27.10’ N, 19°20.43’ E, bottom45 m. (ADRICOSM sta. 7-2).
– 08:40h UTC: Sta. 55, CTD adr02 055, 41°27.14’ N, 19°20.29’ E, bottom 49 m. (ADRICOSMstation 7-2). Samples: UNITUS: chl, TSM; ISMAR: O2, nuts, CDOM.
– 08:53h UTC: Sta. 55, SATLANTIC ADR02 2008 10-24 S055b, 41°27.25’ N, 19°19.17’ E, bot-tom 49 m. (ADRICOSM sta. 7-2).
– 09:29h UTC: Sta. 56, SATLANTIC ADR02 2008 10-24 S056, 41°27.17’ N, 19°16.63’ E, bottom89.8 m. (ADRICOSM sta. 7-3).
– 09:46h UTC: Sta. 56, CTD adr02 056, 41°27.42’ N, 19°16.71’ E, bottom 88.5 m. (ADRICOSMstation 7-3). Samples: UNITUS: chl, TSM; ISMAR: nuts, CDOM.
– 09:58h UTC: Sta. 56, SATLANTIC ADR02 2008 10-24 S056b, 41°27.42’ N, 19°16.72’ E, bot-tom 88.4 m. (ADRICOSM sta. 7-3).
– 10:45h UTC: Sta. 57, SATLANTIC ADR02 2008 10-24 S057, 41°27.18’ N, 19°11.23’ E, bottom124.4 m. (ADRICOSM sta. 7-4).
– 10:55h UTC: Sta. 57, CTD adr02 057, 41°27.29’ N, 19°11.27’ E, bottom 124.6 m. (ADRICOSMstation 7-4). Samples: UNITUS: chl; ISMAR: O2, nuts; IBMK: phytoplankton OGS.
– 11:15h UTC: Sta. 57, SATLANTIC ADR02 2008 10-24 S057b, 41°27.29’ N, 19°11.29’ E, bot-tom 124.6 m. (ADRICOSM sta. 7-4).
– 12:00h UTC: Sta. 58, CTD adr02 058, 41°27.16’ N, 19°05.89’ E, bottom 125.6 m. (ADRICOSMstation 7-5). Samples: UNITUS: chl; ISMAR: nuts.
– 12:51h UTC: Sta. 59, CTD adr02 059, 41°27.21’ N, 19°00.66’ E, bottom 125.1 m. (ADRICOSMstation 7-6). Samples: UNITUS: chl; ISMAR: O2, nuts.
– 13:45h UTC: Sta. 60, SATLANTIC ADR02 2008 10-24 S060, 41°27.22’ N, 18°55.30’ E, bottom196 m. (ADRICOSM sta. 7-7).
– 13:54h UTC: Sta. 60, CTD adr02 060, 41°27.36’ N, 18°55.35’ E, bottom 195 m. (ADRICOSMstation 7-7). Samples: UNITUS: chl, TSM; ISMAR: O2, nuts.
– 13:47h UTC: Sta. 60, SATLANTIC ADR02 2008 10-24 S060b, 41°27.35’ N, 18°55.55’ E, bot-tom 192 m. (ADRICOSM sta. 7-7).
– 15:12h UTC: Sta. 61, CTD adr02 061, 41°27.10’ N, 18°49.99’ E, bottom 326 m. (ADRICOSMstation 7-8). Samples: UNITUS: chl; ISMAR: nuts; IBMK: phytoplankton OGS.
– 15:30h UTC: start Multibeam and CHIRP tracks on Albanian margin.
� 25/10/2008
– 06:00h UTC: weigh anchor in Bar Bay. Waiting for agent and pilot boat to disembark Mon-tenegrin colleagues.
– 08:00h UTC: Leave Bar after disembarking Montenegrin colleagues.
– 04:10h UTC circa: start operations - OGS mooring redeployment. 41°50.06’ N, 17°44.17’ E,bottom 1192 m circa.
– 15:14h UTC: OGS mooring deployed. 41°50.269’ N, 17°45.725’ E. Bottom: 1207.6
– 15:21h UTC: 41°50.264’ N, 17°45.564’ E. Estimate of mooring position.
– 15:29h UTC: first acoustic triangulation of mooring. 41°50.295’ N, 17°45.456’ E. Distance 1192m, i.e. ship on top of mooring.
Author F.Bignami et al.ISMAR-ISAC-CNR Interim Technical Cruise Report
39
– 16:27h UTC: Sta. 62, CTD adr02 062, 41°50.222’ N, 17°45.758’ E, bottom 1215 m. (ADRI-COSM, after OGS mooring deployment). OGS: salinity.
– 17:45h UTC: triangulation fix on mooring. 41°50.283’ N, 17°45.667’ E. Bottom: 1204.5 m, i.e.depth of mooring.
– 18:00h UTC circa: steam to Albanian margin area to start Multibeam and CHIRP tracks.NOTE: time change tonight from daylight savings to solar local.
� 26/10/2008
– 07:37h UTC: Sta. 63, SATLANTIC ADR02 2008 10-26 S063, 41°37.78’ N, 19°13.15’ E, bottom88 m. (ADRICOSM sta. 6-5).
– 07:51h UTC: Sta. 63, CTD adr02 063, 41°37.83’ N, 19°12.85’ E, bottom 89 m. (ADRICOSMstation 6-5). Samples: UNITUS: chl; ISMAR: O2, nuts.
– 08:10h UTC: Sta. 63, SATLANTIC ADR02 2008 10-26 S063b, 41°37.88’ N, 19°18.30’ E, bot-tom 67.5 m. (ADRICOSM sta. 6-5).
– 08:54h UTC: Sta. 64, SATLANTIC ADR02 2008 10-26 S064, 41°37.78’ N, 19°13.15’ E, bottom88 m. (ADRICOSM sta. 6-4).
– 08:08h UTC: Sta. 64, CTD adr02 064, 41°37.96’ N, 19°18.18’ E, bottom 68.8 m. (ADRICOSMstation 6-4). Samples: UNITUS: chl; ISMAR: nuts.
– 09:20h UTC: Sta. 64, SATLANTIC ADR02 2008 10-26 S064b, 41°38.01’ N, 19°17.92’ E, bot-tom 69 m. (ADRICOSM sta. 6-4).
– 10:10h UTC: Sta. 65, SATLANTIC ADR02 2008 10-26 S065, 41°37.98’ N, 19°23.74’ E, bottom40 m. (ADRICOSM sta. 6-3).
– 10:20h UTC: Sta. 65, CTD adr02 065, 41°38.09’ N, 19°23.60’ E, bottom 41 m. (ADRICOSMstation 6-3). Samples: UNITUS: chl, TSM; ISMAR: O2, nuts, CDOM.
– 10:31h UTC: Sta. 65, SATLANTIC ADR02 2008 10-26 S065b, 41°38.25’ N, 19°23.49’ E, bot-tom 41 m. (ADRICOSM sta. 6-3).
– 11:48h UTC: Sta. 66, SATLANTIC ADR02 2008 10-26 S066, 41°37.83’ N, 19°27.67’ E, bottom33 m. (ADRICOSM sta. 6-2).
– 12:03h UTC: Sta. 66, CTD adr02 066, 41°37.96’ N, 19°27.64’ E, bottom 33 m. (ADRICOSMstation 6-2). Samples: UNITUS: chl; ISMAR: nuts.
– 12:10h UTC: Sta. 66, SATLANTIC ADR02 2008 10-26 S066b, 41°37.91’ N, 19°27.62’ E, bot-tom 33 m. (ADRICOSM sta. 6-2). 12:46h UTC: Sta. 67, SATLANTIC ADR02 2008 10-26 S067, 41°37.87’ N, 19°31.73’ E, bottom 22 m. (ADRICOSM sta. 6-1).
– 12:57h UTC: Sta. 67, CTD adr02 067, 41°37.99’ N, 19°31.77’ E, bottom 21.9 m. (ADRICOSMstation 6-1). Samples: UNITUS: chl, TSM; ISMAR: O2, nuts, CDOM.
– 13:01h UTC: Sta. 67, SATLANTIC ADR02 2008 10-26 S067b, 41°37.95’ N, 19°31.85’ E, bot-tom 21.3 m. (ADRICOSM sta. 6-1).
– 14:01h UTC: Sta. 68, SATLANTIC ADR02 2008 10-26 S068, 41°44.43’ N, 19°32.96’ E, bottom18.2 m. (ADRICOSM sta. 5-3).
– 14:10h UTC: Sta. 68, CTD adr02 068, 41°44.55’ N, 19°32.99’ E, bottom 17 m. (ADRICOSMstation 5-3). Samples: UNITUS: chl, TSM; ISMAR: O2, nuts, CDOM.
– 14:21h UTC: Sta. 68, SATLANTIC ADR02 2008 10-26 S068b, 41°44.56’ N, 19°32.87’ E, bot-tom 18 m. (ADRICOSM sta. 5-3). NOTE: this CTD profile OK during acquisition but replayreveals pressure at -180000 circa. Examined LED display on deck unit for pressure frequencyand it results to be 0, as if pressure data stream were silent. We decide to continue CTDutilizing mark scans: while lowering click mark scans every 10 m using winch readout. Thenclick last mark scan at bottom depth, record altimeter value and number of downcast marks,so as to be able to reconstruct depth for CTD profile.
– 14:21h UTC circa: start Multibeam/CHIRP operations on Albanian margin.
� 27/10/2008
– 10:30h UTC: Sta. 69, SATLANTIC ADR02 2008 10-27 S069, 42°03.89’ N, 18°41.26’ E, bottom135.5 m. (ADRICOSM sta. 1-5, repeated today to launch T-FLAP 613). Launched T-FLAP613 after CTD. Last winch depth: 15 m; no. of downcast marks (starting from 0 m): 23. Markevery 5 m.
Author F.Bignami et al.ISMAR-ISAC-CNR Interim Technical Cruise Report

40
– 10:51h UTC: Sta. 69, CTD adr02 069, 42°03.85’ N, 18°41.39’ E, bottom 134.6 m. (ADRICOSMstation 1-5). Samples: UNITUS: chl, TSM; ISMAR: O2, nuts, CDOM.
– 11:21h UTC: Sta. 69, SATLANTIC ADR02 2008 10-27 S069b, 42°03.97’ N, 18°41.58’ E, bot-tom 132 m. (ADRICOSM sta. 1-5).
– 14:40h UTC: Sta. 70, SATLANTIC ADR02 2008 10-27 S070, 42°17.00’ N, 18°16.06’ E, bottom132 m. (Bari - Dubrovnik transect sta. AM9).
– 14:47h UTC: Sta. 70, CTD adr02 070, 42°17.18’ N, 18°15.87’ E, bottom 498 m. (Bari -Dubrovnik transect sta. AM9). Samples: UNITUS: chl, TSM; ISMAR: O2, nuts, CDOM.Launched T-FLAP 625 after CTD. Last winch depth: 570 m (???) m; no. of downcast marks(starting from 0 m): 56. Mark every 10 m.
– 15:35h UTC: Sta. 70, SATLANTIC ADR02 2008 10-27 S070b, 42°17.13’ N, 18°15.93’ E, bot-tom 515 m. (Bari - Dubrovnik transect sta. AM9). Launched T-FLAP 625.
– 16:57h UTC: Sta. 71, CTD adr02 071, 42°09.10’ N, 18°06.83’ E, bottom 1146.7 m. (Bari -Dubrovnik transect sta. AM8). Samples: ISMAR: nuts. Last winch depth: 1136 m; no. ofdowncast marks (starting from 0 m): 115; altimeter from bottom: 16.801 m. Mark every 10m.
– 19:16h UTC: Sta. 72, CTD adr02 072, 41°59.00’ N, 17°56.03’ E, bottom 1219.1 m. (Bari -Dubrovnik transect sta. AM7). Samples: UNITUS: chl; ISMAR: nuts. Last winch depth: 1200m; no. of downcast marks (starting from 0 m): 121; altimeter from bottom: 19.4 m (withwinch at 1202 m). Mark every 10 m.
– 21:55h UTC: Sta. 73, CTD adr02 073, 41°50.00’ N, 17°44.90’ E, bottom 1201 m. (Bari -Dubrovnik transect sta. AM1). No Samples. Last winch depth: 1180 m; no. of downcastmarks (starting from 0 m): 119; altimeter from bottom: 23.150 m. Mark every 10 m.
� 28/10/2008
– 01:01h UTC: Sta. 74, CTD adr02 074, 41°41.04’ N, 17°34.12’ E, bottom 1113 m. (Bari -Dubrovnik transect sta. AM6). Samples: ISMAR: nuts. Last winch depth: 1100 m; no. ofdowncast marks (starting from 0 m): 112; altimeter from bottom: 17.949 m. Mark every 10m. NOTE: scan gap at 600 sec circa.
– 07:51h UTC: Sta. 75, SATLANTIC ADR02 2008 10-28 S075, 41°31.00’ N, 17°23.10’ E, bottom962 m. (Bari - Dubrovnik transect sta. AM5).
– 08:00h UTC: Sta. 75, CTD adr02 075, 41°31.25’ N, 17°23.07’ E, bottom 952 m. (Bari -Dubrovnik transect sta. AM5). Samples: UNITUS: chl; ISMAR: nuts. Launch T-FLAP 621.Last winch depth: 960 m; no. of downcast marks (starting from 0 m): 95; altimeter frombottom: 19.680 m. Mark every 10 m.
– 09:11h UTC: Sta. 75, SATLANTIC ADR02 2008 10-27 S075b, 41°31.34’ N, 17°23.00’ E, bot-tom 949 m. (Bari - Dubrovnik transect sta. AM5).
– 10:58h UTC: Sta. 76, CTD adr02 076, 41°20.94’ N, 17°12.11’ E, bottom 568 m. (Bari -Dubrovnik transect sta. AM4). Samples: ISMAR: nuts. Last winch depth: 560 m; no. ofdowncast marks (starting from 0 m): 57; altimeter from bottom: 19.072 m. Mark every 10 m.
– 12:30h UTC: Sta. 77, CTD adr02 077, 41°16.97’ N, 17°06.21’ E, bottom 155 m. (Bari -Dubrovnik transect sta. AM3). Samples: ISMAR: nuts.Last winch depth: 140 m; no. ofdowncast marks (starting from 0 m): 15; altimeter from bottom: 8.4 m. Mark every 10 m.
– 13:40h UTC: Sta. 78, CTD adr02 078, 41°10.96’ N, 17°00.12’ E, bottom 114.5 m. (Bari -Dubrovnik transect sta. AM2). Samples: UNITUS: chl, TSM; Samples: ISMAR: nuts. Lastwinch depth: 100 m; no. of downcast marks (starting from 0 m): 11; altimeter from bottom:8.2 m (with 101 m winch). Mark every 10 m.
– 13:50h UTC: Steam to Bari.
– 14:00h UTC: enter Bari harbor. End of operations.
Author F.Bignami et al.ISMAR-ISAC-CNR Interim Technical Cruise Report