CONSIDERAZIONI BASATE SULLE REGISTRAZIONI DEL TERREMOTO … · Il terremoto di Honshu (Giappone-Mw...
12
5 Italian Journal of Engineering Geology and Environment, 1 (2011) © Casa Editrice Università La Sapienza www.ijege.uniroma1.it DOI: 10.4408/IJEGE.2011-01.O-01 LUCA LENTI (*) , SALVATORE MARTINO (**) , ANTONELLA PACIELLO (***) , ALBERTO PRESTININZI (**) & ROBERTO W. ROMEO (****) (*) IFSTTAR - University Paris Est - Paris, France (**) Sapienza University of Rome - CERI Research Center and Department of Earth Sciences - Rome, Italy (***) ENEA - Research Center Casaccia - Rome, Italy (****) University of Urbino “Carlo Bo” - Urbino, Italy CONSIDERAZIONI BASATE SULLE REGISTRAZIONI DEL TERREMOTO DI HONSHU (GIAPPONE) DELL’11 MARZO 2011 INSIGHTS INTO THE GROUND MOTION RECORDS OF THE HONSHU (JAPAN) EARTHQUAKE OF 11 MARCH 2011 ABSTRACT Questa nota segue il report preliminare inserito on-line in data 25 marzo 2011 sul sito di questa Rivista. Si tratta quindi di una evolu- zione del resoconto preliminare basato su elaborazioni di alcune regi- strazioni accelerometriche del terremoto di Honshu (Giappone) del 11 marzo 2011, rese disponibili dalle reti giapponesi KI-NET e KIK-NET nonché ottenute da una rete accelerometrica gestita dal CERI (Sapien- za, Università di Roma) in Appennino Centrale. Alcune peculiarità di tali registrazioni, in termini di caratteristiche cinematiche e spettrali, sono poste in luce dalla loro analisi nei domini del tempo e delle frequenze e la possibile esistenza di effetti amplifica- tivi, dovuti alla geologia locale, risulta da un’analisi preliminare di tutte le registrazioni disponibili dalla rete KIK-NET in termini di rapporti tra scuotimento locale e scuotimento su bedrock. Il confronto tra queste di- stribuzioni di effetti e la localizzazione delle principali centrali nucleari dell’isola di Honshu evidenzia l’assenza di amplificazioni locali parti- colarmente significative in tali siti così come, d’altro canto, gli spettri di risposta del moto sismico non risultano superare gli spettri di progetto delle centrali localizzate nell’area costiera orientale di Honshu. Infine, un’analisi preliminare del valore dei danni causati dal si- sma di Honshu rispetto ai precedenti eventi sismici che hanno colpito il Giappone e l’Italia durante l’ultimo secolo mette in evidenza, per entrambi gli Stati, una significativa riduzione nel secondo dopoguerra del rapporto tra vittime ed abitanti esposti, con valori che non arri- vano all’1%. Ciononostante, si deve sottolineare che gli ultimi due eventi sismici considerati (terremoto de L’Aquila del 2009 e terre- moto di Honshu del 2001) hanno prodotto un rapporto tra vittime ed abitanti esposti pressoché uguale a fronte di una differenza di circa tre ordini di magnitudo. PAROLE CHIAVE: terremoto, Honshu, scuotimento sismico, amplificazione si- smica locale, danni INTRODUZIONE Il terremoto di Honshu (Giappone-Mw 9.0) è avvenuto l’11 marzo del 2011 alle 05:46:24 UTC a circa 168 km ad est da Sendai (cordinate epicentrali 38.424°N, 142.836°E, profondità ipocentrale 24 km) (Fig. 1). ABSTRACT This paper is a follow-up of a preliminary report on the same subject, which was posted on the website of this Journal on 25 March 2011. The report investigated the ground motion records of the Honshu earthquake of 11 March 2011, made available by the Japanese accelerometric networks KIK-NET and K-NET and by an Italian seismometric network, operated by the CERI Research Centre (Sapienza University of Rome) and located in the central Apennines. The paper highlights some kinematic and spectral features identified in the above records after analysing them in the time and frequency domains. Possible amplification effects due to the local geological setting also result from a preliminary analysis of the ratios of local ground motion to bedrock motion. The comparison of the distribution of these effects with the location of the main nuclear power plants (NPPs) of the Honshu island shows that: i) local seismic amplification was not particularly significant in these sites, and ii) the response spectra of the Honshu earthquake did not exceed the design spectra of the NPPs located along the eastern coast of Honshu. Finally, a preliminary analysis of the damages caused by the Honshu earthquake vs. previous seismic events which hit Japan and Italy in the last century indicates that the ratio of casualties to ex- posed inhabitants substantially dropped after the second world war (below 1% in both countries). Nevertheless, it is worth stressing that the latest two seismic events considered here (L’Aquila earthquake in 2009 and Honshu earthquake in 2011) had an almost equal ratio of casualties to exposed inhabitants, in spite of a difference of about 3 orders of magnitude. KEY WORDS: earthquake, Honshu, seismic ground motion, local seismic am- plification, damages INTRODUCTION The Honshu (Japan) earthquake (Mw 9.0) occurred about 168 km east of Sendai (epicentral co-ordinates 38.424°N, 142.836°E, hypocentral depth about 24 km) on 11 March 2011 at 05:46:24 UTC (Fig. 1).
Transcript of CONSIDERAZIONI BASATE SULLE REGISTRAZIONI DEL TERREMOTO … · Il terremoto di Honshu (Giappone-Mw...

5Italian Journal of Engineering Geology and Environment, 1 (2011) © Casa Editrice Università La Sapienza www.ijege.uniroma1.it
DOI: 10.4408/IJEGE.2011-01.O-01
LUCA LENTI(*), SALVATORE MARTINO(**), ANTONELLA PACIELLO(***),ALBERTO PRESTININZI(**) & ROBERTO W. ROMEO(****)
(*) IFSTTAR - University Paris Est - Paris, France(**) Sapienza University of Rome - CERI Research Center and Department of Earth Sciences - Rome, Italy
(***) ENEA - Research Center Casaccia - Rome, Italy(****) University of Urbino “Carlo Bo” - Urbino, Italy
CONSIDERAZIONI BASATE SULLE REGISTRAZIONI DEL TERREMOTODI HONSHU (GIAPPONE) DELL’11 MARZO 2011
INSIGHTS INTO THE GROUND MOTION RECORDS OFTHE HONSHU (JAPAN) EARTHQUAKE OF 11 MARCH 2011
ABSTRACTQuesta nota segue il report preliminare inserito on-line in data 25
marzo 2011 sul sito di questa Rivista. Si tratta quindi di una evolu-zione del resoconto preliminare basato su elaborazioni di alcune regi-strazioni accelerometriche del terremoto di Honshu (Giappone) del 11 marzo 2011, rese disponibili dalle reti giapponesi KI-NET e KIK-NET nonché ottenute da una rete accelerometrica gestita dal CERI (Sapien-za, Università di Roma) in Appennino Centrale.
Alcune peculiarità di tali registrazioni, in termini di caratteristiche cinematiche e spettrali, sono poste in luce dalla loro analisi nei domini del tempo e delle frequenze e la possibile esistenza di effetti amplifi ca-tivi, dovuti alla geologia locale, risulta da un’analisi preliminare di tutte le registrazioni disponibili dalla rete KIK-NET in termini di rapporti tra scuotimento locale e scuotimento su bedrock. Il confronto tra queste di-stribuzioni di effetti e la localizzazione delle principali centrali nucleari dell’isola di Honshu evidenzia l’assenza di amplifi cazioni locali parti-colarmente signifi cative in tali siti così come, d’altro canto, gli spettri di risposta del moto sismico non risultano superare gli spettri di progetto delle centrali localizzate nell’area costiera orientale di Honshu.
Infi ne, un’analisi preliminare del valore dei danni causati dal si-sma di Honshu rispetto ai precedenti eventi sismici che hanno colpito il Giappone e l’Italia durante l’ultimo secolo mette in evidenza, per entrambi gli Stati, una signifi cativa riduzione nel secondo dopoguerra del rapporto tra vittime ed abitanti esposti, con valori che non arri-vano all’1%. Ciononostante, si deve sottolineare che gli ultimi due eventi sismici considerati (terremoto de L’Aquila del 2009 e terre-moto di Honshu del 2001) hanno prodotto un rapporto tra vittime ed abitanti esposti pressoché uguale a fronte di una differenza di circa tre ordini di magnitudo.
PAROLE CHIAVE: terremoto, Honshu, scuotimento sismico, amplifi cazione si-smica locale, danni
INTRODUZIONEIl terremoto di Honshu (Giappone-Mw 9.0) è avvenuto l’11
marzo del 2011 alle 05:46:24 UTC a circa 168 km ad est da Sendai (cordinate epicentrali 38.424°N, 142.836°E, profondità ipocentrale 24 km) (Fig. 1).
ABSTRACTThis paper is a follow-up of a preliminary report on the same
subject, which was posted on the website of this Journal on 25 March 2011. The report investigated the ground motion records of the Honshu earthquake of 11 March 2011, made available by the Japanese accelerometric networks KIK-NET and K-NET and by an Italian seismometric network, operated by the CERI Research Centre (Sapienza University of Rome) and located in the central Apennines.
The paper highlights some kinematic and spectral features identifi ed in the above records after analysing them in the time and frequency domains. Possible amplifi cation effects due to the local geological setting also result from a preliminary analysis of the ratios of local ground motion to bedrock motion. The comparison of the distribution of these effects with the location of the main nuclear power plants (NPPs) of the Honshu island shows that: i) local seismic amplifi cation was not particularly signifi cant in these sites, and ii) the response spectra of the Honshu earthquake did not exceed the design spectra of the NPPs located along the eastern coast of Honshu.
Finally, a preliminary analysis of the damages caused by the Honshu earthquake vs. previous seismic events which hit Japan and Italy in the last century indicates that the ratio of casualties to ex-posed inhabitants substantially dropped after the second world war (below 1% in both countries). Nevertheless, it is worth stressing that the latest two seismic events considered here (L’Aquila earthquake in 2009 and Honshu earthquake in 2011) had an almost equal ratio of casualties to exposed inhabitants, in spite of a difference of about 3 orders of magnitude.
KEY WORDS: earthquake, Honshu, seismic ground motion, local seismic am-plifi cation, damages
INTRODUCTIONThe Honshu (Japan) earthquake (Mw 9.0) occurred about 168
km east of Sendai (epicentral co-ordinates 38.424°N, 142.836°E, hypocentral depth about 24 km) on 11 March 2011 at 05:46:24 UTC (Fig. 1).

CONSIDERAZIONI BASATE SULLE REGISTRAZIONI DEL TERREMOTO DI HONSHU (GIAPPONE) DELL’11 MARZO 2011
6 L. LENTI, S. MARTINO, A. PACIELLO, A. PRESTININZI & R.W. ROMEO
The mainshock induced a catastrophic tsunami wave, which reached the eastern Japanese coast in less than 15 min (source: NOAA). The wave had a maximum height of about 10 m and pen-etrated as far as 5 km inland (Fig. 2).
Hundreds of aftershocks, about 20 of which with a magnitude greater than Mw 6, followed the mainshock (source: USGS).
ANALYSIS OF SOME ACCELEROMETRIC RECORDSSome of the ground motion records available for the Honshu
earthquake of 11 March 2011 (source: Japanese seismometric net-works K-NET and KIK-NET) were processed by means of SAC (Seismic Analysis Code) in order to derive velocigrams and displace-ment time histories. Moreover, Fast Fourier Transforms (FFTs), 5% damped response spectra in the 0-20 s range and Arias intensities were computed over the entire duration of the signals.
The results of the processing showed a signifi cantly long dura-tion (about 2 min) and a high energy content (some m/s in terms of Arias intensity), corresponding to an extremely high destructive po-tential (cumulated absolute velocity - CAV - of some g·s vs. a damage threshold as low as 0.16 g·s).
As an example, the waveforms recorded on the ground fl oor of an offi ce building in Sendai by station B2F of the Building Research Insti-tute, 150 km west of the epicentre (Fig. 3), were analysed. The wave-forms show high velocity values and a signifi cant spectral content in a wide interval of periods (between 0.5 and 10 s). Other parameters are as follows: PGV 35 cm/s; PGD 120 cm; AI 2.9 m/s; CAV 3.9 g·s; brack-eted duration 122 s. The waveforms recorded at Fukushima (station FKSH16_2, Fig. 4) have a very similar pattern. In this case, the PGD reached 2 m (horizontal component) and the PGV was of up to 24 cm/s.
La scossa principale ha prodotto una disastrosa onda di tsunami che ha raggiunto la costa orientale del Giappone in meno di 15min (fonte NOAA); l’onda è stata caratterizzata da un’altezza massima di circa 10 m e si è addentrata nell’entroterra fi no a circa 5 km (Fig. 2).
Centinaia di repliche, circa 20 delle quali con Mw>6, hanno se-guito la scossa principale (fonte USGS).
ANALISI DI ALCUNE REGISTRAZIONI ACCELERO-METRICHE
Tra le registrazioni disponibili degli scuotimenti del terremoto di Honshu dell’11 marzo 2011 (fonte reti sismometriche giapponesi K-NET e KIK-NET) alcune sono state processate con il codice SAC (Seismic Analysis Code) per ricavare le storie temporali in velocità e spostamento. Inoltre, sono state ottenute le trasformate di Fourier (FFTs), gli spettri di risposta al 5% di smorzamento nell’intervallo 0-20 s e le intensità di Arias sull’intera durata dei segnali.
I risultati dell’analisi mettono in luce una durata signifi cativa-mente elevata (circa 2 min), un elevato contenuto energetico, pari ad alcuni m/s di intensità di Arias, corrispondente ad un potenziale distruttivo molto alto (velocità assoluta cumulata – CAV – pari ad alcuni g·s, mentre il valore di soglia per il danneggiamento è di 0.16 g·s).
Come esempio sono state analizzate le forme d’onda registrate a Sendai dalla stazione B2F del Buiding Research Institute al piano terra di un edifi cio ad uso uffi cio che è localizzato a 150 km ad ovest dell’epicentro (Fig. 3). I risultati dell’analisi mostrano elevati valori di velocità e un contenuto spettrale signifi cativo in un ampio inter-vallo di periodi (0.5-10 sec). Tra gli altri parametri: PGV 35 cm/s; PGD 120 cm; Intensità di Arias 2.9 m/s; CAV 3.9 g·s; bracketed du-
Fig. 1 - Ubicazione su una Google map delle stazioni delle reti K-NET e KIK-NET considerate in questo studio; viene anche riportato l’epi-centro del terremoto di Honshu dell’11 marzo 2011
- Location of the K-NET and KIK-NET networks (considered in this study) on a Google map and epicentre of the Honshu earthquake of 11 March 2011
Fig. 2 - Propagazione dell’onda di tsunami nell’oceano Pacifi co (fonte NOAA)
- Tsunami wave propagation within the Pacifi c Ocean (NOAA source)

INSIGHTS INTO THE GROUND MOTION RECORDS OF THE HONSHU (JAPAN) EARTHQUAKE OF 11 MARCH 2011
7Italian Journal of Engineering Geology and Environment, 1 (2011) © Casa Editrice Università La Sapienza www.ijege.uniroma1.it
Fig. 3 - Analisi delle forme d’onda della registrazione accelerometrica disponibile per la stazione BF2 di Sendai - Analysis of the waveforms of the accelerometric record available for station BF2 in Sendai
ration 122 s. Caratteristiche molto simili sono mostrate dalle forme d’onda registrate a Fukushima (stazione FKSH16_2) e riportate in Fig. 4. In questo caso il PGD ha raggiunto 2 m (componente oriz-zontale) e il PGV fi no a 24 cm/s.
PRIME CONSIDERAZIONI IN MERITO A POSSIBILI EFFETTI DI AMPLIFICAZIONE SISMICA LOCALE E SULL’INCIDENTE DELLA CENTRALE NUCLEARE DI FUKUSHIMA
Possibili effetti di amplifi cazione sismica locale vengono messi in evidenza dal confronto tra le receiver function (HVSR vs. frequen-za – FIELD & JACOB, 1995) ottenuti per le stazioni MYG013 (vicino Sendai), FKS003 (vicino Fukushima) e MYG004 (vicino Tsukidate) e quelle ottenute per le stazioni B2F e FKSH16_2 le cui receiver fun-
Possible local amplifi cation effects are identifi ed by comparing the receiver functions (HVSR vs. frequency - FIELD & JACOB, 1995) computed for stations MYG013 (close to Sendai), FKS003 (close to Fukushima) and MYG004 (close to Tsukidate) with those obtained for the above-mentioned stations B2F and FKSH16_2, whose receiv-er functions do not point to major amplifi cation effects (Fig. 5).
PRELIMINARY CONSIDERATIONS ON LOCAL SEI-SMIC AMPLIFICATION AND THE FUKUSHIMA NU-CLEAR INCIDENT
Based on all the seismometric records available from the Japa-nese networks K-NET and KIK-NET, a preliminary PGA attenuation law under free-fi eld conditions was derived (Fig. 6), with an uncer-tainty of 100% and an attenuation coeffi cient of roughly 2.5 vs. a typical value of about 1.0.
Only few records yielded PGA values exceeding 1 g. However,

CONSIDERAZIONI BASATE SULLE REGISTRAZIONI DEL TERREMOTO DI HONSHU (GIAPPONE) DELL’11 MARZO 2011
8 L. LENTI, S. MARTINO, A. PACIELLO, A. PRESTININZI & R.W. ROMEO
Fig. 5 - Receiver functions ottenute per le stazioni sismometriche considerate in questo studio
- Receiver functions computed for the accel-erometric stations considered in this study
Fig. 4 - Analisi delle forme d’onda della registrazione accelerometrica disponibile per la stazione FKSH16_2 di Fukushima (stazione KIK-NET) - Analysis of the waveforms of the accelerometric record available for the FKSH16_2 Fukushima KIK-NET station

INSIGHTS INTO THE GROUND MOTION RECORDS OF THE HONSHU (JAPAN) EARTHQUAKE OF 11 MARCH 2011
9Italian Journal of Engineering Geology and Environment, 1 (2011) © Casa Editrice Università La Sapienza www.ijege.uniroma1.it
ction non indicano signifi cativi effetti di amplifi cazione (Fig. 5).Sulla base di tutti i dati disponibili dalle registrazioni sismome-
triche delle reti giapponesi K-NET e KIK-NET, è stata ricavata una legge di attenuazione preliminare del PGA ottenuta per le condizioni di free fi eld (Fig. 6) con un’incertezza del 100% ed un coeffi ciente di attenuazione pari a circa 2.5, che risulta signifi cativo se confrontato con il valore tipico prossimo ad 1.
Solo poche registrazioni hanno restituito valori di PGA superio-ri ad 1g; tuttavia, tutti questi valori sono compresi tra la media e la standard deviation della legge di attenuazione ricavata a dimostrazio-ne del fatto che tali valori risultano legati a condizioni di sito molto specifi che piuttosto che a condizioni legate alle caratteristiche dello scuotimento rispetto all’area sorgente. Inoltre, è bene notare che la legge di attenuazione disponibile in Giappone ed ottenuta sulla base della sismicità, prevede valori di PGA ben più elevati di quelli regi-strati a parità di magnitudo e distanza (SI & MIDORIKAWA, 1999).
Come effetto dello scuotimento sismico e del conseguente tsuna-mi, 4 delle 54 centrali nucleari giapponesi si sono spente riducendo in modo drastico l’approvvigionamento energetico nelle prefetture di Fukushima e Miyagi. Il campo di scuotimento ricavato dalle regi-strazioni in free fi eld è riportato in Fig. 7, nonostante non sia stato possibile considerare ed includere nei calcoli le registrazioni ottenute alle singole centrali nucleari.
I valori di accelerazione sismica ottenuti lungo la costa sono stati approssimativamente di circa 0.5 g, ovvero non così elevati rispetto ai valori di accelerazione di progetto utilizzati per la centrale nucle-are di Fukushima-Daiichi (Tab. 1, dati TEPCO – Tokyo Electric Po-wer Company). Il più elevato dei valori di accelerazione sismica in eccesso rispetto al previsto è stato registrato al reattore 2 anche se tale valore era ampiamente compensato dai fattori cautelativi adottati nella defi nizione dell’accelerazione di progetto. Infatti, a seguito del
all of these values lie between the average and the standard deviation of the attenuation law, suggesting that they are more related to very local and site-specifi c geological conditions than to the characteristics of the strong ground motion radiated from the source. Moreover, it is worth noting that the attenuation law available in Japan and derived from Japanese seismicity predicts PGA values by far higher than the actually recorded ones for the same magnitude-distance pairs (SI & MIDORIKAWA, 1999).
As an effect of the strong ground motion and the consequent tsu-nami, 4 out of the 54 Japanese nuclear power plants (NPPs) were automatically shut down, sharply cutting power supply to the Fuku-shima and Miyagi prefectures. Fig. 7 displays the ground motion fi eld derived from the free-fi eld records of the Honshu earthquake, although it was not possible to include the data recorded at the indi-vidual NPPs in the computations.
Ground motion values along the coastline were approximately around 0.5 g, not so higher than the design acceleration values of the Fukushima NPP (Tab. 1, data from TEPCO - Tokyo Electric Power Company). The maximum exceedance was observed at reactor 2, al-though this value was largely offset by the safety margins used to defi ne the design acceleration. Indeed, after the Niigata-Chuetsu-Oki (NCO) earthquake of 16 July 2007 (Mw 6.8), which struck the Kash-iwazaki-Kariwa NPP (the largest in the world), TEPCO revised the safety margins of the Fukushima-Daiichi NPP, taking into account the results shown in Fig. 8; in the fi gure, the black solid line is the design spectrum of the Fukushima-Daiichi NPP and the red dashed line is the response spectrum recorded at the foundation basemat of the Kash-iwazaki-Kariwa NPP. At the fundamental frequencies of the main structural and functional systems of the Fukushima-Daiichi NPP, the design accelerations do not signifi cantly depart from those observed at the Kashiwazaki-Kariwa NPP, which had no signifi cant damages during the 2007 NCO earthquake. This infers that scramming opera-tions at the Fukushima-Daiichi NPP were successfully conducted and
Fig. 7 - Campo di scuotimento derivato dalle registrazioni in condizioni di free fi eld
- Ground motion fi eld derived from the free-fi eld records
Fig. 6 - Legge di attenuazione in funzione della distanza dalla faglia Joney-Boore in condizioni di free fi eld, ottenuta in base alle registrazioni delle reti giapponesi K-NET e KIK-NET
- PGA attenuation law vs. Joyner-Boore fault distance under free-fi eld conditions, obtained from the records of the Japanese networks K-NET and KIK-NET

CONSIDERAZIONI BASATE SULLE REGISTRAZIONI DEL TERREMOTO DI HONSHU (GIAPPONE) DELL’11 MARZO 2011
10 L. LENTI, S. MARTINO, A. PACIELLO, A. PRESTININZI & R.W. ROMEO
terremoto di Niigata-Chuetsu-Oki del 16 Luglio 2007 (Mw 6.8) che ha colpito la centrale nucleare di Kashiwazaki-Kariwa (a tutt’oggi il più grande impianto nucleare al mondo), la TEPCO ha ricontrollato i valori di sicurezza della centrale nucleare di Fukushima-Daiichi tenu-to conto dei risultati riportati in Fig. 8 dove la linea nera rappresenta lo spettro di progetto della centrale di Fukushima-Daiichi mentre la linea rossa tratteggiata rappresenta lo spettro di risposta registrato sul piano fondale della centrale nucleare di Kashiwazaki-Kariwa. Si può osservare come alle frequenze fondamentali dei principali elementi strutturali e funzionali della centrale nucleare di Fukushima-Daiichi le accelerazioni di progetto non sono così differenti da quelle registra-te alla centrale nucleare di Kashiwazaki-Kariwa, che non ha mostrato danni signifi cativi durante il succitato sisma di Niigata-Chuetsu-Oki del 2007. Pertanto è possibile ritenere che le operazioni di spegni-mento della centrale siano state correttamente condotte e che i danni subiti al reattore siano da attribuirsi esclusivamente agli effetti dovuti all’onda di tsunami.
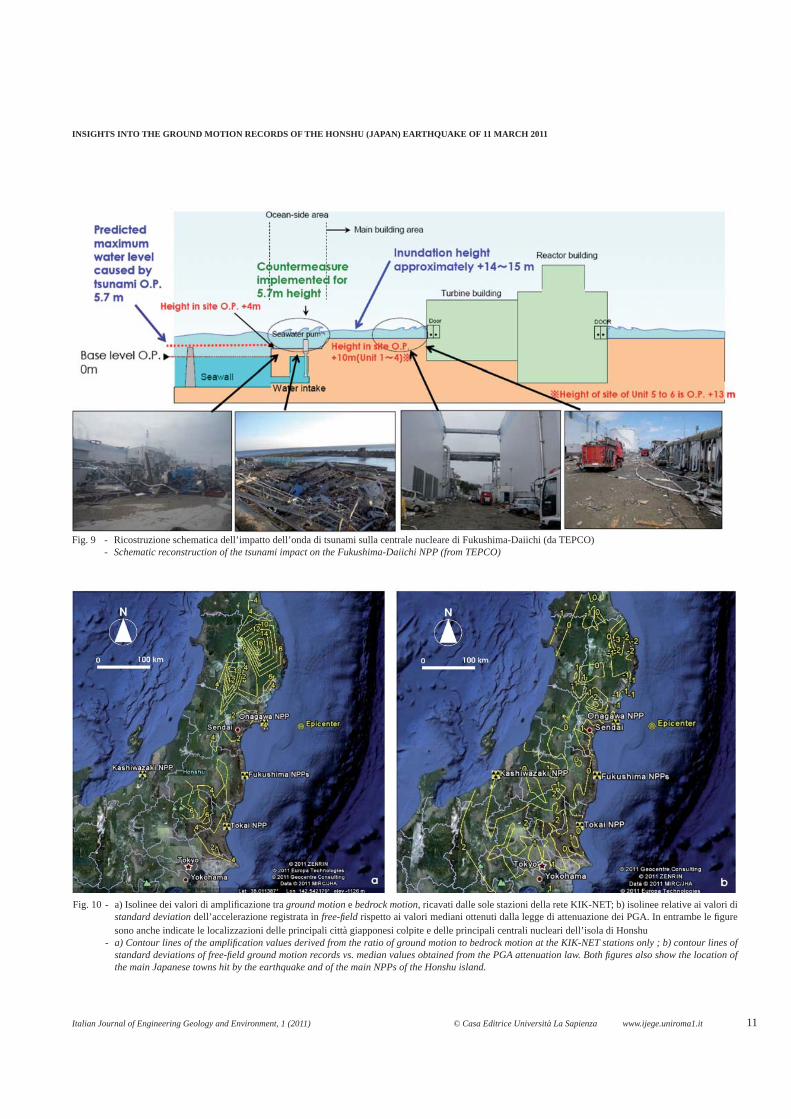
A questo proposito, lo schema di Fig. 9 (da TEPCO) mostra cosa è accaduto alla centrale nucleare di Fukushima-Daiichi per effetto dell’allagamento dovuto allo tsunami. La successione di eventi può essere descritta come segue: l’altezza della massima onda di tsunami di progetto era di 6 m rispetto al livello del mare come dimostrato dalla dimensione delle opere difensive. L’onda di tsunami effettiva-mente generata dal sisma è stata di 14 m rispetto all’attuale livello del mare cosicché l’onda di esondazione è stata circa 5 m più elevata ri-spetto alla sommità degli edifi ci e delle strutture lato mare contenenti i sistemi di pompaggio dell’acqua di mare che, di conseguenza, sono stati danneggiati tanto da non poter raffreddare i nuclei ed evitarne la parziale fusione. Per completezza di informazione è bene ricordare che un recente studio (SATAKE et alii, 2007) aveva identifi cato alme-no tre onde di tsunami giganti che, nel corso degli ultimi 3000 anni avrebbero colpito la prefettura di Miyagi, ultima delle quali nel 869 A.D., e che si sarebbero addentrate nell’entroterra fi no a circa 5 km dalla costa.
In merito all’amplifi cazione sismica locale in corrispondenza dei siti in cui sono localizzate le centrali nucleari di Honshu, possono es-
that reactor building failures were caused by the tsunami wave alone.In this regard, the scheme of Fig. 9 (from TEPCO) shows what
may have happened at the Fukushima-Daiichi NPP owing to the tsuna-mi fl ooding. The sequence of events may be outlined as follows. The maximum design tsunami wave height was 6 m above sea level (as demonstrated by the size of protective structures). The tsunami wave actually generated by the earthquake was 14-m high and the resulting fl ooding depth was about 5 m higher than the top of the ocean-side buildings and structures, containing seawater pumping systems. These systems failed, triggering the heat accumulation and temperature in-crease that led to partial core meltdown. For information complete-ness, a recent study (SATAKE et alii, 2007) had identifi ed at least three giant tsunami waves hitting the Miyagi prefecture in the past 3,000 years; the latest one, in 869 AD, penetrated as far as 5 km inland.
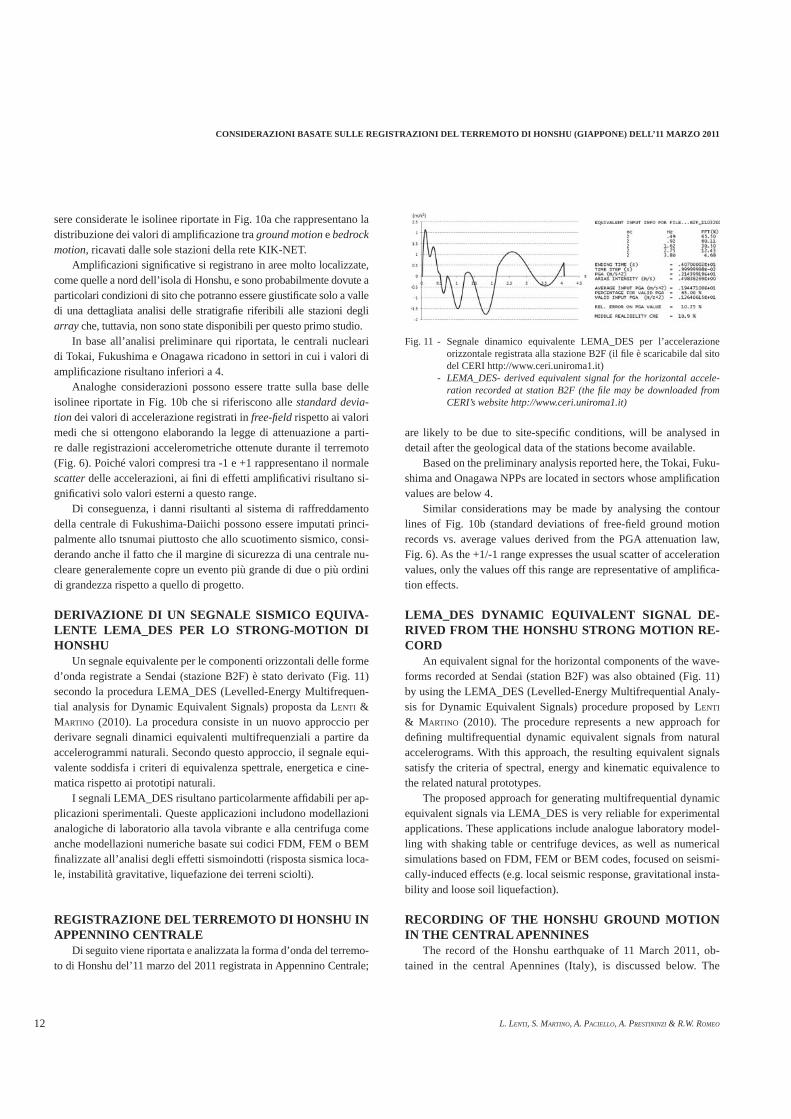
With regard to seismic amplifi cation at the sites of the Honshu NPPs, Fig. 10a shows the contour lines of the distribution of amplifi -cation values between ground motion and bedrock motion, obtained from the KIK-NET stations alone.
High amplifi cation values were recorded in extremely localised areas, such as those north of the Honshu island. These values, which
Fig. 8 - Confronto tra gli spettri di risposta in accelerazione al livello del piano delle fondazioni della centrale nucleare di Fukushima-Daiichi (unità n°1) e quella di Kashiwazaki-Kariwa (unità n° 1 e 4) per un coeffi ciente di smorzamento pari all’1%
- Comparison between 1% damped response spectra at the founda-tion basemats of the Fukushima-Daiichi NPP Unit 1 (black) and of the Kashiwazaki-Kariwa NPP Units 1 and 4 (red)
Tab. 1 - Massima accelerazione di picco (PGA-max) registrata alla fonda-zione della centrale nucleare di Fukushima-Daiichi a confronto con le accelerazioni di progetto (PGA-design) e soglia di accelerazione prevista per lo spegnimento della centrale nucleare (PGA-scram). I valori di PGA sono in gal (cm/s2)
- Maximum observed acceleration (PGA-max) at the foundation basemat of the Fukushima-Daiichi NPP vs. design accelerations (PGA-design) and acceleration threshold for NPP scramming (PGA-scram). The values of the PGAs are expressed in gal (cm/s2)
INSIGHTS INTO THE GROUND MOTION RECORDS OF THE HONSHU (JAPAN) EARTHQUAKE OF 11 MARCH 2011
11Italian Journal of Engineering Geology and Environment, 1 (2011) © Casa Editrice Università La Sapienza www.ijege.uniroma1.it
Fig. 9 - Ricostruzione schematica dell’impatto dell’onda di tsunami sulla centrale nucleare di Fukushima-Daiichi (da TEPCO) - Schematic reconstruction of the tsunami impact on the Fukushima-Daiichi NPP (from TEPCO)
Fig. 10 - a) Isolinee dei valori di amplifi cazione tra ground motion e bedrock motion, ricavati dalle sole stazioni della rete KIK-NET; b) isolinee relative ai valori di standard deviation dell’accelerazione registrata in free-fi eld rispetto ai valori mediani ottenuti dalla legge di attenuazione dei PGA. In entrambe le fi gure sono anche indicate le localizzazioni delle principali città giapponesi colpite e delle principali centrali nucleari dell’isola di Honshu
- a) Contour lines of the amplifi cation values derived from the ratio of ground motion to bedrock motion at the KIK-NET stations only ; b) contour lines of standard deviations of free-fi eld ground motion records vs. median values obtained from the PGA attenuation law. Both fi gures also show the location of the main Japanese towns hit by the earthquake and of the main NPPs of the Honshu island.
CONSIDERAZIONI BASATE SULLE REGISTRAZIONI DEL TERREMOTO DI HONSHU (GIAPPONE) DELL’11 MARZO 2011
12 L. LENTI, S. MARTINO, A. PACIELLO, A. PRESTININZI & R.W. ROMEO
sere considerate le isolinee riportate in Fig. 10a che rappresentano la distribuzione dei valori di amplifi cazione tra ground motion e bedrock motion, ricavati dalle sole stazioni della rete KIK-NET.
Amplifi cazioni signifi cative si registrano in aree molto localizzate, come quelle a nord dell’isola di Honshu, e sono probabilmente dovute a particolari condizioni di sito che potranno essere giustifi cate solo a valle di una dettagliata analisi delle stratigrafi e riferibili alle stazioni degli array che, tuttavia, non sono state disponibili per questo primo studio.
In base all’analisi preliminare qui riportata, le centrali nucleari di Tokai, Fukushima e Onagawa ricadono in settori in cui i valori di amplifi cazione risultano inferiori a 4.
Analoghe considerazioni possono essere tratte sulla base delle isolinee riportate in Fig. 10b che si riferiscono alle standard devia-tion dei valori di accelerazione registrati in free-fi eld rispetto ai valori medi che si ottengono elaborando la legge di attenuazione a parti-re dalle registrazioni accelerometriche ottenute durante il terremoto (Fig. 6). Poiché valori compresi tra -1 e +1 rappresentano il normale scatter delle accelerazioni, ai fi ni di effetti amplifi cativi risultano si-gnifi cativi solo valori esterni a questo range.
Di conseguenza, i danni risultanti al sistema di raffreddamento della centrale di Fukushima-Daiichi possono essere imputati princi-palmente allo tsnumai piuttosto che allo scuotimento sismico, consi-derando anche il fatto che il margine di sicurezza di una centrale nu-cleare generalemente copre un evento più grande di due o più ordini di grandezza rispetto a quello di progetto.
DERIVAZIONE DI UN SEGNALE SISMICO EQUIVA-LENTE LEMA_DES PER LO STRONG-MOTION DI HONSHU
Un segnale equivalente per le componenti orizzontali delle forme d’onda registrate a Sendai (stazione B2F) è stato derivato (Fig. 11) secondo la procedura LEMA_DES (Levelled-Energy Multifrequen-tial analysis for Dynamic Equivalent Signals) proposta da LENTI & MARTINO (2010). La procedura consiste in un nuovo approccio per derivare segnali dinamici equivalenti multifrequenziali a partire da accelerogrammi naturali. Secondo questo approccio, il segnale equi-valente soddisfa i criteri di equivalenza spettrale, energetica e cine-matica rispetto ai prototipi naturali.
I segnali LEMA_DES risultano particolarmente affi dabili per ap-plicazioni sperimentali. Queste applicazioni includono modellazioni analogiche di laboratorio alla tavola vibrante e alla centrifuga come anche modellazioni numeriche basate sui codici FDM, FEM o BEM fi nalizzate all’analisi degli effetti sismoindotti (risposta sismica loca-le, instabilità gravitative, liquefazione dei terreni sciolti).
REGISTRAZIONE DEL TERREMOTO DI HONSHU IN APPENNINO CENTRALE
Di seguito viene riportata e analizzata la forma d’onda del terremo-to di Honshu del’11 marzo del 2011 registrata in Appennino Centrale;
are likely to be due to site-specifi c conditions, will be analysed in detail after the geological data of the stations become available.
Based on the preliminary analysis reported here, the Tokai, Fuku-shima and Onagawa NPPs are located in sectors whose amplifi cation values are below 4.
Similar considerations may be made by analysing the contour lines of Fig. 10b (standard deviations of free-fi eld ground motion records vs. average values derived from the PGA attenuation law, Fig. 6). As the +1/-1 range expresses the usual scatter of acceleration values, only the values off this range are representative of amplifi ca-tion effects.
LEMA_DES DYNAMIC EQUIVALENT SIGNAL DE-RIVED FROM THE HONSHU STRONG MOTION RE-CORD
An equivalent signal for the horizontal components of the wave-forms recorded at Sendai (station B2F) was also obtained (Fig. 11) by using the LEMA_DES (Levelled-Energy Multifrequential Analy-sis for Dynamic Equivalent Signals) procedure proposed by LENTI & MARTINO (2010). The procedure represents a new approach for defi ning multifrequential dynamic equivalent signals from natural accelerograms. With this approach, the resulting equivalent signals satisfy the criteria of spectral, energy and kinematic equivalence to the related natural prototypes.
The proposed approach for generating multifrequential dynamic equivalent signals via LEMA_DES is very reliable for experimental applications. These applications include analogue laboratory model-ling with shaking table or centrifuge devices, as well as numerical simulations based on FDM, FEM or BEM codes, focused on seismi-cally-induced effects (e.g. local seismic response, gravitational insta-bility and loose soil liquefaction).
RECORDING OF THE HONSHU GROUND MOTION IN THE CENTRAL APENNINES
The record of the Honshu earthquake of 11 March 2011, ob-tained in the central Apennines (Italy), is discussed below. The
Fig. 11 - Segnale dinamico equivalente LEMA_DES per l’accelerazione orizzontale registrata alla stazione B2F (il fi le è scaricabile dal sito del CERI http://www.ceri.uniroma1.it)
- LEMA_DES- derived equivalent signal for the horizontal accele-ration recorded at station B2F (the fi le may be downloaded from CERI’s website http://www.ceri.uniroma1.it)

INSIGHTS INTO THE GROUND MOTION RECORDS OF THE HONSHU (JAPAN) EARTHQUAKE OF 11 MARCH 2011
13Italian Journal of Engineering Geology and Environment, 1 (2011) © Casa Editrice Università La Sapienza www.ijege.uniroma1.it
record was generated by a private accelerometric network, located about 15 km from Rieti and making part of an integrated monitor-ing system; the system is operated by the Research Centre for Geo-logical Risks (CERI) of the Sapienza University of Rome (http://www.ceri.uniroma1.it) in co-operation with the French Institute of Science and Technology for Transport, Development and Networks (IFSTTAR - Paris, France) and with the Agenzia Nazionale per le Nuove Tecnologie, l‘Energia e lo Sviluppo Economico Sostenibile (ENEA R.C. Casaccia - Roma, Italy). In particular, the network is located within tunnels hosted in a carbonate slope and is equipped with 4 triaxial accelerometers (EPISENSOR KINEMETRICS), di-rectly installed on the bedrock and connected via a cable to a 24-bit, 130-dB digital data logger (K2 KINEMETRICS), with sampling at 250 p/s and set to the absolute local time by a GPS device.
Two pass-band fi lters of the KINEMETRICS library (“clas-
la registrazione è stata effettuata da una rete accelerometrica privata localizzata a circa 15 km da Rieti, facente parte di un sistema di moni-toraggio integrato gestito dal Centro di Ricerca per i Rischi Geologici (CERI) dell’Università di Roma “Sapienza” (http://www.ceri.uniro-ma1.it) in cooperazione con l’IFSTTAR (The French Institute of Scien-ce and Technology for Transport, Development and Networks - Pari-gi, Francia) e l’ENEA (Agenzia Nazionale per le Nuove Tecnologie, l’Energia e lo Sviluppo Economico Sostenibile – C.R. Casaccia, Rome, Italia). Più in particolare la rete è localizzata all’interno di gallerie ospi-tate in un versante carbonatico ed è strumentata con accelerometri trias-siali (EPISENSOR KINEMETRICS) installati direttamente su roccia, connessi via cavo ad un acquisitore K2 KINEMETRICS a 24 bit e a 130 dB (che garantisce dunque una acquisizione con risoluzione a 250 p/s), e settati ad un tempo assoluto locale tramite GPS.
Due fi ltri passa banda della libreria KINEMETRICS (“classic
Fig. 12 - Analisi della forma d’onda della stazione accelerometrica F1 in Appennino Centrale (Italia) - Analysis of the waveform of the accelerometric record of station F1 in the central Apennines (Italy)

CONSIDERAZIONI BASATE SULLE REGISTRAZIONI DEL TERREMOTO DI HONSHU (GIAPPONE) DELL’11 MARZO 2011
14 L. LENTI, S. MARTINO, A. PACIELLO, A. PRESTININZI & R.W. ROMEO
sic strong motion” with a pass-band of about 1-10 Hz and “IIRC” with a band-pass of about 1-20 Hz) were alternatively applied to the channels of each station. Moreover, some channels were set to a trigger threshold vs. their respective noise level, while others were set in STA/LTA (Short Time Amplitude/Long Time Amplitude) trig-ger mode, which is particularly suitable for detecting low-magni-tude earthquakes. Only 2 channels out of 12 were required for trig-gering the network.
Fig. 12 exhibits some features of the recorded waveforms.The three components of the waveforms were processed by
means of SAC in order to derive velocigrams and displacement time histories. Moreover, Fast Fourier Transforms (FFTs), 5% damped response spectra in the 0-20 s range and cumulated Arias intensities were computed.
The data so processed show that the recorded ground motion reached 25 mg on the horizontal components and about 10mg on the vertical one; it had a dominant FFT frequency of roughly 0.07 Hz, i.e. a period of about 14 s; it reached PGDs of 5 mm and had a duration of about 100 s; its Arias intensity was about 3.0E-7 g2/s, i.e. of the same order of magnitude as the Arias values computed for earthquakes with magnitude 4-5 located in the Reatini Mts. and Gran Sasso Massif seismogenetic areas and about one order of mag-nitude higher than the Arias intensity values computed for the recent earthquakes in the Balkan peninsula (Mw 5.4) and in the southern Tyrrhenian Sea (Mw 5.3) (Fig. 13).
strong motion” con una banda passante 1-10 Hz e “IIRC” con una banda passante di circa 1-20 Hz) sono stati applicati alternativamente ai canali di ogni stazione. Inoltre, alcuni canali sono stati settati con una soglia di trigger rispetto al rispettivo livello di rumore mentre altri sono stati settati in una modalità di trigger STA/LTA (short time amplitude/long time amplitude) particolarmente adeguata per la re-gistrazione dei terremoti di bassa magnitudo. Due canali su 12 sono richiesti per avviare la registrazione.
Alcuni caratteristiche peculiari delle registrazioni vengono pre-sentate in Fig. 12.
Le registrazioni sono state processate tramite il codice SAC per ricavare le storie temporali relative alle velocità e agli spostamen-ti. Inoltre, sono state ottenute le trasformate di Fourier (FFTs) dei segnali temporali, gli spettri di risposta in pseudovelocità al 5% di smorzamento nell’intervallo 0-20 s e le intensità cumulate di Arias.
I dati cosi’ analizzati mostrano che lo scuotimento registrato: ha raggiunto un’accelerazione di 25 mg sulle componenti orizzontali e circa 10 mg sulla componente verticale; presenta uno spettro di Fou-rier in accelerazione caratterizzato da una frequenza dominante di 0.07 Hz, ovvero un periodo di 14 s; raggiunge picchi in spostamento di 5 mm; ha una durata di circa 100 s; ha un’Intensità di Arias di circa 3E+07 g²/s, ovvero dello stesso ordine di grandezza dei valori di Intensità di Arias ottenuti per i terremoti di magnitudo da 4 a 5 con epicentri nei settori dei Monti Reatini e del Massiccio del Gran Sasso e di un ordine di grandezza più elevato dei valori di Intensità di Arias calcolati dalle registrazioni dei terremoti recenti della penisola bal-canica (Mw 5.4) e del Mar Tirreno meridionale (Mw 5.3) (Fig. 13).
Fig. 13 - Intensità di Arias vs. Mw per i terremoti registrati alla stazione F1 in Appenjnino Centrale (Italia) - Arias intensity vs. Mw for the earthquakes recorded at station F1 in the central Apennines (Italy)

INSIGHTS INTO THE GROUND MOTION RECORDS OF THE HONSHU (JAPAN) EARTHQUAKE OF 11 MARCH 2011
15Italian Journal of Engineering Geology and Environment, 1 (2011) © Casa Editrice Università La Sapienza www.ijege.uniroma1.it
Fig. 14 – a) Valori di magnitudo, morti e abitanti esposti relativi ai terremoti italiani di Mw>5.5 e giap-ponesi di Mw>6.5 avvenuti nel corso dell’ul-timo secolo; b) valori di magnitudo, morti e danni (in milioni di Euro) relativi ai terremoti italiani di Mw>5.5 e giapponesi di Mw>6.5 avvenuti nel corso dell’ultimo secolo, le frecce indicano un danno non quantifi cabile poichè associato a terremoti distruttivi; c) valori di magnitudo, abitanti esposti e rapporto morti/abitanti esposti (la diminuzione della lunghez-za della barra corrisponde ad un aumento della percentuale delle perdite) riferiti ai terremoti italiani di Mw>5.5 e giapponesi di Mw>6.5 avvenuti nel corso dell’ultimo secolo
- a) Values of magnitude, casualties and exposed inhabitants for the Mw>5.5 Italian earthqua-kes and the Mw>6.5 Japanese earthquakes oc-curred in the last century; b) values of magni-tude, casualties and damages (in million euro) for the Mw>5.5 Italian earthquakes and the Mw>6.5 Japanese earthquakes occurred in the last century; the arrows express non-detectable damages from destructive earthquakes; c) va-lues of magnitude, exposed inhabitants and ca-sualties/exposed inhabitants ratio (the shorter bars express a higher percentage of casualties) for the Mw>5.5 Italian earthquakes and the Mw>6.5 Japanese earthquakes occurred in the last century
CONSIDERAZIONI BASATE SULLE REGISTRAZIONI DEL TERREMOTO DI HONSHU (GIAPPONE) DELL’11 MARZO 2011
16 L. LENTI, S. MARTINO, A. PACIELLO, A. PRESTININZI & R.W. ROMEO
CONCLUDING REMARKSPreliminary considerations on the effects and damages caused
by the Honshu earthquake of 11 March 2011 may be drawn from the analysis of reports on magnitude, damages (expressed in million euro – source: Word Bank – The Economist), casualties and number of exposed inhabitants for the most destructive earthquakes (Mw > 5.5) occurred in Italy in the last century and the most destructive earthquakes (Mw > 6.5) occurred in Japan in the same time interval (Fig. 14).
All the investigated earthquakes involved more than 10,000 in-habitants (15,000,000 for the Honshu earthquake) (Fig. 14a). Nev-ertheless, the highest percentages of casualties with respect to the exposed population (i.e. the highest ratios of casualties to exposed inhabitants) were recorded for the Italian earthquakes of Reggio and Messina in 1908 (casualties/exposed inhabitants: about 53%) and Avezzano in 1915 (casualties/exposed inhabitants: about 25%), followed by the ones of Tokyo in 1923 (casualties/exposed inhab-itants: about 3.5%) and Kobe in 1995 (casualties/exposed inhabit-ants: about 1.2%); however, the Kobe earthquake had an order of magnitude about 1.5 higher than the one of the Tokyo earthquake (Fig. 14b).
Additionally (Fig. 14c), after the second world war, the ratio of casualties to exposed inhabitants remained below 1% in both Italy and Japan. Nonetheless, the latest two seismic events (L’Aquila earthquake in 2009 and Honshu earthquake in 2011) had an almost equal ratio of casualties to exposed inhabitants, in spite of a differ-ence of about 3 orders of magnitude. This fi nding is particularly sig-nifi cant, since the ratio for the Honshu earthquake also takes into account the casualties caused by the tsunami wave, i.e. not directly related to seismic shaking.
By contrast, except for the highly destructive earthquakes of Reg-gio and Messina, Avezzano and Tokyo, the greatest damages, exceed-ing a value of € 100,000 million (source: Word Bank - The Econo-mist-2011), have so far been caused by the Japanese earthquakes of Kobe and Honshu (Fig. 14c).
CONSIDERAZIONI CONCLUSIVEPrime considerazioni in merito agli effetti ed ai danni causati dal
terremoto di Honshu del 11 Marzo 2011 possono essere tratte analiz-zando i resoconti relativi al rapporto tra magnitudo, danni (espressi in milioni di Euro – fonte: Word Bank – The Economist), morti e numero di abitanti esposti, riferiti ai più distruttivi terremoti (Mw> 5.5) avvenuti in Italia nell’ultimo secolo ed ai più distruttivi terremoti (Mw>6.5) avvenuti nello stesso periodo in Giappone (Fig. 14).
Tutti i terremoti considerati hanno coinvolto popolazioni più nu-merose di 10.000 abitanti fi no ad un massimo di 15.000.000 raggiun-to, per l’appunto dal sisma di Honshu (Fig. 14a). Tuttavia, le più ele-vate percentuali di morti causati dai terremoti considerati rispetto alla popolazione colpita (ovvero i più alti rapporti morti/abitanti esposti) si registrano per i terremoti italiani di Reggio e Messina del 1908 (rapporto morti/abitanti pari a circa 53%) e di Avezzano del 1915 (rapporto morti/abitanti esposti pari a circa 25%) seguiti dal terre-moto di Tokio del 1923 (rapporto morti/abitanti esposti pari a circa 3.5%) e di Kobe del 1995 che, tuttavia, presenta una magnitudo di circa un ordine e mezzo più elevata (Fig. 14b).
Si può inoltre constatare (Fig. 14c) che, a partire dal secondo dopoguerra, sia in Italia che in Giappone il rapporto morti/abitanti esposti per i terremoti considerati si mantiene inferiore all’1%. Tutta-via, si deve rilevare che in riferimento agli ultimi due eventi sismici (terremoto italiano de L’Aquila del 2009 e terremoto giapponese di Honshu del 2011), a fronte di un valore pressoché uguale di rapporto morti/abitanti esposti, corrispondono magnitudo aventi una differen-za di circa tre ordini di grandezza; va oltretutto rimarcato che il valore del rapporto nel caso del terremoto di Honshu tiene conto anche del numero di vittime causato dall’onda di tsunami e dunque non diretta-mente legato agli effetti dello scuotimento.
Di contro, i più elevati valori in termini di danno (Fig. 14c), fatta eccezione per le distruzioni causate dai succitati sismi di Reg-gio e Messina, Avezzano e Tokio, restano ad appannaggio dei sismi giapponesi di Kobe (1995) e Honshu (2011), risultando superiori ai 100.000 milioni di Euro (fonte: Word Bank – The Economist).
REFERENCESFIELD E.H. & JACOB K. (1995) - A comparison and test of various site response estimation techniques, including three that are non reference-site dependent. Bull.
Seism. Soc. Am., 85: 1127–1143.LENTI L. & MARTINO S. (2010) - New procedure for deriving multifrequential dynamic equivalent signals (LEMA_DES): a test-study based on Italian accelerometric
records. Bulletin of Earthquake Engineering, 8: 813-846 (DOI. 10.1007/s10518-009-9169-7).PRESTININZI A., PUGLIESE A. & ROMEO R.W. (2005) - Proposed seismic classifi cation of Italy and related actions. Italian Journal of Engineering Geology and
Environment, 1/2005. DOI:10.4408/IJEGE.2005-01.O-04.SATAKE K., SAWAI Y., SHISHIKURA M., OKAMURA Y., NAMEGAYA Y. & YAMAKI S. (2007) - Tsunami source of the unusual AD 869 earthquake off Miyagi, Japan, inferred
from tsunami deposits and numerical simulation of inundation. American Geophysical Union, Fall Meeting 2007, abstract #T31G-03.SI H. & MIDORIKAWA S. (1999) - Attenuation Relations for Peak Ground Acceleration and Velocity Considering Effects of Fault Type and Site condition. Journal of
Structural Construction Engineering, 523: 63-70.STRONG MOTION CENTER: http://strongmotioncenter.org/cgi-bin/ncesmd/iqr_dist_DM2.pl?iqrID=Japan_11Mar2011&SFlag=0&Flag=1
Received April 2011 - Accepted May 2011