Comparative performance analysis of quantum machine ...
15
Vol.:(0123456789) 1 3 Complex & Intelligent Systems https://doi.org/10.1007/s40747-021-00398-7 ORIGINAL ARTICLE Comparative performance analysis of quantum machine learning with deep learning for diabetes prediction Himanshu Gupta 1 · Hirdesh Varshney 2 · Tarun Kumar Sharma 3 · Nikhil Pachauri 4 · Om Prakash Verma 1 Received: 12 February 2021 / Accepted: 11 May 2021 © The Author(s) 2021 Abstract Background Diabetes, the fastest growing health emergency, has created several life-threatening challenges to public health globally. It is a metabolic disorder and triggers many other chronic diseases such as heart attack, diabetic nephropathy, brain strokes, etc. The prime objective of this work is to develop a prognosis tool based on the PIMA Indian Diabetes dataset that will help medical practitioners in reducing the lethality associated with diabetes. Methods Based on the features present in the dataset, two prediction models have been proposed by employing deep learning (DL) and quantum machine learning (QML) techniques. The accuracy has been used to evaluate the prediction capability of these developed models. The outlier rejection, filling missing values, and normalization have been used to uplift the discriminatory performance of these models. Also, the performance of these models has been compared against state-of-the-art models. Results The performance measures such as precision, accuracy, recall, F 1 score, specificity, balanced accuracy, false detection rate, missed detection rate, and diagnostic odds ratio have been achieved as 0.90, 0.95, 0.95, 0.93, 0.95, 0.95, 0.03, 0.02, and 399.00 for DL model respectively, However for QML, these measures have been computed as 0.74, 0.86, 0.85, 0.79, 0.86, 0.86, 0.11, 0.05, and 35.89 respectively. Conclusion The proposed DL model has a high diabetes prediction accuracy as compared with the developed QML and exist- ing state-of-the-art models. It also uplifts the performance by 1.06% compared to reported work. However, the performance of the QML model has been found as satisfactory and comparable with existing literature. Keywords Binary classification · Deep learning · Diabetes prediction · Healthcare · PIMA · Predictive analysis · Quantum machine learning Abbreviations ANN Artificial neural network AB AdaBoost BMI Body mass index BP Blood pressure DL Deep learning DM Diabetes mellitus DOR Diagnostic odds ratio DPF Diabetes pedigree function DT Decision tree EDA Exploratory data analysis FDR False detection rate G Glucose GP Gaussian process * Om Prakash Verma [email protected] Himanshu Gupta [email protected] Hirdesh Varshney [email protected] Tarun Kumar Sharma [email protected] Nikhil Pachauri [email protected] 1 Department of Instrumentation and Control Engineering, Dr. B R Ambedkar National Institute of Technology Jalandhar, Jalandhar, India 2 Department of Computer Science and Engineering, Babu Banarsi Das University, Lucknow, India 3 Department of Computer Science and Engineering, Shobhit University Gangoh, Saharanpur, India 4 School of Electrical and Electronics, SASTRA Deemed to be University, Thanjavur, Tamilnadu, India
Transcript of Comparative performance analysis of quantum machine ...

Vol.:(0123456789)1 3
Complex & Intelligent Systems https://doi.org/10.1007/s40747-021-00398-7
ORIGINAL ARTICLE
Comparative performance analysis of quantum machine learning with deep learning for diabetes prediction
Himanshu Gupta1 · Hirdesh Varshney2 · Tarun Kumar Sharma3 · Nikhil Pachauri4 · Om Prakash Verma1
Received: 12 February 2021 / Accepted: 11 May 2021 © The Author(s) 2021
AbstractBackground Diabetes, the fastest growing health emergency, has created several life-threatening challenges to public health globally. It is a metabolic disorder and triggers many other chronic diseases such as heart attack, diabetic nephropathy, brain strokes, etc. The prime objective of this work is to develop a prognosis tool based on the PIMA Indian Diabetes dataset that will help medical practitioners in reducing the lethality associated with diabetes.Methods Based on the features present in the dataset, two prediction models have been proposed by employing deep learning (DL) and quantum machine learning (QML) techniques. The accuracy has been used to evaluate the prediction capability of these developed models. The outlier rejection, filling missing values, and normalization have been used to uplift the discriminatory performance of these models. Also, the performance of these models has been compared against state-of-the-art models.Results The performance measures such as precision, accuracy, recall, F1 score, specificity, balanced accuracy, false detection rate, missed detection rate, and diagnostic odds ratio have been achieved as 0.90, 0.95, 0.95, 0.93, 0.95, 0.95, 0.03, 0.02, and 399.00 for DL model respectively, However for QML, these measures have been computed as 0.74, 0.86, 0.85, 0.79, 0.86, 0.86, 0.11, 0.05, and 35.89 respectively.Conclusion The proposed DL model has a high diabetes prediction accuracy as compared with the developed QML and exist-ing state-of-the-art models. It also uplifts the performance by 1.06% compared to reported work. However, the performance of the QML model has been found as satisfactory and comparable with existing literature.
Keywords Binary classification · Deep learning · Diabetes prediction · Healthcare · PIMA · Predictive analysis · Quantum machine learning
AbbreviationsANN Artificial neural networkAB AdaBoostBMI Body mass indexBP Blood pressureDL Deep learningDM Diabetes mellitus
DOR Diagnostic odds ratioDPF Diabetes pedigree functionDT Decision treeEDA Exploratory data analysisFDR False detection rateG GlucoseGP Gaussian process
* Om Prakash Verma [email protected]
Himanshu Gupta [email protected]
Hirdesh Varshney [email protected]
Tarun Kumar Sharma [email protected]
Nikhil Pachauri [email protected]
1 Department of Instrumentation and Control Engineering, Dr. B R Ambedkar National Institute of Technology Jalandhar, Jalandhar, India
2 Department of Computer Science and Engineering, Babu Banarsi Das University, Lucknow, India
3 Department of Computer Science and Engineering, Shobhit University Gangoh, Saharanpur, India
4 School of Electrical and Electronics, SASTRA Deemed to be University, Thanjavur, Tamilnadu, India

Complex & Intelligent Systems
1 3
I Insulink-NN k-Nearest neighborsLDA Linear discriminant analysisMDR Missed detection rateML Machine learningMV Missing valueMLP Multilayer perceptronN NormalizationNB Naive BayesOR Outlier rejectionP PregnanciesPIDD PIMA Indian Diabetes datasetQDA Quadratic discriminant analysisQIBC Quantum-inspired binary classifierQM Quantum mechanicsQML Quantum machine learningRBF Radial basis functionRF Random forestST Skin thicknessSVM Support vector machineT1D Type-1 diabetesT2D Type-2 diabetesVQC Variational quantum circuit
Introduction
The rapid urbanization and modernization have triggered many chronic diseases which creates a colossal threat to public health globally. Diabetes mellitus (DM) also called diabetes is one such disease. It has become one of the most common diseases nowadays in all age groups and habitats [1]. The number of diabetes patients (aged over 18 years) has increased rapidly from 4.7 to 8.5% from 1980 to 2014 which imposes crucial challenges in both developed and develop-ing nations [2]. It has been considered as the seventh major reason for the premature death rate and because of this only, 1.6 million people died every year [3]. Statistical studies reveal that in 2019, 463 million people are living with diabe-tes worldwide and it has been estimated to reach 578 million by 2030, and 700 million by 2045. Therefore, the number of diabetes patients are projected to increase exponentially by 25% in 2030 and 51% in 2045 [4]. However, this growth is asynchronously distributed as this rate is predicted as 143% in Africa compared to 15% in Europe whereas China, India, and the United States of America are the most affected coun-tries as shown in Fig. 1.
Diabetes is a kind of endocrine disease that is associated with the reduced glucose acceptability by the body either because of absolute or relative insufficiency of insulin pro-duced by the pancreas. Generally, it has been classified into
Fig. 1 Top 10 most affected countries with diabetes

Complex & Intelligent Systems
1 3
four types: type-1 diabetes (T1D) or juvenile diabetes or insulin-dependent diabetes, type-2 diabetes (T2D) or DM, gestational DM, and specific types of diabetes due to other causes [5]. Amongst them, T1D and T2D are the two most common types of diabetes. The former is irreversible and is developed due to the deficiency of insulin as a result of dam-aged beta cells of the pancreas whereas, the latter is because of insufficient transportation of insulin into the cells. Both T1D and T2D can lead to serious life-threatening compli-cations, such as diabetic foot syndrome, strokes and heart attacks, cirrhosis of the liver, chronic renal failure, etc. [6]. Therefore, to mitigate these complications, direct cost of diabetes has been increased significantly from $ 232 billion in 2007 to $ 760 billion in 2019 (228%) worldwide and is estimated to reach $ 845 billion by 2045 [7]. However, in the absence of any permanent and long-term cure for diabetes, early and accurate prediction is the only possible way to overcome the above-mentioned issues.
Currently, the early diagnosis and prediction of the dis-ease have been done manually by a doctor which is based upon their knowledge, experience, and observations. Although the healthcare industry already collects a huge amount of data, it does not always reveal inherited hidden patterns. Consequently, these manual decisions can be highly misleading and dangerous especially, for early diagnosis as some parameters may remain hidden and have a devastating impact on the observations and outcomes. Therefore, there is an urgent need for advanced mechanisms for early and automated diagnosis to ensure higher accuracy. Further, as machine learning (ML) and deep learning (DL) techniques have shown promising results in identifying hidden patterns, they have been employed in various complex problems to obtain efficient results with reliable accuracy [8–10].
Being motivated by this, in recent years, a number of ML and DL based frameworks have been proposed for the prediction of diabetes such as logistic regression, artificial neural network (ANN), linear discriminant analysis (LDA), naive Bayes (NB), support vector machine (SVM), deci-sion tree (DT), AdaBoost (AB), J48, k-nearest neighbors (k-NN), quadratic discriminant analysis (QDA), random for-est (RF), multilayer perceptron (MLP), general regression neural network, and radial basis function (RBF) [11]. These techniques have been employed with various dimensionality reduction (such as principal component analysis) and cross-validation (for example k-fold cross-validation) techniques along with the mechanism for filling missing values and rejecting outliers to uplift the performance of ML and DL models. To predict the likelihood of diabetes with maxi-mum accuracy, three different ML classifiers (DT, SVM, and NB) have been employed, and obtained results reveal that NB provides the maximum accuracy of 82% [12]. Fur-ther, the probabilistic neural network achieved an accuracy of 81.49% on the test dataset [13]. Meanwhile, a Gaussian
process (GP) based classification technique has been pro-posed with three different kernels (linear, polynomial, and RBF) to classify the positive and negative diabetes samples. The extensive experiments demonstrate that the GP classi-fier with tenfold cross-validation outperforms the traditional classifiers (LDA, QDA, and NB) with an accuracy of 81.97% [14]. Furthermore, sequential minimal optimization, SVM, and elephant herding optimizer have been applied to predict diabetes based on multi-objective optimization and yield an accuracy of 78.21% [15].
Although these ML and DL models have shown adequate results but their accuracy is still on the lower side because they learn the relation between input (features) and output (class) based on the classical theories of probability and logic [16, 17]. Therefore, they require a lot of improve-ments to have general acceptability for diabetes prediction. Further, Quantum Mechanics (QM) has already shown its effectiveness in various domains (such as classification, prediction and, object detection and tracking) and achieved remarkable performance over classical theory-based models. With the motivation of this advent, previously reported work employed QM to uplift the ML and DL models performance [18]. The quantum particle swarm optimization has been employed to diagnose T2D and achieved the precision of 82.18% [19]. The quantum nearest mean classifier has been utilized for binary classification where the quantum version has been used to estimate the optimal performance meas-ures [20]. A quantum-inspired evolutionary algorithm with binary-real representation has been implemented to improve the ANN by providing self-configuring capability based on the data [21]. A quantum-inspired binary classifier (QIBC) has been proposed to enhance the performance metrics in visual object detection tasks [16]. The obtained results reveal that QIBC outperforms current state-of-the-art tech-niques in most of the tasks. The QM-based framework has been utilized for feature extraction and classification from the electroencephalogram signal and achieved an accuracy of 0.95 with Gaussian kernel [22]. Further, the classifica-tion of osteoarthritis has been accomplished by utilizing classical ML and DL models [23]. However, to reduce the computational burden they proposed to use QM as a future work. Therefore, it may be concluded that there is an enor-mous scope to test and validate the performance of QM. Hence, the research fraternity is now trying to employ this newly advent QM on various benchmark datasets and com-pare the performance with conventionally used ML and DL techniques.
Under the umbrella of the above discussion, the present investigation explores the employability of QM for the pre-diction of diabetes amongst people. Further, another predic-tion model based on DL has been developed. The developed quantum machine learning (QML) and DL models have been trained by employing PIMA Indian diabetes dataset (PIDD)
Complex & Intelligent Systems
1 3
[24]. Finally, the performance of the developed QML and DL models have been compared against the classical models to investigate the effectiveness of these models for the clas-sification task. Therefore, based on the above framework, the main contributions of this work can be sketched as follows:
• Firstly, the proposed work employs various preprocessing techniques for the cleaning of the PIDD and investigates the effectiveness of these techniques by statistical param-eters.
• Secondly, QML has been employed for the prediction of diabetes in PIDD.
• Thirdly, the optimized number of layers required to pre-dict diabetes in PIDD for both QML and DL models has been analyzed by extensive experimentation.
• Finally, the developed models have been exhaustively compared against the state-of-the-art techniques to vali-date the appropriateness of the developed models based on the prediction accuracy.
The remainder of this paper is organized as follows. The next section describes the methodology utilized in the pre-sent investigation. This section also deliberates about the dataset used for the analysis, proposed framework, and simu-lation setup and metrics. Then, detailed results and discus-sion have been presented in the following section. To end with, the last section gives the concluding remarks of the present work.
Methodology
This section focuses on the methodology used for the pre-sent investigation. In this regard, subsections 2.1, 2.2, and 2.3 explain the dataset utilized, proposed framework and, simulation setup and metrics used to assess the performance of the developed models respectively.
Dataset
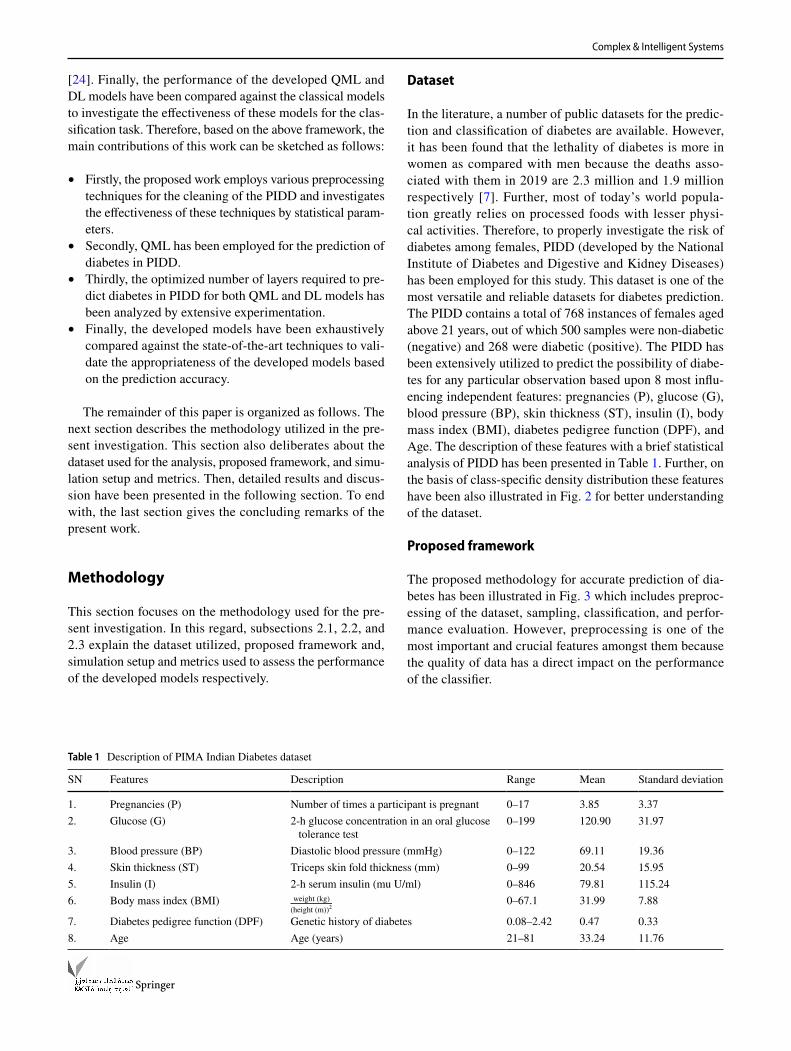
In the literature, a number of public datasets for the predic-tion and classification of diabetes are available. However, it has been found that the lethality of diabetes is more in women as compared with men because the deaths asso-ciated with them in 2019 are 2.3 million and 1.9 million respectively [7]. Further, most of today’s world popula-tion greatly relies on processed foods with lesser physi-cal activities. Therefore, to properly investigate the risk of diabetes among females, PIDD (developed by the National Institute of Diabetes and Digestive and Kidney Diseases) has been employed for this study. This dataset is one of the most versatile and reliable datasets for diabetes prediction. The PIDD contains a total of 768 instances of females aged above 21 years, out of which 500 samples were non-diabetic (negative) and 268 were diabetic (positive). The PIDD has been extensively utilized to predict the possibility of diabe-tes for any particular observation based upon 8 most influ-encing independent features: pregnancies (P), glucose (G), blood pressure (BP), skin thickness (ST), insulin (I), body mass index (BMI), diabetes pedigree function (DPF), and Age. The description of these features with a brief statistical analysis of PIDD has been presented in Table 1. Further, on the basis of class-specific density distribution these features have been also illustrated in Fig. 2 for better understanding of the dataset.
Proposed framework
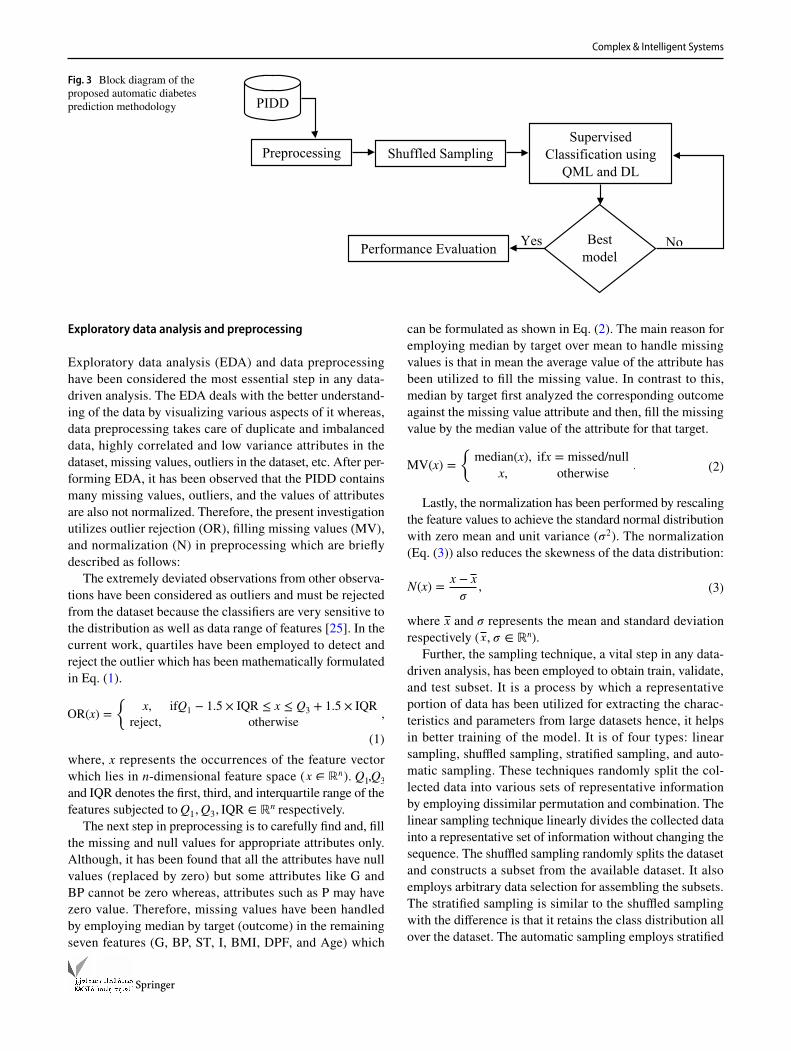
The proposed methodology for accurate prediction of dia-betes has been illustrated in Fig. 3 which includes preproc-essing of the dataset, sampling, classification, and perfor-mance evaluation. However, preprocessing is one of the most important and crucial features amongst them because the quality of data has a direct impact on the performance of the classifier.
Table 1 Description of PIMA Indian Diabetes dataset
SN Features Description Range Mean Standard deviation
1. Pregnancies (P) Number of times a participant is pregnant 0–17 3.85 3.372. Glucose (G) 2-h glucose concentration in an oral glucose
tolerance test0–199 120.90 31.97
3. Blood pressure (BP) Diastolic blood pressure (mmHg) 0–122 69.11 19.364. Skin thickness (ST) Triceps skin fold thickness (mm) 0–99 20.54 15.955. Insulin (I) 2-h serum insulin (mu U/ml) 0–846 79.81 115.246. Body mass index (BMI) weight (kg)
(height (m))20–67.1 31.99 7.88
7. Diabetes pedigree function (DPF) Genetic history of diabetes 0.08–2.42 0.47 0.338. Age Age (years) 21–81 33.24 11.76

Complex & Intelligent Systems
1 3
Fig. 2 Density distribution of attributes in PIMA Indian Diabetes dataset (PIDD)
Complex & Intelligent Systems
1 3
Exploratory data analysis and preprocessing
Exploratory data analysis (EDA) and data preprocessing have been considered the most essential step in any data-driven analysis. The EDA deals with the better understand-ing of the data by visualizing various aspects of it whereas, data preprocessing takes care of duplicate and imbalanced data, highly correlated and low variance attributes in the dataset, missing values, outliers in the dataset, etc. After per-forming EDA, it has been observed that the PIDD contains many missing values, outliers, and the values of attributes are also not normalized. Therefore, the present investigation utilizes outlier rejection (OR), filling missing values (MV), and normalization (N) in preprocessing which are briefly described as follows:
The extremely deviated observations from other observa-tions have been considered as outliers and must be rejected from the dataset because the classifiers are very sensitive to the distribution as well as data range of features [25]. In the current work, quartiles have been employed to detect and reject the outlier which has been mathematically formulated in Eq. (1).
where, x represents the occurrences of the feature vector which lies in n-dimensional feature space ( x ∈ ℝ
n ). Q1,Q3 and IQR denotes the first, third, and interquartile range of the features subjected to Q1,Q3, IQR ∈ ℝ
n respectively.The next step in preprocessing is to carefully find and, fill
the missing and null values for appropriate attributes only. Although, it has been found that all the attributes have null values (replaced by zero) but some attributes like G and BP cannot be zero whereas, attributes such as P may have zero value. Therefore, missing values have been handled by employing median by target (outcome) in the remaining seven features (G, BP, ST, I, BMI, DPF, and Age) which
(1)
OR(x) =
{x, ifQ1 − 1.5 × IQR ≤ x ≤ Q3 + 1.5 × IQR
reject, otherwise,
can be formulated as shown in Eq. (2). The main reason for employing median by target over mean to handle missing values is that in mean the average value of the attribute has been utilized to fill the missing value. In contrast to this, median by target first analyzed the corresponding outcome against the missing value attribute and then, fill the missing value by the median value of the attribute for that target.
Lastly, the normalization has been performed by rescaling the feature values to achieve the standard normal distribution with zero mean and unit variance ( �2 ). The normalization (Eq. (3)) also reduces the skewness of the data distribution:
where x and � represents the mean and standard deviation respectively ( x , � ∈ ℝ
n).Further, the sampling technique, a vital step in any data-
driven analysis, has been employed to obtain train, validate, and test subset. It is a process by which a representative portion of data has been utilized for extracting the charac-teristics and parameters from large datasets hence, it helps in better training of the model. It is of four types: linear sampling, shuffled sampling, stratified sampling, and auto-matic sampling. These techniques randomly split the col-lected data into various sets of representative information by employing dissimilar permutation and combination. The linear sampling technique linearly divides the collected data into a representative set of information without changing the sequence. The shuffled sampling randomly splits the dataset and constructs a subset from the available dataset. It also employs arbitrary data selection for assembling the subsets. The stratified sampling is similar to the shuffled sampling with the difference is that it retains the class distribution all over the dataset. The automatic sampling employs stratified
(2)MV(x) =
{median(x), ifx = missed/null
x, otherwise.
(3)N(x) =x − x
�,
Fig. 3 Block diagram of the proposed automatic diabetes prediction methodology
NoYes
PIDD
Preprocessing Shuffled Sampling
Supervised
Classification using
QML and DL
Best
modelPerformance Evaluation

Complex & Intelligent Systems
1 3
sampling as default however, depending upon the data other suitable sampling techniques can also be utilized.
DL model
DL, a subset of ML, is a kind of black box which learns the relationship between features and target on its own. In this work, a multilayer feed-forward perceptron (MLP) model has been employed to build a DL model and trained with root mean square propagation (RMSprop) using back-prop-agation. The MLP consists of a single input–output layer and may have several hidden layers whereas, each layer contains many neurons that are connected with each other in the uni-directional manner of different weights [26]. The proposed model has been developed by utilizing Keras sequential library of TensorFlow which contains one input layer, four hidden layers, and one output layer. The model summary and architecture of the developed model have been presented in Table 2 and Fig. 4 respectively for better understanding.
The K-dimensional input vector of any layer of MLP pro-duces O-dimensional output vector where K and O represents the input–output dimension of the respective layer subjected to f (x) ∶ ℝ
K→ ℝ
O . The output of each processing unit for k neurons can be mathematically represented by Eq. (4):
where wk , xk , b , and ∅ are the weights, input, bias, and the activation function respectively.
The proposed model has been trained with the goal to mini-mize a cost function which also uses L2 regularization to avoid overfitting and has been mathematically formulated in Eq. (5):
where L represents the cost function and � is the regulariza-tion parameter. Further, during the entire training process weights are updated regularly by employing the RMSprop optimization technique to achieve the desired target value as expressed in Eq. (6):
where wt and wt−1 represents the new and old weights respec-tively with �t and �t−1 the new and old exponential average
(4)f (x) = �
(∑
k
wkxk + b
),
(5)L =
K∑
i=0
(yi −
O∑
j=0
xijwj
)2
+ �
O∑
j=0
w2j,
(6)
wt = wt−1 −�
√�t
×dL
dw,
�t = ��t−1 + (1 − �)�dL
dw
�2
,
Table 2 Model summary of developed DL model
Layer (type) Output shape Number of parameters
Activation function
Dense (None, 8) 72 seluDense (None, 16) 144 seluDense (None, 32) 544 seluDense (None, 8) 264 reluDense (None, 2) 18 reluDense (None, 1) 3 sigmoid
Fig. 4 The MLP architecture for diabetes prediction

Complex & Intelligent Systems
1 3
of the squared gradient respectively. However, � and � repre-sent the moving average parameter and learning rate respec-tively. The hyperparameters such as the number of hidden layers, number of neurons in each hidden layer, learning rate, epochs, and activation functions for each layer have been empirically (hit and trial) chosen in the present work and have been illustrated in Table 3.
QML model
In the recent past, the world has witnessed enormous growth in the field of ML and DL. The models developed using these techniques have been applied in almost all imaginable sectors such as military, aerospace, agriculture, finance, and healthcare. However, with the increasing number of features, they require millions of parameters to learn and therefore, struggles to train efficiently and create lots of computational burden. On the contrary side, quantum computers have been found capable to solve such problems effectively with exist-ing technologies by computing multiple states simultane-ously. They utilize the three basic properties of quantum physics: superposition, Entanglement, and Interference. Because of these inherited properties qubits (the basic unit of quantum computers) can be in multiple states concur-rently (superposition), extremely correlated even if sepa-rated by great distances (entanglement), and bias towards the desired state (interference). Therefore, quantum comput-ing has the potential by which the research community has reached an inch closer towards achieving Artificial General Intelligence.
The superposition is the main property of QM which can be expressed by Eq. (7) [27].
where, ��⟩ represents any arbitrary state between 0 and 1. � and � are complex numbers such that |�|2 + |�|2 = 1 . The qubit remains in this state until measured and after that, it collapses into either state �0⟩ or state �1⟩ with the probability of |�|2 or |�|2 respectively. The number of qubits required to
(7)��⟩ = ��0⟩ + ��1⟩,
perform the given task has been calculated by Eq. (8) which in the present work has been computed as 3.
The present work utilizes a variational quantum circuit (VQC) with tunable hyperparameters to develop QML based classifier for diabetes prediction in PIDD [28]. The developed quantum circuit has three main components: (1) Encoder to encode the input data into quantum states (2) Decoder which produces output states, and (3) Evaluator which is used to compare the output values from the circuit with the corresponding input labels. The evaluation has been performed with the Pauli-Z operators and the average evalu-ated value has been used to improve the statistical accuracy [29]. The decoder quantum gates have been parameterized to model the input training data by optimizing the cost function which can be mathematically formulated as in Eq. 9.
where Δ represents the safe margin and gi the interpreted score of ith classifier ( ci ) on input x such that gi ∈ [−1, 1] . The parameters have been tuned using Adam optimizer with a learning rate of 0.01 and batch size 10. Further, mini-batch training has been employed and hence, used to optimize the average loss of the generated mini-batch. The parameters used for the developed QML model has been represented in Table 4.
Simulation setup and metrics
All the proposed models in the reported work have been implemented on Pycharm using Python 3.8 programming environment with various APIs of Python and Keras. The specifications of the simulation platform have been pre-sented in Table 5 with their associated configurations.
The performance of the developed models has been regu-larly measured in terms of various evaluation metrics such as precision, accuracy, recall, F1 score, specificity, balanced
(8)number of qubits = log2 (number of attributes).
(9)L(x, y) =
∑
j≠y
max(0, gj − gy + Δ
),
gi = ci(x;�),
Table 3 Hyperparameters of developed DL model
SN Hyperparameter Description
1. Hidden layers 42. Hidden layer neurons 16, 32, 8, 23. Learning rate 0.014. Epochs 10005. Activation Function Selu, Relu,
and Sig-moid
Table 4 Parameters of developed QML model
SN Parameter Description
1. Number of qubits 32. Number of CNOT gates 33. Number of qnodes 24. Batch size 105. Learning rate 0.016. Epochs 10007. Safe Margin 0.15
Complex & Intelligent Systems
1 3
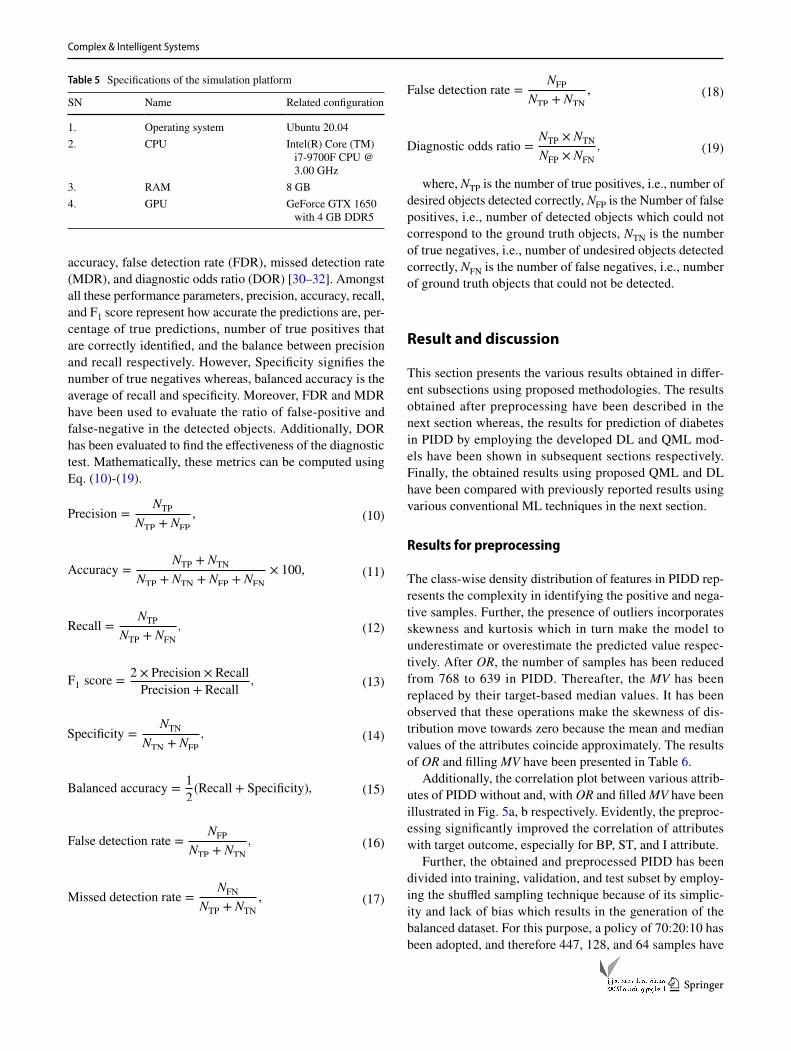
accuracy, false detection rate (FDR), missed detection rate (MDR), and diagnostic odds ratio (DOR) [30–32]. Amongst all these performance parameters, precision, accuracy, recall, and F1 score represent how accurate the predictions are, per-centage of true predictions, number of true positives that are correctly identified, and the balance between precision and recall respectively. However, Specificity signifies the number of true negatives whereas, balanced accuracy is the average of recall and specificity. Moreover, FDR and MDR have been used to evaluate the ratio of false-positive and false-negative in the detected objects. Additionally, DOR has been evaluated to find the effectiveness of the diagnostic test. Mathematically, these metrics can be computed using Eq. (10)-(19).
(10)Precision =NTP
NTP + NFP
,
(11)Accuracy =NTP + NTN
NTP + NTN + NFP + NFN
× 100,
(12)Recall =NTP
NTP + NFN
,
(13)F1 score =2 × Precision × Recall
Precision + Recall,
(14)Specificity =NTN
NTN + NFP
,
(15)Balanced accuracy =1
2(Recall + Specificity),
(16)False detection rate =NFP
NTP + NTN
,
(17)Missed detection rate =NFN
NTP + NTN
,
where, NTP is the number of true positives, i.e., number of desired objects detected correctly, NFP is the Number of false positives, i.e., number of detected objects which could not correspond to the ground truth objects, NTN is the number of true negatives, i.e., number of undesired objects detected correctly, NFN is the number of false negatives, i.e., number of ground truth objects that could not be detected.
Result and discussion
This section presents the various results obtained in differ-ent subsections using proposed methodologies. The results obtained after preprocessing have been described in the next section whereas, the results for prediction of diabetes in PIDD by employing the developed DL and QML mod-els have been shown in subsequent sections respectively. Finally, the obtained results using proposed QML and DL have been compared with previously reported results using various conventional ML techniques in the next section.
Results for preprocessing
The class-wise density distribution of features in PIDD rep-resents the complexity in identifying the positive and nega-tive samples. Further, the presence of outliers incorporates skewness and kurtosis which in turn make the model to underestimate or overestimate the predicted value respec-tively. After OR, the number of samples has been reduced from 768 to 639 in PIDD. Thereafter, the MV has been replaced by their target-based median values. It has been observed that these operations make the skewness of dis-tribution move towards zero because the mean and median values of the attributes coincide approximately. The results of OR and filling MV have been presented in Table 6.
Additionally, the correlation plot between various attrib-utes of PIDD without and, with OR and filled MV have been illustrated in Fig. 5a, b respectively. Evidently, the preproc-essing significantly improved the correlation of attributes with target outcome, especially for BP, ST, and I attribute.
Further, the obtained and preprocessed PIDD has been divided into training, validation, and test subset by employ-ing the shuffled sampling technique because of its simplic-ity and lack of bias which results in the generation of the balanced dataset. For this purpose, a policy of 70:20:10 has been adopted, and therefore 447, 128, and 64 samples have
(18)False detection rate =NFP
NTP + NTN
,
(19)Diagnostic odds ratio =NTP × NTN
NFP × NFN
,
Table 5 Specifications of the simulation platform
SN Name Related configuration
1. Operating system Ubuntu 20.042. CPU Intel(R) Core (TM)
i7-9700F CPU @ 3.00 GHz
3. RAM 8 GB4. GPU GeForce GTX 1650
with 4 GB DDR5

Complex & Intelligent Systems
1 3
been randomly picked as train-, validate-, and test subset respectively.
Results for DL model
The performance of any DL model has been greatly affected by the number of hidden layers and the number of neurons in each layer. However, the addition of these parameters not only increases the complexity of the model but also does not always produces the optimum results. Therefore, to develop the best DL model in the present work, extensive experiments have been carried out on the PIDD. Six different DL models with varying hidden lay-ers (1–6) have been implemented and tested, where the optimum number of neurons have been chosen empirically. The experimentally obtained results demonstrate that out of these six DL models, the model developed using four
hidden layers with the number of neurons in each hid-den layer as 16, 32, 8, and 2 respectively, produced the maximum validation accuracy. This may be because the higher number of hidden layers with a greater number of neurons will tend to limit the generalization capability of the model. Also, it may be affected by the problem of vanishing gradients, which often lead the model towards overfitting particularly in the case of smaller datasets such as PIDD. Further, it has been observed that the models developed using a lesser number of hidden layers are also unable to provide optimum results which might be because of underfitting. The comparative analysis of all the devel-oped DL models has been presented in Fig. 6 for better clarity.
The obtained results reveal that the DL model developed using four hidden layers MLP architecture outperforms other developed DL models by a minimum margin of 7.36%.
Table 6 Description of PIDD after preprocessing
SN Parameter Original Outlier removal Filling missing value
Mean Median Standard deviation Mean Median Standard deviation
Mean Median Standard deviation
1 P 3.85 3 3.37 3.80 3 3.26 3.80 3 3.262 G 120.90 114 31.97 119.11 114 29.16 119.11 114 29.163 BP 69.11 72 19.36 72.12 72 11.35 72.12 72 11.354 ST 20.54 23 15.95 20.56 23 15.34 28.65 27 8.505 I 79.81 37 115.24 65.93 37 79.57 126.29 102.50 52.866 BMI 31.99 32 7.88 32.01 32 6.43 32.01 32 6.437 DPF 0.47 0.36 0.33 0.43 0.358 0.25 0.43 0.36 0.258 Age 33.24 29 11.76 32.72 29 11.08 32.72 29 11.08
Fig. 5 Correlation matrix of PIDD a original, b preprocessed
Complex & Intelligent Systems
1 3
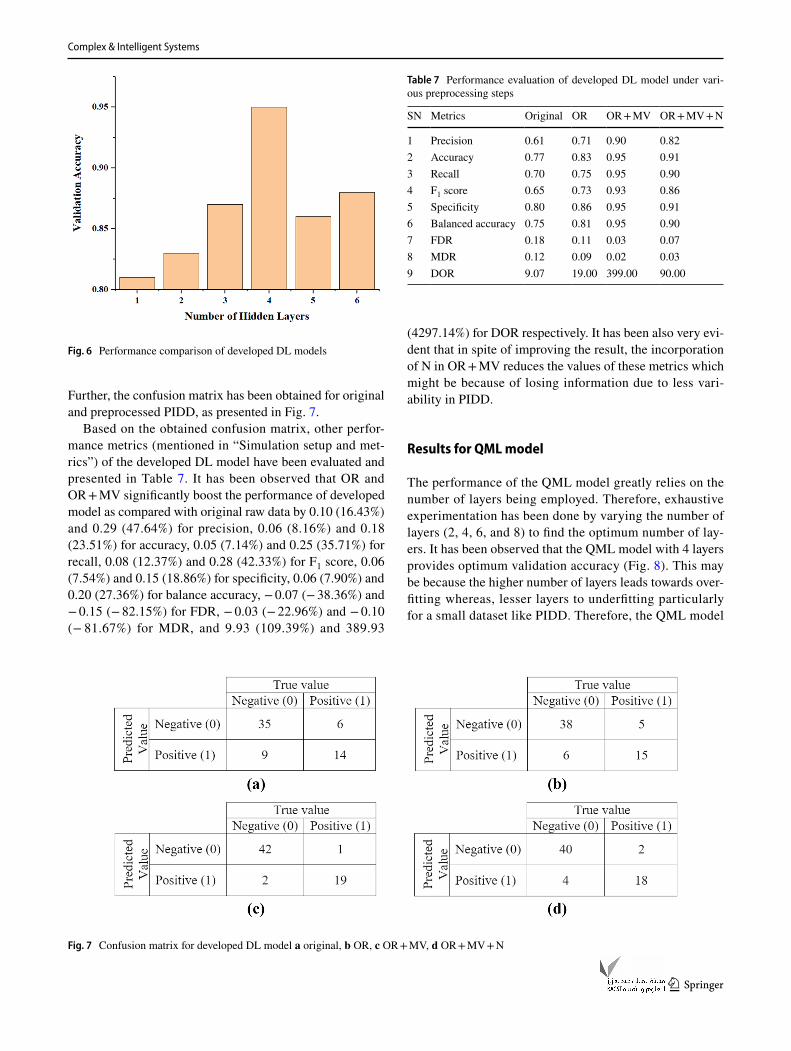
Further, the confusion matrix has been obtained for original and preprocessed PIDD, as presented in Fig. 7.
Based on the obtained confusion matrix, other perfor-mance metrics (mentioned in “Simulation setup and met-rics”) of the developed DL model have been evaluated and presented in Table 7. It has been observed that OR and OR + MV significantly boost the performance of developed model as compared with original raw data by 0.10 (16.43%) and 0.29 (47.64%) for precision, 0.06 (8.16%) and 0.18 (23.51%) for accuracy, 0.05 (7.14%) and 0.25 (35.71%) for recall, 0.08 (12.37%) and 0.28 (42.33%) for F1 score, 0.06 (7.54%) and 0.15 (18.86%) for specificity, 0.06 (7.90%) and 0.20 (27.36%) for balance accuracy, − 0.07 (− 38.36%) and − 0.15 (− 82.15%) for FDR, − 0.03 (− 22.96%) and − 0.10 (− 81.67%) for MDR, and 9.93 (109.39%) and 389.93
(4297.14%) for DOR respectively. It has been also very evi-dent that in spite of improving the result, the incorporation of N in OR + MV reduces the values of these metrics which might be because of losing information due to less vari-ability in PIDD.
Results for QML model
The performance of the QML model greatly relies on the number of layers being employed. Therefore, exhaustive experimentation has been done by varying the number of layers (2, 4, 6, and 8) to find the optimum number of lay-ers. It has been observed that the QML model with 4 layers provides optimum validation accuracy (Fig. 8). This may be because the higher number of layers leads towards over-fitting whereas, lesser layers to underfitting particularly for a small dataset like PIDD. Therefore, the QML model
Fig. 6 Performance comparison of developed DL models
Fig. 7 Confusion matrix for developed DL model a original, b OR, c OR + MV, d OR + MV + N
Table 7 Performance evaluation of developed DL model under vari-ous preprocessing steps
SN Metrics Original OR OR + MV OR + MV + N
1 Precision 0.61 0.71 0.90 0.822 Accuracy 0.77 0.83 0.95 0.913 Recall 0.70 0.75 0.95 0.904 F1 score 0.65 0.73 0.93 0.865 Specificity 0.80 0.86 0.95 0.916 Balanced accuracy 0.75 0.81 0.95 0.907 FDR 0.18 0.11 0.03 0.078 MDR 0.12 0.09 0.02 0.039 DOR 9.07 19.00 399.00 90.00

Complex & Intelligent Systems
1 3
developed using four layers dominates other models by a minimum margin of 3.70%.
The developed QML model with the optimum num-ber of layers has been used to evaluate the performance of both the original and preprocessed dataset. Since, the norm square is always equal to one in QM which is the prime requirement and has to be taken care while state preparation. Hence, normalization is the inherent property of quantum computing therefore, the performance of the developed QML model has been evaluated on the original, OR + N, and OR + MV + N dataset which has been illus-trated in the form of confusion matrix’s in Fig. 9.
Based upon these confusion matrix’s performance of developed QML models have been computed and presented in Table 8. It has been observed that both the OR + N and OR + MV + N preprocessing techniques greatly uplift the performance of developed QML model as compared with original PIDD by 0.19 (38.46%) and 0.26 (53.51%) for precision, 0.14 (20.93%) and 0.19 (27.91%) for accu-racy, 0.15 (23.08%) and 0.20 (30.77%) for recall, 0.18 (32.54%) and 0.24 (42.93%) for F1 score, 0.14 (20.00%) and 0.18 (26.67%) for specificity, 0.14 (21.50%) and 0.19 (28.67%) for balanced accuracy, − 0.18 (− 55.29%) and − 0.22 (− 66.49%) for FDR, − 0.08 (− 49.14%) and − 0.11
(− 66.49%) for MDR, and 14.02 (352.31%) and 31.91 (801.82%) for DOR respectively.
Results comparison
In this subsection, the simulated results of optimized devel-oped models for the prediction and classification of diabetic person has been compared against each other and also with the previously reported results. It has been observed that the developed DL model yields better prediction on all the performance metrics and therefore, completely outperforms the QML model as illustrated in Table 9. The main reason for the underperformance of QML may be considered as
Fig. 8 Comparison of developed QML models
Fig. 9 Confusion matrix for developed QML models: a Original data, b OR + N, c OR + MV + N
Table 8 Performance metrics of developed QML model under vari-ous preprocessing steps
SN Metrics Original OR + N OR + MV + N
1 Precision 0.48 0.67 0.742 Accuracy 0.67 0.81 0.863 Recall 0.65 0.80 0.854 F1 score 0.55 0.73 0.795 Specificity 0.68 0.82 0.866 Balanced accuracy 0.67 0.81 0.867 FDR 0.33 0.15 0.118 MDR 0.16 0.08 0.059 DOR 3.98 18.00 35.89
Table 9 Comparison of developed models
SN Metrics DL QML
1 Precision 0.90 0.742 Accuracy 0.95 0.863 Recall 0.95 0.854 F1 score 0.93 0.795 Specificity 0.95 0.866 Balanced accuracy 0.95 0.867 FDR 0.03 0.118 MDR 0.02 0.059 DOR 399.00 35.89

Complex & Intelligent Systems
1 3
the smaller PIDD along with the normalization of data. The developed DL model achieves higher values of precision (21.62%), accuracy (10.46%), recall (11.76%), and F1 score (17.72%). It also provides a margin of 10.46% for both speci-ficity and balanced accuracy than to QML model. Further, the lower values of FDR and MDR for DL model as com-pared to QML model indicates that the DL model predicts less false positive and negative values. Additionally, much higher values of DOR have been also observed which clearly reveals that the developed DL model has a very high test performance. Therefore, the proposed DL model appears to be the most appropriate for the classification and prediction of diabetes from the PIDD.
Further, the performance (precision, accuracy, recall and, F1 score) of developed models has been compared against the reported ML and DL model’s performance and their com-parison has been presented in Table 10. It has been observed that all the models perform better and provides acceptable prediction results. However, the developed DL establishes its supremacy and attains the best values for most of the perfor-mance metrics. Furthermore, it enhances the state-of-the-art performance in terms of accuracy, recall, and F1 score by a minimum margin of 0.01 (1.06%), 0.01 (1.06%), and 0.02 (2.20%) respectively with a very slight drop in precision.
Conclusion
In the proposed work, the diabetes prediction model has been accomplished by employing QML and DL frame-work. The importance of preprocessing and EDA has been explored and it has been found that they play an important role in robust and precise prediction. Further, the optimum number of layers have been obtained for both QML and DL
models. The results obtained by utilizing optimum QML and DL models have been compared against the state-of-the-art models and the comparative analysis reveals that the developed DL model outperformed all the other mod-els. Therefore, the developed DL model has shown great potential for the prediction of diabetes from PIDD. Further, although the performance of employed QML is still strug-gling as compared to the proposed DL but, compared with the existing models. In the future, the developed DL model will be examined on other diabetes datasets to examine the robustness of the model and a user-friendly web applica-tion will be developed. Moreover, the proposed QML model needs to integrate with the deep learning framework which may boost the performance against the developed models and state-of-the-art techniques.
Funding None.
Declarations
Conflict of interest The authors declare that they have no conflict of interest.
Open Access This article is licensed under a Creative Commons Attri-bution 4.0 International License, which permits use, sharing, adapta-tion, distribution and reproduction in any medium or format, as long as you give appropriate credit to the original author(s) and the source, provide a link to the Creative Commons licence, and indicate if changes were made. The images or other third party material in this article are included in the article’s Creative Commons licence, unless indicated otherwise in a credit line to the material. If material is not included in the article’s Creative Commons licence and your intended use is not permitted by statutory regulation or exceeds the permitted use, you will need to obtain permission directly from the copyright holder. To view a copy of this licence, visit http:// creat iveco mmons. org/ licen ses/ by/4. 0/.
Table 10 Comparative analysis of proposed and already developed diabetes prediction models
ORT outlier rejection technique, MVT missing value technique, GBM gradient boosting machine, XB XG Boost, DA discriminant analysis, ESD extreme studentized deviate, HM-BagMoov hierarchical multi-level classifiers bagging with multi-objective optimized voting
S.N Authors ORT MVT Methodology Precision Accuracy Recall F1 score
1 Maniruzzaman et al. [33] Group Median Median RF – 0.93 0.797 –2 Bozkurt et al. [34] – – ANN – 0.76 0.53 –3 Hang et al. [35] – – GBM – – 0.874 Yuvraj et al. [31] – – RF 0.94 0.94 0.88 0.915 Kaur et al. [36] – – k-NN 0.87 0.88 0.90 0.886 Hasan et al. [2] IQR Attribute’s Mean AB + XB – – 0.79 –7 Wang et al. [37] – NB RF 0.81 0.87 0.85 0.838 Chatrati et al. [38] – – DA – 0.74 0.72 –9 Bashir et al. [39] ESD k-NN HM-BagMoov – 0.86 0.94 0.8410 Proposed* IQR Class wise median QML 0.74 0.86 0.85 0.7911 Proposed* IQR Class wise median DL 0.90 0.95 0.95 0.93

Complex & Intelligent Systems
1 3
References
1. Misra A, Gopalan H, Jayawardena R et al (2019) Diabetes in developing countries. J Diabetes 11:522–539. https:// doi. org/ 10. 1111/ 1753- 0407. 12913
2. Hasan MK, Alam MA, Das D et al (2020) Diabetes prediction using ensembling of different machine learning classifiers. IEEE Access 8:76516–76531. https:// doi. org/ 10. 1109/ ACCESS. 2020. 29898 57
3. Naz H, Ahuja S (2020) Deep learning approach for diabetes prediction using PIMA Indian dataset. J Diabetes Metab Disord 19:391–403. https:// doi. org/ 10. 1007/ s40200- 020- 00520-5
4. Saeedi P, Petersohn I, Salpea P et al (2019) Global and regional diabetes prevalence estimates for 2019 and projections for 2030 and 2045: Results from the International Diabetes Federation Diabetes Atlas, 9th edition. Diabetes Res Clin Pract 157:107843. https:// doi. org/ 10. 1016/j. diabr es. 2019. 107843
5. Association AD (2018) Classification and diagnosis of diabe-tes: Standards of medical care in Diabetes 2018. Diabetes Care 41:S13–S27. https:// doi. org/ 10. 2337/ dc18- S002
6. Zhou H, Myrzashova R, Zheng R (2020) Diabetes prediction model based on an enhanced deep neural network. Eurasip J Wirel Commun Netw. https:// doi. org/ 10. 1186/ s13638- 020- 01765-7
7. International Diabetes Federation (2019) IDF Diabetes Atlas, 9th edn. International Diabetes Federation, Brussels
8. Kumar S, Yadav D, Gupta H et al (2021) A novel yolov3 algo-rithm-based deep learning approach for waste segregation: towards smart waste management. Electronics 10:1–20. https:// doi. org/ 10. 3390/ elect ronic s1001 0014
9. Kollias D, Tagaris A, Stafylopatis A et al (2018) Deep neural architectures for prediction in healthcare. Complex Intell Syst 4:119–131. https:// doi. org/ 10. 1007/ s40747- 017- 0064-6
10. Gupta H, Kumar S, Yadav D et al (2021) Data analytics and mathematical modeling for simulating the dynamics of COVID-19 epidemic—a case study of India. Electronics 10:127. https:// doi. org/ 10. 3390/ elect ronic s1002 0127
11. Larabi-Marie-Sainte S, Aburahmah L, Almohaini R, Saba T (2019) Current techniques for diabetes prediction: review and case study. Appl Sci. https:// doi. org/ 10. 3390/ app92 14604
12. Sisodia D, Sisodia DS (2018) Prediction of diabetes using clas-sification algorithms. Proc Comput Sci 132:1578–1585. https:// doi. org/ 10. 1016/j. procs. 2018. 05. 122
13. Soltani Z, Jafarian A (2016) A new artificial neural networks approach for diagnosing diabetes disease type II. Int J Adv Com-put Sci Appl 7:89–94. https:// doi. org/ 10. 14569/ ijacsa. 2016. 070611
14. Maniruzzaman M, Kumar N, Menhazul Abedin M et al (2017) Comparative approaches for classification of diabetes mellitus data: machine learning paradigm. Comput Methods Programs Biomed 152:23–34. https:// doi. org/ 10. 1016/j. cmpb. 2017. 09. 004
15. MadhuSudana Rao N, Kannan K, Gao X, Roy DS (2018) Novel classifiers for intelligent disease diagnosis with multi-objective parameter evolution. Comput Electr Eng 67:483–496. https:// doi. org/ 10. 1016/j. compe leceng. 2018. 01. 039
16. Tiwari P, Melucci M (2019) Towards a quantum-inspired binary classifier. IEEE Access 7:42354–42372. https:// doi. org/ 10. 1109/ ACCESS. 2019. 29046 24
17. Khan TM, Robles-Kelly A (2020) Machine learning: quantum vs classical. IEEE Access 8:219275–219294. https:// doi. org/ 10. 1109/ ACCESS. 2020. 30417 19
18. Wittek P (2014) Quantum machine learning: what quantum com-puting means to data mining. Elsevier Inc., Amsterdam
19. Chi Y, Liu X, Xia K, Su C (2008) An intelligent diagnosis to type 2 diabetes based on QPSO algorithm and WLS-SVM. In:
Proceedings 2nd 2008 international symposium on intelligent information technology application workshop, IITA 2008 Work-shop. pp 117–121
20. Sergioli G, Bosyk GM, Santucci E, Giuntini R (2017) A quantum-inspired version of the classification problem. Int J Theor Phys 56:3880–3888. https:// doi. org/ 10. 1007/ s10773- 017- 3371-1
21. De Pinho AG, Vellasco M, Da Cruz AVA (2009) A new model for credit approval problems: a quantum-inspired neuro-evolutionary algorithm with binary-real representation. In: 2009 World Congr Nat Biol Inspired Comput NABIC 2009-Proc, pp 445–450. https:// doi. org/ 10. 1109/ NABIC. 2009. 53933 27
22. Li YC, Zhou R, Xu RQ et al (2020) A quantum mechanics-based framework for EEG signal feature extraction and classification. IEEE Trans Emerg Top Comput. https:// doi. org/ 10. 1109/ TETC. 2020. 30007 34
23. Moustakidis S, Christodoulou E, Papageorgiou E et al (2019) Application of machine intelligence for osteoarthritis classi-fication: a classical implementation and a quantum perspec-tive. Quantum Mach Intell 1:73–86. https:// doi. org/ 10. 1007/ s42484- 019- 00008-3
24. Pima Indians Diabetes Database | Kaggle. https:// www. kaggle. com/ uciml/ pima- india ns- diabe tes- datab ase. Accessed 10 Feb 2021
25. Ranga Suri NNR, Murty MN, Athithan G (2019) Outliers in high dimensional data. In: Intelligent systems reference library. Springer Science and Business Media Deutschland GmbH, pp 95–111
26. Miller AS, Blott BH, Hames TK (1992) Review of neural network applications in medical imaging and signal processing. Med Biol Eng Comput 30:449–464
27. Zidan M, Abdel-Aty AH, El-shafei M et al (2019) Quantum clas-sification algorithm based on competitive learning neural network and entanglement measure. Appl Sci 9:1–15. https:// doi. org/ 10. 3390/ app90 71277
28. Terashi K, Kaneda M, Kishimoto T et al (2020) Event classifica-tion with quantum machine learning in high-energy physics. arXiv 5:1–11
29. Havlíček V, Córcoles AD, Temme K et al (2019) Supervised learn-ing with quantum-enhanced feature spaces. Nature 567:209–212. https:// doi. org/ 10. 1038/ s41586- 019- 0980-2
30. Glas AS, Lijmer JG, Prins MH et al (2003) The diagnostic odds ratio: a single indicator of test performance. J Clin Epidemiol 56:1129–1135. https:// doi. org/ 10. 1016/ S0895- 4356(03) 00177-X
31. Yuvaraj N, SriPreethaa KR (2017) Diabetes prediction in health-care systems using machine learning algorithms on Hadoop clus-ter. Cluster Comput. https:// doi. org/ 10. 1007/ s10586- 017- 1532-x
32. Verma L, Srivastava S, Negi PC (2018) An intelligent noninvasive model for coronary artery disease detection. Complex Intell Syst 4:11–18. https:// doi. org/ 10. 1007/ s40747- 017- 0048-6
33. Maniruzzaman M, Rahman MJ, Al-MehediHasan M et al (2018) Accurate diabetes risk stratification using machine learning: role of missing value and outliers. J Med Syst. https:// doi. org/ 10. 1007/ s10916- 018- 0940-7
34. Recep Bozkurt M, Yurtay N, Yilmaz Z, Sertkaya C (2014) Com-parison of different methods for determining diabetes. Turk J Electr Eng Comput Sci 22:1044–1055. https:// doi. org/ 10. 3906/ elk- 1209- 82
35. Lai H, Huang H, Keshavjee K et al (2019) Predictive models for diabetes mellitus using machine learning techniques. BMC Endocr Disord 19:101. https:// doi. org/ 10. 1186/ s12902- 019- 0436-6
36. Kaur H, Kumari V (2019) Predictive modelling and analytics for diabetes using a machine learning approach. Appl Comput Inform. https:// doi. org/ 10. 1016/j. aci. 2018. 12. 004
37. Wang Q, Cao W, Guo J et al (2019) DMP_MI: an effective dia-betes mellitus classification algorithm on imbalanced data with

Complex & Intelligent Systems
1 3
missing values. IEEE Access 7:102232–102238. https:// doi. org/ 10. 1109/ ACCESS. 2019. 29298 66
38. Chatrati SP, Hossain G, Goyal A et al (2020) Smart home health monitoring system for predicting type 2 diabetes and hyperten-sion. J King Saud Univ Comput Inf Sci. https:// doi. org/ 10. 1016/j. jksuci. 2020. 01. 010
39. Bashir S, Qamar U, Khan FH (2016) IntelliHealth: a medical decision support application using a novel weighted multi-layer
classifier ensemble framework. J Biomed Inform 59:185–200. https:// doi. org/ 10. 1016/j. jbi. 2015. 12. 001
Publisher’s Note Springer Nature remains neutral with regard to jurisdictional claims in published maps and institutional affiliations.