
CMRT09 Fabrizio Et Al
6
TEXT EXTRACTION FROM STREET LEVEL IMAGES J. Fabrizio 1,2 , M. Cord 1 , B. Marcotegui 2 1 UPMC Univ Paris 06 Laboratoire d’informatique de Paris 6, 75016 Paris, France 2 MINES Paristech, CMM- Centre de morphologie math´ ematique, Math ´ ematiques et Syst ` emes, 35 rue Saint Honor ´ e - 77305 Fontainebleau cedex, France KEY WORDS: Urban, Text, Extraction, Localization, Detection, Learning, Classification ABSTRACT We of fer in thi s art icl e, a met hod for te xt extra cti on in ima ges issu ed from cit y sce nes . Thi s met hod is use d in the French iTowns project (iTowns ANR project, 2008) to automatically enhance cartographic database by extracting text from geolo caliz ed picture s of town streets. This task is difficult as 1. text in this env ironme nt varies in shape , size , color , orien tatio n... 2. pictu res may be blurred, as they are taken from a moving vehicle , and text may hav e perspecti ve defor matio ns, 3. all pictures are take n outsi de with vari ous objects that can lead to false posit ive s and in uncon strai ned condi tions (espe ciall y light vari es from one pictu re to the other). Then, we can not make the assu mptio n on searc hed text. The only suppos ition is that text is not handwritten. Our proces s is based on two main steps: a new segme ntatio n metho d base d on morph ologic al opera tor and a clas sifica tion step base d on a combi natio n of multip le SVM classifi ers. The descrip tion of our proce ss is giv en in this articl e. The efficie ncy of each step is measured and the global scheme is illustrated on an example. 1 INTRODUCTION Automatic text localization in images is a major task in computer vision. Applications of this task are various (au- tomatic image indexing, visual impaired people assistance or optical charac ter reading. ..). Our work deals with text localization and extraction from images in an urban en- vironment and is a part of iTowns project (iTowns ANR pro jec t, 2008 ). Thi s proj ect ha s two mai n goal s : 1. al- lowing a user to navigate freely within the image flow of a city, 2. Extrac ting feature s automatic ally from this im- age flow to automatically enhance cartographic databases and to allow the user to make high level queries on them (go to a given address, generate relevant hybrid text-image navigation maps (itinerary), find the location of an orphan image , selec t the image s that contain an object, etc.). T o achieve this work, geolocalized set of pictures are taken every meter. All images are processed off line to extract as many semantic data as possible and cartographic databases are enhanced with these data. At the same time, each mo- saic of pictures is assembled into a complete immersive panorama (Figure 1). Many studies focus on text detection and localization in ima ges. Howeve r, most of the m are spe cific to a con- strained context such as automatic localization of postal addre sses on en velo pes (Pal umbo et al., 1992) , licen se plate localizati on (Arth et al., 2007) , text extra ction in video sequ ences (Wolf et al., 2002), automatic forms reading (Ka vall ieratou et al., 2001) and more gener ally ”doc uments” (W ahl et al., 198 2). In such context, str ong hypothe sis may be asserted (blocks of text, alignments, temporal re- dunda ncy for video sequence s...) . In our context ( natural scenes in an urban env ironme nt), text comes from vari- ous sources (road sign, storefron t, adve rtisements...). Its extr actio n is diffi cult: no hypothes is can be made on text (style, position, orientation, lighting, perspective deforma- tions...) and the amount of data is huge. T oday , we work on 1 TB for a part of a single distri ct in Paris. Next yea r, more districts will be processed (more than 4 TB). Differ- Figure 2: General principle of our system. ent approaches already exist for text localization in natu- ral scenes. State s of the art are found in (Mancas -Thillo u, 2006, Retornaz and Marcotegui, 2007, Jung et al., 2004, Jia n Liang et al., 200 5). Eve n if preli minary wor ks ex- ist in natural scene (Retornaz and Marcotegui, 2007, Chen and Yuille, 2004), no standard solution really emerges and they do not focus on urban context. The paper presents our method and is organized as follows: the text localization process is presented and every step is deta iled follo wed by the ev aluat ion of main steps . In the last part, results are presented. Then comes the conclusion. 2 SEGMENT A TION BASED STRA TEGY The goa l of our sys tem is to loc ali ze text . Onc e the lo- calization is performed, the text recognition is carried out by an external O.C.R. (but the system may improve the quality of the region by correcting perspective deforma- tions for example). Our system is a region based approach and starts by isola ting letters , then groups them to resto re words and text zones. Region based approach seems to be more efficient, such approach was ranked first (Retornaz and Marcote gui, 2007) during ImagEval campaig n (Im- agEv al, 2006). Our proces s is compo sed of a casc ade of filter s (Figure 2). It segme nts the imag e. Each re gion is analysed to determine whether the region corresponds to text or not. First stag es during sele ction eliminate a part of non text regions but try to keep as many text region as pos sib le (at the pri ce of a lot of fal se posi ti ves). At the end, detected regions that are close to other text regions are grouped all together. Isolated text regions are canceled. 199 In: Stilla U, Rottenste iner F, Paparoditis N ( Eds) CMRT09 . IAPRS, Vol. XXXVIII, Par t 3/W4 --- Paris, Franc e, 3-4 September, 2009 ¯¯¯¯¯¯¯¯¯¯¯¯¯¯¯¯¯¯¯¯¯¯¯¯¯¯¯¯¯¯¯¯¯¯¯¯¯¯¯¯¯¯¯¯¯¯¯¯¯¯¯¯¯¯¯¯¯¯¯¯¯¯¯¯¯¯¯¯¯¯¯¯¯¯¯¯¯¯¯¯¯¯¯¯¯¯¯¯¯¯¯¯¯¯¯¯¯¯¯¯¯¯¯¯¯¯¯¯¯
-
Upload
mahesh-jangid -
Category
Documents
-
view
217 -
download
0
Transcript of CMRT09 Fabrizio Et Al
8/8/2019 CMRT09 Fabrizio Et Al
http://slidepdf.com/reader/full/cmrt09-fabrizio-et-al 1/6
TEXT EXTRACTION FROM STREET LEVEL IMAGESJ. Fabrizio1,2, M. Cord1, B. Marcotegui2
1UPMC Univ Paris 06
Laboratoire d’informatique de Paris 6, 75016 Paris, France2MINES Paristech, CMM- Centre de morphologie mathematique, Mathematiques et Systemes,
35 rue Saint Honore - 77305 Fontainebleau cedex, France
KEY WORDS: Urban, Text, Extraction, Localization, Detection, Learning, Classification
ABSTRACT
We offer in this article, a method for text extraction in images issued from city scenes. This method is used in the
French iTowns project (iTowns ANR project, 2008) to automatically enhance cartographic database by extracting text
from geolocalized pictures of town streets. This task is difficult as 1. text in this environment varies in shape, size,
color, orientation... 2. pictures may be blurred, as they are taken from a moving vehicle, and text may have perspective
deformations, 3. all pictures are taken outside with various objects that can lead to false positives and in unconstrained
conditions (especially light varies from one picture to the other). Then, we can not make the assumption on searched
text. The only supposition is that text is not handwritten. Our process is based on two main steps: a new segmentation
method based on morphological operator and a classification step based on a combination of multiple SVM classifiers.
The description of our process is given in this article. The efficiency of each step is measured and the global scheme isillustrated on an example.
1 INTRODUCTION
Automatic text localization in images is a major task in
computer vision. Applications of this task are various (au-
tomatic image indexing, visual impaired people assistance
or optical character reading...). Our work deals with text
localization and extraction from images in an urban en-
vironment and is a part of iTowns project (iTowns ANR
project, 2008). This project has two main goals : 1. al-
lowing a user to navigate freely within the image flow of
a city, 2. Extracting features automatically from this im-age flow to automatically enhance cartographic databases
and to allow the user to make high level queries on them
(go to a given address, generate relevant hybrid text-image
navigation maps (itinerary), find the location of an orphan
image, select the images that contain an object, etc.). To
achieve this work, geolocalized set of pictures are taken
every meter. All images are processed off line to extract as
many semantic data as possible and cartographic databases
are enhanced with these data. At the same time, each mo-
saic of pictures is assembled into a complete immersive
panorama (Figure 1).
Many studies focus on text detection and localization in
images. However, most of them are specific to a con-strained context such as automatic localization of postal
addresses on envelopes (Palumbo et al., 1992), license plate
localization (Arth et al., 2007), text extraction in video
sequences (Wolf et al., 2002), automatic forms reading
(Kavallieratou et al., 2001) and more generally ”documents”
(Wahl et al., 1982). In such context, strong hypothesis
may be asserted (blocks of text, alignments, temporal re-
dundancy for video sequences...). In our context (natural
scenes in an urban environment), text comes from vari-
ous sources (road sign, storefront, advertisements...). Its
extraction is difficult: no hypothesis can be made on text
(style, position, orientation, lighting, perspective deforma-
tions...) and the amount of data is huge. Today, we work on 1 TB for a part of a single district in Paris. Next year,
more districts will be processed (more than 4 TB). Differ-
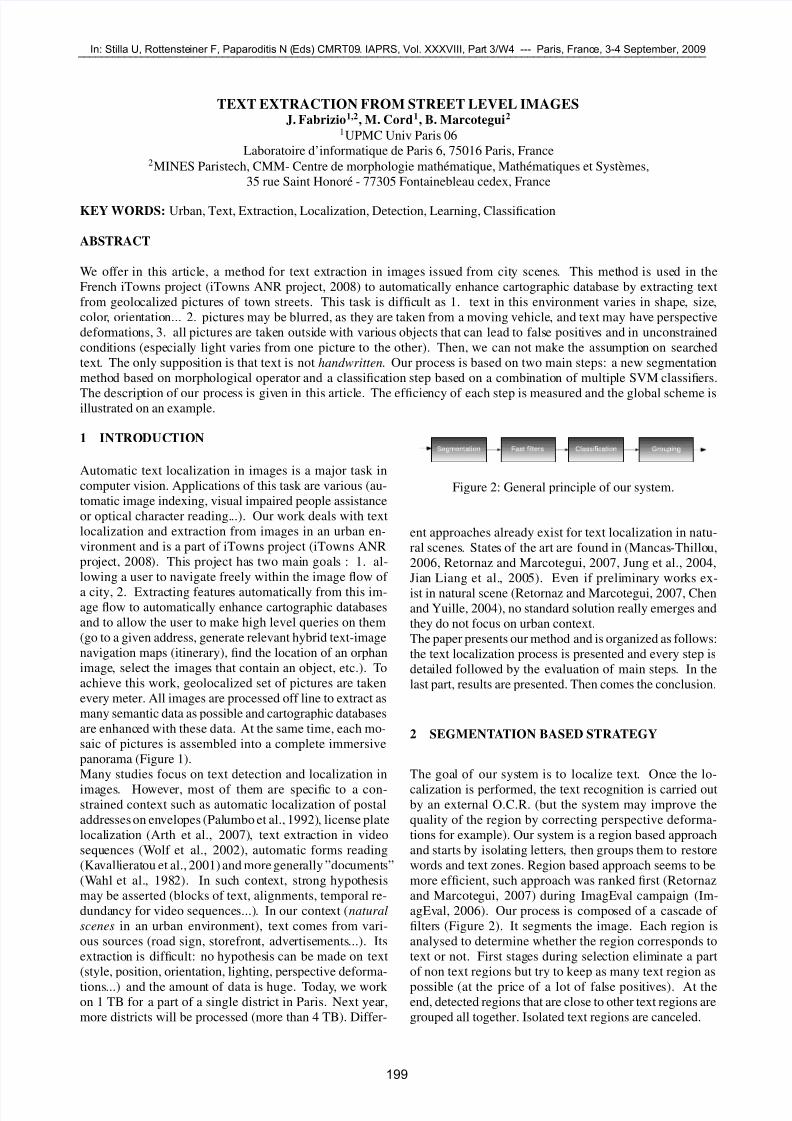
Figure 2: General principle of our system.
ent approaches already exist for text localization in natu-
ral scenes. States of the art are found in (Mancas-Thillou,
2006, Retornaz and Marcotegui, 2007, Jung et al., 2004,
Jian Liang et al., 2005). Even if preliminary works ex-
ist in natural scene (Retornaz and Marcotegui, 2007, Chenand Yuille, 2004), no standard solution really emerges and
they do not focus on urban context.
The paper presents our method and is organized as follows:
the text localization process is presented and every step is
detailed followed by the evaluation of main steps. In the
last part, results are presented. Then comes the conclusion.
2 SEGMENTATION BASED STRATEGY
The goal of our system is to localize text. Once the lo-
calization is performed, the text recognition is carried outby an external O.C.R. (but the system may improve the
quality of the region by correcting perspective deforma-
tions for example). Our system is a region based approach
and starts by isolating letters, then groups them to restore
words and text zones. Region based approach seems to be
more efficient, such approach was ranked first (Retornaz
and Marcotegui, 2007) during ImagEval campaign (Im-
agEval, 2006). Our process is composed of a cascade of
filters (Figure 2). It segments the image. Each region is
analysed to determine whether the region corresponds to
text or not. First stages during selection eliminate a part
of non text regions but try to keep as many text region as
possible (at the price of a lot of false positives). At theend, detected regions that are close to other text regions are
grouped all together. Isolated text regions are canceled.
199
In: Stilla U, Rottensteiner F, Paparoditis N (Eds) CMRT09. IAPRS, Vol. XXXVIII, Part 3/W4 --- Paris, France, 3-4 September, 2009 ¯¯¯¯¯¯¯¯¯¯¯¯¯¯¯¯¯¯¯¯¯¯¯¯¯¯¯¯¯¯¯¯¯¯¯¯¯¯¯¯¯¯¯¯¯¯¯¯¯¯¯¯¯¯¯¯¯¯¯¯¯¯¯¯¯¯¯¯¯¯¯¯¯¯¯¯¯¯¯¯¯¯¯¯¯¯¯¯¯¯¯¯¯¯¯¯¯¯¯¯¯¯¯¯¯¯¯¯¯
8/8/2019 CMRT09 Fabrizio Et Al
http://slidepdf.com/reader/full/cmrt09-fabrizio-et-al 2/6
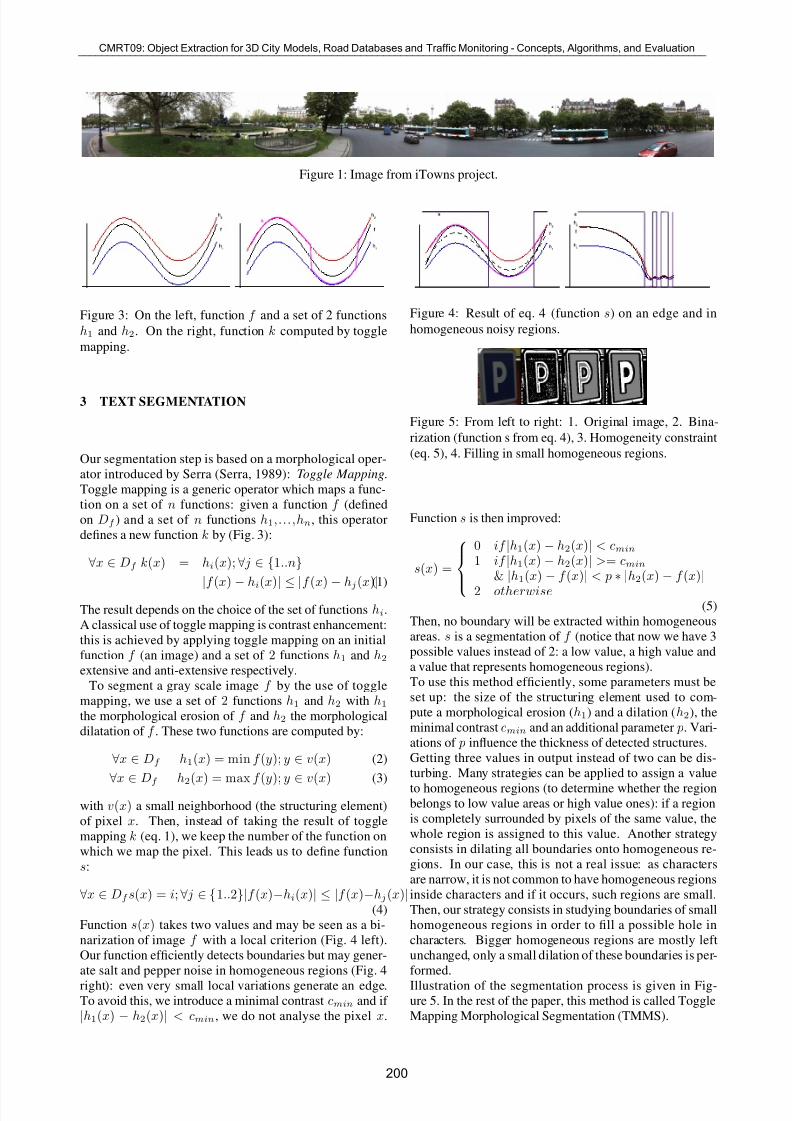
Figure 1: Image from iTowns project.
Figure 3: On the left, function f and a set of 2 functions
h1 and h2. On the right, function k computed by toggle
mapping.
3 TEXT SEGMENTATION
Our segmentation step is based on a morphological oper-
ator introduced by Serra (Serra, 1989): Toggle Mapping.
Toggle mapping is a generic operator which maps a func-
tion on a set of n functions: given a function f (defined
on Df ) and a set of n functions h1,...,hn, this operator
defines a new function k by (Fig. 3):
∀x ∈ Df k(x) = hi(x); ∀ j ∈ {1..n}
|f (x) − hi(x)| ≤ |f (x) − h
j(x)|(1)
The result depends on the choice of the set of functions hi.
A classical use of toggle mapping is contrast enhancement:
this is achieved by applying toggle mapping on an initial
function f (an image) and a set of 2 functions h1 and h2
extensive and anti-extensive respectively.
To segment a gray scale image f by the use of toggle
mapping, we use a set of 2 functions h1 and h2 with h1
the morphological erosion of f and h2 the morphological
dilatation of f . These two functions are computed by:
∀x ∈ Df h1(x) = min f (y); y ∈ v(x) (2)
∀x ∈ Df
h2(x) = max f (y); y ∈ v(x) (3)
with v(x) a small neighborhood (the structuring element)
of pixel x. Then, instead of taking the result of toggle
mapping k (eq. 1), we keep the number of the function on
which we map the pixel. This leads us to define function
s:
∀x ∈ Df s(x) = i; ∀ j ∈ {1..2}|f (x)−hi(x)| ≤ |f (x)−hj(x)|(4)
Function s(x) takes two values and may be seen as a bi-
narization of image f with a local criterion (Fig. 4 left).
Our function efficiently detects boundaries but may gener-
ate salt and pepper noise in homogeneous regions (Fig. 4
right): even very small local variations generate an edge.To avoid this, we introduce a minimal contrast cmin and if
|h1(x) − h2(x)| < cmin, we do not analyse the pixel x.
Figure 4: Result of eq. 4 (function s) on an edge and in
homogeneous noisy regions.
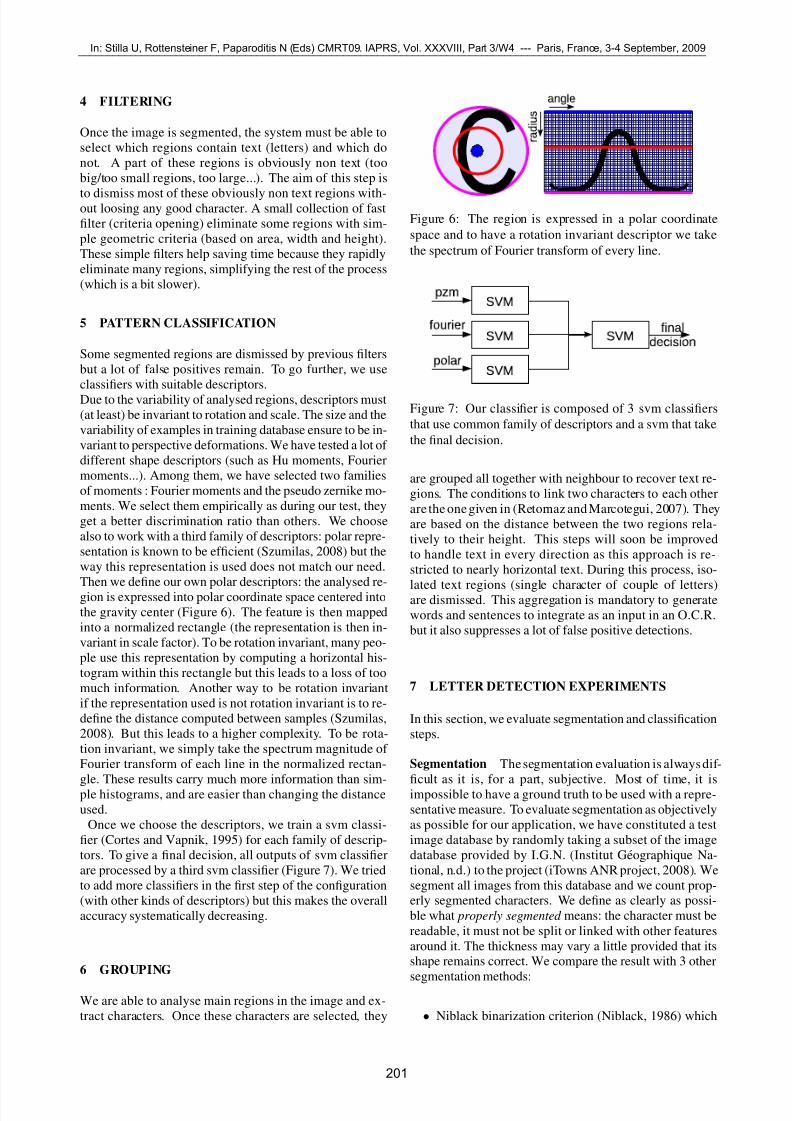
Figure 5: From left to right: 1. Original image, 2. Bina-
rization (function s from eq. 4), 3. Homogeneity constraint
(eq. 5), 4. Filling in small homogeneous regions.
Function s is then improved:
s(x) =
0 if |h1(x) − h2(x)| < cmin
1 if |h1(x) − h2(x)| >= cmin
& |h1(x) − f (x)| < p ∗ |h2(x) − f (x)|
2 otherwise(5)
Then, no boundary will be extracted within homogeneous
areas. s is a segmentation of f (notice that now we have 3
possible values instead of 2: a low value, a high value and
a value that represents homogeneous regions).
To use this method efficiently, some parameters must be
set up: the size of the structuring element used to com-
pute a morphological erosion (h1) and a dilation (h2), the
minimal contrast cmin and an additional parameter p. Vari-
ations of p influence the thickness of detected structures.
Getting three values in output instead of two can be dis-
turbing. Many strategies can be applied to assign a value
to homogeneous regions (to determine whether the regionbelongs to low value areas or high value ones): if a region
is completely surrounded by pixels of the same value, the
whole region is assigned to this value. Another strategy
consists in dilating all boundaries onto homogeneous re-
gions. In our case, this is not a real issue: as characters
are narrow, it is not common to have homogeneous regions
inside characters and if it occurs, such regions are small.
Then, our strategy consists in studying boundaries of small
homogeneous regions in order to fill a possible hole in
characters. Bigger homogeneous regions are mostly left
unchanged, only a small dilation of these boundaries is per-
formed.
Illustration of the segmentation process is given in Fig-ure 5. In the rest of the paper, this method is called Toggle
Mapping Morphological Segmentation (TMMS).
200
CMRT09: Object Extraction for 3D City Models, Road Databases and Traffic Monitoring - Concepts, Algorithms, and Evaluation ¯¯¯¯¯¯¯¯¯¯¯¯¯¯¯¯¯¯¯¯¯¯¯¯¯¯¯¯¯¯¯¯¯¯¯¯¯¯¯¯¯¯¯¯¯¯¯¯¯¯¯¯¯¯¯¯¯¯¯¯¯¯¯¯¯¯¯¯¯¯¯¯¯¯¯¯¯¯¯¯¯¯¯¯¯¯¯¯¯¯¯¯¯¯¯¯¯¯¯¯¯¯¯¯¯¯¯¯¯
8/8/2019 CMRT09 Fabrizio Et Al
http://slidepdf.com/reader/full/cmrt09-fabrizio-et-al 3/6
4 FILTERING
Once the image is segmented, the system must be able to
select which regions contain text (letters) and which do
not. A part of these regions is obviously non text (too
big/too small regions, too large...). The aim of this step is
to dismiss most of these obviously non text regions with-out loosing any good character. A small collection of fast
filter (criteria opening) eliminate some regions with sim-
ple geometric criteria (based on area, width and height).
These simple filters help saving time because they rapidly
eliminate many regions, simplifying the rest of the process
(which is a bit slower).
5 PATTERN CLASSIFICATION
Some segmented regions are dismissed by previous filters
but a lot of false positives remain. To go further, we use
classifiers with suitable descriptors.
Due to the variability of analysed regions, descriptors must
(at least) be invariant to rotation and scale. The size and the
variability of examples in training database ensure to be in-
variant to perspective deformations. We have tested a lot of
different shape descriptors (such as Hu moments, Fourier
moments...). Among them, we have selected two families
of moments : Fourier moments and the pseudo zernike mo-
ments. We select them empirically as during our test, they
get a better discrimination ratio than others. We choose
also to work with a third family of descriptors: polar repre-
sentation is known to be efficient (Szumilas, 2008) but the
way this representation is used does not match our need.
Then we define our own polar descriptors: the analysed re-
gion is expressed into polar coordinate space centered into
the gravity center (Figure 6). The feature is then mapped
into a normalized rectangle (the representation is then in-
variant in scale factor). To be rotation invariant, many peo-
ple use this representation by computing a horizontal his-
togram within this rectangle but this leads to a loss of too
much information. Another way to be rotation invariant
if the representation used is not rotation invariant is to re-
define the distance computed between samples (Szumilas,
2008). But this leads to a higher complexity. To be rota-
tion invariant, we simply take the spectrum magnitude of
Fourier transform of each line in the normalized rectan-
gle. These results carry much more information than sim-ple histograms, and are easier than changing the distance
used.
Once we choose the descriptors, we train a svm classi-
fier (Cortes and Vapnik, 1995) for each family of descrip-
tors. To give a final decision, all outputs of svm classifier
are processed by a third svm classifier (Figure 7). We tried
to add more classifiers in the first step of the configuration
(with other kinds of descriptors) but this makes the overall
accuracy systematically decreasing.
6 GROUPING
We are able to analyse main regions in the image and ex-
tract characters. Once these characters are selected, they
Figure 6: The region is expressed in a polar coordinate
space and to have a rotation invariant descriptor we take
the spectrum of Fourier transform of every line.
Figure 7: Our classifier is composed of 3 svm classifiers
that use common family of descriptors and a svm that take
the final decision.
are grouped all together with neighbour to recover text re-
gions. The conditions to link two characters to each other
are the one given in (Retornaz and Marcotegui, 2007). They
are based on the distance between the two regions rela-
tively to their height. This steps will soon be improved
to handle text in every direction as this approach is re-
stricted to nearly horizontal text. During this process, iso-
lated text regions (single character of couple of letters)are dismissed. This aggregation is mandatory to generate
words and sentences to integrate as an input in an O.C.R.
but it also suppresses a lot of false positive detections.
7 LETTER DETECTION EXPERIMENTS
In this section, we evaluate segmentation and classification
steps.
Segmentation The segmentation evaluation is always dif-
ficult as it is, for a part, subjective. Most of time, it isimpossible to have a ground truth to be used with a repre-
sentative measure. To evaluate segmentation as objectively
as possible for our application, we have constituted a test
image database by randomly taking a subset of the image
database provided by I.G.N. (Institut Geographique Na-
tional, n.d.) to the project (iTowns ANR project, 2008). We
segment all images from this database and we count prop-erly segmented characters. We define as clearly as possi-
ble what properly segmented means: the character must be
readable, it must not be split or linked with other features
around it. The thickness may vary a little provided that itsshape remains correct. We compare the result with 3 other
segmentation methods:
• Niblack binarization criterion (Niblack, 1986) which
201
In: Stilla U, Rottensteiner F, Paparoditis N (Eds) CMRT09. IAPRS, Vol. XXXVIII, Part 3/W4 --- Paris, France, 3-4 September, 2009 ¯¯¯¯¯¯¯¯¯¯¯¯¯¯¯¯¯¯¯¯¯¯¯¯¯¯¯¯¯¯¯¯¯¯¯¯¯¯¯¯¯¯¯¯¯¯¯¯¯¯¯¯¯¯¯¯¯¯¯¯¯¯¯¯¯¯¯¯¯¯¯¯¯¯¯¯¯¯¯¯¯¯¯¯¯¯¯¯¯¯¯¯¯¯¯¯¯¯¯¯¯¯¯¯¯¯¯¯¯
8/8/2019 CMRT09 Fabrizio Et Al
http://slidepdf.com/reader/full/cmrt09-fabrizio-et-al 4/6
evaluates a threshold T (x) for a given pixel x, accord-
ing to its neighborhood by:
T (x) = m(x) + ks(x) (6)
with m and s the mean and the standard deviation
computed on the neighborhood and k ∈ R a parame-
ter.
• Sauvola binarization criterion (Sauvola et al., 1997)
which evaluates a threshold T (x) by:
T (x) = m(x)
1 + k
s(x)
R− 1
(7)
with R the dynamic of standard deviation s(x).
• the segmentation exposed by Retornaz (Retornaz and
Marcotegui, 2007) based on the ultimate opening. This
operator, introduced by Beucher (Beucher, 2007), is
a non-parametric morphological operator that high-lights the most contrasted areas in an image.
The evaluation image database contains 501 characters. Theresults of each method are given in the following table:
% of properly segmented characters
Niblack 73,85
Sauvola 71,26
TMMS 74,85
Ultimate Opening 48,10
Our method gives the best results. Thresholding with Sauvolacriterion is far less efficient on average. It fails frequentlyon text correctly handled with Nilback criterion or our methodbut, in some situations, it gives the best quality segmenta-tion. The overall poor result is explained by the high diffi-culty level of the environment. The ultimate opening sur-prisingly gives bad results. This may come from the factthat images are taken by sensors mounted on a moving car:images may have a motion blur, which makes the ultimateopening fail. We then cancel it from the comparison.The other aspect of our comparison is speed. We evaluateall methods on the set of images and compute mean times.Times are given in seconds for 1920x1080 image size andaccording to the size of the mask of every method:
Mask size 3x3 5x5 7x7 9x9 11x11
Niblack 0,16 0,22 0,33 0,47 0,64
Sauvola 0,16 0,23 0,33 0,47 0,64
TMMS 0,11 0,18 0,27 0,44 0,55
All implementations are performed according to the defi-
nition without any optimization. Our method always gets
the best execution times (Notice that Shafait et al. (Shafait
et al., 2008) have recently offered a faster way to compute
Sauvola criterion).
The speed of the algorithm is important but the output is
also a major aspect as execution time of a complete schemeusually depends on the number of regions provided by seg-
mentation steps. On our database, on average, binarization
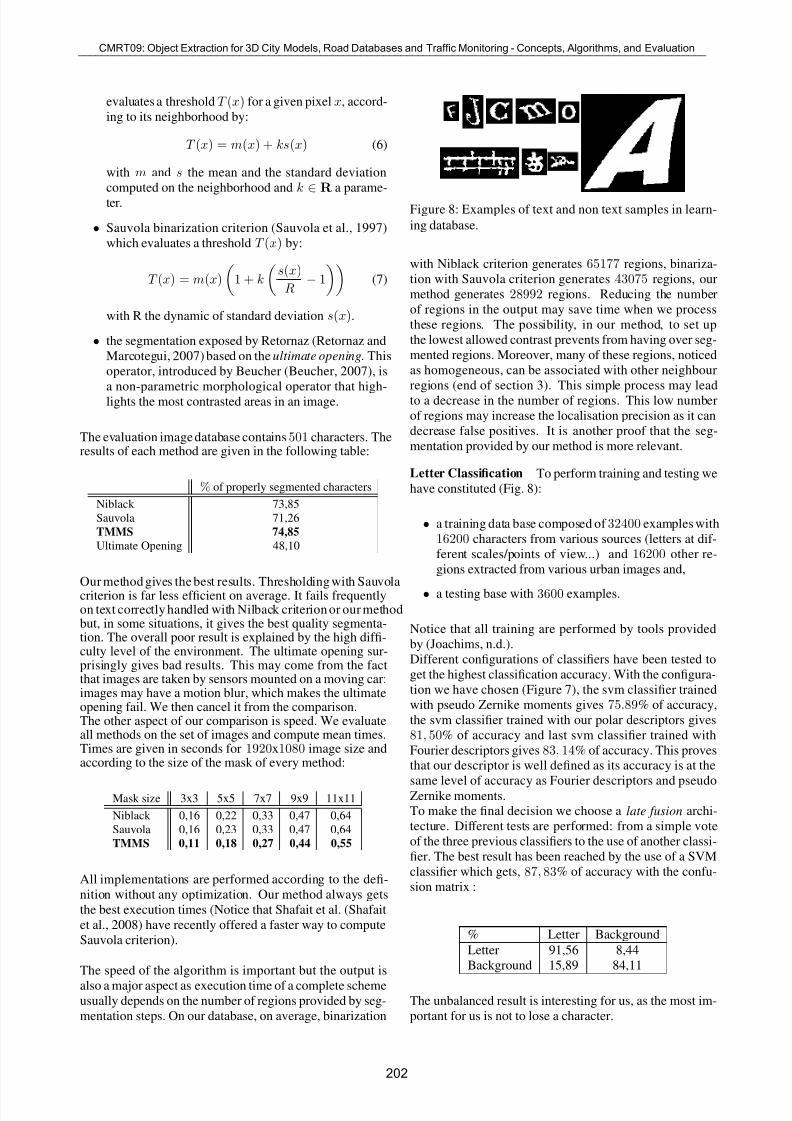
Figure 8: Examples of text and non text samples in learn-
ing database.
with Niblack criterion generates 65177 regions, binariza-
tion with Sauvola criterion generates 43075 regions, our
method generates 28992 regions. Reducing the number
of regions in the output may save time when we process
these regions. The possibility, in our method, to set up
the lowest allowed contrast prevents from having over seg-
mented regions. Moreover, many of these regions, noticed
as homogeneous, can be associated with other neighbour
regions (end of section 3). This simple process may lead
to a decrease in the number of regions. This low number
of regions may increase the localisation precision as it can
decrease false positives. It is another proof that the seg-
mentation provided by our method is more relevant.
Letter Classification To perform training and testing we
have constituted (Fig. 8):
• a training data base composed of 32400 examples with
16200 characters from various sources (letters at dif-
ferent scales/points of view...) and 16200 other re-
gions extracted from various urban images and,
• a testing base with 3600 examples.
Notice that all training are performed by tools provided
by (Joachims, n.d.).
Different configurations of classifiers have been tested to
get the highest classification accuracy. With the configura-
tion we have chosen (Figure 7), the svm classifier trained
with pseudo Zernike moments gives 75.89% of accuracy,
the svm classifier trained with our polar descriptors gives
81, 50% of accuracy and last svm classifier trained with
Fourier descriptors gives 83, 14% of accuracy. This provesthat our descriptor is well defined as its accuracy is at the
same level of accuracy as Fourier descriptors and pseudoZernike moments.To make the final decision we choose a late fusion archi-
tecture. Different tests are performed: from a simple vote
of the three previous classifiers to the use of another classi-
fier. The best result has been reached by the use of a SVM
classifier which gets, 87, 83% of accuracy with the confu-
sion matrix :
% Letter Background
Letter 91,56 8,44
Background 15,89 84,11
The unbalanced result is interesting for us, as the most im-
portant for us is not to lose a character.
202
CMRT09: Object Extraction for 3D City Models, Road Databases and Traffic Monitoring - Concepts, Algorithms, and Evaluation ¯¯¯¯¯¯¯¯¯¯¯¯¯¯¯¯¯¯¯¯¯¯¯¯¯¯¯¯¯¯¯¯¯¯¯¯¯¯¯¯¯¯¯¯¯¯¯¯¯¯¯¯¯¯¯¯¯¯¯¯¯¯¯¯¯¯¯¯¯¯¯¯¯¯¯¯¯¯¯¯¯¯¯¯¯¯¯¯¯¯¯¯¯¯¯¯¯¯¯¯¯¯¯¯¯¯¯¯¯
8/8/2019 CMRT09 Fabrizio Et Al
http://slidepdf.com/reader/full/cmrt09-fabrizio-et-al 5/6
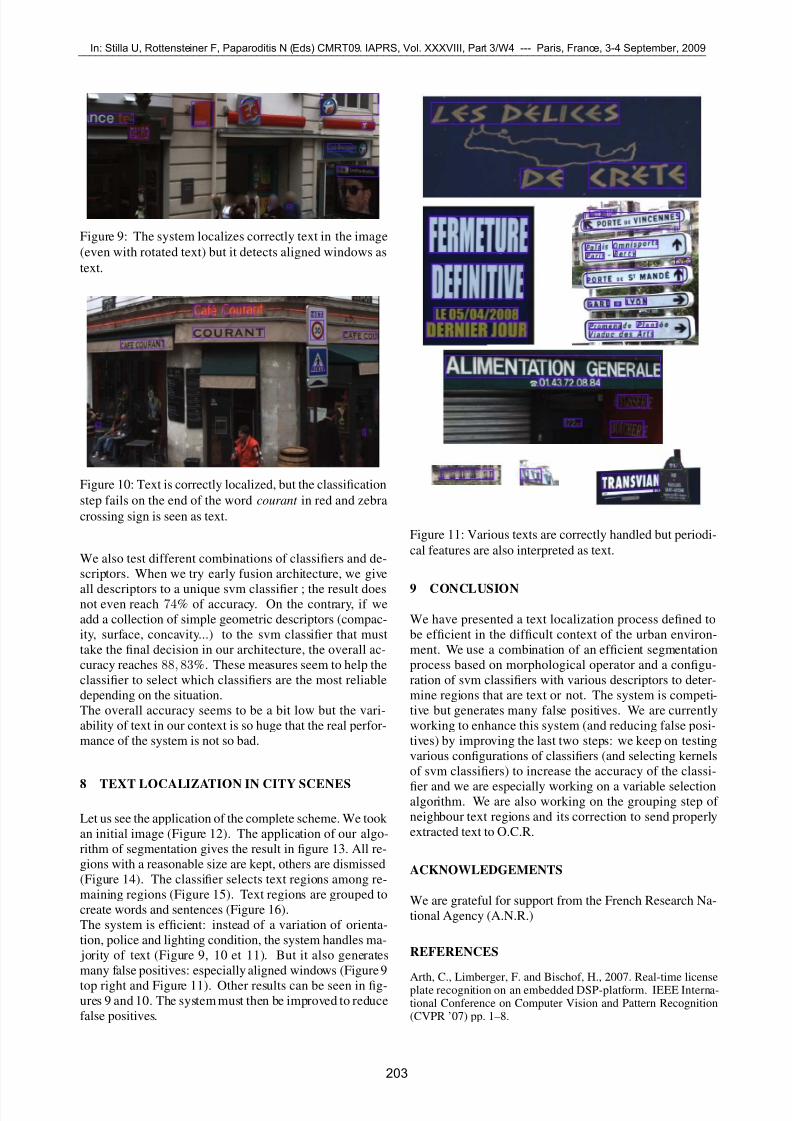
Figure 9: The system localizes correctly text in the image
(even with rotated text) but it detects aligned windows as
text.
Figure 10: Text is correctly localized, but the classification
step fails on the end of the word courant in red and zebra
crossing sign is seen as text.
We also test different combinations of classifiers and de-
scriptors. When we try early fusion architecture, we give
all descriptors to a unique svm classifier ; the result doesnot even reach 74% of accuracy. On the contrary, if we
add a collection of simple geometric descriptors (compac-
ity, surface, concavity...) to the svm classifier that must
take the final decision in our architecture, the overall ac-
curacy reaches 88, 83%. These measures seem to help the
classifier to select which classifiers are the most reliable
depending on the situation.
The overall accuracy seems to be a bit low but the vari-
ability of text in our context is so huge that the real perfor-
mance of the system is not so bad.
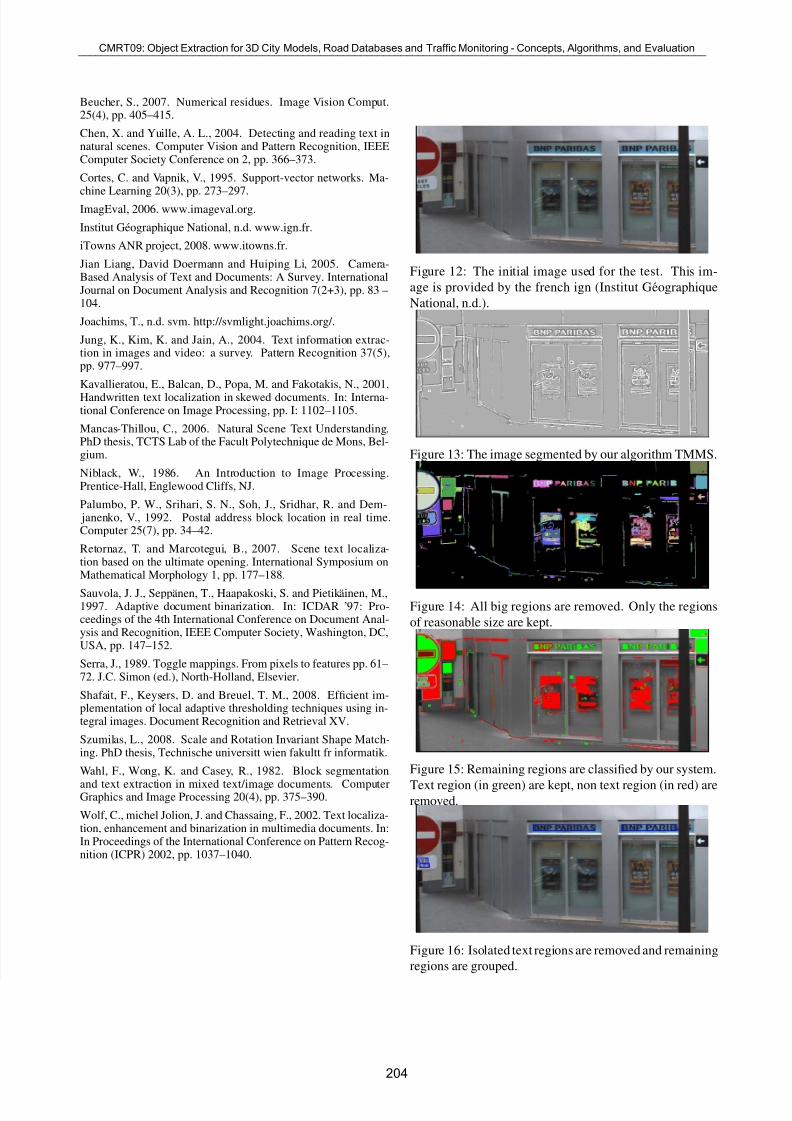
8 TEXT LOCALIZATION IN CITY SCENES
Let us see the application of the complete scheme. We took
an initial image (Figure 12). The application of our algo-
rithm of segmentation gives the result in figure 13. All re-
gions with a reasonable size are kept, others are dismissed
(Figure 14). The classifier selects text regions among re-
maining regions (Figure 15). Text regions are grouped to
create words and sentences (Figure 16).
The system is efficient: instead of a variation of orienta-
tion, police and lighting condition, the system handles ma-
jority of text (Figure 9, 10 et 11). But it also generates
many false positives: especially aligned windows (Figure 9
top right and Figure 11). Other results can be seen in fig-ures 9 and 10. The system must then be improved to reduce
false positives.
Figure 11: Various texts are correctly handled but periodi-
cal features are also interpreted as text.
9 CONCLUSION
We have presented a text localization process defined to
be efficient in the difficult context of the urban environ-
ment. We use a combination of an efficient segmentation
process based on morphological operator and a configu-
ration of svm classifiers with various descriptors to deter-
mine regions that are text or not. The system is competi-
tive but generates many false positives. We are currently
working to enhance this system (and reducing false posi-
tives) by improving the last two steps: we keep on testing
various configurations of classifiers (and selecting kernels
of svm classifiers) to increase the accuracy of the classi-
fier and we are especially working on a variable selectionalgorithm. We are also working on the grouping step of
neighbour text regions and its correction to send properly
extracted text to O.C.R.
ACKNOWLEDGEMENTS
We are grateful for support from the French Research Na-
tional Agency (A.N.R.)
REFERENCES
Arth, C., Limberger, F. and Bischof, H., 2007. Real-time licenseplate recognition on an embedded DSP-platform. IEEE Interna-tional Conference on Computer Vision and Pattern Recognition(CVPR ’07) pp. 1–8.
203
In: Stilla U, Rottensteiner F, Paparoditis N (Eds) CMRT09. IAPRS, Vol. XXXVIII, Part 3/W4 --- Paris, France, 3-4 September, 2009 ¯¯¯¯¯¯¯¯¯¯¯¯¯¯¯¯¯¯¯¯¯¯¯¯¯¯¯¯¯¯¯¯¯¯¯¯¯¯¯¯¯¯¯¯¯¯¯¯¯¯¯¯¯¯¯¯¯¯¯¯¯¯¯¯¯¯¯¯¯¯¯¯¯¯¯¯¯¯¯¯¯¯¯¯¯¯¯¯¯¯¯¯¯¯¯¯¯¯¯¯¯¯¯¯¯¯¯¯¯
8/8/2019 CMRT09 Fabrizio Et Al
http://slidepdf.com/reader/full/cmrt09-fabrizio-et-al 6/6
Beucher, S., 2007. Numerical residues. Image Vision Comput.25(4), pp. 405–415.
Chen, X. and Yuille, A. L., 2004. Detecting and reading text innatural scenes. Computer Vision and Pattern Recognition, IEEEComputer Society Conference on 2, pp. 366–373.
Cortes, C. and Vapnik, V., 1995. Support-vector networks. Ma-
chine Learning 20(3), pp. 273–297.ImagEval, 2006. www.imageval.org.
Institut Geographique National, n.d. www.ign.fr.
iTowns ANR project, 2008. www.itowns.fr.
Jian Liang, David Doermann and Huiping Li, 2005. Camera-Based Analysis of Text and Documents: A Survey. InternationalJournal on Document Analysis and Recognition 7(2+3), pp. 83 –104.
Joachims, T., n.d. svm. http://svmlight.joachims.org/.
Jung, K., Kim, K. and Jain, A., 2004. Text information extrac-tion in images and video: a survey. Pattern Recognition 37(5),pp. 977–997.
Kavallieratou, E., Balcan, D., Popa, M. and Fakotakis, N., 2001.Handwritten text localization in skewed documents. In: Interna-tional Conference on Image Processing, pp. I: 1102–1105.
Mancas-Thillou, C., 2006. Natural Scene Text Understanding.PhD thesis, TCTS Lab of the Facult Polytechnique de Mons, Bel-gium.
Niblack, W., 1986. An Introduction to Image Processing.Prentice-Hall, Englewood Cliffs, NJ.
Palumbo, P. W., Srihari, S. N., Soh, J., Sridhar, R. and Dem- janenko, V., 1992. Postal address block location in real time.Computer 25(7), pp. 34–42.
Retornaz, T. and Marcotegui, B., 2007. Scene text localiza-tion based on the ultimate opening. International Symposium onMathematical Morphology 1, pp. 177–188.
Sauvola, J. J., Seppanen, T., Haapakoski, S. and Pietik ainen, M.,1997. Adaptive document binarization. In: ICDAR ’97: Pro-ceedings of the 4th International Conference on Document Anal-ysis and Recognition, IEEE Computer Society, Washington, DC,USA, pp. 147–152.
Serra, J., 1989. Toggle mappings. From pixels to features pp. 61–72. J.C. Simon (ed.), North-Holland, Elsevier.
Shafait, F., Keysers, D. and Breuel, T. M., 2008. Efficient im-plementation of local adaptive thresholding techniques using in-tegral images. Document Recognition and Retrieval XV.
Szumilas, L., 2008. Scale and Rotation Invariant Shape Match-ing. PhD thesis, Technische universitt wien fakultt fr informatik.
Wahl, F., Wong, K. and Casey, R., 1982. Block segmentation
and text extraction in mixed text/image documents. ComputerGraphics and Image Processing 20(4), pp. 375–390.
Wolf, C., michel Jolion, J. and Chassaing, F., 2002. Text localiza-tion, enhancement and binarization in multimedia documents. In:In Proceedings of the International Conference on Pattern Recog-nition (ICPR) 2002, pp. 1037–1040.
Figure 12: The initial image used for the test. This im-
age is provided by the french ign (Institut Geographique
National, n.d.).
Figure 13: The image segmented by our algorithm TMMS.
Figure 14: All big regions are removed. Only the regions
of reasonable size are kept.
Figure 15: Remaining regions are classified by our system.
Text region (in green) are kept, non text region (in red) areremoved.
Figure 16: Isolated text regions are removed and remaining
regions are grouped.
204
CMRT09: Object Extraction for 3D City Models, Road Databases and Traffic Monitoring - Concepts, Algorithms, and Evaluation ¯¯¯¯¯¯¯¯¯¯¯¯¯¯¯¯¯¯¯¯¯¯¯¯¯¯¯¯¯¯¯¯¯¯¯¯¯¯¯¯¯¯¯¯¯¯¯¯¯¯¯¯¯¯¯¯¯¯¯¯¯¯¯¯¯¯¯¯¯¯¯¯¯¯¯¯¯¯¯¯¯¯¯¯¯¯¯¯¯¯¯¯¯¯¯¯¯¯¯¯¯¯¯¯¯¯¯¯¯