Approximate Inference for Logic Programs with Annotated Disjunctions (RCRA 2009)
7
Stefano Bragaglia DEIS – University of Bologna [email protected] Fabrizio Riguzzi ENDIF – University of Ferrara [email protected]
-
Upload
stefano-bragaglia -
Category
Education
-
view
291 -
download
0
description
These slides, presented at RCRA 2009, summarises my work for the MSc thesis. They introduce some fundamentals on LPADs, the standard inference mechanisms, two approximate algorithms and the graphs documenting our findings.
Transcript of Approximate Inference for Logic Programs with Annotated Disjunctions (RCRA 2009)

Stefano Bragaglia DEIS – University of [email protected]
Fabrizio RiguzziENDIF – University of [email protected]
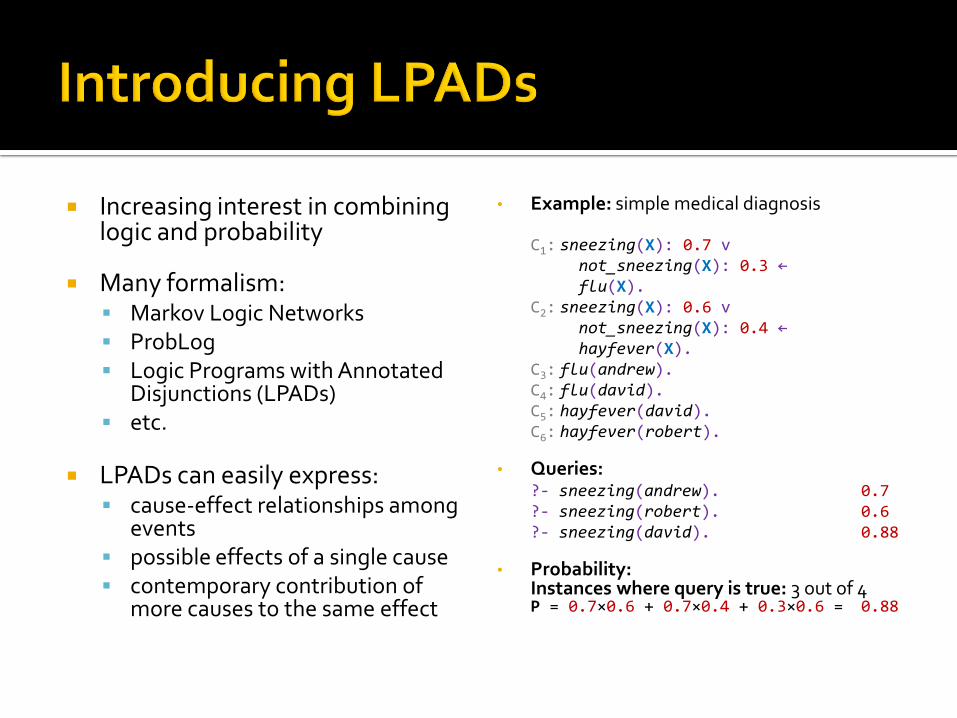
Increasing interest in combining logic and probability
Many formalism: Markov Logic Networks ProbLog Logic Programs with Annotated
Disjunctions (LPADs) etc.
LPADs can easily express: cause-effect relationships among
events possible effects of a single cause contemporary contribution of
more causes to the same effect
• Example: simple medical diagnosis
C1: sneezing(X): 0.7 vnot_sneezing(X): 0.3 ←flu(X).
C2: sneezing(X): 0.6 vnot_sneezing(X): 0.4 ←hayfever(X).
C3: flu(andrew).C4: flu(david).C5: hayfever(david).C6: hayfever(robert).
• Queries:?- sneezing(andrew). 0.7?- sneezing(robert). 0.6?- sneezing(david). 0.88
• Probability:Instances where query is true: 3 out of 4P = 0.7×0.6 + 0.7×0.4 + 0.3×0.6 = 0.88
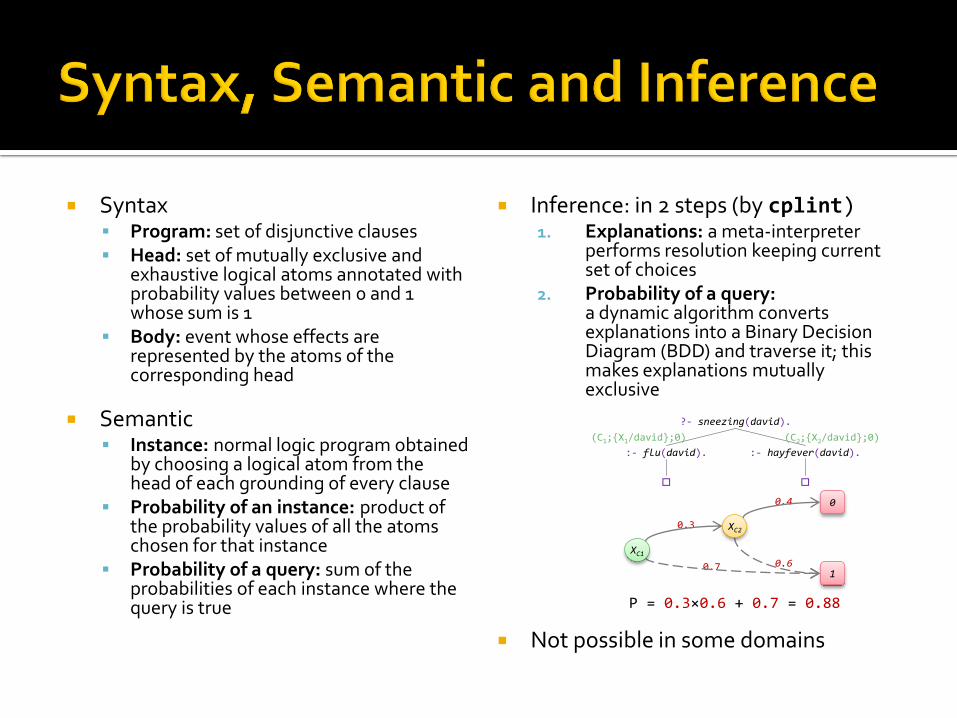
Inference: in 2 steps (by cplint)1. Explanations: a meta-interpreter
performs resolution keeping current set of choices
2. Probability of a query:a dynamic algorithm converts explanations into a Binary Decision Diagram (BDD) and traverse it; this makes explanations mutually exclusive
Not possible in some domains
:- flu(david).
:- hayfever(david).
?- sneezing(david).
(C1;{X1/david};0) (C2;{X2/david};0)
0
10.7
0.3
0.6
0.4
XC1
XC2
P = 0.3×0.6 + 0.7 = 0.88
Syntax Program: set of disjunctive clauses Head: set of mutually exclusive and
exhaustive logical atoms annotated with probability values between 0 and 1 whose sum is 1
Body: event whose effects are represented by the atoms of the corresponding head
Semantic Instance: normal logic program obtained
by choosing a logical atom from the head of each grounding of every clause
Probability of an instance: product of the probability values of all the atoms chosen for that instance
Probability of a query: sum of the probabilities of each instance where the query is true
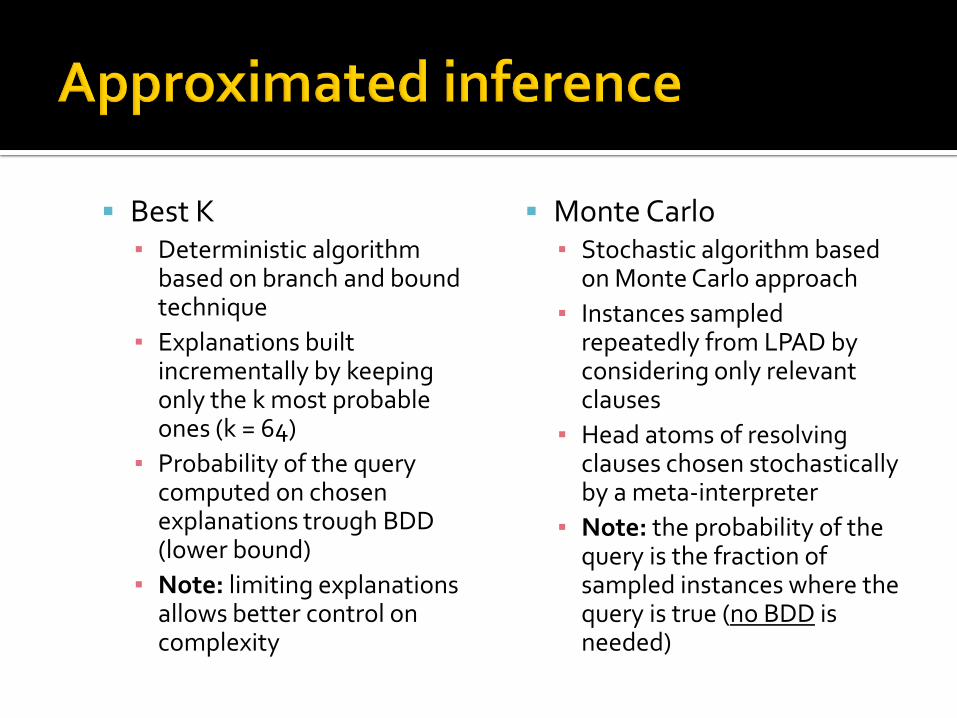
Best K▪ Deterministic algorithm
based on branch and bound technique
▪ Explanations built incrementally by keeping only the k most probable ones (k = 64)
▪ Probability of the query computed on chosen explanations trough BDD (lower bound)
▪ Note: limiting explanations allows better control on complexity
Monte Carlo▪ Stochastic algorithm based
on Monte Carlo approach
▪ Instances sampled repeatedly from LPAD by considering only relevant clauses
▪ Head atoms of resolving clauses chosen stochastically by a meta-interpreter
▪ Note: the probability of the query is the fraction of sampled instances where the query is true (no BDD is needed)
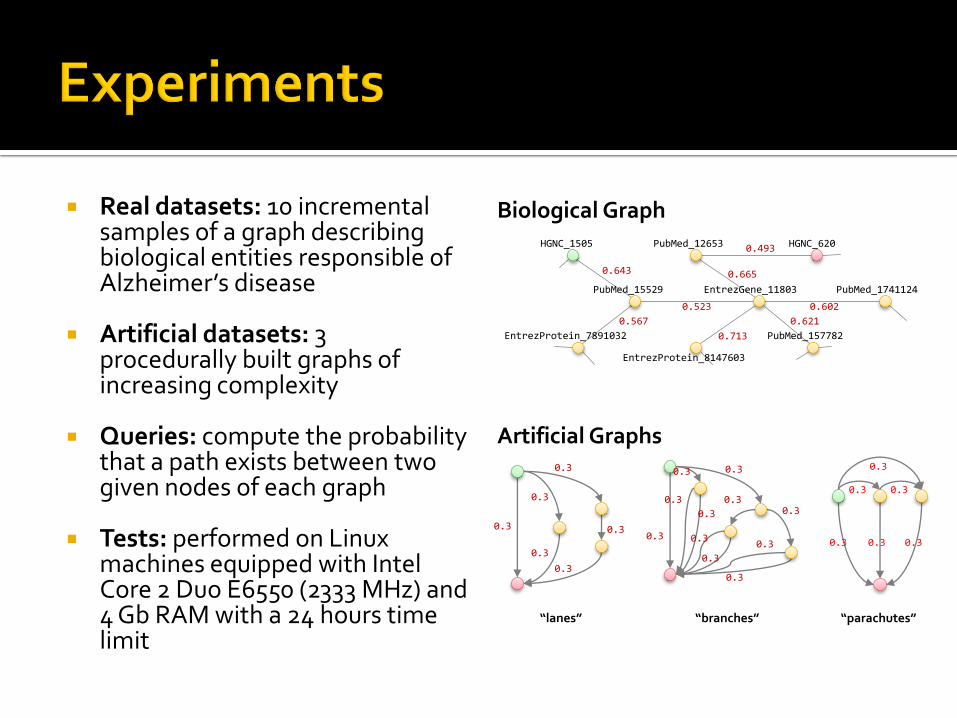
Real datasets: 10 incremental samples of a graph describing biological entities responsible of Alzheimer’s disease
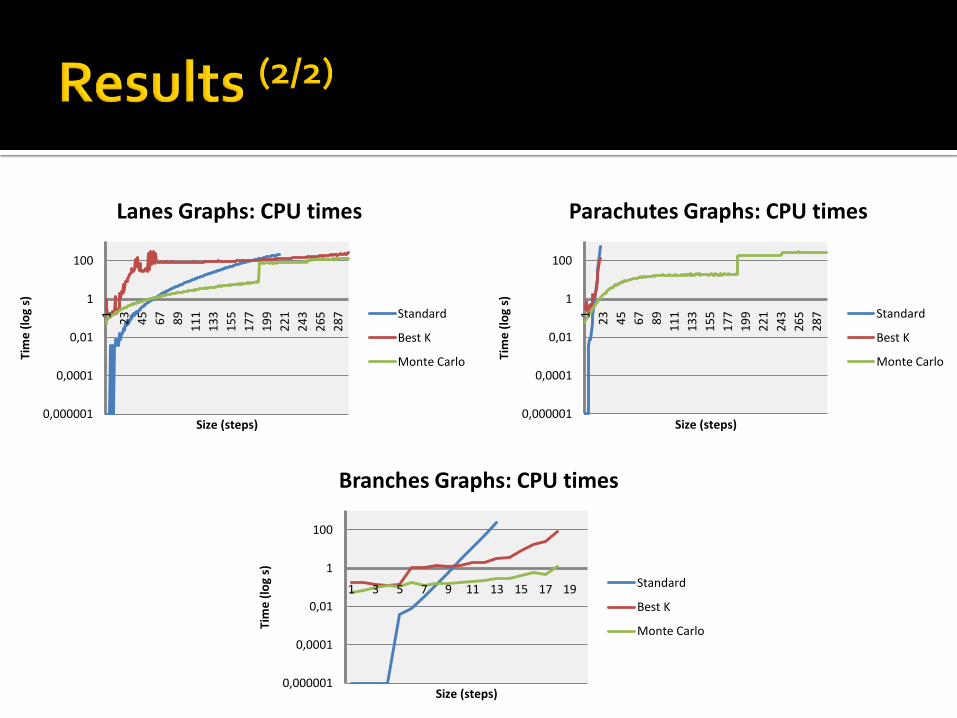
Artificial datasets: 3 procedurally built graphs of increasing complexity
Queries: compute the probability that a path exists between two given nodes of each graph
Tests: performed on Linux machines equipped with Intel Core 2 Duo E6550 (2333 MHz) and 4 Gb RAM with a 24 hours timelimit
0.493
0.665
0.6020.523
0.643
0.567
0.713
0.621
EntrezGene_11803
PubMed_12653 HGNC_620
PubMed_1741124
PubMed_157782
EntrezProtein_8147603
PubMed_15529
HGNC_1505
EntrezProtein_7891032
Biological Graph
Artificial Graphs
0.3
0.3
0.3
0.3
0.3
0.3
“lanes”
0.3
0.3
0.3
0.3
0.3
0.3
0.3
0.3
0.3
0.3
0.3
“branches”
0.3
0.3
0.3
0.3
0.3
0.3
“parachutes”
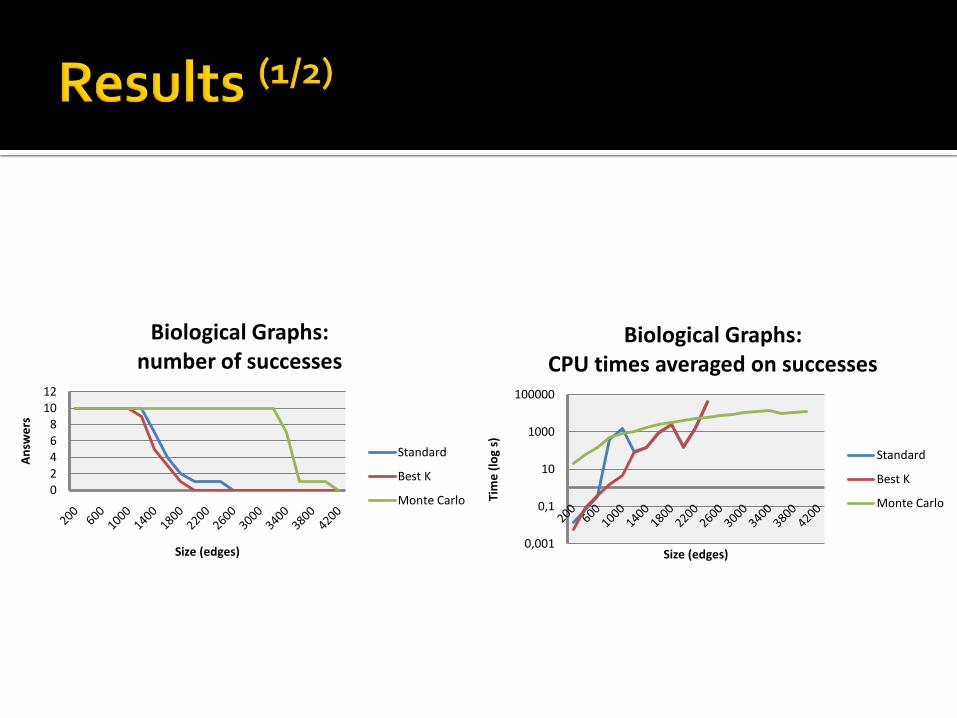
02468
1012
An
swe
rs
Size (edges)
Biological Graphs: number of successes
Standard
Best K
Monte Carlo
0,001
0,1
10
1000
100000
Tim
e (
log
s)
Size (edges)
Biological Graphs: CPU times averaged on successes
Standard
Best K
Monte Carlo
0,000001
0,0001
0,01
1
100
1
23
45
67
89
11
1
13
3
15
5
17
7
19
9
22
1
24
3
26
5
28
7
Tim
e (
log
s)
Size (steps)
Lanes Graphs: CPU times
Standard
Best K
Monte Carlo
0,000001
0,0001
0,01
1
100
1 3 5 7 9 11 13 15 17 19
Tim
e (
log
s)
Size (steps)
Branches Graphs: CPU times
Standard
Best K
Monte Carlo
0,000001
0,0001
0,01
1
100
1
23
45
67
89
11
1
13
3
15
5
17
7
19
9
22
1
24
3
26
5
28
7
Tim
e (
log
s)
Size (steps)
Parachutes Graphs: CPU times
Standard
Best K
Monte Carlo