Analisi multi-pericoli nella citta’ di Torino e nei ...doc/02---derris... · Esperto di Rischi e...
26
Analisi multi-pericoli nella citta’ di Torino e nei distretti industriali Pericolosita’ ed esposizione Torino 14 settembre 2017 With the contribution of the LIFE financial instrument of the European Community LIFE DERRIS - DisastEr Risk Reduction InSurance [email protected] - www.derris.eu LIFE14 CCA/IT/000650 Enrico Ponte – [email protected] Esperto di Rischi e Resilienza GeoAdaptive
Transcript of Analisi multi-pericoli nella citta’ di Torino e nei ...doc/02---derris... · Esperto di Rischi e...

Analisi multi-pericoli nella citta’ di Torino e nei distretti industriali Pericolosita’ ed esposizione
Torino 14 settembre 2017
With the contribution of the LIFE financial
instrument of the European Community
LIFE DERRIS - DisastEr Risk Reduction InSurance
[email protected] - www.derris.eu LIFE14 CCA/IT/000650
Enrico Ponte – [email protected]
Esperto di Rischi e Resilienza GeoAdaptive

14/09/2017 2
With the contribution of the LIFE financial
instrument of the European Community
LIFE DERRIS - DisastEr Risk Reduction InSurance
[email protected] - www.derris.eu
Presentazione del lavoro
Sviluppo e sistematizzazione di una valutazione multi-pericolo • Definire i due rischi significativi per la realta torinese e piu
aggravati dai cambiamenti climatici (isola di calore urbano e inondazione);
• Raccogliere e armonizzare i dati di pericolo esistenti per i rischi selezionati;
• Sviluppare un modello e una caratterizzazione multi-pericolo.
• Sviluppare un inventario di elementi potenzialmente esposti relative alle infrastrutture critiche e alle aree residenziali e commerciali.
• Sviluppare il calcolo delle perdite previste per i portfolio selezionati.
• Sviluppare il processo di mainstreaming tecnico e istituzionale al fine di fornire strategie condivise e prioritizzate.
Analisi dell’esposizione

14/09/2017 3
With the contribution of the LIFE financial
instrument of the European Community
LIFE DERRIS - DisastEr Risk Reduction InSurance
[email protected] - www.derris.eu
Isole di calore urbano
Significativo incremento della temperatura nell’ambito urbano rispetto alle aree rurali circostanti, rispetto alle quali le differenze di temperatura nel corso della notte arrivano non infrequentemente ai 5-6 °C
WMO 2006

14/09/2017 4
With the contribution of the LIFE financial
instrument of the European Community
LIFE DERRIS - DisastEr Risk Reduction InSurance
[email protected] - www.derris.eu
Isole di calore urbano
Profili di temperatura
14/09/2017 5
With the contribution of the LIFE financial
instrument of the European Community
LIFE DERRIS - DisastEr Risk Reduction InSurance
[email protected] - www.derris.eu
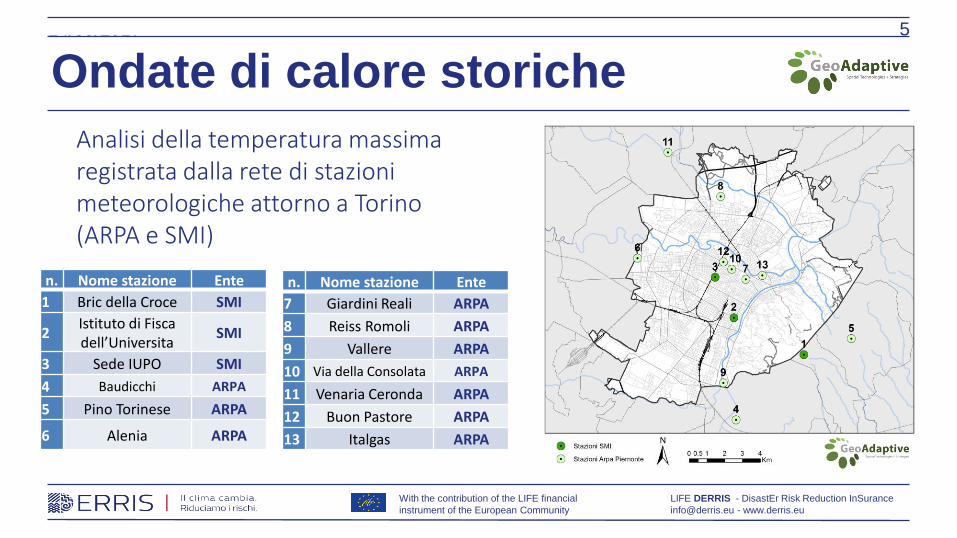
Ondate di calore storiche
Analisi della temperatura massima registrata dalla rete di stazioni meteorologiche attorno a Torino (ARPA e SMI)
n. Nome stazione Ente
1 Bric della Croce SMI
2 Istituto di Fisca dell’Universita
SMI
3 Sede IUPO SMI
4 Baudicchi ARPA
5 Pino Torinese ARPA
6 Alenia ARPA
n. Nome stazione Ente
7 Giardini Reali ARPA
8 Reiss Romoli ARPA
9 Vallere ARPA
10 Via della Consolata ARPA
11 Venaria Ceronda ARPA
12 Buon Pastore ARPA
13 Italgas ARPA

14/09/2017 6
With the contribution of the LIFE financial
instrument of the European Community
LIFE DERRIS - DisastEr Risk Reduction InSurance
[email protected] - www.derris.eu
Selezione degli eventi estremi e propogazione negli anni
Ondate di calore storiche
12.8 12.0 16.0
20.0
42.0
52.9
0.0
10.0
20.0
30.0
40.0
50.0
60.0
70.0
80.0
90.0
100.0
1753-1799 1800-1849 1850-1899 1900-1949 1950-1999 2000-2017
Numero di anni con una giornata con T max > 35 C° [%]
Eventi estremi
Data Temperatura
11 Agosto 2003 41,6 C°
23 Luglio 1945 38,4 C°
21 Luglio 2015 38,1 C°
29 Luglio 1771 38,1 C°
2 Agosto 1928 38,0 C°
8 Agosto 1802 37,5 C°
6 Luglio 2015 37,4 C°
20 Giugno 1858 37,3 C°

14/09/2017 7
With the contribution of the LIFE financial
instrument of the European Community
LIFE DERRIS - DisastEr Risk Reduction InSurance
[email protected] - www.derris.eu
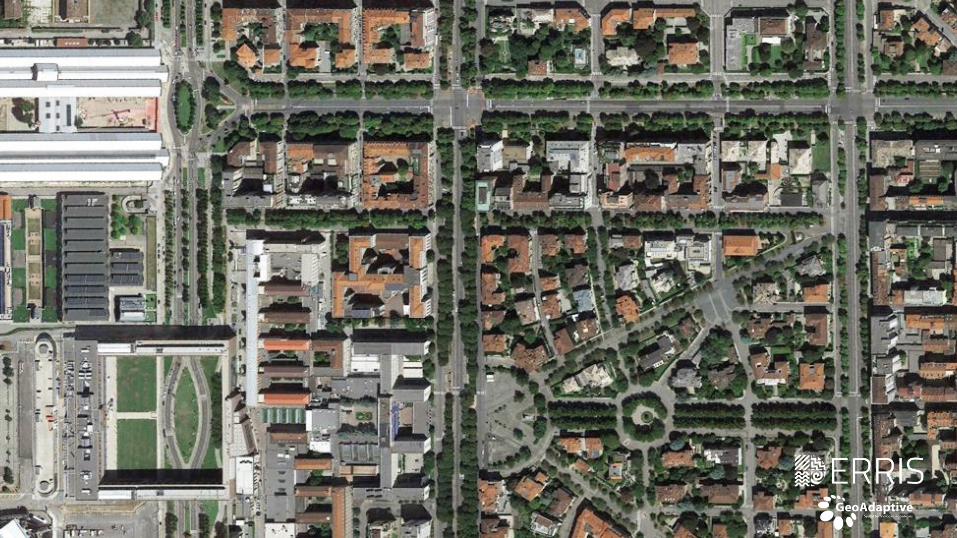
Analisi delle immagini satellitari • I satelliti Landsat e ASTER raccolgono bande visibili e infrarossi termiche • Le immagini elaborate possono consentire di calcolare la copertura del
terreno, la densità della vegetazione e la temperatura superficiale
False color composite (2006) Simplified land cover (2006) purple = developed, green = vegetated, blue = water

14/09/2017 8
With the contribution of the LIFE financial
instrument of the European Community
LIFE DERRIS - DisastEr Risk Reduction InSurance
[email protected] - www.derris.eu
Rappresentazione da satellite
Area Industriale
Distretto Industriale

14/09/2017 9
With the contribution of the LIFE financial
instrument of the European Community
LIFE DERRIS - DisastEr Risk Reduction InSurance
[email protected] - www.derris.eu
Calibrazione dei risultati
• Differenza calcolata tra la temperatura derivata dal satellite e le letture dalle stazioni meteorologiche (vedi a destra)
• I risultati di analisi satellitare evidenziano aree più calde nelle zone industriali e aree più fredde nelle zone con acqua aperta e vegetazione

14/09/2017 10
With the contribution of the LIFE financial
instrument of the European Community
LIFE DERRIS - DisastEr Risk Reduction InSurance
[email protected] - www.derris.eu
Mappature delle UHI
• Basso pericolo: Temperature comprese entro una deviazione standard superiori alla media
• Moderato pericolo: Temperatura comprese tra 1 e 2 deviazioni standard superiori alla media
• Pericolo elevato: Temperatura superiore a due deviazioni standard rispetto alla media
72%
23%
Land Use delle area ad alto pericolo Industrial
Residential
Other Buildings
Paved Area
Agriculture
Vegetation

14/09/2017 11
With the contribution of the LIFE financial
instrument of the European Community
LIFE DERRIS - DisastEr Risk Reduction InSurance
[email protected] - www.derris.eu
UHI per differenti usi del suolo
USO DEL SUOLO
TIPO TEMP.
MEDIA (°C) AREA (HA)
EDIFICIO Produttivo, commerciale 41.5 757.03
Residenziale 39.2 1930.73
SPAZIO VERDE
Verde scolastico 39.2 186.22
Aiuola spartitraffico 38.4 63.43
Piazzale alberato 38.3 31.46
Giardino 38.1 252.37
Verde vario 38.1 69.30
Verde sportivo 38.1 12.77
Banchina alberata 38.1 179.96
Parco 34.3 543.95
Sponde fluviali 32.6 22.96
Parco alberato fitto 29.1 60.79
ACQUA Fiumi 31.4 237.46
14/09/2017 12
With the contribution of the LIFE financial
instrument of the European Community
LIFE DERRIS - DisastEr Risk Reduction InSurance
[email protected] - www.derris.eu
Urban Heat Island - concept

14/09/2017 13
With the contribution of the LIFE financial
instrument of the European Community
LIFE DERRIS - DisastEr Risk Reduction InSurance
[email protected] - www.derris.eu
Urban Heat Island - concept

14/09/2017 14
With the contribution of the LIFE financial
instrument of the European Community
LIFE DERRIS - DisastEr Risk Reduction InSurance
[email protected] - www.derris.eu
Urban Heat Island - concept
22 luglio 2015

14/09/2017 15
With the contribution of the LIFE financial
instrument of the European Community
LIFE DERRIS - DisastEr Risk Reduction InSurance
[email protected] - www.derris.eu
Urban Heat Island - concept

14/09/2017 16
With the contribution of the LIFE financial
instrument of the European Community
LIFE DERRIS - DisastEr Risk Reduction InSurance
[email protected] - www.derris.eu
Urban Heat Island - concept

14/09/2017 17
With the contribution of the LIFE financial
instrument of the European Community
LIFE DERRIS - DisastEr Risk Reduction InSurance
[email protected] - www.derris.eu
Urban Heat Island - concept
22 luglio 2015
14/09/2017 18
With the contribution of the LIFE financial
instrument of the European Community
LIFE DERRIS - DisastEr Risk Reduction InSurance
[email protected] - www.derris.eu
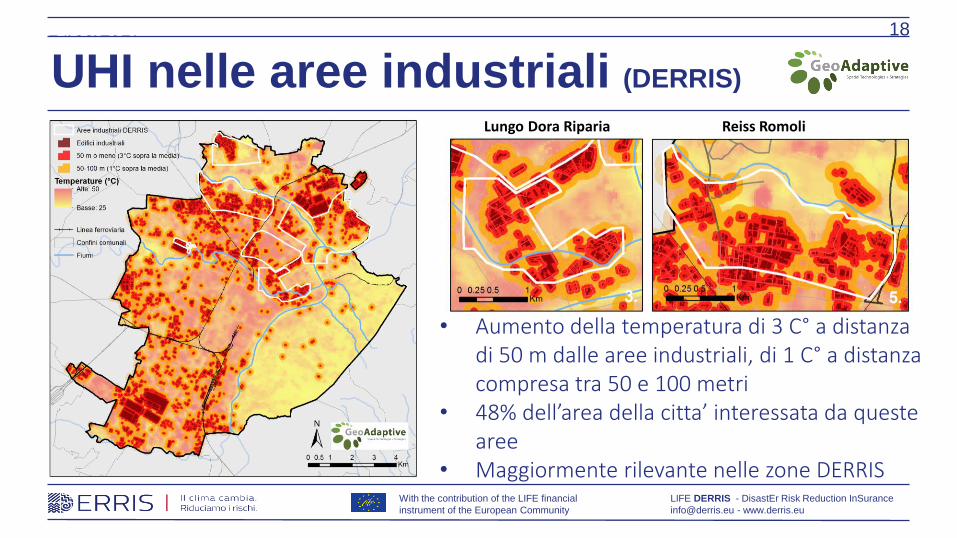
UHI nelle aree industriali (DERRIS)
• Aumento della temperatura di 3 C° a distanza di 50 m dalle aree industriali, di 1 C° a distanza compresa tra 50 e 100 metri
• 48% dell’area della citta’ interessata da queste aree
• Maggiormente rilevante nelle zone DERRIS
Reiss Romoli Lungo Dora Riparia

14/09/2017 19
With the contribution of the LIFE financial
instrument of the European Community
LIFE DERRIS - DisastEr Risk Reduction InSurance
[email protected] - www.derris.eu
Analisi delle inondazioni
FonteDirettiva Alluvioni 2007/60/CE quadro metodologico per la valutazione e la gestione del rischio di alluvioni • Alto pericolo (H): Tempo ritorno fra 20 e
50 anni, ossia alluvioni frequenti • Medio pericolo (M): Tempo ritorno fra
100 e 200 anni, ossia alluvioni poco frequenti
• Basso pericolo (L): Tempo ritorno fino a 500 anni dall’evento, ossia alluvioni rare.
14/09/2017 20
With the contribution of the LIFE financial
instrument of the European Community
LIFE DERRIS - DisastEr Risk Reduction InSurance
[email protected] - www.derris.eu
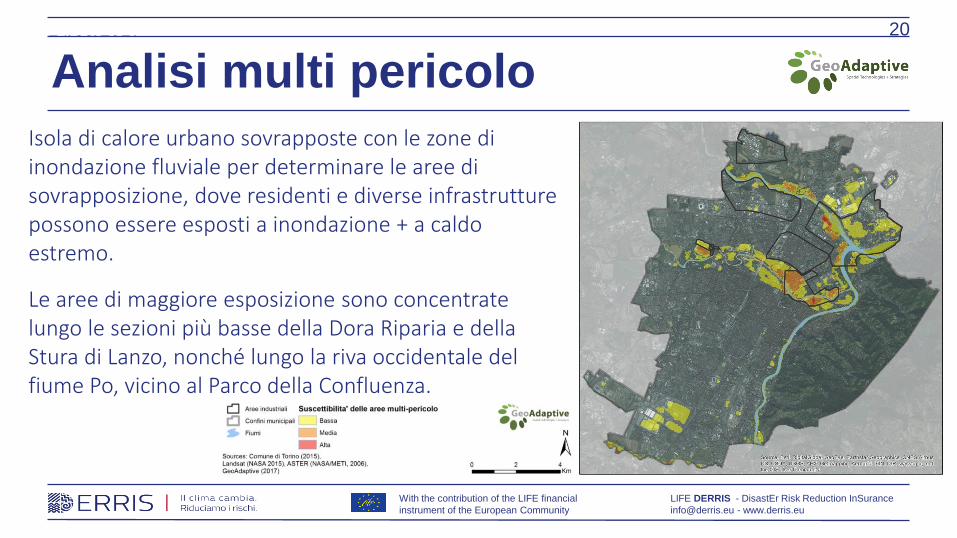
Analisi multi pericolo
Isola di calore urbano sovrapposte con le zone di inondazione fluviale per determinare le aree di sovrapposizione, dove residenti e diverse infrastrutture possono essere esposti a inondazione + a caldo estremo.
Le aree di maggiore esposizione sono concentrate lungo le sezioni più basse della Dora Riparia e della Stura di Lanzo, nonché lungo la riva occidentale del fiume Po, vicino al Parco della Confluenza.

14/09/2017 21
With the contribution of the LIFE financial
instrument of the European Community
LIFE DERRIS - DisastEr Risk Reduction InSurance
[email protected] - www.derris.eu
Analisi multi pericolo (DERRIS)
Parco della Confluenza (ZI verso San Mauro)
Dora Riparia e Cimitero (Lungo Dora Riparia)
• Confluenza Stura di Lanzo nel Po + ampia area industriale.
• Aree rosse ed arancioni prevalentemente residenziali.
• Presenza del fiume Dora Riparia area caratterizzata da un edificato fitto
• assenza di ampie aree verde

14/09/2017 22
With the contribution of the LIFE financial
instrument of the European Community
LIFE DERRIS - DisastEr Risk Reduction InSurance
[email protected] - www.derris.eu
Analisi dell’esposizione
Indicatori Fonte Tipo di pericolo
1 Popolazione 1.1 Over 65 ISTAT UHI, Inondazioni, Multi 1.2 Under 5 ISTAT UHI, Inondazioni, Multi
1.3 Women over 65 ISTAT UHI, Multi 2 Fisica
2.1 Infrastrutture rilevanti GEOPORTALE UHI, Inondazioni, Multi
14/09/2017 23
With the contribution of the LIFE financial
instrument of the European Community
LIFE DERRIS - DisastEr Risk Reduction InSurance
[email protected] - www.derris.eu
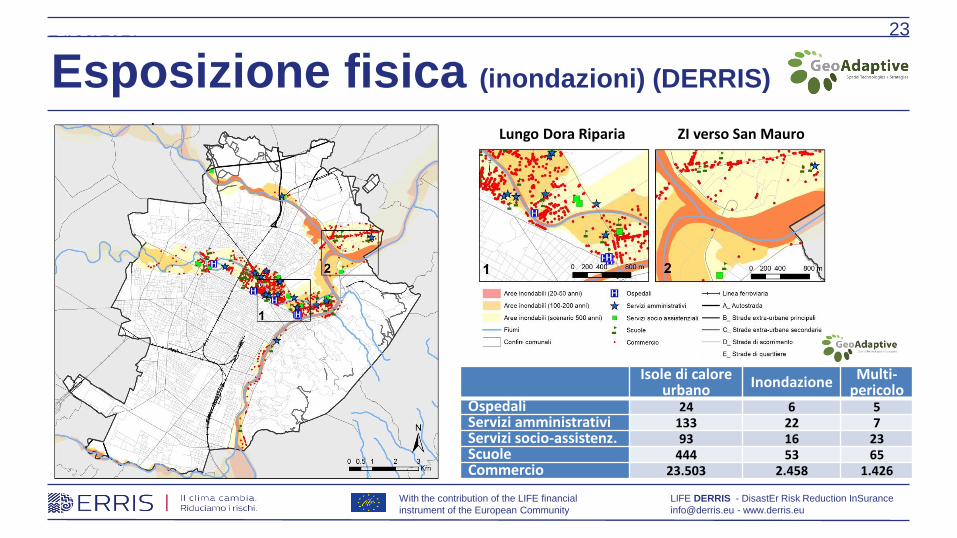
Esposizione fisica (inondazioni) (DERRIS)
Isole di calore urbano Inondazione Multi-
pericolo Ospedali 24 6 5 Servizi amministrativi 133 22 7 Servizi socio-assistenz. 93 16 23 Scuole 444 53 65 Commercio 23.503 2.458 1.426
ZI verso San Mauro Lungo Dora Riparia

14/09/2017 24
With the contribution of the LIFE financial
instrument of the European Community
LIFE DERRIS - DisastEr Risk Reduction InSurance
[email protected] - www.derris.eu
Esposizione umana (UHI)
Isole di calore
urbano Inondazione Multi-
pericolo
Popolaz. over 65 141.116 17.411 10.444
Donne over 65 90.750 (10.299) 7.036
Popolazi. under 5 28.200 4.108 2.838
TOTALE (over 65 + under 5) 260.066 31.818 20.318

14/09/2017 25
With the contribution of the LIFE financial
instrument of the European Community
LIFE DERRIS - DisastEr Risk Reduction InSurance
[email protected] - www.derris.eu
Workshop Co-Design

With the contribution of the LIFE financial
instrument of the European Community
LIFE14 CCA/IT/000650
Enrico Ponte – [email protected]
Esperto di Rischi e Resilienza GeoAdaptive