Diventare Team member Synergy Worldwide o semplicemente acquistare i prodotti
Upload
truongkhuongCategory
view
218download
0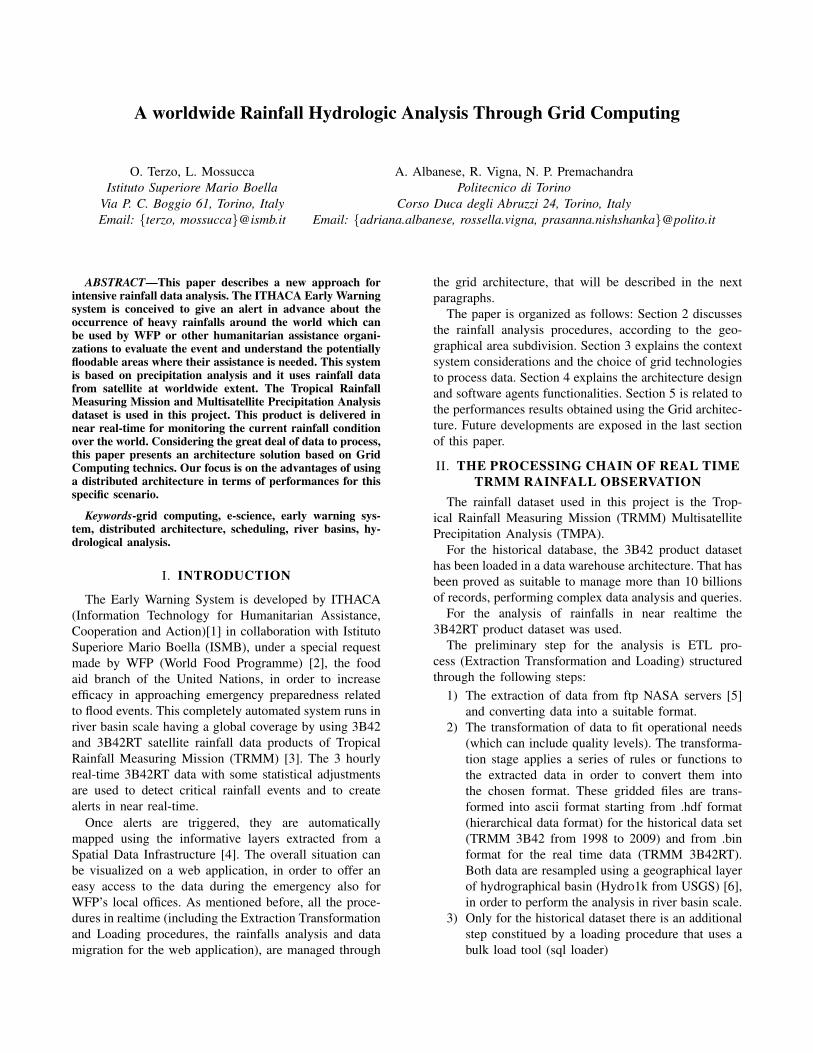
A worldwide Rainfall Hydrologic Analysis Through Grid Computing
O. Terzo, L. MossuccaIstituto Superiore Mario Boella
Via P. C. Boggio 61, Torino, ItalyEmail: {terzo, mossucca}@ismb.it
A. Albanese, R. Vigna, N. P. PremachandraPolitecnico di Torino
Corso Duca degli Abruzzi 24, Torino, ItalyEmail: {adriana.albanese, rossella.vigna, prasanna.nishshanka}@polito.it
ABSTRACT—This paper describes a new approach forintensive rainfall data analysis. The ITHACA Early Warningsystem is conceived to give an alert in advance about theoccurrence of heavy rainfalls around the world which canbe used by WFP or other humanitarian assistance organi-zations to evaluate the event and understand the potentiallyfloodable areas where their assistance is needed. This systemis based on precipitation analysis and it uses rainfall datafrom satellite at worldwide extent. The Tropical RainfallMeasuring Mission and Multisatellite Precipitation Analysisdataset is used in this project. This product is delivered innear real-time for monitoring the current rainfall conditionover the world. Considering the great deal of data to process,this paper presents an architecture solution based on GridComputing technics. Our focus is on the advantages of usinga distributed architecture in terms of performances for thisspecific scenario.
Keywords-grid computing, e-science, early warning sys-tem, distributed architecture, scheduling, river basins, hy-drological analysis.
I. INTRODUCTION
The Early Warning System is developed by ITHACA(Information Technology for Humanitarian Assistance,Cooperation and Action)[1] in collaboration with IstitutoSuperiore Mario Boella (ISMB), under a special requestmade by WFP (World Food Programme) [2], the foodaid branch of the United Nations, in order to increaseefficacy in approaching emergency preparedness relatedto flood events. This completely automated system runs inriver basin scale having a global coverage by using 3B42and 3B42RT satellite rainfall data products of TropicalRainfall Measuring Mission (TRMM) [3]. The 3 hourlyreal-time 3B42RT data with some statistical adjustmentsare used to detect critical rainfall events and to createalerts in near real-time.
Once alerts are triggered, they are automaticallymapped using the informative layers extracted from aSpatial Data Infrastructure [4]. The overall situation canbe visualized on a web application, in order to offer aneasy access to the data during the emergency also forWFP’s local offices. As mentioned before, all the proce-dures in realtime (including the Extraction Transformationand Loading procedures, the rainfalls analysis and datamigration for the web application), are managed through
the grid architecture, that will be described in the nextparagraphs.
The paper is organized as follows: Section 2 discussesthe rainfall analysis procedures, according to the geo-graphical area subdivision. Section 3 explains the contextsystem considerations and the choice of grid technologiesto process data. Section 4 explains the architecture designand software agents functionalities. Section 5 is related tothe performances results obtained using the Grid architec-ture. Future developments are exposed in the last sectionof this paper.
II. THE PROCESSING CHAIN OF REAL TIMETRMM RAINFALL OBSERVATION
The rainfall dataset used in this project is the Trop-ical Rainfall Measuring Mission (TRMM) MultisatellitePrecipitation Analysis (TMPA).
For the historical database, the 3B42 product datasethas been loaded in a data warehouse architecture. That hasbeen proved as suitable to manage more than 10 billionsof records, performing complex data analysis and queries.
For the analysis of rainfalls in near realtime the3B42RT product dataset was used.
The preliminary step for the analysis is ETL pro-cess (Extraction Transformation and Loading) structuredthrough the following steps:
1) The extraction of data from ftp NASA servers [5]and converting data into a suitable format.
2) The transformation of data to fit operational needs(which can include quality levels). The transforma-tion stage applies a series of rules or functions tothe extracted data in order to convert them intothe chosen format. These gridded files are trans-formed into ascii format starting from .hdf format(hierarchical data format) for the historical data set(TRMM 3B42 from 1998 to 2009) and from .binformat for the real time data (TRMM 3B42RT).Both data are resampled using a geographical layerof hydrographical basin (Hydro1k from USGS) [6],in order to perform the analysis in river basin scale.
3) Only for the historical dataset there is an additionalstep constitued by a loading procedure that uses abulk load tool (sql loader)
After these pre-elaboration procedures, the rainfall dataare analyzed through a hydrological model based ondepth-duration-frequency curves [7], which allows thecalculation of cumulated rainfalls in a specific periodfor each hydrographical basin. The rainfall historical dataare used to define these reference curves to which thecumulated rainfall in real-time are compared with.
The first base data for the hydrological analysis is theTRMM rainfall data, having 3 hours temporal resolutionand 0.25 degre sptail resolution (from 50 degrees southto 50 degrees North latitude)
The second one is the geographical surface area fromthe GIS watershed layer of HYDRO1k, a geographicaldatabase which provides a global coverage of topograph-ically derived datasets including drainage basins. Thewatershed layer shown on Figure 1, is hierarchicallyorganized through a territorial subdivision at differentlevels (from one to six).
Figure 1. Drainage basin overview
The level 1 basins corresponding to large geographicalregions (47 in total) are subdivided in 19570 level 6basins. All geographical basins are referred to every rivercatchments: the intersection of the level 6 basins withTRMM grid has generated 311999 micro geographicalentity. The rainfall values are resampled on the basis ofthese entities.
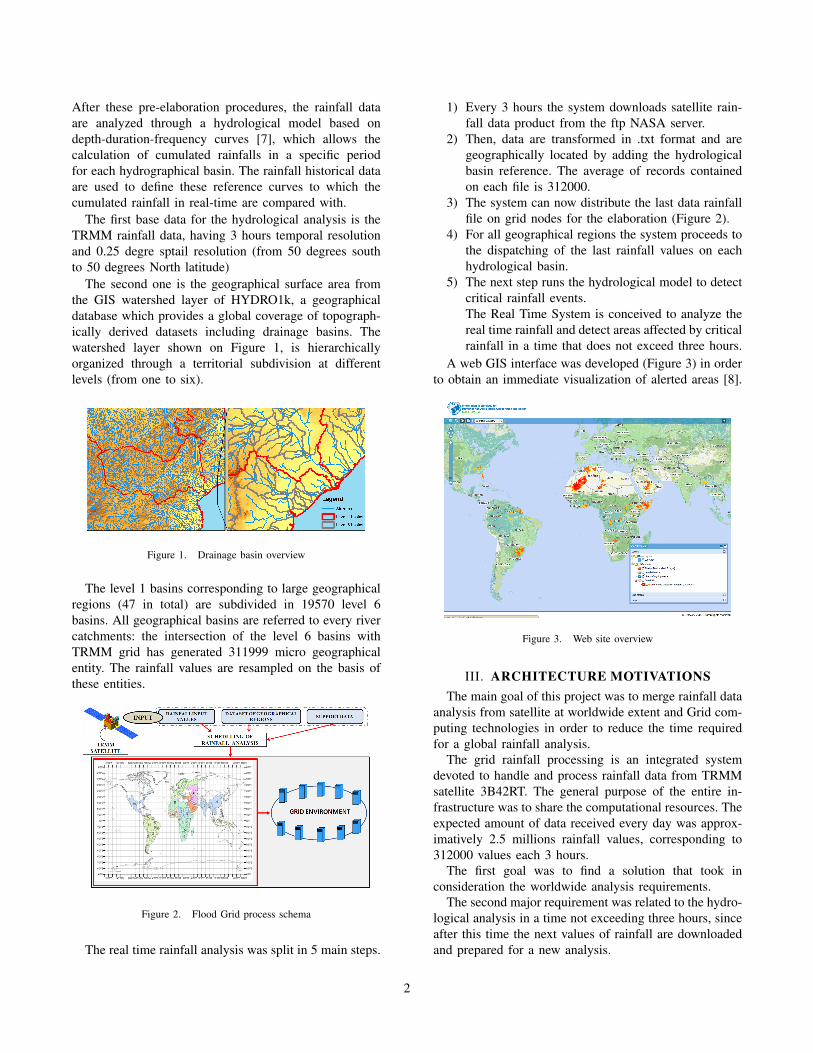
Figure 2. Flood Grid process schema
The real time rainfall analysis was split in 5 main steps.
1) Every 3 hours the system downloads satellite rain-fall data product from the ftp NASA server.
2) Then, data are transformed in .txt format and aregeographically located by adding the hydrologicalbasin reference. The average of records containedon each file is 312000.
3) The system can now distribute the last data rainfallfile on grid nodes for the elaboration (Figure 2).
4) For all geographical regions the system proceeds tothe dispatching of the last rainfall values on eachhydrological basin.
5) The next step runs the hydrological model to detectcritical rainfall events.The Real Time System is conceived to analyze thereal time rainfall and detect areas affected by criticalrainfall in a time that does not exceed three hours.
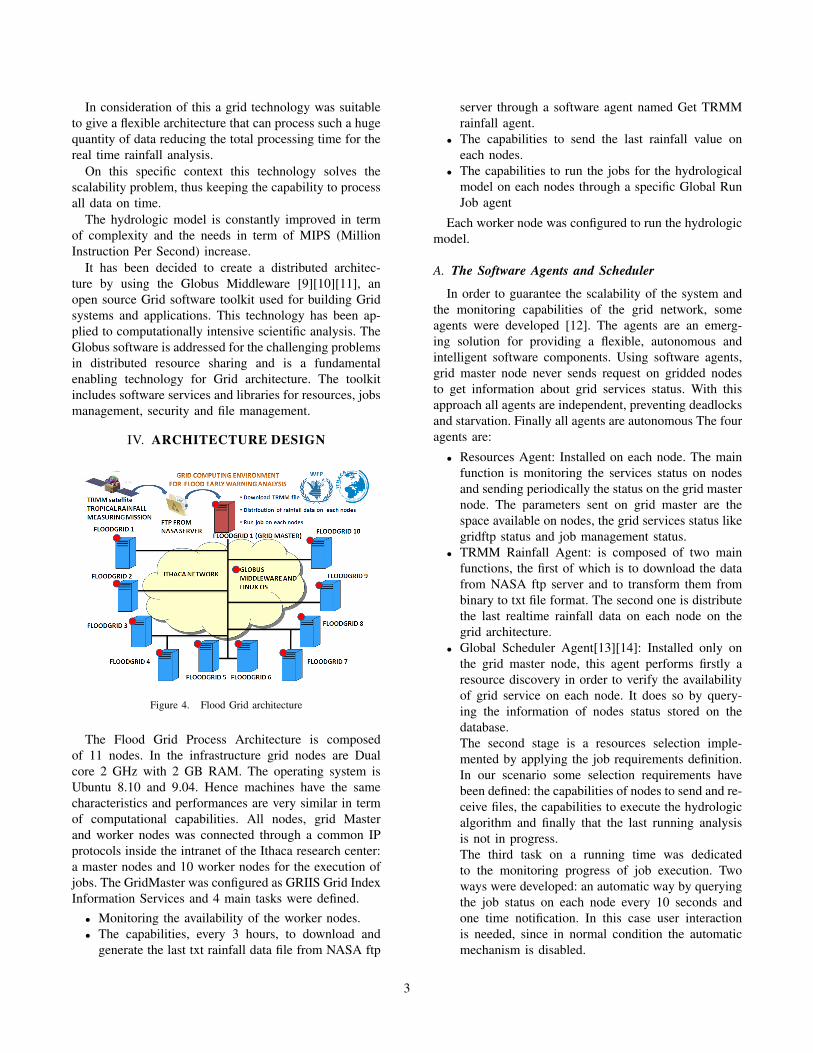
A web GIS interface was developed (Figure 3) in orderto obtain an immediate visualization of alerted areas [8].
Figure 3. Web site overview
III. ARCHITECTURE MOTIVATIONSThe main goal of this project was to merge rainfall data
analysis from satellite at worldwide extent and Grid com-puting technologies in order to reduce the time requiredfor a global rainfall analysis.
The grid rainfall processing is an integrated systemdevoted to handle and process rainfall data from TRMMsatellite 3B42RT. The general purpose of the entire in-frastructure was to share the computational resources. Theexpected amount of data received every day was approx-imatively 2.5 millions rainfall values, corresponding to312000 values each 3 hours.
The first goal was to find a solution that took inconsideration the worldwide analysis requirements.
The second major requirement was related to the hydro-logical analysis in a time not exceeding three hours, sinceafter this time the next values of rainfall are downloadedand prepared for a new analysis.
2
In consideration of this a grid technology was suitableto give a flexible architecture that can process such a hugequantity of data reducing the total processing time for thereal time rainfall analysis.
On this specific context this technology solves thescalability problem, thus keeping the capability to processall data on time.
The hydrologic model is constantly improved in termof complexity and the needs in term of MIPS (MillionInstruction Per Second) increase.
It has been decided to create a distributed architec-ture by using the Globus Middleware [9][10][11], anopen source Grid software toolkit used for building Gridsystems and applications. This technology has been ap-plied to computationally intensive scientific analysis. TheGlobus software is addressed for the challenging problemsin distributed resource sharing and is a fundamentalenabling technology for Grid architecture. The toolkitincludes software services and libraries for resources, jobsmanagement, security and file management.
IV. ARCHITECTURE DESIGN
Figure 4. Flood Grid architecture
The Flood Grid Process Architecture is composedof 11 nodes. In the infrastructure grid nodes are Dualcore 2 GHz with 2 GB RAM. The operating system isUbuntu 8.10 and 9.04. Hence machines have the samecharacteristics and performances are very similar in termof computational capabilities. All nodes, grid Masterand worker nodes was connected through a common IPprotocols inside the intranet of the Ithaca research center:a master nodes and 10 worker nodes for the execution ofjobs. The GridMaster was configured as GRIIS Grid IndexInformation Services and 4 main tasks were defined.
• Monitoring the availability of the worker nodes.• The capabilities, every 3 hours, to download and
generate the last txt rainfall data file from NASA ftp
server through a software agent named Get TRMMrainfall agent.
• The capabilities to send the last rainfall value oneach nodes.
• The capabilities to run the jobs for the hydrologicalmodel on each nodes through a specific Global RunJob agent
Each worker node was configured to run the hydrologicmodel.
A. The Software Agents and Scheduler
In order to guarantee the scalability of the system andthe monitoring capabilities of the grid network, someagents were developed [12]. The agents are an emerg-ing solution for providing a flexible, autonomous andintelligent software components. Using software agents,grid master node never sends request on gridded nodesto get information about grid services status. With thisapproach all agents are independent, preventing deadlocksand starvation. Finally all agents are autonomous The fouragents are:
• Resources Agent: Installed on each node. The mainfunction is monitoring the services status on nodesand sending periodically the status on the grid masternode. The parameters sent on grid master are thespace available on nodes, the grid services status likegridftp status and job management status.
• TRMM Rainfall Agent: is composed of two mainfunctions, the first of which is to download the datafrom NASA ftp server and to transform them frombinary to txt file format. The second one is distributethe last realtime rainfall data on each node on thegrid architecture.
• Global Scheduler Agent[13][14]: Installed only onthe grid master node, this agent performs firstly aresource discovery in order to verify the availabilityof grid service on each node. It does so by query-ing the information of nodes status stored on thedatabase.The second stage is a resources selection imple-mented by applying the job requirements definition.In our scenario some selection requirements havebeen defined: the capabilities of nodes to send and re-ceive files, the capabilities to execute the hydrologicalgorithm and finally that the last running analysisis not in progress.The third task on a running time was dedicatedto the monitoring progress of job execution. Twoways were developed: an automatic way by queryingthe job status on each node every 10 seconds andone time notification. In this case user interactionis needed, since in normal condition the automaticmechanism is disabled.
3
Finally, the last stage, job submission [15][16] byrunning the Job Scheduler Agent on each nodeinvolved on the process analysis. The attention forthis software agent was the frequency of execution(3 hours), due to the delivery of rainfall data by theNASA server ftp. It is worth noting that so far theanalysis requirement have not evolved in respect tothe change of hydrological model algorithm: so, theanalysis requirement was considered static.
• Job Scheduler Agent: Installed on each node, thisspecific agent was developed with some main func-tions. When the master node submits the run com-mand to this agent, its first task is to verify theavailability of rainfall data input to be analyzed. Ifsome files were found the process starts distributingrainfall data on each region and subsequently staginghydrologic model for the analysis. The last task, re-lated to the new critical events found, is the sendingof the new alerts on the grid master node. We cannote that if no rainfall data input were found, at thefirst step, the agent goes into sleep mode waiting forthe next submission of job command from the gridmaster.
B. Architecture ConsiderationAs explained before, in this specific context the global
coverage of earth was split in 312000 micro geographicalareas. In a typical scenario based on a single machine eacharea is analyzed in a sequential mode: for N area to beanalyzed the N+1 area could be processed only when theprevious analysis was completed. This sequential scenariois defined Single Node Infrastructure (SNI).
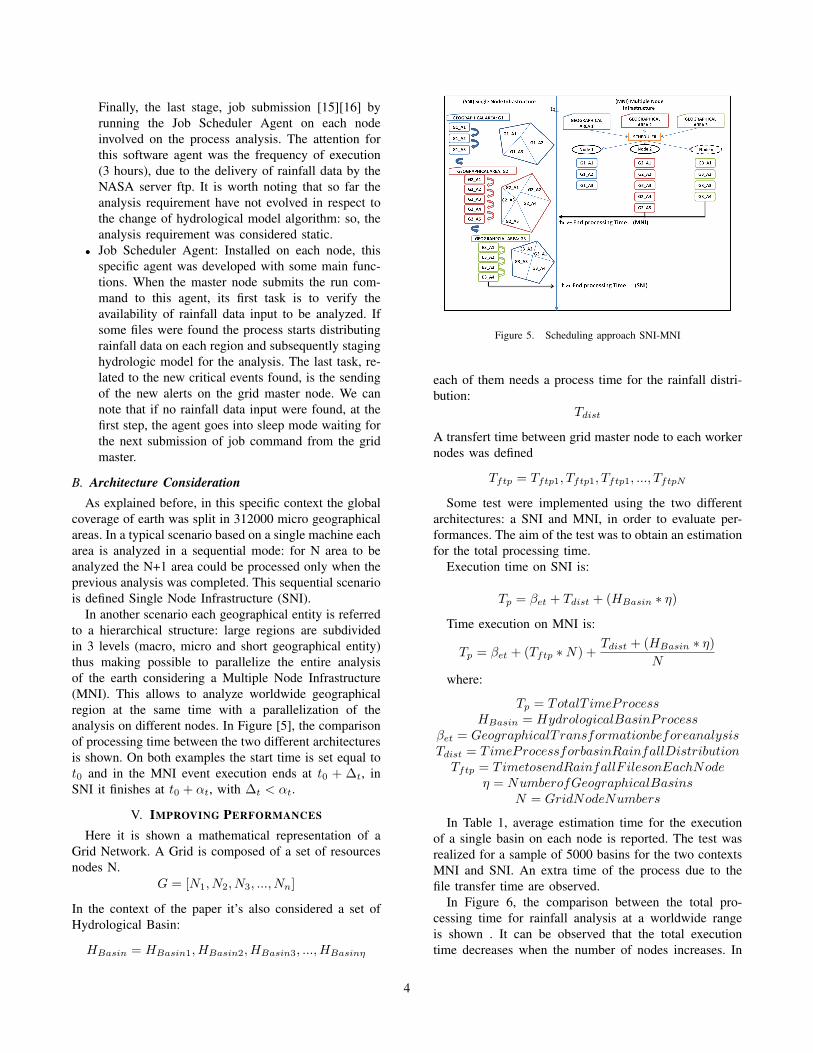
In another scenario each geographical entity is referredto a hierarchical structure: large regions are subdividedin 3 levels (macro, micro and short geographical entity)thus making possible to parallelize the entire analysisof the earth considering a Multiple Node Infrastructure(MNI). This allows to analyze worldwide geographicalregion at the same time with a parallelization of theanalysis on different nodes. In Figure [5], the comparisonof processing time between the two different architecturesis shown. On both examples the start time is set equal tot0 and in the MNI event execution ends at t0 + ∆t, inSNI it finishes at t0 + αt, with ∆t < αt.
V. IMPROVING PERFORMANCES
Here it is shown a mathematical representation of aGrid Network. A Grid is composed of a set of resourcesnodes N.
G = [N1, N2, N3, ..., Nn]
In the context of the paper it’s also considered a set ofHydrological Basin:
HBasin = HBasin1, HBasin2, HBasin3, ...,HBasinη
Figure 5. Scheduling approach SNI-MNI
each of them needs a process time for the rainfall distri-bution:
Tdist
A transfert time between grid master node to each workernodes was defined
Tftp = Tftp1, Tftp1, Tftp1, ..., TftpN
Some test were implemented using the two differentarchitectures: a SNI and MNI, in order to evaluate per-formances. The aim of the test was to obtain an estimationfor the total processing time.
Execution time on SNI is:
Tp = βet + Tdist + (HBasin ∗ η)
Time execution on MNI is:
Tp = βet + (Tftp ∗N) +Tdist + (HBasin ∗ η)
N
where:
Tp = TotalT imeProcessHBasin = HydrologicalBasinProcess
βet = GeographicalTransformationbeforeanalysisTdist = TimeProcessforbasinRainfallDistributionTftp = TimetosendRainfallF ilesonEachNode
η = NumberofGeographicalBasinsN = GridNodeNumbers
In Table 1, average estimation time for the executionof a single basin on each node is reported. The test wasrealized for a sample of 5000 basins for the two contextsMNI and SNI. An extra time of the process due to thefile transfer time are observed.
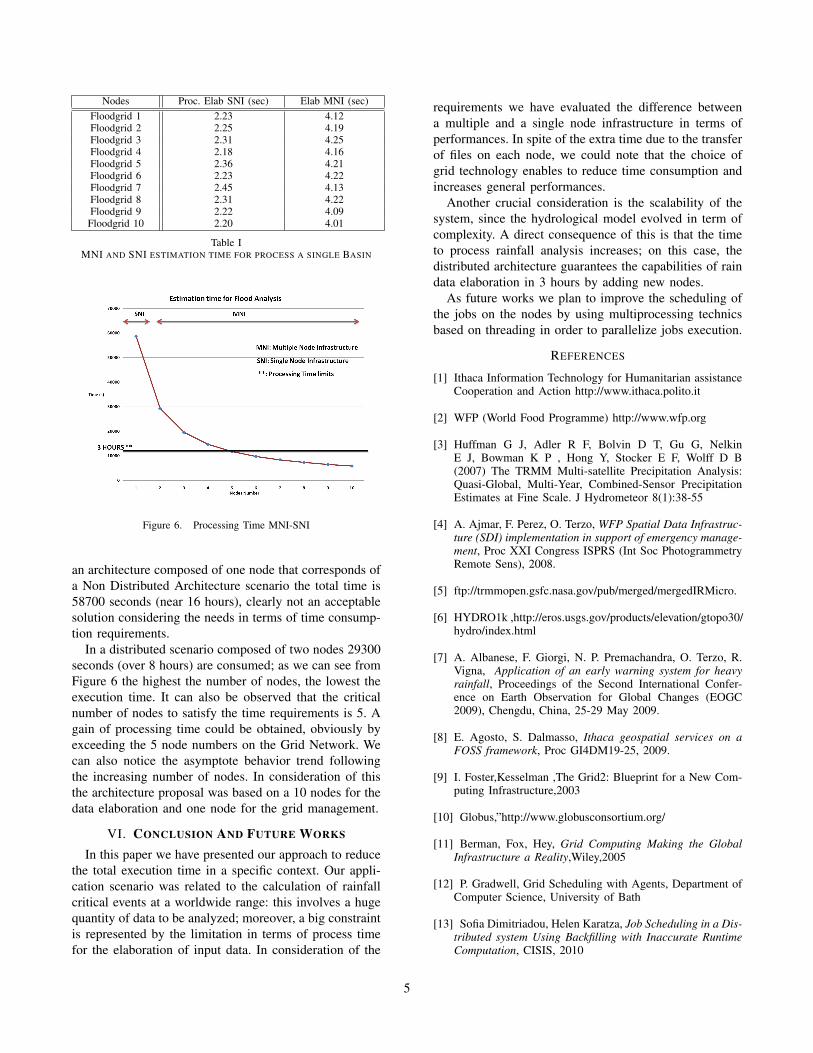
In Figure 6, the comparison between the total pro-cessing time for rainfall analysis at a worldwide rangeis shown . It can be observed that the total executiontime decreases when the number of nodes increases. In
4
Nodes Proc. Elab SNI (sec) Elab MNI (sec)Floodgrid 1 2.23 4.12Floodgrid 2 2.25 4.19Floodgrid 3 2.31 4.25Floodgrid 4 2.18 4.16Floodgrid 5 2.36 4.21Floodgrid 6 2.23 4.22Floodgrid 7 2.45 4.13Floodgrid 8 2.31 4.22Floodgrid 9 2.22 4.09
Floodgrid 10 2.20 4.01
Table IMNI AND SNI ESTIMATION TIME FOR PROCESS A SINGLE BASIN
Figure 6. Processing Time MNI-SNI
an architecture composed of one node that corresponds ofa Non Distributed Architecture scenario the total time is58700 seconds (near 16 hours), clearly not an acceptablesolution considering the needs in terms of time consump-tion requirements.
In a distributed scenario composed of two nodes 29300seconds (over 8 hours) are consumed; as we can see fromFigure 6 the highest the number of nodes, the lowest theexecution time. It can also be observed that the criticalnumber of nodes to satisfy the time requirements is 5. Again of processing time could be obtained, obviously byexceeding the 5 node numbers on the Grid Network. Wecan also notice the asymptote behavior trend followingthe increasing number of nodes. In consideration of thisthe architecture proposal was based on a 10 nodes for thedata elaboration and one node for the grid management.
VI. CONCLUSION AND FUTURE WORKS
In this paper we have presented our approach to reducethe total execution time in a specific context. Our appli-cation scenario was related to the calculation of rainfallcritical events at a worldwide range: this involves a hugequantity of data to be analyzed; moreover, a big constraintis represented by the limitation in terms of process timefor the elaboration of input data. In consideration of the
requirements we have evaluated the difference betweena multiple and a single node infrastructure in terms ofperformances. In spite of the extra time due to the transferof files on each node, we could note that the choice ofgrid technology enables to reduce time consumption andincreases general performances.
Another crucial consideration is the scalability of thesystem, since the hydrological model evolved in term ofcomplexity. A direct consequence of this is that the timeto process rainfall analysis increases; on this case, thedistributed architecture guarantees the capabilities of raindata elaboration in 3 hours by adding new nodes.
As future works we plan to improve the scheduling ofthe jobs on the nodes by using multiprocessing technicsbased on threading in order to parallelize jobs execution.
REFERENCES
[1] Ithaca Information Technology for Humanitarian assistanceCooperation and Action http://www.ithaca.polito.it
[2] WFP (World Food Programme) http://www.wfp.org
[3] Huffman G J, Adler R F, Bolvin D T, Gu G, NelkinE J, Bowman K P , Hong Y, Stocker E F, Wolff D B(2007) The TRMM Multi-satellite Precipitation Analysis:Quasi-Global, Multi-Year, Combined-Sensor PrecipitationEstimates at Fine Scale. J Hydrometeor 8(1):38-55
[4] A. Ajmar, F. Perez, O. Terzo, WFP Spatial Data Infrastruc-ture (SDI) implementation in support of emergency manage-ment, Proc XXI Congress ISPRS (Int Soc PhotogrammetryRemote Sens), 2008.
[5] ftp://trmmopen.gsfc.nasa.gov/pub/merged/mergedIRMicro.
[6] HYDRO1k ,http://eros.usgs.gov/products/elevation/gtopo30/hydro/index.html
[7] A. Albanese, F. Giorgi, N. P. Premachandra, O. Terzo, R.Vigna, Application of an early warning system for heavyrainfall, Proceedings of the Second International Confer-ence on Earth Observation for Global Changes (EOGC2009), Chengdu, China, 25-29 May 2009.
[8] E. Agosto, S. Dalmasso, Ithaca geospatial services on aFOSS framework, Proc GI4DM19-25, 2009.
[9] I. Foster,Kesselman ,The Grid2: Blueprint for a New Com-puting Infrastructure,2003
[10] Globus,”http://www.globusconsortium.org/
[11] Berman, Fox, Hey, Grid Computing Making the GlobalInfrastructure a Reality,Wiley,2005
[12] P. Gradwell, Grid Scheduling with Agents, Department ofComputer Science, University of Bath
[13] Sofia Dimitriadou, Helen Karatza, Job Scheduling in a Dis-tributed system Using Backfilling with Inaccurate RuntimeComputation, CISIS, 2010
5

[14] R. Yahyapour, Philip Wieder, Gid Scheduling Use cases,2006
[15] F Xhafa, S. Pllan, L.Barolli, Grid and P2PMiddleware forScientific Computing Systems, CISIS, 2010
[16] Kurowsky, Nabrzyzki, Scheduling jobs on the Grid-Multicriteria approach, Computational Methods in Scienceand Technology, 2006
6