Valutazione del rischio alluvionale in base alla Direttiva Europea 2007/60.
1
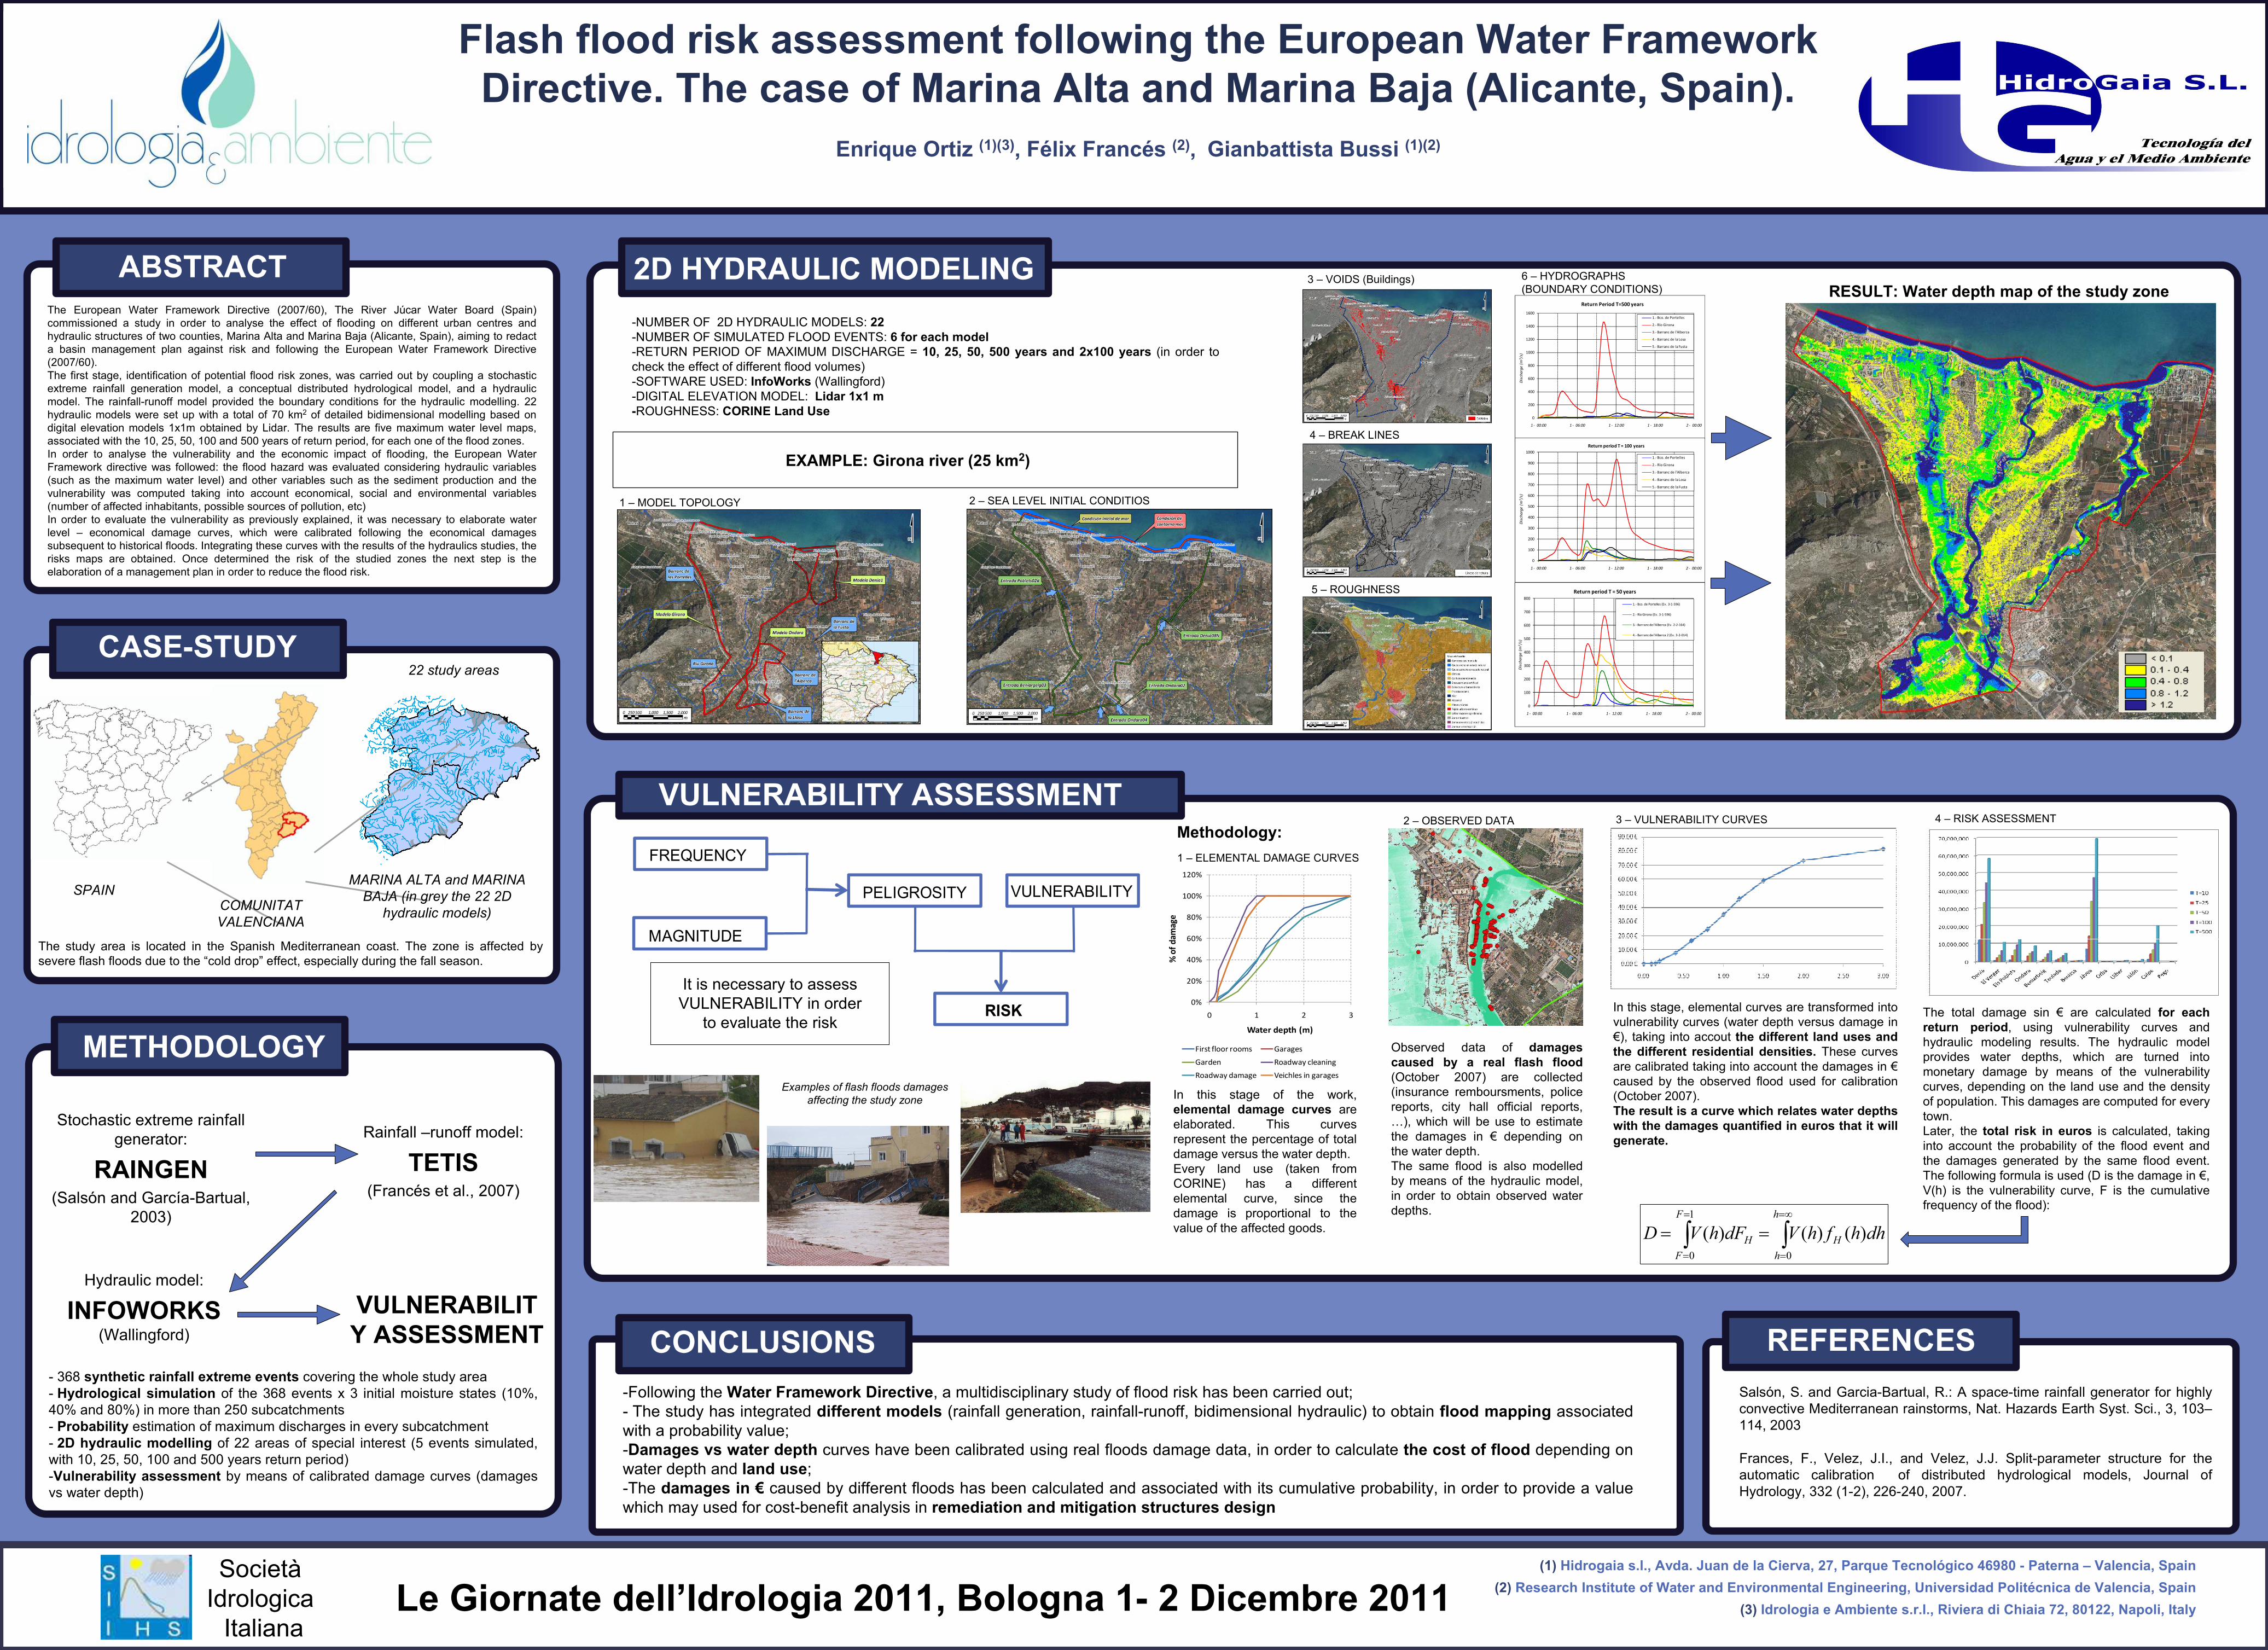
European Geosciences Union General Assembly 2011 Vienna | Austria | 03 – 08 April 2011 The European Water Framework Directive (2007/60), The River Júcar Water Board (Spain) commissioned a study in order to analyse the effect of flooding on different urban centres and hydraulic structures of two counties, Marina Alta and Marina Baja (Alicante, Spain), aiming to redact a basin management plan against risk and following the European Water Framework Directive (2007/60). The first stage, identification of potential flood risk zones, was carried out by coupling a stochastic extreme rainfall generation model, a conceptual distributed hydrological model, and a hydraulic model. The rainfall-runoff model provided the boundary conditions for the hydraulic modelling. 22 hydraulic models were set up with a total of 70 km 2 of detailed bidimensional modelling based on digital elevation models 1x1m obtained by Lidar. The results are five maximum water level maps, associated with the 10, 25, 50, 100 and 500 years of return period, for each one of the flood zones. In order to analyse the vulnerability and the economic impact of flooding, the European Water Framework directive was followed: the flood hazard was evaluated considering hydraulic variables (such as the maximum water level) and other variables such as the sediment production and the vulnerability was computed taking into account economical, social and environmental variables (number of affected inhabitants, possible sources of pollution, etc) In order to evaluate the vulnerability as previously explained, it was necessary to elaborate water level – economical damage curves, which were calibrated following the economical damages subsequent to historical floods. Integrating these curves with the results of the hydraulics studies, the risks maps are obtained. Once determined the risk of the studied zones the next step is the elaboration of a management plan in order to reduce the flood risk. ABSTRACT CASE-STUDY 2D HYDRAULIC MODELING CONCLUSIONS REFERENCES Flash flood risk assessment following the European Water Framework Directive. The case of Marina Alta and Marina Baja (Alicante, Spain). Enrique Ortiz (1)(3) , Félix Francés (2) , Gianbattista Bussi (1)(2) METHODOLOGY Stochastic extreme rainfall generator: RAINGEN (Salsón and García-Bartual, 2003) Rainfall –runoff model: TETIS (Francés et al., 2007) Hydraulic model: INFOWORKS (Wallingford) VULNERABILIT Y ASSESSMENT (1) Hidrogaia s.l., Avda. Juan de la Cierva, 27, Parque Tecnológico 46980 - Paterna – Valencia, Spain (2) Research Institute of Water and Environmental Engineering, Universidad Politécnica de Valencia, Spain (3) Idrologia e Ambiente s.r.l., Riviera di Chiaia 72, 80122, Napoli, Italy VULNERABILITY ASSESSMENT SPAIN COMUNITAT VALENCIANA MARINA ALTA and MARINA BAJA (in grey the 22 2D hydraulic models) 22 study areas - 368 synthetic rainfall extreme events covering the whole study area - Hydrological simulation of the 368 events x 3 initial moisture states (10%, 40% and 80%) in more than 250 subcatchments - Probability estimation of maximum discharges in every subcatchment - 2D hydraulic modelling of 22 areas of special interest (5 events simulated, with 10, 25, 50, 100 and 500 years return period) -Vulnerability assessment by means of calibrated damage curves (damages vs water depth) 1 – MODEL TOPOLOGY 2 – SEA LEVEL INITIAL CONDITIOS -NUMBER OF 2D HYDRAULIC MODELS: 22 -NUMBER OF SIMULATED FLOOD EVENTS: 6 for each model -RETURN PERIOD OF MAXIMUM DISCHARGE = 10, 25, 50, 500 years and 2x100 years (in order to check the effect of different flood volumes) -SOFTWARE USED: InfoWorks (Wallingford) -DIGITAL ELEVATION MODEL: Lidar 1x1 m -ROUGHNESS: CORINE Land Use 3 – VOIDS (Buildings) The study area is located in the Spanish Mediterranean coast. The zone is affected by severe flash floods due to the “cold drop” effect, especially during the fall season. 4 – BREAK LINES 5 – ROUGHNESS 6 – HYDROGRAPHS (BOUNDARY CONDITIONS) 0 200 400 600 800 1000 1200 1400 1600 1 - 00:00 1 - 06:00 1 - 12:00 1 - 18:00 2 - 00:00 Discharge (m 3 /s) Return Period T=500 years 1.- Bco. de Portelles 2.- Río Girona 3.- Barranc de l'Alberca 4.- Barranc de la Losa 5.- Barranc de la Fusta EXAMPLE: Girona river (25 km 2 ) RESULT: Water depth map of the study zone It is necessary to assess VULNERABILITY in order to evaluate the risk Examples of flash floods damages affecting the study zone Methodology: 1 – ELEMENTAL DAMAGE CURVES 2 – OBSERVED DATA 3 – VULNERABILITY CURVES 4 – RISK ASSESSMENT ∫ ∫ ∞ = = = = = = h h H F F H dh h f h V dF h V D 0 1 0 ) ( ) ( ) ( In this stage of the work, elemental damage curves are elaborated. This curves represent the percentage of total damage versus the water depth. Every land use (taken from CORINE) has a different elemental curve, since the damage is proportional to the value of the affected goods. 0% 20% 40% 60% 80% 100% 120% 0 1 2 3 % of damage Water depth (m) First floor rooms Garages Garden Roadway cleaning Roadway damage Veichles in garages Observed data of damages caused by a real flash flood (October 2007) are collected (insurance remboursments, police reports, city hall official reports, …), which will be use to estimate the damages in € depending on the water depth. The same flood is also modelled by means of the hydraulic model, in order to obtain observed water depths. In this stage, elemental curves are transformed into vulnerability curves (water depth versus damage in €), taking into accout the different land uses and the different residential densities. These curves are calibrated taking into account the damages in € caused by the observed flood used for calibration (October 2007). The result is a curve which relates water depths with the damages quantified in euros that it will generate. The total damage sin € are calculated for each return period, using vulnerability curves and hydraulic modeling results. The hydraulic model provides water depths, which are turned into monetary damage by means of the vulnerability curves, depending on the land use and the density of population. This damages are computed for every town. Later, the total risk in euros is calculated, taking into account the probability of the flood event and the damages generated by the same flood event. The following formula is used (D is the damage in €, V(h) is the vulnerability curve, F is the cumulative frequency of the flood): -Following the Water Framework Directive, a multidisciplinary study of flood risk has been carried out; - The study has integrated different models (rainfall generation, rainfall-runoff, bidimensional hydraulic) to obtain flood mapping associated with a probability value; -Damages vs water depth curves have been calibrated using real floods damage data, in order to calculate the cost of flood depending on water depth and land use; -The damages in € caused by different floods has been calculated and associated with its cumulative probability, in order to provide a value which may used for cost-benefit analysis in remediation and mitigation structures design 0 100 200 300 400 500 600 700 800 1 - 00:00 1 - 06:00 1 - 12:00 1 - 18:00 2 - 00:00 Discharge (m 3 /s) Return period T = 50 years 1. - Bco. de Portelles (Ev. 3-1-596) 2. - Río Girona (Ev. 3-1-596) 3. - Barranc de l'Alberca (Ev. 2-2-164) 4. - Barranc de l'Alberca 2 (Ev. 3-2-014) 0 100 200 300 400 500 600 700 800 900 1000 1 - 00:00 1 - 06:00 1 - 12:00 1 - 18:00 2 - 00:00 Discharge (m 3 /s) Return period T = 100 years 1.- Bco. de Portelles 2.- Río Girona 3.- Barranc de l'Alberca 4.-Barranc de la Losa 5.- Barranc de la Fusta Salsón, S. and Garcia-Bartual, R.: A space-time rainfall generator for highly convective Mediterranean rainstorms, Nat. Hazards Earth Syst. Sci., 3, 103– 114, 2003 Frances, F., Velez, J.I., and Velez, J.J. Split-parameter structure for the automatic calibration of distributed hydrological models, Journal of Hydrology, 332 (1-2), 226-240, 2007. FREQUENCY MAGNITUDE PELIGROSITY VULNERABILITY RISK Società Idrologica Italiana Le Giornate dell’Idrologia 2011, Bologna 1- 2 Dicembre 2011
-
Upload
enrique-ortiz -
Category
Documents
-
view
214 -
download
0
description
Valutazione del rischio alluvionale in base alla Direttiva Europea 2007/60. Il caso di Marina Alta e Marina Baja (Alicante, Spagna)
Transcript of Valutazione del rischio alluvionale in base alla Direttiva Europea 2007/60.
European Geosciences Union
General Assembly 2011
Vienna | Austria | 03 – 08 April 2011
The European Water Framework Directive (2007/60), The River Júcar Water Board (Spain)
commissioned a study in order to analyse the effect of flooding on different urban centres and
hydraulic structures of two counties, Marina Alta and Marina Baja (Alicante, Spain), aiming to redact
a basin management plan against risk and following the European Water Framework Directive
(2007/60).
The first stage, identification of potential flood risk zones, was carried out by coupling a stochastic
extreme rainfall generation model, a conceptual distributed hydrological model, and a hydraulic
model. The rainfall-runoff model provided the boundary conditions for the hydraulic modelling. 22
hydraulic models were set up with a total of 70 km2 of detailed bidimensional modelling based on
digital elevation models 1x1m obtained by Lidar. The results are five maximum water level maps,
associated with the 10, 25, 50, 100 and 500 years of return period, for each one of the flood zones.
In order to analyse the vulnerability and the economic impact of flooding, the European Water
Framework directive was followed: the flood hazard was evaluated considering hydraulic variables
(such as the maximum water level) and other variables such as the sediment production and the
vulnerability was computed taking into account economical, social and environmental variables
(number of affected inhabitants, possible sources of pollution, etc)
In order to evaluate the vulnerability as previously explained, it was necessary to elaborate water
level – economical damage curves, which were calibrated following the economical damages
subsequent to historical floods. Integrating these curves with the results of the hydraulics studies, the
risks maps are obtained. Once determined the risk of the studied zones the next step is the
elaboration of a management plan in order to reduce the flood risk.
ABSTRACT
CASE-STUDY
2D HYDRAULIC MODELING
CONCLUSIONS REFERENCES
Flash flood risk assessment following the European Water Framework
Directive. The case of Marina Alta and Marina Baja (Alicante, Spain).
Enrique Ortiz (1)(3), Félix Francés (2), Gianbattista Bussi (1)(2)
METHODOLOGY
Stochastic extreme rainfall
generator:
RAINGEN(Salsón and García-Bartual,
2003)
Rainfall –runoff model:
TETIS(Francés et al., 2007)
Hydraulic model:
INFOWORKS(Wallingford)
VULNERABILIT
Y ASSESSMENT
(1) Hidrogaia s.l., Avda. Juan de la Cierva, 27, Parque Tecnológico 46980 - Paterna – Valencia, Spain
(2) Research Institute of Water and Environmental Engineering, Universidad Politécnica de Valencia, Spain
(3) Idrologia e Ambiente s.r.l., Riviera di Chiaia 72, 80122, Napoli, Italy
VULNERABILITY ASSESSMENT
SPAINCOMUNITAT
VALENCIANA
MARINA ALTA and MARINA
BAJA (in grey the 22 2D
hydraulic models)
22 study areas
- 368 synthetic rainfall extreme events covering the whole study area
- Hydrological simulation of the 368 events x 3 initial moisture states (10%,
40% and 80%) in more than 250 subcatchments
- Probability estimation of maximum discharges in every subcatchment
- 2D hydraulic modelling of 22 areas of special interest (5 events simulated,
with 10, 25, 50, 100 and 500 years return period)
-Vulnerability assessment by means of calibrated damage curves (damages
vs water depth)
1 – MODEL TOPOLOGY 2 – SEA LEVEL INITIAL CONDITIOS
-NUMBER OF 2D HYDRAULIC MODELS: 22
-NUMBER OF SIMULATED FLOOD EVENTS: 6 for each model
-RETURN PERIOD OF MAXIMUM DISCHARGE = 10, 25, 50, 500 years and 2x100 years (in order to
check the effect of different flood volumes)
-SOFTWARE USED: InfoWorks (Wallingford)
-DIGITAL ELEVATION MODEL: Lidar 1x1 m
-ROUGHNESS: CORINE Land Use
3 – VOIDS (Buildings)
The study area is located in the Spanish Mediterranean coast. The zone is affected by
severe flash floods due to the “cold drop” effect, especially during the fall season.
4 – BREAK LINES
5 – ROUGHNESS
6 – HYDROGRAPHS
(BOUNDARY CONDITIONS)
0
200
400
600
800
1000
1200
1400
1600
1 - 00:00 1 - 06:00 1 - 12:00 1 - 18:00 2 - 00:00
Dis
cha
rge
(m
3/s
)
Return Period T=500 years
1.- Bco. de Portelles
2.- Río Girona
3.- Barranc de l'Alberca
4.- Barranc de la Losa
5.- Barranc de la Fusta
EXAMPLE: Girona river (25 km2)
RESULT: Water depth map of the study zone
It is necessary to assess
VULNERABILITY in order
to evaluate the risk
Examples of flash floods damages
affecting the study zone
Methodology:
1 – ELEMENTAL DAMAGE CURVES
2 – OBSERVED DATA 3 – VULNERABILITY CURVES 4 – RISK ASSESSMENT
∫∫∞=
=
=
=
==h
h
H
F
F
H dhhfhVdFhVD0
1
0
)()()(
In this stage of the work,
elemental damage curves are
elaborated. This curves
represent the percentage of total
damage versus the water depth.
Every land use (taken from
CORINE) has a different
elemental curve, since the
damage is proportional to the
value of the affected goods.
0%
20%
40%
60%
80%
100%
120%
0 1 2 3
% o
f d
am
ag
e
Water depth (m)
First floor rooms Garages
Garden Roadway cleaning
Roadway damage Veichles in garages
Observed data of damages
caused by a real flash flood
(October 2007) are collected
(insurance remboursments, police
reports, city hall official reports,
…), which will be use to estimate
the damages in € depending on
the water depth.
The same flood is also modelled
by means of the hydraulic model,
in order to obtain observed water
depths.
In this stage, elemental curves are transformed into
vulnerability curves (water depth versus damage in
€), taking into accout the different land uses and
the different residential densities. These curves
are calibrated taking into account the damages in €
caused by the observed flood used for calibration
(October 2007).
The result is a curve which relates water depths
with the damages quantified in euros that it will
generate.
The total damage sin € are calculated for each
return period, using vulnerability curves and
hydraulic modeling results. The hydraulic model
provides water depths, which are turned into
monetary damage by means of the vulnerability
curves, depending on the land use and the density
of population. This damages are computed for every
town.
Later, the total risk in euros is calculated, taking
into account the probability of the flood event and
the damages generated by the same flood event.
The following formula is used (D is the damage in €,
V(h) is the vulnerability curve, F is the cumulative
frequency of the flood):
-Following theWater Framework Directive, a multidisciplinary study of flood risk has been carried out;
- The study has integrated different models (rainfall generation, rainfall-runoff, bidimensional hydraulic) to obtain flood mapping associated
with a probability value;
-Damages vs water depth curves have been calibrated using real floods damage data, in order to calculate the cost of flood depending on
water depth and land use;
-The damages in € caused by different floods has been calculated and associated with its cumulative probability, in order to provide a value
which may used for cost-benefit analysis in remediation and mitigation structures design
0
100
200
300
400
500
600
700
800
1 - 00:00 1 - 06:00 1 - 12:00 1 - 18:00 2 - 00:00
Dis
cha
rge
(m
3/s
)
Return period T = 50 years
1.- Bco. de Portelles (Ev. 3-1-596)
2.- Río Girona (Ev. 3-1-596)
3.- Barranc de l'Alberca (Ev. 2-2-164)
4.- Barranc de l'Alberca 2 (Ev. 3-2-014)
0
100
200
300
400
500
600
700
800
900
1000
1 - 00:00 1 - 06:00 1 - 12:00 1 - 18:00 2 - 00:00
Dis
cha
rge
(m
3/s
)
Return period T = 100 years
1.- Bco. de Portelles
2.- Río Girona
3.- Barranc de l'Alberca
4.- Barranc de la Losa
5.- Barranc de la Fusta
Salsón, S. and Garcia-Bartual, R.: A space-time rainfall generator for highly
convective Mediterranean rainstorms, Nat. Hazards Earth Syst. Sci., 3, 103–
114, 2003
Frances, F., Velez, J.I., and Velez, J.J. Split-parameter structure for the
automatic calibration of distributed hydrological models, Journal of
Hydrology, 332 (1-2), 226-240, 2007.
FREQUENCY
MAGNITUDE
PELIGROSITY VULNERABILITY
RISK
Società
Idrologica
ItalianaLe Giornate dell’Idrologia 2011, Bologna 1- 2 Dicembre 2011