UNIVERSITÀ DEGLI STUDI DI PADOVA - CORE · vita/morte cellulare alterato, generato quest’ultimo...
87
1 UNIVERSITÀ DEGLI STUDI DI PADOVA DIPARTIMENTO DI MEDICINA Direttore: Prof. Angelo Gatta EMATOLOGIA E IMMUNOLOGIA CLINICA Direttore: Prof. Gianpietro Semenzato SCUOLA DI DOTTORATO DI RICERCA IN ONCOLOGIA E ONCOLOGIA CHIRURGICA XXIV CICLO T-CELL LARGE GRANULAR LYMPHOCYTE LEUKEMIA: PATHOGENESIS AND MOLECULAR DEVELOPMENT Direttore della Scuola: Ch.ma Prof.ssa Paola Zanovello Supervisore: Ch.mo Prof. Gianpietro Semenzato Correlatori: Dott. Renato Zambello Dott.ssa Antonella Teramo Dottorando: Francesca Passeri
Transcript of UNIVERSITÀ DEGLI STUDI DI PADOVA - CORE · vita/morte cellulare alterato, generato quest’ultimo...

1
UNIVERSITÀ DEGLI STUDI DI PADOVA
DIPARTIMENTO DI MEDICINA
Direttore: Prof. Angelo Gatta
EMATOLOGIA E IMMUNOLOGIA CLINICA
Direttore: Prof. Gianpietro Semenzato
SCUOLA DI DOTTORATO DI RICERCA IN
ONCOLOGIA E ONCOLOGIA CHIRURGICA
XXIV CICLO
T-CELL LARGE GRANULAR LYMPHOCYTE LEUKEMIA:
PATHOGENESIS AND MOLECULAR DEVELOPMENT
Direttore della Scuola: Ch.ma Prof.ssa Paola Zanovello
Supervisore: Ch.mo Prof. Gianpietro Semenzato
Correlatori: Dott. Renato Zambello
Dott.ssa Antonella Teramo
Dottorando: Francesca Passeri

2

3
INDEX
ABBREVIATIONS pag. 5
ABSTRACT pag. 7
RIASSUNTO pag. 9 INTRODUCTION pag. 11 1. LARGE GRANULAR LYMPHOCYTES pag. 11 1.1 PROPERTIES AND FUNCTIONS OF T-LGLs pag. 12 2. LARGE GRANULAR LYMPHOCYTE DISORDERS pag. 14 2.1 T-CELL LARGE GRANULAR LYMPHOCYTE LEUKEMIA pag. 14
2.1.1 Clinical presentation pag. 14 2.1.2 Diagnosis pag. 15 2.1.3 Etiology pag. 17
3. CYTOKINES INVOLVED IN T-LGLL pag. 19 3.1 INTERLEUKIN 6 pag. 19 3.2 INTERLEUKIN 15 pag. 21 3.3 CCL5 pag. 24
4. SIGNALING PATHWAYS ACTIVATED IN LEUKEMIC LGLs pag. 24 4.1 THE JAK/STAT PATHWAY pag. 26 AIM OF THE STUDY pag. 31 MATHERIALS AND METHODS pag. 33 1. PATIENTS AND CONTROL DONORS pag. 33 2. LYMPHOCYTES SEPARATION FROM PERIPHERAL BLOOD pag. 33 3. T-LGLs SORTING AND FLOW CYTOMETRY pag. 34 4. T-LGLs PURIFICATION BY IMMUNOMAGNETIC BEADS pag. 35 5. CELL CULTURES pag. 36 6. MOLECULAR ANALYSIS pag. 36 6.1 TOTAL RNA EXTRACTION pag. 36 6.2 cDNA SYNTHESIS pag. 37 6.3 REAL TIME PCR pag. 38 6.4 DNA EXTRACTION pag. 40 6.5 DNA MODIFICATION AND METHYLATION-SPECIFIC PCR (MSP) pag. 41 6.6 BISULFITE SEQUENCING pag. 41 6.7 SCREENING OF SOCS3 AND STAT3 MUTATIONS pag. 42
6.7.1 Sanger Sequencing pag. 42 6.7.2 ARMS-PCR pag. 47
7. PROTEIC ANALYSIS (WESTERN BLOT) pag. 50 7.1 PREPARATION OF CELL LYSATES pag. 50 7.2 POLYACRYLAMIDE GEL ELECTROPHORESIS IN SDS (SDS PAGE) pag. 50
7.3 WESTERN BLOTTING pag. 51 8. ELISA TEST pag. 52 9. APOPTOSIS ANALYSIS BY FLOW CYTOMETRY pag. 52 10. CHEMOTAXIS ANALYSIS BY FLOW CYTOMETRY pag. 53 11. STATISTICAL ANALYSIS pag. 54 RESULTS pag. 55
1. LEUKEMIC LGLs DISPLAY HIGH EXPRESSION AND ACTIVATION OF STAT3 pag. 55 2. SOCS3 IS DOWN-EXPRESSED AND UNRESPONSIVE IN PATHOLOGIC LGLs pag. 56 3. THE DEMETHYLATING AGENT 5-AZA-2’-DEOXYCYTIDINE (DAC)
RESTORES IL-6 MEDIATED SOCS3 EXPRESSION IN LGLs FROM PATIENTS pag. 58

4
4. SOCS3 RESTORATION LEADS TO P-STAT3 AND Mcl-1 REDUCTION AND LGL APOPTOSIS pag. 59 5. METHYLATION ANALYSIS OF SOCS3 PROMOTER IN LEUKEMIC LGLs pag. 60 6. MONONUCLEAR CELLS OF PATIENTS PRODUCED IL-6 AND THE SOLUBLE FORM OF IL-6Rα pag. 62 7. IL-6 EXPRESSION IS INVERSELY CORRELATED TO THE AMOUNT OF CIRCULATING LGLs IN T-LGLL PATIENTS pag. 64 8. IL-6 IS INVOLVED IN SURVIVAL CELL MAINTENANCE AND IN STAT3
PHOSPHORYLATION STATUS pag. 65 9. IL-6 CAN BE PRODUCED BY MSCs AND MODULATE CCL5 EXPRESSION
THROUGH STAT3 SIGNALING CASCADE pag. 66 10. IL-6 AND IL-6Rα EXPRESSION IS RESPONSIVE TO IL-15 STIMULUS pag. 69 11. BOTH IL-6 AND IL-15 PROMOTE LGLs SURVIVAL pag. 70 12. PATIENTS WITH A HIGH PERCENTAGE OF CIRCULATING LGLs MAY
SHOW MISSENSE MUTATIONS IN STAT3 SH2 DOMAIN pag. 71 12.1 MUTATIONAL ANALYSIS BY SANGER SEQUENCING pag. 71 12.2 MUTATIONAL ANALYSIS BY ARMS-PCR pag. 71 12.3 PHENOTYPE OF LGL CLONE IN MUTATED PATIENTS pag. 72
DISCUSSION pag. 75
BIBLIOGRAPHY pag. 79
PUBLICATIONS pag. 87

5
ABBREVIATIONS
Ac Antibody AcMo Monoclonal Antibody ADAM 17 ADAM metallopeptidase domain 17 Ag Antigen Ag490 2-cyano-3-(3,4-dihydroxyphenyl)-N-(benzyl)-2-
propenamide AICD Activation-induced cell death ARMS Amplification Refractory Mutation System Bak Bcl-2 homologous antagonist killer BaX Bcl-2-associated protein X Bcl-2 B-cell lymphoma-2 BM Bone Marrow BSA Bovine Serum Albumine BSF B-cell stimulatory factor 2 CBM Cytokine Binding Module C1P Ceramide 1-phosphate cDNA Complementary DNA CLPD-NK Chronic Lymphoproliferative Disorder of NK cells CMV Citomegalovirus Ct Threshold Cycle CTL Cytotoxic T cell DAC Demethylation agent 5-aza-2’-deoxycytidine DISC Death-inducing signaling complex EBV Epstein Barr Virus ECL ChemiLuminescence EDTA Ethylenediaminetetraacetic acid ESA Erytropoietin Stimulating Agents F/H Ficoll/Hipaque FACS Fluorescence Activated Cell Sorting FasL Fas Ligand FCS Fetal Calf Serum FITC Fluorescein isothiocyanate FNIII Fibronectin type 3-like GAPDH Glyceraldehyde 3-phosphate dehydrogenase GM-CSF Granulocyte-Macrophage Colony-Stimulating Factor HRP Horseradish peroxidase HTLV Human T-Lymphotrophic Virus Ig Immunoglobulin IL-6 Interleukin-6 IL-6Rα Interleukin-6 Receptor alfa IL-2 Interleukin-2

6
IL-15 Interleukin-15 JAK Janus Kinase LGL Large Granular Lymphocyte LGLL Large Granular Lymphocyte Leukemia Mcl-1 Myeloid cell leukemia sequence-1 mgp130 Membrane gp130 mIL-6Rα Membrane IL-6 Receptor alfa MHC Major Histocompatibility Complex MSC Mesenchimal Stem Cell MTX Methotrexate MSP Methylation Specific PCR PAGE Polyacrylamide gel electrophoresis PB Peripheral blood PBMC Peripheral Blood Mononuclear Cell PBS Phosphate Buffered Saline PCR Polimerase Chain Reaction PI Propidium iodide PS Phosphatidylserine Pt Patient RA Rheumatoid Arthritis RBC Red Blood Cell RT Retro Transcriptase RT-PCR Real Time -polymerase chain reaction RTK Receptor tirosine kinase S1P Sphingosine 1-phosphate SDS Sodium Dodecil Solfate sgp130 Soluble gp130 sIL-6Rα Soluble IL-6 receptor alfa SH2 Src Homology 2 SOCS Suppressor of cytokine signaling STAT3 Signal Transducer And Activator of Transcription 3 T Thymidine TAD Trans activation domain TCR T cell receptor T-LGLL T-Large Granular Lymphocyte Leukemia U Uracil UNG Uracil-DNA glycosylase VEGF Vascular Endothelial Growth Factor WHO World Health Organization

7
ABSTRACT
Large granular lymphocyte leukemia (LGLL) is a rare and heterogeneous lymphoproliferative
disorder characterized by the chronic proliferation of clonal large granular lymphocytes
(LGLs) with cytotoxic activity. Two subtypes of LGL proliferations are distinguished: the
most common type (~85% of cases), T-LGL Leukemia (T-LGLL), is sustained by T-cells and
the rarer type (~15% of cases), Chronic Lymphoproliferative Disorder of Natural Killer cells
(CLPD-NK), sustained by NK-cells. This PhD will focus on the T-LGL Leukemia.
The etiology of T-LGLL still remains matter of debate. The main hypothesis suggests an
antigenic stimulation as initial step activating LGLs, which undergo a clonal expansion then
maintained by the abnormal release of cytokines (mainly IL-6 and IL-15) and by an
impairment of the apoptotic machinery due to the activation of several survival pathways.
The project developed in this PhD was aimed to better define this etiopathogenetic hypothesis
and to find new therapeutic targets.
First of all, we have taken into account the JAK/STAT pathway, reported to be deregulated in
T-LGLL. We focused on STAT3, constitutively activated in LGLs, and its specific inhibitor
SOCS3, that we found to be down-expressed and unresponsive to IL-6 triggering. The
pathophysiology of this mechanism is unclear, since we found no methylation in SOCS3
promoter region; anyway we still hypothesize an epigenetic mechanism, since the use of a
demethylating agent restored SOCS3 responsiveness.
We then focused our attention on the main activator of STAT3/SOCS3 axis, IL-6, and we
observed that it enhances LGL survival through STAT3 phosphorylation. We also provided
evidence that IL-6 is mainly expressed by LGLs-depleted PBMC population of T-LGLL
patients characterized by low levels of circulating LGLs (<55%). The involvement of IL-6 in
leukemic LGL survival was confirmed by the observation that incubation with anti-IL-6 and
anti-IL-6Rα (IL-6 receptor) induced apoptosis in LGLs, likely related to a reduction of
STAT3 phosphorylation.
The next step was the analysis of IL-6 receptor system that is composed of two functionally
different chains: IL-6Rα and gpl30. Our data suggested that IL-6 acts through a trans-
signaling mechanism in T-LGLL, being IL-6Rα highly detected in patients’ plasma and
poorly expressed by LGLs. Interestingly, trans-signaling is peculiarly implicated in
inflammatory disease.
Among STAT3 target genes, CCL5 is a chemotactic agent reported to be over-expressed in
LGL leukemia. In our lab we found that its expression is responsive to IL-6 stimulus. Since

8
the BM of patients is frequently infiltrated by LGLs and mesenchymal stromal cells (BM-
MSCs) are reported to be a putative source of IL-6, we studied their role in T-LGLL and
demonstrated that they promote LGL survival and may trigger CCL5 expression in LGLs,
through IL-6 release.
We then focused on IL-15, a T-LGLL key cytokine mainly expressed by T-LGLL patients’
dendritic cells (DC), these latter being considered the responsible for LGL activation through
antigen presentation. We studied IL-15 effects on IL-6 signaling and we found that this
cytokine promotes the trans-signaling mechanism through an enhanced IL-6 expression by
patients’ PBMCs and the inhibition of IL-6Rα expression by LGLs.
Finally, recent data in the literature reported mutational hot spots in SH2 domain of STAT3,
suggesting that STAT3 constitutive activation may result from these acquired genetic
mutations. Accordingly, we analyzed whether patients’ LGLs showed any of STAT3 hot spot
mutations up to now quoted. We observed that two mutations, D661Y and Y640F, were
detected in nearly 20% of cases and more specifically in patients characterized by a high
percentage of circulating LGLs (>55% ), accounting for 40% of all LGL cohort.

9
RIASSUNTO
La malattia linfoproliferativa dei linfociti granulati (LGLL) è una malattia rara caratterizzata
da una linfocitosi cronica dei grandi linfociti granulati (LGL) con attività citotossica. Da un
punto di vista immunologico, si distinguono due forme di LGLL: La T-LGLL, caratterizzata
dalla proliferazione di LGL di tipo T, nonché forma più frequente della patologia (~85% dei
casi) e la NK-CLPD, più rara (~15% dei casi) in cui la linfocitosi viene sostenuta da cellule di
tipo NK.
L’eziopatogenesi della T-LGLL risulta essere ancora materia di dibattito. L’ipotesi più
accreditata indica la stimolazione antigenica come evento in grado di attivare gli LGL; queste
cellule intraprendono dunque un’espansione clonale, che viene mantenuta in un secondo
tempo dal consistente rilascio di citochine (prevalentemente IL-6 ed IL-15) e da un equilibrio
vita/morte cellulare alterato, generato quest’ultimo dalla contemporanea attivazione di
numerose vie di sopravvivenza cellulare.
Nel nostro laboratorio abbiamo seguito differenti linee di ricerca, con l’obiettivo di verificare
tale ipotesi eziopatogenica e trovare nuovi target terapeutici.
Abbiamo preso prima di tutto in considerazione la via di segnale JAK/STAT, che si riporta
essere alterata nella T-LGLL. Ci siamo soffermati in particolare sulla proteina STAT3, che
risulta essere costitutivamente attivata, e su SOCS3, suo specifico inibitore, emerso essere, dai
nostri studi, down-espresso e non responsivo all’IL-6 nella T-LGLL.
Le basi fisiologiche determinanti il mancato meccanismo a feed-back negativo di SOCS3 non
risultano ancora definite, dal momento che il promotore di SOCS3 non è risultato essere
regolato tramite metilazione; è possibile tuttavia che un meccanismo epigenetico sia
comunque responsabile dell’alterata regolazione della via di segnale JAK/STAT, in quanto
abbiamo osservato che l’uso di un agente demetilante è in grado di ripristinare l’attività
inibitoria di SOCS3.
Abbiamo quindi analizzato il principale attivatore dell’asse STAT3/SOCS3, ovvero
l’interleuchina 6 (IL-6), evidenziando come tramite l’attivazione di STAT3 essa sia in grado
di promuovere la sopravvivenza degli LGL. Abbiamo inoltre rilevato che tale citochina è
espressa in particolar modo dai PBMC non LGL di pazienti caratterizzati da bassi livelli di
LGL circolanti (<55%).
Il coinvolgimento di IL-6 nella sopravvivenza degli LGL è stato confermato da un’induzione
dell’apoptosi in seguito a coltura con anticorpi bloccanti anti-IL-6 ed anti-IL-6Rα (recettore α
dell’IL-6), dovuta ad una riduzione dei livelli di STAT3 attivata.

10
Passaggio successivo è stato analizzare il sistema recettoriale di IL-6, composto da due
differenti catene: IL-6Rα e gpl30. I dati ottenuti suggeriscono un meccanismo di trans-
signaling, particolarmente coinvolto nei processi di tipo infiammatorio, alla base dell’azione
di IL-6 nella T-LGLL; IL-6Rα è presente infatti ad alti livelli nel plasma dei pazienti, pur
venendo scarsamente espresso dagli LGL.
Tra i geni target di STAT3 vi è CLL5, un potente agente chemotattico che si riporta essere
over-espresso nella T-LGLL; nel nostro laboratorio abbiamo osservato inoltre che la sua
espressione è responsiva allo stimolo con IL-6. Dal momento che il midollo osseo dei pazienti
risulta essere frequentemente infiltrato dagli LGL e che le cellule mesenchimali stromali
(BM-MSCs) risultano essere una presunta fonte di IL-6, abbiamo analizzato il ruolo di queste
cellule nella T-LGLL e dimostrato che esse sono in grado di promuovere la sopravvivenza
degli LGL e probabilmente stimolare l’espressione di CCL5 da parte degli LGL, tramite il
rilascio di IL-6.
Abbiamo studiato l’interleuchina 15 (IL-15), una citochina chiave della T-LGLL espressa in
particolar modo dalle cellule dendritiche (DC) dei pazienti, considerate responsabili
dell’attivazione degli LGL tramite presentazione dell’antigene.
Abbiamo analizzato gli effetti di IL-15 sul signaling di IL-6 ed abbiamo evidenziato come
tale citochina sia in grado di promuovere il meccanismo di trans-signaling attraverso
l’induzione d’espressione di IL-6 nei PBMC dei pazienti e l’inibizione dell’espressione di IL-
6Rα negli LGL.
Dati recenti di letteratura riportano, infine, hot spot mutazionali nel dominio SH2 di STAT3; è
stato ipotizzato che la costitutiva attivazione di STAT3 sia dovuta a tali mutazioni, per tale
motivo abbiamo indagato, nella nostra coorte di pazienti, la presenza delle mutazioni descritte
finora riportate in letteratura. Abbiamo riscontrato le due mutazioni, D661Y e Y640F, sono
presenti in circa 20% dei casi e specificamente in pazienti caratterizzati da un’alta percentuale
di LGL circolanti (>55%), che costituiscono il 40% dei casi con LGLL.

11
INTRODUCTION
1. LARGE GRANULAR LYMPHOCYTES
Large granular lymphocytes (LGLs) represent approximately 10-15% of peripheral blood
mononuclear cells in adult and are involved in cell-based cytotoxicity. Normally present in
peripheral blood with values ranging from 0.2 and 0.4x10⁹ LGL/L (200-400 LGL/mm3), these
cells have well defined morphology and phenotype1. LGLs are large cells (15-18 µm) with
abundant cytoplasm containing typical azurophilic granules and reniform or round shaped
nucleus (Figure 1)2.
Basing on immunophenotype we can separate two different classes of LGLs, which are:
Natural Killer cell line (CD3 negative), representing 85% of total LGL population and T cell
line (CD3 positive), which constitutes the remaining 15% and needs an activation step before
acquisition of cytotoxic properties3.
Figure 1: Peripheral blood large granular lymphocyte. Reniform nucleus and cytoplasmatic azurophilic granules are clearly visible.
Well defined functional characteristics give LGLs a fundamental role in the progression of
immune response: both T and NK LGLs have cytoplasmatic granules containing perforins and
granzymes B4, and have therefore a central role in cell-mediated immune response, being able
to exert a cytotoxic activity.
NK-LGLs lack of T-Cell Receptor (TCR), show a MHC (Major Histocompatibility Complex)
-non-restricted cytotoxicity and belong to innate immune system, T-LGLs on the other hand
show a TCR rearranging during lymphocyte maturation, moreover are able to exert a MHC-
12
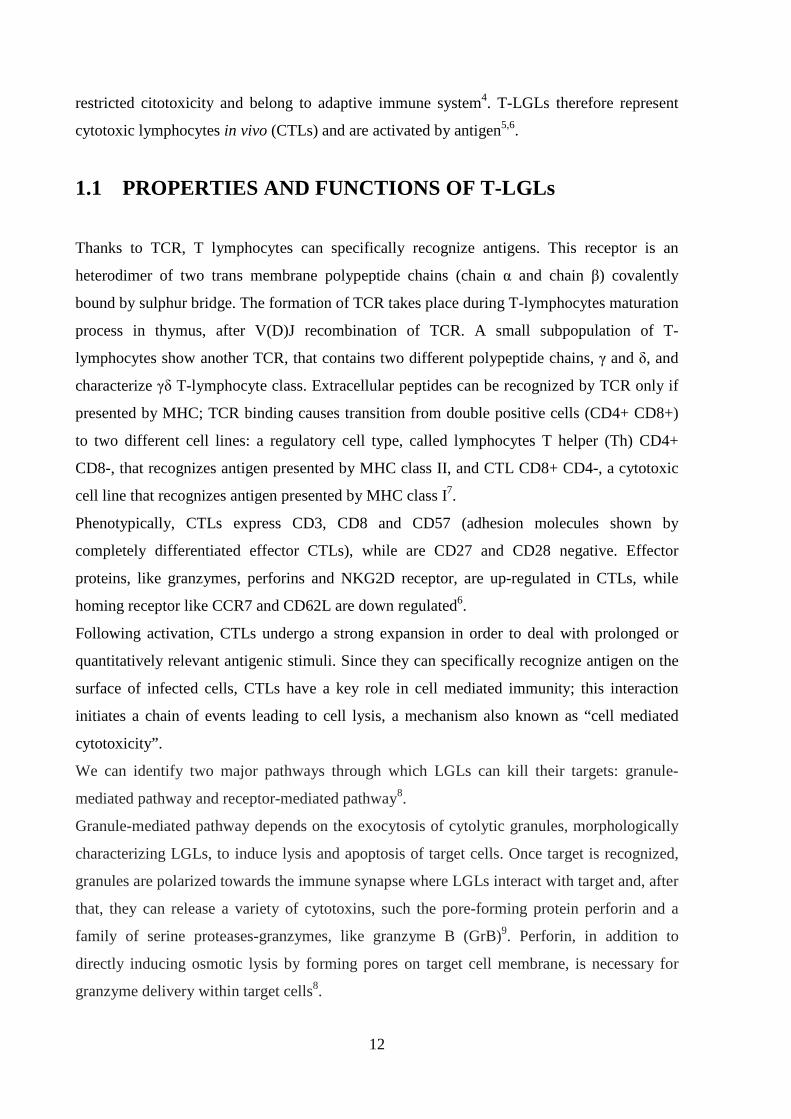
restricted citotoxicity and belong to adaptive immune system4. T-LGLs therefore represent
cytotoxic lymphocytes in vivo (CTLs) and are activated by antigen5,6.
1.1 PROPERTIES AND FUNCTIONS OF T-LGLs
Thanks to TCR, T lymphocytes can specifically recognize antigens. This receptor is an
heterodimer of two trans membrane polypeptide chains (chain α and chain β) covalently
bound by sulphur bridge. The formation of TCR takes place during T-lymphocytes maturation
process in thymus, after V(D)J recombination of TCR. A small subpopulation of T-
lymphocytes show another TCR, that contains two different polypeptide chains, γ and δ, and
characterize γδ T-lymphocyte class. Extracellular peptides can be recognized by TCR only if
presented by MHC; TCR binding causes transition from double positive cells (CD4+ CD8+)
to two different cell lines: a regulatory cell type, called lymphocytes T helper (Th) CD4+
CD8-, that recognizes antigen presented by MHC class II, and CTL CD8+ CD4-, a cytotoxic
cell line that recognizes antigen presented by MHC class I7.
Phenotypically, CTLs express CD3, CD8 and CD57 (adhesion molecules shown by
completely differentiated effector CTLs), while are CD27 and CD28 negative. Effector
proteins, like granzymes, perforins and NKG2D receptor, are up-regulated in CTLs, while
homing receptor like CCR7 and CD62L are down regulated6.
Following activation, CTLs undergo a strong expansion in order to deal with prolonged or
quantitatively relevant antigenic stimuli. Since they can specifically recognize antigen on the
surface of infected cells, CTLs have a key role in cell mediated immunity; this interaction
initiates a chain of events leading to cell lysis, a mechanism also known as “cell mediated
cytotoxicity”.
We can identify two major pathways through which LGLs can kill their targets: granule-
mediated pathway and receptor-mediated pathway8.
Granule-mediated pathway depends on the exocytosis of cytolytic granules, morphologically
characterizing LGLs, to induce lysis and apoptosis of target cells. Once target is recognized,
granules are polarized towards the immune synapse where LGLs interact with target and, after
that, they can release a variety of cytotoxins, such the pore-forming protein perforin and a
family of serine proteases-granzymes, like granzyme B (GrB)9. Perforin, in addition to
directly inducing osmotic lysis by forming pores on target cell membrane, is necessary for
granzyme delivery within target cells8.

13
Granzymes, by their protease activity, potentiate the death of target cells by cleaving and
activating the effector caspases as well as pro-apoptotic Bcl-2 family members (Figure 2,
panel A)9.
The receptor-mediated pathway relies on the engagement and activation of “death receptor”,
such as Fas (CD95), a member of tumor necrosis factor receptor family, by their ligands
(FasL or CD95L). Death receptors are universally expressed on several cell types while, the
corresponding ligands are frequently found on activated CTLs. Receptor-mediated pathway is
not specific for the immune system and the death receptor-ligand interaction is not MHC-
restricted.
Instead, LGL-target interaction brings target cells to the proximity of LGL and upon ligation,
death receptors cluster and induce the formation of death inducing signaling complex (DISC)
which involves the same signaling molecules induced by granzymes (Figure 2, panel A)9.
Figure 2: (A) Receptor- and granules-mediated cytotoxicity, through Fas or granzymes containing granules, respectively; (B) AICD (activation-induced cell death) induction within CTL once the immunity activity is completed. (C) Leukemic LGLs show resistance to AICD, due to the involvement of other signaling pathways that oppose to AICD.
Together, granule-mediated pathway delivers an instant and potent cytolytic potential, while
the receptor-mediated pathway acts as a moderate but persistent supply. Both pathways
contribute to LGL clearance after activation in order to prevent an enhanced activity of these
cells that may alter the immunity homeostasis. This “death pathway” is termed activation-
induced cell death (AICD): both granule- and receptor-mediated pathways can act on
activated LGLs through endocellular or extracellular granule leakage which triggers similar
signaling pathways as in target cells. After activation, LGLs express elevated death receptors,
making themselves sensitive to the death ligands causing AICD (Figure 2 panel B)9.
Panel A Panel A Panel B Panel C
14
Thus, the resistance to Fas-mediated apoptosis and, consequently, the failure to undergo
AICD is the main reason causing abnormal clonal expansion of LGLs with the final result of
an accumulation of these cells in peripheral blood that remain competent in the long term
(Figure 2, panel C). It is well assumed that this event represents the hallmark of LGLL
disorders10.
2. LARGE GRANULAR LYMPHOCYTE DISORDERS
LGL disorder is a rare disease characterized by a clonal and chronic proliferation of cytotoxic
lymphocytes. In the last years, the understanding of natural history, immunophenotype,
pathophysiology and treatment of this disease has greatly expanded and LGL disorder is now
recognized as a well-defined clinical entity. Indeed, on 2008 the World Health Organization
(WHO) classified this disorder as belonging to T- and NK-cell mature neoplasias.
The classification holds for three categories11:
� T-cell large granular lymphocytes leukemia (T-LGLL)
� Aggressive NK-cell leukemia (ANKL)
� Chronic lymphoproliferative disorder of NK cells (CLPD-NK).
Two subtypes of LGL proliferations therefore are distinguished: in the first one, LGL clone is
sustained by T-cells and it is the most common type of LGL proliferation (~85% of cases)3,
while in the second LGL clone is sustained by NK-cells and it represents ~15% of cases11.
2.1 T-CELL LARGE GRANULAR LYMPHOCYTE
LEUKEMIA
T-LGLL is the most frequent LGL disorder in Western countries3. Is a rare disease of the
elderly, with a median age at diagnosis of 60 years, however it has been described in all age
groups, including in the pediatric population. Males and females are affected equally4.
2.1.1 Clinical presentation
T-LGLL typically has an indolent clinical behavior with a median survival >10 years.
Diagnosis generally follows an incidental finding of cytopenia and about a third of patients

15
results asymptomatic. About 60% of patients will become symptomatic during disease
course3,4. Recurrent infection and fatigue may occur in association with neutropenia and
anemia. The liver is often involved histologically but may not be enlarged. The presence of
lymphadenopathy would be considered an uncommon disease manifestation4.
Diagnosis of LGL leukemia is established by documentation of an increased number of clonal
LGLs; initially, a circulating LGL count 2x10⁹/L was considered as mandatory (normal
number of LGLs in the peripheral blood is 0.3x10⁹/L), but now a lower count (range, 0.4-
2x10⁹L) can be compatible with the diagnosis12.
Eighty-five percent of patients develop neutropenia during the disease course, that is severe
(0.5 x 10⁹/L)3,4, in 50%. Anemia and thrombocytopenia are less common and observed in
approximately 50% and 20% of patients, respectively3,4.
Possible mechanisms for neutropenia found in LGLL include deregulated Fas/FasL-induced
apoptosis of myeloid cells, immune complex or antibody-mediated neutrophil destruction,
hypersplenism or direct inhibition of myeloid maturation by cytokines3,4. Which of these
mechanisms is dominant remains unclear and may vary among patients.
T-LGLL is associated with a wide spectrum of autoimmune disorders, most of them involving
connective tissue. In particular, among arthropathies associated with LGLL, rheumatoid
arthritis (RA) is the most common autoimmune disease, occuring in 25%-35% of patients3,4.
Other autoimmune disorders, including systemic lupus erythematous and Hashimoto’s
thyroiditis, can occur in patients with this disorder, but less frequently4.
2.1.2 Diagnosis
The disease should be suspected in all patients with an increased number of LGLs in
peripheral blood and unexplained cytopenias. A careful morphologic examination of LGLs in
peripheral blood and/or a flow cytometry analysis of mature T-cell immunophenotyping panel
(including CD3, CD5, CD7, CD8, CD16, CD25, CD56, CD57, TCRαβ and γδ) and TCR gene
rearrangement are required. Bone marrow trephine biopsy is usually necessary to confirm the
diagnosis, particularly if patient requires treatment.
Main features in T-LGLL diagnosis, is an abnormal proliferation of CD8+ T cells and the
evidence of clonality, established by gene rearrangement studies (Table 1). Indeed, as T cells
rearrange TCR genes during their normal development, all the cells arising from a malignant,
transformed T cell will have the same sequence of TCR genes. This can be demonstrated
either by Southern Blotting or by Polymerase Chain Reaction (PCR) analysis. However, PCR
16
is currently the technique most widely used in clinical setting. Flow cytometry using
monoclonal antibodies against TCR variable region family gene segments can also aid in the
establishment of clonality in T-cell disorders.
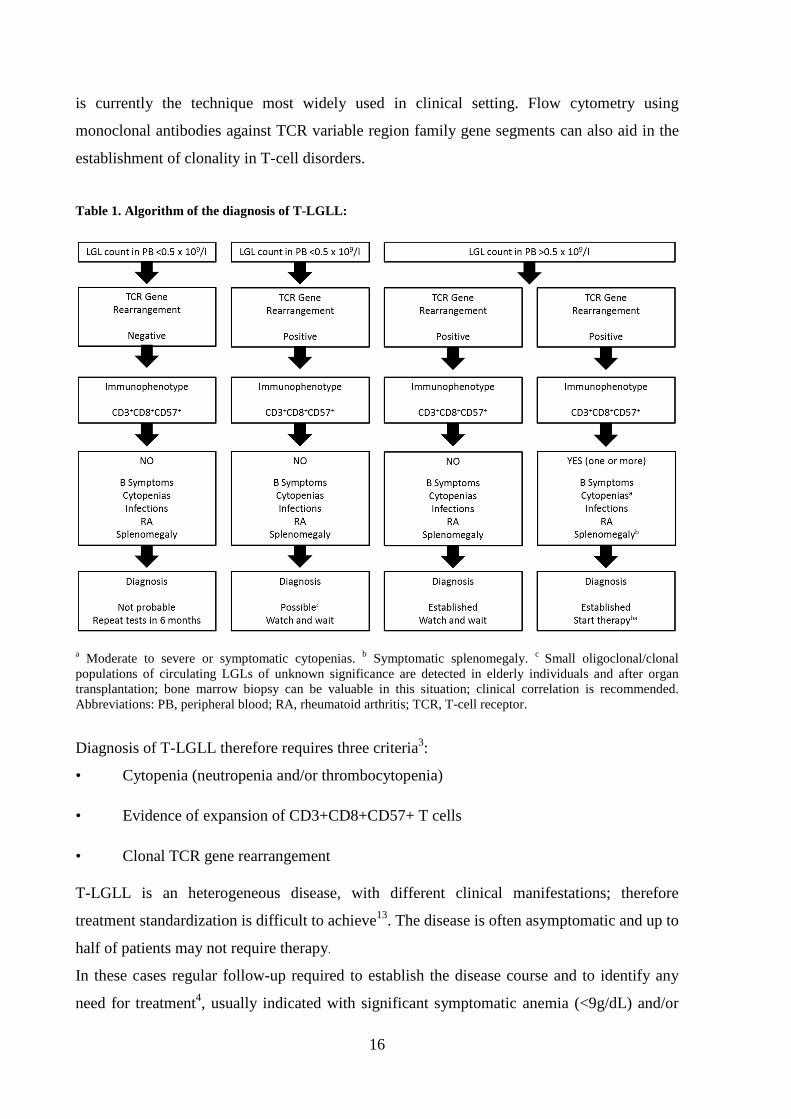
Table 1. Algorithm of the diagnosis of T-LGLL:
a Moderate to severe or symptomatic cytopenias. b Symptomatic splenomegaly. c Small oligoclonal/clonal populations of circulating LGLs of unknown significance are detected in elderly individuals and after organ transplantation; bone marrow biopsy can be valuable in this situation; clinical correlation is recommended. Abbreviations: PB, peripheral blood; RA, rheumatoid arthritis; TCR, T-cell receptor.
Diagnosis of T-LGLL therefore requires three criteria3:
• Cytopenia (neutropenia and/or thrombocytopenia)
• Evidence of expansion of CD3+CD8+CD57+ T cells
• Clonal TCR gene rearrangement
T-LGLL is an heterogeneous disease, with different clinical manifestations; therefore
treatment standardization is difficult to achieve13. The disease is often asymptomatic and up to
half of patients may not require therapy.
In these cases regular follow-up required to establish the disease course and to identify any
need for treatment4, usually indicated with significant symptomatic anemia (<9g/dL) and/or

17
need for transfusion, severe neutropenia (<0.5 x 10⁹/L), severe thrombocytopenia (<50 x
109/L), or any combination of these symptoms3. Other indications for treatment include
recurrent infections and massive splenomegaly14.
The main treatment involves immunosuppressive therapy rather than chemotherapy.
Immunosuppressive therapy includes methotrexate (MTX) or cyclophosphamide (both at low
doses) or cyclosporine A.
Therapy with low doses per os MTX (10 mg/m2 per week), a drug employed as an effective
anti-inflammatory and immunosuppressive agent3,15 with the ability to alleviate RA15,
demonstrated complete clinical remission through normalization of blood counts15 in about
only 50% of patients with T-LGLL4,16. Short dosing of corticosteroids in addition to MTX
treatment may help to alleviate B symptoms and improve the blood cell count4 however,
because of adverse effects, administration of high-dose steroids for more than 1 month is
usually not recommended.
Corticosteroids such as prednisone can be used to hasten the clinical response. Alone, this
compound has been shown to improve neutrophil count but doesn’t result in a long-lasting
remission3,13, because LGL clone continues to persist. Prophylactic antibiotics therapy is
recommended for patients under corticosteroids therapy, presenting severe symptomatic
neutropenia3.
Administration of growth factors, as ESA (Erytropoietin Stimulating Agents) and GM-CSF
(Granulocyte-Macrophage Colony-Stimulating Factor), may help to treat cytopenias, even if
for short periods.
Treatment with chemotherapic agents should be considered for patients refractory or relapsing
after immunosuppressive therapy17 and for young individuals with a significative medullary
infiltration.
Treatment with purine analogs like Pentostatine, Fludarabine and 2-chlorodeoxyadenosine
(2CDA) gave promising results, even if in a low percentage of patients10,18,19.
Monoclonal antibodies like Alemtuzumab (anti-CD52), Humanized MiK-β-1(anti-CD122)
and Siplizumab (anti-CD2), antithymocyte globulin or splenectomy are considered treatment
options in the case of failure with the first-line treatment3.
2.1.3 Etiology
The etiology of T-LGLL still remains matter of debate, due to the fact that no single, specific
agent but a series of events can finally trigger LGLs proliferation. Some reports strongly

18
support the role of chronic antigenic stimulation by exogenous antigens, such as human T-cell
lymphotrophic virus (HTLV) or putative endogenous autoantigens as the initial stimulus
inducing the activation and clonal expansion of effector CD8+ LGLs4. Later, LGLs expansion
may be sustained by the action of cytokines, like interleukin-2 (IL-2) and interleukin-15 (IL-
15)2 (Figure 3).
The exact role of retroviral infection as etiologic agent has not been entirely established4, it
has been described that most patients with T-LGLL are not infected with prototypical HTLV,
but they showed serum reactivity against a small peptide derived from the HTLV-I envelope
protein p21e16.
Figure 3: T-LGLL Etiopathogenetic hypothesis. Abbreviations: IL-2, Interleukin 2; IL-15, Interleukin 15; AICD, activation-induced cell death.
Data from our lab20 have shown a possible role for dendritic cells (DC) in the pathogenesis of
LGLL. These cells belong to the antigen-presenting cell (APC) family, characterized by the
ability to recognize antigens and later to present the same antigens and adhesion molecules on
their surface to T cells, inducing their activation.
DCs can be involved in LGLs proliferation; after the recognition of a specific antigen they
may maintain proliferation by releasing cytokines like IL-2, IL-15 and IL-18.
Immunohistochemical analysis performed on T-LGLL patients osteomedullary biopsies have
shown the presence of direct contact between LGL and DC, in contrast to healthy controls in
which cells have a random distribution. It has been hypothesized that the medullary
environment represents the place where pathological proliferation starts and thus DCs
represent viral infection target cells20.
19
Moreover, proliferating LGLs are characterized by an impaired apoptotic machinery, due to
the activation of several survival pathways, which results in LGL aberrant outliving and
number increase.
3. CYTOKINES INVOLVED IN T-LGLL
3.1 INTERLEUKIN 6
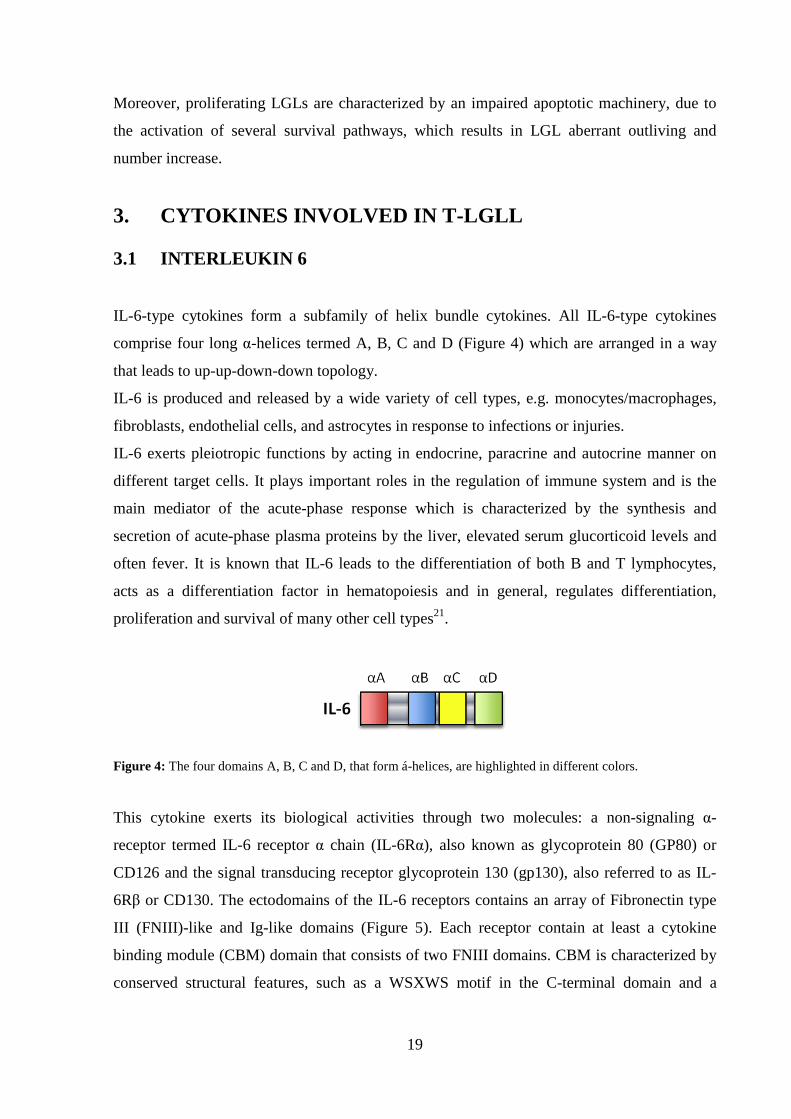
IL-6-type cytokines form a subfamily of helix bundle cytokines. All IL-6-type cytokines
comprise four long α-helices termed A, B, C and D (Figure 4) which are arranged in a way
that leads to up-up-down-down topology.
IL-6 is produced and released by a wide variety of cell types, e.g. monocytes/macrophages,
fibroblasts, endothelial cells, and astrocytes in response to infections or injuries.
IL-6 exerts pleiotropic functions by acting in endocrine, paracrine and autocrine manner on
different target cells. It plays important roles in the regulation of immune system and is the
main mediator of the acute-phase response which is characterized by the synthesis and
secretion of acute-phase plasma proteins by the liver, elevated serum glucorticoid levels and
often fever. It is known that IL-6 leads to the differentiation of both B and T lymphocytes,
acts as a differentiation factor in hematopoiesis and in general, regulates differentiation,
proliferation and survival of many other cell types21.
Figure 4: The four domains A, B, C and D, that form á-helices, are highlighted in different colors.
This cytokine exerts its biological activities through two molecules: a non-signaling α-
receptor termed IL-6 receptor α chain (IL-6Rα), also known as glycoprotein 80 (GP80) or
CD126 and the signal transducing receptor glycoprotein 130 (gp130), also referred to as IL-
6Rβ or CD130. The ectodomains of the IL-6 receptors contains an array of Fibronectin type
III (FNIII)-like and Ig-like domains (Figure 5). Each receptor contain at least a cytokine
binding module (CBM) domain that consists of two FNIII domains. CBM is characterized by
conserved structural features, such as a WSXWS motif in the C-terminal domain and a

20
distinct pattern of cysteine residues in the N-terminal domain. An Ig-like domain is also
located N-terminally to the membrane-proximal CBM22.
To induce cascade signaling, IL-6 first binds to the trans-membrane IL-6Rα (mIL-6Rα), that
is not determinant for signal transduction having a small cytoplasmic domain. On the contrary
gp130 has three additional membrane-proximal FNIII domains22 and its cytoplasmic domain
contains several potential motifs for intracellular signaling, such as YSTV sequence for SHP2
(Src homology domain-containing protein tyrosine phosphatase-2) recruitment and YXXQ
motifs (where X is any aminoacid) for STAT activation.
gp130 does not have any intrinsic kinase domain but, like other cytokine receptors, its
cytoplasmic domain contains regions for the association with a non-receptor tyrosine kinase,
like JAK, and can initiate downstream signaling cascades.
Figure 5: Structural organization of IL-6Rα and gp130. Tyrosine residue of gp130 that become phosphorylated are indicated (Y). For gp130 the box1 and box2 regions, as well as the dileucine motif (LL) are showed. Abbreviations: CBM, cytokine binding module; FNIII, Fibronectin type III; TM, transmembrane; Ig-like, immunoglobuline-like.
Neither IL-6 nor mIL-6Rα alone binds or activates gp130; IL-6 first binds to mIL-6Rα and the
IL-6/mIL-6Rα complex is able to recruit gp130 receptor and triggers its homodimerization. A
high affinity functional receptor complex of IL-6, mIL-6Rα and gp130 is formed; this IL-6
system is called “classical signaling”23 (Figure 6).
Whereas membrane-bound gp130 (mgp130) is ubiquitously expressed, mIL-6Rα expression is
restricted mainly to hepatocytes, neutrophils, monocytes and macrophages; anyway, many
cells not expressing mIL-6Rα are reported to be responsive to IL-6.
The cytokine has been found to use an alternative pathway to activate target cells lacking
mIL-6Rα, called trans-signalling23 (Figure 6), which acts through the soluble agonistic form
of the IL-6Rα (sIL-6Rα), generated by both alternative splicing of mRNA and limited
proteolysis of the membranous form by ADAM (a disintegrine and metalloproteinase)-1722.

21
Figure 6: Representation of IL-6 classical signaling on the left and IL-6 trans-signaling on the right.
One important difference between classical and trans-signaling is that classical signaling is
correlated with anti-inflammatory and regenerative activities, while trans-signaling
contributes to the pro-inflammatory activities of IL-6, e.g. by controlling leukocyte
infiltration, inhibition of T-cell apoptosis and Treg differentiation24.
It has been shown that in chronic inflammatory diseases such as inflammatory bowel disease,
peritonitis, asthma, RA and in colon cancer, IL-6 trans-signaling is critically involved in the
maintenance of the disease state, due to the high levels of IL-6 and sIL-6Rα detected.
Also a soluble form of gp130 (sgp130) has been discovered, which acts as the natural
inhibitor of IL-6/sIL-6Rα complex and selectively inhibits IL-6 trans-signaling without
affecting classic signaling25.
3.2 INTERLEUKIN 15
IL-15 is an inflammatory cytokine, belonging to a subfamily of four helix cytokines, that
stimulates T and NK cells activity. There are two isoforms for this 14-15 kDa glycoprotein
encoded by interleukin 15 gene on chromosome 4: one of 48 aminoacids (IL-15 LSP) that can
be bounded to cytoplasmatic membrane or secreted, and another one with 21 aminoacids (IL-
15 SSP), which can be nuclear or cytoplasmatic and has a role in cell cycle regulation.

22
Interleukin 15 is constitutively expressed by a large number of cells, among which
macrophages, dendritic cells, keratinocytes, fibroblasts, but only few cell types, as monocytes
and dendritic cells, can translate mRNA26.
Main interleukin 15 functions include26,27:
- Stimulus of cytotoxic T lymphocytes proliferation
- NK cells differentiation from hematopoietic progenitors in bone marrow
- Induction of NK cells activation
- Promotion of normal B lymphocytes proliferation and activation
- Activation of CD3+ and CD3- large granular lymphocytes
- Attraction of neutrophils and monocytes in sites of infection.
- Regulation of pro-inflammatory cytokines production by macrophages
- Induction of IL-2 expression by dendritic cells
Expression of IL-15 and its specific receptor IL-15R is upregulated in many infective,
inflammatory and immunological diseases, among which T-LGLL.
The IL-15 specific receptor consists of:
- a specific subunit, IL-15Rα
- IL-15Rβ subunit (CD122) founded also in IL-2 receptor
- Common γ chain (γc)
In most cases IL-15 binds IL-15Rα with high affinity in the endoplasmatic reticulum and the
resulting complex is carried on cell surface where, together with IL-15Rβ, it triggers the
trasductional cascade (Figure 7).
An uncommon mechanism requires instead the transfer of IL-15Rα on cell surface, where it
binds secreted IL-15 (Figure 7). Different IL-15Rα isoforms, derived from alternative
splicing, have been identified, but it’s not clear yet if they have an agonist or antagonist role
in the signaling pathway activation28.

23
Figure 7: Binding mechanisms of IL-15 and IL-15Rα.
Once IL-15/IL-15Rα complex is formed, it is exposed on cell surface, where it contacts IL-
15Rβ and common chain γ and allows IL-15 to exert its functions. This mechanism could
happens through two ways (Figure 8):
- Trans-presentation: IL-15/IL15Rα complex of a cell, generally monocyte or dendritic cell,
binds to IL15Rβ/γc of another cell type, like CD8 T lymphocytes and NK cells. From
recent studies has emerged that this mechanism of IL-15 signaling pathway is the most
common28,29.
Cis-presentation: the IL-15/IL-15Rα complex binds to a IL-2/IL-15Rβ/γc complex located on
the same cell surface. Activation of several signaling pathways, including JAK/STAT and
RAS/MEK/ERK, follows IL-15 binding to its receptor.
Figure 8: IL-15 signaling transduction mechanisms; Panel A: Trans-presentation. Panel B: Cis- presentation.

24
3.3 CCL5
CCL5 (also known as RANTES) is a potent chemotactic agent for memory T lymphocytes
and monocytes that belongs to the CC chemokine subfamily and is expressed after cellular
activation in fibroblasts, T cells, monocytes, endothelial cells and certain epithelial cells30.
This chemokine is reported to be strongly expressed by peripheral blood mononuclear cells of
LGLL patients, together with other inflammatory cytokines, as MIP-1β, IL-18, IL-6, IL-15
and to a lesser extent IL-8 and IL-1Ra31.
This pattern of cytokine up-regulation characterizes LGLL and can be found also in some
chronic infections or autoimmune diseases, sustaining the hypothesis for which LGLL is
characterized by a chronic inflammatory background.
Moreover, literature data report that among various human T-cell lines (those infected with
HTLV-I) preferentially express CCL5, supporting the etiopathogenic hypothesis of a chronic
antigenic stimulation by exogenous antigens, and that this expression is mediated in part by a
transcriptional trans-activator of HTLV-1, Tax, via the activation of Nuclear factor-kB (NF-
kB)30.
Yang and colleagues described another mechanism of CCL5 production by NF-kB
activation32: These Authors found that unphosphorylated STAT3 (USTAT3) binds to the NF-
kB dimers p65/p50 in competition with IkB. The USTAT3/NF-kB complex translocates into
the nucleus, binds to DNA, and activates NF-kB-regulated genes, among which CCL5.
Therefore, CLL5 over-expression seen in patients’ plasma could be explained by higher
expression levels of USTAT3 in T-LGLL patients, due to the constitutively activated
JAK/STAT axis.
4. SIGNALING PATHWAYS ACTIVATED IN LEUKEMIC LGLs
Signaling cascades serve several purposes: to carry a message from the cell surface into the
nucleus, to amplify the signal and to regulate the cell in order to adapt to the environment.
Doing so, signaling pathways do not work isolated, instead they are involved in dynamic and
complex interactions.
As mentioned above, while normal activated CTLs readily undergo Fas-FasL-mediated
apoptosis, leukemic LGLs are resistant to FasL-mediated apoptosis or AICD. This raises from
two possible causes: (1) Fas-FasL apoptotic machinery is deficient in leukemic LGLs, or (2)

25
some constitutively survival signals keep leukemic LGLs alive despite of Fas-mediated death
signals.
Starting from the actual knowledge that no mutations in Fas or FasL genes were found in
LGLL4, we can consider that some survival signals keep leukemic LGLs away from death.
There are several intracellular signaling pathways, having a cross-talk with the Fas-FasL
pathway, that could be responsible for AICD escaping.
Concerning Fas-FasL pathway alteration, it was reported an abnormal DISC formation;
indeed, higher basal levels of c-FLIP protein, a DISC inhibitor, were detected that contributes
to the Fas-resistant phenotype in leukemic LGLs4.
Many signaling pathways are deregulated in LGL leukemia (Figure 9)9,33,34:
• RAS/MEK/ERK: a constitutive active form of Ras (H-Ras-GTP) is expressed in PBMCs,
promoting cell survival by directly inducing transcription of FLIP and myeloid cell leukemia
sequence-1 (Mcl-1) genes;
• NF-kB: LGLs show constitutively active NF-ĸB, that induces the expression of Mcl-1 and c-
Rel genes;
• PI3K/Akt: SFK maintains PI3K in its constitutively activated form, with consequent
constitutive Erk activity. The result is abnormal DISC formation and Fas-resistance;
• JAK/STAT: STAT1 and STAT3 are constitutively activated and STAT3 induces the
expression of Mcl-1 gene;
• Sphingolipid Rheostat: LGLs express abundant anti-apoptotic sphingosine 1-phosphate
(S1P) and ceramide 1-phosphate (C1P) and low levels of proapoptotic ceramide and
sphingosine.
The signaling network model proposed by Zhang et al34 suggests that the persistence of the
cytokine IL-15 and platelet-derived growth factor (PDGF) is sufficient to reproduce all known
deregulations in leukemic T-LGLs.
IL-15 alters the expression of Bcl-2 family members, i.e. Bcl-2, Bcl-XL, Bim, Noxa, and
Mcl-1 and many of these genes result deregulated in T-LGLL, such as Bcl-2 related X gene
(Bax), that is down-regulated, and Mcl-1, which is up-regulated (Figure 9)34. The deregulation
of T-cell homeostasis due to the alteration of pro- and anti-apoptotic factors could be
responsible for leukemic LGLs survival. In the present study a particular attention has been
addressed to the deregulation of JAK/STAT pathway.

26
Figure 9: Various survival signaling pathways interact and cross-regulate each other at various levels. The dynamic interaction leads to survival of leukemic large granular lymphocytes.
4.1 THE JAK/STAT PATHWAY
JAK/STAT pathway is one of the few pleiotropic cascades used to transduce a multitude of
signals for cell development and homeostasis. In mammals, JAK/STAT pathway is the
principal signaling mechanism for a wide array of cytokines and growth factors.
JAK activation stimulates cell proliferation, differentiation, migration and apoptosis, events
that are critical to hematopoiesis, immune development, and other processes. Predictably,
mutations that involve pathway activity affect these processes35, for example, mutations that
constitutively activate or fail to regulate JAK signaling properly, cause inflammatory disease,
erythrocytosis and different forms of leukemia.
Following T-cell activation, the association of two receptor subunits’ cytoplasmic domains
with JAK tyrosine kinases is required (Figure 10).
Two kinase-homologous domains at the C-terminus characterize JAK kinases: one is a non-
catalytic regulatory domain, whereas the other has tyrosine kinase activity.
Once ligand-receptor complex is formed, it triggers its own dimerization and recruits two
JAKs, which are therefore brought into close proximity; this step allows their trans-
phosphorylation and activation.
27
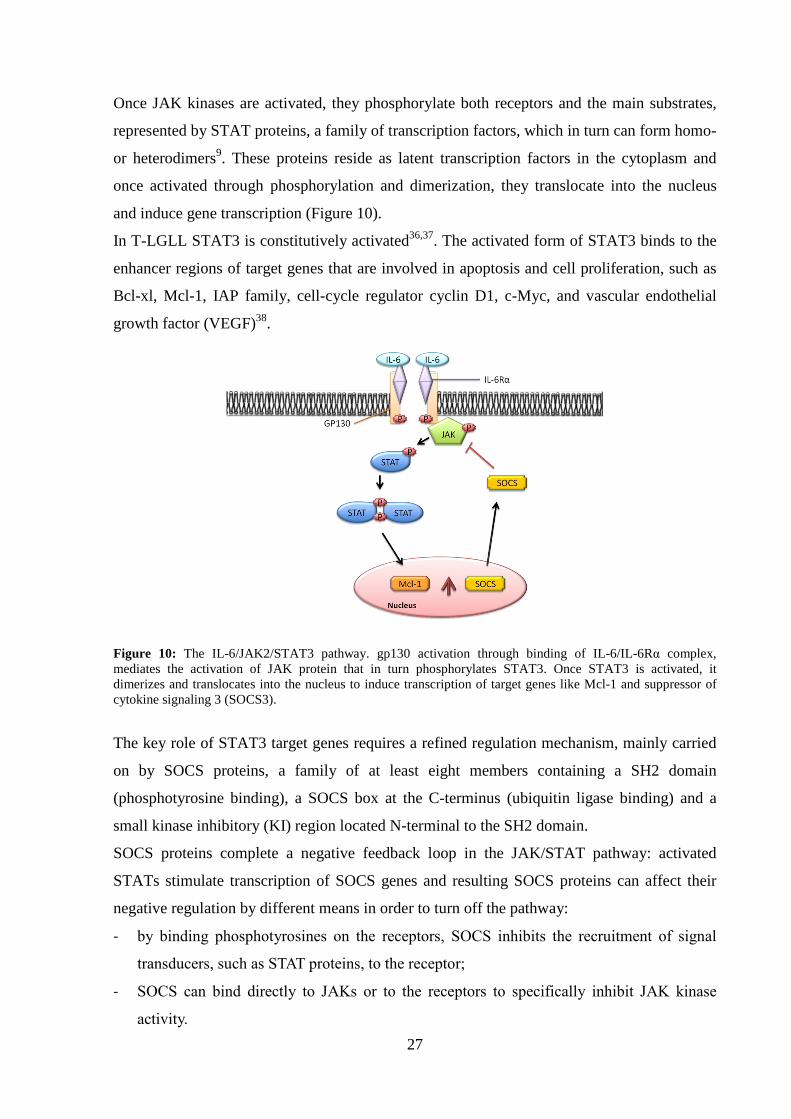
Once JAK kinases are activated, they phosphorylate both receptors and the main substrates,
represented by STAT proteins, a family of transcription factors, which in turn can form homo-
or heterodimers9. These proteins reside as latent transcription factors in the cytoplasm and
once activated through phosphorylation and dimerization, they translocate into the nucleus
and induce gene transcription (Figure 10).
In T-LGLL STAT3 is constitutively activated36,37. The activated form of STAT3 binds to the
enhancer regions of target genes that are involved in apoptosis and cell proliferation, such as
Bcl-xl, Mcl-1, IAP family, cell-cycle regulator cyclin D1, c-Myc, and vascular endothelial
growth factor (VEGF)38.
Figure 10: The IL-6/JAK2/STAT3 pathway. gp130 activation through binding of IL-6/IL-6Rα complex, mediates the activation of JAK protein that in turn phosphorylates STAT3. Once STAT3 is activated, it dimerizes and translocates into the nucleus to induce transcription of target genes like Mcl-1 and suppressor of cytokine signaling 3 (SOCS3).
The key role of STAT3 target genes requires a refined regulation mechanism, mainly carried
on by SOCS proteins, a family of at least eight members containing a SH2 domain
(phosphotyrosine binding), a SOCS box at the C-terminus (ubiquitin ligase binding) and a
small kinase inhibitory (KI) region located N-terminal to the SH2 domain.
SOCS proteins complete a negative feedback loop in the JAK/STAT pathway: activated
STATs stimulate transcription of SOCS genes and resulting SOCS proteins can affect their
negative regulation by different means in order to turn off the pathway:
- by binding phosphotyrosines on the receptors, SOCS inhibits the recruitment of signal
transducers, such as STAT proteins, to the receptor;
- SOCS can bind directly to JAKs or to the receptors to specifically inhibit JAK kinase
activity.

28
The constitutive expression and activation of STAT1 and STAT3 by leukemic LGLs could be
responsible of their survival; as a matter of fact, 2-cyano-3-(3,4-dihydroxyphenyl)-N-
(benzyl)-2-propenamide (AG490), an inhibitor of JAK2/3 and consequently of STAT1/3, can
restore apoptosis and Fas sensitivity in LGLs.
In our lab we focused our attention on STAT3 protein. This protein contains about 750-850
amino acids and the domain structure comprises from N- to C-terminus: an oligomerization
domain, the so-called coiled-coil domain, the DNA-binding domain in the center of the
molecule, the linker domain, the SH2 domain that binds to a specific phosphotyrosine in a
cytokine receptor’s cytosolic domain and the trans-activation domain (TAD) with critical
tyrosine and serine residues (Figure 11).
Unphosphorylated STAT3 represents the inactive form, that resides in the cytoplasm until
activation occurs by transient association of STAT3 with cytokine receptors39.
STAT3 recruitment to the activated JAKs has been shown to be mediated by SH2 domain and
requires the phosphorylation of receptor tyrosine motifs, specifically tyrosine 70539. The
phosphorylation activates STAT3, that can form homodimers or heterodimers and translocates
to the nucleus, where it induces the expression of target genes.
After cytokine stimulation STAT3 is phosphorylated also on serine residue 727 within the
trans-activation domain, although it is not clear what is the serine kinase involved in the
process. Serine residue 727 phosphorylation seems unable to interfere with STAT3 tyrosine
phosphorylation, while it regulates STAT3 transcriptional activity40.
STAT3 specific inhibition, which could be performed by antisense oligonucleotides, has been
shown to induce significant apoptosis and to restore Fas-sensitivity in leukemic LGLs. In
particular, STAT3 inhibition correlates with a Mcl-1 decrease, indicating a role of this anti-
apoptotic protein in LGLs survival37.
Figure 11: STAT protein structure. Abbreviations: Y, tyrosine; S, serine.
29
Recent data in the literature report mutational hot spots in SH2 domain of STAT3; it has been
hypothesized that constitutive activation may result from increased stabilization of STAT3
homodimers or heterodimers through enhanced hydrophobic attraction between STAT
monomers caused by STAT3 mutations41,42. We therefore analyzed whether patients’ LGLs
showed any of the STAT3 hot spot mutations above quoted.

30
31
AIM OF THE STUDY
The PhD project carried on different research lines with the aim to better understand the
pathogenesis and the molecular mechanisms characterizing the development of T-LGLL.
T-LGLL is characterized by a chronic and clonal expansion of LGLs, sustained by a
continuous cytokine stimulus and an impairment in the apoptotic machinery. This latter is due
to the activation of several survival signaling pathways.
In our lab we focused on JAK/STAT pathway, since it is reported to be deregulated in T-
LGLL, with a constitutive activation and over-expression of the transcription factor STAT3.
In order to explain this impairment we studied:
- SOCS3 expression and promoter region. This protein is STAT3 specific inhibitor,
normally acting through a negative feedback mechanism. Being among STAT3 target
genes, it is expected to be, in turn, over-expressed in T-LGLL.
- IL-6 levels and its receptor system to evaluate its involvement in the development of
T-LGLL, considering that it is reported to be the main activator of JAK/STAT
pathway.
- IL-15 levels and its effects on IL-6 signaling. IL-15, as IL-6, is an inflammatory
cytokine and has a well defined key role in T-LGLL. It is mainly secreted by patients’
cells belonging to the monocyte/macrophage lineage, among which DC, that are
considered the responsible of LGLs antigen activation.
- STAT3 mutations in SH2 domain, since in some patients affected by T-LGLL, STAT3
hot spot mutations, inducing STAT3 activation, have been recently demonstrated.
Being bone marrow of patients frequently infiltrated by LGLs, we studied also:
- The role of CLL5 in LGL BM infiltration. CCL5 is induced by STAT3, is a strong
chemotactic agent and an important mediator of acute and chronic inflammation, and
is reported to be over-expressed in LGLL.
- BM-MSCs involvement in the survival maintenance and compartmentalization of
leukemic LGLs, since these cells are considered a source of IL-6, the main activator of
STAT3 signaling.

32

33
MATHERIALS AND METHODS
1. PATIENTS AND CONTROL DONORS
Sixty patients affected by T-LGLL were studied. Chronic peripheral blood lymphocytosis
(lasting more than 6 months) was sustained by at least 2,000 LGLs/mm3 (range: 25%-95% of
lymphocyte pool)43, with the phenotype CD3+CD57+CD8+CD16±CD56±. At the time of the
study no patients had received treatment, with a follow up ranging from 1 to 16 years. In all
patients clonality was demonstrated by molecular analysis of TCR gene rearrangement and
often a prevalent expression of a discrete TCR Vβ region was established, according to the
methods previously reported44. Twenty healthy donors were used as controls in all
experiments performed, which were approved by the Institutional Review Board. All enrolled
patients and controls provided written informed consent in accordance with the Declaration of
Helsinki.
2. LYMPHOCYTES SEPARATION FROM PERIPHERAL BLOOD
Lymphocytes were isolated from peripheral blood of T-LGLL patients and healthy
individuals. Mononuclear cells were obtained from samples of heparinized venous blood by
Ficoll-Hypaque (F/H) (Amersham Biosciences; San Francisco, CA) density gradient
centrifugation.
This is a simple and rapid method of purifying PBMCs that takes advantage of the density
differences between mononuclear cells and other elements of the blood. Mononuclear cells
and platelets collect on top of the F/H layer because they have a lower density. In contrast, red
blood cells (RBC) and granulocytes have a higher density than F/H and collect at the bottom
of the F/H layer.
Peripheral blood was first diluted in 1:3 ratio with 0.9% sodium chloride (saline) at room
temperature, gently agitated, and later layered slowly over F/H solution. We proceeded with a
centrifugation at 900g for 20 min at 20°C, without brake. The ring of mononuclear cells
formed at F/H interface was aspirated and subjected to two subsequent washes with saline by
centrifugation at 400g for 10 minutes at 20°C (Figure 13). The pellet was resuspended in an
adequate amount of saline buffer; the cells were counted in a Burker chamber and used as
desired.

34
Figure 13: Isolation of mononuclear cells from peripheral blood by stratification on Ficoll/Hipaque. By centrifugation on F/H, mononuclear cells were isolated from peripheral blood. Mononuclear cells and platelets were concentrated above the layer of F/H because they have lower density; on the contrary, the red blood cells (RBC) and granulocytes (PMN) have a higher density than the F/H and collect on the bottom of the tube. RT: room temperature.
3. T-LGLs SORTING AND FLOW CYTOMETRY
The immunophenotypic analysis on lymphocytes obtained from peripheral blood of T-LGLL
patients was performed through flow cytometry. This technique allows a multiparametric
evaluation of antigenic characteristic of single cells by the analysis of visible and fluorescent
light they emit when flow through a liquid medium.
The immunophenotyping is based on the identification of surface and intracellular Ag using
monoclonal antibodies (moAbs) conjugated with fluorochromes. The presence of a certain Ag
is revealed and used as an indicator of belonging to a cell line and of cell level maturation.
Target cell population used in this thesis was detected by fluorochromes-conjugated moAbs
(Becton Dickinson, Sunnyvale, CA, USA) anti-CD3, anti-CD16, anti-CD56, anti-CD57 and
anti-CD8.
Analysis was performed by flow cytometer FACSCalibur (Becton Dickinson) and data
obtained were processed by Macintosh CELL Quest software program (Becton Dickinson).
For each analysis at least 1x10⁴ events were acquired and analysis was performed overlapping
samples’ histograms (obtained with different antibodies) with isotypic control (fluorescein
isothiocyanate (FITC)-conjugated IgG1 antibody) histogram.
LGLs from patients and CTLs from controls (the putative normal counterpart of pathologic
LGLs, represented by CD8+CD57+ cells) were obtained by sorting process, based on
recognition of specific surface antigens.
An antibody conjugated with FITC fluorochrome was incubated with a mononuclear cells
quantity between 30 and 125x106 and diluted in phosphate buffered saline (PBS) for 20
minutes at 4°C. IgG1 FITC-conjugated antibody was used as isotypic control.

35
Antibody treated cells were then subjected to two washes and resuspended in PBS-EDTA
(Ethylenediaminetetraacetic acid). Antibody conjugated cells were then isolated from total
cell population by FACSAria cell sorter (BD Biosciences, San Jose CA, USA), with a large
band-pass filter at 530 nm and Argon laser (488 nm, 100mW) that excited FITC
fluorochrome. For each analyzed sample 5,000 events/sec had been acquired.
In order to minimize the possibility of nozzle clogs, the sample had to be put through a 40
micron cell strainer before sorting. After filtering, the cells should be kept on ice and
protected from light. To avoid clumps formation, for really sticky cells another filtering step
before sorting was required. Purity and vitality of obtained cells were then analyzed, and
resulted always higher than 95%.
Cells were then employed for total RNA extraction.
4. T-LGLs PURIFICATION BY IMMUNOMAGNETIC BEADS
Alternatively to sorting technique, especially for low cellularity samples, T-LGLs from
patients were obtained using magnetic separations over columns (MACS; Miltenyi Biotec,
Auburn, CA). This technique employs superparamagnetic particles coupled to highly specific
monoclonal antibodies, in our specific case CD57, which magnetically labels target cell
population.
Thanks to their small size, approximately 50 nm, microbeads, which are also biodegradable,
do not activate cells and do not saturate cell surface epitopes.
In detail, PBMCs obtained from F/H separation were centrifuged at 300g for 10 minutes; after
removal of supernatant, pellet was resuspended with purification buffer (PBS 1X, BSA
(Bovine Serum Albumine) 0.5%, EDTA 2 mM). MACS microbeads were added to cell
suspension (80 µl buffer and 20 µl of microbeads for 10⁷ cells) and incubation at 4-8 °C was
performed for 15 minutes. A washing step was performed by adding 1-2 mL of buffer per 107
cells and after a centrifuge step at 300g for 10 minutes, cells were placed onto specific
magnetic columns (MACS) placed on a MACS magnetic separator; this amplifies the
magnetic field by 10,000-fold, therefore inducing a high gradient within the column.
Magnetically labeled cells were retained within the column, unlabeled cells flown through.
After a washing step, the column was removed from the magnetic field of the separator, and
the target cells were eluted from the column, washed with physiologic solution, counted and
used for experiments.

36
5. CELL CULTURES
LGLs purified from patients or CTLs from controls were cultured at 2x10⁶ cells/ml in RPMI-
1640 medium (Euroclone) containing L-glutamine (2mM) and HEPES (25mM) (Gibco
Laboratories, Grand Island, NY, USA) added with FCS (Fetal Calf Serum) at a concentration
of 0,5%. Penicillin (100 U/ml) and streptomycin (100 µg/ml) (Gibco Laboratories, Grand
Island, NY, USA) were added to the medium at a concentration of 1%.
Cells were then incubated at 37°C with humidity and 5% CO2.
All cell treatments were performed under a laminar flow cabinet (Biohazard). We stimulated
LGLs and PBMCs from patients with IL-6 (10 ng/ml) and IL-15 (10 ng/ml) (R&D Systems,
Minneapolis, MN, USA) and we evaluated STAT3, pSTAT3, levels at 24 and 48 hours.
The effect of IL-6 triggering on LGLs or CTLs culture was studied by incubation with 10
ng/ml IL-6 to observe STAT3 activation, SOCS3 and CCL5 expression after 1 hour, Mcl-1
expression up to 6 hours and LGL apoptosis up to 7 days. Except for CCL5 the same analysis
were performed following 96 hours cells treatment with DAC (5 µM).
To inhibit STAT3 phosphorylation LGLs were cultured with AG490 (50 µM) (Calbiochem,
Darmstadt, Germany), a specific inhibitor of Jak2.
To neutralize IL-6 action, PBMCs were cultured in the presence of a anti-IL-6 or anti-IL-6Rα
(2 µg/ml) antibodies; a mouse IgG1 antibody was used as a control (2 µg/ml).
Finally we used IL-6 (10 ng/ml) and IL-15 (10 ng/ml) on CD57- cells from patients and
PBMCs from controls to observe IL-6 and IL-15 expression at 24 h and 48h, and we use these
cytokines also on patients’ CD57+ cells and controls’ CTLs to observe IL6Rα expression at
24h and 48h.
6. MOLECULAR ANALYSIS
6.1 TOTAL RNA EXTRACTION
Total RNA was extracted from peripheral blood T lymphocytes by “Rneasy Mini” kit
(QIAGEN, Hilden, Germany) according to manufacturer’s instruction.
Lymphocytes were lysed using a solution containing β-mercaptoethanol and lysis buffer; 70%
ethanol (usually 350 µl or 600 µl) then was added according to product user manual, and
samples were transferred to a purification column (supplied by the kit) and then centrifuged at
10,000 rpm for 15 seconds, followed by elute removal.

37
After the addition of 350µl of RW1 buffer (supplied by the kit), samples were centrifuged
again at 10,000 rpm for 15 seconds and the elutes were discarded. Then we proceeded with 20
minutes of incubation with 80µl of a DNase I solution (QIAGEN). After having washed with
350µl of RW1 buffer, followed by centrifugation at 10,000 rpm for 15 seconds, the collector
tube was replaced. 500µl of RPE buffer (supplied by the kit) were added, the samples were
centrifuged at 10,000 rpm for 15 seconds, and the elutes were discarded. Again, 500µl of RPE
buffer were added and a centrifugation at 15,000g for 2 minutes was carried out. Columns
were then transferred to 1.5ml tubes, 30µl of H2O- Rnase free (supplied by the kit) were
added on the membrane, and purification was performed by centrifugation at 10,000 rpm for 1
minute in order to dissociate the RNA from the membranes and bring it into solution.
The extracted RNA was then quantified using a spectrophotometer Ultrospec 1100 pro
(Amersham Biosciences). RNA samples were diluted 1:70, their absorbance (A) at
wavelengths of 260nm (λ nucleotides) and 280nm (λ proteins) was determined, and
A260/A280 ratio was calculated. Values less than 2 indicate a protein contamination of RNA
preparation.
RNA concentration was finally calculated using the following formula:
A260 x dilution factor x 40 = RNA concentration in µg/ml.
The value of 40 corresponds to the concentration of RNA, expressed in µg/ml, when obtained
A260 is 1.
6.2 cDNA SYNTHESIS
The reverse transcription from mRNA to cDNA (complementary DNA) uses a reverse
transcriptase (RT), which generates a cDNA strand from a template of mRNA.
In this thesis, total RNA has been used as template and the reaction was performed in the
presence of an oligo-dT primer, which hybridizes to the poly(A) tail of mRNA. The RT used
is the Myeloblastoma Avian Virus (AMV) polymerase (Promega, Madison, WI, USA); this
enzyme has 5'→3' activity (with RNA or DNA as a template) and a 3'→5' RNase H activity,
which degrades the RNA filament of the double helix DNA-RNA, produced during cDNA
synthesis. This latter was performed by the “Reverse Trascription System” kit (Promega
Corporation; Madison, WI).
The reaction mixture is composed of:
- 4 µl of 25mM MgCl2
- 2 µl of 10X RT buffer
38
- 2 µl of the mixture of the 4 deoxynucleosides triphosphates (dNTP mix) 10mM
- 0.5 µl of an enzyme inhibitor of RNase 40 µg/µl
- 0.6 µl of AMV RT 25 µg/µl
- 1 µl of primer Oligo (dT) 0.5 mg/ml
- 1 µg of RNA
- RNase-free H2O to final volume of 20 µl
Before the additon of RT reaction mixture, tubes containing template RNA were placed into a
pre-heated 70°C heat block for 5 minutes. After this initial step, mixture containing RNA was
incubated at 42°C for 15 minutes, then placed at 95°C for 5 minutes (to stop the RT reaction)
and, finally, put on ice for a few minutes. Thus, the cDNA obtained was stored at -80°C or
used immediately to set up the amplification reaction by means of Real Time -polymerase
chain reaction (RT-PCR).
6.3 REAL TIME PCR
RT-PCR is a technique commonly used in molecular biology to detect the amplification of
cDNA and therefore RNA expression levels. It’s based on the direct correlation between
fluorescence emission and cDNA amplification.
In our lab, each sample was amplified in duplicate and genes of interest were STAT3, IL-6,
IL-6Rα, IL-15, CCL5, Mcl-1 and gp130 besides the housekeeping gene GAPDH
(Glyceraldehyde 3-phosphate dehydrogenase), which is expressed constitutively in all cells
and acts as normalizer. For each gene, RT-PCR was also performed on a negative control.
The amplification of the genes of interest were obtained using ABI PRISM 7000 sequence
detection system (Applied Biosystems; Foster City, CA) in a volume of 15µl. For each sample
a reaction mix was used, made with:
- 1,5 µl cDNA
- 4,2 µl H2O without RNAse
- 0,9 µl primer Forward (Fw) 5 µM (Sigma)
- 0,9 µl primer Reverse (Rev) 5 µM (Sigma)
- 7,5 µl SYBR Green PCR Master Mix 2X (Applied Biosystems), which contains Taq
polymerase, A,C,G,U nucleotides, reaction buffer, magnesium chloride, uracil-N-
glycosylase (UNG) and SYBR Green (Applied Biosystems).

39
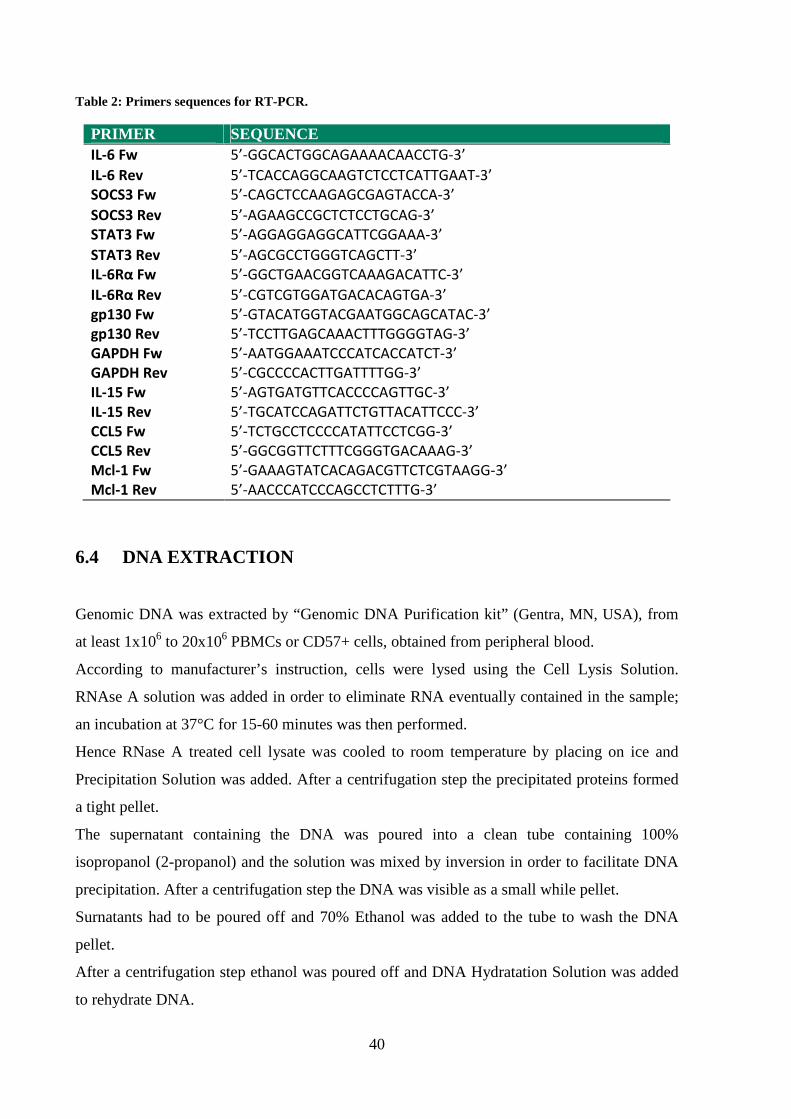
The primers used for amplification of gene of interest are reported in Table 2 and were
designed in our lab, except for STAT3, for which we used the primers as described in Haider
et al45.
For the reaction, an initial step at 50°C for 2 minutes is required in order to activate UNG
enzyme, which breaks down possible contamination derived from previous reactions, that
show uracil (U) in place of thymidine (T)
After this step, reaction conditions were:
- Denaturation at 95°C for 10 minutes
- Annealing at 60°C for 15 seconds
- Extension at 72°C for 1 second
A dissociation curve to distinguish specific from nonspecific amplification was also
generated.
Threshold cycle (Ct) was acquired for each sample and starting quantities (Co) of each sample
were obtained with Ct method, which is based on the following equation:
Co=2-∆∆Ct
where ∆Ct represents the difference between target gene Ct and housekeeping gene Ct, and
∆∆Ct is obtained by subtracting sample ∆Ct from calibrator ∆Ct.
Calibrator is a sample used as reference which is included in every reaction plate in order to
compare different plates’ results.
For 45 cycles
40
Table 2: Primers sequences for RT-PCR.
PRIMER SEQUENCE IL-6 Fw 5’-GGCACTGGCAGAAAACAACCTG-3’
IL-6 Rev 5’-TCACCAGGCAAGTCTCCTCATTGAAT-3’
SOCS3 Fw 5’-CAGCTCCAAGAGCGAGTACCA-3’
SOCS3 Rev 5’-AGAAGCCGCTCTCCTGCAG-3’
STAT3 Fw 5’-AGGAGGAGGCATTCGGAAA-3’
STAT3 Rev 5’-AGCGCCTGGGTCAGCTT-3’
IL-6Rα Fw 5’-GGCTGAACGGTCAAAGACATTC-3’
IL-6Rα Rev 5’-CGTCGTGGATGACACAGTGA-3’
gp130 Fw 5’-GTACATGGTACGAATGGCAGCATAC-3’
gp130 Rev 5’-TCCTTGAGCAAACTTTGGGGTAG-3’
GAPDH Fw 5’-AATGGAAATCCCATCACCATCT-3’
GAPDH Rev 5’-CGCCCCACTTGATTTTGG-3’
IL-15 Fw 5’-AGTGATGTTCACCCCAGTTGC-3’
IL-15 Rev 5’-TGCATCCAGATTCTGTTACATTCCC-3’
CCL5 Fw 5’-TCTGCCTCCCCATATTCCTCGG-3’
CCL5 Rev 5’-GGCGGTTCTTTCGGGTGACAAAG-3’
Mcl-1 Fw 5’-GAAAGTATCACAGACGTTCTCGTAAGG-3’
Mcl-1 Rev 5’-AACCCATCCCAGCCTCTTTG-3’
6.4 DNA EXTRACTION
Genomic DNA was extracted by “Genomic DNA Purification kit” (Gentra, MN, USA), from
at least 1x10⁶ to 20x106 PBMCs or CD57+ cells, obtained from peripheral blood.
According to manufacturer’s instruction, cells were lysed using the Cell Lysis Solution.
RNAse A solution was added in order to eliminate RNA eventually contained in the sample;
an incubation at 37°C for 15-60 minutes was then performed.
Hence RNase A treated cell lysate was cooled to room temperature by placing on ice and
Precipitation Solution was added. After a centrifugation step the precipitated proteins formed
a tight pellet.
The supernatant containing the DNA was poured into a clean tube containing 100%
isopropanol (2-propanol) and the solution was mixed by inversion in order to facilitate DNA
precipitation. After a centrifugation step the DNA was visible as a small while pellet.
Surnatants had to be poured off and 70% Ethanol was added to the tube to wash the DNA
pellet.
After a centrifugation step ethanol was poured off and DNA Hydratation Solution was added
to rehydrate DNA.

41
Rehydrated DNA was then store at 4°C, or at -20°C/-80°C for long-term storage
Quantification by spectrometer was finally required in order to obtain DNA concentration and
purity.
6.5 DNA MODIFICATION AND METHYLATION-SPECIFIC PCR (MSP)
DNA extracted was then modified by sodium bisulfite, converting only unmethylated
cytosines to uracil, as described by Herman et al46.
The “Methylamp™ DNA Modification Kit” has been used in order to perform bisulfite
conversion and converted DNA was used as template for MSP as described47, using either a
methylation- or unmethylation-specific primer set.
The sequence amplified was from nucleotides –525 to –384 of the SOCS3 promoter region,
defining the start codon ATG as +1.
Methylation- and unmethylation-specific primers are reported in Table 3.
Table 3: Primers sequences for MSP.
PRIMER SEQUENCE Methylation-specific Fw 5’-GGAGATTTTAGGTTTTCGGAATATTTC-3’
Methylation-specific Rev 5’-CCCCCGAAACTACCTAAACGCCG-3’
unmethylation-specific Fw 5’-GTTGGAGATTTTAGGTTTTTGGAATATTTT-3’
unmethylation-specific Rev 5’-AAACCCCCAAAACTACCTAAACACCA-3’
PCR products were analyzed in 2% agarose gel stained with Syber Safe (Invitrogen, Paisley,
UK) and visualized under ultraviolet illumination in order to detect DNA samples containing
a methylated SOCS3 promoter region.
6.6 BISULFITE SEQUENCING
Bisulfite-modified DNA was amplified using primers recognizing SOCS3 promoter region
from nucleotide –704 to –186 (forward: 5’-GATTTGAGGGGGTTTAGTTTTAAGGA-3’
and reverse 5’-CCACTACCCCAAAAACCCTCTCCTAA-3’) as reported by Isomoto et al48.
The PCR products were cloned into the PCR II vector in accordance with manufacturer’s
instruction employing the “TOPO-TA cloning kit” (Invitrogen).

42
Plasmid DNA purified from 5 randomly picked clones using the “Plasmid miniprep kit” (Bio-
Rad Laboratories, Hercules, CA) were obtained and prepared for automated DNA sequencing
analysis. The reaction conditions were as follows: 96°C 10 seconds, 50°C 5 seconds, 60°C 4
minutes, for 25 cycles.
DNA was sequenced using dye terminator technology and an ABI 3130 sequencer (Applied
Biosystems), which is based on Sanger sequencing
6.7 SCREENING OF SOCS3 AND STAT3 MUTATIONS
To sequence SOCS3 gene we used primers designed to cover the entire coding region (678
bp) as reported by Cho-Vega et al.49:
upstream primer 5'-CATGCCCTTTGCGCCCTT
downstream primer 5'-AGATCCACGCTGGCTCCGT,
For the screening of STAT3 mutations D661V, D661Y, D661H, Y640F, N647I and K658N,
recently described by Koskela et al.41, we constructed the same set of primers to amplify the
exon 21, where all the mutations are located. Template DNA was obtained from patients’
purified LGLs and remaining autologous PBMCs. As healthy control we used DNA obtained
both from CD8+CD57+ cells and PBMCs of buffy coats.
DNA was sequenced as described in the previous paragraph.
The presence of D661Y and Y640F mutations, non-detectable by direct sequencing due to the
low sensitivity of the method (reaching 25% of positive cells) was also analyzed by a DNA
tetra-primer amplification refractory mutation system (ARMS) assay, as reported by Jerez et
al42.
6.7.1 Sanger Sequencing
Sanger Sequencing is a multi-step process, consisting of:
- PCR of STAT3 gene exon 21, located on chromosome 17
- Control PCR employing an agarose gel at 2%
- Clonewell based purification/ purification from gel
- Cycle sequencing, using dye terminator technology
- Column-based purification of cycle sequencing products
- Sanger-sequencing.

43
� Exon 21 PCR
STAT3 gene exon 21 PCR produces high amounts of exon 21 copies that can be used for
mutation analysis. For each sample a reaction mix was used, made with:
- 27.5 µl H2O
- 5 µl Buffer 10X
- 3 µl MgCl2 25mM
- 4 µl dNTPmix 10mM
- 4 µl Primer Fw 20pM
- 4 µl Primer Rev 20pM
- 0,5 µl TaqGold 1U/ul
Mix were split in aliquots of 48µl that were distributed in PCR test tubes. 2µl of sample’s
concentrated DNA were then addicted.
Test tubes were finally centrifugated at 4°C in a mini-centrifuge and put in thermal cycler.
The reaction conditions were as follows:
- Denaturation at 94°C for 10 minutes
- Denaturation at 94°C for 30 seconds
- Annealing at 60°C for 1minute and 30 seconds
- Extension at 72°C for 1 minute
- Extension at 72°C for 10 minute
- Rapid thermal ramp to 12 °C and hold
� Control of PCR products employing an agarose gel
PCR products were analyzed with a 2% agarose gel, addicted of 5% Syber Safe.
5µl of each sample and 2µl of molecular weight (100 bp) were loaded on gel and
electrophoretic run was performed. Finally gel analysis and acquisition were performed with
ChemiDoc (Bio-Rad,USA) strumentation and software.
� Clonewell based purification
Exon 21 PCR products were purificated by Clonewell procedure, that requires E-Gel®
CloneWell™ 0.8% SYBR Safe™ gels (Invitrogen life technologies, California, USA) and the
For 35 cycles

44
E-Gel® iBase™ Power System (Invitrogen). This system allows the extraction of DNA bands
of interest from the gel without any additional purification steps.
� Purification from gel
Alternatively to Clonewell, purification of Exon 21 PCR products can be performed by
purification from gel.
QIAquick Gel Extraction Kit (QIAGEN Duesseldorf, Germany) was used. This protocol is
designed to extract and purify DNA of 70 bp to 10 kb; up to 400 mg agarose can be processed
per spin column.
Once agarose gel was placed on trans illuminator, the band of interest became visible and
could be excised with a clean, sharp scalpel; the gel slice was putted inside a sterile and
colorless 1.5 ml tube and weighed. According to manufacturer’s instructions, 3 volumes of
Buffer QG were added to 1 volume of gel (100 mg ~ 100 µl), followed by incubation at 50°C
for 10 min (or until the gel slice has completely dissolved). The tube was vortexed every 2–3
min to help dissolve gel.
To increase the yield of DNA fragments <500 bp and >4 kb, 1 gel volume of isopropanol was
added to the sample, and the resulting mix was applied to a QIAquick spin column placed in a
provided 2 ml collection tube; followed a centrifugation step for 1 minute.
Flow-through was discarded and QIAquick column was placed back in the same collection
tube. A wash step was performed adding 750 µl of PE Buffer and performing centrifuge for 1
minute.
After flow-through elimination an additional centrifuge was performed for 1 minute. Column
was the applied to a 1.5 ml collection tube and 30 µl of EB Buffer (10 mM Tris-Cl, pH 8.5)
were added in the middle of the column. After an incubation of 1 minute at room temperature,
1 minute centrifuge was performed and column eliminated; the remained tube containing
purificated DNA sequence was conserved at 4°C.
� Cycle Sequencing
Cycle sequencing protocol allows the separation of already purified amplified DNA fragments
for sequencing process. This method exploits the repetition of heat denaturation, alignment
and extension cycles, to increase the signal level starting from low DNA template quantities.
45
The technique, based on Sanger sequencing, employs a PCR reaction that synthesizes new
strands of DNA complementary to a single-stranded template. The template DNA is supplied
with a mixture of all four deoxynucleotides, four dideoxynucleotides (ddNTPs)-each labeled
with a different color fluorescent tag, and DNA polymerase. Beacause of this feature, this
sequencing technique is called dye terminator sequencing.
Dideoxynucleotides are chain-terminating inhibitors of DNA polymerase; the absence of the
3'-hydroxyl group (-OH) means that, after being added by a DNA polymerase to a growing
nucleotide chain, no further nucleotides can be added as no phosphodiester bond can be
created, leading to the termination of the DNA sequence.
During PCR, as all four deoxynucleotides are present, chain elongation proceeds until, by
chance, DNA polymerase inserts a dideoxynucleotide. The result is a new set of DNA chains
all of different lengths. The fragments are then separated by size using gel electrophoresis.
As each labeled DNA fragment passes a detector at the bottom of the gel, the color is
recorded. The DNA sequence is then reconstructed from the pattern of colors representing
each nucleotide in the sequence.
Two reaction mix, one with primer Forward (Fw) and one with primer Reverse (Rev), were
set up for sequencing template forward and reverse strands respectively. Each mix contains:
- Terminator Ready MIX 8 µl
- Primer Fw o Primer Rev (3,2pM/ul) 1 µl
- H2O sterile 8 µl
Kit ABI PRISM BigDye terminator v1.1 Cycle Sequencing Kits (Applied Biosystems)
provides both Terminator Ready MIX and Primers.
Terminator Ready MIX contains: 4 different BigDye Terminator (labeled ddNTPs), DNA
polymerase AmpliTaq, MgCl2, Tris-HCl Buffer (pH 9.0).
Employed enzyme is a variant of DNA polymerase Taq; indeed a point mutation is located in
the active site of the enzyme and determines a less effective discrimination towards ddNTPs.
Moreover the enzyme has another mutation in the amino terminus domain that apparently
eliminates the 5’�3’ exonuclease activity of AmpliTaq DNA polymerase.
Two 0.2 ml collection tubes were provided for each samples, one tube for Forward strand and
the other tube for Reverse strand. In each tube, 9 µl of MIX and 11 µl of diluted sample DNA
were applied.
DNA is diluted according to the intensity of bands during CloneWell or gel excision.
The more visible and therefore concentrated is the band, the less DNA is required; indeed,
high DNA concentrations interfere with sequencing process.

46
Collection tube with diluted DNA were finally placed in a thermal cycler, set up for the cycle-
sequencing.
The reaction conditions were as follows:
- Denaturation at 96°C for 1 minute
- Denaturation at 96°C per 10 seconds
- Annealing at 50°C for 5 seconds
- Extension at 60°C for 4 minutes
- Rapid thermal ramp to 4 °C and hold until ready to purify.
� Column purification
After Cycle Sequencing reaction, fast and easy removal of unincorporated dye terminators
and primer dimers is performed; therefore reaction products could be analyzed with a DNA
sequencer.
The DyeEx 2.0 Spin Kit (QIAGEN) was employed. Spin columns supplied by the kit use gel-
filtration technology.
To resuspend the resin, the columns were gently vortexed. The caps of the columns were
losen a quarter turn to avoid a vacuum inside the spin columns.
The bottom closures of the columns then were snapped off and each column was placed in a 2
ml collection tube (supplied by the kit). Followed a centrifugation step at 700 x g for 3
minutes.
Each spin column was carefully transferred to a 1.5 ml clean centrifuge tube and the
sequencing reaction was slowly applied directly onto the center of slanted gel bed surface.
Followed another centrifuge step at 700 x g for 3 minutes, and spin columns were removed
from the microcentrifuge tubes. The eluates contained the purified DNA, ready for the
sequencer.
� Sanger Sequencing
Sanger sequencing is the first automated method of DNA sequencing based on the selective
incorporation of chain-terminating ddNTPs by DNA polymerase during in vitro DNA
replication. The method produces a DNA “ladder” of fragments that differ in length by one
base and bear a specific ddNTP chain terminator, each of which emit light at different
wavelengths.
For 25 cycles

47
Starting from low quantities of DNA, the method can sequence DNA fragments 400-1,000 bp
long, sorting fragment by length and detecting the fluorescence signal.
Cycle Sequencing reaction products were loaded in the sequencer ABI PRISM 3130 Genetic
Analyzer (Applied Biosystems), by following these steps:
- 0.5 ml capless tubes were labeled with numbers assigned and 25 µl of TSR (template
suppression reagent) were added to each DNA sample. Tubes were vortexed and pulsed
down briefly.
- Samples were placed in the thermocycler at 95°C for 2 minutes to obtain DNA
denaturation, then were placed immediately on ice until their use.
TSR is used to prevent clogging of the capillary with DNA template during injection.
The sequencer employs a 16-capillary electrophoresis and is provided with a laser that allows
multiple colour detection of laser-induced fluorescence.
Samples were applied in capillaries filled with a polymer (POP7, Applied Biosystems) and
after an electrophoretic run they are separated according to their molecular weight.
Light emitted by labeled ddNTPs is collected and, according to wavelenght, separated by a
spectrophotometer. Obtained data were analyzed by “sequencing analysis” software, which
elaborates fluorescence signals collected by the sequencer and creates electropherograms.
6.7.2 ARMS-PCR
The amplification-refractory mutation system (ARMS) is a simple method for detecting any
mutation involving single base changes or small deletions. ARMS is based on the use of
sequence-specific PCR primers that allow amplification of test DNA only when the target
allele is contained within the sample. The method allows the identification of sequencing
refractory mutations, which are mutations “invisible” at Sanger sequencing analysis.
In our lab we performed tetra-primer ARMS-PCR for the detection of D661Y and Y640F
mutations, reported to be the more frequent mutations in T-LGLL.
Two PCR reaction tubes containing the same DNA sample were respectively added with
primers designed for the amplification of mutated DNA in one reaction tube and for the
amplification of non mutated DNA in the other reaction tube.
DNA dilution was requested before PCR in order to obtain the final DNA concentration of
100 ng/µl. Finally, different reaction mix were set up for each mutation of interest (Table 4),
and reaction conditions were optimized.
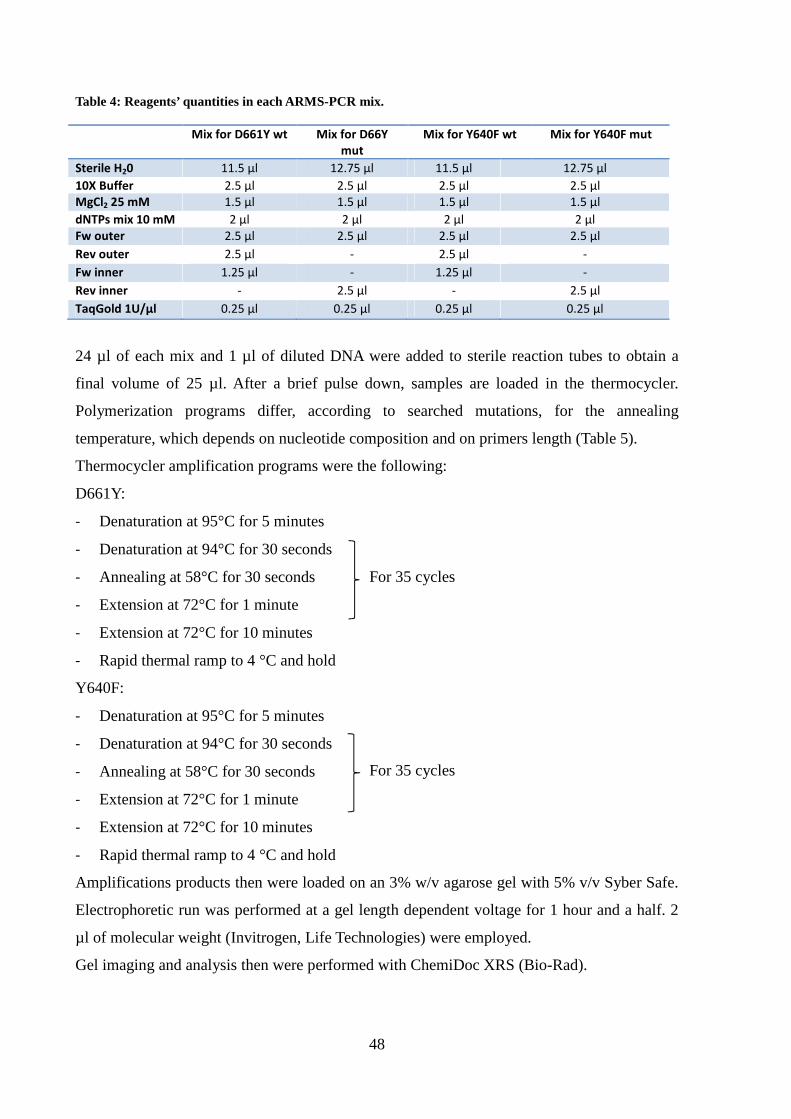
48
Table 4: Reagents’ quantities in each ARMS-PCR mix.
Mix for D661Y wt Mix for D66Y
mut
Mix for Y640F wt Mix for Y640F mut
Sterile H20 11.5 µl 12.75 µl 11.5 µl 12.75 µl
10X Buffer 2.5 µl 2.5 µl 2.5 µl 2.5 µl
MgCl2 25 mM 1.5 µl 1.5 µl 1.5 µl 1.5 µl
dNTPs mix 10 mM 2 µl 2 µl 2 µl 2 µl
Fw outer 2.5 µl 2.5 µl 2.5 µl 2.5 µl
Rev outer 2.5 µl - 2.5 µl -
Fw inner 1.25 µl - 1.25 µl -
Rev inner - 2.5 µl - 2.5 µl
TaqGold 1U/µl 0.25 µl 0.25 µl 0.25 µl 0.25 µl
24 µl of each mix and 1 µl of diluted DNA were added to sterile reaction tubes to obtain a
final volume of 25 µl. After a brief pulse down, samples are loaded in the thermocycler.
Polymerization programs differ, according to searched mutations, for the annealing
temperature, which depends on nucleotide composition and on primers length (Table 5).
Thermocycler amplification programs were the following:
D661Y:
- Denaturation at 95°C for 5 minutes
- Denaturation at 94°C for 30 seconds
- Annealing at 58°C for 30 seconds
- Extension at 72°C for 1 minute
- Extension at 72°C for 10 minutes
- Rapid thermal ramp to 4 °C and hold
Y640F:
- Denaturation at 95°C for 5 minutes
- Denaturation at 94°C for 30 seconds
- Annealing at 58°C for 30 seconds
- Extension at 72°C for 1 minute
- Extension at 72°C for 10 minutes
- Rapid thermal ramp to 4 °C and hold
Amplifications products then were loaded on an 3% w/v agarose gel with 5% v/v Syber Safe.
Electrophoretic run was performed at a gel length dependent voltage for 1 hour and a half. 2
µl of molecular weight (Invitrogen, Life Technologies) were employed.
Gel imaging and analysis then were performed with ChemiDoc XRS (Bio-Rad).
For 35 cycles
For 35 cycles

49
Table 5: Primers sequences for D661Y and Y640F mutations’ ARMS-PCR
Tetra-primer ARMS PCR uses in a single PCR reaction four primers, one pair of inner allele-
specific primers and one pair of outer standard primers.
While the forward and reverse outer standard primers bind the DNA template at 3’- and 5’-
terminal, the forward and reverse inner primers selectively bind the wild-type and the mutant
allele, respectively.
The specificity of inner primers is conferred by the identity of the terminal 3’ nucleotide with
either the wild-type or the mutant allele, and is increased by the introduction of a deliberate
mismatch at position -1 from the 3’-terminus.
Reverse inner primer can bind the template only when mutation occurs, while forward inner
primer binds only to wild type sequence; so, when the mutation occurs, a percentage of
forward outer primer in employed by PCR reaction with reverse inner primer, while when
template shows the wild type sequence, a percentage of inner outer primer is employed in
concert with forward inner primers. Tetra-primer PCR therefore produce not only amplicons
with outer primers, but also mutation-specific amplicons.
By positioning the two outer primers at different distances from the polymorphic nucleotide,
the PCR products differ in length (Table 6), allowing them to be discriminated by gel
electrophoresis.
Table 6: Primers combinations and amplicons length for D661Y and Y640F tetra-primer ARMS-PCR.
MUTATION SEQUENCE PRIMERS AMPLICON LENGHT
D661Y Wt/mut Fw outer D661Y + Rev outer D661Y 290bp
wt Fw inner D661Y + Rev outer D661Y 182bp
mut Rev inner D661Y + Fw outer D661Y 161bp
Y640F Wt/mut Fw outer Y640F + Rev outer Y640F 197bp
wt Fw inner Y640F + Rev outer Y640F 119bp
mut Rev inner Y640F + Fw outer Y640F 131bp
PRIMER SEQUENCE Primer D661Y Fw outer 5’-CCTAGCTGTAGGTTCCATGATCTTTCCT-3’ Primer D661Y Rev outer 5’-AAAATTAAATGCCAGGAACATGGAAAAT-3’ Primer D661Y Fw inner 5’-AAATCATCATGGGCTATAAGATCACGG-3’
Primer D661Y Rev inner 5’-GGAGACACCAGGATATTGGTAGCGTA-3’ Primer Y640F Fw outer 5’-AAAAAATGGGCAGTTTCTCTGAGATGACC-3’
Primer Y640F Rev outer 5’-CCAGTGGAGACACCAGGATATTGGTAGC-3’
Primer Y640F Fw inner 5’-ACCCAGATCCAGTCCGTGGAACCTTA-3’
Primer Y640F Rev inner 5’-ACATGTTGTTCAGCTGCTGCTTTGAGA-3’

50
7. PROTEIC ANALYSIS (WESTERN BLOT)
7.1 PREPARATION OF CELL LYSATES
For each sample aliquots of 250,000 and 500,000 LGLs or PBMCs from patients and CTLs
from controls were lysed in 50µl of the following buffer:
- 50mM Tris (hydroxymethyl) aminomethane hydrochloride (Tris-HCl) pH 6.8;
- 5mM Ethylenediaminetetraacetic acid (EDTA);
- 10% glycerol;
- 2% SDS (sodium dodecyl sulphate);
- 1% β-mercaptoethanol;
- Dye (Bromophenol blue or pyronin) (Sigma-Aldrich; Milan, IT).
Subsequently, the lysates were vortex, boiled at of 100°C for 5 minutes and then subjected to
SDS-PAGE (polyacrylamide gel electrophoresis).
7.2 POLYACRYLAMIDE GEL ELECTROPHORESIS IN SDS (SDS-PAGE)
The polyacrylamide gel electrophoresis in SDS is one of the methods used to separate a
mixture of proteins on the basis of their molecular weight.
SDS is a ionic detergent that binds tightly to proteins causing their denaturation; in the
presence of an excess of SDS, approximately 1.4 g of detergent will bind to each gram of
protein, providing a constant amount of negative charge per unit mass. Therefore, during
electrophoresis, all protein-SDS complexes move toward the anode, and thanks to the
molecular sieve properties of the gel, their mobility is inversely proportional to their
molecular weight. By the migration of standard proteins of known molecular weight
simultaneously to samples, it is possible to determine the protein sample weights.
SDS polyacrylamide gel was prepared following Laemmli method, for which the
electrophoretic plate consists of two types of gel:
- Stacking gel at pH 6.8, which concentrates the protein samples so that they are all aligned at
the start of electrophoresis;
- Running gel at pH 8.8, in which the real separation of proteins occurs.
The plate size of 10×8 cm was fixed in the Hoefer Mighty Small-If 250 Scientific Instruments
machine (Amersham Biosciences). The electrophoresis was run for about 2 hours at 25mA.

51
7.3 WESTERN BLOTTING
The western blotting (WB) or immunoblotting is an immunoassay able to detect traces of a
specific protein in a heterogeneous mixture, combining the high resolving power of gel
electrophoresis with the specificity of the antibodies. The WB is a technique with high
sensitivity, able to detect quantities of protein in the order of nanogram.
After SDS-PAGE, proteins were transferred onto a nitrocellulose membrane by the action of
an electric field, obtained by applying the appropriate current of 350 mA for 2 hours and 30
minutes. The buffer used for the transfer consisted of: 25 mM Tris, 192 mM glycine, 20%
methanol and 0.1% SDS with a final pH of 8.0 (Buffer A). After the transfer, the membrane
was left overnight in the saturation buffer consisting of 50mM Tris-HCl, pH 7.5, 150mM
NaCl and 5% bovine serum albumin (BSA) (BufferB), for nonspecific sites saturation. This
step was followed by incubation for 2 hours and 30 min at room temperature of the primary
antibodies (Abs), diluted in: 50mM Tris-HCl, pH 7.5, 150mM NaCl, 1% BSA (buffer C).
For our study we used the following Abs: rabbit monoclonal anti-P-STAT3 Tyr XP (Cell
Signaling; Beverly, Massachusetts); rabbit monoclonal anti-total STAT3 (Cell Signaling;
Beverly, Massachusetts); anti Mcl-1 (Cell Signaling Beverly, Massachusetts), rabbit
monoclonal anti-P-ERK (Cell Signaling; Beverly, Massachusetts), rabbit monoclonal anti-
total ERK (Cell Signaling; Beverly, Massachusetts), monoclonal mouse anti-SOCS3 Ab
(AbD Serotec Oxford, UK) and mouse monoclonal anti-β-actin (Sigma-Aldrich; Milan, Italy).
Three washes of 10 min, each at room temperature, were subsequently performed, using
buffer C supplemented with 0.1% Tween. Membranes were then incubated for 30 minutes
with a secondary anti-IgG Ab, obtained against the animal species immunized for the primary
Ab. The secondary Ab is conjugated with horseradish peroxidase (Amersham International
Biotechnology; Buckingamshire, UK) and diluted in buffer C.
After three additional washes, the membrane was subjected to the detection antibody with the
enhanced ChemiLuminescence system (ECL) (Pierce; Rockford, Illinois): the membrane is
incubated for 1 min with 1ml of luminol and 1 ml of H2O2, which in contact with the
peroxidase and, as a result, with the Ag-Ab complex, gives rise to an oxidation reaction with
light emission. The blots were acquired with ImageQuant LAS 500 imager (Amersham
Biosciences) and densitometry analysis was performed with the software ImageQuantTL
(Amersham Biosciences), provided with the instrument. Quantization on target protein/β-
actin, expressed as arbitrary units, were normalized on Jurkat cell line.

52
8. ELISA TEST
Enzyme-linked immunosorbent assay (ELISA) is a test that uses antibodies and color change
to quantify the protein concentration in organic liquids. We used Instant ELISA®
(eBioscience) for the analysis of IL-6, sIL-6Rα and CLL5 concentration in cells cultures
plasma and supernatant.
Samples were stored frozen at -20°C to avoid loss of bioactive human IL-6/sIL-6Rα/CCL5.
Before starting the number of microwell strips required to test were determined counting the
desired number of samples plus microwell strips for blanks and standards (coloured). As
suggested by test protocol, each sample, standard, blank and control sample should be assayed
in duplicate.
Protocol is reported in user manual attached to test kit. As general principles an anti-human
coating antibody is adsorbed onto microwells and the human antigen of interest present in the
sample or standard binds to antibodies adsorbed to the microwells. Then a biotin-conjugated
anti-antibody is added and binds to the human protein of interest captured by the first
antibody. As final step, streptavidin-HRP (Horseradish peroxidase) is added and binds to the
biotin conjugated anti-human antibody.
Unbound biotin conjugated anti-human IL-6/ sIL-6Rα/ CCL5 and Streptavidin-HRP is
removed during a wash step, and substrate solution reactive with HRP is added to the wells. A
coloured product is formed in proportion to the amount of soluble human protein present in
the sample. The reaction is terminated by addition of acid and absorbance is measured at 450
nm. A standard curve is prepared from 7 human IL-6/ sIL-6Rα/ CCL5 standard dilutions and
sample concentration determined.
9. APOPTOSIS ANALYSIS BY FLOW CYTOMETRY
Apoptosis was assessed by annexin V/Propidium Iodide (PI) staining (BD Pharmingen).
Annexin V/PI staining was performed on PBMCs or LGLs after culture in RPMI 0.5% FCS,
with or without the following agents: human recombinant IL-6, anti-IL6, anti-IL-6Rα
antibodies (R&D Systems, Minneapolis, MN) demethylating agent 5-aza-2’-deoxycytidine
(DAC) (Sigma Aldrich St. Louis, MO) and AG490 ( Calbiochem, Darmstadt, Germany). A
staining with anti-CD57-FITC was used to identify leukemic LGLs from PBMCs.

53
During the early stages of apoptosis the plasma membrane undergoes profound changes:
phosphatidylserine (PS), a negatively charged aminofosfolipide normally expressed only on
the inner side of the plasma membrane, is exposed on the outer surface. Annexin V is a
protein that, in presence of high concentrations of Ca2+, recognizes and binds selectively the
PS, and therefore is useful for the identification of apoptotic cells that expose the
phospholipid on their surface.
Aliquots of 2x10⁵ cells were harvested, washed, and incubated for 10 min in the dark at room
temperature with: 100µl of binding buffer, a Ca2+-rich solution that optimizes the binding of
Annexin V to the PS, 5µl of Annexin V-FITC, and 10µl of PI, provided by the kit (1µl/ml
final concentration).
After the incubation, 100µl of binding buffer were added and cells, at the final concentration
of 1×10⁶cells/ml, were analyzed by flow cytometer FACScan. For each sample 20,000 events
were acquired and the number of apoptotic cells was expressed as percentage of Annexin V
positive cells in the total cells analyzed.
10. CHEMOTAXIS ANALYSIS BY FLOW CYTOMETRY
Neoplastic LGL motility in presence/absence of MSC conditioned medium, was analyzed by
adding complete medium and MSC conditioned medium to a multiple well plate, step
followed by application of Transwell inserts (Corning, NY, USA) and by the addiction of
complete medium and 2x10⁶/ml cells to their inside compartment (Figure 14).
Employed medium volumes consider the transwell insert diameter and are suggested by
manufacturer’s instructions. After 24 hours of incubation at 37°C and 5% CO2, transwell
inserts were remowed from the multiple well plate, and media from the lower wells were
transferred into FACS tubes.
Software CellQuest Pro (BD Biosciences) was used for the analysis and for the set up of the
instrument. For chemotaxis analysis of collected media we set the acquisition time at 60
seconds. Each sample was read three times.
Known the suspension volume drawn by the cytometer and number of acquired events, total
number of migrated cells could be easily determined. This value in normalized on the number
of cells migrated in alone condition (well containing only complete medium and not MSC
conditioned stimulus) and Migration Index (MI) was obtained.
MI= number of cells migrated with stimulus/ number of cells migrated without stimulus

54
Figure 14: representative model of chemotaxis analysis.
11. STATISTICAL ANALYSIS
Data are expressed as mean plus or minus standard error (SE), and statistical analysis was
performed by Student’s t-test. A value of P less than .05 was accepted as significant.
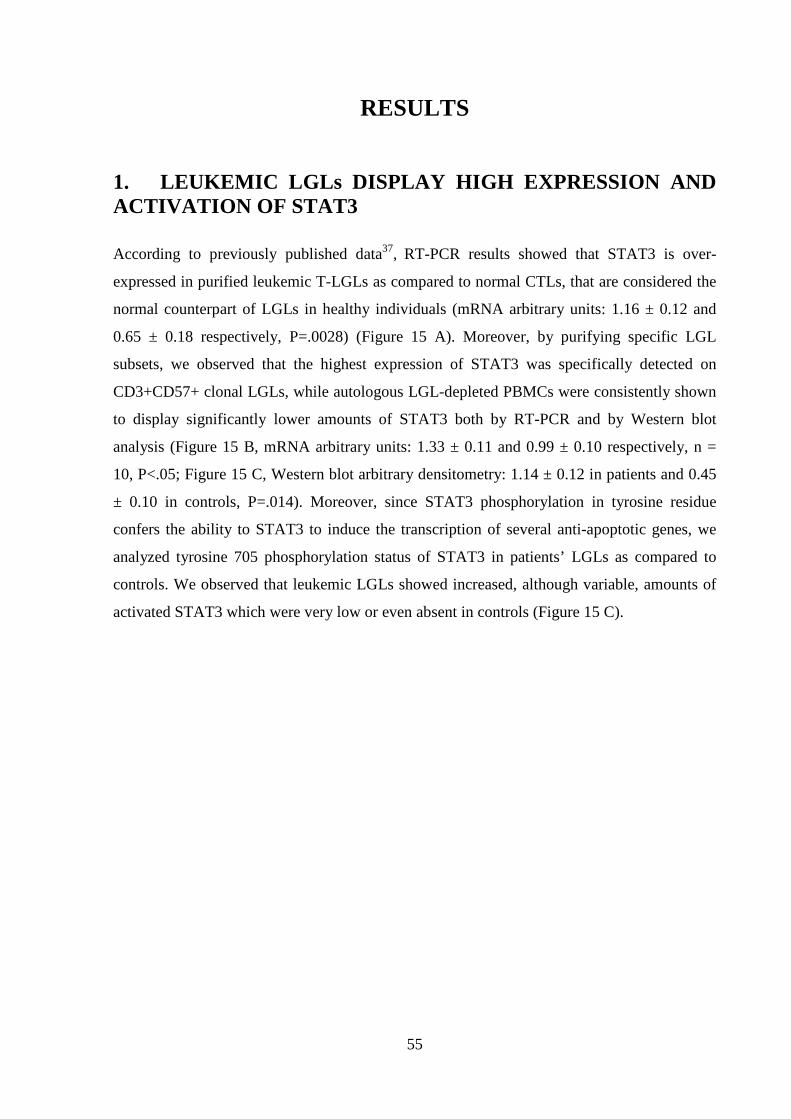
55
RESULTS
1. LEUKEMIC LGLs DISPLAY HIGH EXPRESSION AND ACTIVATION OF STAT3
According to previously published data37, RT-PCR results showed that STAT3 is over-
expressed in purified leukemic T-LGLs as compared to normal CTLs, that are considered the
normal counterpart of LGLs in healthy individuals (mRNA arbitrary units: 1.16 ± 0.12 and
0.65 ± 0.18 respectively, P=.0028) (Figure 15 A). Moreover, by purifying specific LGL
subsets, we observed that the highest expression of STAT3 was specifically detected on
CD3+CD57+ clonal LGLs, while autologous LGL-depleted PBMCs were consistently shown
to display significantly lower amounts of STAT3 both by RT-PCR and by Western blot
analysis (Figure 15 B, mRNA arbitrary units: 1.33 ± 0.11 and 0.99 ± 0.10 respectively, n =
10, P<.05; Figure 15 C, Western blot arbitrary densitometry: 1.14 ± 0.12 in patients and 0.45
± 0.10 in controls, P=.014). Moreover, since STAT3 phosphorylation in tyrosine residue
confers the ability to STAT3 to induce the transcription of several anti-apoptotic genes, we
analyzed tyrosine 705 phosphorylation status of STAT3 in patients’ LGLs as compared to
controls. We observed that leukemic LGLs showed increased, although variable, amounts of
activated STAT3 which were very low or even absent in controls (Figure 15 C).

56
Figure 15: (A) STAT3 mRNA expression levels in LGLs from patients and in CTLs from controls. Gene expression data are normalized to the expression levels of the housekeeping gene GAPDH. (B) STAT3 mRNA expression levels in LGLs from patients and in patients’ LGLs depleted PBMC population. Gene expression data are normalized to the expression levels of the housekeeping gene GAPDH. (C) Western blotting results of P-Y705 STAT3 and total STAT3 in PBMC from patients, PBMCs from controls, patients’ LGLs and PBMC depleted population. The housekeeping β-Actin was used as calibrator.
2. SOCS3 IS DOWN-EXPRESSED AND UNRESPONSIVE IN PATHOLOGIC LGLS
STAT3 phosphorylation in tyrosine residue confers the ability to STAT3 to induce the
transcription of several anti-apoptotic genes and of its specific suppressor, SOCS3.
Although STAT3 was highly expressed and activated, using RT-PCR we surprisingly
observed that SOCS3 mRNA median value was significantly lower, almost undetectable, in
patients’ LGLs as compared with controls’ CTLs (Figure 16 A, mRNA arbitrary units: 0.26 ±
0.04 and 0.63 ± 0.17 respectively, P=.003; Figure 16 B, Western blot: 0.59 ± 0.05 and 0.85 ±
0.10 respectively, P=.014).
C.
A. B.

57
Figure 17: (A) SOCS3 mRNA expression levels in patients’ LGLs and LGLs depleted PBMC population. Gene expression data are normalized to the expression levels of the housekeeping gene GAPDH; (B) patients’ LGLs and LGLs depleted PBMC population are analyzed by Western Blot. Proteins examined are SOCS3 and the housekeeping β-Actin. This latter is used as normalizator.
To evaluate whether, in patients, SOCS3 is responsive to STAT3 phosphorylation, we
stimulated in vitro both patients’ LGLs and controls’ CTLs with IL-6. This latter is
considered the main activator of STAT3/SOCS3 axis and its role in STAT3 up-regulation is
well known50.
By Western blot and RT-PCR analysis, we observed that, while STAT3 is physiologically
able to respond to the IL-6 trigger both in patients and controls, SOCS3 expression markedly
increased only in healthy individuals, whereas in patients’ LGLs it remained quantitatively
unchanged at near undetectable levels (Figure 18 A; mRNA arbitrary units: 1 hour alone
condition, 0.12 ± 0.04 in patients’ LGLs and 0.31 ± 0.08 in controls’ CTLs; 1 hour IL-6
stimulus, 0.16 ± 0.04 in patients’ LGLs and 1.40 ± 0.38 in controls’ CTLs; Figure 18 B,
Western blot: 0.59 ± 0.05 in patients and 0.85 ± 0.10 in controls, P=.014).
C.
A. B.

58
Figure 18: (A) SOCS3 mRNA expression levels in LGLs from patients and CTLs from controls at 1 hour, with or without IL-6 stimulus. Gene expression data are normalized to the expression levels of the housekeeping gene GAPDH; (B) after 1 hour IL-6 stimulus, LGLs from patients and CTLs from controls are analyzed by Western Blot. Proteins examined are SOCS3 and the housekeeping β-Actin. This latter is used as normalizator.
To determine whether SOCS3 gene mutation was present, the SOCS3 coding region was
sequenced and neither mutation nor alternative splicing of the SOCS3 gene were detected in
any of the 27 patients studied.
3. THE DEMETHYLATING AGENT 5-AZA-2’-DEOXYCYTIDINE (DAC) RESTORES IL-6 MEDIATED SOCS3 EXPRESSION IN LGLs FROM PATIENTS
In several tumors where JAK/STAT pathway is involved, SOCS3 was occasionally found
silenced through an epigenetic mechanism47,48,51,52. To evaluate whether an epigenetic
mechanism accounts for SOCS3 inhibition, leukemic LGLs were incubated with DAC, a
hypomethylating agent that hypomethylates DNA by inhibiting DNA methyltransferase.
Following 96 hours incubation with this agent, IL-6 treated LGLs showed an increase of
SOCS3 expression both at transcription and protein level (Figures 19 A-B), progressively
fading in the next hours (data not shown) since SOCS3 is short-living. On the contrary, LGLs
A.
B.

59
untreated with DAC maintained SOCS3 down-modulated independently from IL-6
stimulation.
Figure 19: Results obtained by LGL cultures treated for 96 hours with or without DAC and then stimulated with IL-6 for one hour. (A) SOCS3 expression level in LGLs obtained by RT-PCR and normalized on GAPDH. The results of four representative patients are reported. (B) Western blot analysis of LGL extracts for phosphorylated STAT3, total STAT3 and SOCS3, β-Actin served as a loading control. Two representative cases of patients are shown.
4. SOCS3 RESTORATION LEADS TO P-STAT3 AND Mcl-1 REDUCTION AND LGL APOPTOSIS
To investigate whether in leukemic LGLs JAK/STAT signaling was re-established as a
consequence of SOCS3 restoration, we tested the modulation of P-STAT3 and Mcl-1 after 1,
3 and 6 hours LGL culture.
- + - + - + - +
+ + + + + + + +
pt #1 pt #2 pt #4pt #3
0,00
0,50
1,00
1,50
2,00
2,50
3,00
3,50
4,00
alone DAC alone DAC alone DAC alone DAC
mR
NA
exp
ress
ion
leve
l A
rbitr
ary
units
IL-6 (1h):
DAC (96h):
SOCS3/GAPDH
v
4.00
3.50
3.00
2.50
2.00
1.50
1.00
0.50
0.00
- + - + - + - +
B.
A.
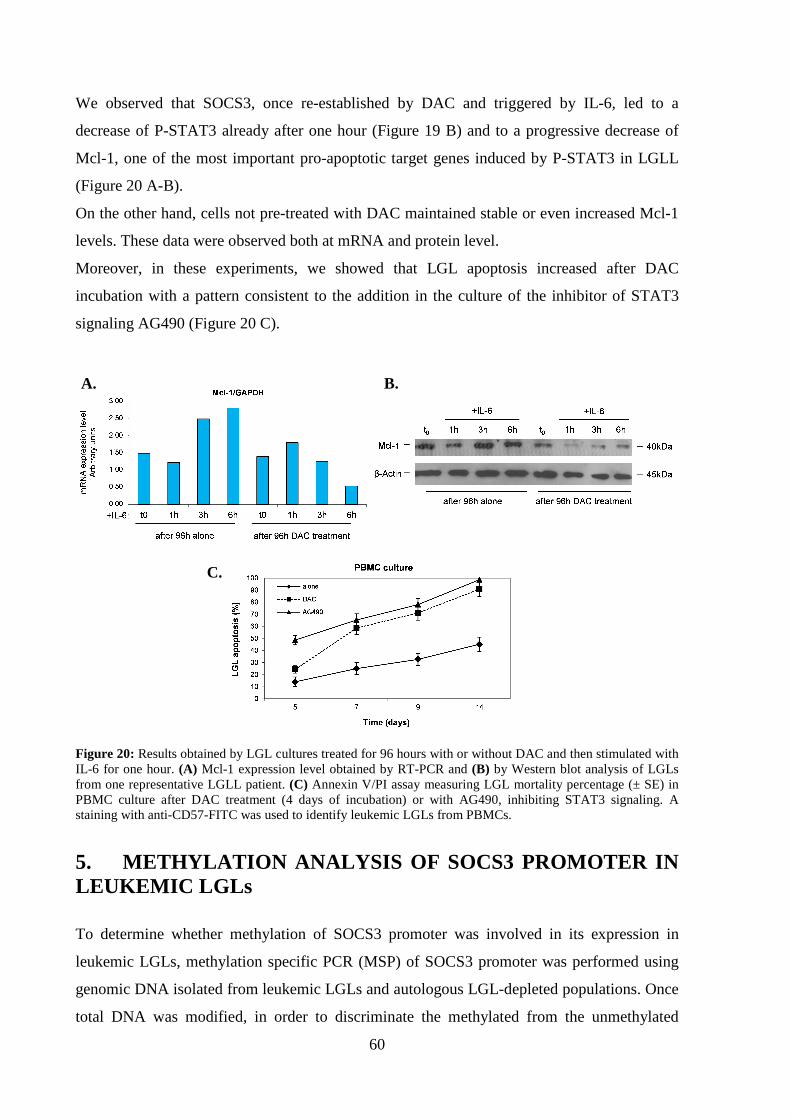
60
We observed that SOCS3, once re-established by DAC and triggered by IL-6, led to a
decrease of P-STAT3 already after one hour (Figure 19 B) and to a progressive decrease of
Mcl-1, one of the most important pro-apoptotic target genes induced by P-STAT3 in LGLL
(Figure 20 A-B).
On the other hand, cells not pre-treated with DAC maintained stable or even increased Mcl-1
levels. These data were observed both at mRNA and protein level.
Moreover, in these experiments, we showed that LGL apoptosis increased after DAC
incubation with a pattern consistent to the addition in the culture of the inhibitor of STAT3
signaling AG490 (Figure 20 C).
Figure 20: Results obtained by LGL cultures treated for 96 hours with or without DAC and then stimulated with IL-6 for one hour. (A) Mcl-1 expression level obtained by RT-PCR and (B) by Western blot analysis of LGLs from one representative LGLL patient. (C) Annexin V/PI assay measuring LGL mortality percentage (± SE) in PBMC culture after DAC treatment (4 days of incubation) or with AG490, inhibiting STAT3 signaling. A staining with anti-CD57-FITC was used to identify leukemic LGLs from PBMCs.
5. METHYLATION ANALYSIS OF SOCS3 PROMOTER IN LEUKEMIC LGLs
To determine whether methylation of SOCS3 promoter was involved in its expression in
leukemic LGLs, methylation specific PCR (MSP) of SOCS3 promoter was performed using
genomic DNA isolated from leukemic LGLs and autologous LGL-depleted populations. Once
total DNA was modified, in order to discriminate the methylated from the unmethylated
A. B.
C.

61
promoter sequence, a total of 20 samples from patients and additional 6 samples from healthy
individuals were analyzed using MSP of the SOCS3 promoter region, comprising nucleotides
-525 to -384.
PCR product from LGLs of patients under study identified only unmethylated sequences in all
cases studied. Consistent results were obtained also from the autologous LGL-depleted
PBMCs population and in control CTLs. Data on two representative patients are shown in
Figure 21 A.
These results were confirmed by sequencing assays on 10 patients and 5 controls (Figure 21
B). A total of 44 CpG sites located between nucleotides -678 and -216 of the SOCS3
promoter were tested by bisulfite sequencing. We found that methylation was not increased in
SOCS3 promoter CpG island of any LGLL patient with respect to controls.
Figure 21: (A) Methylation specific PCR of SOCS3 promoter in LGLs and the autologous LGL-depleted PBMCs of two representative patients. M: methylated band and U: unmethylated band. (B) Methylation of CpG
A.
B.

62
dinucleotides. The figure reports the methylation pattern in the promoter region of the SOCS3 gene for one representative control and two representative patients. The filled circles indicate methylated CpG dinucleotides, the empty circles unmethylated ones. The numbers indicate the CpG dinucleotide position before the start codon. The analysis of controls was performed in the sorted CTLs; instead in patients the analysis was performed on sorted LGLs. The methylation frequency, for each sequenced clone, was calculated as the number of methylated CpG dinucleotides over the total CpG dinucleotides present in the analyzed sequence. The difference of median methylation frequency methylation was similar in the patients with respect to the controls.
6. MONONUCLEAR CELLS OF PATIENTS PRODUCED IL-6 AND THE SOLUBLE FORM OF IL-6-R α
Literature data report high IL-6 level in acute and chronic inflammatory conditions, where it
activates cell survival and proliferation pathways53,54. With this as a background we studied
IL-6 expression levels in T-LGLL patients and we observed by Elisa Test high quantity of the
cytokine in patients’ plasma (Figure 22, 29.67 ± 8.91 pg/ml and 0.67 ± 1.37 pg/ml
respectively, P<.05).
Figure 22: Histograms of IL-6 level in plasma of patients and controls measured by ELISA test.
Furthermore, we observed that patients' cells expressed higher mRNA level of IL-6 as
compared to controls. This increased expression of IL-6 mRNA was restricted to the LGL-
depleted PBMC population (Figure 23 A, P<.01). Consistent results were obtained by ELISA
test, analyzing IL-6 levels in the supernatants of cell culture after 24 hours incubation in
RPMI 0.5% FCS medium.
Patients’ PBMCs depleted of LGLs released high levels of IL-6 as compared to autologous
purified leukemic LGLs and to control PBMCs (Figure 23 B, P<.01).
0
10
20
30
40
50
pg/m
l
IL-6 in plasma
P<.05
patients controls

63
Figure 23: (A) IL-6 mRNA expression and (B) secretion level in patients (LGLs and LGL-depleted PBMCs, n = 27) and in controls (CTLs and PBMC, n = 18).
Recently, it has been found that IL-6 acts not only through the “classical signaling” but also
by an alternative pathway called trans-signaling23. According to the classical signaling, IL-6
first binds to the membrane IL-6 receptor alpha (mIL-6Rα), then the complex associates with
the signal transducing membrane protein gp130. In the alternative signaling, IL-6 binds to the
soluble agonistic form of IL-6Rα (sIL-6Rα) and can activate also cells lacking mIL-6Rα.
Therefore, we analyzed IL-6Rα expression levels and by RT-PCR we found that IL-6Rα was
poorly expressed by LGLs of patients as compared to PBMCs (mRNA arbitrary units: 3.76 ±
1.44 vs 78.72 ± 28.33 respectively; P<.01) and to CTLs and PBMC from controls (mRNA
arbitrary units: 73.57 ± 10.61 and 70.86 ± 10.85, respectively; P<.01 for each comparison)
(Figure 24 A).
By Elisa test we showed that the loss of IL-6Rα by leukemic LGLs is balanced by a
significant higher level of sIL-6Rα in plasma of patients as compared with controls (Figure 24
B: 84.32 ± 6.38 ng/ml and 51.22 ± 16.65 ng/ml, respectively; P<.05), suggesting that IL-6
activation is mediated by a trans-signaling process.
0
10
20
30
40
50
60
LGLs PBMCs w/oLGLs
CTLs PBMCs
mR
NA
exp
ress
ion
leve
lA
rbitr
ary
units
IL-6/GAPDH
patients controls
P<.01 P<.01
0
50
100
150
200
250
300
350
LGLs PBMCs w/oLGLs
PBMCs
patients
controls PBMCs
pg/m
l
IL-6 in cell culture supernatant
P<.01 P<.01
B. A.

64
Figure 24: (A) Histograms of IL-6Rα mRNA expression level in patients (LGLs and PBMCs) and in controls (CTLs and PBMCs). (B) Histograms of IL-6Rα levels in plasma of patients and controls, measured by ELISA.
7. IL-6 EXPRESSION IS INVERSELY CORRELATED TO THE AMOUNT OF CIRCULATING LGLs IN T-LGLL PATIENTS
Due to the heterogeneity detected in the plasma levels of secreted IL-6, we tried to correlate
the amount of IL-6 to the percentage of circulating LGLs in PBMCs (LGL range in our cohort
of patients: 25%-95%).
Interestingly, we observed that lower IL-6 levels were detected in patients presenting higher
number of leukemic LGLs, on the contrary, patients with higher IL-6 levels associate to
patients characterized by low circulating LGLs (Figure 25).
The results indicate that IL-6 secretion was inversely correlated to LGL percentage. We
established at 55% the threshold of LGL percentage that better distinguishes patients
0
20
40
60
80
100
120
mR
NA
exp
ress
ion
leve
ls
arbi
trar
y un
its
IL-6Rα/GAPDH
LGLs PBMCs CTL PBMCpatients controls
P<.01
P<.01
0
10
20
30
40
50
60
70
80
90
100
ng/m
l
sIL-6Rα in plasma
patients controls
P<.05
A.
B.
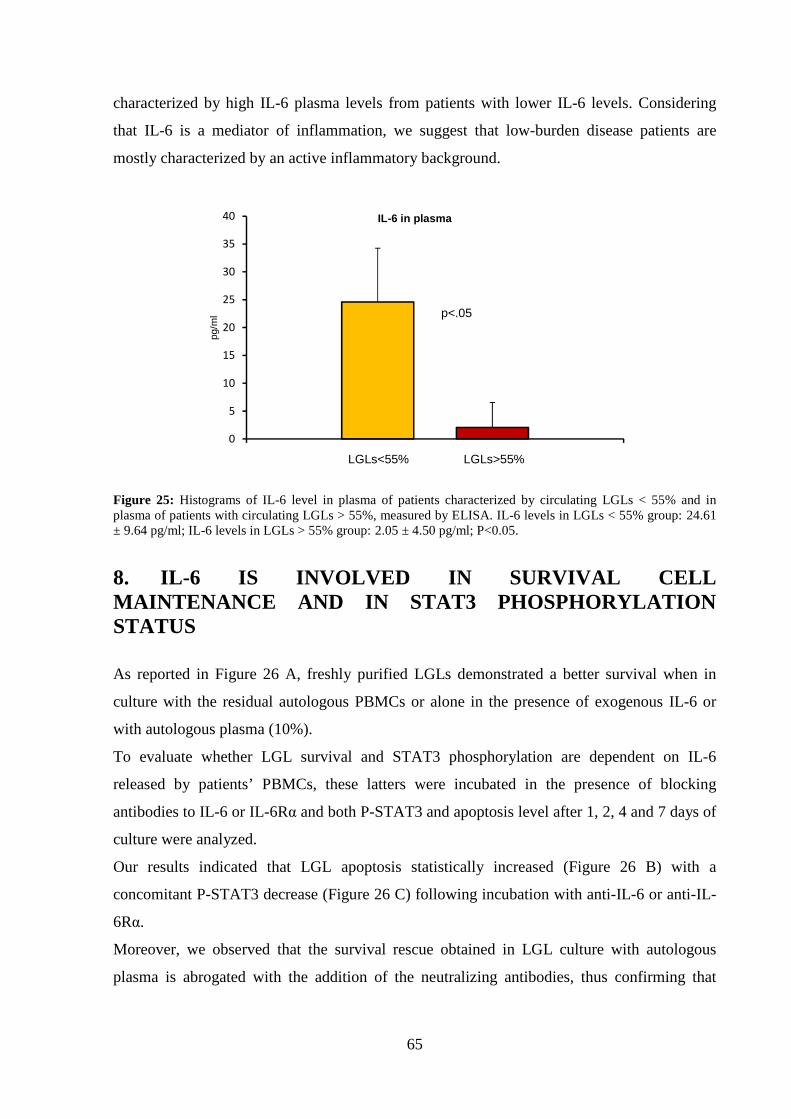
65
characterized by high IL-6 plasma levels from patients with lower IL-6 levels. Considering
that IL-6 is a mediator of inflammation, we suggest that low-burden disease patients are
mostly characterized by an active inflammatory background.
Figure 25: Histograms of IL-6 level in plasma of patients characterized by circulating LGLs < 55% and in plasma of patients with circulating LGLs > 55%, measured by ELISA. IL-6 levels in LGLs < 55% group: 24.61 ± 9.64 pg/ml; IL-6 levels in LGLs > 55% group: 2.05 ± 4.50 pg/ml; P<0.05.
8. IL-6 IS INVOLVED IN SURVIVAL CELL MAINTENANCE AND IN STAT3 PHOSPHORYLATION STATUS
As reported in Figure 26 A, freshly purified LGLs demonstrated a better survival when in
culture with the residual autologous PBMCs or alone in the presence of exogenous IL-6 or
with autologous plasma (10%).
To evaluate whether LGL survival and STAT3 phosphorylation are dependent on IL-6
released by patients’ PBMCs, these latters were incubated in the presence of blocking
antibodies to IL-6 or IL-6Rα and both P-STAT3 and apoptosis level after 1, 2, 4 and 7 days of
culture were analyzed.
Our results indicated that LGL apoptosis statistically increased (Figure 26 B) with a
concomitant P-STAT3 decrease (Figure 26 C) following incubation with anti-IL-6 or anti-IL-
6Rα.
Moreover, we observed that the survival rescue obtained in LGL culture with autologous
plasma is abrogated with the addition of the neutralizing antibodies, thus confirming that
0
5
10
15
20
25
30
35
40pg
/ml
IL-6 in plasma
p<.05
LGLs>55%LGLs<55%

66
autologous plasma IL-6 mediates LGL survival (Figure 26 D). These results suggest that IL-6
is necessary to maintain STAT3 activation thereby supporting leukemic LGL survival.
Figure 26: Apoptosis was measured after 1, 2, 4 and 7 days of culture in RPMI 0.5% FCS by Annexin V/PI. A staining with anti-CD57-FITC was used to identify leukemic LGLs from PBMCs. (A) Purified LGL apoptosis was analyzed in cells cultured alone or with autologous PBMCs or with IL-6 or with autologous plasma 10%. (B) LGL apoptosis time course and (C) WB analysis of P-STAT3 and STAT3 in PBMC at 4 hours of culture (two representative patients) with control IgG1, with anti-IL6 and anti- IL-6Rα Abs. β-Actin served as a loading control. (D) LGL apoptosis in culture alone and with autologous plasma in the presence of isotype control antibody and of anti-IL6 and anti-IL-6Rα Abs. The apoptosis histograms show the mean results (± SE) from 4 individual experiments.
9. IL-6 CAN BE PRODUCED BY MSCs AND MODULATE CCL5 EXPRESSION THROUGH STAT3 SIGNALING CASCADE
Through STAT3, IL-6 activates the transcription of some target genes, among which CCL532.
This cytokine, strongly expressed by PBMCs of T-LGLL patients31, is an important mediator
of acute and chronic inflammation. Since IL-6/STAT3 axis is constitutively activated in T-
LGLL patients and CCL5 is over-expressed, we investigated whether IL-6/STAT3 axis could
modulate CCL5 expression. By RT-PCR we found that IL-6 stimulation increased CCL5
A.
D. C.
B.

67
mRNA levels in T-LGLL patients, while in controls no significative increase has been
detected (Figure 27).
Figure 27: (A) CCL5 mRNA expression levels in patients’ LGLs and controls’ CTLs stimulated with IL-6 for one hour. Gene expression data are normalized to the expression levels of the housekeeping gene GAPDH.
Moreover, by transwell migration assay, we detected a high motility of LGLs in presence of
medium with CCL5, which in turn acts as a chemo-attractant in T-LGLL (Figure 28).
Figure 28: Chemotaxis analysis for the evaluation of neoplastic LGL motility in presence/absence of CCL5 stimulus for 24 hours.
Being bone marrow mesenchymal stem cells (BM-MSCs) reported to be a source of IL-6, and
considering that bone marrow has been frequently demonstrated to represent a privileged site
of LGLs infiltration20, we investigated the role of BM-MSCs in CCL5 upregulation,
compartmentalization and survival of leukemic LGLs through IL-6 release.
CD8br
CD57+
0
1
2
3
4
5
IL6 (1h)ctr.1
- +
ctr.2
- +
pt.1
- +
pt.2
- +
pt.3
- +
mR
NA
exp
ress
ion
leve
lA
rbitr
ary
units
0
1
2
3
4
5
6
7
8
alone
CCL5
MIG
RA
TIO
N I
ND
EX
Flo
w C
ytom
etry
Ass
ay
pt.1 pt.2 pt.3

68
By apoptosis analysis we found an increased survival of T-LGLs after incubation with MSCs’
medium, while treatment with IL-6 neutralizing antibodies decreased survival sustained by
MSC conditioned medium (Figure 29). This result confirms the hypothesis that MSCs
promote LGLs survival through IL-6 release.
Figure 29: Apoptosis assay by Annexin V/PI on CTLs from controls and LGLs from patients. Results were obtained by cell cultures treated for 5 days with MSC medium in the presence of isotypic control, and with MSC medium added with anti-IL6 and anti-IL-6Rα Abs (in the histogram indicated with the general word “aIL-6”).
By Transwell assay we evaluated the ability of neoplastic cells to migrate in presence of
neoplastic MSC conditioned medium. We expressed results as Migration Index (MI= number
of migrated cells in presence of MSC conditioned medium / number of migrated cells in
presence of medium alone).
Figure 30: Chemotaxis analysis for the evaluation of neoplastic LGL motility in presence/absence of MSC conditioned medium for 24 hours.
Cel
l sur
iviv
alpe
rcen
tage
(Ann
/PI)
0
10
20
30
40
50
60
70
80
90
CD
8br
alon
e
CD
8br
+ M
SC
BC 5d pt. 5d
CD
8br
+ M
SC
+ a
IL6
T a
lone
T +
MS
C
T+
MS
C +
aIL
6
0
5
10
15
20
25
30
35
40
medium alone
MSC medium
MIG
RA
TIO
N I
ND
EX
Flo
w C
ytom
etry
Ass
ay
pt. 1 pt. 2 pt. 3

69
We detected a high motility of LGLs in presence of MSC medium (Figure 30), therefore it
could be hypothesized that MSCs, triggering CCL5 expression in LGLs through IL-6 release,
could promote the recruitment of neoplastic cells in the bone marrow.
10. IL-6 AND IL-6Rα EXPRESSION IS RESPONSIVE TO IL-15 STIMULUS
Considering the role of IL-15 in LGLL pathogenesis we evaluated IL-15 effect on IL-6
signaling. By RT-PCR and Elisa Test we observed that IL-15 strongly induced IL-6
expression and secretion in patients’ PBMCs after 24 hours culture (Figure 31 A and B,
respectively).
Figure 31: (A) IL-6 mRNA expression levels in patients and controls’ PBMCs in culture after 24 hours alone (mRNA arbitrary units: 5.073 ± 4.56 in patients’ PBMC and 1.47 ± 0.61 in PBMC from controls) and after 24 hours with IL-15 (190.6 ± 127.56 in patients’ PBMC and 103.88 ± 21.01 in PBMC from controls. The increase of IL-6 expression after IL-15 stimulation is statistically significant (P<.01). Gene expression data are normalized to the expression levels of the housekeeping gene GAPDH. (B) Histograms of IL-6 level in cell culture supernatants of patients’ PBMC, measured by ELISA test (alone 24h condition: 20.91 ± 2.91 pg/ml; IL-15 24h condition: 184.65 ± 67.69 pg/ml, P<.05).
Moreover, by RT-PCR we observed that IL-15 can inhibit IL-6Rα expression in LGLs (Figure
32). Therefore this cytokine could account for the down-expression of IL-6Rα observed in
LGLs, ultimately promoting the trans-signaling process.
0,00
50,00
100,00
150,00
200,00
250,00
300,00
IL-6 in cell culture supernatants
P<.05
alone 24h IL-15 24h
300
250
200
150
100
50
0
pg/m
l
0
50
100
150
200
250
300
IL-6/GAPDH
P<.05
alone 24h IL-15 24h
mR
NA
exp
ress
ion
leve
lA
rbitr
ary
units
A. B.

70
Figure 32: Hystograms of IL-6Rα mRNA expression level in patients’ LGLs in culture after 24 hours alone (mRNA arbitrary units: 14.83 ± 5.8) and after 24 hours with IL-15 (2.91 ± 3.7). Gene expression data are normalized to the expression levels of the housekeeping gene GAPDH.
11. BOTH IL-6 AND IL-15 PROMOTE LGLs SURVIVAL
IL-6 is the main activator of STAT3 and IL-15 seems to promote IL-6 trans-signaling
pathway in T-LGLL. Therefore, next step was the analysis of IL-6 and IL-15 effects on
STAT3 activation in leukemic LGLs.
By Western Blot analysis we observed that both 1 hour IL-6 stimulus and 24 hours IL-15
stimulus strongly increased STAT3 phosphorylation levels (Figure 33 A-B), indicating that
STAT3 protein in LGLs is responsive to these cytokines.
These mechanisms therefore contribute to LGLs survival.
Figure 33: WB analysis of P-STAT3 and STAT3 in patients’ LGLs at (A) 1 hours stimulus with IL-6 and at (B) 24 hours stimulus with IL-15. β-Actin served as a loading control.
0
5
10
15
20
25
patients (LGLs)
mR
NA
exp
ress
ion
lev
els
arb
itra
ry u
nit
s
IL-6Rα/GAPDH
alone 24h
IL-15 24h
P<.05
A.
B.
71
12. PATIENTS WITH A HIGH PERCENTAGE OF CIRCULATING LGLS MAY SHOW MISSENSE MUTATION IN STAT3 SH2 DOMAIN
Recently, it has been discovered that mutational hot spots in the SH2 domain of STAT3 are
present in a percentage of patients with T-LGLL41,42. Y640F and D661Y are reported to be
the more frequent mutations (90% of cases) (Figure 35 A). Consistently, in our cohort of
patients, by Sanger sequencing and PCR ARMS we also found only these mutations. We
found 11 mutated out of 60 patients affected by T-LGLL (18%).
12.1 MUTATIONAL ANALYSIS BY SANGER SEQUENCING
Sixty T-LGLL patients were analyzed by Sanger Sequencing for their LGL and LGL-depleted
PBMC population and mutations were reported in 9 patients (15%): 6 patients showed Y640F
mutation and 3 patients showed D661Y mutation. Interestingly, when a patient is mutated, the
mutation is found only in LGLs and not in remaining PBMCs. Moreover, we observed that:
- not all LGLs are mutated at the same time, but STAT3 mutations can be found only in
a subpopulation of LGLs;
- in all the 17 healthy controls analyzed CTLs and PBMCs resulted unmutated in
STAT3;
- mutations were found only in patients with a high percentage of circulating LGLs.
Considering the arbitrary cut off point proposed for IL-6 expression levels, mutations
were found only inside the group of patients characterized by circulating LGLs >55%
and low IL-6 level.
12.2 MUTATIONAL ANALYSIS BY ARMS-PCR
In order to confirm the results obtained by Sanger Sequencing, we performed also ARMS-
PCR method, which allows the identification of sequencing refractory mutations, for the
detection of D661Y and Y640F mutations.
Out of 60 T-LGLL patients analyzed 11 resulted mutated (18%): 8 patients showed Y640F
mutation and 3 patients were characterized by D661Y mutation.
Among these 11 patients, 9 were already found mutated by Sanger Sequencing. ARMS-PCR
method therefore added 2 new mutated cases to our analysis.

72
12.3 PHENOTYPE OF LGL CLONE IN MUTATED PATIENTS
Immunophenotype analysis showed a high heterogeneity in the group of patients (table 6).
Among T-LGLL patients, the majority of cases displayed a double positive CD3/CD8
leukemic clone and a low percentage of cases displayed a double positive CD4/CD8 or were
CD4+/CD8- T clone.
In the majority of cases, the leukemic clone is characterized by the expression of CD57. Only
a subpopulation of LGLs expressed CD16, which can be coexpressed or not with CD57.
Inside leukemic T cell population some cases showed the expression restriction for one or
more (2-3) Vβ at the same time.
By observing the phenotype of mutated as compared to the unmutated patients, we showed
that STAT3 mutation not only identifies patients with >55% of PBMCs but is associated with
a specific phenotype:
- CD3/CD8 positivity
- CD57 positivity
- CD16 positivity
- CD56 negativity
Differently, patients with an LGL percentage >55% but negative for the mutation are
phenotypically characterized by the negativity for CD16 and the positivity for CD56.

73
Table 7: T-LGLL patients characterized by a percentage of circulating LGLs >55% on total PBMCs.
Patients’ immunophenotypes, Vβ and KIR restriction and the results of mutational analysis by Sanger Sequencing and ARMS-PCR, are reported.
# Pt. DISEASEAGE/SEX
% LGL IMMUNOPHENOTYPE Vβ / KIR MUTATION
1 T-LGLL M74 85% CD3/CD57/CD16 Vβ5.2 Y640F
2 T-LGLL M41 71% CD3/CD57/CD16 - Y640F
3 T-LGLL F62 55% CD3/CD57/CD16 Vβ2 D661Y
4 T-LGLL F73 62% CD3/CD57/16 Vβ7.1 Y640F
5 T-LGLL F76 73% CD3/CD57/CD16 Vβ21 Y640F
6 T-LGLL M52 89% CD3/CD57/CD16 KIR2D2/3 Y640F
7 T-LGLL M53 86% CD3/CD57/CD16 KIR2D2/3 Y640F
8 T-LGLL M54 72% CD3/CD57/CD16 - Y640F
9 T-LGLL F65 57% CD3/CD16 Vβ14 Y640F
10 T-LGLL F53 67% CD3/CD57/CD16 Vβ9KIR2D2/3
D661Y
11 T-LGLL F51 55% CD3/CD16/CD57 Vβ14 D661Y
12 T-LGLL F78 65% CD3/CD57/CD16 - -
13 T-LGLL M48 70% CD3/CD57/CD56 Vβ5.1 -
14 T-LGLL F73 65% CD3/CD57/CD56 - -
15 T-LGLL M85 78% CD3/CD57/CD56 Vβ13.6 -
16 T-LGLL M66 73% CD3/CD57/CD56 Vβ1 -
20 T-LGLL M40 95% CD3/γδ/CD56/CD16 KIR2D2/3 -
21 T-LGLL F73 66% CD3/CD57/CD56 Vβ2 -
22 T-LGLL F75 79% CD3/CD57/CD16 - -
23 T-LGLL M79 55% CD3/CD57 Vβ17KIR2D1
-

74

75
DISCUSSION
In this PhD project, we provide evidence that two different mechanisms account for the
constitutive STAT3 activation in patients with T-LGLL: 1) the high production of IL-6,
released by autologous LGL-depleted population of patients' PBMC, and in the bone marrow
MSCs, and 2) the down modulation of SOCS3, which is responsible for the lack of the
physiological negative feedback mechanism controlling STAT3 activation. Interestingly, we
demonstrated that in leukemic LGLs the constitutive activation of STAT3 may be down-
modulated by DAC, suggesting a putative role of demethylating agents in LGLL treatment
strategies. Moreover, we demonstrated that the subset of patients characterized by STAT3
mutations were specifically included within the high LGL burden patients' group, which
seems to be independent by cytokine stimulation.
The constitutive activation of JAK/STAT pathway has been claimed to be involved in the
development of several human cancers, including hematologic neoplasms (acute myeloid
leukemias, Sezary syndrome, multiple myeloma)40,55,56. In T-LGLL, Epling-Burnette et al
reported that LGLs from patients constitutively express high levels of activated STAT3 as
compared to PBMC of healthy individuals37. They also showed that STAT3 activation
contributes to Fas resistance resulting in abnormal survival of leukemic LGL and is also
responsible of the over-expression of the anti-apoptotic protein Mcl-137.
During this PhD, we confirmed that over-expression and activation of STAT3 in T-LGLL is a
common feature for all T-LGLL patients and demonstrated that patients’ PBMCs release high
amounts of IL-6 as compared to healthy individuals, suggesting that the activation of STAT3
may result from a persistent stimulation of this cytokine, which is central in inflammatory
processes and has been demonstrated to play a role in multiple myeloma and in other
neoplastic disorders where the JAK/STAT pathway is involved40,57,58.
Furthermore, we provided evidence that IL-6 is secreted through a paracrine mechanism,
since its production is not mediated by leukemic LGLs but by the residual normal autologous
LGL-depleted PBMCs, likely cells belonging to the monocyte/macrophage lineage. Also
MSCs seem to play a key role in the cytokine secretion in the bone marrow where patients’
LGLs show high frequency of infiltration20. Through the release of IL-6, our results indicate
that MSCs are able to stimulate CCL5 secretion by LGLs, triggering the chemotactic
environment of the bone marrow, since we demontrated the ability of CCL5 to induce the
migration of T LGLs.
76
Taken together, these data highlight the importance of tumor environment59 and point out that
additional cells, different from the malignant LGL clone, contribute to the disease
development and maintenance.
We also provided evidence that patients’ PBMCs release in vivo high amount of soluble IL-
6Rα allowing LGLs, that not express membrane-bound IL-6Rα but only gp130, to be
responsive to IL-6 through the trans-signaling process60. This mechanism has been
demonstrated in many chronic inflammatory diseases, including chronic inflammatory bowel
disease, peritonitis, rheumatoid arthritis, asthma, as well as colon cancer, where IL-6 trans-
signaling is critically involved in the maintenance of a disease state, by promoting transition
from acute to chronic inflammation60-62. Our results also indicate that IL-15, a well described
cytokine crucial in LGLL pathogenesis, can sustain IL-6 trans-signaling, then contributing to
maintain the inflammatory background of the disease.
Both IL-6 and IL-15 stimuli strongly enhance the phosphorylation of STAT3, confirming
their central role in maintaining LGL survival in LGLL, demonstrated also by the relevant
inhibition of STAT3 phosphorylation in the presence of antibodies against IL-6 or IL-6Rα.
Interestingly, even if STAT3 is constitutively expressed and activated in T-LGLL, we found a
very low expression of its specific inhibitor, SOCS3, in patients’ LGLs as compared to the
CTLs of controls. Consistently, the feedback loop sustained by this protein which is crucial in
controlling the level of STAT3 activation, can be inhibited in some tumors characterized by
P-STAT3 over-expression47,48,52.
Comparison between pathological LGLs and the remaining autologous PBMCs indicate that
the signaling pattern defined by high P-STAT3 and low SOCS3 expression was a discrete
characteristic of leukemic LGLs. This mechanism in the pathophysiology of T-LGLL lacks a
clear explanation yet. In fact, sequencing the entire coding region of 27 patients, we ruled out
the presence of SOCS3 gene mutations, and also showed that the promoter was not
inactivated via CpG island methylation, as demonstrated in other neoplastic clinical
conditions47,48,52.
Even if SOCS3 promoter in T-LGLL patients showed no methylation, by treating leukemic
LGLs with the demethylating agent DAC, SOCS3 expression was restored, with reappearance
of P-STAT3 suppression and inhibition of downstream signals, in particular Mcl-1
expression63. Although the fine mechanisms tuning out SOCS3 expression has not up to now
clarified, for the first time our results demonstrated a link between constitutive STAT3
activation, ultimately resulting in LGL survival, and epigenetic regulatory mechanisms. More
interestingly, our data provided evidence of the reversibility of epigenetic inhibition using

77
hypomethylating agents, thus opening the possibility that an epigenetic approach to re-express
SOCS3 may be exploited for the treatment of T-LGLL64.
Recently, recurrent somatic missense mutations (more often Y640F and D661Y) in the SH2
domain of STAT3 have been reported in nearly one third of patients affected by LGL
disorders41. It has been hypothesized that STAT3 mutations can enhance its constitutive
activation by an increased stabilization of STAT3 homodimers or heterodimers through
enhanced hydrophobic attraction between STAT monomers. However, this putative role of
STAT3 mutations is still controversial. As a matter of fact, whereas STAT3 activation is a
constitutive mechanism in all T-LGLL patients37,41, STAT3 mutations are reported only in a
fraction of cases, despite that the presence of monoclonal rearrangement of TCR was shown
in all patients41,42.
In our series of patients we found 11 cases with STAT3 mutations (6 with Y640F and 2 with
D661Y, 18%) out of 60 monoclonal patients analyzed. Interestingly, we demonstrated that the
group of patients accounting for STAT3 mutations in T-LGLL is characterized by cases with
high percentage of circulating LGLs (more than 55% LGLs)41,42, and it is worth of notice that
previously published results about STAT3 mutations considered only patients with very high
LGL clonal expansions. To compare our results with literature data by taking into account
only patients with clonal and >55% LGLs, we found an incidence of mutations (11 out 29
cases, 38%) more consistent with literature data.
The finding that mutated patients affected by T-LGLL show a particular and distinctive
phenotype of LGL clone (CD8+/CD57+/CD16+) further suggests that patients bearing
STAT3 mutations might be distinguished as a different subgroup of patients.
Another interesting feature of STAT3 mutated patients was that they were characterized by a
very low level of IL-6 in their plasma. These results suggest that an initial step along the
development of disease still characterized by low lymphocytosis (LGLs <55% of total
PBMCs), is mostly sustained by extrinsic factors contributing to the relevant inflammatory
background. A subsequent step can be recognized by a high lymphocytosis (LGLs >55% of
total PBMCs) in which LGL disease likely goes on independently from exogenous stimuli,
becoming self-maintaining due to the contribution of the emerging STAT3 mutations. It is
suggested that these phases can represent two sequential steps in the progression of disease.
Taking together, these results indicate that genomic mutations might only marginally account
for in vivo activation of STAT3 in LGLL patients and further emphasize the heterogeneity of
mechanisms sustaining LGLL. Among these the tumor environment play a key role, being

78
responsible for the activation of LGLs by antigene presentation, and for progression of the
disease by the secretion of important mediators of inflammation.

79
BIBLIOGRAPHY
1. Dearden C. Large granular lymphocytic leukaemia pathogenesis and management. Br
J Haematol;152(3):273-283.
2. Lamy T, Loughran TP, Jr. Current concepts: large granular lymphocyte leukemia.
Blood Rev 1999;13(4):230-240.
3. Sokol L, Loughran TP, Jr. Large granular lymphocyte leukemia. Curr Hematol Malig
Rep 2007;2(4):278-282.
4. Loughran TP, Jr. Clonal diseases of large granular lymphocytes. Blood 1993;82(1):1-
14.
5. Baesso I, Pavan L, Boscaro E, Miorin M, Facco M, Trentin L, Agostini C, Zambello
R, Semenzato G. T-cell type lymphoproliferative disease of granular lymphocytes
(LDGL) is equipped with a phenotypic pattern typical of effector cytotoxic cells. Leuk
Res 2007;31(3):371-377.
6. Wlodarski MW, Nearman Z, Jankowska A, Babel N, Powers J, Leahy P, Volk HD,
Maciejewski JP. Phenotypic differences between healthy effector CTL and leukemic
LGL cells support the notion of antigen-triggered clonal transformation in T-LGL
leukemia. J Leukoc Biol 2008;83(3):589-601.
7. Rose MG, Berliner N. T-cell large granular lymphocyte leukemia and related
disorders. Oncologist 2004;9(3):247-258.
8. Liu CC, Young LH, Young JD. Lymphocyte-mediated cytolysis and disease. N Engl J
Med 1996;335(22):1651-1659.
9. Shah MV, Zhang R, Loughran TP, Jr. Never say die: survival signaling in large
granular lymphocyte leukemia. Clin Lymphoma Myeloma 2009;9 Suppl 3:S244-253.

80
10. Zambello R, Semenzato G. Large granular lymphocyte disorders: new
etiopathogenetic clues as a rationale for innovative therapeutic approaches.
Haematologica 2009;94(10):1341-1345.
11. Harris NL, Jaffe ES, Diebold J, Flandrin G, Muller-Hermelink HK, Vardiman J, Lister
TA, Bloomfield CD. World Health Organization classification of neoplastic diseases
of the hematopoietic and lymphoid tissues: report of the Clinical Advisory Committee
meeting-Airlie House, Virginia, November 1997. J Clin Oncol 1999;17(12):3835-
3849.
12. Zhang D, Loughran TP, Jr. Large granular lymphocytic leukemia: molecular
pathogenesis, clinical manifestations, and treatment. Hematology Am Soc Hematol
Educ Program;2012:652-659.
13. Lamy T, Loughran TP, Jr. How I treat LGL leukemia. Blood;117(10):2764-2774.
14. Alekshun TJ, Sokol L. Diseases of large granular lymphocytes. Cancer Control
2007;14(2):141-150.
15. Loughran TP, Jr., Kidd PG, Starkebaum G. Treatment of large granular lymphocyte
leukemia with oral low-dose methotrexate. Blood 1994;84(7):2164-2170.
16. Sokol L, Agrawal D, Loughran TP, Jr. Characterization of HTLV envelope
seroreactivity in large granular lymphocyte leukemia. Leuk Res 2005;29(4):381-387.
17. O'Malley DP. T-cell large granular leukemia and related proliferations. Am J Clin
Pathol 2007;127(6):850-859.
18. Edelman MJ, O'Donnell RT, Meadows I. Treatment of refractory large granular
lymphocytic leukemia with 2-chlorodeoxyadenosine. Am J Hematol 1997;54(4):329-
331.
81
19. Witzig TE, Weitz JJ, Lundberg JH, Tefferi A. Treatment of refractory T-cell chronic
lymphocytic leukemia with purine nucleoside analogues. Leuk Lymphoma 1994;14(1-
2):137-139.
20. Zambello R, Berno T, Cannas G, Baesso I, Binotto G, Bonoldi E, Bevilacqua P,
Miorin M, Facco M, Trentin L, Agostini C, Semenzato G. Phenotypic and functional
analyses of dendritic cells in patients with lymphoproliferative disease of granular
lymphocytes (LDGL). Blood 2005;106(12):3926-3931.
21. Hirano T. Interleukin 6 and its receptor: ten years later. Int Rev Immunol 1998;16(3-
4):249-284.
22. Heinrich PC, Behrmann I, Muller-Newen G, Schaper F, Graeve L. Interleukin-6-type
cytokine signalling through the gp130/Jak/STAT pathway. Biochem J 1998;334 ( Pt
2):297-314.
23. Mihara M, Hashizume M, Yoshida H, Suzuki M, Shiina M. IL-6/IL-6 receptor system
and its role in physiological and pathological conditions. Clin Sci (Lond);122(4):143-
159.
24. Scheller J, Chalaris A, Schmidt-Arras D, Rose-John S. The pro- and anti-
inflammatory properties of the cytokine interleukin-6. Biochim Biophys
Acta;1813(5):878-888.
25. Rose-John S, Mitsuyama K, Matsumoto S, Thaiss WM, Scheller J. Interleukin-6 trans-
signaling and colonic cancer associated with inflammatory bowel disease. Curr Pharm
Des 2009;15(18):2095-2103.
26. Perera PY, Lichy JH, Waldmann TA, Perera LP. The role of interleukin-15 in
inflammation and immune responses to infection: implications for its therapeutic use.
Microbes Infect;14(3):247-261.
27. Zambello R, Facco M, Trentin L, Sancetta R, Tassinari C, Perin A, Milani A, Pizzolo
G, Rodeghiero F, Agostini C, Meazza R, Ferrini S, Semenzato G. Interleukin-15

82
triggers the proliferation and cytotoxicity of granular lymphocytes in patients with
lymphoproliferative disease of granular lymphocytes. Blood 1997;89(1):201-211.
28. Stonier SW, Schluns KS. Trans-presentation: a novel mechanism regulating IL-15
delivery and responses. Immunol Lett;127(2):85-92.
29. Castillo EF, Schluns KS. Regulating the immune system via IL-15 transpresentation.
Cytokine;59(3):479-490.
30. Mori N, Krensky AM, Ohshima K, Tomita M, Matsuda T, Ohta T, Yamada Y,
Tomonaga M, Ikeda S, Yamamoto N. Elevated expression of CCL5/RANTES in adult
T-cell leukemia cells: possible transactivation of the CCL5 gene by human T-cell
leukemia virus type I tax. Int J Cancer 2004;111(4):548-557.
31. Kothapalli R, Nyland SB, Kusmartseva I, Bailey RD, McKeown TM, Loughran TP,
Jr. Constitutive production of proinflammatory cytokines RANTES, MIP-1beta and
IL-18 characterizes LGL leukemia. Int J Oncol 2005;26(2):529-535.
32. Yang J, Liao X, Agarwal MK, Barnes L, Auron PE, Stark GR. Unphosphorylated
STAT3 accumulates in response to IL-6 and activates transcription by binding to
NFkappaB. Genes Dev 2007;21(11):1396-1408.
33. Lamy T, Liu JH, Landowski TH, Dalton WS, Loughran TP, Jr. Dysregulation of
CD95/CD95 ligand-apoptotic pathway in CD3(+) large granular lymphocyte
leukemia. Blood 1998;92(12):4771-4777.
34. Zhang R, Shah MV, Yang J, Nyland SB, Liu X, Yun JK, Albert R, Loughran TP, Jr.
Network model of survival signaling in large granular lymphocyte leukemia. Proc Natl
Acad Sci U S A 2008;105(42):16308-16313.
35. O'Shea JJ, Gadina M, Schreiber RD. Cytokine signaling in 2002: new surprises in the
Jak/Stat pathway. Cell 2002;109 Suppl:S121-131.

83
36. Schade AE, Wlodarski MW, Maciejewski JP. Pathophysiology defined by altered
signal transduction pathways: the role of JAK-STAT and PI3K signaling in leukemic
large granular lymphocytes. Cell Cycle 2006;5(22):2571-2574.
37. Epling-Burnette PK, Liu JH, Catlett-Falcone R, Turkson J, Oshiro M, Kothapalli R, Li
Y, Wang JM, Yang-Yen HF, Karras J, Jove R, Loughran TP, Jr. Inhibition of STAT3
signaling leads to apoptosis of leukemic large granular lymphocytes and decreased
Mcl-1 expression. J Clin Invest 2001;107(3):351-362.
38. Levy DE, Inghirami G. STAT3: a multifaceted oncogene. Proc Natl Acad Sci U S A
2006;103(27):10151-10152.
39. Greenlund AC, Farrar MA, Viviano BL, Schreiber RD. Ligand-induced IFN gamma
receptor tyrosine phosphorylation couples the receptor to its signal transduction
system (p91). EMBO J 1994;13(7):1591-1600.
40. Schuringa JJ, Wierenga AT, Kruijer W, Vellenga E. Constitutive Stat3, Tyr705, and
Ser727 phosphorylation in acute myeloid leukemia cells caused by the autocrine
secretion of interleukin-6. Blood 2000;95(12):3765-3770.
41. Koskela HL, Eldfors S, Ellonen P, van Adrichem AJ, Kuusanmaki H, Andersson EI,
Lagstrom S, Clemente MJ, Olson T, Jalkanen SE, Majumder MM, Almusa H, Edgren
H, Lepisto M, Mattila P, Guinta K, Koistinen P, Kuittinen T, Penttinen K, Parsons A,
Knowles J, Saarela J, Wennerberg K, Kallioniemi O, Porkka K, Loughran TP, Jr.,
Heckman CA, Maciejewski JP, Mustjoki S. Somatic STAT3 mutations in large
granular lymphocytic leukemia. N Engl J Med;366(20):1905-1913.
42. Jerez A, Clemente MJ, Makishima H, Koskela H, Leblanc F, Peng Ng K, Olson T,
Przychodzen B, Afable M, Gomez-Segui I, Guinta K, Durkin L, Hsi ED, McGraw K,
Zhang D, Wlodarski MW, Porkka K, Sekeres MA, List A, Mustjoki S, Loughran TP,
Maciejewski JP. STAT3 mutations unify the pathogenesis of chronic
lymphoproliferative disorders of NK cells and T-cell large granular lymphocyte
leukemia. Blood;120(15):3048-3057.
84
43. Semenzato G, Zambello R, Starkebaum G, Oshimi K, Loughran TP, Jr. The
lymphoproliferative disease of granular lymphocytes: updated criteria for diagnosis.
Blood 1997;89(1):256-260.
44. Zambello R, Trentin L, Facco M, Cerutti A, Sancetta R, Milani A, Raimondi R,
Tassinari C, Agostini C, Semenzato G. Analysis of the T cell receptor in the
lymphoproliferative disease of granular lymphocytes: superantigen activation of clonal
CD3+ granular lymphocytes. Cancer Res 1995;55(24):6140-6145.
45. Haider AS, Peters SB, Kaporis H, Cardinale I, Fei J, Ott J, Blumenberg M, Bowcock
AM, Krueger JG, Carucci JA. Genomic analysis defines a cancer-specific gene
expression signature for human squamous cell carcinoma and distinguishes malignant
hyperproliferation from benign hyperplasia. J Invest Dermatol 2006;126(4):869-881.
46. Herman JG, Graff JR, Myohanen S, Nelkin BD, Baylin SB. Methylation-specific
PCR: a novel PCR assay for methylation status of CpG islands. Proc Natl Acad Sci U
S A 1996;93(18):9821-9826.
47. Niwa Y, Kanda H, Shikauchi Y, Saiura A, Matsubara K, Kitagawa T, Yamamoto J,
Kubo T, Yoshikawa H. Methylation silencing of SOCS-3 promotes cell growth and
migration by enhancing JAK/STAT and FAK signalings in human hepatocellular
carcinoma. Oncogene 2005;24(42):6406-6417.
48. Isomoto H, Mott JL, Kobayashi S, Werneburg NW, Bronk SF, Haan S, Gores GJ.
Sustained IL-6/STAT-3 signaling in cholangiocarcinoma cells due to SOCS-3
epigenetic silencing. Gastroenterology 2007;132(1):384-396.
49. Cho-Vega JH, Rassidakis GZ, Amin HM, Tsioli P, Spurgers K, Remache YK, Vega F,
Goy AH, Gilles F, Medeiros LJ. Suppressor of cytokine signaling 3 expression in
anaplastic large cell lymphoma. Leukemia 2004;18(11):1872-1878.
50. Rawlings JS, Rosler KM, Harrison DA. The JAK/STAT signaling pathway. J Cell Sci
2004;117(Pt 8):1281-1283.

85
51. Weber A, Hengge UR, Bardenheuer W, Tischoff I, Sommerer F, Markwarth A, Dietz
A, Wittekind C, Tannapfel A. SOCS-3 is frequently methylated in head and neck
squamous cell carcinoma and its precursor lesions and causes growth inhibition.
Oncogene 2005;24(44):6699-6708.
52. He B, You L, Uematsu K, Zang K, Xu Z, Lee AY, Costello JF, McCormick F, Jablons
DM. SOCS-3 is frequently silenced by hypermethylation and suppresses cell growth
in human lung cancer. Proc Natl Acad Sci U S A 2003;100(24):14133-14138.
53. Scheller J, Ohnesorge N, Rose-John S. Interleukin-6 trans-signalling in chronic
inflammation and cancer. Scand J Immunol 2006;63(5):321-329.
54. Naugler WE, Karin M. The wolf in sheep's clothing: the role of interleukin-6 in
immunity, inflammation and cancer. Trends Mol Med 2008;14(3):109-119.
55. Lin TS, Mahajan S, Frank DA. STAT signaling in the pathogenesis and treatment of
leukemias. Oncogene 2000;19(21):2496-2504.
56. Eriksen KW, Kaltoft K, Mikkelsen G, Nielsen M, Zhang Q, Geisler C, Nissen MH,
Ropke C, Wasik MA, Odum N. Constitutive STAT3-activation in Sezary syndrome:
tyrphostin AG490 inhibits STAT3-activation, interleukin-2 receptor expression and
growth of leukemic Sezary cells. Leukemia 2001;15(5):787-793.
57. Isomoto H, Kobayashi S, Werneburg NW, Bronk SF, Guicciardi ME, Frank DA,
Gores GJ. Interleukin 6 upregulates myeloid cell leukemia-1 expression through a
STAT3 pathway in cholangiocarcinoma cells. Hepatology 2005;42(6):1329-1338.
58. To KF, Chan MW, Leung WK, Ng EK, Yu J, Bai AH, Lo AW, Chu SH, Tong JH, Lo
KW, Sung JJ, Chan FK. Constitutional activation of IL-6-mediated JAK/STAT
pathway through hypermethylation of SOCS-1 in human gastric cancer cell line. Br J
Cancer 2004;91(7):1335-1341.

86
59. Shvidel L, Duksin C, Tzimanis A, Shtalrid M, Klepfish A, Sigler E, Haran M, Eilat E,
Berrebi A. Cytokine release by activated T-cells in large granular lymphocytic
leukemia associated with autoimmune disorders. Hematol J 2002;3(1):32-37.
60. Rose-John S. Interleukin-6 biology is coordinated by membrane bound and soluble
receptors. Acta Biochim Pol 2003;50(3):603-611.
61. Rabe B, Chalaris A, May U, Waetzig GH, Seegert D, Williams AS, Jones SA, Rose-
John S, Scheller J. Transgenic blockade of interleukin 6 transsignaling abrogates
inflammation. Blood 2008;111(3):1021-1028.
62. Yamamoto K, Rose-John S. Therapeutic blockade of interleukin-6 in chronic
inflammatory disease. Clin Pharmacol Ther;91(4):574-576.
63. Shah MV, Zhang R, Irby R, Kothapalli R, Liu X, Arrington T, Frank B, Lee NH,
Loughran TP, Jr. Molecular profiling of LGL leukemia reveals role of sphingolipid
signaling in survival of cytotoxic lymphocytes. Blood 2008;112(3):770-781.
64. Teramo A, Gattazzo C, Passeri F, Lico A, Tasca G, Cabrelle A, Martini V, Frezzato F,
Trimarco V, Ave E, Boscaro E, Piazza F, Facco M, Trentin L, Semenzato G, Zambello
R. Intrinsic and extrinsic mechanisms contribute to maintain the JAK/STAT pathway
aberrantly activated in T-type large granular lymphocyte leukemia.
Blood;121(19):3843-3854, S3841.

87
PUBLICATIONS
1. Teramo A, Gattazzo C, Passeri F, Lico A, Tasca G, Cabrelle A, Martini V, Frezzato F,
Trimarco V, Ave E, Boscaro E, Piazza F, Facco M, Trentin L, Semenzato G, Zambello
R. Intrinsic and extrinsic mechanisms contribute to maintain the JAK/STAT pathway
aberrantly activated in T-type large granular lymphocyte leukemia.
Blood;121(19):3843-3854, S3841.