
UNIVERSITA’ DEGLI STUDI...
91
UNIVERSITA’ DEGLI STUDI DELL’INSUBRIA Facoltà di Scienze MM.FF.NN. - Como Tesi di Dottorato di Ricerca in Scienze Ambientali XXIV ciclo FINE-ROOT DYNAMICS, ANATOMY AND CARBON-NITROGEN CONCENTRATIONS IN RELATION TO FOREST MANAGEMENT AND SOIL WATER CONTENT. CASE STUDIES IN BEECH (Fagus sylvatica L.) AND TURKEY-OAK (Quercus cerris L.) FORESTS Tutor: Prof. Donato CHIATANTE Dottorando: Mattia TERZAGHI Anno 2011
Transcript of UNIVERSITA’ DEGLI STUDI...

1
UNIVERSITA’ DEGLI STUDI DELL’INSUBRIA
Facoltà di Scienze MM.FF.NN. - Como
Tesi di Dottorato di Ricerca in Scienze Ambientali
XXIV ciclo
FINE-ROOT DYNAMICS, ANATOMY AND
CARBON-NITROGEN CONCENTRATIONS IN RELATION
TO FOREST MANAGEMENT AND SOIL WATER CONTENT.
CASE STUDIES IN BEECH (Fagus sylvatica L.)
AND TURKEY-OAK (Quercus cerris L.) FORESTS
Tutor:
Prof. Donato CHIATANTE
Dottorando:
Mattia TERZAGHI
Anno 2011

2
“...We Are The Future Of Science...”
Carolina Miguel Pérez
(personal communication, September 5, 2009)

3
Contents Abstract 6
Chapther I – Introduction
7
1.1 Global carbon cycle and carbon balance 7
1.2 The carbon cycle and the human activities 8
1.3 Carbon storage on land. The residual terrestrial sink 10
1.4 Terrestrial ecosystems: vegetation and soils 11
1.5 The role of roots in carbon balance 12
1.6 The research project 13
1.6.1 Forest management 13
1.6.2 Soil water content 15
1.7 References 16
Chapter II - Study sites and stands characterization
19
2.1 Fagus sylvatica L. stands 19
2.1.1 Study site 19 2.1.2 Stand measurements (soil temperature, canopy cover, tree
stocking density, above-ground biomass and leaf biomass) 21
2.1.3 Above-ground stand characteristics 22
2.2 Quercus cerris L. stand 26
2.2.1 Study site 26
2.2.2 Stand measurements (soil moisture, canopy cover and above-ground biomass, tree stocking density and leaf biomass
28
2.2.3 Above-ground stand characteristics 29
2.3 References 31
Chapter III - Effect of forest management on fine roots in Fagus sylvatica L. stands
32
3.1 Materials and methods 32
3.1.1 Fine-root measurements 32
3.1.2 Statistical analysis 35

4
3.2 Results 35
3.2.1 Fine-root standing mass and seasonal pattern 35
3.2.2 Fine-root production and turnover 39
3.3 Discussion 41
3.4 Acknowledgements 44
3.5 References 45
Chapter IV - Forest management and its effect on carbon and nitrogen concentration in fine roots of beech (Fagus sylvatica L.)
48
4.1 Materials and methods 49
4.1.1 Fine-root measurements 49
4.1.2 Fine-root nitrogen and carbon concentrations 50
4.1.3 Statistical analysis 51
4.2 Results and discussion 51
4.2.1 Fine-root nitrogen concentration 52
4.2.2 Fine-root carbon concentration 56
4.2.3 Fine-root C:N ratio 57
4.3 Acknowledgements 59
4.4 References 60
Chapter V - Effects of conversion of old coppice to high forest on anatomy of Fagus sylvatica fine roots
62
5.1 Materials and methods 63
5.1.1 Fine-root sampling 63
5.1.2 Histological analysis 63
5.1.3 Statistical analysis 65
5.2 Results and Discussion 66
5.2.1 General fine-root histological traits in Fagus sylvatica L. 66
5.2.2 Fine-root histological traits and forest management 68
5.3 Acknowledgements 71
5.4 References 72

5
Chapter VI - Fine-root mass, length and specific root length in a Turkey-oak (Quercus cerris L.) stand in relation to seasonal changes in soil moisture
74
6.1 Materials and methods 75
6.1.1 Fine-root measurements 75
6.1.2 Statistical analysis 77
6.2 Results 78
6.2.1 Soil moisture 78
6.2.2 Fine-root mass, length and SRL 78
6.2.3 Fine-root production and turnover rate 81
6.3 Discussion 82
6.4 Acknowledgements 86
6.5 References
87
Chapter VII - Conclusions 90

6
Abstract
Uncertainties in estimates of fine root dynamics prevent a proper quantification of net
primary productivity and belowground C allocation. Moreover, model studies for estimating
carbon budgets are biased by the lack of fine roots datasets at forest stand level. This study
shed some lights on fine root dynamics in two different Italian forests. In particular fine-root
systems was investigated: 1) in three beech forest stands (Fagus sylvatica L.) located in
Southern-Alps in relation to different forest management practices and age 2) in a mature
Turkey-oak stand (Quercus cerris L.) located in the Southern Apennines in relation to soil
moisture seasonal changes.
Data from beech forests showed that conversion from coppice to high forest practice
induced considerable variations in fine-root traits. Reduction of stand tree density induced a
reduction of total fine-root mass and an increase of both production and turnover rate. Both
fine-root production and turnover rate increased in converted stands. When fine-roots Carbon
and Nitrogen contents were analyzed, their ratio was significantly lower in converted stands,
supporting the finding of a higher turnover rate. A histological study was carried to assess if
also anatomical changes occurred due to conversion practices. Anatomy on fine roots showed
a higher percentage of xylem cells in conversion stands explaining the lowest carbon
concentration.
Turkey-oak fine-root biomass and length showed a bimodal pattern with a peak in
summer and a peak in autumn. SRL had only one peak in summer. All fine root traits
increased during the transition from the wet to dry season. These results indicate a pulse in
root growth in order to increase the soil exploitation when soil water content is low.
Moreover, during the summer period, Q. cerris change fine-root morphology leading an
increase of fine root length per unit mass.

7
Chapter I
Introduction
1.1 Global carbon cycle and carbon balance
Many efforts are being spent towards understand how much of the carbon emitted into
the atmosphere remains there and how much is taken up by terrestrial ecosystems and world’s
oceans. Answers to these matters will provide at least a part of the scientific understanding
necessary for establishing the amount and rate of CO2 emissions that would meet a “safe”
concentration (Houghton 2007).
The contemporary global carbon cycle (simplified form in Figure 1.1) refers to the
exchanges of carbon within and between four major reservoirs: the atmosphere, the oceans,
land, and fossil fuels. In terms of unit of time, the carbon exchanges may occur: -in seconds
by the fixation of atmospheric CO2 into sugar through photosynthesis; -over millennia by the
accumulation of fossil carbon (coal, oil, gas) and processes such as weathering, vulcanism,
seafloor spreading, and diagenesis. The amounts of carbon exchanged annually through the
‘over millennia processes’ are small and generally ignored in budgets of a century (see
Sundquist and Visser 2004 for a review of the carbon cycle over longer time frames)
(Houghton 2007).
Understanding how different mechanisms regulate carbon sinks is very important
because they have different implications for the rate of future CO2 increase as well as the rate
of global warming. The most recent and comprehensive overview on the carbon cycle,
particularly with respect to climate, is the fourth Intergovernmental Panel on Climate Change
2007 (IPCC 2007 www.ipcc.ch/). The basic aspects of the global carbon cycle have been

Chapter I - Introduction
8
understood for 35 years, but predictions of how sources and sinks of carbon will respond to a
changing climate are actively debated.
1.2 The carbon cycle and the human activities
Scientists have used a combination of data and models to reconstruct changes in the
global carbon cycle over the past centuries. The historical information includes rates of fossil
fuel use and rates of land-use change. Data on past CO2 and CH4 concentrations as well as
temperature were obtained from Antartic ice cores (Houghton 2007). Approximately 300 PgC
have been released since 1750, essentially all of it since 1860 (Keeling 1973, Andres et al.
1999). Today there are approximately 100 stations worldwide where weekly flask samples of
Figure 1.1 The global carbon cycle in the 1990s. Units are PgC or PgC year−1 (in Houghton 2007)

Chapter I - Introduction
9
air are collected, analyzed for CO2 and other constituents. Resulting data are integrated into a
consistent global data set (Masarie and Tans 1995). In 2005, the concentration of atmospheric
CO2 reached nearly 380 ppm (388.92 ppm in October 2011), an increase of 35% above the
preindustrial concentration (275–285 ppm, Monnin et al. 2001).
The relatively recent increasing of CO2 atmospheric concentration is attributable to the
fossil fuel consumption by human activities:
1) Since 1850, the timing of the increase is coincident with the rising emissions of
carbon from fossil fuel combustion and land-use change (e.g. deforestation and urbanization).
2) The latitudinal gradient in CO2 concentrations is highest at northern midlatitudes
and lower at higher and lower latitudes, consistent with the fact that most of the emissions of
fossil fuel are located in northern mid-latitudes. Moreover, this latitudinal gradient has
increased in proportion to emissions of carbon from fossil fuels (Keeling et al. 2005).
3) The distribution of carbon isotopes and other biogeochemical tracers are consistent
with scientific understanding of the sources and sinks of carbon from fossil fuels, land, and
the oceans. For example, the increase in concentrations over the period 1850 to 2000 was
accompanied by a decrease in the 14C content of CO2. The decrease is what would be
expected if the CO2 added to the system were fossil carbon depleted in 14C through
radioactive decay. This dilution of 14CO2 is called the Suess effect (Houghton 2007).

Chapter I - Introduction
10
1.3 Carbon storage on land. The residual terrestrial sink.
The measured amount of carbon released by land use changes such as conversion of
forests to agricultural lands (156-174 PgC) (Houghton 2003), is much larger than the amount
calculated in the global carbon budget equation (39-40 PgC) (Sabine et al. 2004) (Tab. 1.1).
Table 1.1 The global carbon budget for two intervals (units are PgC) (in Houghton 2007)
1800 to 1994 1850 to 2000
Emissions from fossil fuels and cement production 244±201 2753
Atmospheric increase −165±41 −1754
Oceanic uptake −118±191 −1405
Calculated land-use change 39±281 40
Measured land-use change 1742 1562
Residual terrestrial sink −135 −116 1 Sabine et al. 2004. 2 Houghton 2003. 3 Keeling 1973, Andres et al. 1999. 4 Prentice et al. 2001. 5 Joos et al. 1999
The difference between these two values (a residual sink of 116-135 PgC) may be due
to errors in the analyses (either the ocean models or the land-use change calculations), or may
indicate a terrestrial flux of carbon unrelated to land-use change (Houghton 2007). The
release of carbon calculated from changes in land use includes only the sources and sinks of
carbon resulting directly from human activity; ecosystems not directly modified by human
activity are left out of the analysis. In contrast, the release computed by difference includes all
ecosystems and processes. The mechanisms responsible for carbon sinks on land are not yet
well known, therefore two competing factors have been proposed:

Chapter I - Introduction
11
1) enhanced growth of forests from physiological or metabolic factors that affect rates
of photosynthesis, respiration, growth, and decay.
2) regrowth from past disturbances, changes in land use, or management, affecting the
mortality of forest stands, the age structure of forests, and hence their rates of carbon
accumulation (Houghton 2007).
Carbon is taken up from the atmosphere through photosynthesis and released through
respiration, including the respiration of plants, animals, and microbes (largely soil
respiration), and fire. An imbalance between these two processes will cause ecosystems to be
either carbon sinks or sources. Differently, if this two processes are balanced, an increase in
productivity will lead to an increase in carbon storage until the carbon lost from the detritus
pool comes into a new equilibrium..The longer the turnover time, the higher the storage
(Houghton 2007).
1.4 Terrestrial ecosystems: vegetation and soils.
Carbon accounts for approximately 0.27% of the mass of elements in Earth’s crust
(Kempe 1979), yet accounts for approximately 50% of dry (water removed) organic matter
The carbon exchanges between terrestrial ecosystems and the atmosphere are mainly the
result of biological processes such as photosynthesis and respiration ( 120 PgC year−1 in each
direction). Year-to-year variations in these fluxes owing to climatic variations, including
variations in fires, may be as high as 5 PgC year−1 (Peylin et al. 2005). The amount of carbon
contained in terrestrial vegetation (550±100 Pg) is on the order of the amount in the
atmosphere (800 Pg). Forests are particularly important as a carbon reservoir because trees
hold much more carbon per unit area than other types of vegetation (Houghton 2007). The
organic matter in soils is two to three times this amount [1500–2000 PgC in the top meter and
as much as 2300 Pg in the top 3 m (Jobbàgy and Jackson 2000)].

Chapter I - Introduction
12
1.5 The role of roots in carbon balance
Root system is an important part of the path for carbon and energy movement from
plant canopy to soil. Root construction and maintenance influence carbon (C) and mineral
nutrient consumption, while root death influences the partial return of these resources to soil
(Eissenstat and Yanai 1997). Thus, root production and turnover directly impact the carbon
cycle in terrestrial ecosystems (Matamala 2003). Net primary production (NPP) is greater
below- then above-ground in a range of different ecosystems (Caldwell 1987). Even in forests
with enormous above-ground biomass, below-ground NPP was consistently higher than
above-ground, especially early in stand development (Gower et al. 1994). Roots, like other
plant organs, have a life history: they are born, age and die (Harper 1977). The contribution of
root C to the formation of soil organic matter depends on root productivity, turnover rates,
exudation, mycorrhizal colonization, and soil characteristics, all of which vary with forest
type (Matamala 2003). Current estimates have indicated that fine-root production contributes
from 33 to 67% of the annual NPP in forest ecosystems. (Jackson et al. 1997; Grier et al.
1981; Santantonio et al. 1987). However, very little is known about below-ground systems
dynamics.
So far scientists developed several models in order to analyze carbon budgets and
fluxes at the forest stand level. These models range from very detailed ecophysiological
models for climate impact assessment, to very general empirical/descriptive models for forest
stand carbon budget (Mohren 1987; Dewar 1991; Mery and Kanninen 1999; Kirschbaum et
al. 1998; Schlamadinger and Marland 1996; White et al. 2000; Karjalainen 1996, in Masera et
al. 2003). None of these models have been widely disseminated or accepted as a possible
standard for carbon crediting (Masera et al. 2003). These biomass estimates have the largest
relative uncertainties because the lack of data related to fine roots. (Peltoniemi et al. 2004).
Apart the type of model used, uncertainties in estimates of fine-root longevity prevent proper
Chapter I - Introduction
13
quantification of net primary productivity and below-ground C allocation in forests. Thus,
turnover rate has a large effect on carbon modeling. When the fine-root turnover rate was set
to its lower or upper limit estimated, it alone changed the simulated soil carbon stock by 15%
and carbon accumulation rate by 30% (Peltoniemi et al. 2004)
1.6 The research project
The function of forests in sequestering carbon is one of the most intensely investigated
topics in forestr research. There is a need to better understand some of the aspects of root
development and life cycle that might influence below-ground carbon stock turnover (Tobin
et al. 2007). Forest root systems are mainly composed by – structural roots (diameter > 2 mm)
and – fine roots (diameter < 2 mm). Given their simple anatomical organization, fine roots are
the most sensitive component of the root system responding rapidly to variations in the
rooting environment. Therefore, the fine-root compartment should be investigated when
studying nutrient cycling and carbon accumulation in a forest ecosystem (Helmisaari et al.
2002).
1.6.1 Forest management
The Italian National Forest Inventory (www.sian.it/inventarioforestale/jsp/home_
en.jsp 2011) indicates that more than 60 percent of Italian forests are maintained under a
coppice regime. This situation stems from when there was a high demand for small timber,
firewood and charcoal. Now, based on social and economic factors, there is a trend to convert
traditional coppice management to high forest management (Ciancio et al. 2006). Coppice
stands are usually characterised by dense distribution of stools each of which includes a
number of stems. Only one stem in each stool is left during conversion to high forest
management. At the same time, tree density per hectare usually decrease. Because the optimal

Chapter I - Introduction
14
degree of tree density has not yet been established, converted stands may have different
structures. Thus, high forest management results in a considerable change in the canopy
structure, which in turn may alters important environmental factors such as light/shade
distribution, soil-profile, soil-temperature, and nutrient distribution. Moreover roots belonging
to the cut trees may die and decompose. Given this, is not unreasonable to speculate that the
contemporaneous variation of so many important factors is not without consequences for the
root life-cycle.
In this work, we studied three forest stands differing in use intensity and cutting age
(an undisturbed 40-year-old coppice stand and two coppice stands converted to high forest in
1994 and 2004) in the Southern-Alps (see chapter II for site characterization). We analysed
the impact of conversion practice in beech forest on fine-root traits. The cited order reflects
the cutting age: the more recent the cutting operation, the more severe the forest use intensity
and the effect of disturbance on the environmental factors that characterise a stand.
In chapther III, we evaluated the (a) monthly variation of the fine-root standing
biomass and necromass during a growing season; (b) the annual fine-root production and
turnover rate and (c) how the above-indicated fine-root traits vary in relation to the soil depth.
In chapter IV, we focused on carbon and nitrogen concentrations in beech fine roots
because these two parameters could be used as indicators of the construction and maintenance
costs respectively for fine-root biomass.
In chapter V, we present an histological analysis regarding beech fine roots. Our aim
was to evaluate the occurrence of significant differences in anatomical characteristics among
fine roots 1-2 mm thick sampled in the three different managed beech forests.
Chapter I - Introduction
15
1.6.2 Soil water content
Simulations performed with atmospheric models over the Mediterranean Basin predict
an overall warming in all seasons, a decrease in annual mean precipitation and the consequent
reduction of soil water content (Gibelin and De´que 2003). In addition, data on fine roots of
tree species growing in the Mediterranean Basin are scarce and their changes in biomass have
been generally ignored (Finer et al. 2007; Jackson et al. 1997).
Even if oaks (Quercus ssp.) are major components of European temperate vegetation
types (Bradshaw and Lindbladh 2005; Bolte and Löf 2010), very little is known about these
species. Very few studies investigated the fine-root growth of Q. cerris. Manes et al. (2005)
studied three-year old potted seedlings of Quercus cerris L. (Turkey-oak) under controlled
conditions in relation to soil water stress. Claus and George (2005) investigated Q. cerris fine-
root mass under natural conditions in central Italy in relation to chronosequence. Thus, there
is a lack of data on the fine-root mass and morphology in forest stands growing under natural
conditions and in relation to soil moisture seasonal variation. This lack of data hinders
attempts to model accurately the behaviour of terrestrial ecosystems, and their potential
responses to climate change.
In chapter VI was presente a study with objective the detection of adaptive responses of
the fine-root systems in a Turkey-oak stand to changes in water availability. The study was
carried on a Quercus cerris L. forest stand (see chapter II for site characterization) throughout
an entire vegetative season. Our specific investigations were to: (i) quantify the seasonal
variation of (a) live and dead fine-root as dynamic adaption of primary production to
environmental changes, (b) length and (c) SRL; (ii) quantify these characteristics in the
different diameter classes of the fine-root population. The effects of seasonal water deficits
were assessed by comparing root mass and morphology between the wet and dry seasons.
Chapter I - Introduction
16
1.7 References
Andres R.J., Fielding D.J., Marland G., Boden T.A., Kumar N. and Kearney A.T. 1999.
Carbon dioxide emissions from fossil-fuel use, 1751–1950. Tellus, 51B:759–765
Bolte A. and Löf M. 2010. Root spatial distribution and biomass partitioning in Quercus
robur L. seedlings: the effects of mounding site preparation in oak plantations. Eur. J.
For. Res. 129:603–612
Bradshaw R.H.W. and Lindbladh M. 2005. Regional spread and stand-scale establishment
of Fagus sylvatica and Picea abies in Scandinavia. Ecol. 86:1679–1686
Caldwell M.M. 1987. Competition between roots in natural communities. In P.J. Gregory and
J.V. Lake. eds, Root development and Function. Cambridge University Press, New
York, pp. 167-815
Ciancio O., Corona P., La monaca A., Portoghesi L. and Travaglino D. 2006. Conversion
of clearcut beech coppices into high forests with continuous cover: A case study in
central Italy. For. Eco. Manag. 224:235-240
Claus A. and George E. 2005. Effect of stand age on fine-root biomass and biomass
distribution in three European forest chronosequences. Can. J. For. Res. 35:1617-
1625
Eissenstat D.M. and Yanai R.D. 1997. The ecology of root life span, Adv. Ecol. Res., 27:1–
60
Finer L., Helmisaari H.S., Lohmus K., Majdi H., Brunner I., Børja I., Eldhuset T.,
Godbold D., Grebenc T., Konopka B., Kraigher H., Mottonen M.R., Ohashi M.,
Oleksyn J., Ostonen I., Uri V., Vanguelova E. 2007. Variation in fine root biomass
of three European tree species: Beech (Fagus sylvatica L.), Norway spruce (Picea
abies L. Karst.), and Scots pine (Pinus sylvestris L.). Plant Biosystems, 141:394-405
Gibelin A.L. and De’que’ M. 2003. Anthropogenic climate change over the Mediterranean
region simulated by a global variable resolution model. Climate Dynamics, 20:327-
339
Gower S.T., Gholz H.L., Nakane K. and Baldwin V.C. 1994. Production and carbon
allocation patterns of pine forests. In Gholz H.L., Linder S. and McMurtrie R.E. eds,
Environmental Constraints on the Structure and Productivity of Pine Forest
Ecosystems: A Comparative Analysis, Ecological Bulletins, Copenhagen, 43:115–135
Chapter I - Introduction
17
Grier C.C., Vogt K.A., Keyes M.R. and Edmonds R.L. 1981. Biomass distribution and
above and belowground production in young and mature Abies amabilis zone
ecosystems of the Washington Cascades. Can. J. For. Res., 11:155-167
Harper J.L. 1977. Population Biology of Plants. Academic Press, London
Helmisaari H.S., Makkonen K., Kellomäki S., Valtonen E., Mälkönen E. 2002. Below-
and above-ground biomass, production and nitrogen use in Scots pine stands in
eastern Finland. For. Ecol. Manag. 165:317-326
Houghton R.A. 2003. Revised estimates of the annual net flux of carbon to the atmosphere
from changes in land use and land management. 1850–2000. Tellus, 55B:378–390
Houghton R.A. 2007. Balancing the Global Carbon Budget. Annu. Rev. Earth Planet. Sci.
35:313-347
Jackson R.B., Mooney H.A. and Schulze E.D. 1997. A global budget for fine root biomass,
surface area, and nutrient contents. Proceedings of the National Academy of
Sciences, USA 94:7362-7366
Jobbàgy E.G. and Jackson R.B. 2000. The vertical distribution of soil organic carbon and
its relation to climate and vegetation. Ecol. Applicat. 10:423–436
Joos F., Meyer R., Bruno M. and Leuenberger M. 1999. The variability in the carbon sinks
as reconstructed for the last 1000 years. Geophys. Res. Lett,. 26:1437–1440
Keeling C.D. 1973. Industrial production of carbon dioxide from fossil fuels and limestone.
Tellus, 25:174–198
Keeling R.F., Manning A.C., Hamme R.C. and Paplawski W. 2005. Global oceanic and
land carbon sinks from the Scripps atmospheric oxygen flask sampling network.
Seventh Int. Conf. Carbon Dioxide, Broomfield, CO (Abstr.)
Kempe S. 1979. Carbon in the rock cycle. In Bolin B., Degens E.T., Kempe S. and Ketner P.
eds, The Global Carbon Cycle, New york, Wiley, pp. 343–377
Manes F., Vitale M., Donato E., Giannini M. and Puppi G. 2006. Different ability of three
Mediterranean oak species to tolerate progressive water stress. Photosynthetica 44:
387-393
Masarie K.A. and Tans P.P. 1995. Extension and integration of atmospheric carbon dioxide
data into a globally consistent measurement record. J. Geophys. Res., 100:11593–
11610
Masera O.R., Garza-Caligaris J., Kanninen M., Karjalainen T., Liski J., Nabuurs G.J.,
Pussinen A., de Jong B.H.J. and Mohren G.M.J. 2003. Modelling carbon

Chapter I - Introduction
18
sequestration in afforestation, agroforestry and forest management projects: the
CO2FIX V.2 approach. Ecological modelling 164:177-199
Matamala R. 2003. Impacts of fine root turnover on forest NPP and soil C sequestration
potential. Science, 302:1385-1387
Monnin E., Indermühle A., Dallenbach A., Fluckiger J., Stauffer B., et al. 2001.
Atmospheric CO2 concentrations over the last glacial termination. Science, 29:112–
114
Peltoniemi M., Mäkipää R., Liski J. and Tamminen P. 2004. Changes in soil carbon with
stand age – an evaluation of a modelling method with empirical data. Global Change
Biology, 10:2078–2091
Peylin P., Bousquet P., LeQuèrè C., Sitch S., Friedlingstein P., et al. 2005. Multiple
constraints on regional CO2 flux variations over land and oceans. Global
Biogeochem. Cycles 19:GB1011
Prentice I.C., Farquhar G.D., Fasham M.J.R., Goulden M.L., Heimann M., et al. 2001.
The carbon cycle and atmospheric carbon dioxide. In Houghton J.T., Ding Y., Griggs
D.J., Noguer M., van der Linden P.J., Dai X., Maskell K. and Johnson C.A. eds,
Climate Change 2001: The Scientific Basis. Contribution of Working Group I to the
Third Assessment Report of the Intergovernmental Panel on Climate Change,
Cambridge, Cambridge Univ. Press pp. 239–287
Sabine C.L., Feely R.A., Gruber N., Key R.M., Lee K., et al. 2004. The oceanic sink for
anthropogenic CO2. Science, 305:367–71
Santantonio D. and Grace J.C. 1987. Estimating fine-root production and turnover from
biomass and decomposition data: a compartment-flow model. Can. J. For. Res.,
17:900-908.
Sundquist E.T. and Visser K. 2004. The geological history of the carbon cycle. In
Schlesinger W.H. ed, Biogeochemistry. Treatise on Geochemistry, Oxford, UK:
Elsevier-Pergamon, 8:425–472
Tobin B., Cermak J., Chiatante D., Danjon F., Di Iorio A., Dupuy L., Eshel A., Jourdan
C., Kalliokoski T., Laiho R., Nadezhdina N., Nicoll B., Pagè L., Silva J., Spanos I.
2007. Towards developmental modelling of tree root systems. Plant. Biosyst. 141:481-
501 www.ipcc.ch - IPCC Fourth Assessment Report (AR4) Climate Change 2007: Mitigation of Climate Change
www.sian.it/inventarioforestale/jsp/home_en.jsp 2011
19
Chapter II
Study sites and stands characterization
Data were obtained from different study sites: three different managed beech stands
(Fagus sylvatica L.) in Lombardy Alps and a Turkey-oak stand (Quercus cerris L.) in Molise
Appennines.
2.1 Fagus sylvatica L. stands
2.1.1 Study site
The study area is located in the catchments of the Telo stream in the Lombardy Alps
(Intelvi Valley, NW Italy, 45° 59’ N, 9° 07’ E) approximately from 1160 m to 1200 m above
sea level between Lakes Como and Lugano. This area is characterised by a sub-continental
climate, with a mean annual precipitation of 1600 mm, mainly concentrated in two main
periods (April-May and October-November), and a mean annual temperature of 10-11°C.
Rainfall (mm) and air temperature (°C) were recorded at 60 min interval. Sensors
(Thermometer DMA572 and Rain gauge DQA030; LSI Latstem s.r.l.) were mounted on a 3-m
high mast and set up on a hill (Alpe di Ponna) 0.8 km from the experimental site. An intense
snow fall on 22 November 2008 prevented sampling until the following spring.
According to the World Reference Base (WRB) for Soil Resources (IUSS 2006), soil
type is Leptosol 40-50 cm deep. Sampling plots were placed in three stands with different
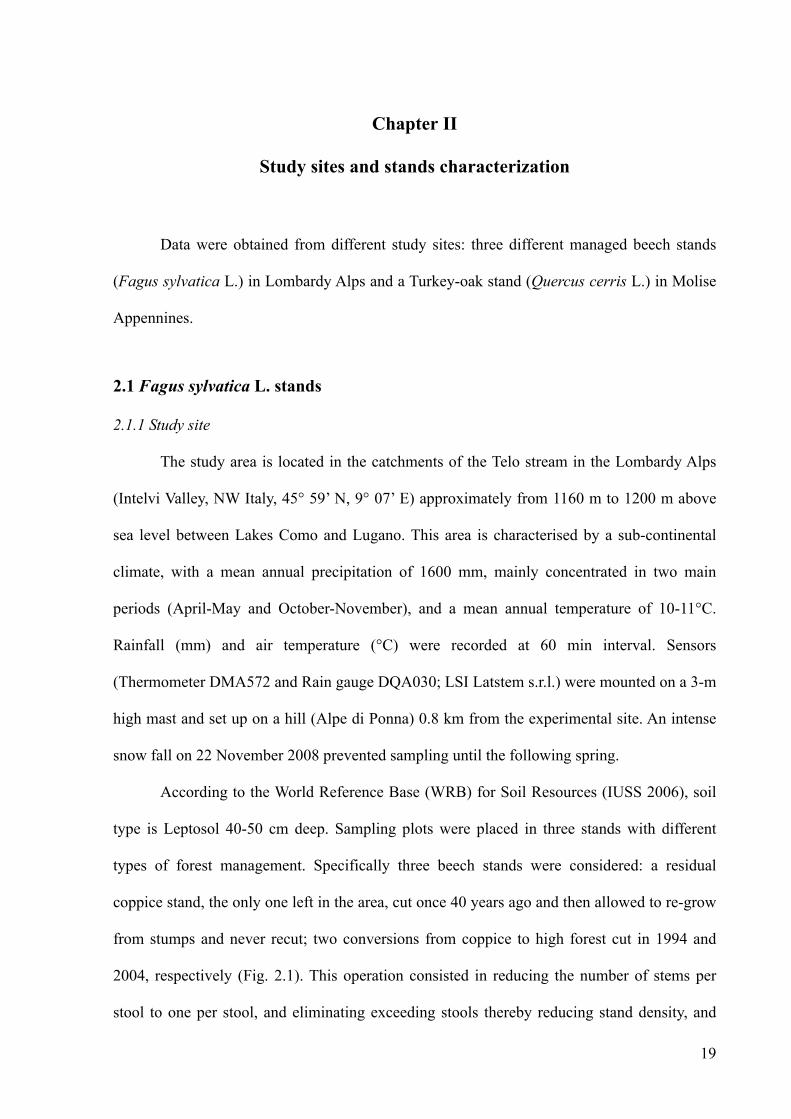
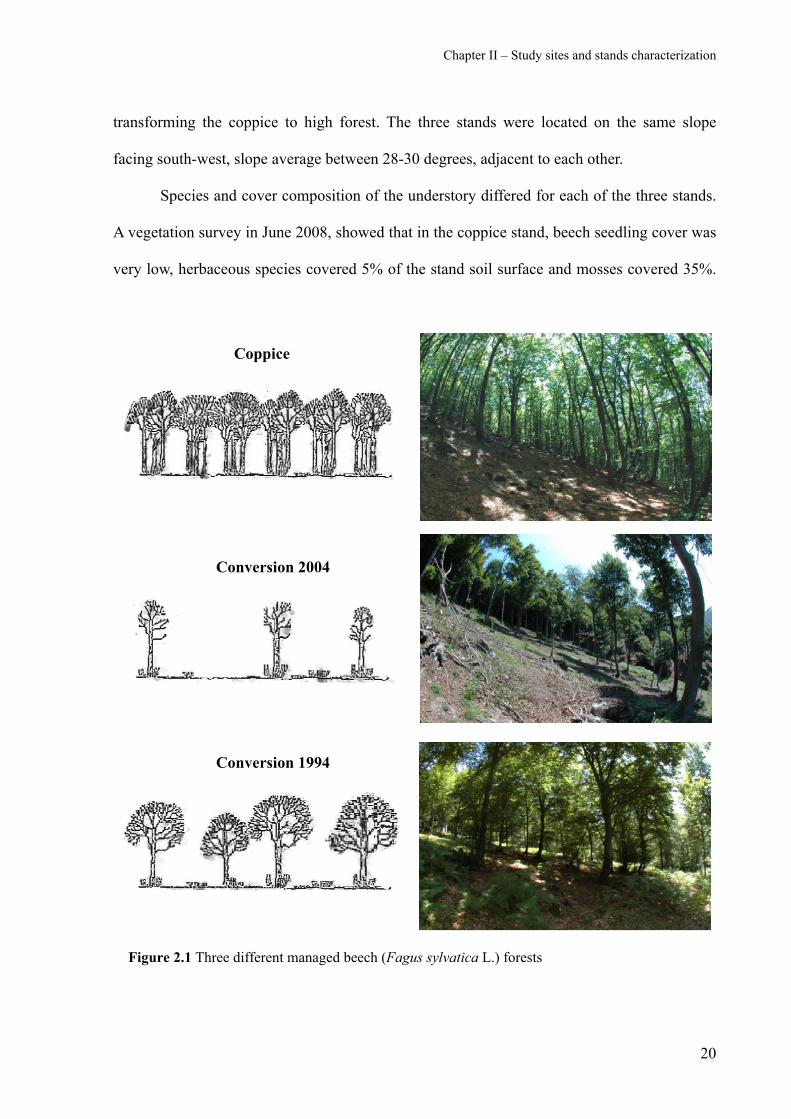
types of forest management. Specifically three beech stands were considered: a residual
coppice stand, the only one left in the area, cut once 40 years ago and then allowed to re-grow
from stumps and never recut; two conversions from coppice to high forest cut in 1994 and
2004, respectively (Fig. 2.1). This operation consisted in reducing the number of stems per
stool to one per stool, and eliminating exceeding stools thereby reducing stand density, and
Chapter II – Study sites and stands characterization
20
transforming the coppice to high forest. The three stands were located on the same slope
facing south-west, slope average between 28-30 degrees, adjacent to each other.
Species and cover composition of the understory differed for each of the three stands.
A vegetation survey in June 2008, showed that in the coppice stand, beech seedling cover was
very low, herbaceous species covered 5% of the stand soil surface and mosses covered 35%.
Conversion 1994
Conversion 2004
Coppice
Figure 2.1 Three different managed beech (Fagus sylvatica L.) forests
Chapter II – Study sites and stands characterization
21
Five herbaceous species were found and the most abundant species were Luzula nivea
with a cover of 20% and Maianthemum bifolium (up to 4%). In the 1994 Conversion stand,
beech seedlings covered up to 15% of the soil surface. The herbaceous species covered from
20% to 50% with 16 species the most abundant of which were Pteridium aquilinum (from 8%
to 20%), Maianthemum bifolium (up to 20%) and Silene rupestris (up to 35%). Mosses
covered only 5% of the soil surface. In the 2004 Conversion stand, beech seedlings covered
up to 15% and seedlings of birch (Betula pendula Roth) covered 2%. Herbaceous species
covered up to 85% and mosses only 1%. The number of herbaceous species was 19 and the
most abundant were Carex pallescens (25%), Veronica officinalis (15%), Rumex acetosella
(10%) and Luzula pilosa (10%).
2.1.2 Stand measurements (soil temperature, canopy cover, tree stocking density, above-
ground biomass and leaf biomass)
Soil temperature was measured during the growing season. Measurements were taken
next to the soil cores. On each sampling date, six measurements were taken at three soil
depths: 5 cm, 15 cm and 25 cm. Soil temperature was measured using a high accuracy
thermometer with a stainless steel probe (mod. CheckTemp 1). The probe utilizes a high-tech
NTC thermistor sensor that makes it possible to obtain an extremely high accuracy (± 0.3°C)
in a very short time.
In July 2008 canopy cover was measured by hemispherical photos (Rich 1990)
analysed with the Can-eye freeware (www4.paca.inra.fr/can-eye 2011). 10 hemispherical
photos per stand were taken at 7.5-meter intervals along a transect.
Chapter II – Study sites and stands characterization
22
To determine the tree stocking density per stand, an area of 100x100 m was delimited
within each stand and the number of trees was counted. In the Coppice stand, each multi-
stemmed stool was counted as one tree.
.In November 2008, for each stand, three sample trees representing the range of tree
sizes were selected for destructive harvesting, and the dbh was measured. Finally, a site-
specific allometric relationship was developed to estimate the woody biomass from the tree
dbh. The best fit (r2= 0.97) was obtained by a unique power function suitable for all three
stands (no Stand effect, ANCOVA P=0.74). The power equation (1) is:
W=aDb (1)
where W = dry weight D = dbh a =1.0594 b = 1.8237
The above-ground biomass was surveyed on seven selected 20-m diameter circular-
shaped sampling plots per stand (a total of 2198 m2 per stand) with the site specific allometric
relationship, estimating branch and stem biomass from tree diameter at breast heights (dbh).
In order to estimate leaf biomass, 10 litter traps where placed in summer 2008 in each
stand at 7.5-meter intervals along a transect (Finotti et al. 2003). Leaves where sampled at the
end of October 2008 after leaf shedding, dried and weighed.
2.1.3 Above-ground stand characteristics
Due to the different management intensities and age, the forest types differed clearly
with respect to the above-ground stand structure. As shown in Table 2.1, stem density and
above-ground biomass were higher in the Coppice stand than in the 2004 Conversion stand,
whereas dbh and height were greater in the 2004 Conversion stand. In the 1994 Conversion
stand, the values of all the parameters tested were intermediate between those of the Coppice

Chapter II – Study sites and stands characterization
23
and the 2004 Conversion stands. The differences in canopy cover percentage measured by the
hemispherical photo analysis reflected those recorded for tree density, namely canopy cover
was highest in the Coppice stand and lowest in the 2004 Conversion stand (Tab. 2.1). Soil
temperatures were invariably lower in the Coppice stand where the canopy cover was
maximum and therefore the shading effect was higher whereas soil temperatures were highest
in the 2004 Conversion stand where the percentage of canopy cover was lowest (Tab. 2.1).
The soil temperature pattern was similar in the three stands (Fig. 2.2).

Chapter II – Study sites and stands characterization
24
Table 2.1 Tree density, above-ground biomass, canopy cover and soil temperature of three forest management treatments. Canopy cover values are the means of 10
replicates; soil temperature (0 – 30 cm) is referred to the means of three soil depths (5 cm, 15 cm and 25 cm) and each value is the mean of 6 replicates for 7 sampling dates
(May - October 2008). Above-ground biomass values are the mean of 7 replicates. All values are mean ±S.E.
Soil temperature(°C)
ForestManagement
No. stemshectares -1
Above-groundBiomass(Mg ha-1)
Leafbiomass
(Mg ha-1)Mean dbh a
(cm)
Mean treeheight
(m)
Canopycover(%) 0-30 cm 5 cm 15 cm 25 cm
Coppice 724 ±35 248.5 ±15.6 2.7 ±0.1 17.2 ± 0.7 12.1 ±0.3 94.2 ±0.6 10.24 ± 0.30a
10.57 ± 0.55a
10.22 ± 0.51a
9.94 ± 0.51a
Conversion1994 279 ±24 123.7 ±7.3 3.3 ±0.1 22.6 ± 1.5 12.8 ±0.7 74.2 ±5.5 11.26 ±0.32
b11.66 ± 0.58
ab11.15 ± 0.54
ab10.96 ± 0.53
b
Conversion2004 167 ±20 91.8 ±20.2 1.6 ±0.2 31.9 ± 1.9 18.9 ±0.8 54.3 ±3.2 12.23 ± 0.36
c12.75 ± 0.69
b12.05 ± 0.59
b11.90 ± 0.58
ca dbh (diameter at breast height)
Soil temperature was measured with the Checktemp 1 thermometer with an NTC thermistor sensor (Hanna Instruments ®) (± 0.3°C). On each sampling date, measurements
were taken at the soil core sampling point at three depths (5 cm, 15 cm and 25 cm). a, b and c indicate significant differences between forest management treatments within
the same soil depth (Mann-Whitney U test, p < 0.05)

Chapter II – Study sites and stands characterization
25
Figure 2.2 Upper panel (A) shows air temperature (°C) and monthly total rainfall (mm) characterizing the study site during the sampling period. Lower panel (B) shows soil temperatures (°C) measured in each stand for the whole 0-30 cm soil depth. During the snow cover period indicated on the X-axis, soil temperature was not measured. At the beginning of March 2009 in the 1994 Conversion stand, soil temperature was measured under snow cover. Data are the means of 12 measurements ± S.E.

Chapter II – Study sites and stands characterization
26
2.2 Quercus cerris L. stand
2.2.1 Study site
The experimental site is located in the Trigno river basin near Trivento (Molise, Italy),
on the east side of the southern Italian Apennine. The site is located on a north-facing hill
slope, at an altitude of 600 m (latitude 41°43′ N, longitude 14°33′ E - shallow-slope
conditions, 4°-5°). The climate is montane Mediterranean with summer drought generally
spanning June, July and August. Rainfall is usually concentrated between late autumn and
early spring (Fig. 2.3).
The mean yearly precipitation is 656 mm, falling mostly as rain. The area under
investigation is subject to seasonal and yearly variations in terms of drought and cold stress
periods. Evapotranspiration is high during summer when rainfall is low thereby resulting in a
considerable moisture deficit (Van Beek et al. 2001). The mean summer and winter
temperatures are estimated to be 22 °C and 7 °C, respectively. Soil type is the widespread
Typic Eutrudepts fine loamy mixed mesic (USDA, Keys to Soil Taxonomy, 1998) (see Table
Figure 2.3 Climatic factors of the survey site from 1975 to 2006. The drought period was determined based on temperature and rainfall data according to Bagnolous and Gaussen (data from the Trivento weather station, Regione Molise)

Chapter II – Study sites and stands characterization
27
1 for soil site features in Di Iorio et al. 2008) that reacts to the montane Mediterranean climate
with high shrinkage and cracks forming to a maximum depth of 1.0 m in the summer. This
soil type frequently becomes waterlogged during the winter months (Barij et al. 2007).
Vegetation over-storey at the study site is dominated by European Turkey-oak (Quercus
cerris L., 50-75% cover, Fig. 2.4). Turkey-oak extends from south-east Europe to south-west
Asia. In Italy, it is distributed over all the territory, preferring clay, and deep sub-acid soils. In
the Apennines, this species forms pure or mixed forests together with other broadleaved
species (i.e., Quercus pubescens Willd.) (Pignatti 1982).
The main understory species at the study site are Crataegus monogyna Jacq. (land cover
percentage: 25-50%), Euonymus europeus L. (<25%), Ligustrum vulgare L. (25-50%),
Ruscus aculeatus L. (25-50%), Asparagus acutifolius L. (<25%), Lonicera caprifolium L.
(<25%), Rosa canina L. (<25%), Cornus mas L. (<5%) and Prunus spinosa L. (<5%). The
Figure 2.4 Quercus cerris L. stand

Chapter II – Study sites and stands characterization
28
stand investigated is managed as coppice with standards, and the trees are felled at an average
rate of once every 15-20 years. The mean age of the trees is between 28 and 30 years old with
bigger seed origin trees almost 55 years old.
2.2.2 Stand measurements (soil moisture, canopy cover and above-ground biomass, tree
stocking density and leaf biomass)
ThetaProbe type ML2 Delta-T Devices were used to record the volumetric soil moisture
content (m3 m-3) by the well established method of responding to changes in the apparent
dielectric constant. On each sampling date, measurements were taken at the soil core sampling
point at three depths (10 cm, 20 cm and 30 cm; hereafter reported as mean 30 cm depth). Soil
was classified according to the USDA keys to Soil Taxonomy (1988). Soil analyses were
carried out according to the SISS (Italian Society of Soil Science) and USDA (United States
Department of Agriculture) standard methods.
In July 2010 canopy cover was measured by hemispherical photos (Rich 1990) analysed
with the Can-eye freeware (www4.paca.inra.fr/can-eye 2011). 10 hemispherical photos per
stand were taken at 7.5-meter intervals along a transect.
Seven selected sampling plots per stand along a 140 m long transect were surveyed to
obtain number of stems, and diameter at breast height (dbh) values. The plots were circular-
shaped with a diameter of 20 m for a total area of 2199 m2. To measure the above-ground
biomass of the stand, in November 2010 we selected four sample trees that represented the
range of tree size for destructive harvesting. The dbh and plant height of each tree were
measured, and the trunks and branches were sliced into sections that measured almost one-
tenth of their respective total length. We measured the total fresh weight of each tree using a
forest skidding tractor and a portable dynamometer. For each tree, the dry weights of two sub-
Chapter II – Study sites and stands characterization
29
samples of trunk and branch at small-end and large-end were determined after oven drying at
70 °C to a constant weight (2-3 weeks). A site-specific allometric relationship (r2= 0.99) was
developed to estimate the woody biomass from the tree dbh. The power equation (2) is:
W=aDb (2)
where W = dry weight D = dbh a =0.193 b = 2.323
Finally, to determine the tree stocking density (number of trees ha-1) of the stands, we
counted the total number of trees in an area measuring 100x100 meters.
In order to estimate leaf biomass, 10 litter traps where placed in July 2010 at 7.5-meter
intervals along a transect (Finotti et al. 2003). Leaves where sampled at the end of November
2010 after leaf shedding, dried and weighed.
2.2.3 Above-ground stand characteristics
As shown in Table 2.2, stem density was higher in the Turkey-oak stand than in the
beech stands, whereas dbh and height were smaller. The above-ground biomass value was
intermediate between those of the 1994 Conversion stand and the 2004 Conversion stand.
There was a total canopy cover more than 95%.

Chapter II – Study sites and stands characterization
30
Table 2.2 Vegetation and soil features of the survey site
Soil
Layer depth
(cm) Texture Ph H2O C/N
N
(g kg-1)
P
(ppm)
K
(ppm)
Organic matter
(g kg-1)
A (0-7) Clay 8.4 8.2 0.9 2.9 180.4 13.0
C1 (7-30) Silty clay 8.6 7.5 0.4 2.3 124.8 5.1
Vegetation
Tree number
(stem per Ha-1)
Above-ground biomass
(Mg ha-1)
Leaf biomass
(Mg ha-1)
Canopy cover (%)
Mean dbh
(cm)
Mean tree height
(m)
1735 ±106 106.4 ±9.2 3.0 ±0.1 95.6 ±0.4 9.4 ±0.6 8.35 ±0.4
Vegetation data from all stems over 5 cm diameter in July 2010. All values are mean ±S.E.
Soil features data from Di Iorio et al. (2008)
Chapter II – Study sites and stands characterization
31
2.3 References
Barij N., Stokes A., Bogaard T. and Van Beek R. 2007. Does growing on a slope affect tree
xylem structure and water relations? Tree Physiol., 27:757–764
Di Iorio A., Lasserre B., Petrozzi L., Scippa G.S. and Chiatante D. 2008. Adaptive
longitudinal growth of first-order lateral roots of a woody species (Spartium junceum)
to slope and different soil conditions—upward growth of surface roots. Environ. Exp.
Bot., 63:207–215
IUSS Working Group WRB. 2006. World reference base for soil resources 2006. 2nd
edition, World Soil Resources Reports No. 103. FAO, Rome
Finotti R., Freitas S.R., Cerqueira R. and Vieira M.V. 2003. A Method to Determine the
Minimum Number of Litter Traps in Litterfall Studies. Biotropica 35(3): 419-421
Pignatti S. 1982. Flora d’Italia. Edagricole, Bologna
Rich P.M. 1990. Characterizing plant canopies with hemispherical photographs. Remote
Sens. Rev. 5: 13–29
Van Beek R., Cammeraat L.H. and Dorren L.K.A. 2001. Eco-engineering and
Conservation of Slopes for Long-term Protection from Erosion, Landslides and
Storms. FIELD REPORT
www4.paca.inra.fr/can-eye 2011
32
Chapter III
Effect of forest management on fine roots in Fagus sylvatica L. stands
There is an intrinsic difficulty in modelling carbon allocation in the below-ground
compartment with respect to the above-ground compartment. Firstly, it is highly labour-
intensive, and secondly, models must include a variety of internal (e.g., genotype of plant
species) and external (e.g., temperature, precipitation, soil properties, nutrient availability and
competition between plants) factors (Majdi et al. 2005). A major external factor is the effect of
anthropological action on the forest including management practices (Rötzer et al. 2010).
Interestingly, a recent review of root biomass data of the three main types of North-European
beech ecosystems demonstrated that the fine-root biomass undergoes considerable
fluctuations in relation to above-ground characteristics (Finer et al. 2007). Moreover, various
studies have shown that forest use intensity and disturbance has a profound impact on fine-
root standing mass, fine-root growth rate and fine-root turnover (Chertov et al. 2005;
Leuschner et al. 2008).
In an attempt to shed light on this issue, we investigated how fine-root compartment
reacts to management practices, which have intensified in recent years consequent to regional
and governmental policy to convert most of these forests from a coppice to a high-standard
condition.

Chapter III – Effect of forest management on fine roots in Fagus sylvatica L. stands
33
3.1 Materials and methods
3.1.1 Fine-root measurements
Fine-root biomass (d < 2 mm) was determined in soil cores (Vogt and Persson 1991).
In each stand, four permanent 10-m2 plots were established. Each plot was the centre of a
circular-shaped plot with a 20 m diameter where above-ground characteristics were also
measured. Two soil cores (4 cm diameter × 30 cm deep) were randomly collected in each plot
using a motor-driven portable core sampler (adapted from Ponder Jr. and Alley 1997). In this
study, we established sampling times in relation to the growing seasons of beech forests and
when the soil was free of snow. Therefore, the kinetics of biomass and necromass variation
was investigated from May to October 2008 by collecting core samples approximately every
30 days. Because of snow cover, during winter period experimental site was very difficult to
reach, therefore we couldn’t sample. As already observed by other authors (Claus and George
2005; Crider F.J. 1928), we assumed that fine-root production and decomposition are low
during winter season. Therefore in order to evaluate root biomass present throughout the
winter and to conclude our annual experiment, in April 2009 after snowmelt core samples
were collected. Each core sample was divided into three portions according to the depth from
the soil surface: 0-10 cm (including the first 2/3 cm of humus layer), 10-20 cm and 20-30 cm.
Mean distance between plots was 50 meters, six- to ten fold the distance between trees in all
stands.
Samples were stored in plastic bags at 4°C until processed. For processing, each
sample was placed in a nylon bag (300 µm mesh) that was contained in a plastic cylinder (6
mm mesh) and washed automatically using a washing machine. We distinguished beech roots
from other understory roots by identifying morphological characteristics at the microscope.
The morphological characteristics of beech fine roots were previously established from
samples dug near the stem. Beech fine roots were reddish and stiffer than the understorey

Chapter III – Effect of forest management on fine roots in Fagus sylvatica L. stands
34
roots (herbaceous). Moreover, the fine roots of F. sylvatica were classified “live” (relate dry
weight hereafter termed biomass) or “dead” (relate dry weight hereafter termed necromass)
depending on their colour, texture and shape (Vogt and Persson 1991). Live roots were
resilient, translucent, and white to tan; dead roots fragmented easily, were dull, and gray to
black. The reliability of the criteria we used was confirmed by observations at the binocular
microscope. These visual and manual criteria were based on readily observable morphological
features. These criteria yielded reproducible results providing a practical approach to
classifying roots on the scale required by this study. The roots freed from soil were scanned at
a resolution of 400 dpi with a calibrated flatbed scanner coupled to a lighting system for
image acquisition (Epson Expression 10000 XL). Afterwards they were separately oven-dried
and weighed. Fine-root images were analysed by the WinRhizo Pro V. 2007d software
(Regent Instruments Inc., Quebec, Canada) to obtain length and diameter. The following root
traits were determined for each stand: (1) annual mean live (LFRM g m-2) and dead (DFRM;
g m-2) fine-root dry mass; (2) fine-root biomass and necromass seasonal pattern; (3) fine-root
annual production (FRP, g m-2 yr-1) and turnover rate (yr-1); (4) fine-root depth distribution.
In a recent work carried in a Fagus-Quercus mixed forest, Hertel and Leuschner
(2002) compared different methods and found that minimum-maximum would yield a more
realistic result (25% overestimation). We estimated FRP using the 'minimum-maximum
method’ procedure (Edwards and Harris 1977; McClaugherty et al. 1982) considering only
significant differences between maximum and minimum for each soil layer. Rates of biomass
turnover were calculated as Annual Root Production divided by Maximum Standing Biomass
(Gill and Jackson 2000).
Chapter III – Effect of forest management on fine roots in Fagus sylvatica L. stands
35
3.1.2 Statistical analysis
To compare three beech stands with differing forest management practices, permanent
plots were established within each stand, and considered independent replicates. This is a
point comparison approach rather than a replicated experiment on the ecosystem scale. The
effects of forest management on fine-root biomass and necromass were evaluated for the
whole 0-30 cm soil depth and at three different soil depths (0–10 cm, 10–20 cm, and 20–30
cm). For the whole 0-30 cm soil depth, fine-root biomass, necromass and production were
calculated by summing values obtained from all soil layers. Data were not normally
distributed nor did they meet the assumption of homoschedaticity. A non parametric Mann-
Whitney U two-sample test with a 5% rejection level was used to test for significant
differences between stands (annual mean fine-root biomass and necromass, total mean fine-
root mass per number of stems), soil layers and fine-root mass at two sampling dates.
Statistical analysis was performed with SPSS software package version 12.0 (SPSS Inc,
Chicago IL, USA).
3.2 Results
3.2.1 Fine-root standing mass and seasonal pattern
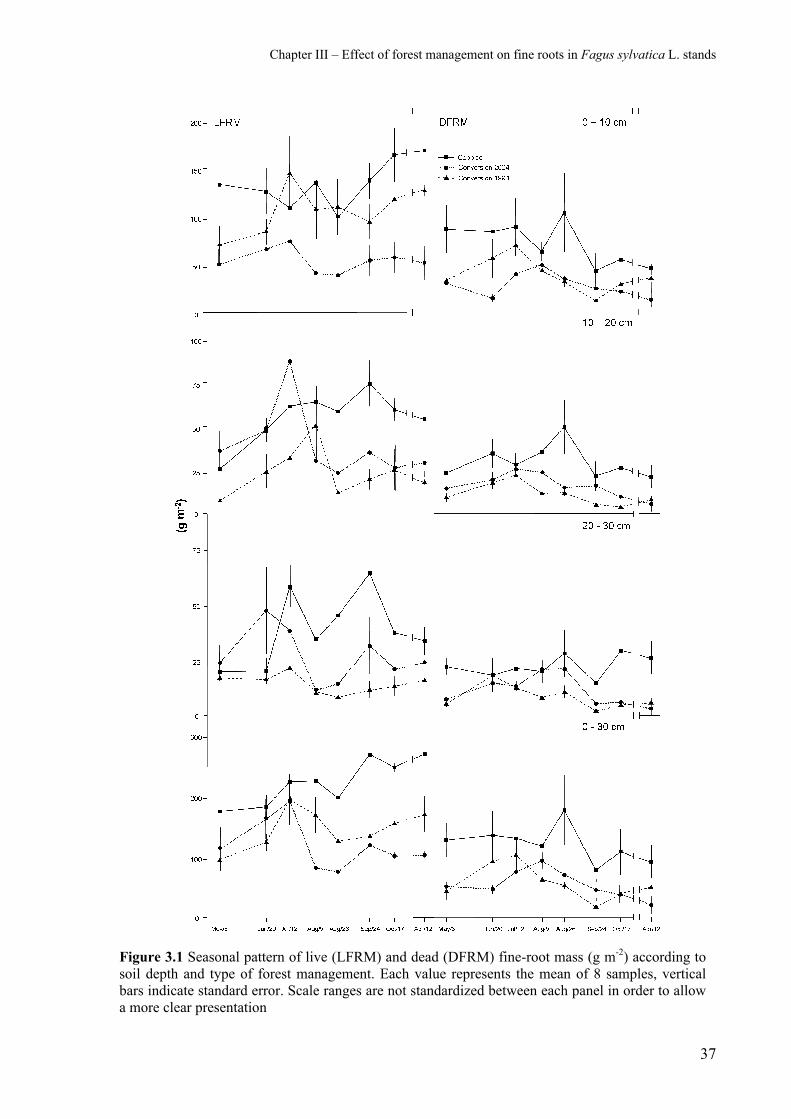
Figure 3.1 shows the seasonal variations of standing mass of live (LFRM) and dead
(DFRM) fine roots in the three stands and at three different soil depths. In the case of LFRM,
there was a bimodal pattern in almost all the conditions examined with the formation of two
peaks that became more evident when standing mass was examined at greater depths.
However, the timing of peak formation differed in the three stands in June-July and in
September-October. In the case of DFRM, there was only one clearly evident peak, which
occurred at the end of August (and at all the soil-depths examined) in the Coppice stand. Both
1994 and 2004 Conversion stands showed a slight increase, albeit not a peak, in July and

Chapter III – Effect of forest management on fine roots in Fagus sylvatica L. stands
36
August respectively. This was more evident at a soil depth of 0-30 cm. For each single layer,
a slight increase was evident only at 0-10 cm and at 20-30 cm in the case of the 2004
Conversion stand. Moreover, only in the case of the Coppice stand a second increase in
DFRM values was found in October at a soil depth of 20-30 cm. The annual mean LFRM and
DFRM, expressed as the sum of the three depths considered, was significantly higher in the
Coppice stand (Mann-Whitney U test, p <0.05; Table 2) than in either of the two Conversion
stands. Biomass was significantly higher in the 1994 Conversion stand than the 2004
Conversion stand, while necromass did not show significant difference.
The fine-root biomass per tree was calculated by dividing the fine-root biomass per
hectare by the stem number per hectare. The results showed a significantly higher value (p <
0.05) for both Conversion stands (2004, 7.15 ±0.6 kg stem-1; 1994, 5.19 ±0.5 kg stem-1 – data
not shown) than for the Coppice stand (3.18 ±0.2 kg stem-1 – data not shown). The fine-root
biomass per tree did not differ between Conversion stands (p = 0.06). Moreover, when above-
ground stand characteristics such as stem density per hectares were compared with fine-root
biomass we found that fine-root biomass increased as stand stem density increased (Fig. 3.2).
Chapter III – Effect of forest management on fine roots in Fagus sylvatica L. stands
37
Figure 3.1 Seasonal pattern of live (LFRM) and dead (DFRM) fine-root mass (g m-2) according to soil depth and type of forest management. Each value represents the mean of 8 samples, vertical bars indicate standard error. Scale ranges are not standardized between each panel in order to allow a more clear presentation

Chapter III – Effect of forest management on fine roots in Fagus sylvatica L. stands
38
Analysed separately, the biomass of both live and dead fine roots decreased significantly with
depth (Tab. 3.1). Indeed, a mean of 59% (biomass) and 58% (necromass) of the total value
Table 3.1 Annual mean fine-root biomass and necromass of three forest management treatments in the 0-10, 10-20 and 20-30 cm soil layer. Profile 0-30 values are sums of each soil layer. Values are means of 32 samples ±S.E.
Coppice stand Conversion 1994 stand Conversion 2004 stand
Soil depth
LFRM (g m-2)
DFRM (g m-2)
LFRM (g m-2)
DFRM (g m-2)
LFRM (g m-2)
DFRM (g m-2)
0-10 135.4 ±8.9 ax
71.5 ±8.9 ax 106.5
±9.1 bx 38.7
±5.3 bx 53.6 ±5.7 cx
28.9 ±3.0 bx
10-20 55.8 ±4.1 ay
30.1 ±3.2 ay 23.9
±3.8 by 11.5
±1.3 by 39.5 ±4.3 cx
16.4 ±2.0 by
20-30 38.8 ±4.1 az
22.2 ±2.5 az 14.4
±1.7 by 8.6
±1.2 bz 26.4 ±3.8 cy
11.4 ±1.6 bz
Profile 0-30
230.0 ±17.2 a
123.8 ±14.6 a 144.8
±14.7 b 58.8
±7.8 b 119.4 ±13.7 c
56.8 ±6.6 b
a, b and c indicate significant differences between forest management treatments within the same soil depth (Mann-Whitney U test, p < 0.05). x, y and z indicate significant differences between soil depth within the same forest management treatment (Mann-Whitney U test, p < 0.05)
Figure 3.2 Relation between stem density (number of stems Ha-1) and fine-root biomass (g m-2). Each point represents a sampling plot. Above-ground characteristics were measured around each plot by circular-shaped area with 20-m diameter. Fine-root biomass for each sampling plot is the mean of 16 samples (from May 2008 to April 2009) ± S.E.

Chapter III – Effect of forest management on fine roots in Fagus sylvatica L. stands
39
was concentrated in the uppermost soil layer (0-10 cm). In the 1994 Conversion stand the
remaining value was equally distributed between the other two soil layers, whereas in the
2004 Conversion stand and the Coppice stand, the values in the other two soil layers
decreased by almost one third that of the upper layer. In the Coppice stand, both live and dead
fine-root mass significantly differed between soil layers. In the 2004 Conversion stand, the
live mass in the first layer (0-10 cm) did not differ significantly to the second layer (10-20
cm) and both were significantly higher compared to the deepest layer (20-30 cm). In the 1994
Conversion stand, LFRM were significantly higher in the first soil layer than in the two
deeper layers while DFRM significantly differed over all the tree soil layers. Differently, the
percentage of necromass on the total mass (biomass plus necromass) was higher in the deeper
soil layer. In particular, in the 1994 Conversion stand, it increased from 27% in the upper soil
layer to 32% and 60% respectively in the 10-20 cm and 20-30 cm layer. In the Coppice stand,
the necromass percentage slightly increased from 34% in the upper soil layer to 36% in the
deeper layer. Differently, in the 2004 Conversion stand (in which the soil had been recently
disturbed cause the management practices) the necromass percentage was highest in the
uppermost soil layer (35%) then in the lower (30%).
3.2.2 Fine-root production and turnover
The annual FRP in the uppermost soil layers (0-10 cm) was higher in both 1994 and
2004 Conversion stands than in the Coppice stand where zero production was found because
minimum and maximum were not significantly different. Both 1994 and 2004 Conversion
stands showed no significant difference, resulting in a zero production, in the lowest soil layer
(20-30 cm). Where zero production was found, fine-root turnover rate was not given. In the
Coppice stand and the 2004 Conversion stand FRP increased in the middle soil layer,
decreasing at the lower one. The 1994 Conversion stand showed a clear FRP decrease along

Chapter III – Effect of forest management on fine roots in Fagus sylvatica L. stands
40
the three soil depth. Fine-root turnover rate in both Coppice and 1994 Conversion stand did
not vary in the two soil layers where values were given, while the 2004 Conversion stand
showed a slight increase at depth. The annual FRP and fine-root turnover rate of the whole 0-
30 cm depth was different in the three stands. Both FRP and turnover were lower in the
Coppice stand and higher in the 1994 Conversion stand, with intermediate values for the 2004
Conversion stand (Table 3.2).
Table 3.2 Seasonal maximum and minimum of fine-root dry mass (biomass and necromass), net annual fine-root production (FRP) (according to minimum-maximum method) and turnover rate (production/seasonal maximum fine-root biomass) of three forest management treatments in the 0-10, 10-20 and 20-30 cm soil layers. Profile 0-30 FRP and seasonal maximum fine-root biomass are sums of each soil layer. Profile 0-30 turnover rate means are weighted means
Fine-root biomass and necromass (g m-2)
Soil depth Seasonal minimum
Seasonal maximum
Significance of min-max difference1
FRP (g m-2 yr-1)
Seasonal maximum
fine-root biomass (g m-2)
Turnover rate
(yr-1)
Coppice 0-10 180.9 224.0 n.s 0 178.6 _2
10-20 49.2 99.5 * 50.3 74.7 0.67 20-30 38.2 76.3 * 38.1 63.6 0.60
Profile 0-30 88.4 316.9 0.64
Conversion 1994 0-10 87.7 244.6 * 157.0 145.2 1.08
10-20 17.2 71.7 * 54.4 51.4 1.06 20-30 13.5 34.1 n.s 0 21.4 _2
Profile 0-30 211.4 218.0 1.08
Conversion 2004 0-10 62.1 114.0 * 51.9 74.1 0.70
10-20 35.0 112.8 * 77.8 87.1 0.89 20-30 27.1 61.6 n.s. 0 47.1 _2
Profile 0-30 129.7 208.3 0.81 1 * marks significant maximum-minimum difference (p < 0.05) for a given soil layer. 2 No data are given because none of the seasonal differences were significant

Chapter III – Effect of forest management on fine roots in Fagus sylvatica L. stands
41
3.3 Discussion
There is a surge of interest in understanding how management practices affect below-
ground events taking place in a forest. Apart from the obvious scientific interest in the topic,
such studies can have a practical impact given the potential implication for modelling carbon
sequestration. Furthermore, data about the effect of management practices on fine roots will
lead to a more accurate evaluation of the forest carbon stock, which is an indicator of
sustainable forest management (IPCC 2007 www.ipcc.ch; Bakker 1999).
Here we show that at the stand level the general decrease of the total root biomass
observed in the Conversion stands can be related to the reduction of tree density that occurs
during conversion. A coppice stand is usually characterised by a dense distribution of stools
each of which includes a number of stems. During conversion to high forest management,
only one stem in each stool is left to continue growing. This kind of management leads to the
death of roots belonging to the eliminated stools. A higher fine-root biomass: stem number
ratio was observed in both 1994 and 2004 Conversion stands. This suggested that fine-root
biomass production per tree in these stands was higher than in Coppice stand. Management
practices also affect biomass distribution along the soil profile. Indeed, a lack of significant
differences in fine-root mass between soil layers was observed in the Converted stands with
respect to Coppice stand. Therefore, from a practical point of view, derangements caused by
conversion management practices (such as cutting, skid trailing and logging-operations) seem
to result in a temporary stimulation of fine-root emission (as described by Helmisaari et al.
2002) as well as a high soil disturbance which is reflected by fine-root soil distribution (as
described by Gondard et al. 2003, Hartanto et al. 2003). Moreover, it is reasonable to assume
that the stimulation of biomass production observed in the 2004 Conversion stand will
decrease after 10 years given the finding that root mass per tree was higher in 2004

Chapter III – Effect of forest management on fine roots in Fagus sylvatica L. stands
42
Conversion stand than in the 1994 Conversion stand, which has not undergone management
practices in the last 14 years.
When investigating the effect of conversion of a stand from coppice to high forest
management it is necessary to consider that the consequent overall rejuvenation of the stand
would also directly affect the life-cycle of the roots. In this context, both a decrease (Fujimaki
et al. 2007) and an increase of fine-root biomass have been directly related to stand
rejuvenation (Curt and Prevosto 2003) in coniferous and deciduous stands. Our data fits with
the fine-root biomass successional pattern model throughout a forest’s life cycle constructed
by Claus and George (2005). Indeed, the more recent 2004 Conversion stand represents the
first phase after cut with a rapid increase in fine-root production. The 1994 Conversion stand
represents the second phase with a relatively slow decrease in FRP and the Coppice stand
represents the third phase of the model where FRP reach equilibrium together with canopy
closure.
In analogy with fine-root production also fine-root turnover was affected during
conversion from coppice to high forest stand. In fact, there was an increase in fine-root
turnover that probably reflects the need to construct a different type of root system when a
single large stem remains on the stool. Moreover, soil temperature may play an important role
in fine-root dynamics. In the stands of the present study canopy cover increased with tree
density and both of these factors were inversely related to soil temperature. Jackson et al.
(1996) found that within the same plant functional type fine-root turnover rate increased with
increasing of temperature. Our results show that a lower mean soil temperature was associated
with a lower fine-root turnover rate. The turnover rates we obtained are close to those
obtained in other studies (Gill and Jackson 2000).
Majdi et al. (2005) postulated the occurrence of unimodal or bimodal seasonal patterns
in the root life cycle of temperate forests, which could depend on seasonal variations of water
Chapter III – Effect of forest management on fine roots in Fagus sylvatica L. stands
43
and nutrient availability (Coners and Leuschner, 2005). The relation between LFRM and
DFRM peaks reported confirms the occurrence of a bimodal pattern in the life cycle of the
fine-root component in a beech forest. It also suggests that this bimodal pattern is not affected
by the conversion of the stands examined. Furthermore, as found by Mainiero and Kazda
(2006), the match between the seasonal pattern of root mass and the seasonal pattern of soil
temperature and rainfall suggests that both of the environmental factors affect root turnover.
The general decrease of fine-root biomass we found in midsummer might derive from an
increase of soil temperature. Moreover, during this period also rainfall reached the seasonal
minimum with a consequent shortage in water availability. In summer it would have been too
costly for the trees of our stand to continue their normal production and maintenance of root
mass (see, Atkin et al. 2000). This is supported by the occurrence of a second small LFRM
peak in late summer when the temperature decreases and rainfall increases. In addition values
obtained in April 2009 were similar to those obtained at the end of the previous growing
season (October 2008), thereby ruling out variability during the winter. This confirms that the
decline and consequent arrest of new roots production and mortality in the fall coincides with
cold temperature and leaf shedding.
Joslin et al. (2006) hypothesised that a tree’s fine-root system consists of pools of fine
roots of different ages. One pool is very dynamic and has a life span < 1 year (“short-lived”),
and the other has a life span > 1 year (“long-lived”) and consists of older fine roots.
Andersson and Majdi (2005) suggested that the seasonal timing of production might influence
fine-root age. In particular, fine-roots produced in spring have shorter life spans that those
produced later. In our experiments, the difference between the initial and peak values of
biomass is roughly due to a flush of new roots, and the fact that the peak was followed by a
marked decrease suggests that most of these new fine roots are of the “short-lived” type. The
second flush of new roots seems to be less abundant than the first one and is probably formed

Chapter III – Effect of forest management on fine roots in Fagus sylvatica L. stands
44
mainly by “short-lived” fine roots because also this second peak lasts only a few weeks. If
this hypothesis is valid, the amount of fine roots present during winter could represent the
portion of the root system classifiable as “long-lived” fine roots. Consequently, the increment
in the amount of fine roots between the beginning and the end of the vegetative season would
represent the yearly production of “long-lived” fine roots.
3.4 Acknowledgements
I’m grateful to Dr. Antonio Montagnoli, Dr. Samanta Riva and Dr. Antonino Di Iorio
for their valuable help in the field and laboratory work, to Professor Donato Chiatante for his
valuable comments and suggestions. I thank Dr. Davide Beccarelli and Dr. Lorenzo Guerci
from Consorzio Forestale “Lario Intelvese” for helping with the field work and data on forest
management. This work was supported by the Italian Ministry of Environment as part of the
research project “Trees and Italian forests, sinks of carbon and biodiversity, for the reduction
of atmospheric CO2 and improvement of environmental quality”. The authors are also
indebted to the Italian Botanic Society Onlus for supporting this research.
Chapter III – Effect of forest management on fine roots in Fagus sylvatica L. stands
45
3.5 References
Andersson P. and Majdi H. 2005. Estimating median root longevity at sites with long winter
time – Does median reflect the root turnover?. Plant Soil, 276:9-14
Atkin O.K., Edwards E.J. and Loveys B.R. 2000. Response of root respiration to changes
in temperature and its relevance to global warming. New. Phytol. 147:141-154
Bakker M.R. 1999. Fine-root parameters as indicators of sustainability of forest ecosystems.
For. Ecol. Manage. 122:7-16
Chertov O., Komarov A., Mikhailov A., Andrienko G., Andrienko N. and Gatalsky P.
2005. Geovisualization of forest simulation modelling results: A case study of carbon
sequestration and biodiversity. Comput. Electron. Agric. 49:175-191
Claus A. and George E. 2005. Effect of stand age on fine-root biomass and biomass
distribution in three European forest chronosequences. Can. J. For. Res. 35:1617-
1625
Coners H. and Leuschner C. 2005. In situ measurements of fine root water absorption in
three temperate tree species – temporal variability and control by soil and
atmospheric factors. Basic and Applied Ecology 6:395-405
Crider F.J. 1928. Winter root growth of plants. Science, Vol. LXVIII 1765:403-404
Curt T. and Prevosto B. 2003. Rooting strategy of naturally regenerated beech in Silver
birch and Scots pine woodlands. Plant Soil 255:265-279
Edwards N.T. and Harris W.F. 1977. Carbon cycling in a mixed deciduous forest floor.
Ecology 58:431-437
Finer L., Helmisaari H.S., Lohmus K., Majdi H., Brunner I., Børja I., Eldhuset T.,
Godbold D., Grebenc T., Konopka B., Kraigher H., Mottonen M., Ohashi M.,
Oleksyn J., Ostonen I., Uri V. and Vanguelova E. 2007. Variation in fine root
Chapter III – Effect of forest management on fine roots in Fagus sylvatica L. stands
46
biomass of three European tree species: Beech (Fagus sylvatica L.), Norway spruce
(Picea abies L. Karst.), and Scots pine (Pinus sylvestris L.). Plant. Biosyst. 141:394-
405
Fujimaki R., Tateno R. and Tokuchi N. 2007. Root development across a chronosequence
in a Japanese cedar (Cryptomeria japonica D. Don) plantation. J. For. Res. 12:96–
102
Gill A.R. and Jackson R.B. 2000. Global patterns of root turnover for terrestrial
ecosystems. New. Phytol. 147:13-31
Gondard H., Romane F., Aronson J. and Shater Z. 2003. Impact of soil surface
disturbances on functional group diversity after clear-cutting in Aleppo pine (Pinus
halepensis) forests in southern France. For. Ecol. Manag. 180:165–174
Hartanto H., Prabhub R., Widayatc A.S.E. and Asdakd C. 2003. Factors affecting runoff
and soil erosion: plot-level soil loss monitoring for assessing sustainability of forest
management. For. Ecol. Manag. 180:361–374
Helmisaari H.S., Makkonen K., Kellomäki S., Valtonen E. and Mälkönen E. 2002.
Below- and above-ground biomass, production and nitrogen use in Scots pine stands
in eastern Finland. For. Ecol. Manag. 165:317-326
Hertel D. and Leuschner C. 2002. A comparison of four different fine root production
estimates with ecosystem carbon balance data in a Fagus–Quercus mixed forest. Plant
Soil 239: 237-251
Jackson R.B., Mooney H.A. and Schulze E.D. 1996. A global budget for fine-root biomass,
surface area, and nutrient contents. Proc. Nat. Acad. Sci. USA 94:7362-7366
Joslin J.D., Gaudinski J.B., Torn M.S., Riley W.J. and Hanson P.J. 2006. Fine-root
turnover patterns and their relationship to root diameter and soil depth in a 14 C-
labeled hardwood forest. New Phytol. 172:523-535

Chapter III – Effect of forest management on fine roots in Fagus sylvatica L. stands
47
Leuschner C., Harteveld M. and Hertel D. 2008. Consequences of increasing forest use
intensity for biomass, morphology and growth of fine roots in a tropical moist forest
on Sulawesi, Indonesia. Agric. Ecosyst. Environ. 129: 474–481
Mainiero R. and Kazda M. 2006. Depth-related fine root dynamics of Fagus sylvatica
during exceptional drought. For. Ecol. Manag. 237:135-142
Majdi K., Pregitzer K.S., Moren A.S., Nylund J.E. and Agren G.I. 2005. Measuring fine-
root turnover in forest ecosystems. Plant Soil 276:1-8
McClaugherty C.A., Aber J.D. and Melillo J.M. 1982. The role of fine roots in the organic
matter and nitrogen budgets of two forested ecosystems. Ecology 63:1481-1490
Ponder F.Jr. and Alley D.E. 1997. Soil sampler for rocky soils. Res. Note NC-371. USDA
Forest Service North Central Forest Experiment Station, St. Paul, MN. 5 pp
Rötzer T., Dieler J., Mette T., Moshammer R. and Pretzsch H. 2010. Productivity and
carbon dynamics in managed Central European forests depending on site conditions
and thinning regimes. Forestry 83: 483-496
Vogt K.A. and Persson H. 1991. Root methods. In Lassoie J.P. and Hinckley T.M. (eds)
Techniques and Approaches in Forest Tree Ecophysiology. CRC Press Boca Raton,
Florida USA pp 477-502
www.ipcc.ch - IPCC Fourth Assessment Report (AR4) Climate Change 2007: Mitigation of
Climate Change

48
Chapter IV
Forest management and its effect on carbon and nitrogen concentration in
fine roots of beech (Fagus sylvatica L.)
Conversion to high forest results in considerable alteration of almost all micro-
environmental factors that characterized the coppice stand. Various studies have shown that
increase in canopy opening size causes an increase of both seasonal average soil temperatures
and soil temperature extremes (Liechty et al. 1992, Hashimoto and Suzuky 2004). The
seasonal and daytime–night-time differences in average maximum-minimum air temperatures
are increased 15 cm above the soil surface consequent to canopy opening (Carlson and Groot
1997).
In the attempt to shed some light on the effects of conversion, we studied the effect of
conversion of a coppice stand to high-standard management on the below-ground biomass,
particularly the fine-root component (roots with a diameter between 0-2 mm). Our rationale
was that fine roots represent the component of a root system that is most sensitive to climate
and microclimate variations (Aussenac 2000, Fotelli et al. 2002), and to stressful conditions
such as drought, competition and herbivory (Lopez et al. 1998, Glen and Robert 2006,
Withington et al. 2006). Moreover, stand conversion induces a decrease in the fine-root
standing biomass (Lopez et al. 2003, Tufekcioglu et al. 2005). In addition, Fotelli et al. (2002,
2004) reported both an increase and a decrease of fine-root biomass in thinned forests,
depending on site exposure, whereas Lopez et al. (2003) confirmed that fine-root production
is positively affected by management operations.

Chapter IV – Effect of forest management on fine-root N and C concentration
49
We found that the conversion of a beech stand from coppice to high forest induces, in
the fine-root component, a decrease of total biomass and an increase of turnover rate. We also
found that fine-root biomass production is transiently stimulated by conversion (see chapter
III). Taken together, our earlier findings suggest that the fate of fine roots after conversion is
factor to be considered in the measurement of a forest carbon stock that will be used as an
indicator of sustainable forest management (http://www.sfmindicators.org/ 2011).
In this chapter we focus on carbon and nitrogen concentrations in fine roots. The C
concentration of fine roots is associated with construction costs (Gordon and Jackson 2000,
Guo et al. 2004) whereas N concentration is associated with their metabolic activity,
respiration and root longevity (Ryan 1991, Pregitzer et al. 1998, Withington et al. 2006).
Furthermore, the C:N ratio could provide an indication of the fine-root life-span (Withington
et al. 2006).
4.1 Materials and methods
4.1.1 Fine-root measurements
Fine roots were collected at different soil depths using a motor-driven portable root
soil core sampler (adapted from Ponder and Alley 1997) during the 2009 growing season
(between May and October). In each stand, a permanent 10 m2 plot was set. Two soil cores (4
cm diameter x 30 cm deep) were randomly collected in each plot. Samples were taken when
the soil was free of snow cover. Fine roots were sampled on six dates approximately every 30
days for a total of 36 cores (2 cores x 3 stands x 6 collecting dates). The soil cores were
separated into three soil layers: 0-10 cm including the humus layer (0- 2/3 cm), 10-20 cm and
20-30 cm from the soil surface. Samples were stored in plastic bags at 4°C until processed.
Each sample was washed automatically in a filtering nylon bag (300 µm mesh) using a
washing machine (adapted from Benjamin and Nielsen 2004).
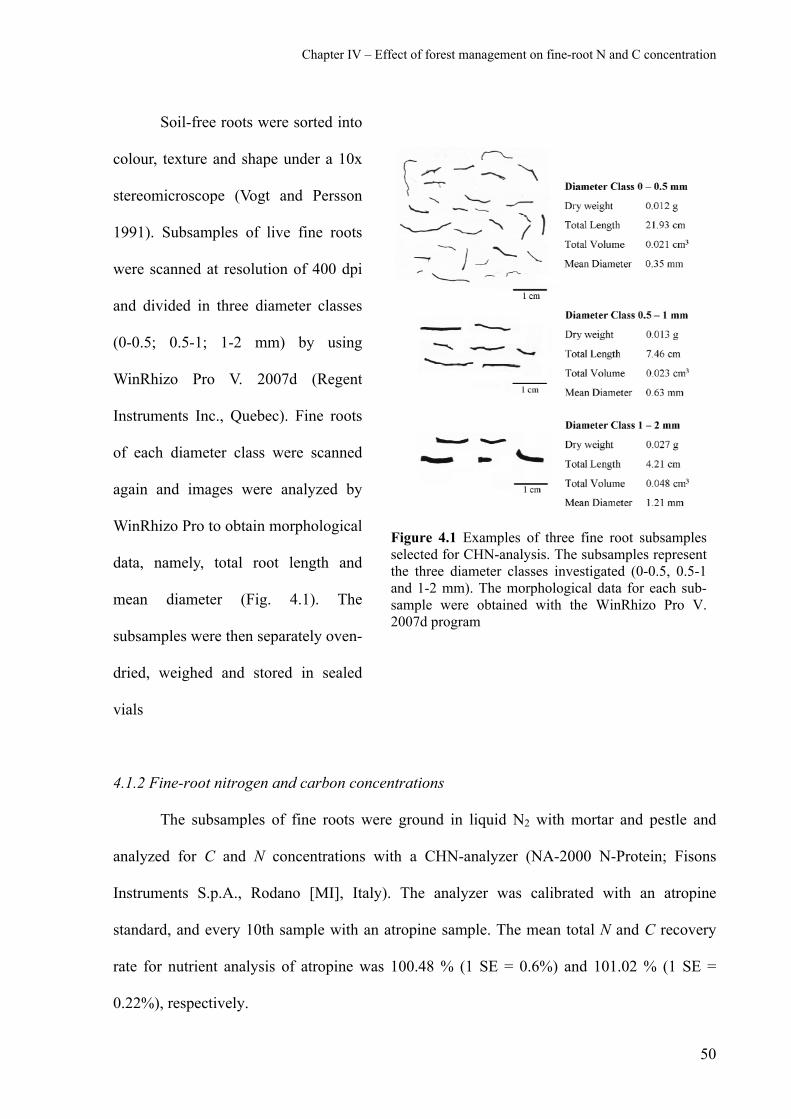
Chapter IV – Effect of forest management on fine-root N and C concentration
50
Soil-free roots were sorted into
colour, texture and shape under a 10x
stereomicroscope (Vogt and Persson
1991). Subsamples of live fine roots
were scanned at resolution of 400 dpi
and divided in three diameter classes
(0-0.5; 0.5-1; 1-2 mm) by using
WinRhizo Pro V. 2007d (Regent
Instruments Inc., Quebec). Fine roots
of each diameter class were scanned
again and images were analyzed by
WinRhizo Pro to obtain morphological
data, namely, total root length and
mean diameter (Fig. 4.1). The
subsamples were then separately oven-
dried, weighed and stored in sealed
vials
4.1.2 Fine-root nitrogen and carbon concentrations
The subsamples of fine roots were ground in liquid N2 with mortar and pestle and
analyzed for C and N concentrations with a CHN-analyzer (NA-2000 N-Protein; Fisons
Instruments S.p.A., Rodano [MI], Italy). The analyzer was calibrated with an atropine
standard, and every 10th sample with an atropine sample. The mean total N and C recovery
rate for nutrient analysis of atropine was 100.48 % (1 SE = 0.6%) and 101.02 % (1 SE =
0.22%), respectively.
Figure 4.1 Examples of three fine root subsamples selected for CHN-analysis. The subsamples represent the three diameter classes investigated (0-0.5, 0.5-1 and 1-2 mm). The morphological data for each sub-sample were obtained with the WinRhizo Pro V. 2007d program
Chapter IV – Effect of forest management on fine-root N and C concentration
51
4.1.3 Statistical analysis
Statistical analyses were carried out using the SPSS software package version 12.0
(SPSS Inc, Chicago IL, USA). C:N ratio data did not meet the normal distribution and
homoscedasticity. A logarithm transformation produced normal distributions and equal
variances, and were therefore analysed using normal parametric statistics. It was not
necessary to transform fine-root N and C concentration data. Analysis of variance (4-way
ANOVA) was performed to assess the effects of diameter class (0-0.5; 0.5-1.0; 1.0-2.0 mm),
depth (0-10; 10-20; 20-30 cm), management (Coppice; 1994 Conversion; 2004 Conversion)
and time (six sampling times). A Bonferroni test with a 5% rejection level was used to detect
significant differences between stands, soil depth and diameter class. Mean sub-sample root
diameters were included as covariates into the 4-way ANOVA for each diameter class.
4.2 Results and discussion
We measured N and C concentrations in fine roots in three beech stands: one
maintained as coppice; the other two had been converted to high forest (in 1994 and 2004,
respectively) but had a different tree density. Conversion resulted in a decrease in tree density
in the 2004 Conversion stand, whereas tree density in the 1994 Conversion stand was
intermediate between that of Coppice and the 2004 Conversion stand. The decrease in tree
density increased light and soil temperature within the stand (see Tab. 2.1), but we cannot
exclude that the reduced tree density also affected other environmental factors. Given the
amount of variations introduced in stands during conversion, it is conceivable these changes
could have affected N and C concentrations in fine roots.
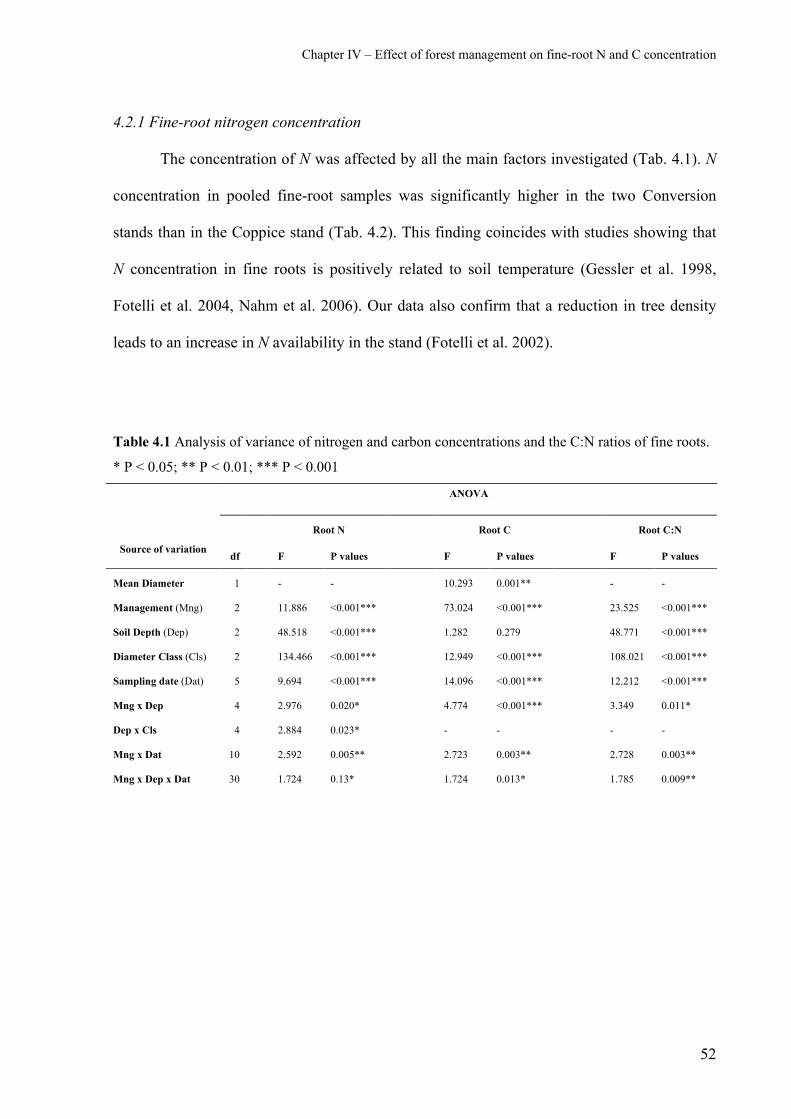
Chapter IV – Effect of forest management on fine-root N and C concentration
52
4.2.1 Fine-root nitrogen concentration
The concentration of N was affected by all the main factors investigated (Tab. 4.1). N
concentration in pooled fine-root samples was significantly higher in the two Conversion
stands than in the Coppice stand (Tab. 4.2). This finding coincides with studies showing that
N concentration in fine roots is positively related to soil temperature (Gessler et al. 1998,
Fotelli et al. 2004, Nahm et al. 2006). Our data also confirm that a reduction in tree density
leads to an increase in N availability in the stand (Fotelli et al. 2002).
Table 4.1 Analysis of variance of nitrogen and carbon concentrations and the C:N ratios of fine roots.
* P < 0.05; ** P < 0.01; *** P < 0.001
ANOVA
Root N Root C Root C:N
Source of variation df F P values F P values F P values
Mean Diameter 1 - - 10.293 0.001** - -
Management (Mng) 2 11.886 <0.001*** 73.024 <0.001*** 23.525 <0.001***
Soil Depth (Dep) 2 48.518 <0.001*** 1.282 0.279 48.771 <0.001***
Diameter Class (Cls) 2 134.466 <0.001*** 12.949 <0.001*** 108.021 <0.001***
Sampling date (Dat) 5 9.694 <0.001*** 14.096 <0.001*** 12.212 <0.001***
Mng x Dep 4 2.976 0.020* 4.774 <0.001*** 3.349 0.011*
Dep x Cls 4 2.884 0.023* - - - -
Mng x Dat 10 2.592 0.005** 2.723 0.003** 2.728 0.003**
Mng x Dep x Dat 30 1.724 0.13* 1.724 0.013* 1.785 0.009**

Chapter IV – Effect of forest management on fine-root N and C concentration
53
Previous studies showed that the N concentration in fine roots is directly related to their
metabolic activity and respiration, and inversely to their longevity (Ryan 1991, Pregitzer et al.
1998, Withington et al. 2006). Therefore, our finding that N concentrations were significantly
higher in the two Conversion stands than in the Coppice stand suggests that the environmental
variations introduced by conversion are responsible for the increased metabolic activities of
fine roots, which in turn, would lead to an acceleration of their growth rate (Valverde-
Barrantes et al. 2007) and a shorting of their life-span. This hypothesis is consistent with our
previous findings (chapter three) that the fine-root turnover rate increases, and consequently
the life-span decreases, as a result of conversion operations.
It has been suggested that N concentration is related to root diameter and it seems that
the concentration is highest in the thinnest root branches (Gordon and Jackson 2000, Li et al.
2010) located in the uppermost soil layer (Pregitzer et al. 1998). We have limited our
investigation to fine roots with a maximum diameter of 2 mm and have divided them into
three diameter classes. Although we do not know whether functional differences exist
between these three diameter classes, we cannot exclude that, also in our case, fine roots with
a diameter between 0.0 and 0.5 mm could play a role in N uptake function as suggested by
Hishi (2007) and Guo et al. (2008). If this is the case, we could speculate that fine roots
Table 4.2 Pooled values of fine-root N and C concentrations and the C:N ratio between stands. Values
are the means of 108 replicates ± 1 SE. a, b and c denote comparison among three forest management
differentiated stands (Bonferroni test, P<0.05)
Management N (g kg-1) C (g kg-1) C:N ratio
Coppice 8.5 ± 0.1 a 537.9 ± 1.2 a 65.3 ± 1.0 a
Conversion 1994 8.9 ± 0.1 b 526.9 ± 1.1 b 60.9 ± 0.9 b
Conversion 2004 9.0 ± 0.1 b 528.5 ± 1.0 b 59.8 ± 0.8 b

Chapter IV – Effect of forest management on fine-root N and C concentration
54
belonging to the two thicker diameter classes might play a role in transport and storage (Hishi
2007, Guo et al. 2008).
We evaluated N concentrations of fine roots belonging to the three different diameter
classes excavated from the three different stands at three different soil depths (Tab. 4.3). The
concentration of N was highest in fine roots with a diameter between 0.0 and 0.5 mm, which
live in the most superficial (0-10 cm) soil layer. The fine-root N concentration in this
superficial soil layer decreased as root diameter increased (Tab. 4.3). The decrease of N
concentration with the increase of fine-root diameter was confirmed at the other two soil
depths. Diameter class showed a statistical interaction with soil-depth (Tab. 4.1). Irrespective
of stands, the fine roots of the 0.0-0.5-mm diameter class, but not those of the 1.0-2.0-mm
class, had different N concentrations at different soil depths (Tab. 4.3). This result is in
agreement with that reported by Pregitzer et al. (1998). The sensitivity of fine roots of the 0.0-
0.5-mm-diameter class remains to be determined and could be related to their uptake function,
which means fine roots are more sensitive to changes in soil features than thicker roots.
Table 4.3 Fine-root N concentration of three diameter classes. Values refer to three soil depths each
10-cm thick and three different forest management stands. Each value represents a mean of 12 samples
± 1 SE. a, b and c denote comparison between stands within the same diameter class and depth
(Bonferroni test, P<0.05). x, y and z denote comparison among soil depths within the same
management and diameter class (Bonferroni test, P<0.05)
Diameter class 0 – 0.5 mm Diameter class 0.5 – 1 mm Diameter class 1 – 2 mm
Management Management Management Soil
depth (cm)
Coppice (g kg-1)
Conversion 1994
(g kg-1)
Conversion 2004
(g kg-1)
Coppice (g kg-1)
Conversion 1994
(g kg-1)
Conversion 2004
(g kg-1)
Coppice (g kg-1)
Conversion 1994
(g kg-1)
Conversion 2004
(g kg-1)
0 - 10 10.3 ± 0.3 ax
10.6 ± 0.3 ax
11.2 ± 0.3 ax 9.7
± 0.4 ax 9.0
± 0.3 ax 9.4
± 0.3 ax 8.2 ± 0.4 ax
8.4 ± 0.3 ax
8.1 ± 0.3 ax
10 - 20 8.9 ± 0.2 ay
10.2 ± 0.3 bxy
9.8 ± 0.1 by 8.0
± 0.3 ay 8.8
± 0.2 abxy 8.9
± 0.3 bxy 7.2 ± 0.2 ax
7.9 ± 0.3 abx
8.2 ± 0.2 bx
20 - 30 8.6 ± 0.2 ay
9.3 ± 0.4 by
9.5 ± 0.2 by 8.1
± 0.3 ay 7.9
± 0.2 ay 8.3
± 0.3 ay 7.3 ± 0.4 ax
7.7 ± 0.5 ax
7.8 ± 0.2 ax
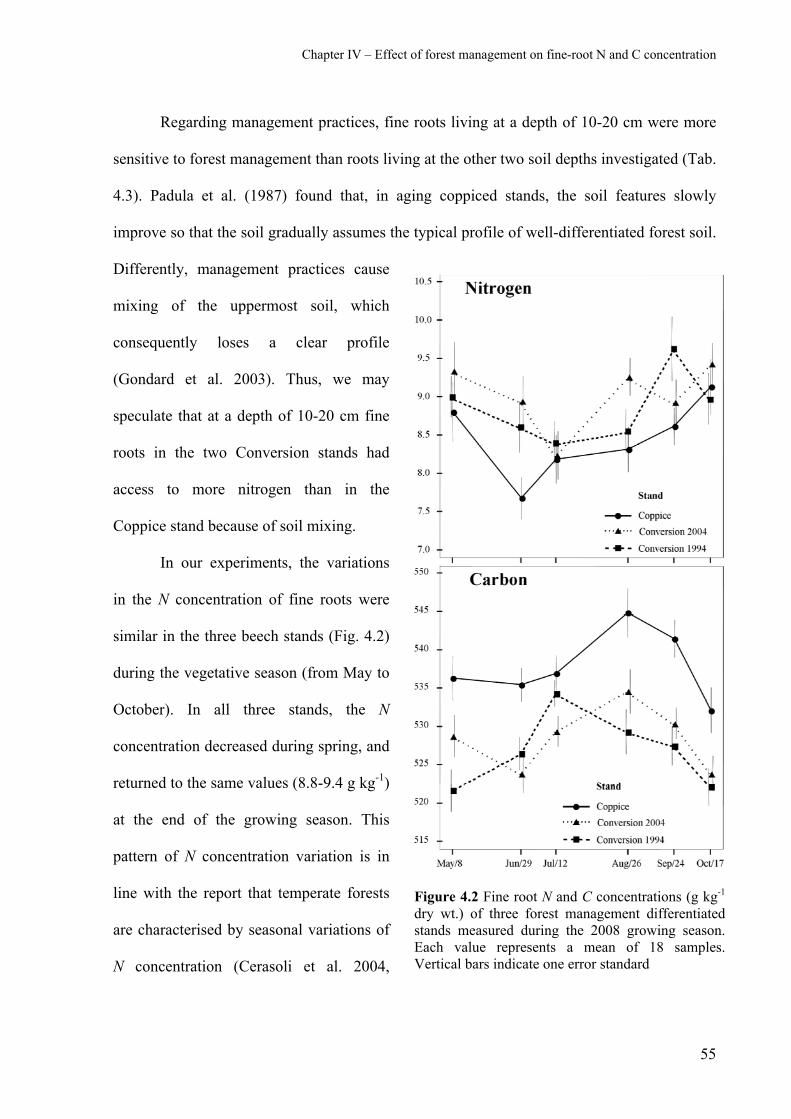
Chapter IV – Effect of forest management on fine-root N and C concentration
55
Regarding management practices, fine roots living at a depth of 10-20 cm were more
sensitive to forest management than roots living at the other two soil depths investigated (Tab.
4.3). Padula et al. (1987) found that, in aging coppiced stands, the soil features slowly
improve so that the soil gradually assumes the typical profile of well-differentiated forest soil.
Differently, management practices cause
mixing of the uppermost soil, which
consequently loses a clear profile
(Gondard et al. 2003). Thus, we may
speculate that at a depth of 10-20 cm fine
roots in the two Conversion stands had
access to more nitrogen than in the
Coppice stand because of soil mixing.
In our experiments, the variations
in the N concentration of fine roots were
similar in the three beech stands (Fig. 4.2)
during the vegetative season (from May to
October). In all three stands, the N
concentration decreased during spring, and
returned to the same values (8.8-9.4 g kg-1)
at the end of the growing season. This
pattern of N concentration variation is in
line with the report that temperate forests
are characterised by seasonal variations of
N concentration (Cerasoli et al. 2004,
Figure 4.2 Fine root N and C concentrations (g kg-1
dry wt.) of three forest management differentiated stands measured during the 2008 growing season. Each value represents a mean of 18 samples. Vertical bars indicate one error standard
Chapter IV – Effect of forest management on fine-root N and C concentration
56
Nahm et al. 2006). Therefore, in analogy with Fotelli et al. (2002) and Millard (1989), we
suggest that also in our beech stands the decrease in N could be associated to utilization of the
N reserve in order to support newly developing tissues. Should this be the case, the increase
observed by us could be associated to restoration of the N-depleted reserves.
4.2.2 Fine-root carbon concentration
Fine-root C concentration was affected by all the main factors investigated
(management, diameter class, sampling date) except soil depth (Tab 4.1). The concentration
of C was significantly higher in the Coppice stand than in either of the Conversion stands
(Bonferroni, P<0.05; Table 2). However, these significant differences among the three stand
managements were more pronounced as regards the thinnest root class (0-0.5 mm; Tab. 4.4).
Previous studies identified considerable differences in C concentration in the fine roots
of different species, and showed that C concentration is related positively to root diameter
(Gordon and Jackson 2000, Pregitzer et al. 2002). In contrast, another study reported that C
concentration was highest in roots with the thinnest diameter (Goldfarb et al. 1990). We found
that C concentration decreased significantly as root diameter increased (Tab. 4.4).
Our finding could be related to an increase in the secondary metabolite content (i.e.,
lignin and tannins) in the thinnest fine roots (Harborne 1980). In fact, secondary metabolites
have a C content higher than compounds like cellulose and other sugars (Chua and Wayman
1979, Krässig, 1993), therefore an increase in secondary metabolites would result in an
increase in total C concentrations. Alternatively, we cannot exclude that a higher C
concentration in the thinnest fine root could derive from a lower cellulose and total-non-
structural carbohydrate (TNC) concentration (Nguyen et al. 1990, Guo et al. 2004).

Chapter IV – Effect of forest management on fine-root N and C concentration
57
Goldfarb et al. (1990) suggested that C concentration in fine roots is higher in early
summer than in spring or autumn. We confirm the significant (Tab. 4.2) variation of C
concentration in fine roots during the year with a peak in July or August depending upon the
type of management (Fig. 4.2). These variations differed with soil depth depending on
management practice (significant management versus sampling date versus soil depth
interaction, Tab. 4.2). The peak of C concentration found by us during summer could be
related to the maximum vegetative activity which requires a reduction of investment in TNC.
This possibility was suggested by Cerasoli et al. (2004) who reported, during the growing
season, the highest C concentration in roots while TNC levels were the lowest. The rapid
decrease of C concentration following the peak could be related to the end of the growing
season and therefore to the need to restore the sugar reserve (Nguyen et al. 1990).
4.2.3 Fine-root C:N ratio
The C:N ratio is considered an indicator of fine-root life-span (Pregitzer et al. 2002,
Tjoelker et al. 2005, Withington et al. 2006). It can also cast light on the relationship between
Table 4.4 Fine-root C concentration of three diameter classes. Values refer to three soil depths each
10-cm thick and three different forest management stands. Each value represents a mean of 12 samples
± 1 SE. a, b and c denote comparison between stands within the same diameter class and depth
(Bonferroni test, P<0.05). h, j and k denote comparison among diameter class within the same
management and soil depth (Bonferroni test, P<0.05)
Diameter class 0 – 0.5 mm Diameter class 0.5 – 1 mm Diameter class 1 – 2 mm
Management Management Management Soil
depth (cm)
Coppice (g kg-1)
Conversion 1994
(g kg-1)
Conversion 2004
(g kg-1)
Coppice (g kg-1)
Conversion 1994
(g kg-1)
Conversion 2004
(g kg-1)
Coppice (g kg-1)
Conversion 1994
(g kg-1)
Conversion 2004
(g kg-1)
0 - 10 551.4 ± 2.3 ah
536.8 ± 2.6 bh
533.3 ± 1.9 bh 540.4
± 2.0 aj 528.3
± 3.1 bj 525.2
± 2.3 bj 527.3 ± 3.3 ak
519.4 ± 1.8 ak
519.7 ± 2.6 aj
10 - 20 548.8 ± 1.4 ah
536.6 ± 2.6 bh
536.8 ± 3.7 bh 538.8
± 3.5 aj 526.6
± 2.0 bj 528.2
± 2.1 bhj 530.1 ± 3.0 aj
518.0 ± 2.6 bk
521.9 ± 1.8 abj
20 - 30 541.7 ± 2.5 ah
534.5 ± 2.0 bh
538.8 ± 3.3 abh 536.2
± 2.2 ah 525.7
± 2.0 bj 530.9
± 2.4 abh 525.9 ± 2.3 aj
515.0 ± 2.7 bk
521.4 ± 2.4 abj
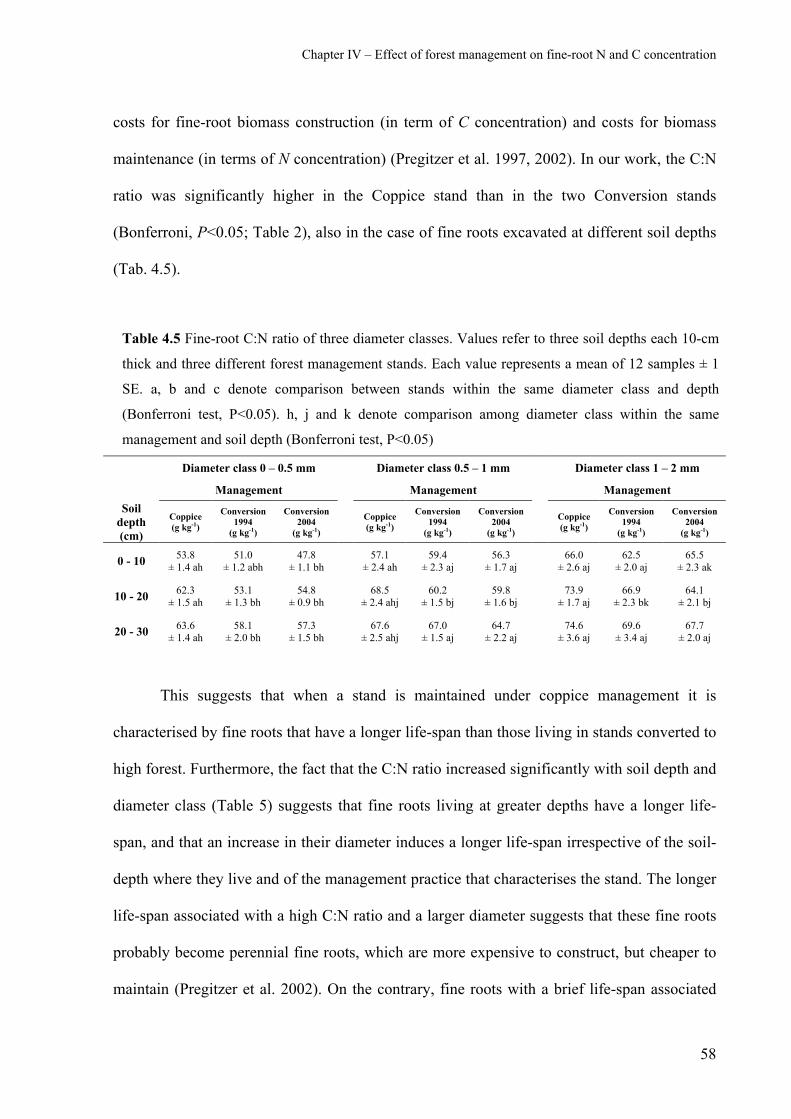
Chapter IV – Effect of forest management on fine-root N and C concentration
58
costs for fine-root biomass construction (in term of C concentration) and costs for biomass
maintenance (in terms of N concentration) (Pregitzer et al. 1997, 2002). In our work, the C:N
ratio was significantly higher in the Coppice stand than in the two Conversion stands
(Bonferroni, P<0.05; Table 2), also in the case of fine roots excavated at different soil depths
(Tab. 4.5).
Table 4.5 Fine-root C:N ratio of three diameter classes. Values refer to three soil depths each 10-cm
thick and three different forest management stands. Each value represents a mean of 12 samples ± 1
SE. a, b and c denote comparison between stands within the same diameter class and depth
(Bonferroni test, P<0.05). h, j and k denote comparison among diameter class within the same
management and soil depth (Bonferroni test, P<0.05)
Diameter class 0 – 0.5 mm Diameter class 0.5 – 1 mm Diameter class 1 – 2 mm
Management Management Management Soil
depth (cm)
Coppice (g kg-1)
Conversion 1994
(g kg-1)
Conversion 2004
(g kg-1)
Coppice (g kg-1)
Conversion 1994
(g kg-1)
Conversion 2004
(g kg-1)
Coppice (g kg-1)
Conversion 1994
(g kg-1)
Conversion 2004
(g kg-1)
0 - 10 53.8 ± 1.4 ah
51.0 ± 1.2 abh
47.8 ± 1.1 bh 57.1
± 2.4 ah 59.4
± 2.3 aj 56.3
± 1.7 aj 66.0 ± 2.6 aj
62.5 ± 2.0 aj
65.5 ± 2.3 ak
10 - 20 62.3 ± 1.5 ah
53.1 ± 1.3 bh
54.8 ± 0.9 bh 68.5
± 2.4 ahj 60.2
± 1.5 bj 59.8
± 1.6 bj 73.9 ± 1.7 aj
66.9 ± 2.3 bk
64.1 ± 2.1 bj
20 - 30 63.6 ± 1.4 ah
58.1 ± 2.0 bh
57.3 ± 1.5 bh 67.6
± 2.5 ahj 67.0
± 1.5 aj 64.7
± 2.2 aj 74.6 ± 3.6 aj
69.6 ± 3.4 aj
67.7 ± 2.0 aj
This suggests that when a stand is maintained under coppice management it is
characterised by fine roots that have a longer life-span than those living in stands converted to
high forest. Furthermore, the fact that the C:N ratio increased significantly with soil depth and
diameter class (Table 5) suggests that fine roots living at greater depths have a longer life-
span, and that an increase in their diameter induces a longer life-span irrespective of the soil-
depth where they live and of the management practice that characterises the stand. The longer
life-span associated with a high C:N ratio and a larger diameter suggests that these fine roots
probably become perennial fine roots, which are more expensive to construct, but cheaper to
maintain (Pregitzer et al. 2002). On the contrary, fine roots with a brief life-span associated

Chapter IV – Effect of forest management on fine-root N and C concentration
59
with a low C:N ratio and a low diameter probably become ephemeral fine roots, which are
cheap to construct, but more expensive to maintain (Pregitzer et al. 2002).
4.3 Acknowledgements
This work was conducted within the framework of the research project “Trees and
Italian forests, sinks of carbon and biodiversity, for the reduction of atmospheric CO2 and
improvement of environmental quality” funded by the Italian Ministry of Environment. I also
acknowledge SBI (Italian Botanic Society Onlus) for supporting this research. I thank Dr.
Alessandra Luzzaro for assistance with the CHN analysis. I also thank Dr. Antonio
Montagnoli for his valuable help in the laboratory work. I’m grateful to Professor Donato
Chiatante and Antonino Di Iorio for their valuable comments and suggestions.
Chapter IV – Effect of forest management on fine-root N and C concentration
60
4.4 References Abramoff M.D., Magalhaes P.J. and Ram S.J. 2004. Image Processing with ImageJ.
Biophotonics International, Vol. 11, 7:36-42
Clowes F.A.L. 1951. The Structure of Mycorrhizal Roots of Fagus sylvatica. New
Phytologist, Vol. 50, 1:1-16
Cochard H., Lemoine D. and Dreyer E. 1999. The effects of acclimation to sunlight on the
xylem vulnerability to embolism in Fagus sylvatica L. Plant, Cell and Environment,
Vol. 22, 1:101–108
Coutts M. P. 1987. Developmental processes in tree root systems. Can. J. For. Res., 17:761-
767
Eissenstat D.M. and Yanai R.D. 1997. The ecology of root life span, Adv. Ecol. Res., 27:1–
60
Fitter A.H. 1991. Characteristics and functions of root systems. In. Waisel Y., Eshel A.,
Kafkafi U. (eds) Plant Roots: the Hidden Half. Marcel Dekker, Inc., New York, pp 3-
25
Gardiner B.A., Stac G..R., Belcher R.E. and Wood C.J. 1997. Field and wind tunnel
assessments of the implications of respacing and thinning for tree stability. Forestry,
70:233-252.
Hishi T. and Takeda H. 2005. Life cycles of individual roots in fine root system of
Chamaecyparis obtuse Sieb. et Zucc. J. For. Res., 10:181-187
O'Brien T.P., Feder N. and McCully M.E. 1964. Polyehromatic Staining of Plant Cell
Walls
by Toluidine Blue O. Protoplasma, Vol. 59, 2:368-373
Parker A.J., Haskins E.F. and Deyrup-Olsen I. 1982. Toluidine Blue: A Simple, Effective
Stain for Plant Tissues. The American Biology Teacher, Vol. 44, 8:487-489
Rasband W.S. 1997-2011. ImageJ. U.S. National Institutes of Health, Bethesda,
Maryland, USA, http://imagej.nih.gov/ij/
Ruess M.G., Hendrick R.L., Burton A.J., Pregitzer K.S., Sveinbjornssön B., Allen M.F.
and Maurer G.E. 2003. Coupling fine root dynamics with ecosystem carbon cycling
in black spruce forest of interior Alaska. Ecol. Monogr., 73:643-662
Sperry J.S. 1993. Winter xylem embolism and spring recovery in Betula cordifolia, Fagus
grandifolia, Abies balsamea and Picea rubens. In Borghetti M., Grace J., Raschi A.

Chapter IV – Effect of forest management on fine-root N and C concentration
61
(eds) Water Transport in Plants under Climatic Stress, Cambridge University Press,
Cambridge, pp. 86-98
Vogt K.A. and Persson H. 1991. Root methods. In Lassoie J.P., Hinckley T.M. (eds).
Techniques and Approaches in Forest Tree Ecophysiology. CRC Press Boca Raton,
Florida USA pp 477-502.
Waisel Y. and Eshel A. 1991. Multiform behaviour of various constituents of one root
system. In. Waisel Y, Eshel A and Kafkafi U eds, Plant Roots: the Hidden Half.
Marcel Dekker, Inc., New York, pp 39-52
Wilcox H. 1964. Xylem in roots of Pinus resinosa Ait. in relation to heterorhizy and growth
activity. In Zimmermann M.H. ed, The Formation of Wood in Forest Trees, Academic
press, 459-478
62
Chapter V
Effects of conversion of old coppice to high forest on anatomy of Fagus
sylvatica L. fine roots
Fine roots (d < 2mm) play an important role in soil dynamics but they are usually
treated all as physiologically identical units. On the contrary, it has been shown (Eissenstat
and Yanai 1997) that fine roots belonging to a single root system show a wide range of
variabilities in regard of seasonality, longevity and chemical composition. These variations
seem to depend upon branching position, diameter size class, or functional role (water
transport, nutrient absorption, mechanical stability) Moreover, it seems that such variability
leads to morphological and anatomical variations (Coutts 1987). This great variability in fine
roots has been described and named “heterorhizy” by von Alten (1909) and Noelle (1910, in
Wilcox 1964) and has been reviewed more recently by Fitter (1991) and by Waisel and Eshel
(1991). Differences among fine roots include also differences in decomposition rates and this
leads to differences in the way fine roots contribute to organic matter accumulation in the soil
(Ruess et al. 2003).
In previous chapters (III, IV) we have compared fine roots collected in various stands
of Fagus sylvatica L. forests subjected to different management practices such as the
conservation of coppicing or the conversion of coppice stand to high forest. The results
presented demonstrate that fine-root dynamics is influenced by forest management; in
particular we have shown that by after forest conversion, fine-root turnover, production and
nitrogen concentration increased and fine-root carbon concentration decreased. The results
presented in the present chapter refer to a histological approach regarding fine roots which

Chapter V – Effect of forest management on fine-root histological traits
63
were sampled from all the three different beech forests considered in the previous chapters. In
this case the aim was to evaluate the possible occurrence of anatomical differences which
could be due to the type of forest management practice applied to a specific stand.
5.1 Material and methods
5.1.1 Fine-roots sampling
Fine roots were collected 19th of July 2010 at different soil depths by means of a hand
auger in. In each stand, three soil cores (8 cm diameter x 30 cm deep) were collected. The soil
cores were then divided into three fraction-layers depending upon the depth: the first (0-10
cm) layer included the humus (0- 2/3 cm); the second and third layer included respectively the
fraction-layers comprised between 10-20 cm and 20-30 cm from the soil surface. Samples
were stored in plastic bags at 4°C until processed. Each sample was washed automatically in a
filtering nylon bag (300 µm mesh) using a washing machine (adapted from Benjamin and
Nielsen 2004).
Soil-free roots were sorted under a 10x stereomicroscope depending upon their colour,
texture and shape (Vogt and Persson 1991) and only the live roots were investigated.
Furthermore, we considered only fine roots showing a diametr comprised between 1.0 and 2.0
mm which were measured by means of a digital calliper. After classification, root samples
were fixed in FAA (Formalin-Acetic Acid-Alcohol, 5: 5: 90).
5.1.2 Histological analysis
Samples were dehydrated and embedded with Technovit 7100 resin system (Heraeus
Kulzer, Wehrheim, Germany) based on 2-hydroxyethyl-methacrylate (GMA) for light-
microscopy studies. Embedding protocol is listed in Table 5.1.

Chapter V – Effect of forest management on fine-root histological traits
64
Samples (67) were sectioned by a sliding microtome and stained in Toluidine blue O
(O’Brien et al. 1964, Parker et al 1982) for 2 minutes. Sections were photographed by
Olympus BX63 light microscope and images were analysed by an open source analytical
software (ImageJ, Abramoff et al. 2004, Rasband 1997-2011).
Table 5.1. Embedding steps using Technovit 7100 resin system
Solution Sample immersion time
Dehydratation
Ethanol 10% 15 m
Ethanol 30% 15 m
Ethanol 50% 15 m
Ethanol 70% 15 m
Ethanol 95% 15 m
Ethanol 100% 12 h
Pre-infiltration
Etanolo 100% + Technovit 7100(v/v ratio = 3:1) 1 h
Etanolo 100% + Technovit 7100(v/v ratio = 1:1) 1 h
Etanolo 100% + Technovit 7100(v/v ratio = 1:3) 1 h
Infiltration
100 ml Technovit 7100 +1 g hardener I 12 h
Embedding
15 ml infiltration solution +1 ml hardener II 2 h
For each section root traits measured were: Root Cross-section Area (Root CSA), Mean root
diameter (obtained as a mean between 10 measurements), Xylem CSA, Central cylinder CSA,

Chapter V – Effect of forest management on fine-root histological traits
65
Wood CSA (xylem area less central cylinder area), Number of vessels, Vessels CSA, Total
Vessels CSA (Fig. 5.1)
5.1.3 Data analysis
Statistical analyses were carried out by using the SPSS software package version 12.0
(SPSS Inc, Chicago IL, USA). Data met the normal distribution and homoscedasticity.
Because most of the measured anatomical traits showed a dependence on root diameter, the
latter was used as a covariate in a two-way analysis of covariance (ANCOVA) that was
performed to assess the effects of forest management (Coppice; 1994 and 2004 Conversion
stands) and soil depth (0-10; 10-20; 20-30 cm). A Bonferroni test with a 5% rejection level
was used to detect significant differences between stands and soil depths.
Figure 5.1 Example of section analysis using ImageJ software

Chapter V – Effect of forest management on fine-root histological traits
66
5.2 Results and Discussion
5.2.1 General fine-root histological traits in Fagus sylvatica L.
All roots investigated showed a secondary anatomical structure with a central stele
surrounded by secondary xylem and phloem. A cork cambium resulted to be present which
originated a thin periderm. (Fig. 5.2).
Figure 5.2 Light micrograph of a transverse section through a root of Fagus sylvatica L. Differentiations in cell types and tissue structures using Toluidine blue O

Chapter V – Effect of forest management on fine-root histological traits
67
We observed in our sections that multiseriated rays originated from primary xylem
poles, and their number coincided with the number of primary xylem poles. Therefore we
adopted the easily detectable number of multiseriate rays as a way to detect rapidly the
number of xylem poles present in each section
(Fig. 5.3).
We found that in Fagus sylvatica L. the
number of protoxylem poles varied from 4 to 8
in relation with the size of the central stele
(Fig. 5.4), but we didn't find any relation with
type of forest management or soil depth.
Clowes (1951) investigated the
structure of mycorrhizal roots of Fagus
sylvatica L. and found that resistance to
mycorrhizal infection increases proportionally
with the increase of the number of protoxylem
poles. In particular this author reported the
presence of roots with a monarch, diarch and
triarch (one, two and three protoxylem poles)
xylem organization. In the present
Figure 5.4 Relation between number of protoxylem poles and central cylinder area. n indicates number of sections analysed. Error bars are 1 S.E. * only one ottarch root was found
Figure 5.3 Light micrograph of a transverse section (stained with tincture of iodine) through a root of Fagus sylvatica L. 5 (A) and 7 (B) multiseriate rays radiate from central cylinder

Chapter V – Effect of forest management on fine-root histological traits
68
investigation a similar situation was absent
and a possible explanation could be that in
our study we investigated fine roots with a
diameter comprised between 1.0-2.0 mm
and showing a clear presence of secondary
growth. On the contrary Clowes (1951)
investigated thinner fine roots with a
diameter comprised between 0.3-1.1 mm
which did not present a secondary growth
yet. The lack of a secondary structure in
Fagus roots showing a small diameter and
presence of 1,2 or 3 protoxylem poles
suggest that these roots could play an hephemeral feeding function. This hypothesis is
consistent with a suggestion by Hishi and Takeda (2005) according to which lower is the
number of protoxylem poles present in a fine root and higher is its probability to die
maintaining its primary anatomical organisation. In our roots mean vessel area was 1130 µm2
but this value seemed to be strongly affected by root diameter as showed in Figure 5.5.
5.2.2 Fine-root histological traits and forest management
Figure 5.6 shows the percentage of secondary xylem (on total section area) found in
each transverse root section analysed. Despite it is not surprising that we found that secondary
xylem amount increased with root diameter it was unexpected to find that root from both
Conversions stands showed a 7-9% increase of secondary xylem in respect to roots extracted
from Coppice stand. The differences were significant difference when roots sampled at 5 cm
soil depth were examined (p<0.05; Coppice, 43%; Conversion 1994, 52%; Conversion 2004,
Figure 5.5 Relation between mean vessel area (µm2) and fine root diameter (mm). Each point represents a fine root section. Different dots represent different soil depths

Chapter V – Effect of forest management on fine-root histological traits
69
50%; data not showed). A possible
interpretation of these results could be that
after a conversion cut, the roots apparatus of
the remaining trees must arrange differently
the anatomy of their roots in order to
respond to a possible increase of tensile
strengths (Gardiner et al. 1997). This
hypothesis would explain well why is not
rare within an early converted forest to find
few trees fallen down because of snow or
wind have affected their stability before the
roots could adapt to the new mechanical
forces which jeopardise their stability. A similar situation was also observed in this study with
the 2004 Conversion stand (Fig. 5.7). If this is the case, then the increased percentage of
Figure 5.6 Relation between stem percentage of wood on total section area and fine root diameter (mm). Each point represents a fine root section. Different dots represent different stands
Figure 5.7 Fallen trees in Conversion 2004 stand

Chapter V – Effect of forest management on fine-root histological traits
70
secondary xylem) observed in our experiment involves also an increase of capability of each
single root for water transportation. This increase in water transportation could satisfy an
increased demand of water by canopy, as a consequence of a more open canopy opening and
an increased exposure to sunlight which would increase overall transpiration amount
(Cochard et al. 1999).
Fine roots sampled from the most recently (2004) converted forest stand showed to be
characterised at 5 cm of soil depth by vessels having a significantly larger lumen diameter
(Fig. 5.8) despite their number decreased (Fig. 5.9) in respect to the other two stands
considered in our experiments. In this stand root diameter values didn't change in deeper soil,
unlikely the other two stands (Conversion 1994 and Coppice) where the increase of vessels
diameter with depth coincided with a decrease of their number (Fig. 5.8, 5.9). In particular,
fine roots growing at 25 cm soil depth in Coppice, stand showed the largest vessel diameter
Figure 5.8 Mean Vessels CSA of fine roots (1-2 mm) from three different forest management stands. Values refer to three soil depths. Each value represents a mean of 7-8 samples ± 1 SE. a, b denote comparison between stands within the same depth (Bonferroni test, P<0.05)
Figure 5.9 Number of vessels of fine roots (1-2 mm) from three different forest management stands. Values refer to three soil depths. Each value represents a mean of 7-8 samples ± 1 SE. a, b denote comparison between stands within the same depth (Bonferroni test, P<0.05)

Chapter V – Effect of forest management on fine-root histological traits
71
value (Fig. 5.8, 5.9), so that the Total Vessels CSA resulted to be significantly higher in this
stand than in both conversions (p<0.005, data not showed). In regard to root diameter it has
been suggested (Sperry 1993) that despite larger vessels are more efficient in water transport
they become more susceptible to embolism (vessels filled with air become unable to trasport
water to the leaves). The two main factors responsible for inducing vessel embolism are
dehydration and sap-freezing temperatures, and environmental conditions characterised by
these two factors take place more frequently in shallow soil layers. This fact could explain
why fine roots with larger vessels are developed in depth soil layer whereas those with
smaller vessels are developed in shallow soil layers. The finding that in our experiment the
most recently converted stand (Conversion 2004) didn't show such a typical pattern of
diameter vessel distribution with depth could be the consequence of the primary need of a tree
after conversion operations to restore an efficient fine-root network able to support an
increased requirement of water absorbed from the entire soil profile.
5.3 Acknowledgements
This work was conducted within the framework of the research project “Trees and
Italian forests, sinks of carbon and biodiversity, for the reduction of atmospheric CO2 and
improvement of environmental quality” funded by the Italian Ministry of Environment. I
thank Dr. Di Iorio Antonino and Dr. Antonio Montagnoli for assistance with the field and
laboratory work. I would like to express my gratitude to Professor Donato Chiatante for his
valuable comments and suggestions.
Chapter V – Effect of forest management on fine-root histological traits
72
References
Abramoff M.D., Magalhaes P.J. and Ram S.J. 2004. Image Processing with ImageJ.
Biophotonics International, Vol. 11, 7:36-42
Clowes F.A.L. 1951. The Structure of Mycorrhizal Roots of Fagus sylvatica. New
Phytologist, Vol. 50, 1:1-16
Cochard H., Lemoine D. and Dreyer E. 1999. The effects of acclimation to sunlight on the
xylem vulnerability to embolism in Fagus sylvatica L. Plant, Cell and Environment,
Vol. 22, 1:101–108
Coutts M. P. 1987. Developmental processes in tree root systems. Can. J. For. Res., 17:761-
767
Eissenstat D.M. and Yanai R.D. 1997. The ecology of root life span, Adv. Ecol. Res., 27:1–
60
Fitter A.H. 1991. Characteristics and functions of root systems. In. Waisel Y., Eshel A.,
Kafkafi U. (eds) Plant Roots: the Hidden Half. Marcel Dekker, Inc., New York, pp 3-
25
Gardiner B.A., Stac G..R., Belcher R.E. and Wood C.J. 1997. Field and wind tunnel
assessments of the implications of respacing and thinning for tree stability. Forestry,
70:233-252.
Hishi T. and Takeda H. 2005. Life cycles of individual roots in fine root system of
Chamaecyparis obtuse Sieb. et Zucc. J. For. Res., 10:181-187
O'Brien T.P., Feder N. and McCully M.E. 1964. Polyehromatic Staining of Plant Cell
Walls by Toluidine Blue O. Protoplasma, Vol. 59, 2:368-373
Parker A.J., Haskins E.F. and Deyrup-Olsen I. 1982. Toluidine Blue: A Simple, Effective
Stain for Plant Tissues. The American Biology Teacher, Vol. 44, 8:487-489
Rasband W.S. 1997-2011. ImageJ. U.S. National Institutes of Health, Bethesda,
Maryland, USA, http://imagej.nih.gov/ij/
Ruess M.G., Hendrick R.L., Burton A.J., Pregitzer K.S., Sveinbjornssön B., Allen M.F.
and Maurer G.E. 2003. Coupling fine root dynamics with ecosystem carbon cycling
in black spruce forest of interior Alaska. Ecol. Monogr., 73:643-662
Sperry J.S. 1993. Winter xylem embolism and spring recovery in Betula cordifolia, Fagus
grandifolia, Abies balsamea and Picea rubens. In Borghetti M., Grace J., Raschi A.
Chapter V – Effect of forest management on fine-root histological traits
73
(eds) Water Transport in Plants under Climatic Stress, Cambridge University Press,
Cambridge, pp. 86-98
Vogt K.A. and Persson H. 1991. Root methods. In Lassoie J.P., Hinckley T.M. (eds).
Techniques and Approaches in Forest Tree Ecophysiology. CRC Press Boca Raton,
Florida USA pp 477-502.
Waisel Y. and Eshel A. 1991. Multiform behaviour of various constituents of one root
system. In. Waisel Y, Eshel A and Kafkafi U eds, Plant Roots: the Hidden Half.
Marcel Dekker, Inc., New York, pp 39-52
Wilcox H. 1964. Xylem in roots of Pinus resinosa Ait. in relation to heterorhizy and growth
activity. In Zimmermann M.H. ed, The Formation of Wood in Forest Trees, Academic
press, 459-478

74
Chapter VI
Fine-root mass, length and specific root length in a Turkey-oak
(Quercus cerris L.) stand in relation to seasonal changes in soil moisture
Fine-root dynamics is influenced by a variety of internal (e.g., genotype of plant
species) and external (e.g., temperature, precipitation, soil properties, nutrient availability and
competition between plants) factors (Majdi et al. 2005). During the summer, forest
ecosystems in Mediterranean climate areas undergo natural soil moisture deficit coupled with
elevated temperature. Thus, water deficit is subject to seasonal variability and causes mild
and/or extreme drought. Soil moisture is a key factor that has been found to influence fine-
root biomass and turnover of trees (Meier et al. 2008). Any distortion of the fine-root system
by such a kind of stressors might affect carbon and nutrient cycling in the ecosystem.
Plants continuously adapt the growth of different organs to a dynamically
hetereogeneous soil resources (Metcalfe et al. 2008). With regard to organ responses to
stresses, roots use bio-adaptive processes as an ontogenic response to environmental
conditions (Chiatante et al. 2005). Different tree species appear to use different adaptation
strategies to optimize their mineral nutrition (Comas et al. 2002; Curt and Prevosto 2003;
Comas and Eissenstat 2004). This species-specific adaptation in response to the local
heterogeneity of the soil involves two possible strategies that depend on their ability to
exclude or tolerate the stress (Manes et al 2006 and references therein). Briefly, a plant adopts
an extensive strategy (Ostonen et al. 2007), namely it shifts its allocation of carbon towards
roots, where photosynthate can be used to increase water uptake. This leads to an increase in
root mass and length in the fine-root system as soil moisture declines (Manes et al. 2005;

Chapter VI – Effect of soil moisture on Turkey-oak (Quercus cerris L.) fine roots
75
Ostonen et al. 2007). Plants may also respond by closing their stomata thereby reducing CO2
assimilation and diffusion into the plant (Metcalfe et al. 2008). The product of this change in
the total amount of labile carbon available to the plant is probably a decline in root mass
production as soil moisture falls (Manes et al. 2005). Alternatively, a plant may adopt an
‘intensive’ strategy, namely it may induce morphological adaptations of the fine roots that
enable trees to grow even under harsh soil conditions (Ostonen et al. 2007).
Root length is assumed to be proportional to resource acquisition (benefit) and root
mass to be proportional to construction and maintenance (cost) (Eissenstat and Yanai 1997).
Specific root length (SRL m g−1) is the length-to-mass ratio (L/M) of a root fragment. Fitter
(1976, 1985, 1991) was one of the first authors to apply SRL and proposed the length/mass
ratio as an index of root benefit to root cost. Long and thin roots (high SRL) are believed to be
the below-ground equivalent of thin leaves, which are less expensive to produce (Withington
et al. 2006; Ostonen et al. 2007). Water uptake may stimulate the production of finer roots,
which results in a relatively greater length per unit mass thereby leading to an increase in SRL
under drier conditions (Metcalfe 2009). Thus, a decline in soil moisture in some species may
induce changes in the diameter of the root population (Ostonen et al. 2007).
6.1 Materials and methods
6.1.1 Fine-root measurements
The soil core sampling method (Vogt and Persson 1991) was used to quantify fine-root
mass (diameter < 2 mm) during the 2008 growing season. Four permanent 10 m2 square-
shaped plots were set up; these were different from the plots set up for stand measurements.
Sudmeyer et al. (2004) found that maximum lateral root spread is roughly 1.5-2.5 times the
tree height. Although this value refers to an agroforestry system, we considered it valid for

Chapter VI – Effect of soil moisture on Turkey-oak (Quercus cerris L.) fine roots
76
our oak stands. Therefore, we set-up plots at a distance equal to 3.5-4.1 times the mean stand
tree height and each plot was considered an independent replicate. At each sampling date, two
soil cores (4 cm diameter x 30 cm deep) were randomly collected in each plot using a motor-
driven portable core sampler (adapted from Ponder Jr. and Alley 1997). To investigate the
kinetics of biomass and necromass, we collected soil samples on 12 days between April 4 and
November 27. Samples were collected at an interval of not less than 15 days and not more
than 26 days; eight cores were collected on each sampling date for a total of 96 cores. We did
not sample in winter because we assumed that during this season fine-root production and
decomposition are low (Claus and George 2005; Crider., 1928). Samples were stored in
plastic bags at 4°C until processed. For processing, each sample was placed in a nylon bag
(300 µm mesh) that was contained in a plastic cylinder (6 mm mesh) and washed
automatically using a washing machine. Fine roots were examined at the microscope and
were divided into two groups: oak and other understorey species. Fine roots from oak trees
were classified “live” (dry weight hereafter termed “biomass” or live fine-root mass [LFRM])
or “dead” (necromass or DFRM) depending on their colour, texture and shape (Vogt and
Persson 1991). The roots freed from soil were scanned at a resolution of 400 dpi with a
calibrated flatbed scanner coupled to a lighting system for image acquisition (Epson
Expression 10000 XL). They were then live and dead samples were oven-dried separately and
weighed. Fine-root images were analyzed by WinRhizo Pro V. 2007d (Regent Instruments
Inc., Quebec) to obtain root length and diameter. The following fine-root traits were
determined for Oak trees: live and dead dry mass (g m-2); length and SRL only for live roots;
and diameter classes. We also estimated annual FRP using the 'minimum-maximum method’
procedure (Edwards and Harris 1977; McClaugherty et al. 1982) considering only significant
differences between maximum and minimum. Rates of biomass turnover were calculated as
Annual Root Production divided by Maximum Standing Biomass (Gill and Jackson 2000).

Chapter VI – Effect of soil moisture on Turkey-oak (Quercus cerris L.) fine roots
77
6.1.2 Statistical analysis
The data were analyzed with the SPSS software package version 12.0 (SPSS Inc,
Chicago IL, USA). The data were not normally distributed neither did they meet the
assumption of homoscedasticity. They were square-root transformed or log-transformed to
ensure normal distributions and equal variances to allow the use of normal parametric
statistics. Analysis of variance (one-way ANOVA) was performed on fine-root biomass,
length and mean forest fine-root SRL to assess the effect of time (seasonality). The effect of
soil moisture on fine-root biomass, length and mean forest fine-root SRL was assessed using a
power regression function.

Chapter VI – Effect of soil moisture on Turkey-oak (Quercus cerris L.) fine roots
78
6.2 Results
6.2.1 Soil moisture
As expected, the highest soil water content was recorded between April (40.3%) and
June (38.9%) as a result of spring rainfall events (Fig. 6.1 a, b). It decreased to almost 30% at
the beginning of July and to almost 18% in August. In fact, rainfall events were very rare in
summer (5 in July and 2 in August, and rainfall was very scarce (in July, one rain event
produced 10.4 mm and one produced 3 mm; all other rain events were under 1 mm). Soil
moisture increased at the beginning of September and at the beginning October as result of
early autumn rainfall. It decreased at the end of October in conjunction a decrease in rainfall,
and then increased up to the end of November.
6.2.2 Fine-root mass, length and SRL
The annual mean LFRM was slightly lower than the annual mean DFRM (152.4 ± 8 g
m-2 and 175.9 ± 7 g m-2, respectively; data not shown). Time (seasonality) significantly
affected both LFRM and DFRM, and both varied greatly during the vegetative season (Fig.
6.1c). LFRM progressively increased from the beginning of April to mid-June, and decreased
slightly at the beginning of July. It peaked at the end of July and remained stable until the end
of August, when it decreased until the beginning of October. There was a second small peak
at the end of October. Then LFRM decreased until the end of November at which time it
reached the same value measured at the beginning of the season. DFRM increased slightly
during the study period. Small peaks occurred at the beginning of July and October, and at the
end of November in conjunction with decreases in LFRM (Fig. 6.1c). Mean annual live fine-
root length was 1.16 ± 0.80 km m-2 and mean annual live fine-root SRL was 7.68 ± 0.28 m g-1
(data not shown). Fine-root length had the same seasonal pattern as live dry mass with a peak

Chapter VI – Effect of soil moisture on Turkey-oak (Quercus cerris L.) fine roots
79
Figure 6.1 Monthly average temperature and rainfall from April to November 2008 (a). Seasonal variation of (b) soil moisture, (c) fine-root biomass and necromass, (d) length and (e) SRL. Data refer to each sampling date throughout the growing seasons. Data are the means of 8 measurements ±1 SE. (S.E. not shown if smaller than symbol). SRL, specific root length

Chapter VI – Effect of soil moisture on Turkey-oak (Quercus cerris L.) fine roots
80
in summer and a peak in autumn, whereas SRL had only one peak in summer, because
the rate of increase was greater for length than that of mass. Thus, more root length per unit
mass was produced under drier soil
conditions. Both fine-root length and
SRL showed a significant time effect
(Fig 6.1 d, e). Fine-root mass, length
and SRL peaked during the transition
from the wet to dry season. In fact,
fine-root dry mass, length and SRL
showed an inverse power
relationship with the soil moisture
(Fig. 6.2 a, b, c).
Very fine roots (diameter < 0.5
mm) constituted a considerable
proportion of total root length (79%),
whereas they constituted only 21 %
of biomass (Tab. 6.1). Analysis of
mass and length seasonal variation
per diameter class (Fig. 6.3) showed
that very fine roots (diameter < 0.5
mm and 0.5 < diameter < 0.1)
increased most when soil moisture
was lowest.
Figure 6.2 The relationship between volumetric soil moisture and fine-root (a) biomass, (b) length and (c) SRL in the surface 30 cm soil layer between April and November 2008
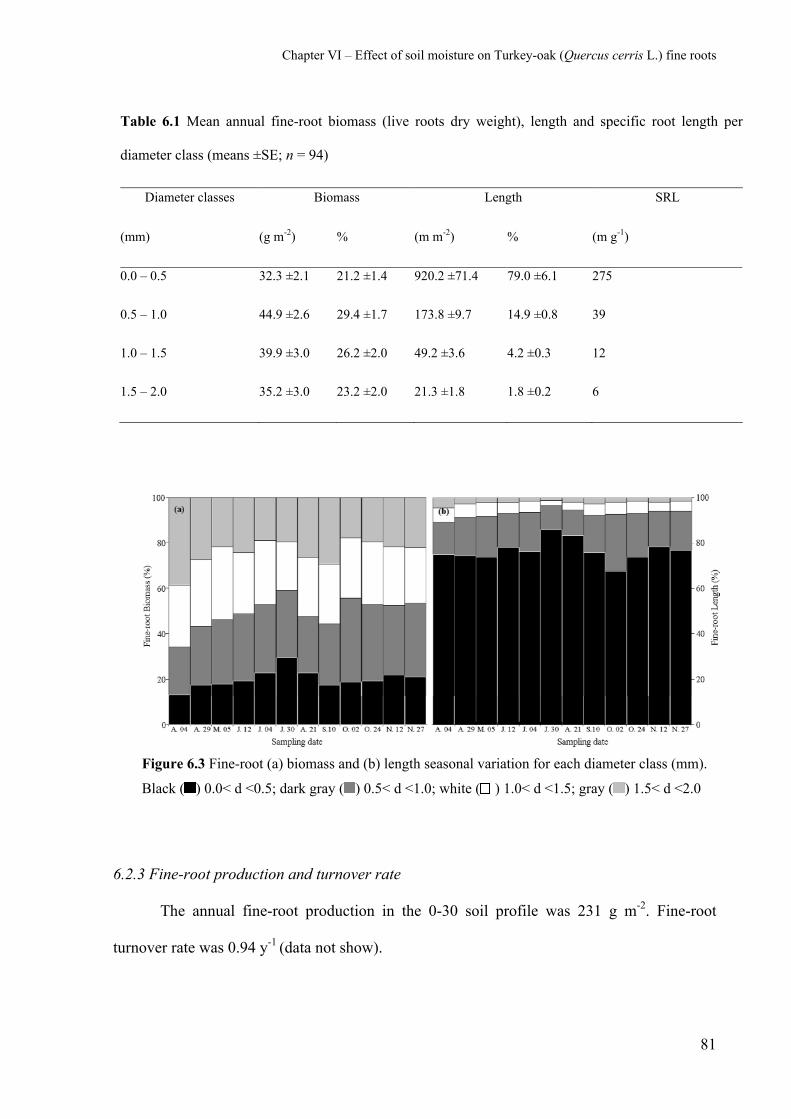
Chapter VI – Effect of soil moisture on Turkey-oak (Quercus cerris L.) fine roots
81
Table 6.1 Mean annual fine-root biomass (live roots dry weight), length and specific root length per
diameter class (means ±SE; n = 94)
Diameter classes Biomass Length SRL
(mm) (g m-2) % (m m-2) % (m g-1)
0.0 – 0.5 32.3 ±2.1 21.2 ±1.4 920.2 ±71.4 79.0 ±6.1 275
0.5 – 1.0 44.9 ±2.6 29.4 ±1.7 173.8 ±9.7 14.9 ±0.8 39
1.0 – 1.5 39.9 ±3.0 26.2 ±2.0 49.2 ±3.6 4.2 ±0.3 12
1.5 – 2.0 35.2 ±3.0 23.2 ±2.0 21.3 ±1.8 1.8 ±0.2 6
6.2.3 Fine-root production and turnover rate
The annual fine-root production in the 0-30 soil profile was 231 g m-2. Fine-root
turnover rate was 0.94 y-1 (data not show).
Figure 6.3 Fine-root (a) biomass and (b) length seasonal variation for each diameter class (mm).
Black ( ) 0.0< d <0.5; dark gray ( ) 0.5< d <1.0; white ( ) 1.0< d <1.5; gray ( ) 1.5< d <2.0

Chapter VI – Effect of soil moisture on Turkey-oak (Quercus cerris L.) fine roots
82
6.3 Discussion
The mean total (live plus dead) fine-root mass in our Turkey-oak stand in the Southern
Apennines of Italy (152.4 ± 8 g m-2 and 175.9 ± 7 g m-2, respectively) was consistent with
the values reported for the same or similar species. For example, it was 395-398 g m-2 for the
older stands of Q. cerris in central Italy (Claus and George 2005) 298 g m–2 for a Q. alba
stand in Missouri, USA (Joslin and Henderson 1987), and 536-654 g m-2 respectively young
and old Q. robur stand in the Netherlands (Bakker 1998). Moreover, our results concerning
live fine roots are similar to those reported in the review by Jackson et al. (1997). The fine-
root turnover rate calculated in our Turkey-oak stand was consistent with the values reported
in the review by Gill and Jackson (2000).
Few data are available regarding root length. Jackson et al. (1997) estimated the mean
standing crop root length in temperate deciduous forests at 3.4 km m−2, almost three times the
value measured in our study site (1.16 ± 0.80 km m-2). Concerning SRL, in a meta-analysis,
Ostonen et al. (2007) reported a fine-root SRL (diameter < 2mm) ranging between 1.4 to 25 m
g-1 depending on tree species. Our result (7.68 ± 0.28 m g-1) falls within this range, and is
similar to the value reported for Q. robur (4.1- 21.3 m g-1; Bakker 1998) and for Q. cerris
(4.10-6.80 m g-1; Claus and George 2005).
In our Q. cerris stand, both fine-root mass and length showed a bimodal seasonal
growth pattern. Complex bimodal seasonal patterns have been identified in fine-root biomass
in temperate forests (Gaudinski et al. 2001; Tierney and Fahey 2002; Matamala et al. 2003;
Trumbore and Gaudinski 2003; Majdi et al. 2005). It has been suggested that this seasonal
variation could reflect seasonal variations of water and consequent nutrient availability
(Coners and Leuschner 2005; Vanguelova et al. 2005; Mainiero and Kazda 2006) as well as
an ontogenic response to local conditions (Chiatante et al. 2005).

Chapter VI – Effect of soil moisture on Turkey-oak (Quercus cerris L.) fine roots
83
In our site, from the beginning of April to the beginning of July, fine-root mass and
length were closely related to soil water content patterns. In July, when the mean air
temperature exceeded 20 °C and soil water content decreased, fine-root traits were inversely
related to soil water content. Teskey and Hinckley (1981) observed that temperature was the
dominant factor for oak root growth at low temperatures, but soil water content was the most
important factor when temperatures increased above 17 °C. In our study, the summer fine-
root peak lasted until the end of August when water in the soil was lowest and air temperature
highest, after which fine-root traits decreased. This suggests that root growth/production in
the surface 30 cm soil layer was affected by the changes in plant allocation predicted by the
functional balance theory (Metcalfe et al. 2008). We found that September and October
rainfall events were followed by an increase of soil water content immediately after the
appearance of a second fine-root peak. In line with previous studies (Chiatante et al. 2005,
2006), we suggest that this second flush of fine-root production is a recovery mechanism
whereby the plant can uptake water and nutrients for winter storage (Cerasoli et al. 2004).
This was followed by a decline and consequent arrests of new root production in the autumn
coincided with lower temperatures and leaf shedding.
The relationship between the LFRM and DFRM patterns reported herein is consistent
with a bimodal pattern in the life cycle of the fine-root component in our Turkey-oak forest
stand. In particular, the peaks of live mass were followed by peaks of necromass. Joslin et al.
(2006) hypothesised that a tree fine-root system consists of pools of fine roots of different
ages. One pool is very dynamic and has a life span < 1 year (“short-lived”), and the other has
a life span > 1 year (“long-lived”) and consists of older fine roots. In particular, fine-roots
produced in spring have shorter life spans that those produced later. It is feasible that the
difference we found between the initial and peak value of biomass could be due to the
production (flush) of new roots. Moreover, the fact that the peak of fine roots lasts just a few

Chapter VI – Effect of soil moisture on Turkey-oak (Quercus cerris L.) fine roots
84
weeks suggests that most of these new fine roots produced are of the “short-live” type.
Furthermore, also the second flush, though less abundant than the first one, could be formed
mainly by “short-lived” fine roots because also this second peak lasts only a few weeks. If this
is the case, the amount of fine roots present during winter could represent the portion of the
root system classifiable as “long-lived” fine roots. As a consequence, the increment between
the amount of fine roots measurable at the beginning and at the end of the vegetative season
would represent the yearly production of “long-lived” fine roots. In our study, the difference
in biomass between April and November was roughly 1%, which indicates that almost all fine
roots produced died at the end of the season. Thus, the reduction in root traits observed in our
study may be attributed to the shedding of “short-lives” fine roots produced during the season,
thereby resulting in a very low net increment in total fine-root mass.
The general increase of fine-root biomass and length we found in summer might
derive from a lower amount of rainfall and soil water content coupled with an increase of air
temperature that normally occurs in this type of climate. Fine-root production flushes during
the drier period could be a strategy to overcome the unfavourable environmental conditions.
This hypothesis is reinforced by the inverse relationship found between soil water content and
fine-root biomass, length and mean forest fine-root SRL, all of which were higher when the
soil was drier. These findings indicate that the soil moisture deficit in the beginning of July
led to an increase in root biomass. Our data coincide with reports by Chiatante et al. (2005,
2006) that after the beginning of drought, there is an increase in root mass and length despite
a reduction in stomatal conductance. In literature, the mechanisms behind this fine-root
growth, as the carbon gain is lowered by the reduction in stomatal conductance with
increasing drought stress, suggests that carbon is preferentially channelled into the fine-root
production (Dickson and Tomlinson 1996; Thomas and Gausling 2000; in Di Iorio et al.
2011). In our study, fine-root biomass decreased (end of July-beginning of August) only when

Chapter VI – Effect of soil moisture on Turkey-oak (Quercus cerris L.) fine roots
85
drought was prolonged and soil water content reached very low values. As found by Cudlin et
al (2007) in a recent meta-analysis, the fact that root growth stops and several roots die
(decrease in root length and biomass) might indicate that an overall reduction of the root
production becomes more functional when water shortage exceeds a certain limit in content
and time. Therefore a relative allocation of growth to below-ground organs is a frequent
occurrence during a mild drought, and even the absolute root growth may increase following a
mild drought. However, when water stress continues, root growth usually decreases (Joslin et
al. 2000).
We found that the peak of mean fine-root SRL in summer coincided with biomass and
length peaks. Thus, in summer more root length per unit mass was produced than during the
rest of the growing season during which the fine-root length/mass ratio remains constant.
Fine-root SRL represents a mean of all root classes and its value varies proportionally
with root class. In our study, the proportion of roots with diameters smaller than 0.5 mm
varied in total fine-root biomass and length , respectively from 12% (4 April) to 29% (30
July) and from 74% (4 April) to 85% (30 July). This result shows that roots in this diameter
class are major cause of the annual fine-root fluctuation. The increases in mean forest fine-
root SRL is a consequence of the increment of the smaller diameter fractions and might imply
they are more efficient in exploiting soil water. This hypothesis is in good agreement with the
finding of Pregitzer et al. (2002) that the roots in an arbitrary fine-root size-class do not
function the same way, and that their carbon cost for construction and maintenance could be
different. Our results indicate that the root system is sensitive to soil-water dehydration and
responds to an increase in fine-root mass and length which is due mainly to the thinner roots.
Our data on the responses of fine roots to soil water content have shed some light on the
mechanisms that govern plant-water relationships. These mechanisms are important for

Chapter VI – Effect of soil moisture on Turkey-oak (Quercus cerris L.) fine roots
86
forests growing under natural conditions because they enable plants to survive the typical dry
summer in the Mediterranean area, which is likely to become drier and last longer given the
increase in temperature expected in this century.
6.4 Acknowledgements
I give special thanks to Dr. Bruno Lassere, Dr. Antonio Montagnoli and Dr. Antonino
Di Iorio for their help in field activities. I wish to thank Professor Donato Chiatante for
providing many useful comments and suggestions. This work was developed as part of the
research project “Trees and Italian forests, sinks of carbon and biodiversity, for the reduction
of atmospheric CO2 and improvement of environmental quality” funded by Italian Ministry of
Environment. I also acknowledge SBI (Italian Botanic Society Onlus) for supporting this
research.
Chapter VI – Effect of soil moisture on Turkey-oak (Quercus cerris L.) fine roots
87
6.5 References
Bakker M.R. 1998. Fine roots of pedunculate oak (Quercus robur L.) in the Netherlands
seven years after liming. Netherlands, J. Agric. Sci., 46:209-222
Cerasoli S., Maillard P., Scartazza A., Brugnoli E., Chaves M.M. and Pereira J.S. 2004.
Carbon and nitrogen winter storage and remobilisation during seasonal flush growth in
two-year-old cork oak (Quercus suber L.) saplings. Ann. F. Science, 61:721-729
Chiatante D., Di Iorio A., Sciandra S., Scippa G.S. and Mazzoleni S. 2006. Effect of
drought and fire on root development in Quercus pubescens Willd. and Fraxinus ornus
L. seedlings. Environ. Exp. Bot., 56: 190–197
Chiatante D., Di Iorio A. and Scippa G.S. 2005. Root responses of Quercus ilex L.
seedlings to drought and fire. Plant Biosystems, 139:198–208
Claus A. and George E. 2005. Effect of stand age on fine-root biomass and biomass
distribution in three European forest chronosequences. Can. J. For. Res., 35:1617-1625
Comas L.H., Bouma T.J. and Eissenstat D.M. 2002. Linking root traits to potential growth
rate in six temperate tree species. Oecologia, 132:34-43
Comas L.H. and Eissenstat D.M. 2004. Linking fine root traits to maximum potential
growth rate among 11 mature temperate tree species. Funct. Ecol., 18:388–397
Coners H. and Leuschner C. 2005. In situ measurements of fine root water absorption in
three temperate tree species – temporal variability and control by soil and atmospheric
factors. Basic. Appl. Ecol., 6:395–405
Cudlin P., Kieliszewska-Rokicka B., Rudawska M., Grebenc T., Alberton O., Lehto T.,
Bakker M.R., Børja I., Konopka B., Leski T., Kraigher H. and Kuyper T.W. 2007.
Fine roots and ectomycorrhizas as indicators of environmental change. Plant
Biosystems, 141:406–425
Curt T.H. and Prevosto B. 2003. Rooting strategy of naturally regenerated beech in Silver
birch and Scots pine woodlands. Plant Soil, 255:265-279
Di Iorio A., Montagnoli A., Scippa G.S. and Chiatante D. 2011. Fine root growth of
Quercus pubescens seedlings after drought stress and fire disturbance. Environ. Exp.
Bot., 74:272-279

Chapter VI – Effect of soil moisture on Turkey-oak (Quercus cerris L.) fine roots
88
Dickson R.E. and Tomlinson P.T. 1996. Oak growth, development and carbon metabolism
in response to water stress. Ann. Sci. Forest., 53:181-196
Gaudinski J.B., Trumbore S.E., Davidson E.A., Cook A.C., Markewitz D. and Richter
D.D. 2001. The age of fine-root carbon in three forests of the eastern United States
measured by radiocarbon. Oecologia, 129:420-429
Jackson R.B., Mooney H.A. and Schulze E.D. 1997. A global budget for fine root biomass,
surface area, and nutrient contents. Proc. Nat. Acad. Sci., 94:7362-7366
Joslin J.D., Gaudinski J.B., Torn M.S., Riley W.J. and Hanson P.J. 2006. Fine-root
turnover patterns and their relationship to root diameter and soil depth in a 14 C-
labeled hardwood forest. New Phytol., 172:523-535
Joslin J.D. and Henderson G.S. 1987. Organic matter and nutrients associated with fine
root turnover in a white oak stand. For. Sci., 33:330-346
Joslin J.D., Wolfe M.H. and Hanson P.J. 2000. Effects of altered water regimes on forest
root systems. New Phytol., 147:117–129
Mainiero R. and Kazda M. 2006. Depth-related fine root dynamics of Fagus sylvatica
during exceptional drought. For. Ecol. Manag., 237:135-142
Majdi K., Pregitzer K.S., Moren A.S., Nylund J.E. and Agren G.I. 2005. Measuring fine
root turnover in forest ecosystems. Plant Soil, 276:1-8
Manes F., Vitale M., Donato E., Giannini M. and Puppi G. 2006. Different ability of three
Mediterranean oak species to tolerate progressive water stress. Photosynthetica, 44:
387-393
Matamala R., Gonzàlez-Meler M.A., Jastrow J.D., Norby R.J. and Schlesinger W.H.
2003. Impacts of fine root turnover on forest NPP and soil C sequestration potential.
Science, 302:1385-1387
Metcalfe D.B., Meir P., Aragão L.E., da Costa A.C.L., Braga A.P., Gonçalves P.H.L., de
Athaydes Silva Junior J., de Almeida S.S., Dawson L.A., Malhi Y. and Williams M.
2008. The effects of water availability on root growth and morphology in an Amazon
rainforest. Plant Soil, 311:189–199
McClaugherty C.A., Aber J.D. and Melillo J.M. 1982. The role of fine roots in the organic
matter and nitrogen budgets of two forested ecosystems. Ecology, 63:1481-1490
Chapter VI – Effect of soil moisture on Turkey-oak (Quercus cerris L.) fine roots
89
Ostonen I., Puttsepp U., Biel C., Alberton O., Bakker M.R., Lohmus K., Majdi H.,
Metcalfe D., Olsthoorn A.F.M., Pronk A., Vanguelova E., Weih M. and Brunner I.
2007. Specific root length as an indicator of environmental change. Plant Biosystems,
141:426–442
Ponder F.Jr. and Alley D.E. 1997. Soil sampler for rocky soils. Res. Note NC-371. USDA
Forest Service North Central Forest Experiment Station, St. Paul, MN. 5 pp.
Sudmeyer R.A., Speijers J. and Nicholas B.D. 2004. Root distribution of Pinus pinaster, P.
radiata, Eucalyptus globulus and E. kochii and associated soil chemistry in agricultural
land adjacent to tree lines. Tree Physiol., 24:1333-1346
Teskey R.O. and Hinckley T.M. 1981. Influence of temperature and water potential on root
growth of white oak. Physiol. Plantarum, 52:363–369
Thomas F.M. and Gausling T. 2000. Morphological and physiological responses of oak
seedlings (Quercus petraea and Q. robur) to moderate drought. Ann. For. Sci., 57:325-
333
Tierney G. and Fahey T. 2002. Fine root turnover in a northern hardwood forest: a direct
comparison of the radiocarbon and minirhizotron methods. Can. J. For. Res., 32:1692-
1697
Vanguelova E.I., Nortcliff S., Moffat A.J. and Kennedy F. 2005. Morphology, biomass and
nutrient status of fine roots of Scots pine (Pinus sylvestris) as influenced by seasonal
fluctuations in soil moisture and soil solution chemistry. Plant and Soil, 270:233–247
Vogt K.A. and Persson H. 1991. Root methods. In: Lassoie J.P., Hinckley T.M. (eds)
Techniques and Approaches in Forest Tree Ecophysiology. CRC Press Boca Raton,
Florida. pp 477-502.

90
Conclusions
In this study considerable variations in the fine-root compartment occur in both Alpine
beech forests in relation to forest management and in Apennine Turkey-oak forest in relation
to soil moisture deficit.
Concerning to the response of fine roots to forest management practices, conversion
from coppice to high forest showed that a 40-year-old coppice stand is characterized by lower
fine-root biomass production. Given the importance of fine-root production, this finding
suggests an immediate advantage in converting a coppice stand to high forest stand due to the
increase of fine-root primary production. On the contrary, this study also showed that
harvesting in the converted stands causes a general decrease in the total mass of fine roots
with a consequent increase of carbon release. Moreover, the coppice stand showed the highest
fine-root biomass coupled with the lowest turnover rate. Therefore, the coppice stand seems to
be associated with a higher amount and a longer period of below-ground carbon stock
accumulation, at least as regards the fine-root compartment.
These previous results were supported by the finding that fine-root C:N ratio (an
indicator of fine-root life-span) was significantly higher in fine roots of the coppice stand than
in converted ones. This was because an higher fine-root nitrogen concentration in converted
stands (e.g. higher metabolic activity) and an higher fine-root carbon concentration in the
coppice stand. While effects on fine-root nitrogen concentration in relation to forest
management are well known, nothing is reported about changes in carbon concentration. We
suggested that. The histological analysis in the present work showed that the highest carbon
concentration was related to differences in fine-root anatomical structure. Fine roots in the
Coppice stand showed an higher percentage of phloem instead of xylem, explaining the
highest carbon concentration.
91
An important remark is that the thinnest root component (0-0.5 mm) appears to be
more sensitive to forest management than other root diameter classes analyzed (0.5-1; 1.0-2.0
mm). This finding could be useful in evaluations of fine-root response to environmental
changes.
Concluding, stand biomass comparison between the three stands has highlighted that
forest stands subject to conversion practice have to be accounted as carbon source. In fact the
biomass measured in the old-coppice stand was not recovered after 14 years the cutting
operations
In regards to the fine-root response to soil moisture deficit, we investigated the
characteristics of Quercus cerris fine roots during a growing season. Both fine-root biomass
and length were influenced by seasonal variations of soil water content and were consistently
higher when the soil was drier. We found that peaks constituting the bimodal pattern of fine-
root growth were characterised by an increase of the thinner fraction (diameter < 0.5 mm) of
the root population. This pattern leads to an increase of the mean fine-root SRL displaying, in
summer, the same response of mass and length. While we found a significant relationship
between some of the measured fine-root characteristics and soil moisture at our study site, we
cannot exclude that other environmental variables such as above-ground growth and soil
fertility could contribute to this variation.
Finally, a more comprehensive measurement programme is required to elucidate the
effects of other potentially important drivers of fine-root growth patterns and processes (e.g.
changes in canopy evapotranspiration) and how these changes would affect the soil carbon
stock.