Istituto di Igiene Università Cattolica del Sacro Cuore, Roma
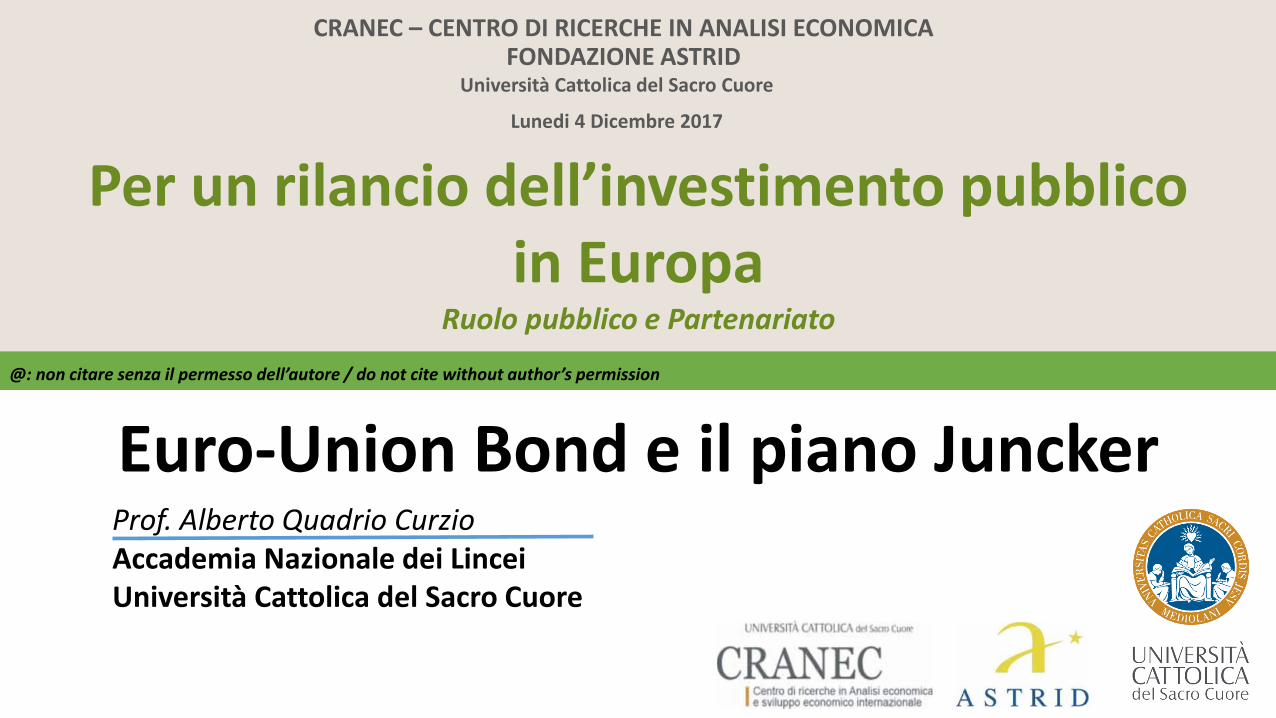
CRANEC – CENTRO DI RICERCHE IN ANALISI ECONOMICA FONDAZIONE ASTRID
Università Cattolica del Sacro Cuore
Lunedi 4 Dicembre 2017
Euro-Union Bond e il piano Juncker Prof. Alberto Quadrio Curzio Accademia Nazionale dei Lincei Università Cattolica del Sacro Cuore
Per un rilancio dell’investimento pubblico in Europa
Ruolo pubblico e Partenariato
@: non citare senza il permesso dell’autore / do not cite without author’s permission
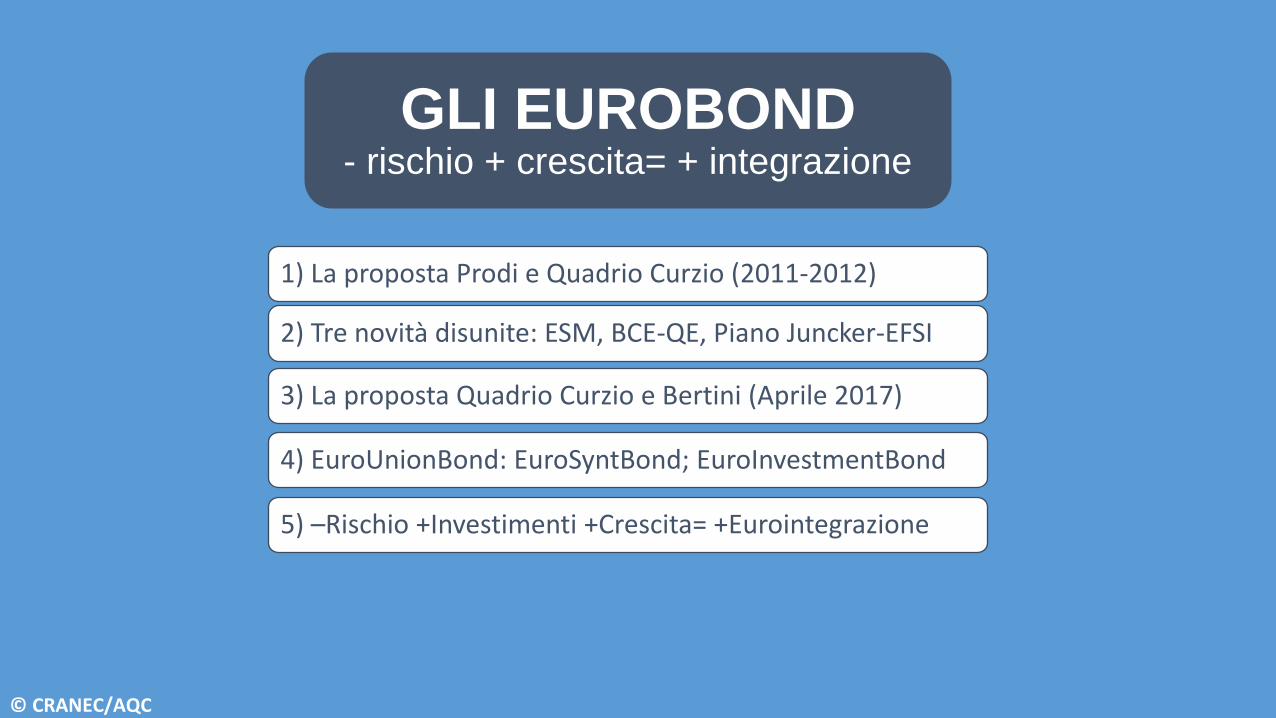
GLI EUROBOND - rischio + crescita= + integrazione
1) La proposta Prodi e Quadrio Curzio (2011-2012)
2) Tre novità disunite: ESM, BCE-QE, Piano Juncker-EFSI
4) EuroUnionBond: EuroSyntBond; EuroInvestmentBond
5) –Rischio +Investimenti +Crescita= +Eurointegrazione
3) La proposta Quadrio Curzio e Bertini (Aprile 2017)
© CRANEC/AQC

La proposta Prodi e Quadrio Curzio 2011-12 sugli Eurounionbond (con i successivi approfondimenti di Alberto Quadrio Curzio (2017), si rimanda rif. biblio in slide 7)
Tre novità economico-istituzionali disunite: ESM, BCE-QE, Piano Juncker-EFSI
Se ci fosse una razionalità politica… che aiuterebbe anche la BCE a ricollocare i 2000 miliardi di titoli di Stato si potrebbe arrivare ad ulteriori innovazioni (la proposta di Quadrio Curzio e Bertini 2017) come…
Gli EuroUnionBond per unificare parte dei debiti pubblici degli stati della UEM;
Gli EuroInvestmentBond per finanziare gli investimenti infrastrutturali
© CRANEC/AQC

«EuroUnionBond per la Nuova Europa» in Il Sole 24 Ore del 23/08/2011 – NB i dati di questa tavola e delle due successive sono quelli del 2011
RICOSTRUZIONE CON CRESCITA INNOVATIVA EuroUnionBond (EUB) e Fondo Finanziario Europeo (FFE)
Proposta Prodi - Quadrio Curzio: 2011 e 2012
FONDO FINANZIARIO EUROPEO (FFE)
RISERVE AUREE*
AZIONI E OBBLIGAZIONI DI RETI(Enel,Eni,Poste Ecc) A VALORI DI STIMA
CAPITALE CONFERITO = 1,000 miliardi
Italia = 180 mld €
Ogni Paese conferisce in pari misura alla sua quota BCE
UEM = 550 mld
Italia = 79 mld €
UEM =450 mld € (350 milioni once)
Italia = 101 mld € (79 milioni once)
*Prezzo 1800$/oz
© C
RA
NEC
/AQ
C

Leva sul capitale conferito di 1,000 miliardi: 3
EMISSIONE OBBLIGAZIONARIA DI 3,000
Durata 10 anni (e oltre) al 3% annuo
Onere interessi 90 miliardi = 1% del PIL UEM
2,300 Titoli di Stato 25% Pil
Uem
700 Investimenti
infrastrutturali
RICOSTRUZIONE CON CRESCITA INNOVATIVA EuroUnionBond (EUB) e Fondo Finanziario Europeo (FFE)
Prodi - Quadrio Curzio: 2011 e 2012
(33% circa PIL UEM)
«EuroUnionBond per la Nuova Europa» in Il Sole 24 Ore del 23/08/2011 © CRANEC/AQC

Pil di UEM = 9,000 miliardi di euro
Debito/Pil di UEM = 85%
60 % verso il mercato
EUB FFE
RICOSTRUZIONE CON CRESCITA INNOVATIVA EuroUnionBond (EUB) e Fondo Finanziario Europeo (FFE)
Proposta Prodi - Quadrio Curzio
95% (da 120%) verso il mercato
«EuroUnionBond per la Nuova Europa» in Il Sole 24 Ore del 23/08/2011 © CRANEC/AQC
Edited by • Ivano Cardinale Goldsmiths, University of London, UK
• D'Maris Coffman University College London, UK
• Roberto Scazzieri Università degli Studi, Bologna, Italy
2017
© CRANEC/AQC
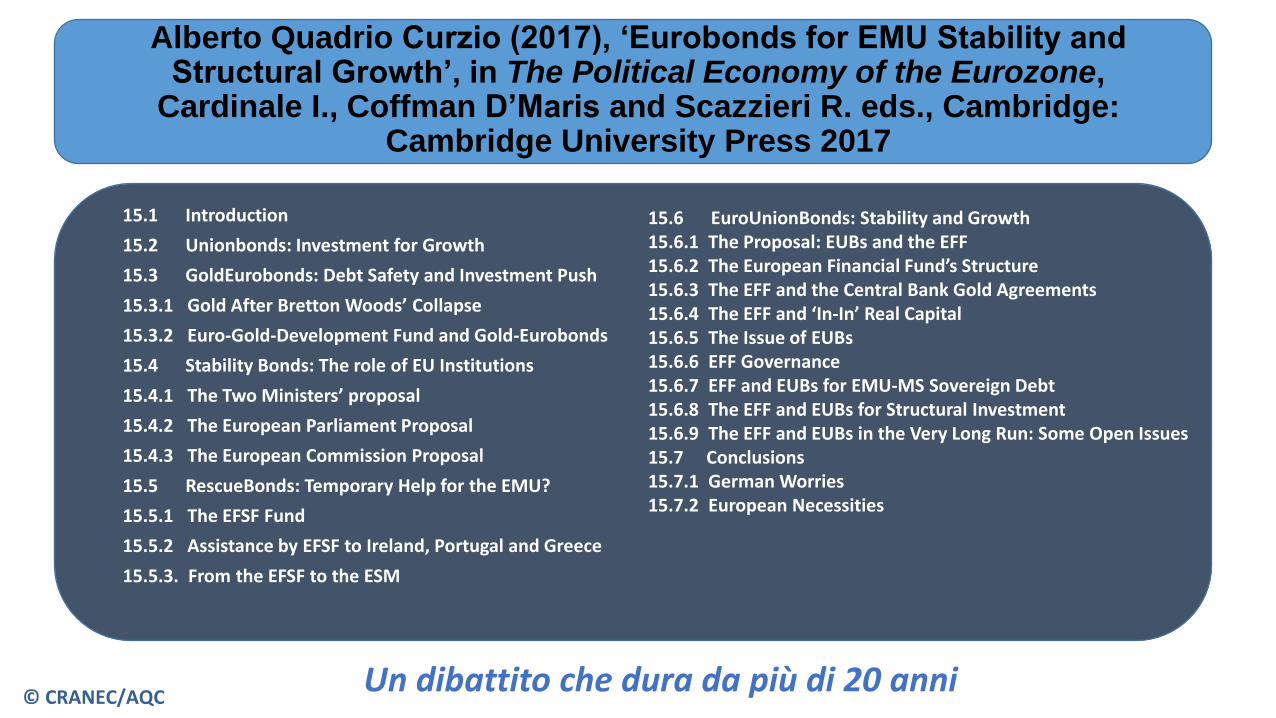
Alberto Quadrio Curzio (2017), ‘Eurobonds for EMU Stability and Structural Growth’, in The Political Economy of the Eurozone,
Cardinale I., Coffman D’Maris and Scazzieri R. eds., Cambridge: Cambridge University Press 2017
15.1 Introduction
15.2 Unionbonds: Investment for Growth
15.3 GoldEurobonds: Debt Safety and Investment Push
15.3.1 Gold After Bretton Woods’ Collapse
15.3.2 Euro-Gold-Development Fund and Gold-Eurobonds
15.4 Stability Bonds: The role of EU Institutions
15.4.1 The Two Ministers’ proposal
15.4.2 The European Parliament Proposal
15.4.3 The European Commission Proposal
15.5 RescueBonds: Temporary Help for the EMU?
15.5.1 The EFSF Fund
15.5.2 Assistance by EFSF to Ireland, Portugal and Greece
15.5.3. From the EFSF to the ESM
15.6 EuroUnionBonds: Stability and Growth 15.6.1 The Proposal: EUBs and the EFF 15.6.2 The European Financial Fund’s Structure 15.6.3 The EFF and the Central Bank Gold Agreements 15.6.4 The EFF and ‘In-In’ Real Capital 15.6.5 The Issue of EUBs 15.6.6 EFF Governance 15.6.7 EFF and EUBs for EMU-MS Sovereign Debt 15.6.8 The EFF and EUBs for Structural Investment 15.6.9 The EFF and EUBs in the Very Long Run: Some Open Issues 15.7 Conclusions 15.7.1 German Worries 15.7.2 European Necessities
© CRANEC/AQC Un dibattito che dura da più di 20 anni

Il futuro della UEM passa dal coordinamento delle innovazioni che ci sono ma che vanno completate e connesse
1) Eurobond del MES: sono concreti e di successo. Limitate emissioni. Finalità di soccorso a Stati
in difficoltà Spagna, Grecia, Portogallo
2) Eurobond della BCE: sono sintetici o compositi dai titoli di stato acquistati con il QE nelle
proporzioni delle quote di capitale sottoscritte dagli Stati membri presso la BCE
3) Eurobond dell’EFSI (Fondo Europeo per gli Investimenti Strategici del Piano Juncker): sono
immaginari perché non c’è raccolta ma solo prestiti Bei con garanzie
© CRANEC/AQC
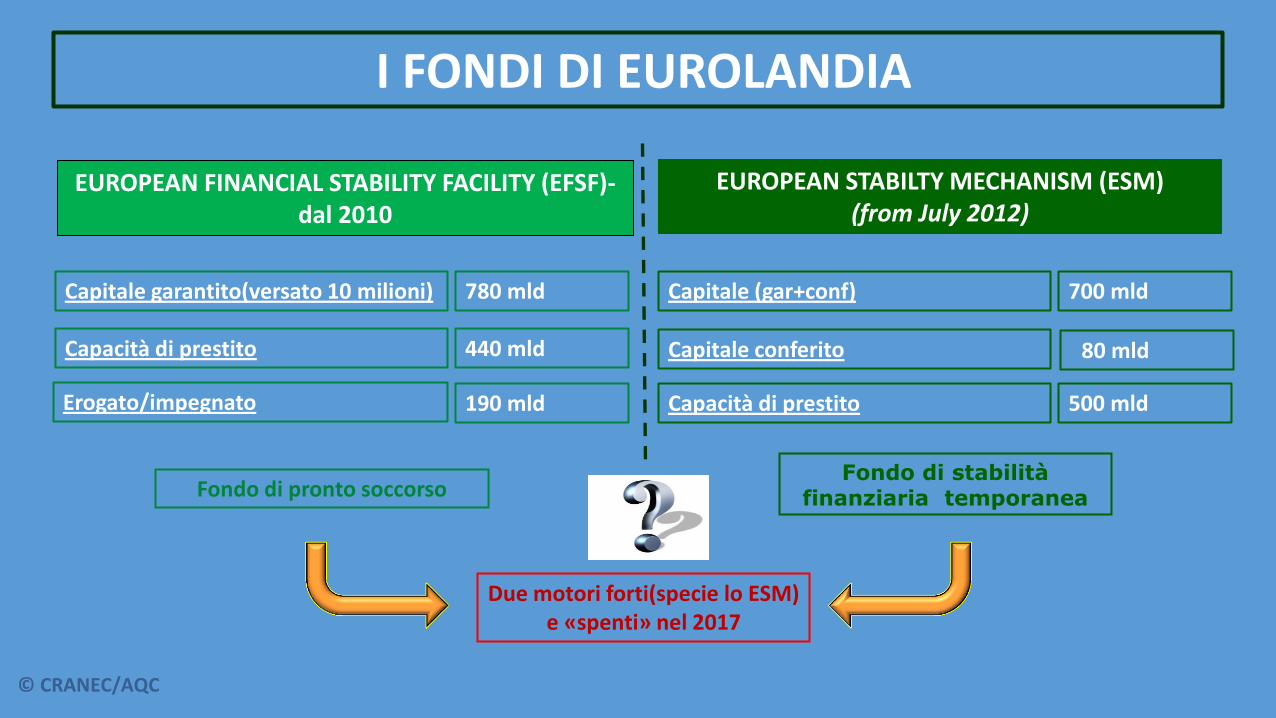
I FONDI DI EUROLANDIA
EUROPEAN FINANCIAL STABILITY FACILITY (EFSF)-dal 2010
EUROPEAN STABILTY MECHANISM (ESM) (from July 2012)
Fondo di pronto soccorso Fondo di stabilità
finanziaria temporanea
Due motori forti(specie lo ESM) e «spenti» nel 2017
Erogato/impegnato
Capacità di prestito
780 mld
190 mld
Capitale garantito(versato 10 milioni)
440 mld Capitale conferito
Capacità di prestito
700 mld
80 mld
Capitale (gar+conf)
500 mld
© CRANEC/AQC


© CRANEC/AQC

* Figures do mention the net disbursed amount for PT & IE, being the net loan amount minus the upfront fees and issuance costs paid by the beneficiary MS to the EFSF
at inception of the loan. Both are conventions for these countries. The net loan amount lent to IE and PT set in total €2bn higher. Contrarily the facility refers to the net
loan amount for GR.
** The initial programme amount for Greece was €144.6bn. This final amount is derived by excluding the undisbursed amount of €0.95bn of the PSI facility as well as
€10.93bn "Bank Recapitalisation Installment" and €1.81bn installment of the MFFA, whose availability periods have ended and are therefore no longer available.
Fonte: sito ESM, presentazione «European Financial Stability Facility & European Stability Mechanism», December 2017
EFSF lending programme
[as of November 2nd, 2017]

* Disbursements were made in-kind. All notes have now been exchanged for cash.
** Currently the entire €86bn programme for Greece is shown as funded by ESM; however, the initial programme buffer of €19.6bn is no longer expected to be disbursed and
the final ESM participation is also expected to be lower due to lower financing needs and alternative sources of financing (in particular IMF). ESM lending figures will be
adjusted when IMF participation becomes clearer.
** Initial programme amount for SP was €100 bn out of which €41,3 was disbursed during Availability Period. Availability period has ended on 31/12/13.
*** Spain has voluntarily prepaid €1.3bn on 08/07/14, €1.5bn on 17/03/15, €2.5bn on 14/07/15, €1bn on 11/11/2016 and €1bn on 14/06/2017, €2bn on 16/11/17 and made a
scheduled repayment of €0.3bn on 23/07/14.
**** Following expiration of Availability Period on 31 March 2016, remaining €2.67bn installment is no longer available for disbursement.
***** Greece early repaid €2.029bn on 20/02/2017
Fonte: sito ESM, presentazione «European Financial Stability Facility & European Stability Mechanism», December 2017
ESM lending programme
[as of November 2nd, 2017]
[as of November 2nd, 2017]
Fonte: sito ESM, presentazione «European Financial Stability Facility & European Stability Mechanism», December 2017
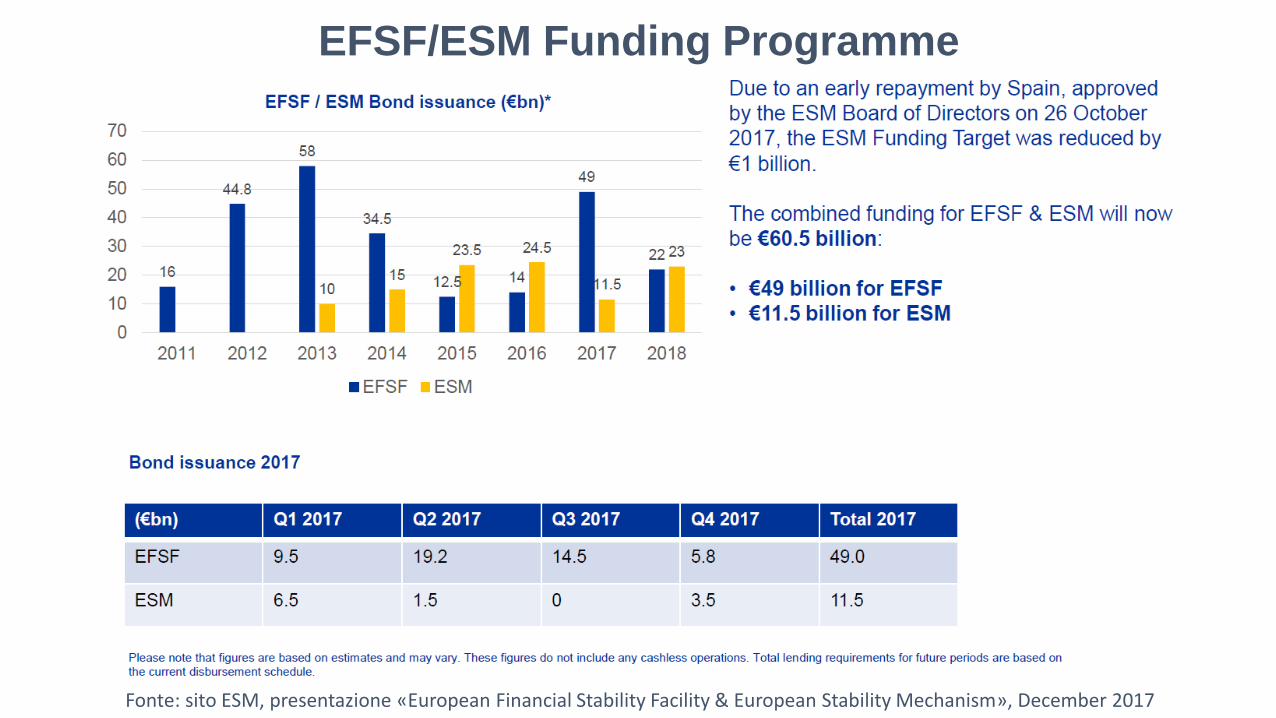
EFSF/ESM Funding Programme

Fonte: sito ESM, presentazione «European Financial Stability Facility & European Stability Mechanism», December 2017

Alcuni dati e fatti sullo ESM in sintesi (1/3)
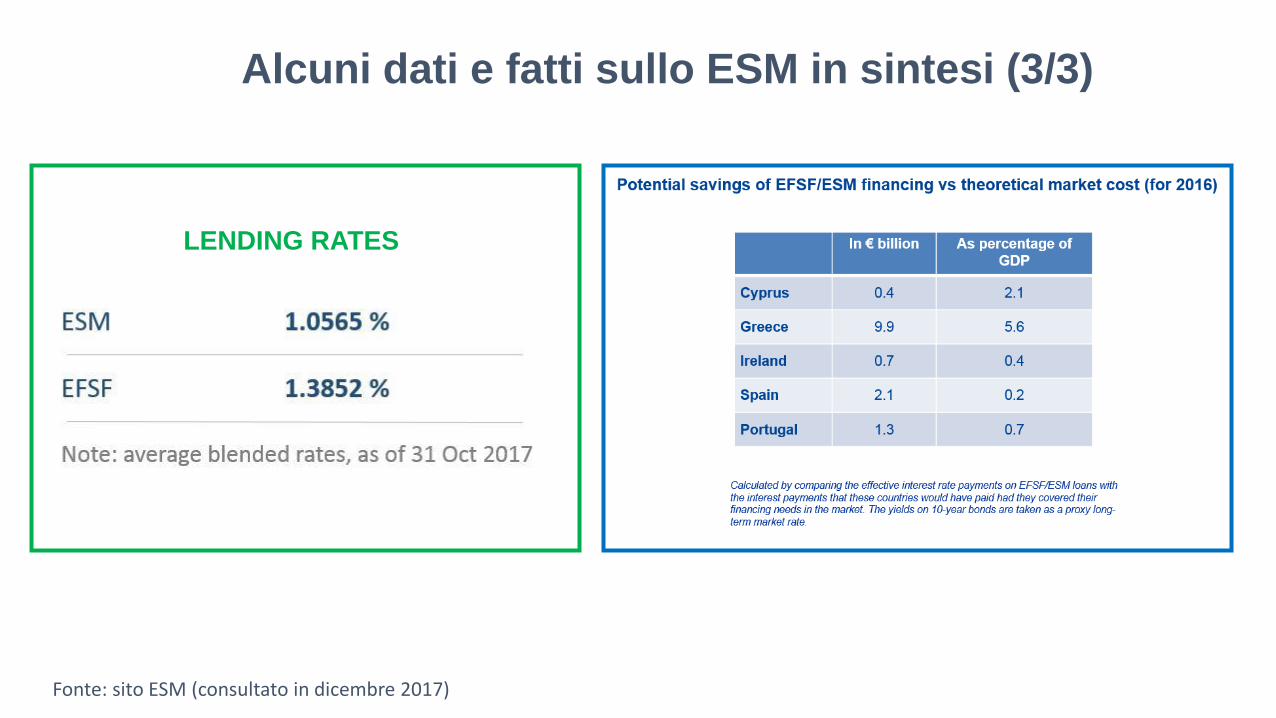
Fonte: sito ESM (consultato in dicembre 2017)

Fonte: sito ESM (consultato in dicembre 2017)
Alcuni dati e fatti sullo ESM in sintesi (2/3)
Fonte: sito ESM (consultato in dicembre 2017)
Alcuni dati e fatti sullo ESM in sintesi (3/3)
LENDING RATES
La BCE e lo ESM: un «connubio» virtuoso possibile
© CRANEC/AQC
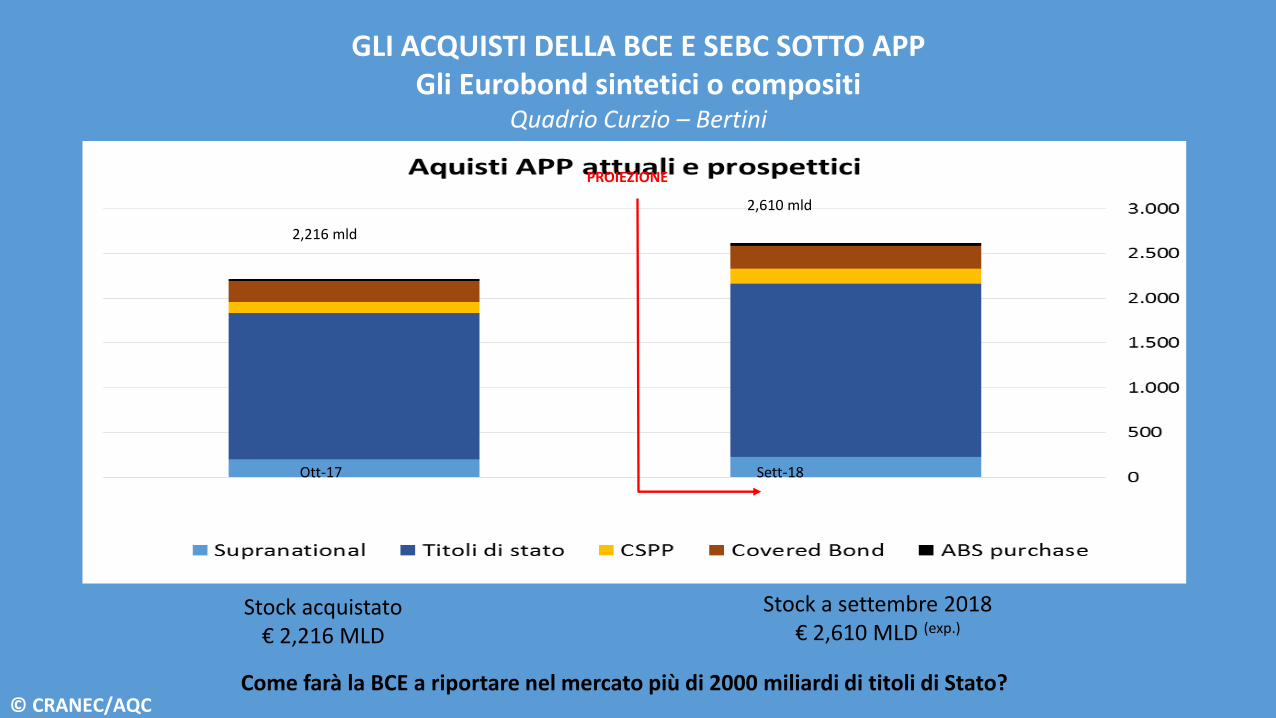
GLI ACQUISTI DELLA BCE E SEBC SOTTO APP Gli Eurobond sintetici o compositi
Quadrio Curzio – Bertini
PROIEZIONE
Stock acquistato € 2,216 MLD
Ott-17
2,216 mld
2,610 mld
Sett-18
Stock a settembre 2018 € 2,610 MLD (exp.)
Come farà la BCE a riportare nel mercato più di 2000 miliardi di titoli di Stato? © CRANEC/AQC

ESM = FFE+FES BCE RIENTRA DALLA POLITICA MONETARIA
ESPANSIVA QE (APP DI CUI PSPP E CSPP +
TLTRO ) MARZO 2015
IMPULSO ALLA COESIONE EUROPEA E 2° PILASTRO ALLA IRREVERSIBITA’ DEL PROGETTO UEM
MODIFICA ESM MARZO 2018
CREAZIONE di due SPV MARZO 2018
STRUTTURAZIONE PORTAFOGLI DI
GARANZIA OTTOBRE 2018
EMISSIONE di EueoUnionBond = a EURO(SAFE)BOND più EUROINVESTMENT BOND
MARZO 2019
IMPULSO ALLA CRESCITA di € MLD da 675 a 3,350
secondo la leva (da 3 a 15)
DALL’ESM ALL’EURO-MEF:
fine mandato Draghi alla BCE OTTOBRE 2019
3° Pilastro BANKING UNION
European Deposit Insurance
© CRANEC/AQC
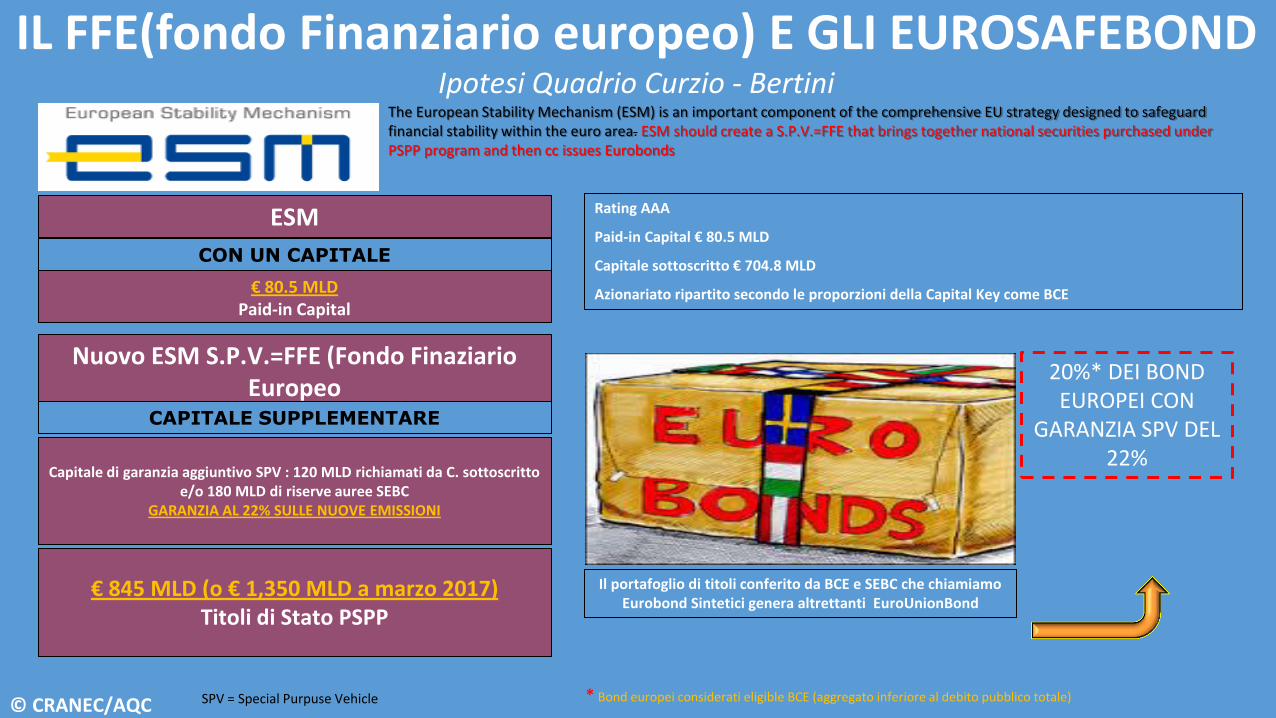
IL FFE(fondo Finanziario europeo) E GLI EUROSAFEBOND Ipotesi Quadrio Curzio - Bertini
SPV = Special Purpuse Vehicle
The European Stability Mechanism (ESM) is an important component of the comprehensive EU strategy designed to safeguard financial stability within the euro area. ESM should create a S.P.V.=FFE that brings together national securities purchased under PSPP program and then cc issues Eurobonds
ESM
Nuovo ESM S.P.V.=FFE (Fondo Finaziario Europeo
Rating AAA
Paid-in Capital € 80.5 MLD
Capitale sottoscritto € 704.8 MLD
Azionariato ripartito secondo le proporzioni della Capital Key come BCE € 80.5 MLD Paid-in Capital
CAPITALE SUPPLEMENTARE
€ 845 MLD (o € 1,350 MLD a marzo 2017) Titoli di Stato PSPP
Capitale di garanzia aggiuntivo SPV : 120 MLD richiamati da C. sottoscritto e/o 180 MLD di riserve auree SEBC
GARANZIA AL 22% SULLE NUOVE EMISSIONI
Il portafoglio di titoli conferito da BCE e SEBC che chiamiamo Eurobond Sintetici genera altrettanti EuroUnionBond
20%* DEI BOND EUROPEI CON
GARANZIA SPV DEL 22%
* Bond europei considerati eligible BCE (aggregato inferiore al debito pubblico totale)
CON UN CAPITALE
© CRANEC/AQC

3
Nuove emissioni € 3375 MLD
IL FES (fondo europeo sviluppo)E EUROINVESTMENTBOND Ipotesi Quadrio Curzio - Bertini
€ 8 MLD Paid-in Capital + 8MLD impegnati € 5 MLD dalla BEI
CON UN CAPITALE
Elevare in chiave pro-ciclica l’attività attualmente svolta da FEIS e BEI in complementarietà con il Piano Juncker
Dal FEIS del Piano Juncker al FES
FEIS Attuale
Effetto moltiplicatore stimato P-Juncker 1 : 15 = € 315 MLD (exp.)
Ipotesi Rating : AAA
CAPITALE GARAZIA TOT. € 250 MLD
SPV FES EUROINVESTMENTBOND
FEIS Cap. Upgrade
+ Riserve Auree SEBC PER € 107 MLD+120 da ESM
Trasferimento all’SPV-FES dei Titolo Supranational e sotto CSPP € 122 MLD (o € 225 MLD a marzo 2017)
EMISSIONE DI EUROINVESTMENTBOND
Nuove emissioni € 1125 MLD
1
Leva fin. 1 : 3 Garanzia SPV 37%
Nuove emissioni € 675 MLD
base* 2
Leva fin. 1 : 5
Garanzia SPV 22%
accelerata*
Leva fin. 1 : 15
Garanzia SPV 7,5%
P.Juncker*
* La leva finanziaria deve esse dipendente dai tassi BCE per favorire collegamento e pro-ciclicità della politica monetaria
Ipotesi Ipotesi Ipotesi
© CRANEC/AQC

Il Piano Juncker è un buon inizio per gli investimenti
© CRANEC/AQC
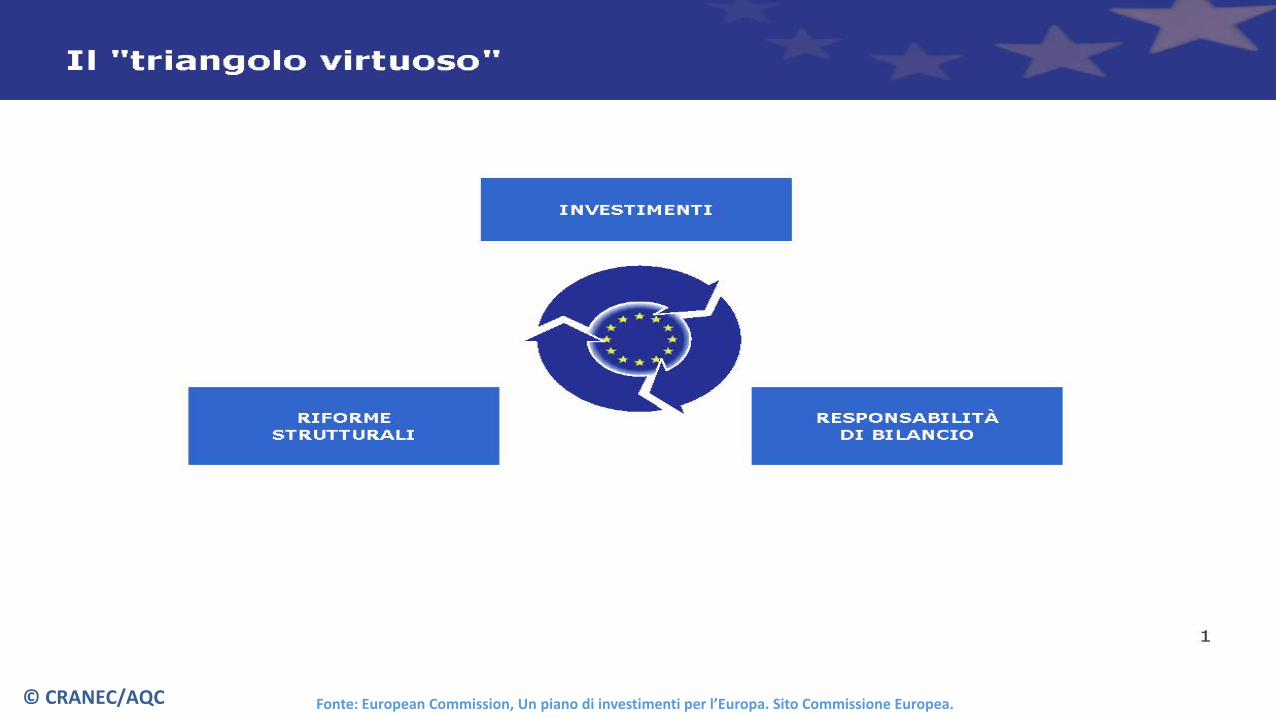
Fonte: European Commission, Un piano di investimenti per l’Europa. Sito Commissione Europea. © CRANEC/AQC

Fonte: European Commission, Un piano di investimenti per l’Europa. Sito Commissione Europea.
Troppe buone intenzioni
© CRANEC/AQC
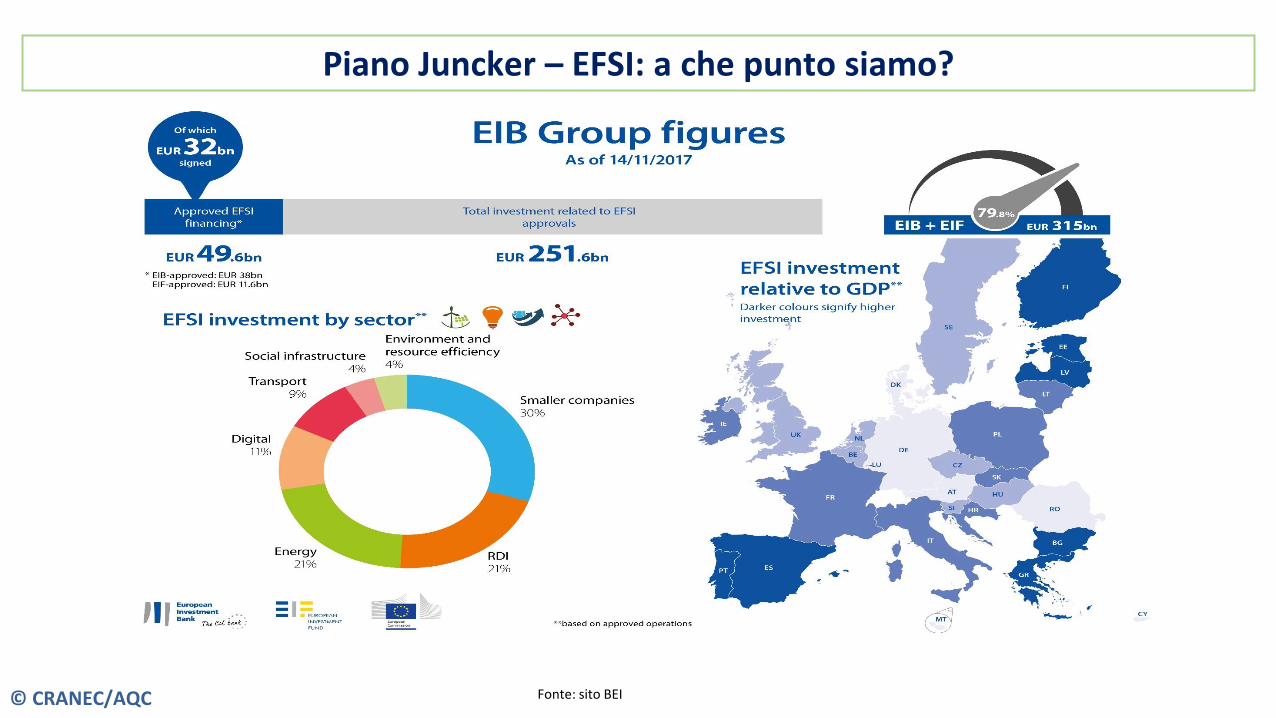
Piano Juncker – EFSI: a che punto siamo?
Fonte: sito BEI © CRANEC/AQC
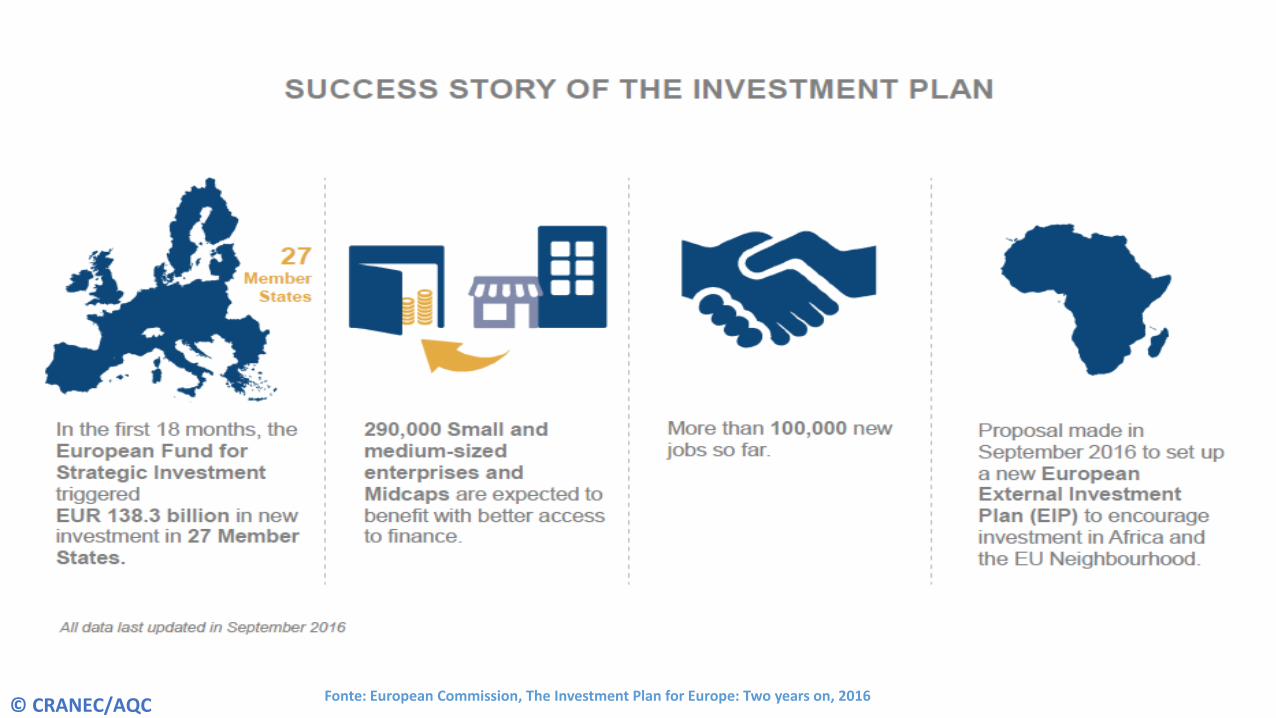
Fonte: European Commission, The Investment Plan for Europe: Two years on, 2016
© CRANEC/AQC

Che non basta per recuperare gli investimenti europei nella crisi: ci vogliono gli Euroinvestmentbond
© CRANEC/AQC

Fonte: DG ECFIN, AMECO Database, 2016 © CRANEC/AQC
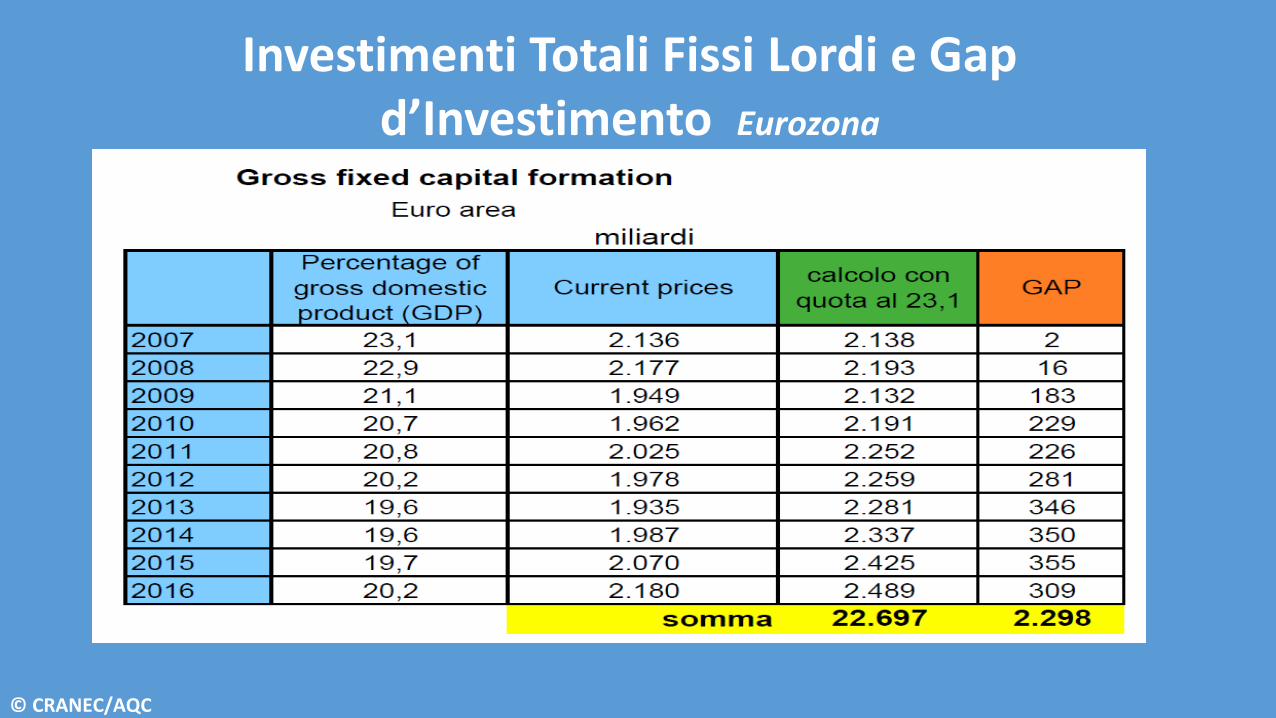
Investimenti Totali Fissi Lordi e Gap d’Investimento Eurozona
© CRANEC/AQC

How big are Europe’s investment gaps?
Fonte: EIB, Restoring EU Competitiveness, 2016 © CRANEC/AQC
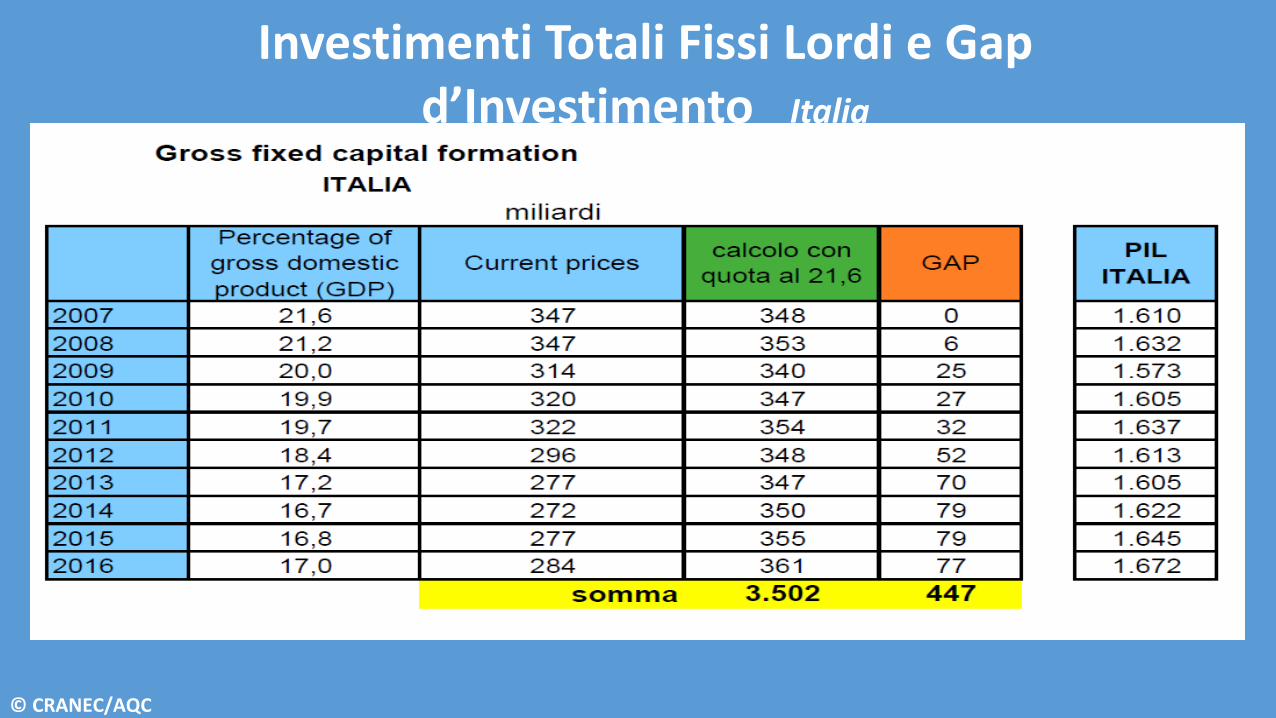
Investimenti Totali Fissi Lordi e Gap d’Investimento Italia
© CRANEC/AQC
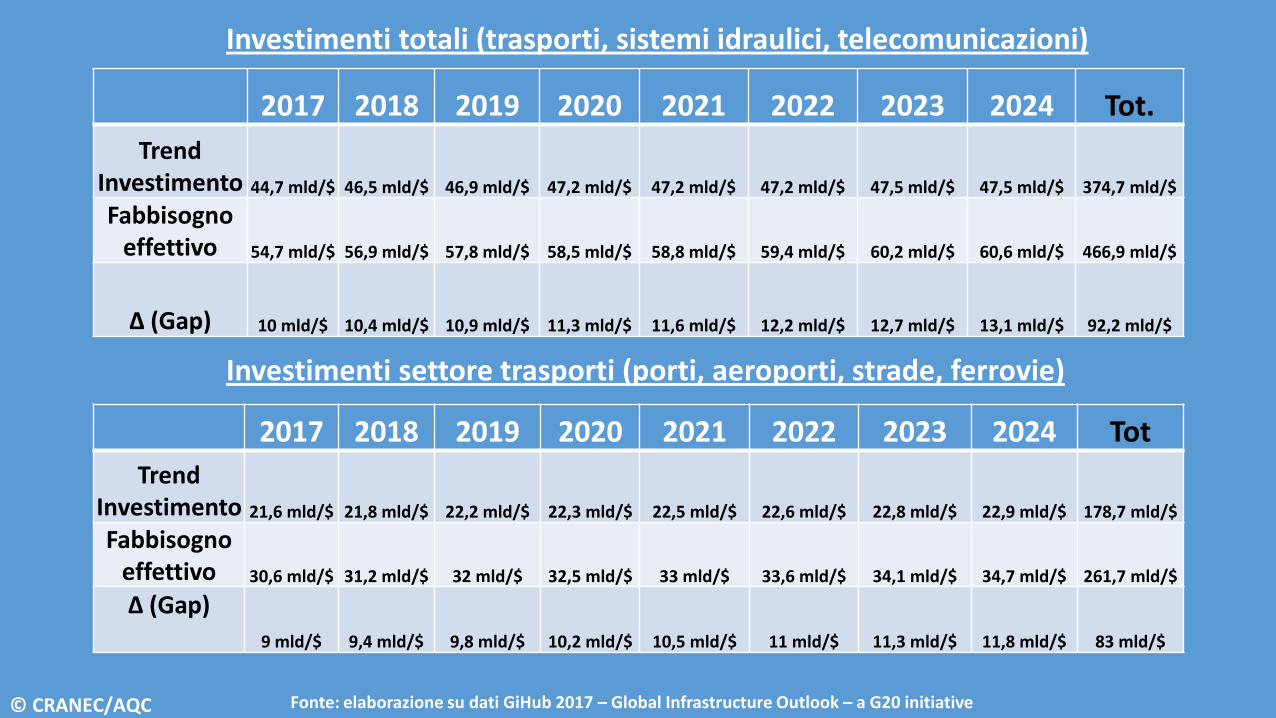
Investimenti settore trasporti (porti, aeroporti, strade, ferrovie)
Investimenti totali (trasporti, sistemi idraulici, telecomunicazioni)
Fonte: elaborazione su dati GiHub 2017 – Global Infrastructure Outlook – a G20 initiative
2017 2018 2019 2020 2021 2022 2023 2024 Tot
Trend Investimento 21,6 mld/$ 21,8 mld/$ 22,2 mld/$ 22,3 mld/$ 22,5 mld/$ 22,6 mld/$ 22,8 mld/$ 22,9 mld/$ 178,7 mld/$
Fabbisogno effettivo 30,6 mld/$ 31,2 mld/$ 32 mld/$ 32,5 mld/$ 33 mld/$ 33,6 mld/$ 34,1 mld/$ 34,7 mld/$ 261,7 mld/$
Δ (Gap) 9 mld/$ 9,4 mld/$ 9,8 mld/$ 10,2 mld/$ 10,5 mld/$ 11 mld/$ 11,3 mld/$ 11,8 mld/$ 83 mld/$
2017 2018 2019 2020 2021 2022 2023 2024 Tot.
Trend Investimento 44,7 mld/$ 46,5 mld/$ 46,9 mld/$ 47,2 mld/$ 47,2 mld/$ 47,2 mld/$ 47,5 mld/$ 47,5 mld/$ 374,7 mld/$
Fabbisogno effettivo 54,7 mld/$ 56,9 mld/$ 57,8 mld/$ 58,5 mld/$ 58,8 mld/$ 59,4 mld/$ 60,2 mld/$ 60,6 mld/$ 466,9 mld/$
Δ (Gap) 10 mld/$ 10,4 mld/$ 10,9 mld/$ 11,3 mld/$ 11,6 mld/$ 12,2 mld/$ 12,7 mld/$ 13,1 mld/$ 92,2 mld/$
© CRANEC/AQC

CRANEC – CENTRO DI RICERCHE IN ANALISI ECONOMICA FONDAZIONE ASTRID
Università Cattolica del Sacro Cuore
Lunedi 4 Dicembre 2017
Prof. Alberto Quadrio Curzio Accademia Nazionale dei Lincei Università Cattolica del Sacro Cuore
@: non citare senza il permesso dell’autore / do not cite without author’s permission
Gli Euro-Union Bond= Euro-Safe Bond+Euro-InvestmentBond
il traguardo