TQiIit Terra Quasi-Incognita: Beyond the 2°C LineTerra Quasi-Incognita: Beyond the 2°C Line...
20
9/28/2009 1 T Q i I it Professor H. J. Schellnhuber CBE Potsdam Institute for Climate Impact Research T erra Quasi-Incognita: Beyond the 2°C Line Authors Johan Rockström, Will Steffen, Kevin Noone, Åsa Persson, F. Stuart Chapin, III, Eric F. Lambin, Timothy M. Lenton, Marten Scheffer, Carl Folke Hans Joachim Schellnhuber Björn Carl Folke, Hans Joachim Schellnhuber, Björn Nykvist, Cynthia A. de Wit, Terry Hughes, Sander van der Leeuw, Henning Rodhe, Sverker Sörlin, Peter K. Snyder, Robert Costanza, Uno Svedin, Malin Falkenmark, Louise Karlberg, Robert W. Corell, Victoria J. Fabry, James Hansen, Brian Walker, Diana Liverman, Katherine Richardson, Paul Crutzen, Jonathan A. Foley
Transcript of TQiIit Terra Quasi-Incognita: Beyond the 2°C LineTerra Quasi-Incognita: Beyond the 2°C Line...
9/28/2009
1
T Q i I it
Professor H. J. Schellnhuber CBEPotsdam Institute for Climate Impact Research
Terra Quasi-Incognita:Beyond the 2°C Line
p
AuthorsJohan Rockström, Will Steffen, Kevin Noone, Åsa Persson, F. Stuart Chapin, III, Eric F. Lambin, Timothy M. Lenton, Marten Scheffer, Carl Folke Hans Joachim Schellnhuber BjörnCarl Folke, Hans Joachim Schellnhuber, Björn Nykvist, Cynthia A. de Wit, Terry Hughes, Sander van der Leeuw, Henning Rodhe, Sverker Sörlin, Peter K. Snyder, Robert Costanza, Uno Svedin, Malin Falkenmark, Louise Karlberg, Robert W. Corell, Victoria J. Fabry, James Hansen, Brian Walker, Diana Liverman, Katherine Richardson, Paul Crutzen, Jonathan A. Foley
9/28/2009
2
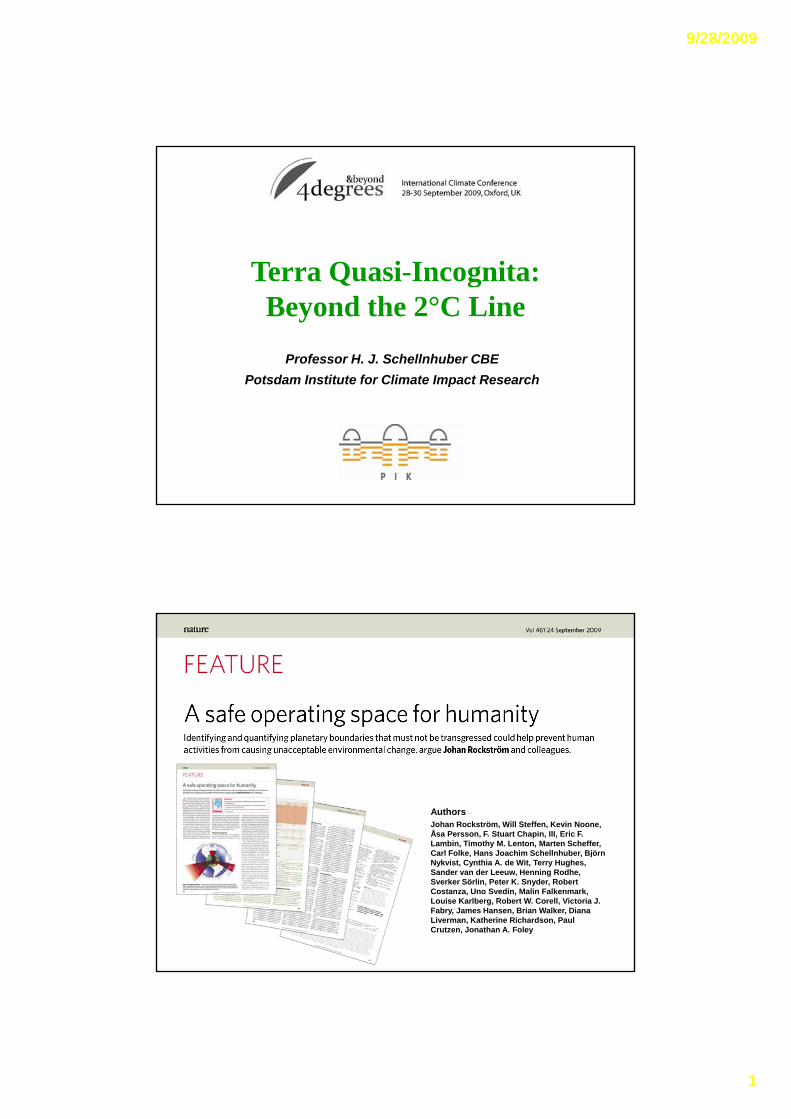
1995: The WBGU Tolerable Windows Approach
First justification / operationalization of the 2°C guardrail
9/28/2009
3
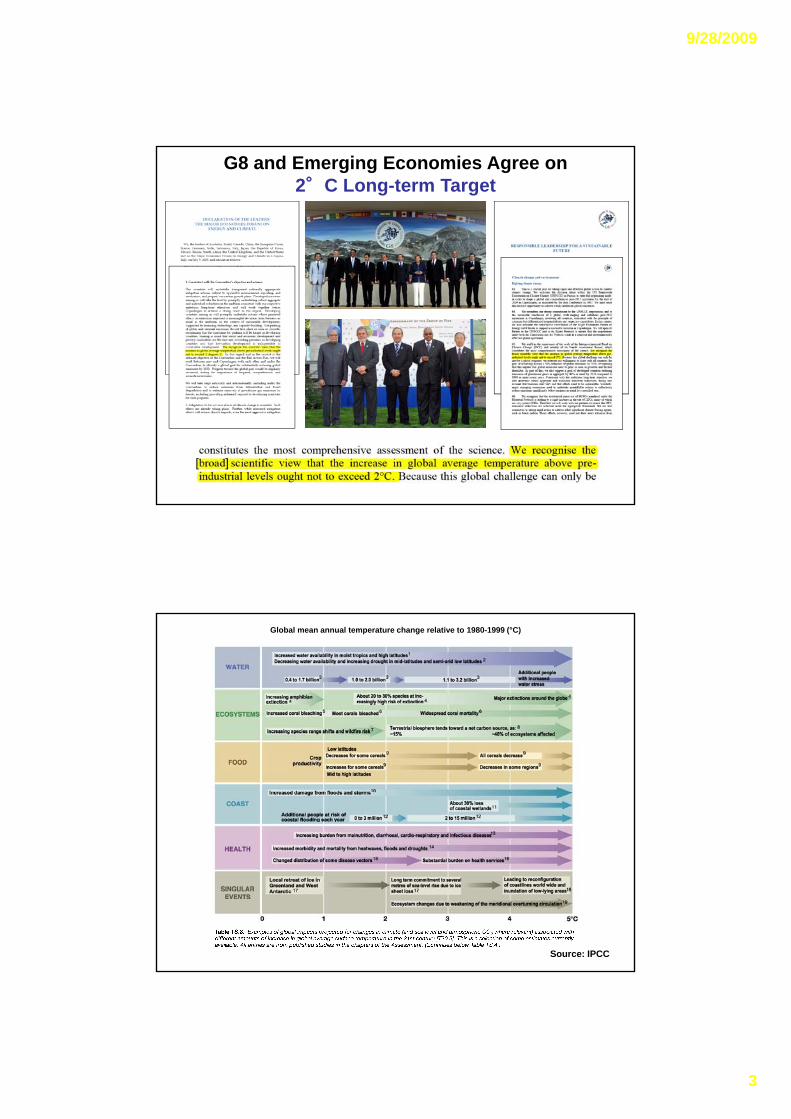
G8 and Emerging Economies Agree on 2°C Long-term Target
[ ]
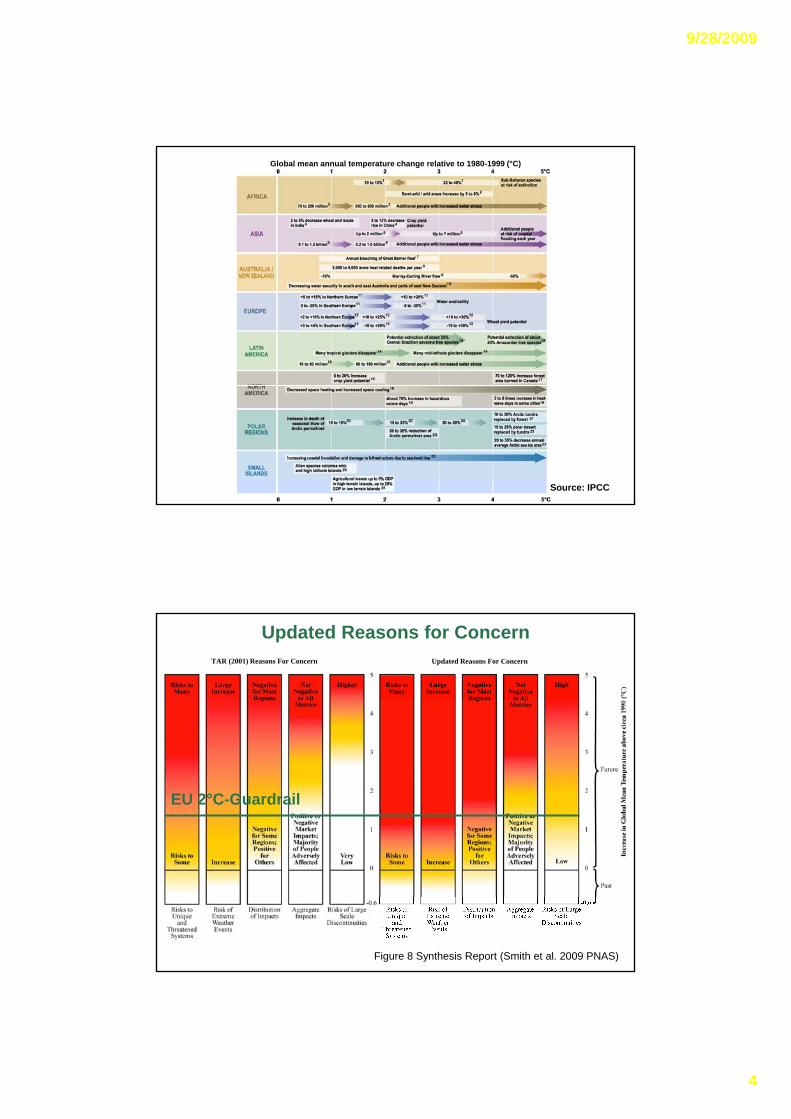
Global mean annual temperature change relative to 1980-1999 (°C)
Source: IPCC
9/28/2009
4
Global mean annual temperature change relative to 1980-1999 (°C)
Source: IPCC
TAR (2001) Reasons For Concern Updated Reasons For Concern
Updated Reasons for Concern
EU 2°C-Guardrail
Figure 8 Synthesis Report (Smith et al. 2009 PNAS)
9/28/2009
5
MILESTONES of the Great TransformationAn effective and just global agreement on climate change
A low carbon infrastructure
Forest protection, conservation and restoration
„[…] we should confine the temperature rise to 2°C to avoid unmanageable climate„[…] we should confine the temperature rise to 2 C to avoid unmanageable climate risks. This can only be achieved
• with a peak of global emissions of all greenhouse gases by 2015
• at least a 50% emission reduction by 2050 on a 1990 baseline. […] developed countries have to aim for a 25-40% reduction by 2020.
[…] a total carbon budget […] should be accepted as the base for measuring the effectiveness of short-term (2020) and long-term (2050) targets“
9/28/2009
6
Meinshausen et al. 2009aAllen et al. 2009
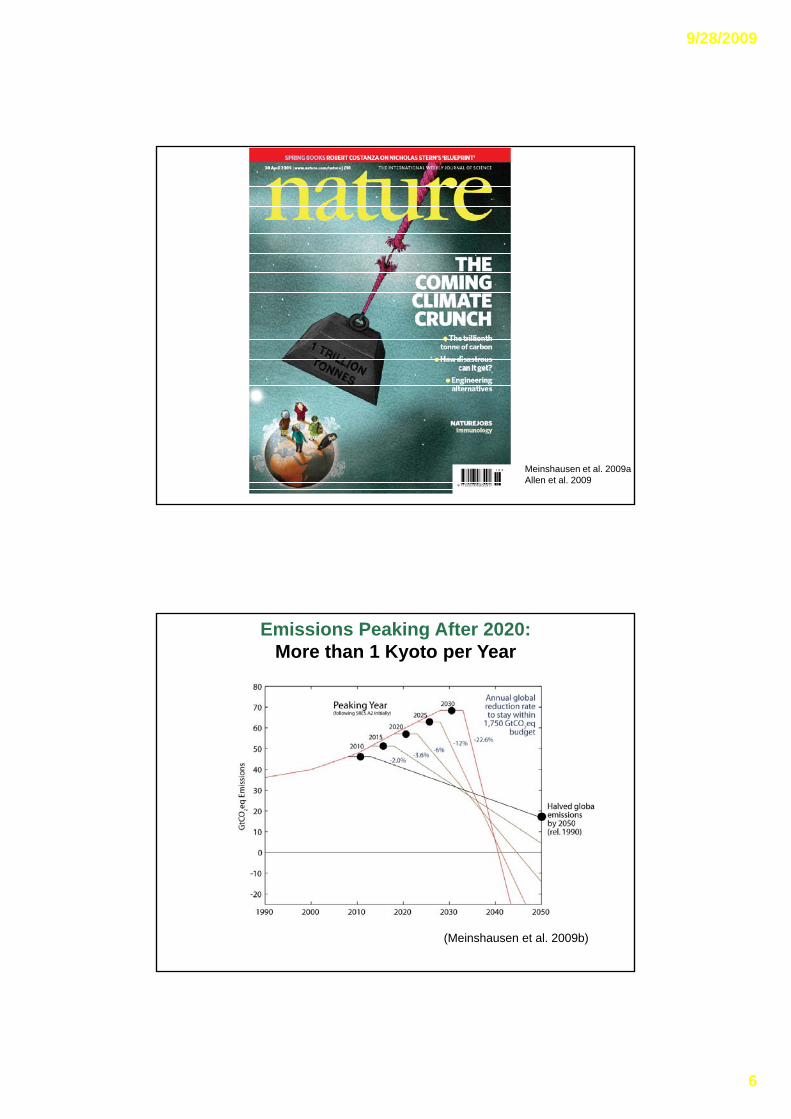
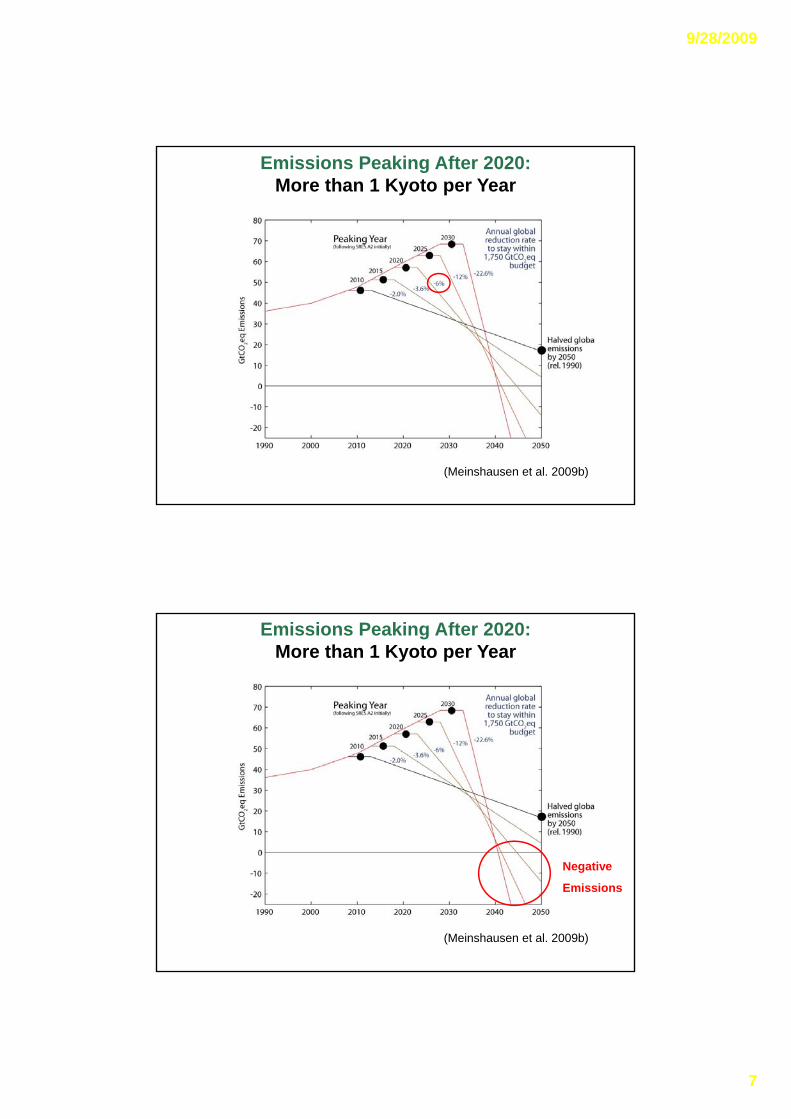
Emissions Peaking After 2020:More than 1 Kyoto per Year
(Meinshausen et al. 2009b)
9/28/2009
7
Emissions Peaking After 2020: More than 1 Kyoto per Year
(Meinshausen et al. 2009b)
Emissions Peaking After 2020:More than 1 Kyoto per Year
Negative
Emissions
(Meinshausen et al. 2009b)
9/28/2009
8
∫=2
1
)()(T
Tglobglob dttEpC
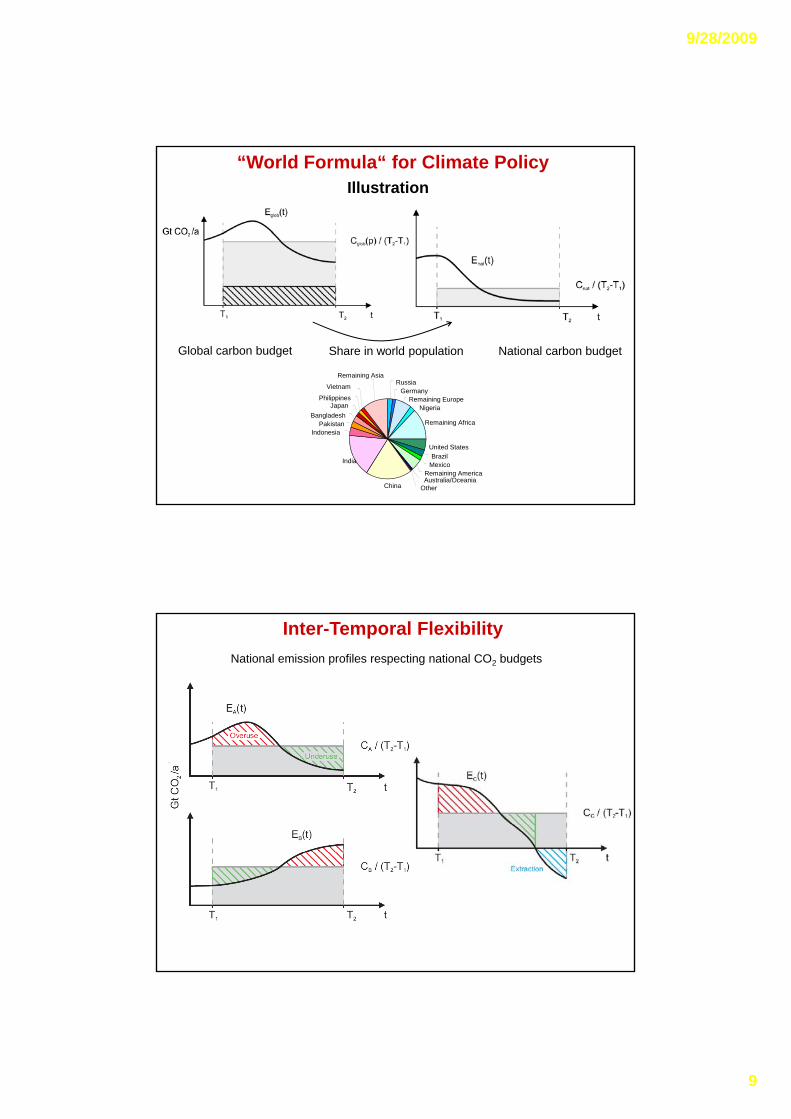
“World Formula” for Climate Policy
)()()()(
2
1 Mglob
Mnatglob
T
Tnatnat TM
TMpCdttEC == ∫
Total global CO2 budget in period [T1,T2] that keeps global warming below 2°C with probability p
Integral over global profile of CO2 emissions
National CO2budget in [T1,T2]
Integral over national emission profile
Fraction of global CO2 budget as determined by ratio of national population Mnat to world population Mglob at time TM
9/28/2009
9
“World Formula“ for Climate PolicyIllustration
Russia Vietnam
Remaining Asia
Share in world populationGlobal carbon budget National carbon budget
Germany Remaining Europe
Nigeria
Remaining Africa
United States Brazil
Mexico Remaining America
China
India
Indonesia Pakistan
Bangladesh Japan
Philippines
Vietnam
Australia/OceaniaOther
Inter-Temporal FlexibilityNational emission profiles respecting national CO2 budgets
9/28/2009
10
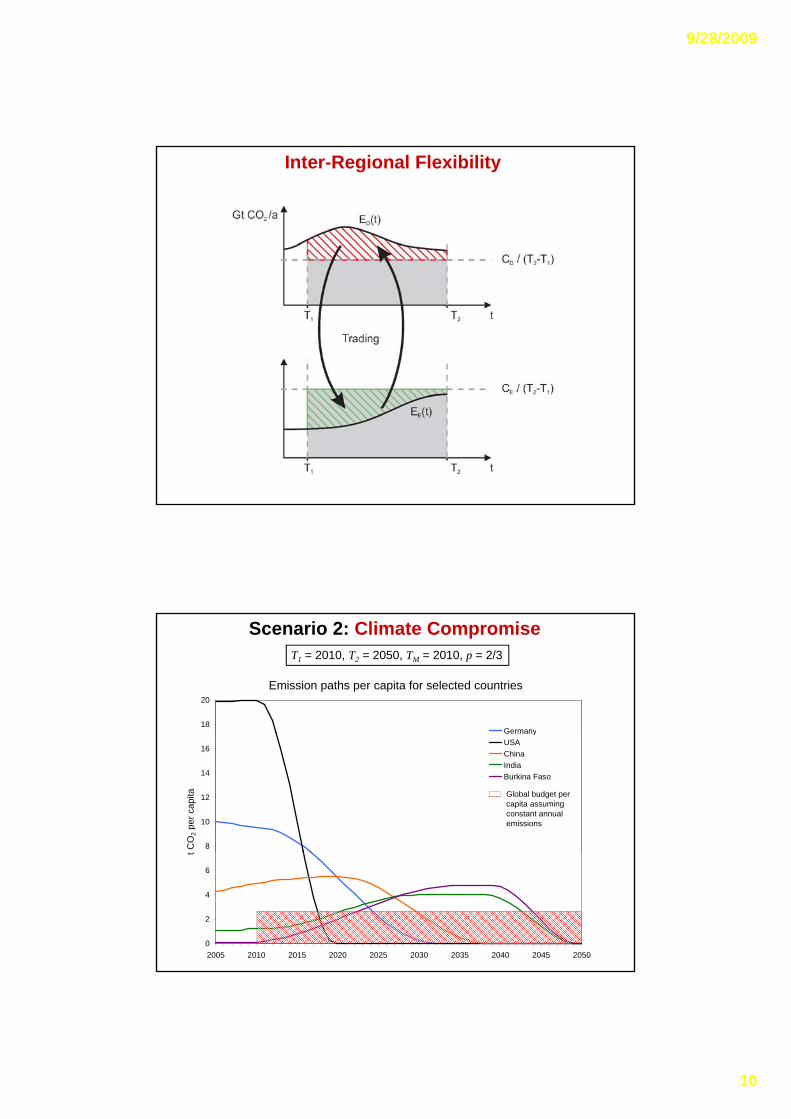
Inter-Regional Flexibility
Scenario 2: Climate CompromiseT1 = 2010, T2 = 2050, TM = 2010, p = 2/3
Emission paths per capita for selected countries
18
20
Germany
8
10
12
14
16
CO
2 per
cap
ita
GermanyUSAChinaIndiaBurkina Faso
Global budget per capita assumingconstant annual emissions
0
2
4
6
2005 2010 2015 2020 2025 2030 2035 2040 2045 2050
t
9/28/2009
11
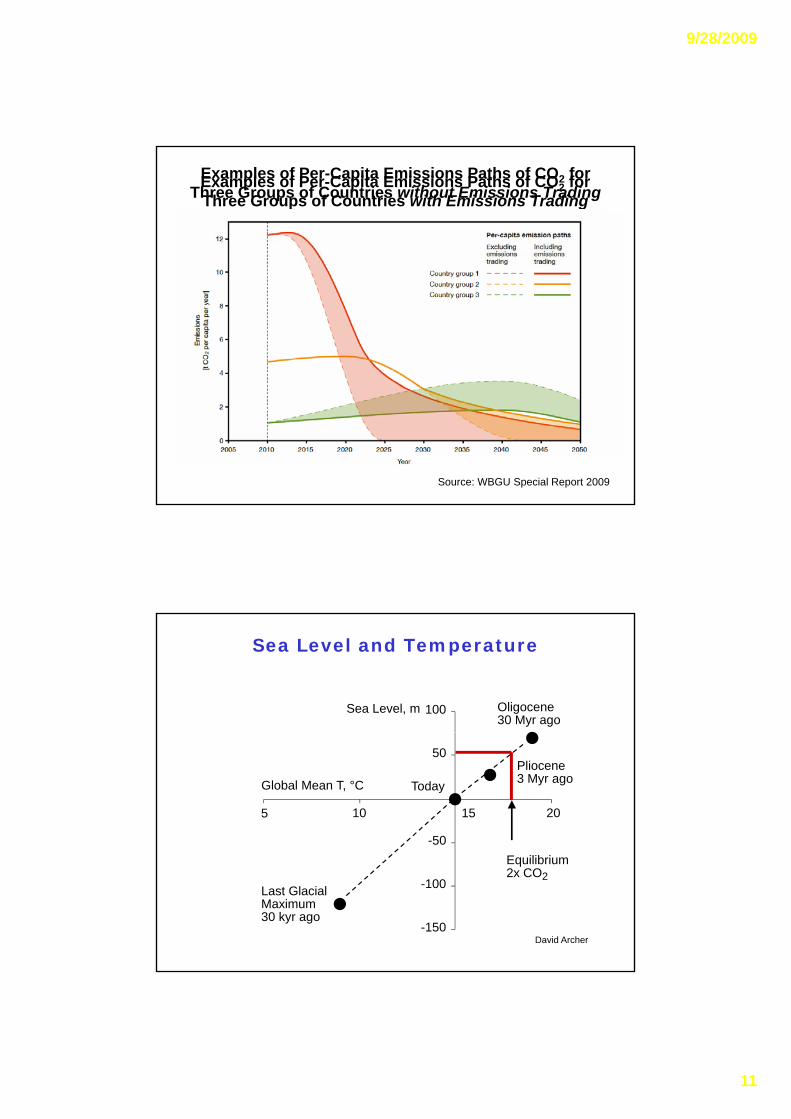
Examples of Per-Capita Emissions Paths of CO2 for Three Groups of Countries without Emissions TradingExamples of Per-Capita Emissions Paths of CO2 for
Three Groups of Countries with Emissions Trading
Source: WBGU Special Report 2009
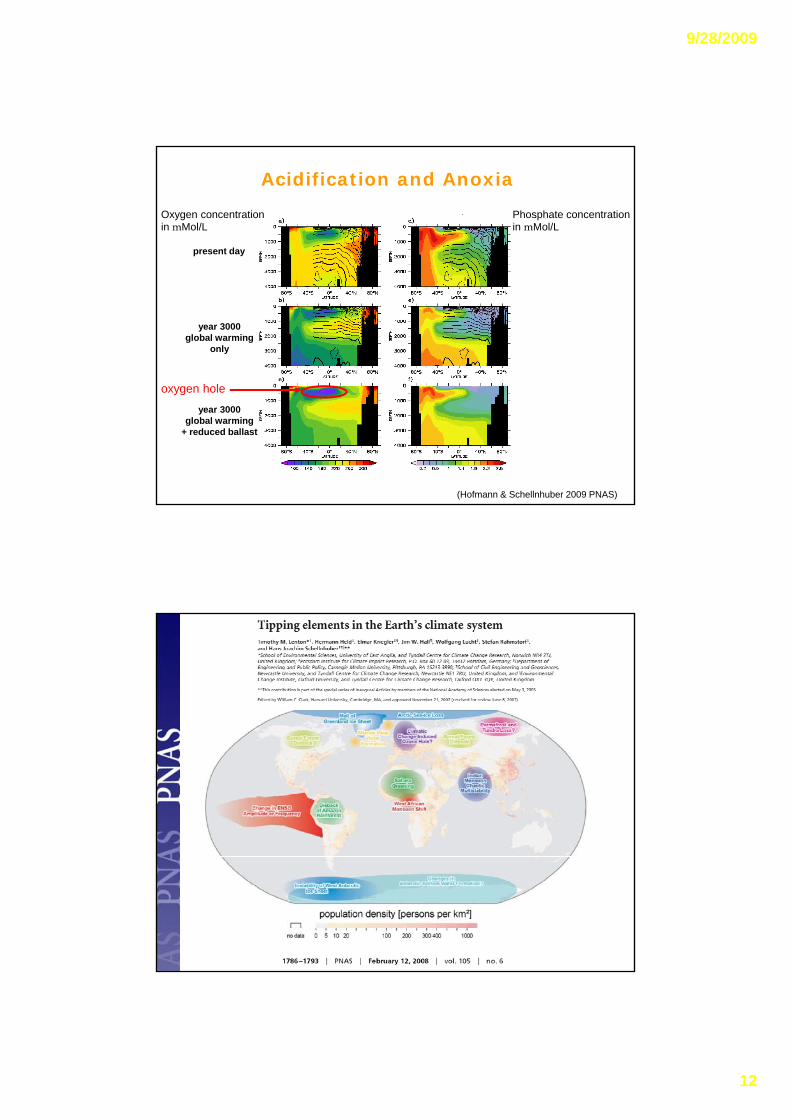
Sea Level, m Oligocene30 Myr ago
100
Sea Level and Temperature
Today
50Pliocene3 Myr ago
1510
-50
205
Global Mean T, °C
-100
Equilibrium2x CO2
Last GlacialMaximum30 kyr ago
-150David Archer
9/28/2009
12
Acidification and Anoxia
Oxygen concentrationin mMol/L
Phosphate concentrationin mMol/L
present day
h l
year 3000global warming
only
(Hofmann & Schellnhuber 2009 PNAS)
oxygen hole
year 3000global warming
+ reduced ballast
9/28/2009
13
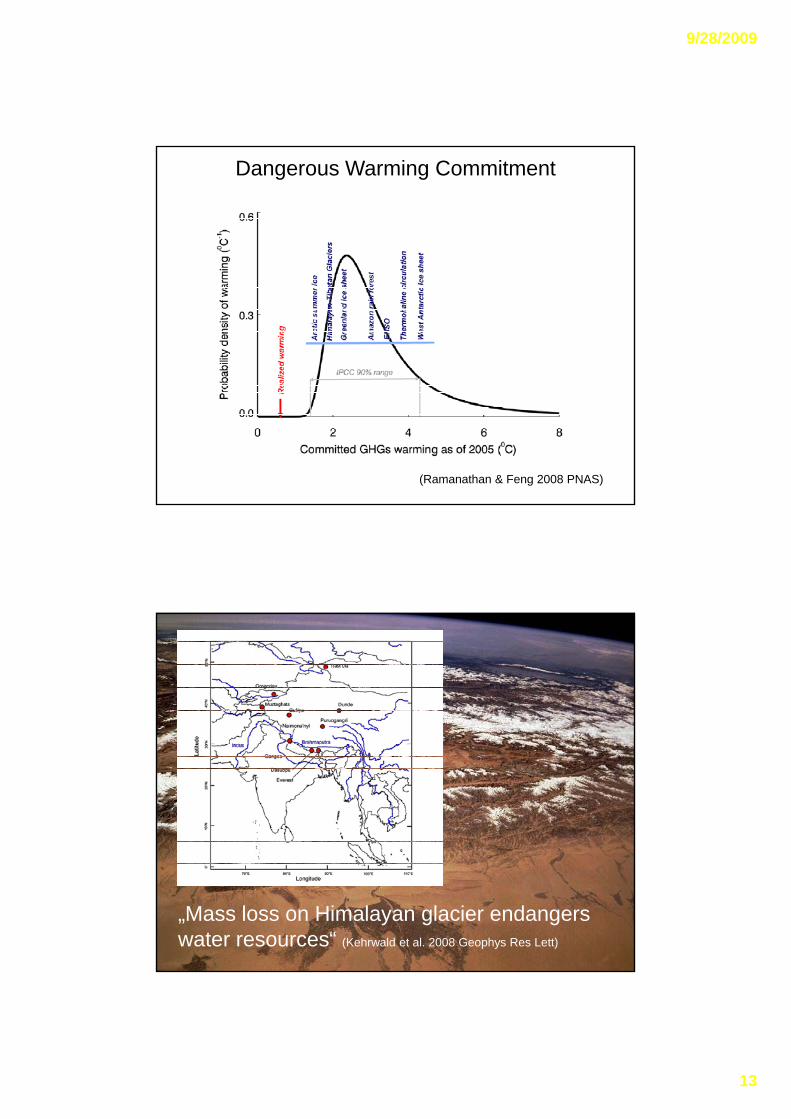
Dangerous Warming Commitment
(Ramanathan & Feng 2008 PNAS)
„Mass loss on Himalayan glacier endangers water resources“ (Kehrwald et al. 2008 Geophys Res Lett)
9/28/2009
14
Nature, 24 Sep 2009
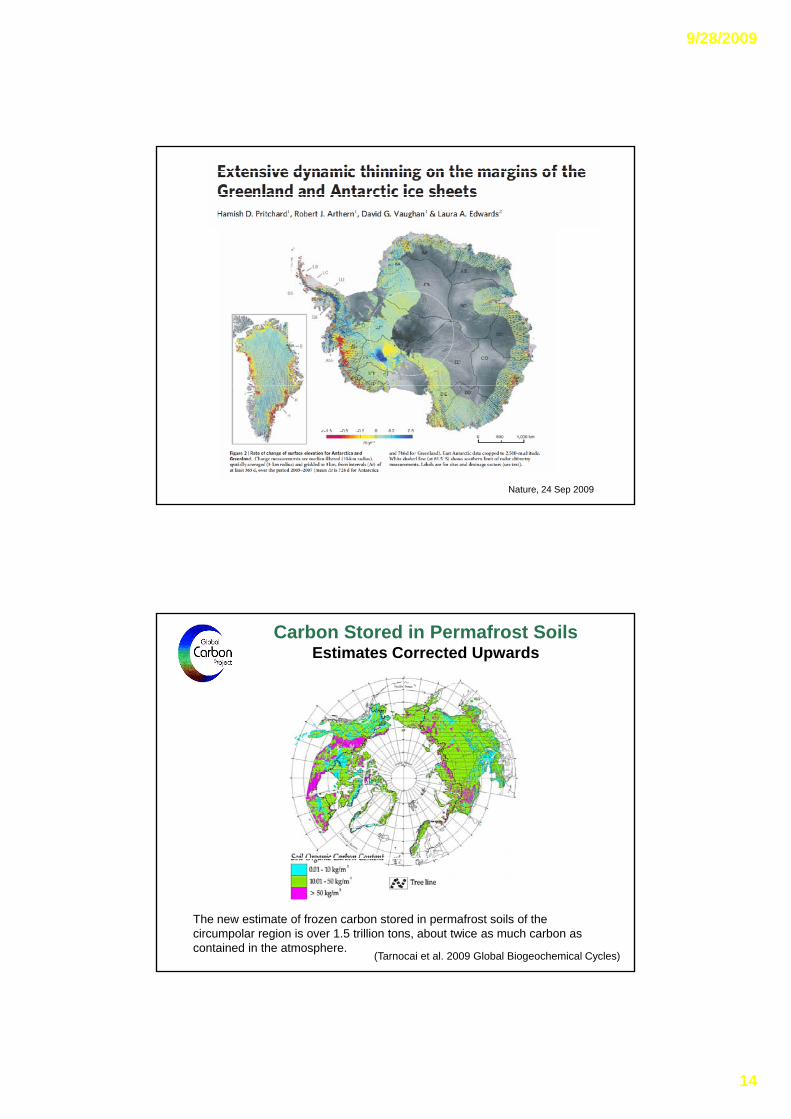
Carbon Stored in Permafrost SoilsEstimates Corrected Upwards
(Tarnocai et al. 2009 Global Biogeochemical Cycles)
The new estimate of frozen carbon stored in permafrost soils of the circumpolar region is over 1.5 trillion tons, about twice as much carbon as contained in the atmosphere.
9/28/2009
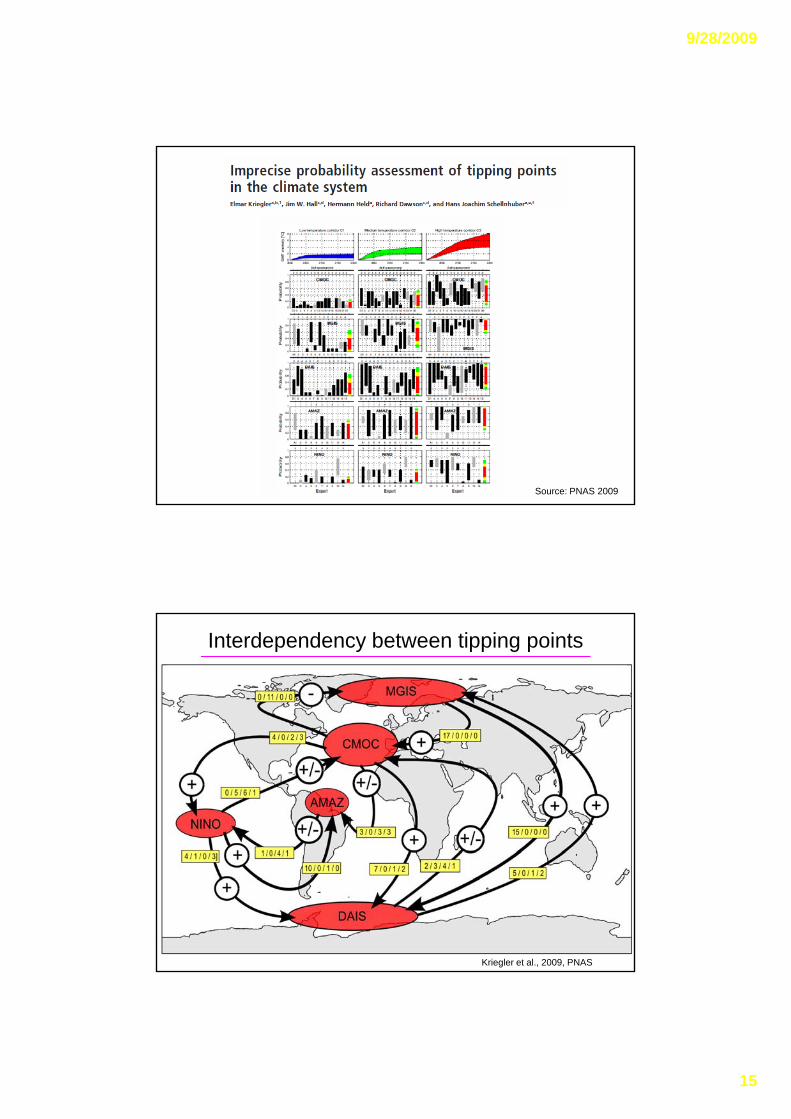
15
Source: PNAS 2009
Interdependency between tipping points
Kriegler et al., 2009, PNAS
9/28/2009
16
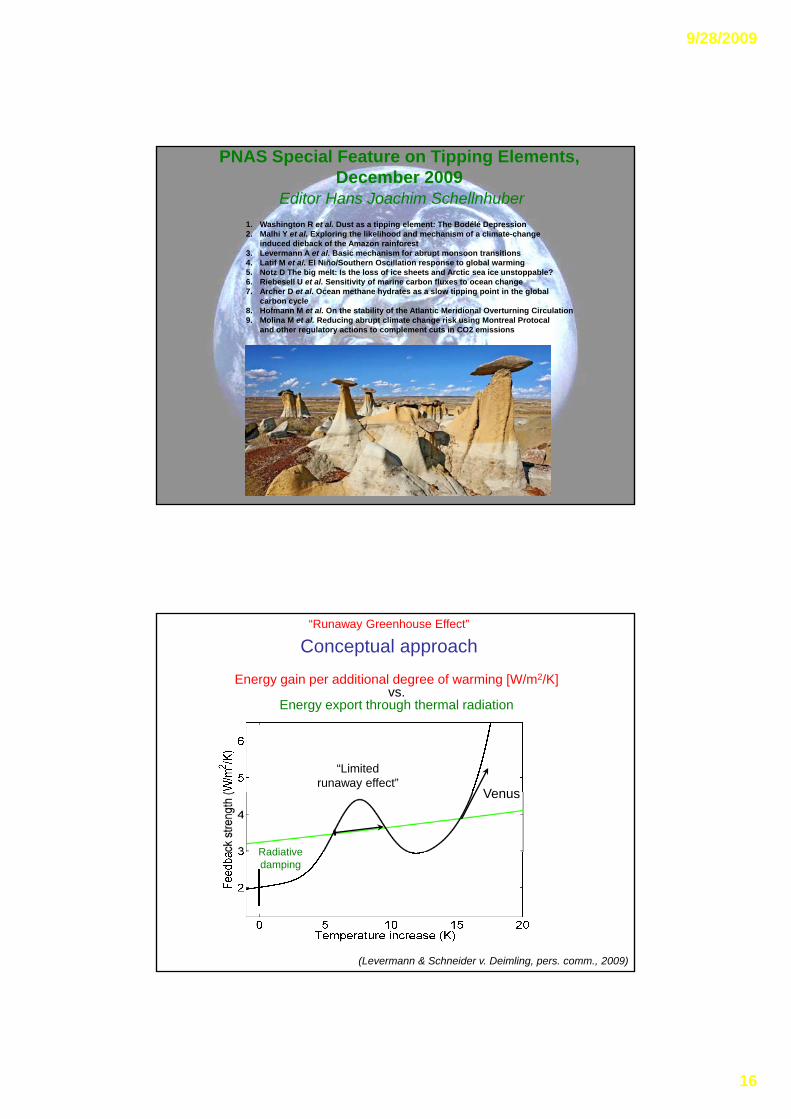
1. Washington R et al. Dust as a tipping element: The Bodélé Depression2. Malhi Y et al. Exploring the likelihood and mechanism of a climate-change
induced dieback of the Amazon rainforest3. Levermann A et al. Basic mechanism for abrupt monsoon transitions4. Latif M et al. El Niño/Southern Oscillation response to global warming
PNAS Special Feature on Tipping Elements, December 2009
Editor Hans Joachim Schellnhuber
p g g5. Notz D The big melt: Is the loss of ice sheets and Arctic sea ice unstoppable? 6. Riebesell U et al. Sensitivity of marine carbon fluxes to ocean change7. Archer D et al. Ocean methane hydrates as a slow tipping point in the global
carbon cycle8. Hofmann M et al. On the stability of the Atlantic Meridional Overturning Circulation9. Molina M et al. Reducing abrupt climate change risk using Montreal Protocal
and other regulatory actions to complement cuts in CO2 emissions
“Runaway Greenhouse Effect”
Conceptual approach
Energy gain per additional degree of warming [W/m2/K]vs.
Energy export through thermal radiation
Venus
“Limited runaway effect”
RadiativeRadiative damping
(Levermann & Schneider v. Deimling, pers. comm., 2009)
9/28/2009
17
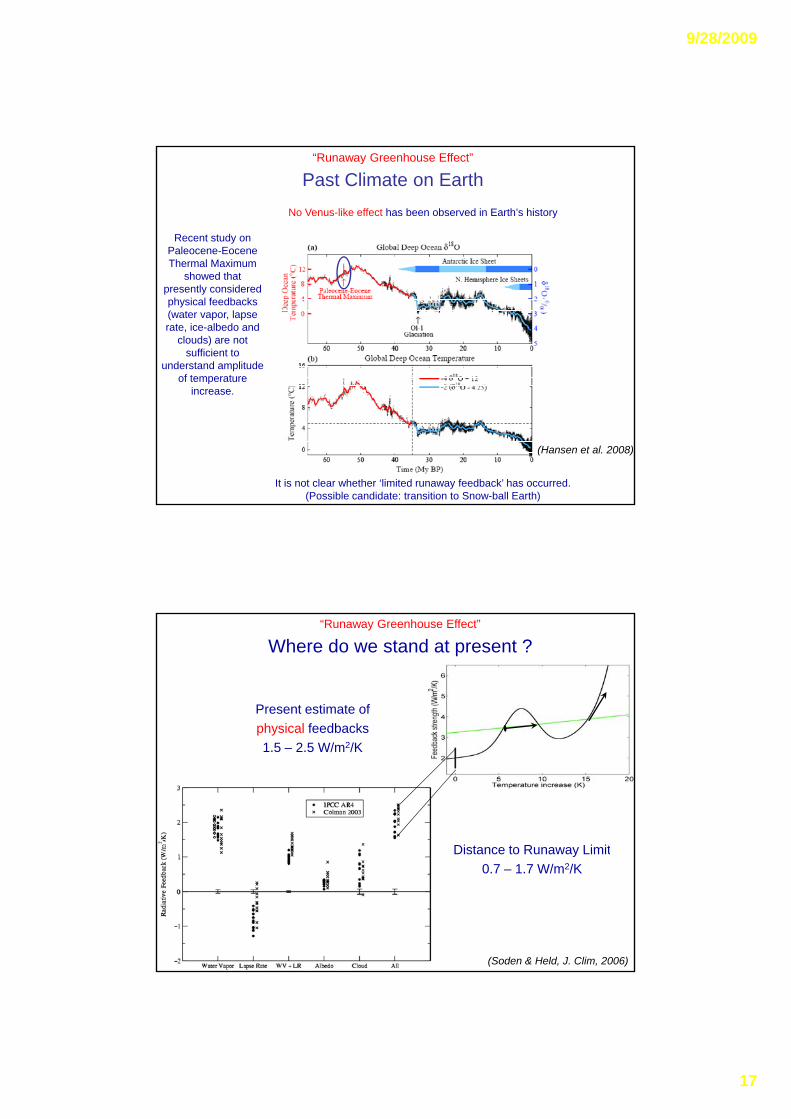
“Runaway Greenhouse Effect”
Past Climate on EarthNo Venus-like effect has been observed in Earth’s history
Recent study on Paleocene-Eocene Thermal MaximumThermal Maximum
showed that presently considered physical feedbacks (water vapor, lapse rate, ice-albedo and
clouds) are not sufficient to
understand amplitude of temperature
It is not clear whether ‘limited runaway feedback’ has occurred.(Possible candidate: transition to Snow-ball Earth)
(Hansen et al. 2008)
increase.
“Runaway Greenhouse Effect”
Where do we stand at present ?
Present estimate of physical feedbacksphysical feedbacks1.5 – 2.5 W/m2/K
Distance to Runaway LimitDistance to Runaway Limit0.7 – 1.7 W/m2/K
(Soden & Held, J. Clim, 2006)
9/28/2009
18
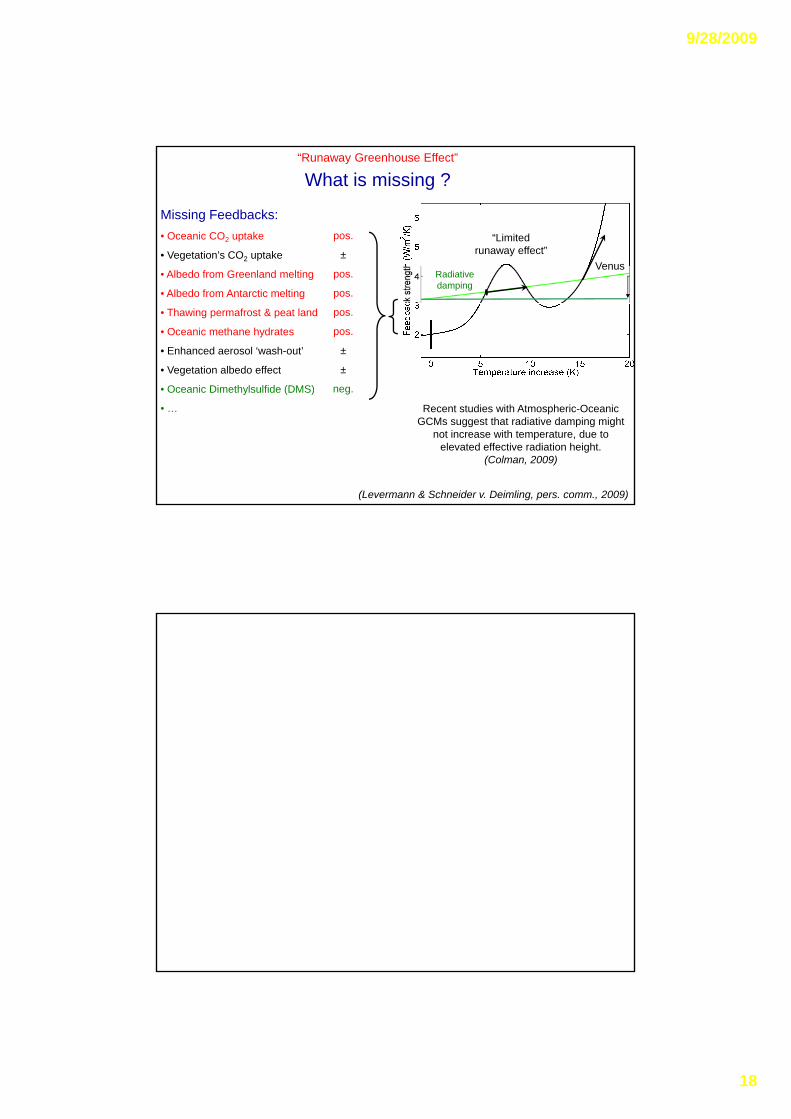
Missing Feedbacks:• Oceanic CO2 uptake
• Vegetation’s CO2 uptake
“Runaway Greenhouse Effect”
What is missing ?
Venus
“Limited runaway effect”
pos.
±
• Albedo from Greenland melting
• Albedo from Antarctic melting
• Thawing permafrost & peat land
• Oceanic methane hydrates
• Enhanced aerosol ‘wash-out’
• Vegetation albedo effect
O i Di th l lfid (DMS)
VenusRadiativedamping
pos.
pos.
pos.
pos.
±
±
• Oceanic Dimethylsulfide (DMS)
• …
(Levermann & Schneider v. Deimling, pers. comm., 2009)
neg.
Recent studies with Atmospheric-Oceanic GCMs suggest that radiative damping might
not increase with temperature, due to elevated effective radiation height.
(Colman, 2009)

9/28/2009
19
9/28/2009
20
Key Message 2 - Social and Environmental Disruption
„Temperature rises above 2°C […] are likely to cause major societal and environmental
disruptions through the rest of the century and beyond.“