
Structure determination of the zeolite IM-5 using electron
25
Structure determination of the zeolite IM-5 using electron crystallography Junliang Sun I, II Zhanbing He I , Sven Hovmo ¨ller I , Xiaodong Zou * , I, II , Fabian Gramm III, IV , Christian Baerlocher III and Lynne B. McCusker III I Inorganic and Structural Chemistry, Department of Materials and Environmental Chemistry Stockholm University, 106 91 Stockholm, Sweden II Berzelii Centre EXSELENT on Porous Materials, Stockholm University, 106 91 Stockholm, Sweden III Laboratory of Crystallography, ETH Zurich, 8093 Zurich, Switzerland IV Electron Microscopy ETH Zurich (EMEZ), 8093 Zurich, Switzerland Received July 3, 2009; accepted November 13, 2009 Electron crystallography / Zeolites / Structure determination / HRTEM images / Structure phases and amplitudes Abstract. The structure of the complex zeolite IM-5 (Cmcm, a ¼ 14.33(4) A, b ¼ 56.9(2) A, c ¼ 20.32(7) A) was determined by combining selected area electron diffrac- tion (SAED), 3D reconstruction of high resolution transmis- sion electron microscopy (HRTEM) images from different zone axes and distance least squares (DLS) refinement. The unit cell parameters were determined from SAED. The space group was determined from extinctions in the SAED patterns and projection symmetries of HRTEM images. Using the structure factor amplitudes and phases of 144 in- dependent reflections obtained from HRTEM images along the [100], [010] and [001] directions, a 3D electrostatic potential map was calculated by inverse Fourier transforma- tion. From this 3D potential map, all 24 unique Si positions could be determined. Oxygen atoms were added between each Si––Si pair and further refined together with the Si positions by distance-least-squares. The final structure model deviates on average 0.16 A for Si and 0.31 A for O from the structure refined using X-ray powder diffraction data. This method is general and offers a new possibility for determining the structures of zeolites and other materials with complex structures. 1. Introduction Zeolites have attracted considerable interest because of their diverse industrial applications in the areas of cataly- sis, separation and ion exchange. In particular, the synth- esis of new high-silica zeolites has been actively pursued, because these zeolites tend to have higher thermal stability and consequently wider applications [1]. Structural infor- mation is fundamental to the understanding of zeolite chemistry and therefore to its application and possible modification. Unfortunately, most high-silica zeolites are polycrystalline or not even pure phases, and this has made the determination of their structures extremely difficult. X-ray powder diffraction has been one of the most im- portant techniques for solving the structures of unknown zeolites [2]. Several novel approaches such as incorporat- ing crystal chemical information (FOCUS) [3, 4], using pore/channel information to generate structure envelopes [5, 6], or using textured samples to generate more single- crystal-like data [7, 8] have been developed for this pur- pose. However, when the structures become too complex and a large portion of the reflections overlap in the pow- der diffraction pattern, structure determination from X-ray powder diffraction data alone is very difficult. Recently X-ray powder diffraction has been combined with electron crystallography to determine the structures of several complex zeolites: TNU-9 [9], IM-5 [10], SSZ- 74 [11] and ITQ-37 [12]. The advantages of electron crys- tallography as a complementary tool to powder diffraction are twofold: (1) electrons interact much more strongly with atoms than do X-rays, so polycrystalline materials down to 10 nm behave like single crystals with electrons on a TEM, and (2) the crystallographic structure factor phases, which are lost in a diffraction experiment, can be obtained from high resolution transmission electron micro- scopy (HRTEM) images. The phase information facilitates structure solution significantly. Electron crystallography has been used to determine the structures of a large range of polycrystalline compounds, especially nano- and micro-sized crystallites. These include minerals [13], oxides [14–17], metal clusters [18–20], and intermetallic compounds [21]. One complex structure of n-AlCrFe with a ¼ 40.687 A, c ¼ 12.546 A, space group P6 3 /m was solved by combining information from HRTEM images and selected area electron diffraction (SAED) pat- terns from 13 zone axes [21]. There, 124 of the 129 unique atoms were determined by electron crystallography. Even structures of membrane proteins have been solved by elec- tron crystallography [22, 23]. Thus, it is clear that extremely complex structures can be solved by electron crystallography. Electron crystallography has also been applied to zeo- lites and ordered mesoporous materials [24–29]. The Z. Kristallogr. 225 (2010) 77–85 / DOI 10.1524/zkri.2010.1204 77 # by Oldenbourg Wissenschaftsverlag, Mu ¨nchen * Correspondence author (e-mail: [email protected])
Transcript of Structure determination of the zeolite IM-5 using electron
Structure determination of the zeolite IM-5 using electroncrystallography
Junliang SunI, II Zhanbing HeI, Sven HovmollerI, Xiaodong Zou*, I, II, Fabian GrammIII, IV, Christian BaerlocherIII
and Lynne B. McCuskerIII
I Inorganic and Structural Chemistry, Department of Materials and Environmental Chemistry Stockholm University, 106 91 Stockholm, SwedenII Berzelii Centre EXSELENT on Porous Materials, Stockholm University, 106 91 Stockholm, SwedenIII Laboratory of Crystallography, ETH Zurich, 8093 Zurich, SwitzerlandIV Electron Microscopy ETH Zurich (EMEZ), 8093 Zurich, Switzerland
Received July 3, 2009; accepted November 13, 2009
Electron crystallography / Zeolites /Structure determination / HRTEM images /Structure phases and amplitudes
Abstract. The structure of the complex zeolite IM-5(Cmcm, a ¼ 14.33(4) �A, b ¼ 56.9(2) �A, c ¼ 20.32(7) �A)was determined by combining selected area electron diffrac-tion (SAED), 3D reconstruction of high resolution transmis-sion electron microscopy (HRTEM) images from differentzone axes and distance least squares (DLS) refinement. Theunit cell parameters were determined from SAED. Thespace group was determined from extinctions in the SAEDpatterns and projection symmetries of HRTEM images.Using the structure factor amplitudes and phases of 144 in-dependent reflections obtained from HRTEM images alongthe [100], [010] and [001] directions, a 3D electrostaticpotential map was calculated by inverse Fourier transforma-tion. From this 3D potential map, all 24 unique Si positionscould be determined. Oxygen atoms were added betweeneach Si––Si pair and further refined together with the Sipositions by distance-least-squares. The final structuremodel deviates on average 0.16 �A for Si and 0.31 �A for Ofrom the structure refined using X-ray powder diffractiondata. This method is general and offers a new possibility fordetermining the structures of zeolites and other materialswith complex structures.
1. Introduction
Zeolites have attracted considerable interest because oftheir diverse industrial applications in the areas of cataly-sis, separation and ion exchange. In particular, the synth-esis of new high-silica zeolites has been actively pursued,because these zeolites tend to have higher thermal stabilityand consequently wider applications [1]. Structural infor-mation is fundamental to the understanding of zeolitechemistry and therefore to its application and possiblemodification. Unfortunately, most high-silica zeolites are
polycrystalline or not even pure phases, and this has madethe determination of their structures extremely difficult.
X-ray powder diffraction has been one of the most im-portant techniques for solving the structures of unknownzeolites [2]. Several novel approaches such as incorporat-ing crystal chemical information (FOCUS) [3, 4], usingpore/channel information to generate structure envelopes[5, 6], or using textured samples to generate more single-crystal-like data [7, 8] have been developed for this pur-pose. However, when the structures become too complexand a large portion of the reflections overlap in the pow-der diffraction pattern, structure determination from X-raypowder diffraction data alone is very difficult.
Recently X-ray powder diffraction has been combinedwith electron crystallography to determine the structuresof several complex zeolites: TNU-9 [9], IM-5 [10], SSZ-74 [11] and ITQ-37 [12]. The advantages of electron crys-tallography as a complementary tool to powder diffractionare twofold: (1) electrons interact much more stronglywith atoms than do X-rays, so polycrystalline materialsdown to 10 nm behave like single crystals with electronson a TEM, and (2) the crystallographic structure factorphases, which are lost in a diffraction experiment, can beobtained from high resolution transmission electron micro-scopy (HRTEM) images. The phase information facilitatesstructure solution significantly.
Electron crystallography has been used to determine thestructures of a large range of polycrystalline compounds,especially nano- and micro-sized crystallites. These includeminerals [13], oxides [14–17], metal clusters [18–20], andintermetallic compounds [21]. One complex structure ofn-AlCrFe with a ¼ 40.687 �A, c ¼ 12.546 �A, space groupP63/m was solved by combining information from HRTEMimages and selected area electron diffraction (SAED) pat-terns from 13 zone axes [21]. There, 124 of the 129 uniqueatoms were determined by electron crystallography. Evenstructures of membrane proteins have been solved by elec-tron crystallography [22, 23]. Thus, it is clear that extremelycomplex structures can be solved by electron crystallography.
Electron crystallography has also been applied to zeo-lites and ordered mesoporous materials [24–29]. The
Z. Kristallogr. 225 (2010) 77–85 / DOI 10.1524/zkri.2010.1204 77# by Oldenbourg Wissenschaftsverlag, Munchen
* Correspondence author (e-mail: [email protected])
structures of many interesting zeolites and related porousmaterials remain unsolved, because the samples containmore than one phase, have defects and/or the structuresare just too complex to be solved from X-ray powder dif-fraction data alone. In such cases, the advantages of elec-tron crystallography come to light.
Recently a novel approach to structure solution using acharge-flipping algorithm was reported [30]. Several com-plex zeolite structures have been solved by combining X-ray powder diffraction data and electron crystallographyusing this new approach [10–12]. One example is that ofthe high-silica zeolite catalyst IM-5, whose synthesis wasfirst reported in 1998 [31]. It has proven to be an impor-tant thermally stable catalyst for hydrocarbon cracking andNO reduction [32]. IM-5 is one of the most complexknown zeolites, with 24 Si-atoms in the asymmetric unit,and crystallizes only in polycrystalline form. Even the unitcell dimensions are difficult to determine from X-ray pow-der diffraction data, because the large unit cell and coinci-dental relationships between the lengths of the axes causean extreme degree of reflection overlap. Electron diffrac-tion, however, is a single crystal technique and all reflec-tions are recorded individually. This makes electron dif-fraction very powerful for the determination of unit cellparameters. Originally, the structure of IM-5 could only besolved by combining transmission electron microscopyand X-ray powder diffraction data in a charge-flippingstructure solution algorithm [10].
It is important to know if the structures of materials ascomplex as IM-5 can be solved by electron crystallogra-phy. It is also important to establish a general approachfor doing so. In this paper, we examine a complete abinitio structure determination of the zeolite IM-5 usingonly electron crystallography and no prior structure infor-mation.
2. Experiments
The sample of IM-5 was synthesized by Benazzi et al. asreported earlier [31]. A small amount of IM-5 sample wasground to a fine powder and dispersed in acetone. A dropof this suspension was transferred onto a holey carbonfilm supported by a copper grid. SAED patterns were col-lected on Philips CM-30, JEOL JEM-3010 and JEOLJEM-2000FX transmission electron microscopes operatedat 300 kV, 300 kV and 200 kV, respectively. For the deter-mination of the unit cell parameters, several tilt series ofSAED patterns were collected by tilting the crystalsaround diffraction rows with the shortest reciprocal dis-tances. HRTEM images were obtained along the mainaxes on JEOL JEM-3010 transmission electron micro-scopes at 300 kV (point resolution 1.7 �A). The SAED pat-terns and HRTEM images were recorded by a Gatan mul-tiscan A40 or Keenview CCD cameras. To minimize thedynamic effects, only the thinnest edges of the crystalswere selected for SAED and HRTEM.
All SAED patterns were analyzed by the program ELD[33]. The program Trice [34] was used to combine theSAED patterns from each tilt series, with the positionsand intensities given by ELD, into 3D reciprocal space.
The unit cell parameters were then determined from the3D reciprocal space. Crystallographic image processing ofthe HRTEM images was performed by the programCRISP [35]. For each HRTEM image, the thinnest part ofthe crystal was selected and its Fourier transform was cal-culated. The corresponding contrast transfer function(CTF) was estimated from the Fourier transform, and theeffects of the CTF were compensated for. The positions ofthe diffraction spots were determined and the correspond-ing reciprocal lattice was refined. The amplitude andphase were then extracted from each diffraction spot. Notethat due to the lath-like crystal morphology of IM-5(Fig. 1), crystals were mostly oriented with the a-axis per-pendicular to the holey carbon film. While HRTEMimages with large thin areas (>100 nm) were relativelyeasy to obtain in the [100] projection, it was very difficult tofind the [010] and [001] directions under TEM, especiallycrystals containing thin areas in the projections. In thebest cases, very small thin areas (10–20 nm) could be ob-tained at the edges of the crystals in [010] and [001] pro-jections. They were just enough for the image processing.
In order to determine the projection symmetry of thecrystal, all possible plane groups were tested to see whichone best fitted the experimental image. The correspondingprojection symmetry was determined only from thephases, since different plane groups can give the same am-plitude relationships. In addition, a slight crystal misalign-ment can introduce large changes in the amplitudes, butnot in the phases. For each plane group, the phases ofsymmetry-related reflections obey some simple relation-ships if the origin is at a symmetry element. For example,a 2-fold axis is always selected as the origin for the planegroup p2, and then all phases are restricted to 0 or 180�.A weighted average difference between the experimentalphases and the phases after imposing the phase relationsand restrictions is defined as the phase residual (jres). It iscalculated using the equation:
jres ¼Phk
Ahk Djhk
.Phk
Ahk
where Ahk is the amplitude of reflection hk and Df hk is thephase error of reflection hk. When the origin is moved toa different position within a unit cell, all phases will bechanged accordingly, while amplitudes remain the same.So, for a certain plane group, by searching throughout thewhole unit cell, we can find the origin(s) that correspondto the lowest phase residual jres. The origin is then movedto such an origin. The R-value for symmetry-related re-flections and the lowest phase residual were calculated foreach possible plane group. The plane group that corre-sponds to the lowest phase residual jres and highest possi-ble symmetry will be chosen as the correct projectionsymmetry.
Finally, the projection symmetry was applied to the am-plitudes and phases. The amplitudes for the symmetry-re-lated reflections are set to be equal. The phases of all re-flections were adjusted to correspond to the nearestpossible phases according to the phase relationships andthe phase restrictions. For example, for projections con-taining a 2-fold axis, all phases were adjusted to the near-est of 0� or 180�. The final amplitudes and phases will be
78 J. Sun, Z. He, S. Hovmoller et al.
close to those of the structure factors, if the crystal is thinenough. A projection of the potential map can be calcu-lated by inverse Fourier transform using the amplitudesand phases after imposing the projection symmetry. Thereflections obtained from HRTEM images along differentzone axes were merged together. A 3D electrostatic poten-tial map was calculated using the program eMap [36], andthe atomic positions were determined from this 3D poten-tial map. The geometry of the final structure model wasoptimized using the distance least-squares program DLS-76 [37]. SAED patterns were simulated using the programMacTempas [38], and the atomic coordinates from the mod-el.
3. Results and discussion
The complete structure determination of IM-5 is dividedinto the following steps: (1) determination of the unit cell,lattice type and Laue group from SAED patterns, (2) de-termination of the projection symmetry and crystal struc-ture factors from each HRTEM image, (3) 3D reconstruc-tion from different projections and determination of atomicpositions, (4) structure optimization by distance least-squares refinement, and (5) structure verification. Eachstep is described in detail below.
3.1 Determination of unit cell, lattice typeand Laue group
A general way of determining the unit cell is from a tiltseries of SAED patterns, as shown in Fig. 1. The 2D lat-tice for each SAED pattern was detected and further re-fined using the program ELD [33]. The positions, d-valuesand intensities of all diffraction spots were extracted. Thisinformation, together with the corresponding tilt angle foreach SAED pattern in the tilt series, was used to recon-struct the 3D reciprocal space using the program Trice[34]. From the reconstructed 3D reciprocal lattice, the cellparameters were determined to be a ¼ 14.1(5) �A,b ¼ 56.9(1) �A, c ¼ 19.8(1) �A, a ¼ 90.0(3)�, b ¼ 90.8(6)�,g ¼ 89.6(5)�. The reflection condi-
tion was h þ k ¼ 2n for all reflections, indicating thatIM-5 is C-centered.
To check whether IM-5 is orthorhombic or adopts alower symmetry, its Laue class needs to be determined.The SAED pattern along the [100] direction clearly shows2mm symmetry (see Fig. 1). All SAED patterns obtainedby tilting the crystal around the b*-axis show a mirror-symmetry perpendicular to the b*-axis. Thus, the crystalhas a mirror symmetry perpendicular to the b* axis inreciprocal space. Similarly, the crystal has a mirror sym-metry perpendicular to the c*-axis in reciprocal space.Since reciprocal space is always centrosymmetric, theremust also be a mirror symmetry perpendicular to the a*-axis. Thus, the diffraction pattern of IM-5 belongs to theLaue class mmm and its unit cell is C-centred orthorhom-bic. The similar intensity distributions and tilt angles ofthe symmetry-related SAED patterns (for example [501]and [�5 0 1], [301] and [�3 0 1] and [11 1 0] and[�11 1 0] in Fig. 1) further confirm the mirror symmetryperpendicular to the a*-axis. The deviations of unit cellangles from 90� were caused by lens distortions of theTEM instrument [39], errors of the tilt angles due to thegoniometer, and sample misalignment. The final unit cellparameters were obtained from the SAED patterns takenalong the three main zone axes (see Fig. 2a–c) asa ¼ 14.1 �A, b ¼ 57.0 �A and c ¼ 19.8 �A, because theseare usually more accurate than those obtained from a tiltseries.
3.2 Determination of space group
The space group of IM-5 can be deduced from the sys-tematic absences observed in the SAED patterns takenalong the three main zone axes (shown in Fig. 2a–c). Thisgives the following reflection conditions: hkl: hþ k ¼ 2n;0kl: k ¼ 2n; h0l: h ¼ 2n, l ¼ 2n; hk0: hþ k ¼ 2n; h00:h ¼ 2n; 0k0: k ¼ 2n; 00l: l ¼ 2n.
There are only 3 possible space groups correspondingto these reflection conditions: Cmc21, C2cm and Cmcm[11]. These three space groups have the same systematicabsences and can not be distinguished from diffraction
Structure determination of the zeolite IM-5 using electron crystallography 79
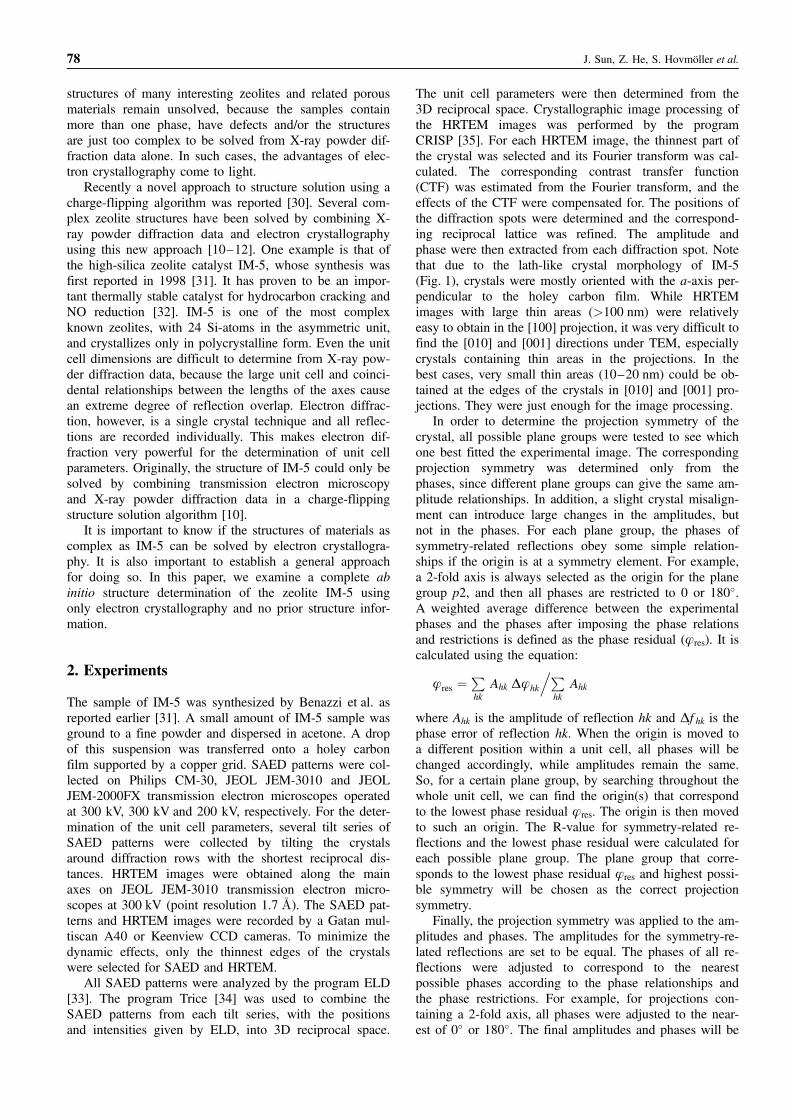
Fig. 1. A series of SAED patterns fromthe same crystal of IM-5 tilted alongthe two shortest perpendicular recipro-cal axes. The tilt axes are indicated byarrows. The corresponding tilt angle foreach SAED pattern is given. The unitcell parameters were determined fromthe tilt series and the SAED patternswere then indexed. SAED patternsalong the [501], [�5 0 1], [301] and[�3 0 1] directions show a mirror-sym-metry perpendicular to the b*-axis.Thus, the crystal has a mirror symme-try perpendicular to the b* axis in reci-procal space. Similarly, the SAED pat-terns along the [100], [11 1 0] and[�11 1 0] directions all have the mir-ror-symmetry perpendicular to the c*-axis. A TEM image of a typical plate-like IM-5 crystal is inserted.
data. However, their projection symmetries are different,as shown in Table 1. Since HRTEM images maintain thephase information, it is possible to determine the projec-tion symmetries from HRTEM images. In this way, wecan uniquely determine the space group.
HRTEM images along the three main zone axes areshown in Fig. 3. The projection symmetry was determinedby crystallographic image processing using the programCRISP [35] (Fig. 4). Amplitudes and phases for all ob-served reflections were extracted from the Fourier trans-form of each HRTEM image. The corresponding lowestphase residual jres was given for each plane group. Thelowest phase residuals for the HRTEM image along the[100] projection are 4.5�, 9.1� and 11.1�, corresponding topm (m? c), pg (g? b) and pmg (m? c) symmetries, re-spectively (Table 2). Since pmg is a supergroup of pm andpg and its phase residue is only higher by a few degreesthan those for pm and pg, the higher projection symmetrypmg is the most reasonable one for IM-5 along the [100]direction. The projection symmetries along the [010] and[001] directions were obtained in a similar way from theHRTEM images, and found to be pmm and cmm, respec-tively, by comparing the corresponding phase residuals(see Table 2). The space group of IM-5 could be thendeduced from the projection symmetries from the threemain directions, to be Cmcm, according to Table 1.
The phase residuals jres along the three main zoneaxes are 11.1, 13.2 and 16.0�, corresponding to the sym-metries pmg, pmm and cmm, respectively. As a rule ofthumb, phase residuals less than 20� are often acceptableso that the space group Cmcm is the most probable one. Itis worth mentioning that due to the lath-like shape of theIM-5 crystals (see Fig. 1), the crystals along [010] and[001] directions are relatively thick, which makes the sym-metry determination less reliable for those projections. Wecannot completely rule out the possibility that the realstructure may be slightly distorted from Cmcm symmetry.
For example, the projection symmetries along the [010]and [001] directions may be pm (m? c) and cm (m? b),which gave much lower phase residuals (3.7 and 6.4�, re-spectively). In such a case, the space group would beC2cm.
80 J. Sun, Z. He, S. Hovmoller et al.
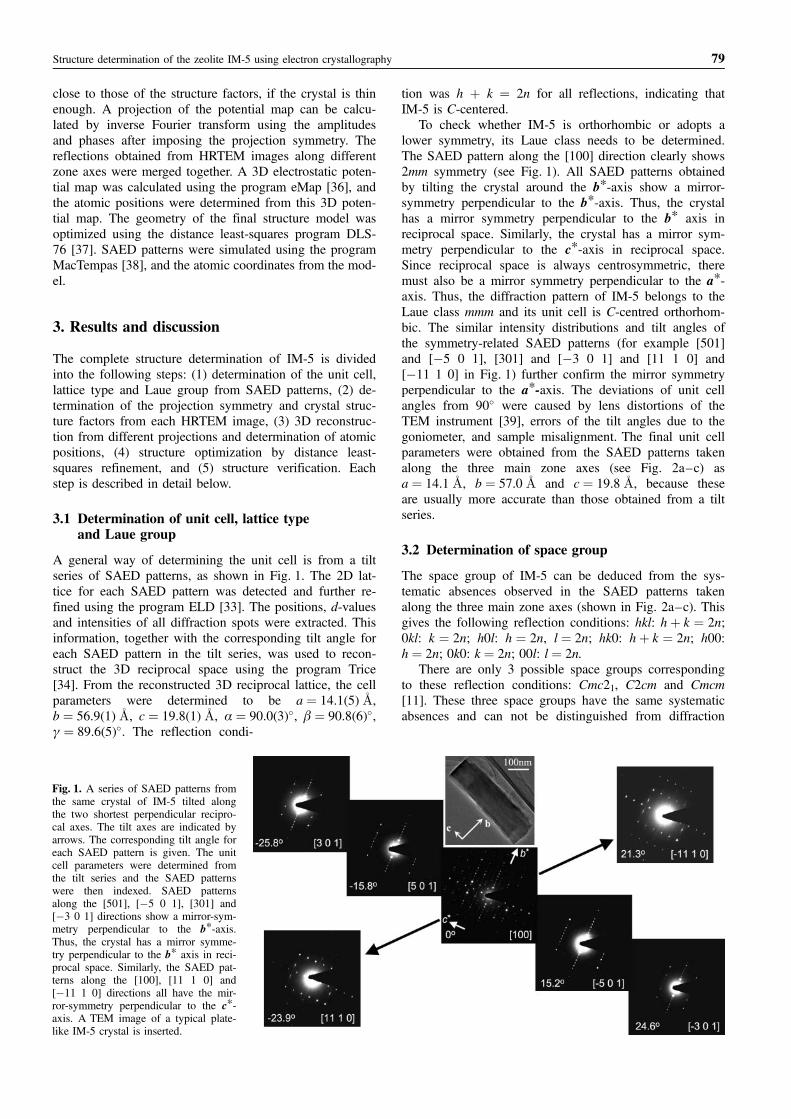
Fig. 2. Experimental SAED patterns ofIM-5 taken along (a) [100], (b) [001],(c) [010] and (d) [3 �1 0] directions.The corresponding simulated ED pat-terns along (e) [100] (thicknesst ¼ 100 �A), (f) [001] (t ¼ 180 �A), (g)[010] (t ¼ 200 �A) and (h) [3 �1 0](t ¼ 150 �A) directions. The accelerat-ing voltage was 300 kV.
Table 1. Projection symmetries for three possible space groups.
Space group [100] [010] [001]
Cmc21 pg pm ðm ? aÞ cmm
C2cm pmg pm ðm ? cÞ cm ðm ? bÞCmcm pmg pmm cmm
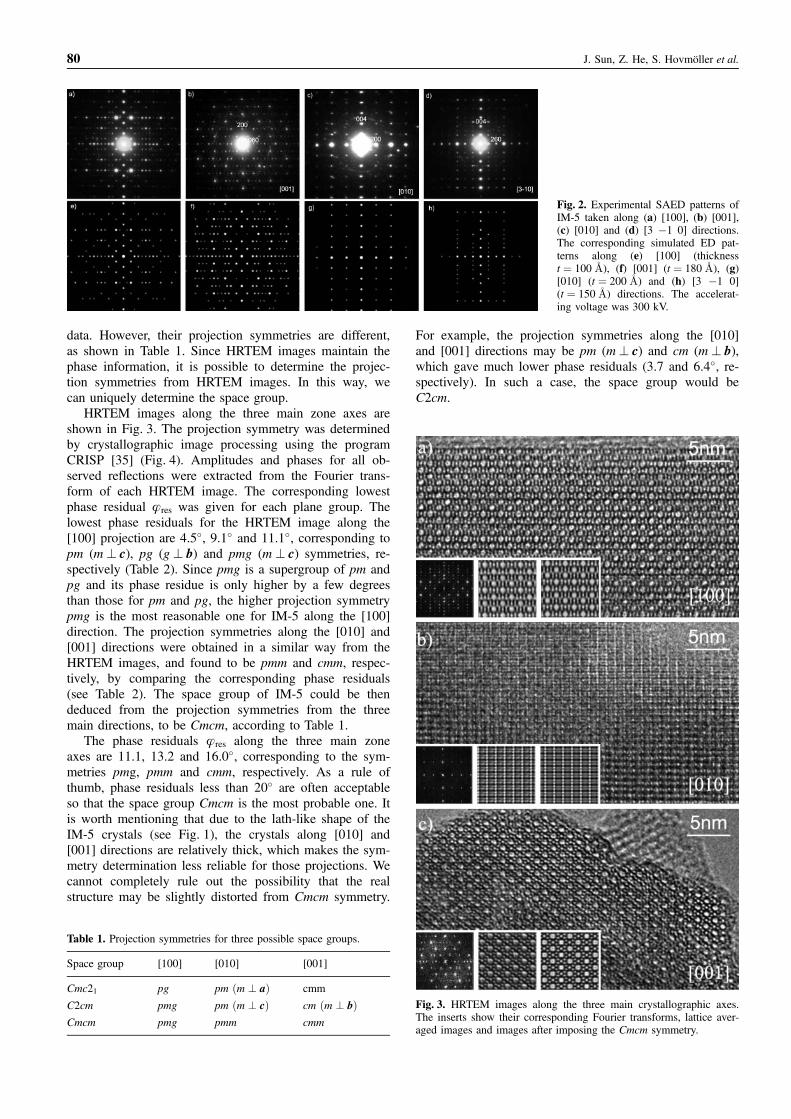
Fig. 3. HRTEM images along the three main crystallographic axes.The inserts show their corresponding Fourier transforms, lattice aver-aged images and images after imposing the Cmcm symmetry.
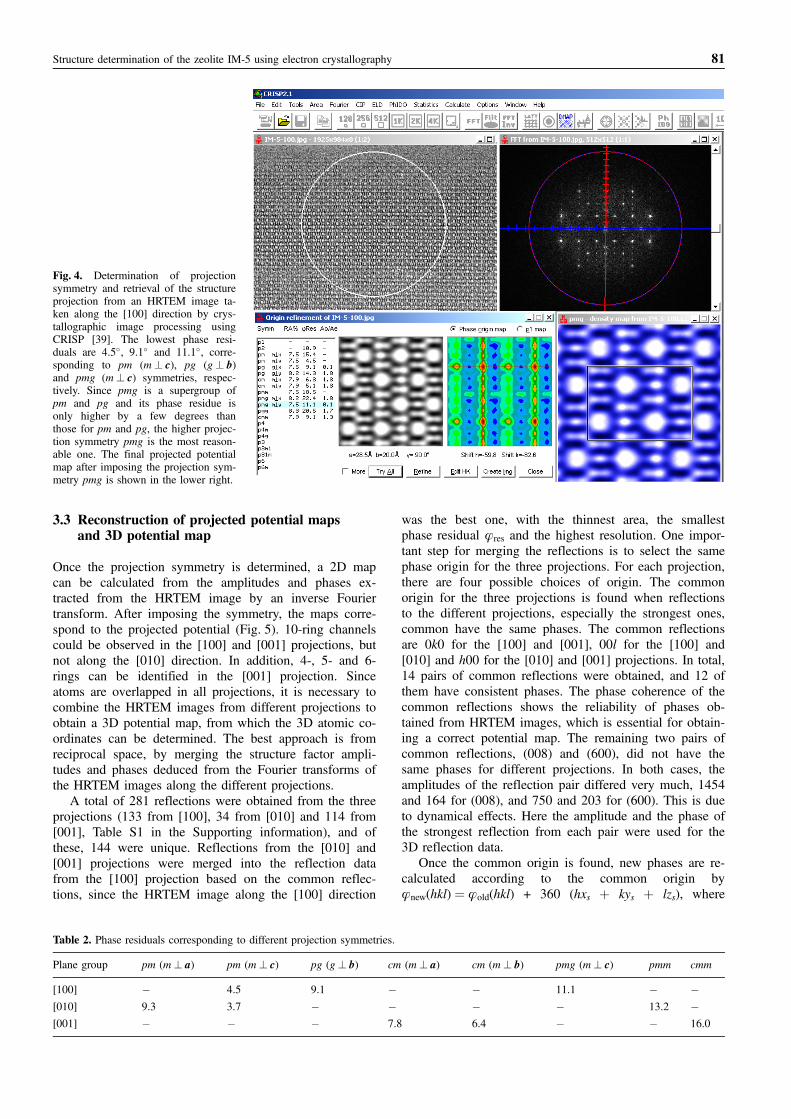
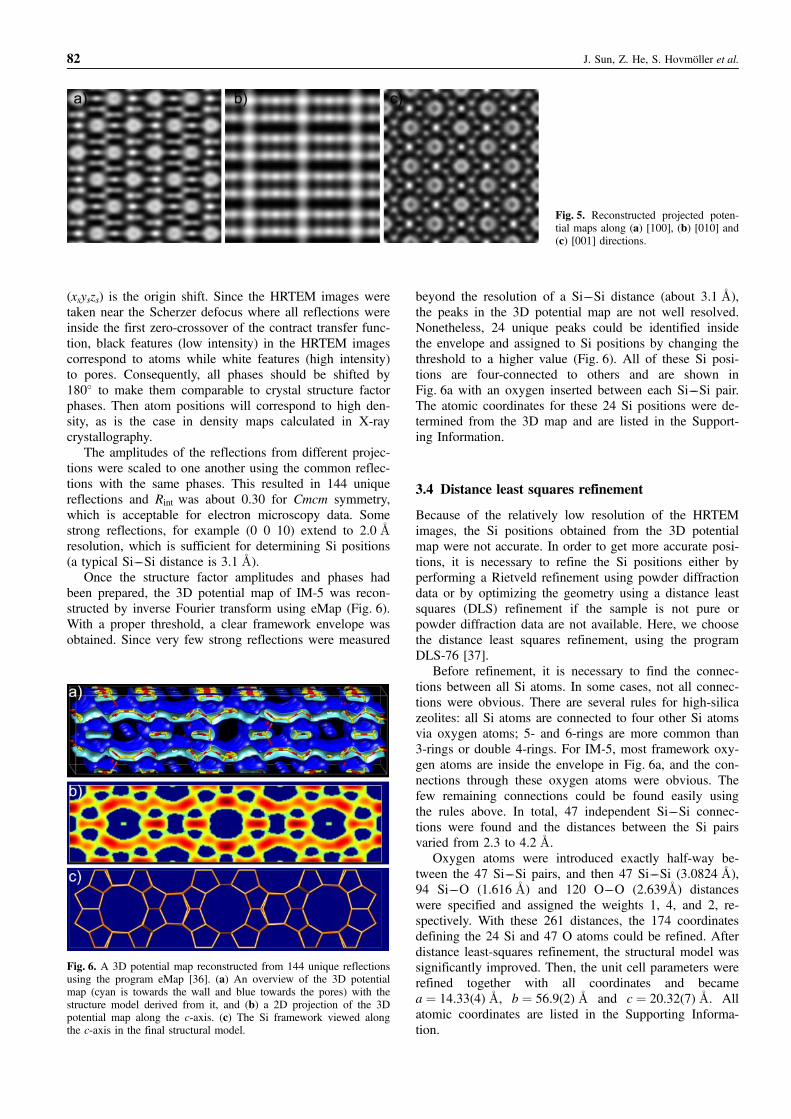
3.3 Reconstruction of projected potential mapsand 3D potential map
Once the projection symmetry is determined, a 2D mapcan be calculated from the amplitudes and phases ex-tracted from the HRTEM image by an inverse Fouriertransform. After imposing the symmetry, the maps corre-spond to the projected potential (Fig. 5). 10-ring channelscould be observed in the [100] and [001] projections, butnot along the [010] direction. In addition, 4-, 5- and 6-rings can be identified in the [001] projection. Sinceatoms are overlapped in all projections, it is necessary tocombine the HRTEM images from different projections toobtain a 3D potential map, from which the 3D atomic co-ordinates can be determined. The best approach is fromreciprocal space, by merging the structure factor ampli-tudes and phases deduced from the Fourier transforms ofthe HRTEM images along the different projections.
A total of 281 reflections were obtained from the threeprojections (133 from [100], 34 from [010] and 114 from[001], Table S1 in the Supporting information), and ofthese, 144 were unique. Reflections from the [010] and[001] projections were merged into the reflection datafrom the [100] projection based on the common reflec-tions, since the HRTEM image along the [100] direction
was the best one, with the thinnest area, the smallestphase residual jres and the highest resolution. One impor-tant step for merging the reflections is to select the samephase origin for the three projections. For each projection,there are four possible choices of origin. The commonorigin for the three projections is found when reflectionsto the different projections, especially the strongest ones,common have the same phases. The common reflectionsare 0k0 for the [100] and [001], 00l for the [100] and[010] and h00 for the [010] and [001] projections. In total,14 pairs of common reflections were obtained, and 12 ofthem have consistent phases. The phase coherence of thecommon reflections shows the reliability of phases ob-tained from HRTEM images, which is essential for obtain-ing a correct potential map. The remaining two pairs ofcommon reflections, (008) and (600), did not have thesame phases for different projections. In both cases, theamplitudes of the reflection pair differed very much, 1454and 164 for (008), and 750 and 203 for (600). This is dueto dynamical effects. Here the amplitude and the phase ofthe strongest reflection from each pair were used for the3D reflection data.
Once the common origin is found, new phases are re-calculated according to the common origin byjnew(hkl) ¼ jold(hkl) + 360 (hxs þ kys þ lzs), where
Structure determination of the zeolite IM-5 using electron crystallography 81
Fig. 4. Determination of projectionsymmetry and retrieval of the structureprojection from an HRTEM image ta-ken along the [100] direction by crys-tallographic image processing usingCRISP [39]. The lowest phase resi-duals are 4.5�, 9.1� and 11.1�, corre-sponding to pm (m? c), pg (g? b)and pmg (m? c) symmetries, respec-tively. Since pmg is a supergroup ofpm and pg and its phase residue isonly higher by a few degrees thanthose for pm and pg, the higher projec-tion symmetry pmg is the most reason-able one. The final projected potentialmap after imposing the projection sym-metry pmg is shown in the lower right.
Table 2. Phase residuals corresponding to different projection symmetries.
Plane group pm (m? a) pm (m? c) pg (g? b) cm (m? a) cm (m? b) pmg (m? c) pmm cmm
[100] � 4.5 9.1 � � 11.1 � �[010] 9.3 3.7 � � � � 13.2 �[001] � � � 7.8 6.4 � � 16.0
(xsyszs) is the origin shift. Since the HRTEM images weretaken near the Scherzer defocus where all reflections wereinside the first zero-crossover of the contract transfer func-tion, black features (low intensity) in the HRTEM imagescorrespond to atoms while white features (high intensity)to pores. Consequently, all phases should be shifted by180� to make them comparable to crystal structure factorphases. Then atom positions will correspond to high den-sity, as is the case in density maps calculated in X-raycrystallography.
The amplitudes of the reflections from different projec-tions were scaled to one another using the common reflec-tions with the same phases. This resulted in 144 uniquereflections and Rint was about 0.30 for Cmcm symmetry,which is acceptable for electron microscopy data. Somestrong reflections, for example (0 0 10) extend to 2.0 �Aresolution, which is sufficient for determining Si positions(a typical Si––Si distance is 3.1 �A).
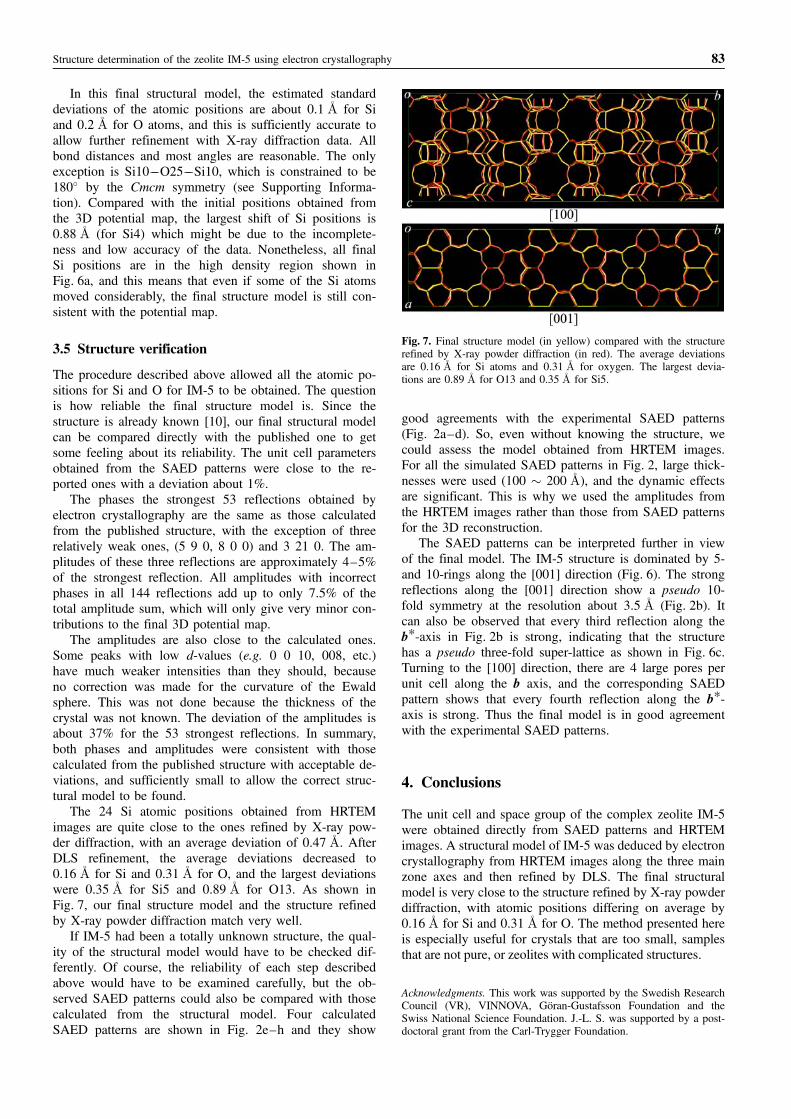
Once the structure factor amplitudes and phases hadbeen prepared, the 3D potential map of IM-5 was recon-structed by inverse Fourier transform using eMap (Fig. 6).With a proper threshold, a clear framework envelope wasobtained. Since very few strong reflections were measured
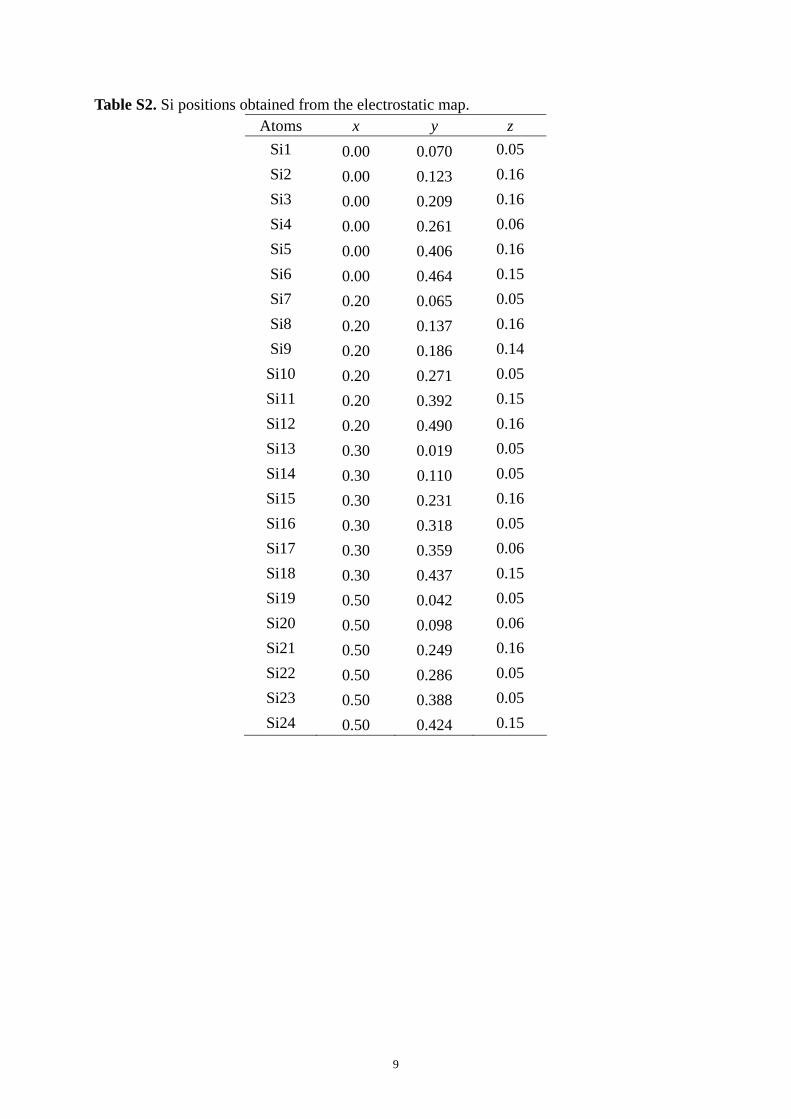
beyond the resolution of a Si––Si distance (about 3.1 �A),the peaks in the 3D potential map are not well resolved.Nonetheless, 24 unique peaks could be identified insidethe envelope and assigned to Si positions by changing thethreshold to a higher value (Fig. 6). All of these Si posi-tions are four-connected to others and are shown inFig. 6a with an oxygen inserted between each Si––Si pair.The atomic coordinates for these 24 Si positions were de-termined from the 3D map and are listed in the Support-ing Information.
3.4 Distance least squares refinement
Because of the relatively low resolution of the HRTEMimages, the Si positions obtained from the 3D potentialmap were not accurate. In order to get more accurate posi-tions, it is necessary to refine the Si positions either byperforming a Rietveld refinement using powder diffractiondata or by optimizing the geometry using a distance leastsquares (DLS) refinement if the sample is not pure orpowder diffraction data are not available. Here, we choosethe distance least squares refinement, using the programDLS-76 [37].
Before refinement, it is necessary to find the connec-tions between all Si atoms. In some cases, not all connec-tions were obvious. There are several rules for high-silicazeolites: all Si atoms are connected to four other Si atomsvia oxygen atoms; 5- and 6-rings are more common than3-rings or double 4-rings. For IM-5, most framework oxy-gen atoms are inside the envelope in Fig. 6a, and the con-nections through these oxygen atoms were obvious. Thefew remaining connections could be found easily usingthe rules above. In total, 47 independent Si––Si connec-tions were found and the distances between the Si pairsvaried from 2.3 to 4.2 �A.
Oxygen atoms were introduced exactly half-way be-tween the 47 Si––Si pairs, and then 47 Si––Si (3.0824 �A),94 Si––O (1.616 �A) and 120 O––O (2.639�A) distanceswere specified and assigned the weights 1, 4, and 2, re-spectively. With these 261 distances, the 174 coordinatesdefining the 24 Si and 47 O atoms could be refined. Afterdistance least-squares refinement, the structural model wassignificantly improved. Then, the unit cell parameters wererefined together with all coordinates and becamea ¼ 14.33(4) �A, b ¼ 56.9(2) �A and c ¼ 20.32(7) �A. Allatomic coordinates are listed in the Supporting Informa-tion.
82 J. Sun, Z. He, S. Hovmoller et al.
Fig. 5. Reconstructed projected poten-tial maps along (a) [100], (b) [010] and(c) [001] directions.
Fig. 6. A 3D potential map reconstructed from 144 unique reflectionsusing the program eMap [36]. (a) An overview of the 3D potentialmap (cyan is towards the wall and blue towards the pores) with thestructure model derived from it, and (b) a 2D projection of the 3Dpotential map along the c-axis. (c) The Si framework viewed alongthe c-axis in the final structural model.
In this final structural model, the estimated standarddeviations of the atomic positions are about 0.1 �A for Siand 0.2 �A for O atoms, and this is sufficiently accurate toallow further refinement with X-ray diffraction data. Allbond distances and most angles are reasonable. The onlyexception is Si10––O25––Si10, which is constrained to be180� by the Cmcm symmetry (see Supporting Informa-tion). Compared with the initial positions obtained fromthe 3D potential map, the largest shift of Si positions is0.88 �A (for Si4) which might be due to the incomplete-ness and low accuracy of the data. Nonetheless, all finalSi positions are in the high density region shown inFig. 6a, and this means that even if some of the Si atomsmoved considerably, the final structure model is still con-sistent with the potential map.
3.5 Structure verification
The procedure described above allowed all the atomic po-sitions for Si and O for IM-5 to be obtained. The questionis how reliable the final structure model is. Since thestructure is already known [10], our final structural modelcan be compared directly with the published one to getsome feeling about its reliability. The unit cell parametersobtained from the SAED patterns were close to the re-ported ones with a deviation about 1%.
The phases the strongest 53 reflections obtained byelectron crystallography are the same as those calculatedfrom the published structure, with the exception of threerelatively weak ones, (5 9 0, 8 0 0) and 3 21 0. The am-plitudes of these three reflections are approximately 4–5%of the strongest reflection. All amplitudes with incorrectphases in all 144 reflections add up to only 7.5% of thetotal amplitude sum, which will only give very minor con-tributions to the final 3D potential map.
The amplitudes are also close to the calculated ones.Some peaks with low d-values (e.g. 0 0 10, 008, etc.)have much weaker intensities than they should, becauseno correction was made for the curvature of the Ewaldsphere. This was not done because the thickness of thecrystal was not known. The deviation of the amplitudes isabout 37% for the 53 strongest reflections. In summary,both phases and amplitudes were consistent with thosecalculated from the published structure with acceptable de-viations, and sufficiently small to allow the correct struc-tural model to be found.
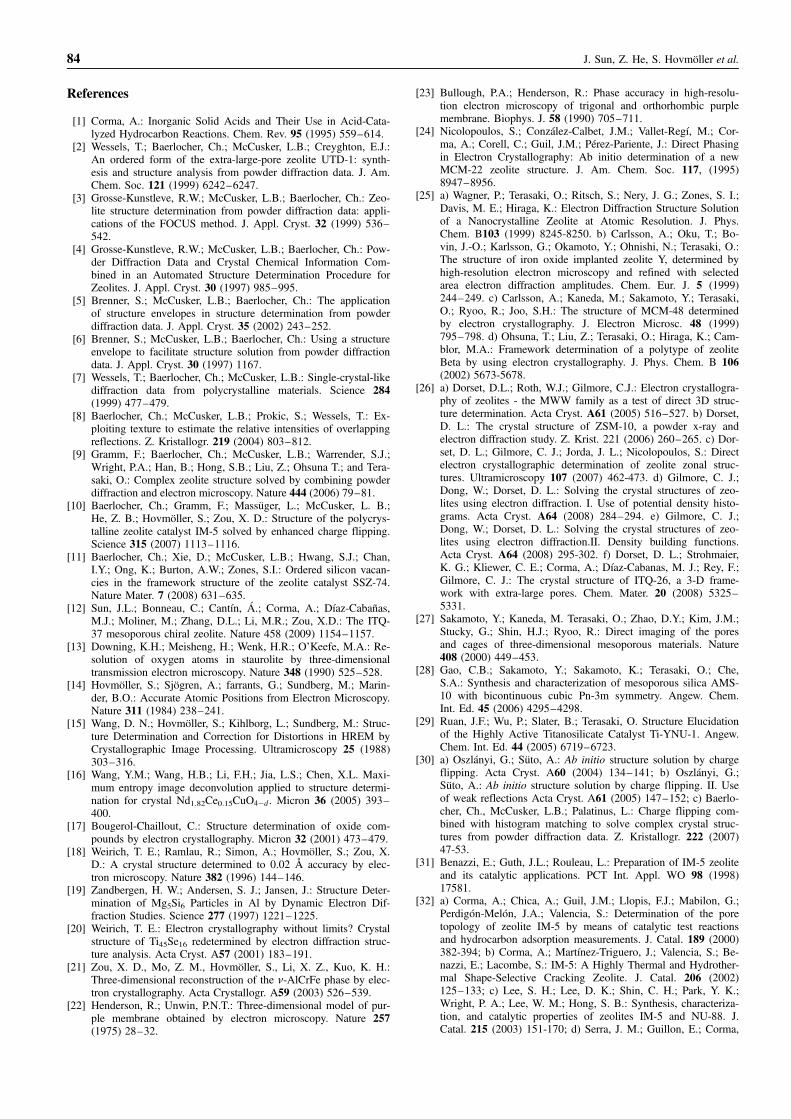
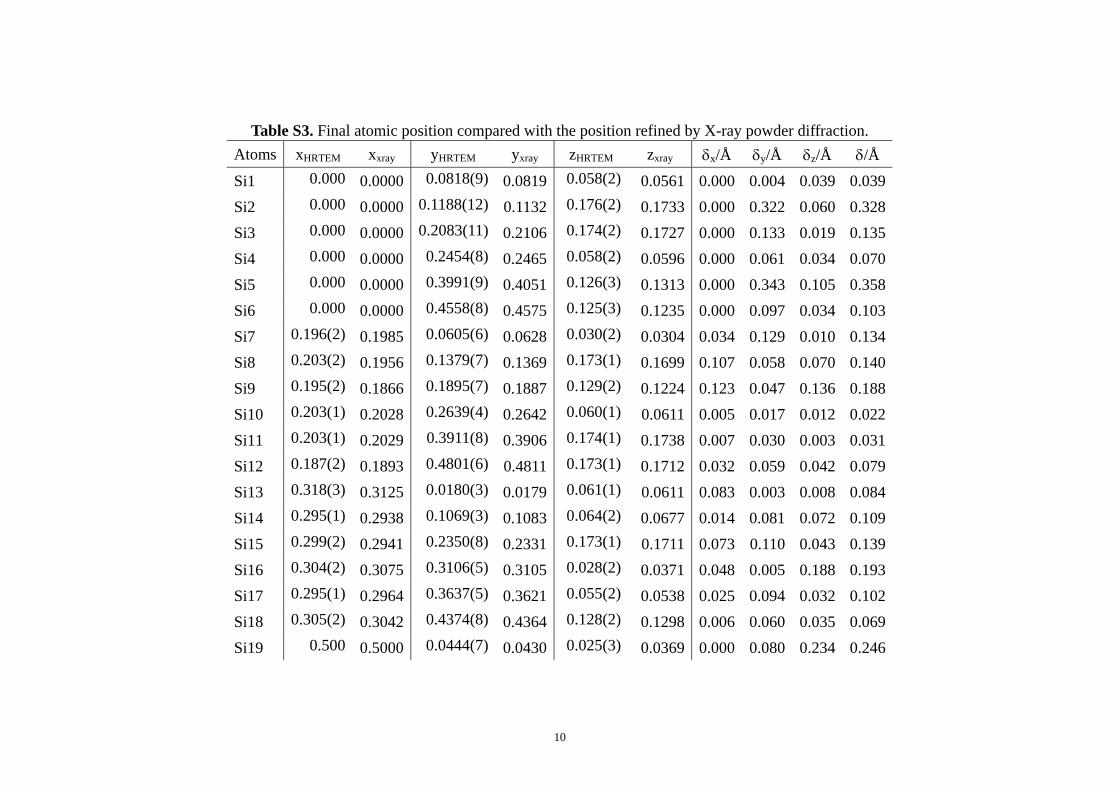
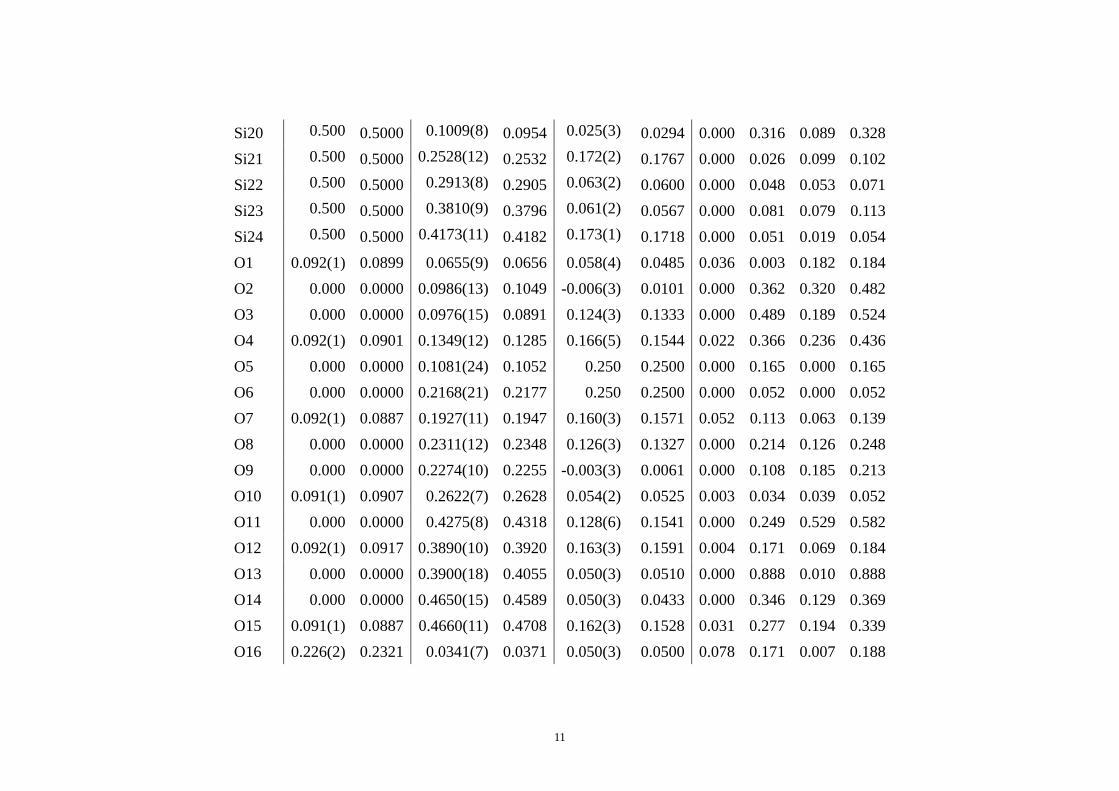
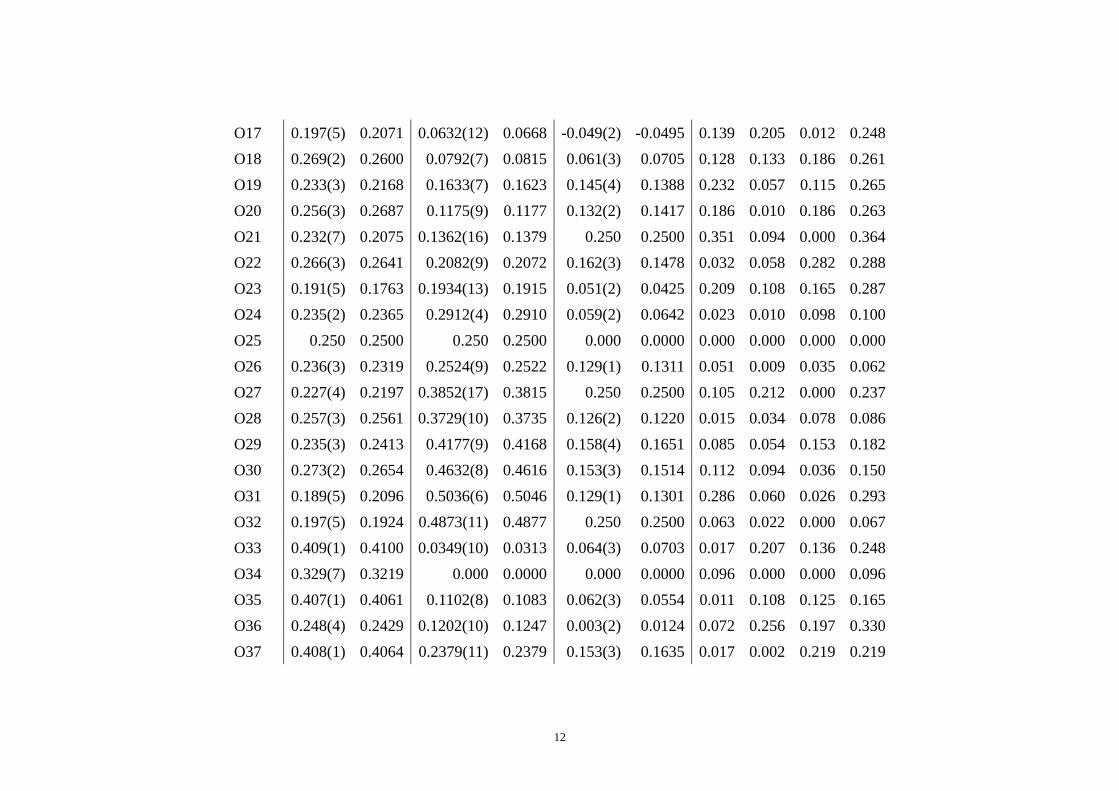
The 24 Si atomic positions obtained from HRTEMimages are quite close to the ones refined by X-ray pow-der diffraction, with an average deviation of 0.47 �A. AfterDLS refinement, the average deviations decreased to0.16 �A for Si and 0.31 �A for O, and the largest deviationswere 0.35 �A for Si5 and 0.89 �A for O13. As shown inFig. 7, our final structure model and the structure refinedby X-ray powder diffraction match very well.
If IM-5 had been a totally unknown structure, the qual-ity of the structural model would have to be checked dif-ferently. Of course, the reliability of each step describedabove would have to be examined carefully, but the ob-served SAED patterns could also be compared with thosecalculated from the structural model. Four calculatedSAED patterns are shown in Fig. 2e–h and they show
good agreements with the experimental SAED patterns(Fig. 2a–d). So, even without knowing the structure, wecould assess the model obtained from HRTEM images.For all the simulated SAED patterns in Fig. 2, large thick-nesses were used (100 � 200 �A), and the dynamic effectsare significant. This is why we used the amplitudes fromthe HRTEM images rather than those from SAED patternsfor the 3D reconstruction.
The SAED patterns can be interpreted further in viewof the final model. The IM-5 structure is dominated by 5-and 10-rings along the [001] direction (Fig. 6). The strongreflections along the [001] direction show a pseudo 10-fold symmetry at the resolution about 3.5 �A (Fig. 2b). Itcan also be observed that every third reflection along theb*-axis in Fig. 2b is strong, indicating that the structurehas a pseudo three-fold super-lattice as shown in Fig. 6c.Turning to the [100] direction, there are 4 large pores perunit cell along the b axis, and the corresponding SAEDpattern shows that every fourth reflection along the b*-axis is strong. Thus the final model is in good agreementwith the experimental SAED patterns.
4. Conclusions
The unit cell and space group of the complex zeolite IM-5were obtained directly from SAED patterns and HRTEMimages. A structural model of IM-5 was deduced by electroncrystallography from HRTEM images along the three mainzone axes and then refined by DLS. The final structuralmodel is very close to the structure refined by X-ray powderdiffraction, with atomic positions differing on average by0.16 �A for Si and 0.31 �A for O. The method presented hereis especially useful for crystals that are too small, samplesthat are not pure, or zeolites with complicated structures.
Acknowledgments. This work was supported by the Swedish ResearchCouncil (VR), VINNOVA, Goran-Gustafsson Foundation and theSwiss National Science Foundation. J.-L. S. was supported by a post-doctoral grant from the Carl-Trygger Foundation.
Structure determination of the zeolite IM-5 using electron crystallography 83
Fig. 7. Final structure model (in yellow) compared with the structurerefined by X-ray powder diffraction (in red). The average deviationsare 0.16 �A for Si atoms and 0.31 �A for oxygen. The largest devia-tions are 0.89 �A for O13 and 0.35 �A for Si5.
References
[1] Corma, A.: Inorganic Solid Acids and Their Use in Acid-Cata-lyzed Hydrocarbon Reactions. Chem. Rev. 95 (1995) 559–614.
[2] Wessels, T.; Baerlocher, Ch.; McCusker, L.B.; Creyghton, E.J.:An ordered form of the extra-large-pore zeolite UTD-1: synth-esis and structure analysis from powder diffraction data. J. Am.Chem. Soc. 121 (1999) 6242–6247.
[3] Grosse-Kunstleve, R.W.; McCusker, L.B.; Baerlocher, Ch.: Zeo-lite structure determination from powder diffraction data: appli-cations of the FOCUS method. J. Appl. Cryst. 32 (1999) 536–542.
[4] Grosse-Kunstleve, R.W.; McCusker, L.B.; Baerlocher, Ch.: Pow-der Diffraction Data and Crystal Chemical Information Com-bined in an Automated Structure Determination Procedure forZeolites. J. Appl. Cryst. 30 (1997) 985–995.
[5] Brenner, S.; McCusker, L.B.; Baerlocher, Ch.: The applicationof structure envelopes in structure determination from powderdiffraction data. J. Appl. Cryst. 35 (2002) 243–252.
[6] Brenner, S.; McCusker, L.B.; Baerlocher, Ch.: Using a structureenvelope to facilitate structure solution from powder diffractiondata. J. Appl. Cryst. 30 (1997) 1167.
[7] Wessels, T.; Baerlocher, Ch.; McCusker, L.B.: Single-crystal-likediffraction data from polycrystalline materials. Science 284(1999) 477–479.
[8] Baerlocher, Ch.; McCusker, L.B.; Prokic, S.; Wessels, T.: Ex-ploiting texture to estimate the relative intensities of overlappingreflections. Z. Kristallogr. 219 (2004) 803–812.
[9] Gramm, F.; Baerlocher, Ch.; McCusker, L.B.; Warrender, S.J.;Wright, P.A.; Han, B.; Hong, S.B.; Liu, Z.; Ohsuna T.; and Tera-saki, O.: Complex zeolite structure solved by combining powderdiffraction and electron microscopy. Nature 444 (2006) 79–81.
[10] Baerlocher, Ch.; Gramm, F.; Massuger, L.; McCusker, L. B.;He, Z. B.; Hovmoller, S.; Zou, X. D.: Structure of the polycrys-talline zeolite catalyst IM-5 solved by enhanced charge flipping.Science 315 (2007) 1113–1116.
[11] Baerlocher, Ch.; Xie, D.; McCusker, L.B.; Hwang, S.J.; Chan,I.Y.; Ong, K.; Burton, A.W.; Zones, S.I.: Ordered silicon vacan-cies in the framework structure of the zeolite catalyst SSZ-74.Nature Mater. 7 (2008) 631–635.
[12] Sun, J.L.; Bonneau, C.; Cantın, A.; Corma, A.; Dıaz-Cabanas,M.J.; Moliner, M.; Zhang, D.L.; Li, M.R.; Zou, X.D.: The ITQ-37 mesoporous chiral zeolite. Nature 458 (2009) 1154–1157.
[13] Downing, K.H.; Meisheng, H.; Wenk, H.R.; O’Keefe, M.A.: Re-solution of oxygen atoms in staurolite by three-dimensionaltransmission electron microscopy. Nature 348 (1990) 525–528.
[14] Hovmoller, S.; Sjogren, A.; farrants, G.; Sundberg, M.; Marin-der, B.O.: Accurate Atomic Positions from Electron Microscopy.Nature 311 (1984) 238–241.
[15] Wang, D. N.; Hovmoller, S.; Kihlborg, L.; Sundberg, M.: Struc-ture Determination and Correction for Distortions in HREM byCrystallographic Image Processing. Ultramicroscopy 25 (1988)303–316.
[16] Wang, Y.M.; Wang, H.B.; Li, F.H.; Jia, L.S.; Chen, X.L. Maxi-mum entropy image deconvolution applied to structure determi-nation for crystal Nd1.82Ce0.15CuO4�d . Micron 36 (2005) 393–400.
[17] Bougerol-Chaillout, C.: Structure determination of oxide com-pounds by electron crystallography. Micron 32 (2001) 473–479.
[18] Weirich, T. E.; Ramlau, R.; Simon, A.; Hovmoller, S.; Zou, X.D.: A crystal structure determined to 0.02 A accuracy by elec-tron microscopy. Nature 382 (1996) 144–146.
[19] Zandbergen, H. W.; Andersen, S. J.; Jansen, J.: Structure Deter-mination of Mg5Si6 Particles in Al by Dynamic Electron Dif-fraction Studies. Science 277 (1997) 1221–1225.
[20] Weirich, T. E.: Electron crystallography without limits? Crystalstructure of Ti45Se16 redetermined by electron diffraction struc-ture analysis. Acta Cryst. A57 (2001) 183–191.
[21] Zou, X. D., Mo, Z. M., Hovmoller, S., Li, X. Z., Kuo, K. H.:Three-dimensional reconstruction of the n-AlCrFe phase by elec-tron crystallography. Acta Crystallogr. A59 (2003) 526–539.
[22] Henderson, R.; Unwin, P.N.T.: Three-dimensional model of pur-ple membrane obtained by electron microscopy. Nature 257(1975) 28–32.
[23] Bullough, P.A.; Henderson, R.: Phase accuracy in high-resolu-tion electron microscopy of trigonal and orthorhombic purplemembrane. Biophys. J. 58 (1990) 705–711.
[24] Nicolopoulos, S.; Conzalez-Calbet, J.M.; Vallet-Regı, M.; Cor-ma, A.; Corell, C.; Guil, J.M.; Perez-Pariente, J.: Direct Phasingin Electron Crystallography: Ab initio determination of a newMCM-22 zeolite structure. J. Am. Chem. Soc. 117, (1995)8947–8956.
[25] a) Wagner, P.; Terasaki, O.; Ritsch, S.; Nery, J. G.; Zones, S. I.;Davis, M. E.; Hiraga, K.: Electron Diffraction Structure Solutionof a Nanocrystalline Zeolite at Atomic Resolution. J. Phys.Chem. B103 (1999) 8245-8250. b) Carlsson, A.; Oku, T.; Bo-vin, J.-O.; Karlsson, G.; Okamoto, Y.; Ohnishi, N.; Terasaki, O.:The structure of iron oxide implanted zeolite Y, determined byhigh-resolution electron microscopy and refined with selectedarea electron diffraction amplitudes. Chem. Eur. J. 5 (1999)244–249. c) Carlsson, A.; Kaneda, M.; Sakamoto, Y.; Terasaki,O.; Ryoo, R.; Joo, S.H.: The structure of MCM-48 determinedby electron crystallography. J. Electron Microsc. 48 (1999)795–798. d) Ohsuna, T.; Liu, Z.; Terasaki, O.; Hiraga, K.; Cam-blor, M.A.: Framework determination of a polytype of zeoliteBeta by using electron crystallography. J. Phys. Chem. B 106(2002) 5673-5678.
[26] a) Dorset, D.L.; Roth, W.J.; Gilmore, C.J.: Electron crystallogra-phy of zeolites - the MWW family as a test of direct 3D struc-ture determination. Acta Cryst. A61 (2005) 516–527. b) Dorset,D. L.: The crystal structure of ZSM-10, a powder x-ray andelectron diffraction study. Z. Krist. 221 (2006) 260–265. c) Dor-set, D. L.; Gilmore, C. J.; Jorda, J. L.; Nicolopoulos, S.: Directelectron crystallographic determination of zeolite zonal struc-tures. Ultramicroscopy 107 (2007) 462-473. d) Gilmore, C. J.;Dong, W.; Dorset, D. L.: Solving the crystal structures of zeo-lites using electron diffraction. I. Use of potential density histo-grams. Acta Cryst. A64 (2008) 284–294. e) Gilmore, C. J.;Dong, W.; Dorset, D. L.: Solving the crystal structures of zeo-lites using electron diffraction.II. Density building functions.Acta Cryst. A64 (2008) 295-302. f) Dorset, D. L.; Strohmaier,K. G.; Kliewer, C. E.; Corma, A.; Dıaz-Cabanas, M. J.; Rey, F.;Gilmore, C. J.: The crystal structure of ITQ-26, a 3-D frame-work with extra-large pores. Chem. Mater. 20 (2008) 5325–5331.
[27] Sakamoto, Y.; Kaneda, M. Terasaki, O.; Zhao, D.Y.; Kim, J.M.;Stucky, G.; Shin, H.J.; Ryoo, R.: Direct imaging of the poresand cages of three-dimensional mesoporous materials. Nature408 (2000) 449–453.
[28] Gao, C.B.; Sakamoto, Y.; Sakamoto, K.; Terasaki, O.; Che,S.A.: Synthesis and characterization of mesoporous silica AMS-10 with bicontinuous cubic Pn-3m symmetry. Angew. Chem.Int. Ed. 45 (2006) 4295–4298.
[29] Ruan, J.F.; Wu, P.; Slater, B.; Terasaki, O. Structure Elucidationof the Highly Active Titanosilicate Catalyst Ti-YNU-1. Angew.Chem. Int. Ed. 44 (2005) 6719–6723.
[30] a) Oszlanyi, G.; Suto, A.: Ab initio structure solution by chargeflipping. Acta Cryst. A60 (2004) 134–141; b) Oszlanyi, G.;Suto, A.: Ab initio structure solution by charge flipping. II. Useof weak reflections Acta Cryst. A61 (2005) 147–152; c) Baerlo-cher, Ch., McCusker, L.B.; Palatinus, L.: Charge flipping com-bined with histogram matching to solve complex crystal struc-tures from powder diffraction data. Z. Kristallogr. 222 (2007)47-53.
[31] Benazzi, E.; Guth, J.L.; Rouleau, L.: Preparation of IM-5 zeoliteand its catalytic applications. PCT Int. Appl. WO 98 (1998)17581.
[32] a) Corma, A.; Chica, A.; Guil, J.M.; Llopis, F.J.; Mabilon, G.;Perdigon-Melon, J.A.; Valencia, S.: Determination of the poretopology of zeolite IM-5 by means of catalytic test reactionsand hydrocarbon adsorption measurements. J. Catal. 189 (2000)382-394; b) Corma, A.; Martınez-Triguero, J.; Valencia, S.; Be-nazzi, E.; Lacombe, S.: IM-5: A Highly Thermal and Hydrother-mal Shape-Selective Cracking Zeolite. J. Catal. 206 (2002)125–133; c) Lee, S. H.; Lee, D. K.; Shin, C. H.; Park, Y. K.;Wright, P. A.; Lee, W. M.; Hong, S. B.: Synthesis, characteriza-tion, and catalytic properties of zeolites IM-5 and NU-88. J.Catal. 215 (2003) 151-170; d) Serra, J. M.; Guillon, E.; Corma,
84 J. Sun, Z. He, S. Hovmoller et al.

A.: A rational design of alkyl-aromatics dealkylation-transalkyla-tion catalysts using C8 and C9 alkyl-aromatics as reactants. J.Catal. 227 (2004) 459–469.
[33] Zou, X. D.; Sukharev, Yu.; Hovmoller, S.: ELD – A computerprogram system for extracting intensities from electron diffrac-tion patterns. Ultramicroscopy 49 (1993) 147–158.
[34] Zou, X.D.; Hovmoller, A.; Hovmoller S.: Trice – a program forreconstructing 3D reciprocal space and determining unit cellparameters. Ultramicroscopy 98 (2004) 187–193.
[35] Hovmoller, S.: CRISP – Crystallographic image processing on apersonal computer. Ultramicroscopy 41 (1992) 121–135.
[36] Oleynikov, P. http://www.analitex.com.
[37] Baerlocher, Ch.; Hepp, A.; Meier, W.M. DLS-76: Distance-least-squares refinement program. ETH Zurich, Switzerland,1976.
[38] O’Keefe, M.A.; Dahmen, U.; Hetherington, C.J.D.: Simulatedimage maps for use in experimental high-resolution electron mi-croscopy. Mat. Res. Soc. Symp. Proc. 159 (1989) 453–458.
[39] Capitani, G.C.; Oleynikov, P.; Hovmoller, S.; Mellini, M. A.: Apractical method to detect and correct for lens distortion in theTEM. Ultramicroscopy 106 (2006) 66–74.
[40] Hahn, T. International Tables for Crystallography Vol. A: Space-Group Symmetry. Fifth Edition, Kluwer Academic Publishers(Dordrecht), 2002.
Structure determination of the zeolite IM-5 using electron crystallography 85
1
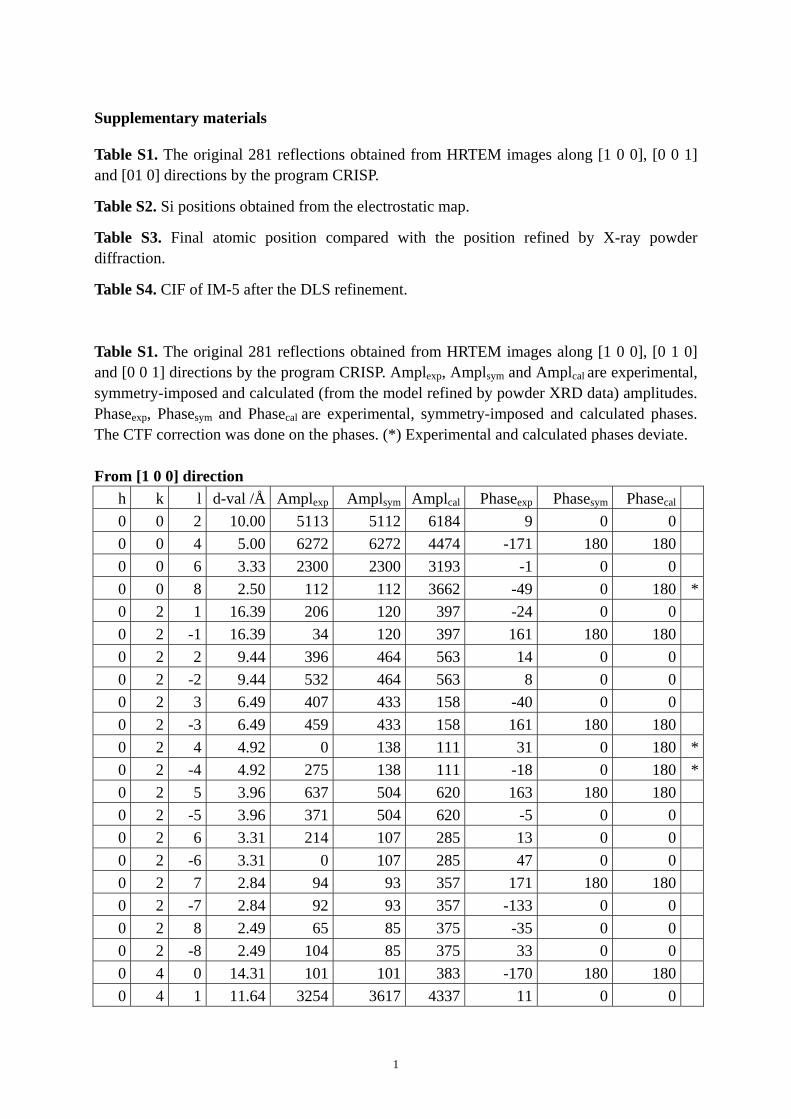
Supplementary materials
Table S1. The original 281 reflections obtained from HRTEM images along [1 0 0], [0 0 1] and [01 0] directions by the program CRISP.
Table S2. Si positions obtained from the electrostatic map.
Table S3. Final atomic position compared with the position refined by X-ray powder diffraction.
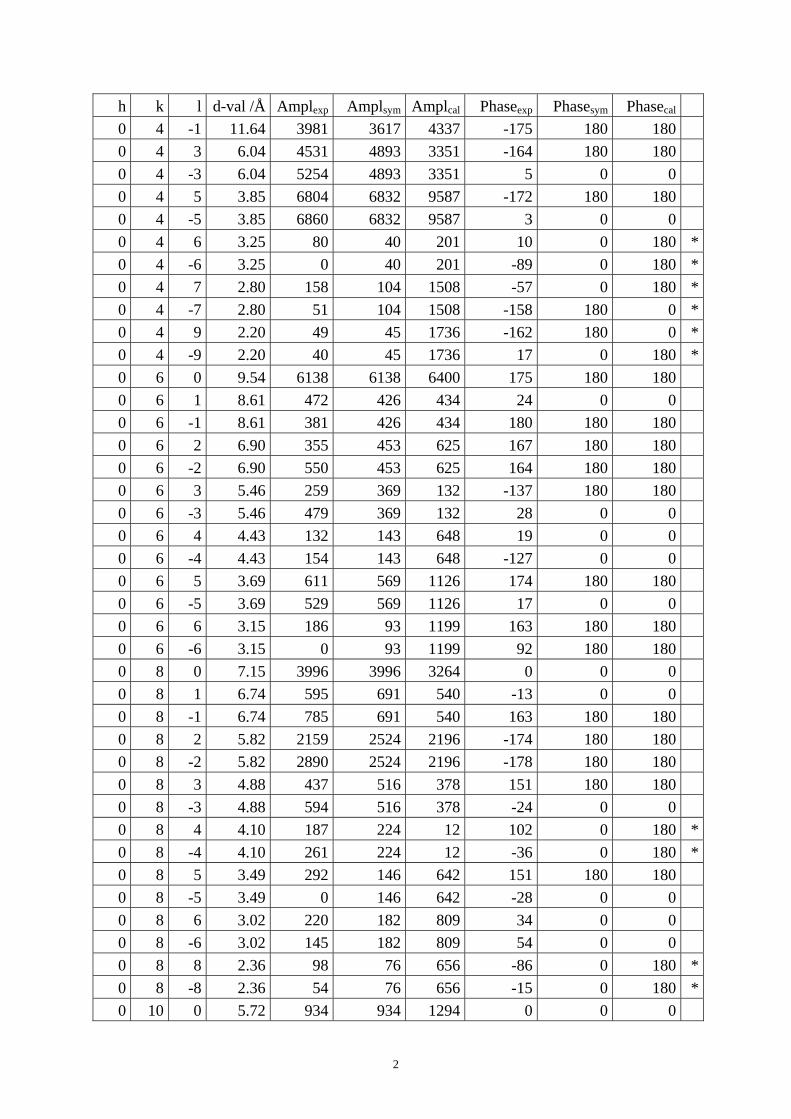
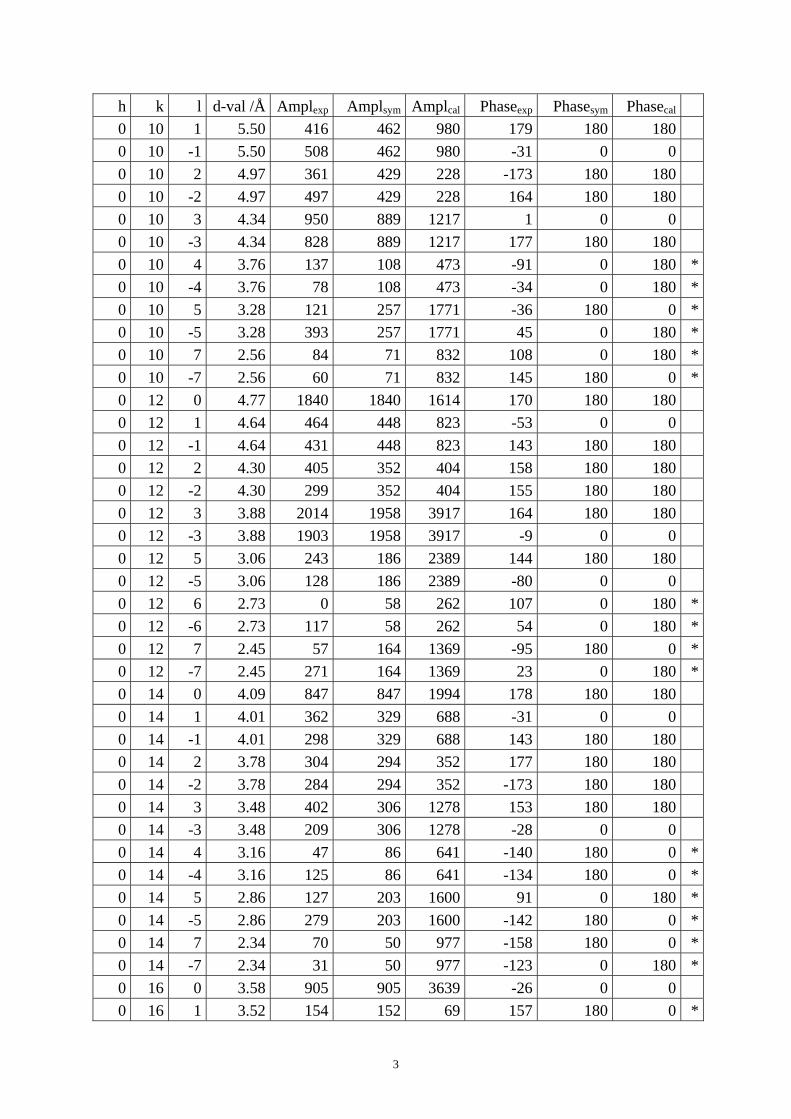
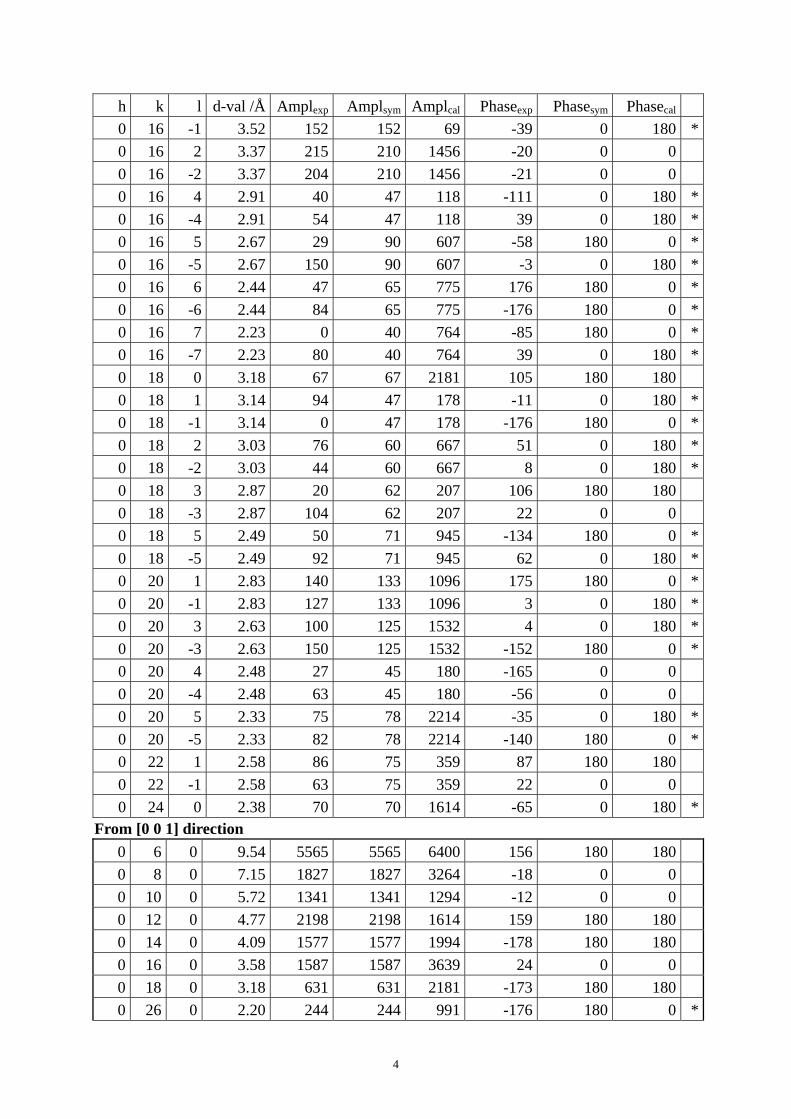
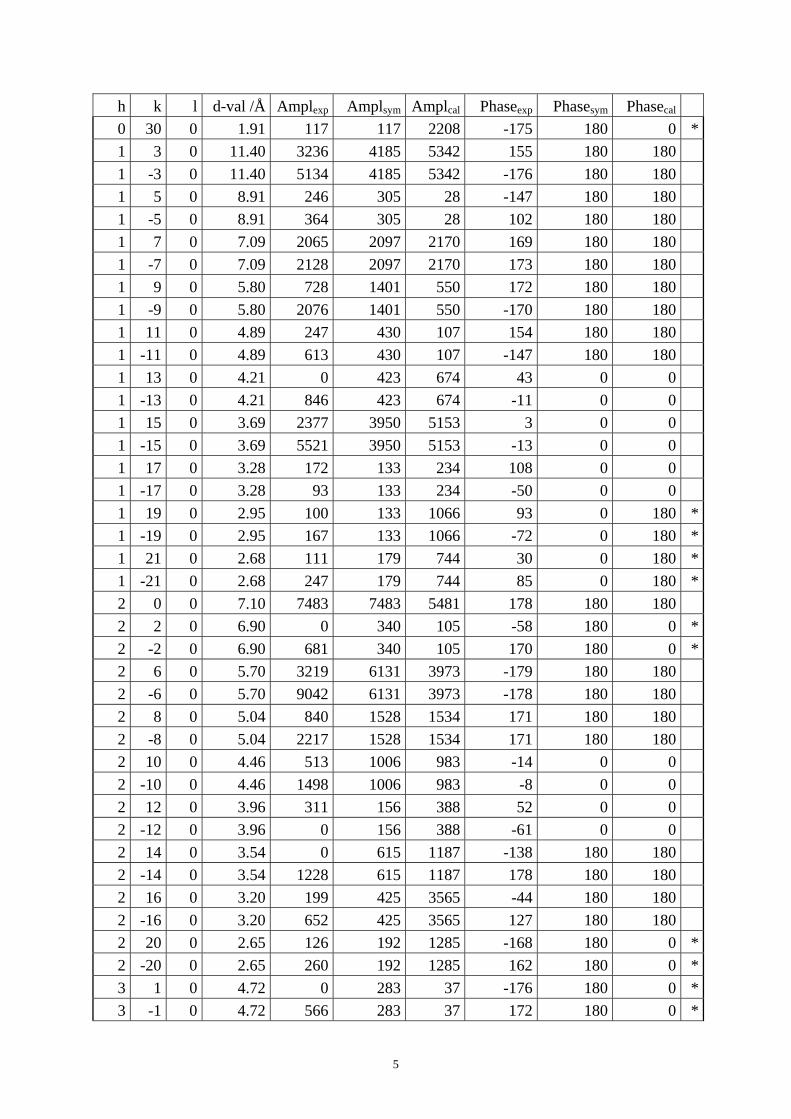
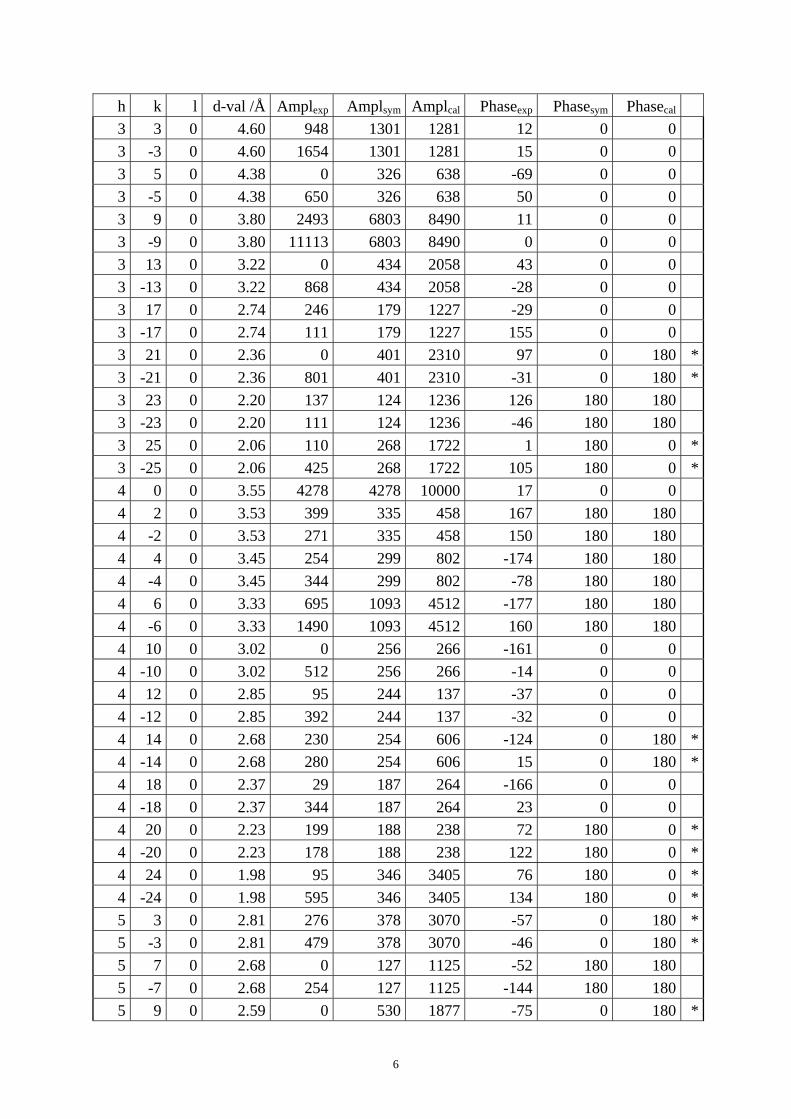
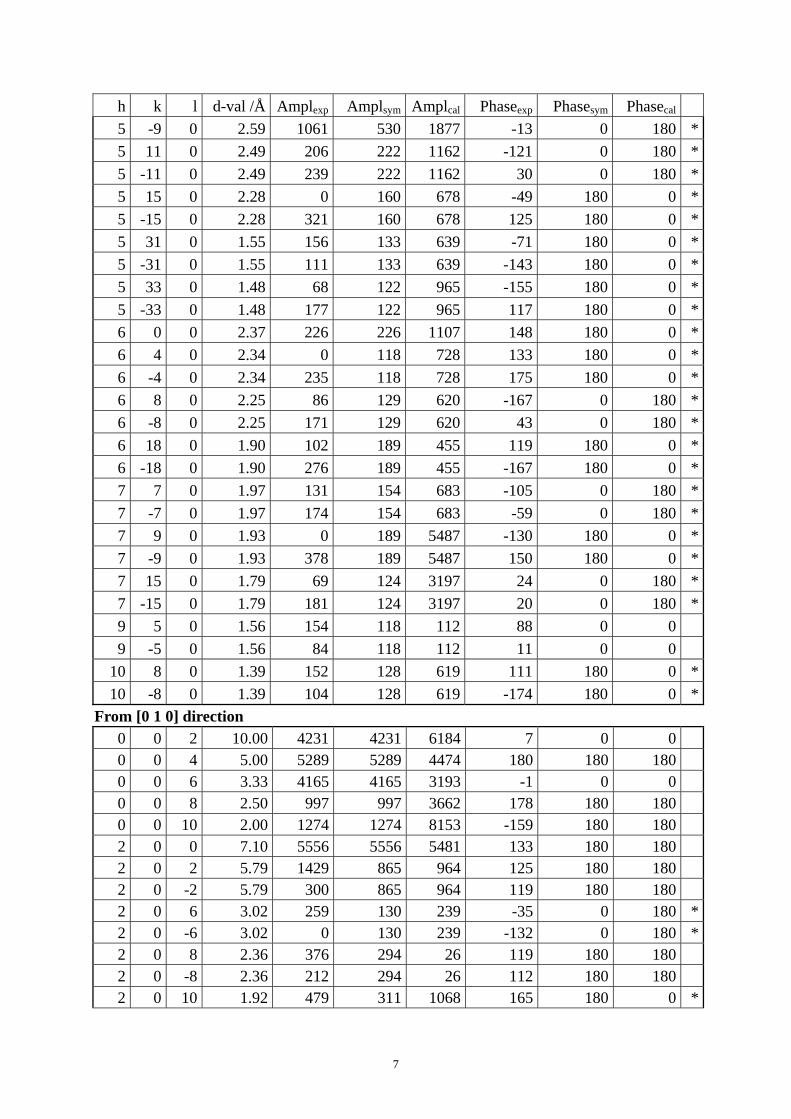
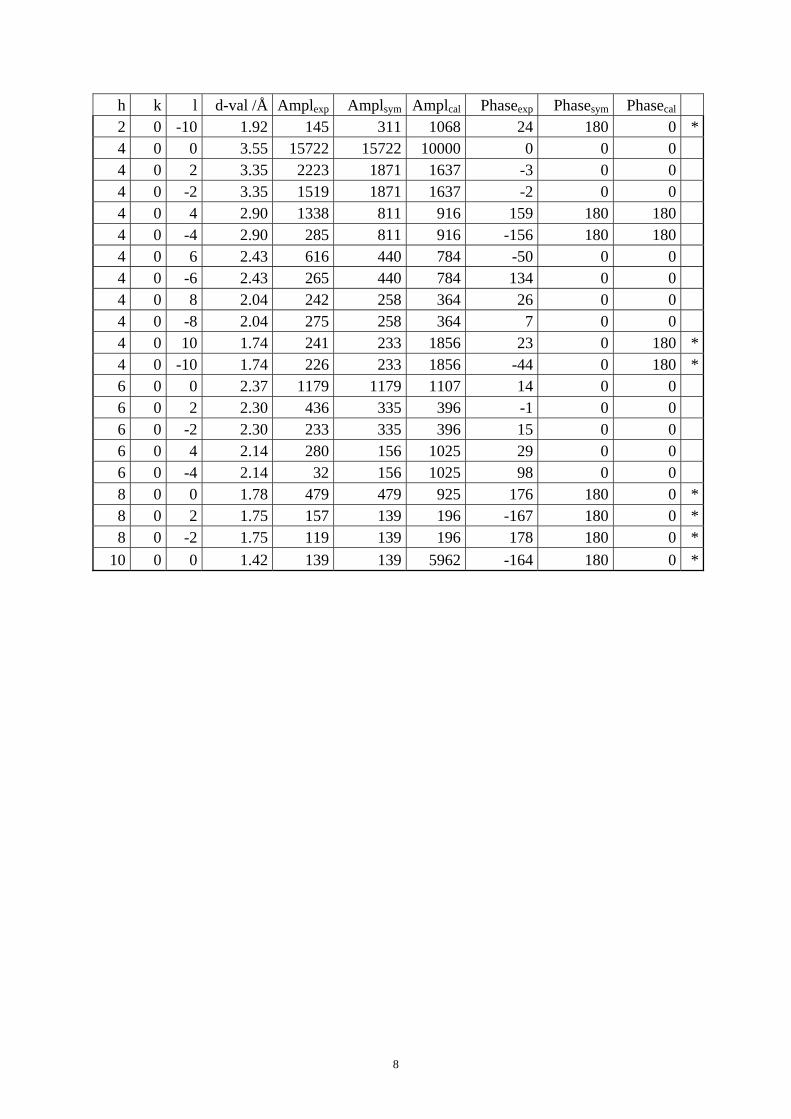
Table S4. CIF of IM-5 after the DLS refinement. Table S1. The original 281 reflections obtained from HRTEM images along [1 0 0], [0 1 0] and [0 0 1] directions by the program CRISP. Amplexp, Amplsym and Amplcal are experimental, symmetry-imposed and calculated (from the model refined by powder XRD data) amplitudes. Phaseexp, Phasesym and Phasecal are experimental, symmetry-imposed and calculated phases. The CTF correction was done on the phases. (*) Experimental and calculated phases deviate.
From [1 0 0] direction
h k l d-val /Å Amplexp Amplsym Amplcal Phaseexp Phasesym Phasecal 0 0 2 10.00 5113 5112 6184 9 0 0 0 0 4 5.00 6272 6272 4474 -171 180 180 0 0 6 3.33 2300 2300 3193 -1 0 0 0 0 8 2.50 112 112 3662 -49 0 180 *0 2 1 16.39 206 120 397 -24 0 0 0 2 -1 16.39 34 120 397 161 180 180 0 2 2 9.44 396 464 563 14 0 0 0 2 -2 9.44 532 464 563 8 0 0 0 2 3 6.49 407 433 158 -40 0 0 0 2 -3 6.49 459 433 158 161 180 180 0 2 4 4.92 0 138 111 31 0 180 *0 2 -4 4.92 275 138 111 -18 0 180 *0 2 5 3.96 637 504 620 163 180 180 0 2 -5 3.96 371 504 620 -5 0 0 0 2 6 3.31 214 107 285 13 0 0 0 2 -6 3.31 0 107 285 47 0 0 0 2 7 2.84 94 93 357 171 180 180 0 2 -7 2.84 92 93 357 -133 0 0 0 2 8 2.49 65 85 375 -35 0 0 0 2 -8 2.49 104 85 375 33 0 0 0 4 0 14.31 101 101 383 -170 180 180 0 4 1 11.64 3254 3617 4337 11 0 0
2
h k l d-val /Å Amplexp Amplsym Amplcal Phaseexp Phasesym Phasecal 0 4 -1 11.64 3981 3617 4337 -175 180 180 0 4 3 6.04 4531 4893 3351 -164 180 180 0 4 -3 6.04 5254 4893 3351 5 0 0 0 4 5 3.85 6804 6832 9587 -172 180 180 0 4 -5 3.85 6860 6832 9587 3 0 0 0 4 6 3.25 80 40 201 10 0 180 *0 4 -6 3.25 0 40 201 -89 0 180 *0 4 7 2.80 158 104 1508 -57 0 180 *0 4 -7 2.80 51 104 1508 -158 180 0 *0 4 9 2.20 49 45 1736 -162 180 0 *0 4 -9 2.20 40 45 1736 17 0 180 *0 6 0 9.54 6138 6138 6400 175 180 180 0 6 1 8.61 472 426 434 24 0 0 0 6 -1 8.61 381 426 434 180 180 180 0 6 2 6.90 355 453 625 167 180 180 0 6 -2 6.90 550 453 625 164 180 180 0 6 3 5.46 259 369 132 -137 180 180 0 6 -3 5.46 479 369 132 28 0 0 0 6 4 4.43 132 143 648 19 0 0 0 6 -4 4.43 154 143 648 -127 0 0 0 6 5 3.69 611 569 1126 174 180 180 0 6 -5 3.69 529 569 1126 17 0 0 0 6 6 3.15 186 93 1199 163 180 180 0 6 -6 3.15 0 93 1199 92 180 180 0 8 0 7.15 3996 3996 3264 0 0 0 0 8 1 6.74 595 691 540 -13 0 0 0 8 -1 6.74 785 691 540 163 180 180 0 8 2 5.82 2159 2524 2196 -174 180 180 0 8 -2 5.82 2890 2524 2196 -178 180 180 0 8 3 4.88 437 516 378 151 180 180 0 8 -3 4.88 594 516 378 -24 0 0 0 8 4 4.10 187 224 12 102 0 180 *0 8 -4 4.10 261 224 12 -36 0 180 *0 8 5 3.49 292 146 642 151 180 180 0 8 -5 3.49 0 146 642 -28 0 0 0 8 6 3.02 220 182 809 34 0 0 0 8 -6 3.02 145 182 809 54 0 0 0 8 8 2.36 98 76 656 -86 0 180 *0 8 -8 2.36 54 76 656 -15 0 180 *0 10 0 5.72 934 934 1294 0 0 0
3
h k l d-val /Å Amplexp Amplsym Amplcal Phaseexp Phasesym Phasecal 0 10 1 5.50 416 462 980 179 180 180 0 10 -1 5.50 508 462 980 -31 0 0 0 10 2 4.97 361 429 228 -173 180 180 0 10 -2 4.97 497 429 228 164 180 180 0 10 3 4.34 950 889 1217 1 0 0 0 10 -3 4.34 828 889 1217 177 180 180 0 10 4 3.76 137 108 473 -91 0 180 *0 10 -4 3.76 78 108 473 -34 0 180 *0 10 5 3.28 121 257 1771 -36 180 0 *0 10 -5 3.28 393 257 1771 45 0 180 *0 10 7 2.56 84 71 832 108 0 180 *0 10 -7 2.56 60 71 832 145 180 0 *0 12 0 4.77 1840 1840 1614 170 180 180 0 12 1 4.64 464 448 823 -53 0 0 0 12 -1 4.64 431 448 823 143 180 180 0 12 2 4.30 405 352 404 158 180 180 0 12 -2 4.30 299 352 404 155 180 180 0 12 3 3.88 2014 1958 3917 164 180 180 0 12 -3 3.88 1903 1958 3917 -9 0 0 0 12 5 3.06 243 186 2389 144 180 180 0 12 -5 3.06 128 186 2389 -80 0 0 0 12 6 2.73 0 58 262 107 0 180 *0 12 -6 2.73 117 58 262 54 0 180 *0 12 7 2.45 57 164 1369 -95 180 0 *0 12 -7 2.45 271 164 1369 23 0 180 *0 14 0 4.09 847 847 1994 178 180 180 0 14 1 4.01 362 329 688 -31 0 0 0 14 -1 4.01 298 329 688 143 180 180 0 14 2 3.78 304 294 352 177 180 180 0 14 -2 3.78 284 294 352 -173 180 180 0 14 3 3.48 402 306 1278 153 180 180 0 14 -3 3.48 209 306 1278 -28 0 0 0 14 4 3.16 47 86 641 -140 180 0 *0 14 -4 3.16 125 86 641 -134 180 0 *0 14 5 2.86 127 203 1600 91 0 180 *0 14 -5 2.86 279 203 1600 -142 180 0 *0 14 7 2.34 70 50 977 -158 180 0 *0 14 -7 2.34 31 50 977 -123 0 180 *0 16 0 3.58 905 905 3639 -26 0 0 0 16 1 3.52 154 152 69 157 180 0 *
4
h k l d-val /Å Amplexp Amplsym Amplcal Phaseexp Phasesym Phasecal 0 16 -1 3.52 152 152 69 -39 0 180 *0 16 2 3.37 215 210 1456 -20 0 0 0 16 -2 3.37 204 210 1456 -21 0 0 0 16 4 2.91 40 47 118 -111 0 180 *0 16 -4 2.91 54 47 118 39 0 180 *0 16 5 2.67 29 90 607 -58 180 0 *0 16 -5 2.67 150 90 607 -3 0 180 *0 16 6 2.44 47 65 775 176 180 0 *0 16 -6 2.44 84 65 775 -176 180 0 *0 16 7 2.23 0 40 764 -85 180 0 *0 16 -7 2.23 80 40 764 39 0 180 *0 18 0 3.18 67 67 2181 105 180 180 0 18 1 3.14 94 47 178 -11 0 180 *0 18 -1 3.14 0 47 178 -176 180 0 *0 18 2 3.03 76 60 667 51 0 180 *0 18 -2 3.03 44 60 667 8 0 180 *0 18 3 2.87 20 62 207 106 180 180 0 18 -3 2.87 104 62 207 22 0 0 0 18 5 2.49 50 71 945 -134 180 0 *0 18 -5 2.49 92 71 945 62 0 180 *0 20 1 2.83 140 133 1096 175 180 0 *0 20 -1 2.83 127 133 1096 3 0 180 *0 20 3 2.63 100 125 1532 4 0 180 *0 20 -3 2.63 150 125 1532 -152 180 0 *0 20 4 2.48 27 45 180 -165 0 0 0 20 -4 2.48 63 45 180 -56 0 0 0 20 5 2.33 75 78 2214 -35 0 180 *0 20 -5 2.33 82 78 2214 -140 180 0 *0 22 1 2.58 86 75 359 87 180 180 0 22 -1 2.58 63 75 359 22 0 0 0 24 0 2.38 70 70 1614 -65 0 180 *
From [0 0 1] direction 0 6 0 9.54 5565 5565 6400 156 180 180 0 8 0 7.15 1827 1827 3264 -18 0 0 0 10 0 5.72 1341 1341 1294 -12 0 0 0 12 0 4.77 2198 2198 1614 159 180 180 0 14 0 4.09 1577 1577 1994 -178 180 180 0 16 0 3.58 1587 1587 3639 24 0 0 0 18 0 3.18 631 631 2181 -173 180 180 0 26 0 2.20 244 244 991 -176 180 0 *
5
h k l d-val /Å Amplexp Amplsym Amplcal Phaseexp Phasesym Phasecal
0 30 0 1.91 117 117 2208 -175 180 0 *1 3 0 11.40 3236 4185 5342 155 180 180 1 -3 0 11.40 5134 4185 5342 -176 180 180 1 5 0 8.91 246 305 28 -147 180 180 1 -5 0 8.91 364 305 28 102 180 180 1 7 0 7.09 2065 2097 2170 169 180 180 1 -7 0 7.09 2128 2097 2170 173 180 180 1 9 0 5.80 728 1401 550 172 180 180 1 -9 0 5.80 2076 1401 550 -170 180 180 1 11 0 4.89 247 430 107 154 180 180 1 -11 0 4.89 613 430 107 -147 180 180 1 13 0 4.21 0 423 674 43 0 0 1 -13 0 4.21 846 423 674 -11 0 0 1 15 0 3.69 2377 3950 5153 3 0 0 1 -15 0 3.69 5521 3950 5153 -13 0 0 1 17 0 3.28 172 133 234 108 0 0 1 -17 0 3.28 93 133 234 -50 0 0 1 19 0 2.95 100 133 1066 93 0 180 *1 -19 0 2.95 167 133 1066 -72 0 180 *1 21 0 2.68 111 179 744 30 0 180 *1 -21 0 2.68 247 179 744 85 0 180 *2 0 0 7.10 7483 7483 5481 178 180 180 2 2 0 6.90 0 340 105 -58 180 0 *2 -2 0 6.90 681 340 105 170 180 0 *2 6 0 5.70 3219 6131 3973 -179 180 180 2 -6 0 5.70 9042 6131 3973 -178 180 180 2 8 0 5.04 840 1528 1534 171 180 180 2 -8 0 5.04 2217 1528 1534 171 180 180 2 10 0 4.46 513 1006 983 -14 0 0 2 -10 0 4.46 1498 1006 983 -8 0 0 2 12 0 3.96 311 156 388 52 0 0 2 -12 0 3.96 0 156 388 -61 0 0 2 14 0 3.54 0 615 1187 -138 180 180 2 -14 0 3.54 1228 615 1187 178 180 180 2 16 0 3.20 199 425 3565 -44 180 180 2 -16 0 3.20 652 425 3565 127 180 180 2 20 0 2.65 126 192 1285 -168 180 0 *2 -20 0 2.65 260 192 1285 162 180 0 *3 1 0 4.72 0 283 37 -176 180 0 *3 -1 0 4.72 566 283 37 172 180 0 *
6
h k l d-val /Å Amplexp Amplsym Amplcal Phaseexp Phasesym Phasecal 3 3 0 4.60 948 1301 1281 12 0 0 3 -3 0 4.60 1654 1301 1281 15 0 0 3 5 0 4.38 0 326 638 -69 0 0 3 -5 0 4.38 650 326 638 50 0 0 3 9 0 3.80 2493 6803 8490 11 0 0 3 -9 0 3.80 11113 6803 8490 0 0 0 3 13 0 3.22 0 434 2058 43 0 0 3 -13 0 3.22 868 434 2058 -28 0 0 3 17 0 2.74 246 179 1227 -29 0 0 3 -17 0 2.74 111 179 1227 155 0 0 3 21 0 2.36 0 401 2310 97 0 180 *3 -21 0 2.36 801 401 2310 -31 0 180 *3 23 0 2.20 137 124 1236 126 180 180 3 -23 0 2.20 111 124 1236 -46 180 180 3 25 0 2.06 110 268 1722 1 180 0 *3 -25 0 2.06 425 268 1722 105 180 0 *4 0 0 3.55 4278 4278 10000 17 0 0 4 2 0 3.53 399 335 458 167 180 180 4 -2 0 3.53 271 335 458 150 180 180 4 4 0 3.45 254 299 802 -174 180 180 4 -4 0 3.45 344 299 802 -78 180 180 4 6 0 3.33 695 1093 4512 -177 180 180 4 -6 0 3.33 1490 1093 4512 160 180 180 4 10 0 3.02 0 256 266 -161 0 0 4 -10 0 3.02 512 256 266 -14 0 0 4 12 0 2.85 95 244 137 -37 0 0 4 -12 0 2.85 392 244 137 -32 0 0 4 14 0 2.68 230 254 606 -124 0 180 *4 -14 0 2.68 280 254 606 15 0 180 *4 18 0 2.37 29 187 264 -166 0 0 4 -18 0 2.37 344 187 264 23 0 0 4 20 0 2.23 199 188 238 72 180 0 *4 -20 0 2.23 178 188 238 122 180 0 *4 24 0 1.98 95 346 3405 76 180 0 *4 -24 0 1.98 595 346 3405 134 180 0 *5 3 0 2.81 276 378 3070 -57 0 180 *5 -3 0 2.81 479 378 3070 -46 0 180 *5 7 0 2.68 0 127 1125 -52 180 180 5 -7 0 2.68 254 127 1125 -144 180 180 5 9 0 2.59 0 530 1877 -75 0 180 *
7
h k l d-val /Å Amplexp Amplsym Amplcal Phaseexp Phasesym Phasecal
5 -9 0 2.59 1061 530 1877 -13 0 180 *5 11 0 2.49 206 222 1162 -121 0 180 *5 -11 0 2.49 239 222 1162 30 0 180 *5 15 0 2.28 0 160 678 -49 180 0 *5 -15 0 2.28 321 160 678 125 180 0 *5 31 0 1.55 156 133 639 -71 180 0 *5 -31 0 1.55 111 133 639 -143 180 0 *5 33 0 1.48 68 122 965 -155 180 0 *5 -33 0 1.48 177 122 965 117 180 0 *6 0 0 2.37 226 226 1107 148 180 0 *6 4 0 2.34 0 118 728 133 180 0 *6 -4 0 2.34 235 118 728 175 180 0 *6 8 0 2.25 86 129 620 -167 0 180 *6 -8 0 2.25 171 129 620 43 0 180 *6 18 0 1.90 102 189 455 119 180 0 *6 -18 0 1.90 276 189 455 -167 180 0 *7 7 0 1.97 131 154 683 -105 0 180 *7 -7 0 1.97 174 154 683 -59 0 180 *7 9 0 1.93 0 189 5487 -130 180 0 *7 -9 0 1.93 378 189 5487 150 180 0 *7 15 0 1.79 69 124 3197 24 0 180 *7 -15 0 1.79 181 124 3197 20 0 180 *9 5 0 1.56 154 118 112 88 0 0 9 -5 0 1.56 84 118 112 11 0 0
10 8 0 1.39 152 128 619 111 180 0 *10 -8 0 1.39 104 128 619 -174 180 0 *
From [0 1 0] direction 0 0 2 10.00 4231 4231 6184 7 0 0 0 0 4 5.00 5289 5289 4474 180 180 180 0 0 6 3.33 4165 4165 3193 -1 0 0 0 0 8 2.50 997 997 3662 178 180 180 0 0 10 2.00 1274 1274 8153 -159 180 180 2 0 0 7.10 5556 5556 5481 133 180 180 2 0 2 5.79 1429 865 964 125 180 180 2 0 -2 5.79 300 865 964 119 180 180 2 0 6 3.02 259 130 239 -35 0 180 *2 0 -6 3.02 0 130 239 -132 0 180 *2 0 8 2.36 376 294 26 119 180 180 2 0 -8 2.36 212 294 26 112 180 180 2 0 10 1.92 479 311 1068 165 180 0 *
8
h k l d-val /Å Amplexp Amplsym Amplcal Phaseexp Phasesym Phasecal
2 0 -10 1.92 145 311 1068 24 180 0 *4 0 0 3.55 15722 15722 10000 0 0 0 4 0 2 3.35 2223 1871 1637 -3 0 0 4 0 -2 3.35 1519 1871 1637 -2 0 0 4 0 4 2.90 1338 811 916 159 180 180 4 0 -4 2.90 285 811 916 -156 180 180 4 0 6 2.43 616 440 784 -50 0 0 4 0 -6 2.43 265 440 784 134 0 0 4 0 8 2.04 242 258 364 26 0 0 4 0 -8 2.04 275 258 364 7 0 0 4 0 10 1.74 241 233 1856 23 0 180 *4 0 -10 1.74 226 233 1856 -44 0 180 *6 0 0 2.37 1179 1179 1107 14 0 0 6 0 2 2.30 436 335 396 -1 0 0 6 0 -2 2.30 233 335 396 15 0 0 6 0 4 2.14 280 156 1025 29 0 0 6 0 -4 2.14 32 156 1025 98 0 0 8 0 0 1.78 479 479 925 176 180 0 *8 0 2 1.75 157 139 196 -167 180 0 *8 0 -2 1.75 119 139 196 178 180 0 *
10 0 0 1.42 139 139 5962 -164 180 0 *
9
Table S2. Si positions obtained from the electrostatic map. Atoms x y z
Si1 0.00 0.070 0.05 Si2 0.00 0.123 0.16 Si3 0.00 0.209 0.16 Si4 0.00 0.261 0.06 Si5 0.00 0.406 0.16 Si6 0.00 0.464 0.15 Si7 0.20 0.065 0.05 Si8 0.20 0.137 0.16 Si9 0.20 0.186 0.14 Si10 0.20 0.271 0.05 Si11 0.20 0.392 0.15 Si12 0.20 0.490 0.16 Si13 0.30 0.019 0.05 Si14 0.30 0.110 0.05 Si15 0.30 0.231 0.16 Si16 0.30 0.318 0.05 Si17 0.30 0.359 0.06 Si18 0.30 0.437 0.15 Si19 0.50 0.042 0.05 Si20 0.50 0.098 0.06 Si21 0.50 0.249 0.16 Si22 0.50 0.286 0.05 Si23 0.50 0.388 0.05 Si24 0.50 0.424 0.15
10
Table S3. Final atomic position compared with the position refined by X-ray powder diffraction. Atoms xHRTEM xxray yHRTEM yxray zHRTEM zxray δx/Å δy/Å δz/Å δ/Å Si1 0.000 0.0000 0.0818(9) 0.0819 0.058(2) 0.0561 0.000 0.004 0.039 0.039 Si2 0.000 0.0000 0.1188(12) 0.1132 0.176(2) 0.1733 0.000 0.322 0.060 0.328 Si3 0.000 0.0000 0.2083(11) 0.2106 0.174(2) 0.1727 0.000 0.133 0.019 0.135 Si4 0.000 0.0000 0.2454(8) 0.2465 0.058(2) 0.0596 0.000 0.061 0.034 0.070 Si5 0.000 0.0000 0.3991(9) 0.4051 0.126(3) 0.1313 0.000 0.343 0.105 0.358 Si6 0.000 0.0000 0.4558(8) 0.4575 0.125(3) 0.1235 0.000 0.097 0.034 0.103 Si7 0.196(2) 0.1985 0.0605(6) 0.0628 0.030(2) 0.0304 0.034 0.129 0.010 0.134 Si8 0.203(2) 0.1956 0.1379(7) 0.1369 0.173(1) 0.1699 0.107 0.058 0.070 0.140 Si9 0.195(2) 0.1866 0.1895(7) 0.1887 0.129(2) 0.1224 0.123 0.047 0.136 0.188 Si10 0.203(1) 0.2028 0.2639(4) 0.2642 0.060(1) 0.0611 0.005 0.017 0.012 0.022 Si11 0.203(1) 0.2029 0.3911(8) 0.3906 0.174(1) 0.1738 0.007 0.030 0.003 0.031 Si12 0.187(2) 0.1893 0.4801(6) 0.4811 0.173(1) 0.1712 0.032 0.059 0.042 0.079 Si13 0.318(3) 0.3125 0.0180(3) 0.0179 0.061(1) 0.0611 0.083 0.003 0.008 0.084 Si14 0.295(1) 0.2938 0.1069(3) 0.1083 0.064(2) 0.0677 0.014 0.081 0.072 0.109 Si15 0.299(2) 0.2941 0.2350(8) 0.2331 0.173(1) 0.1711 0.073 0.110 0.043 0.139 Si16 0.304(2) 0.3075 0.3106(5) 0.3105 0.028(2) 0.0371 0.048 0.005 0.188 0.193 Si17 0.295(1) 0.2964 0.3637(5) 0.3621 0.055(2) 0.0538 0.025 0.094 0.032 0.102 Si18 0.305(2) 0.3042 0.4374(8) 0.4364 0.128(2) 0.1298 0.006 0.060 0.035 0.069 Si19 0.500 0.5000 0.0444(7) 0.0430 0.025(3) 0.0369 0.000 0.080 0.234 0.246
11
Si20 0.500 0.5000 0.1009(8) 0.0954 0.025(3) 0.0294 0.000 0.316 0.089 0.328 Si21 0.500 0.5000 0.2528(12) 0.2532 0.172(2) 0.1767 0.000 0.026 0.099 0.102 Si22 0.500 0.5000 0.2913(8) 0.2905 0.063(2) 0.0600 0.000 0.048 0.053 0.071 Si23 0.500 0.5000 0.3810(9) 0.3796 0.061(2) 0.0567 0.000 0.081 0.079 0.113 Si24 0.500 0.5000 0.4173(11) 0.4182 0.173(1) 0.1718 0.000 0.051 0.019 0.054 O1 0.092(1) 0.0899 0.0655(9) 0.0656 0.058(4) 0.0485 0.036 0.003 0.182 0.184 O2 0.000 0.0000 0.0986(13) 0.1049 -0.006(3) 0.0101 0.000 0.362 0.320 0.482 O3 0.000 0.0000 0.0976(15) 0.0891 0.124(3) 0.1333 0.000 0.489 0.189 0.524 O4 0.092(1) 0.0901 0.1349(12) 0.1285 0.166(5) 0.1544 0.022 0.366 0.236 0.436 O5 0.000 0.0000 0.1081(24) 0.1052 0.250 0.2500 0.000 0.165 0.000 0.165 O6 0.000 0.0000 0.2168(21) 0.2177 0.250 0.2500 0.000 0.052 0.000 0.052O7 0.092(1) 0.0887 0.1927(11) 0.1947 0.160(3) 0.1571 0.052 0.113 0.063 0.139 O8 0.000 0.0000 0.2311(12) 0.2348 0.126(3) 0.1327 0.000 0.214 0.126 0.248 O9 0.000 0.0000 0.2274(10) 0.2255 -0.003(3) 0.0061 0.000 0.108 0.185 0.213 O10 0.091(1) 0.0907 0.2622(7) 0.2628 0.054(2) 0.0525 0.003 0.034 0.039 0.052 O11 0.000 0.0000 0.4275(8) 0.4318 0.128(6) 0.1541 0.000 0.249 0.529 0.582 O12 0.092(1) 0.0917 0.3890(10) 0.3920 0.163(3) 0.1591 0.004 0.171 0.069 0.184 O13 0.000 0.0000 0.3900(18) 0.4055 0.050(3) 0.0510 0.000 0.888 0.010 0.888 O14 0.000 0.0000 0.4650(15) 0.4589 0.050(3) 0.0433 0.000 0.346 0.129 0.369 O15 0.091(1) 0.0887 0.4660(11) 0.4708 0.162(3) 0.1528 0.031 0.277 0.194 0.339 O16 0.226(2) 0.2321 0.0341(7) 0.0371 0.050(3) 0.0500 0.078 0.171 0.007 0.188
12
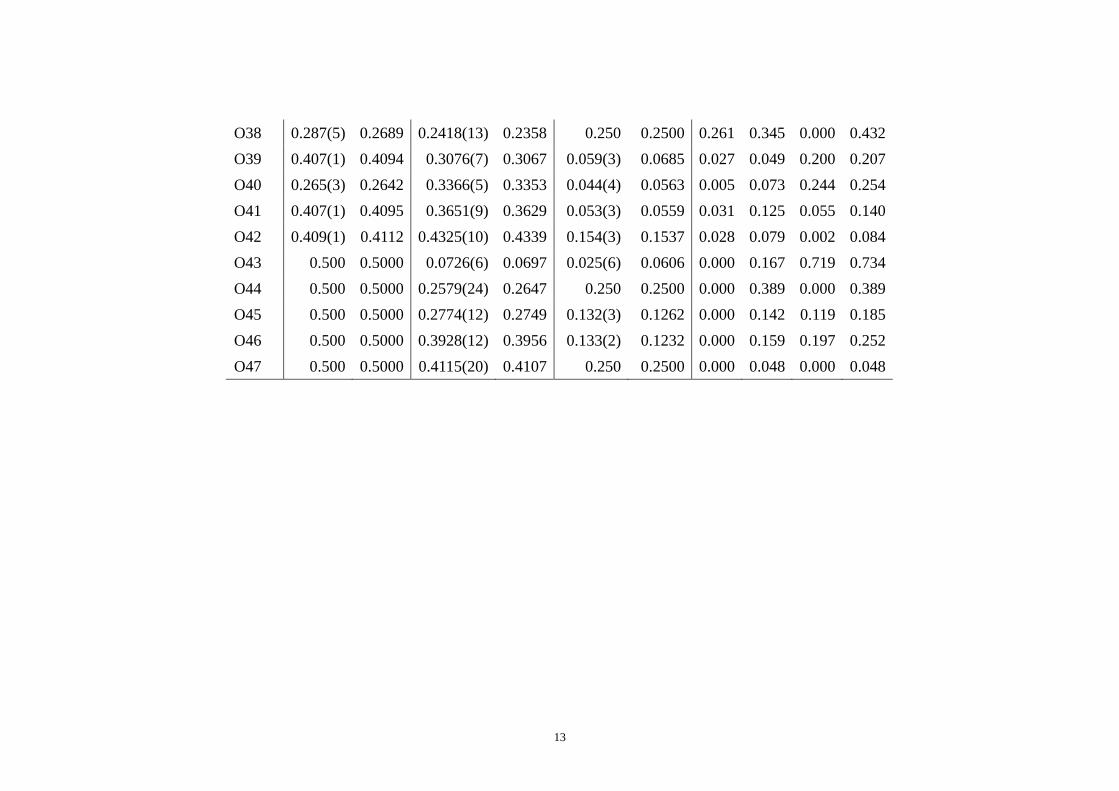
O17 0.197(5) 0.2071 0.0632(12) 0.0668 -0.049(2) -0.0495 0.139 0.205 0.012 0.248 O18 0.269(2) 0.2600 0.0792(7) 0.0815 0.061(3) 0.0705 0.128 0.133 0.186 0.261 O19 0.233(3) 0.2168 0.1633(7) 0.1623 0.145(4) 0.1388 0.232 0.057 0.115 0.265 O20 0.256(3) 0.2687 0.1175(9) 0.1177 0.132(2) 0.1417 0.186 0.010 0.186 0.263 O21 0.232(7) 0.2075 0.1362(16) 0.1379 0.250 0.2500 0.351 0.094 0.000 0.364 O22 0.266(3) 0.2641 0.2082(9) 0.2072 0.162(3) 0.1478 0.032 0.058 0.282 0.288 O23 0.191(5) 0.1763 0.1934(13) 0.1915 0.051(2) 0.0425 0.209 0.108 0.165 0.287 O24 0.235(2) 0.2365 0.2912(4) 0.2910 0.059(2) 0.0642 0.023 0.010 0.098 0.100 O25 0.250 0.2500 0.250 0.2500 0.000 0.0000 0.000 0.000 0.000 0.000 O26 0.236(3) 0.2319 0.2524(9) 0.2522 0.129(1) 0.1311 0.051 0.009 0.035 0.062 O27 0.227(4) 0.2197 0.3852(17) 0.3815 0.250 0.2500 0.105 0.212 0.000 0.237 O28 0.257(3) 0.2561 0.3729(10) 0.3735 0.126(2) 0.1220 0.015 0.034 0.078 0.086 O29 0.235(3) 0.2413 0.4177(9) 0.4168 0.158(4) 0.1651 0.085 0.054 0.153 0.182 O30 0.273(2) 0.2654 0.4632(8) 0.4616 0.153(3) 0.1514 0.112 0.094 0.036 0.150 O31 0.189(5) 0.2096 0.5036(6) 0.5046 0.129(1) 0.1301 0.286 0.060 0.026 0.293 O32 0.197(5) 0.1924 0.4873(11) 0.4877 0.250 0.2500 0.063 0.022 0.000 0.067 O33 0.409(1) 0.4100 0.0349(10) 0.0313 0.064(3) 0.0703 0.017 0.207 0.136 0.248 O34 0.329(7) 0.3219 0.000 0.0000 0.000 0.0000 0.096 0.000 0.000 0.096 O35 0.407(1) 0.4061 0.1102(8) 0.1083 0.062(3) 0.0554 0.011 0.108 0.125 0.165 O36 0.248(4) 0.2429 0.1202(10) 0.1247 0.003(2) 0.0124 0.072 0.256 0.197 0.330 O37 0.408(1) 0.4064 0.2379(11) 0.2379 0.153(3) 0.1635 0.017 0.002 0.219 0.219
13
O38 0.287(5) 0.2689 0.2418(13) 0.2358 0.250 0.2500 0.261 0.345 0.000 0.432 O39 0.407(1) 0.4094 0.3076(7) 0.3067 0.059(3) 0.0685 0.027 0.049 0.200 0.207 O40 0.265(3) 0.2642 0.3366(5) 0.3353 0.044(4) 0.0563 0.005 0.073 0.244 0.254 O41 0.407(1) 0.4095 0.3651(9) 0.3629 0.053(3) 0.0559 0.031 0.125 0.055 0.140 O42 0.409(1) 0.4112 0.4325(10) 0.4339 0.154(3) 0.1537 0.028 0.079 0.002 0.084 O43 0.500 0.5000 0.0726(6) 0.0697 0.025(6) 0.0606 0.000 0.167 0.719 0.734 O44 0.500 0.5000 0.2579(24) 0.2647 0.250 0.2500 0.000 0.389 0.000 0.389 O45 0.500 0.5000 0.2774(12) 0.2749 0.132(3) 0.1262 0.000 0.142 0.119 0.185 O46 0.500 0.5000 0.3928(12) 0.3956 0.133(2) 0.1232 0.000 0.159 0.197 0.252 O47 0.500 0.5000 0.4115(20) 0.4107 0.250 0.2500 0.000 0.048 0.000 0.048

14
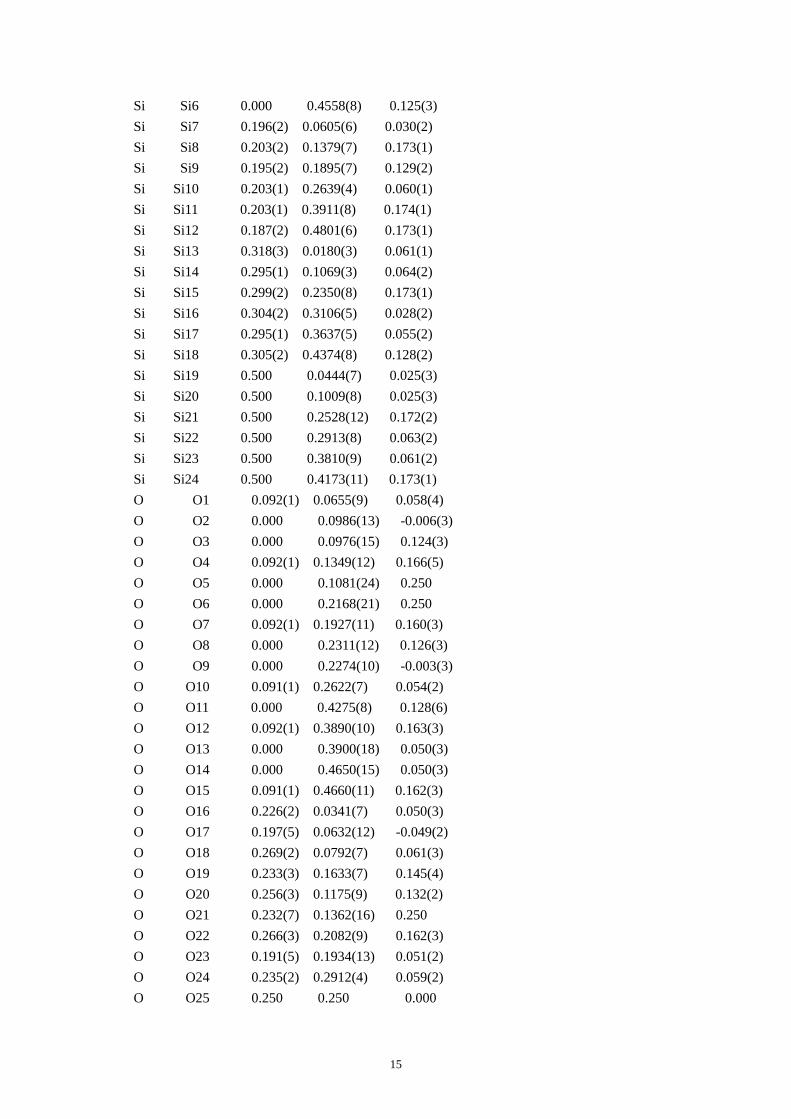
Table S4. CIF of IM-5 after the DLS refinement.
data_IM-5fromHRTEM _audit_creation_method 'generated by CrystalMaker 7.1.7' _cell_length_a 14.33(4) _cell_length_b 56.9(2) _cell_length_c 20.32(7) _cell_angle_alpha 90.0000 _cell_angle_beta 90.0000 _cell_angle_gamma 90.0000 _symmetry_space_group_name_H-M 'C 2/m 2/c 21/m' _symmetry_Int_Tables_number 63 _symmetry_cell_setting orthorhombic loop_ _symmetry_equiv_pos_as_xyz '+x,+y,+z' '1/2+x,1/2+y,+z' '-x,+y,+z' '1/2-x,1/2+y,+z' '+x,-y,1/2+z' '1/2+x,1/2-y,1/2+z' '-x,-y,1/2+z' '1/2-x,1/2-y,1/2+z' '-x,-y,-z' '1/2-x,1/2-y,-z' '+x,-y,-z' '1/2+x,1/2-y,-z' '-x,+y,1/2-z' '1/2-x,1/2+y,1/2-z' '+x,+y,1/2-z' '1/2+x,1/2+y,1/2-z' loop_ _atom_site_type_symbol _atom_site_label _atom_site_fract_x _atom_site_fract_y _atom_site_fract_z Si Si1 0.000 0.0818(9) 0.058(2) Si Si2 0.000 0.1188(12) 0.176(2) Si Si3 0.000 0.2083(11) 0.174(2) Si Si4 0.000 0.2454(8) 0.058(2) Si Si5 0.000 0.3991(9) 0.126(3)
15
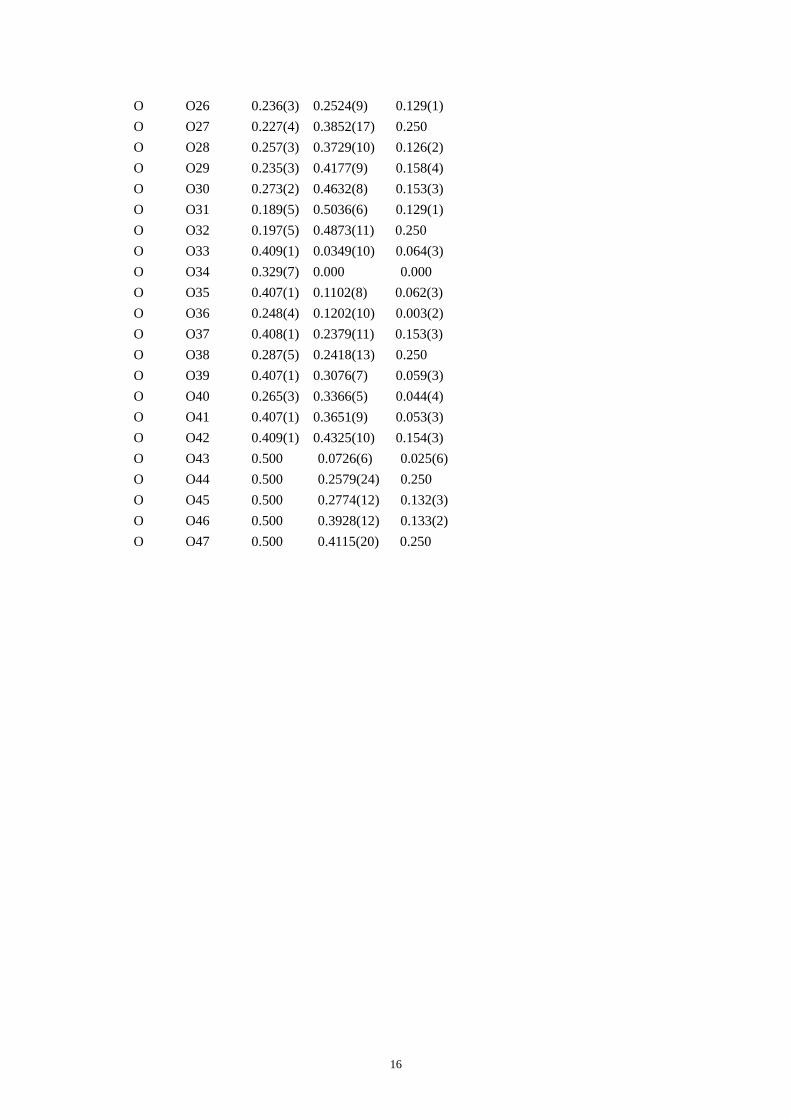
Si Si6 0.000 0.4558(8) 0.125(3) Si Si7 0.196(2) 0.0605(6) 0.030(2) Si Si8 0.203(2) 0.1379(7) 0.173(1) Si Si9 0.195(2) 0.1895(7) 0.129(2) Si Si10 0.203(1) 0.2639(4) 0.060(1) Si Si11 0.203(1) 0.3911(8) 0.174(1) Si Si12 0.187(2) 0.4801(6) 0.173(1) Si Si13 0.318(3) 0.0180(3) 0.061(1) Si Si14 0.295(1) 0.1069(3) 0.064(2) Si Si15 0.299(2) 0.2350(8) 0.173(1) Si Si16 0.304(2) 0.3106(5) 0.028(2) Si Si17 0.295(1) 0.3637(5) 0.055(2) Si Si18 0.305(2) 0.4374(8) 0.128(2) Si Si19 0.500 0.0444(7) 0.025(3) Si Si20 0.500 0.1009(8) 0.025(3) Si Si21 0.500 0.2528(12) 0.172(2) Si Si22 0.500 0.2913(8) 0.063(2) Si Si23 0.500 0.3810(9) 0.061(2) Si Si24 0.500 0.4173(11) 0.173(1) O O1 0.092(1) 0.0655(9) 0.058(4) O O2 0.000 0.0986(13) -0.006(3) O O3 0.000 0.0976(15) 0.124(3) O O4 0.092(1) 0.1349(12) 0.166(5) O O5 0.000 0.1081(24) 0.250 O O6 0.000 0.2168(21) 0.250 O O7 0.092(1) 0.1927(11) 0.160(3) O O8 0.000 0.2311(12) 0.126(3) O O9 0.000 0.2274(10) -0.003(3) O O10 0.091(1) 0.2622(7) 0.054(2) O O11 0.000 0.4275(8) 0.128(6) O O12 0.092(1) 0.3890(10) 0.163(3) O O13 0.000 0.3900(18) 0.050(3) O O14 0.000 0.4650(15) 0.050(3) O O15 0.091(1) 0.4660(11) 0.162(3) O O16 0.226(2) 0.0341(7) 0.050(3) O O17 0.197(5) 0.0632(12) -0.049(2) O O18 0.269(2) 0.0792(7) 0.061(3) O O19 0.233(3) 0.1633(7) 0.145(4) O O20 0.256(3) 0.1175(9) 0.132(2) O O21 0.232(7) 0.1362(16) 0.250 O O22 0.266(3) 0.2082(9) 0.162(3) O O23 0.191(5) 0.1934(13) 0.051(2) O O24 0.235(2) 0.2912(4) 0.059(2) O O25 0.250 0.250 0.000
16
O O26 0.236(3) 0.2524(9) 0.129(1) O O27 0.227(4) 0.3852(17) 0.250 O O28 0.257(3) 0.3729(10) 0.126(2) O O29 0.235(3) 0.4177(9) 0.158(4) O O30 0.273(2) 0.4632(8) 0.153(3) O O31 0.189(5) 0.5036(6) 0.129(1) O O32 0.197(5) 0.4873(11) 0.250 O O33 0.409(1) 0.0349(10) 0.064(3) O O34 0.329(7) 0.000 0.000 O O35 0.407(1) 0.1102(8) 0.062(3) O O36 0.248(4) 0.1202(10) 0.003(2) O O37 0.408(1) 0.2379(11) 0.153(3) O O38 0.287(5) 0.2418(13) 0.250 O O39 0.407(1) 0.3076(7) 0.059(3) O O40 0.265(3) 0.3366(5) 0.044(4) O O41 0.407(1) 0.3651(9) 0.053(3) O O42 0.409(1) 0.4325(10) 0.154(3) O O43 0.500 0.0726(6) 0.025(6) O O44 0.500 0.2579(24) 0.250 O O45 0.500 0.2774(12) 0.132(3) O O46 0.500 0.3928(12) 0.133(2) O O47 0.500 0.4115(20) 0.250