Considerazioni ergonomiche per l’ottimizzazione delle postazioni di lavoro al vdt
La Cooperazione al cuore del MediterraneoLa Coopération au coeur de la Méditerranée
SMART-DEPUR fognature “smart” per l’ottimizzazione
dei sistemi di drenaggio e depurazione dei reflui urbani
Renato IannelliUniversità di PisaDESTEC (Dipartimento di Ingegneria
dell’Energia, dei Sistemi, del
Territorio e delle Costruzioni)
Livorno, 28 giugno 2018
La Cooperazione al cuore del MediterraneoLa Coopération au coeur de la Méditerranée
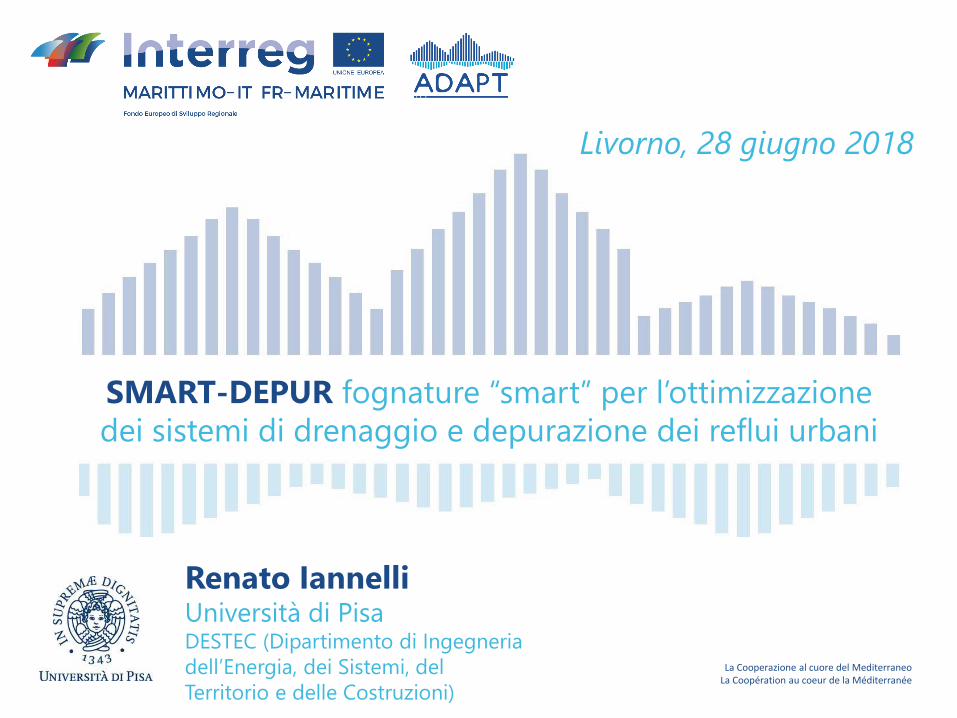
Introduction
I&I (Infiltration/Inflow)
❑ Inflow is stormwater (surface runoff) that enters sanitary sewers at points of direct connection to the systems
❑ Inflow sources: footing/foundation drains, roof drains or leaders, downspouts, drains from window wells, outdoor basement stairwells, drains from driveways, groundwater/basement sump pumps, and illegal/wrong connections to the sanitary sewer system
❑ Infiltration is groundwater that enters sewers through pipe cracks and/or leaks
➢ Inflow and infiltration reduce the ability of sanitary sewers and treatment facilities to transport and treat domestic and industrial wastewater
➢ Higher costs. e.g., higher amount of reagents, more electrical energy required, environmental impacts, and workforce used to face the emergencies
La Cooperazione al cuore del MediterraneoLa Coopération au coeur de la Méditerranée
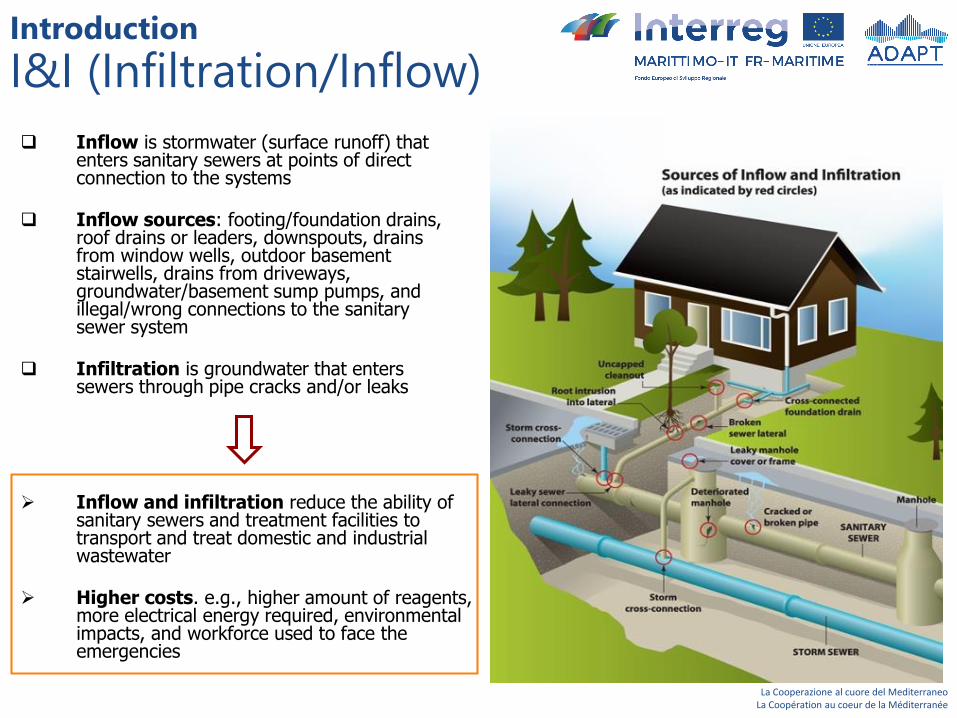
Case study
Livorno sewer system
❑ We studied a portion of the sanitary sewer system, located in the city center of Livorno
❑ The basin has an area of about 0.6 km2. It is mainly a residential area, with few commercial activities
❑ The basin closure section is located at the intersection of Via Carlo Bini and Via delle Navi.
Basin closure section
La Cooperazione al cuore del MediterraneoLa Coopération au coeur de la Méditerranée
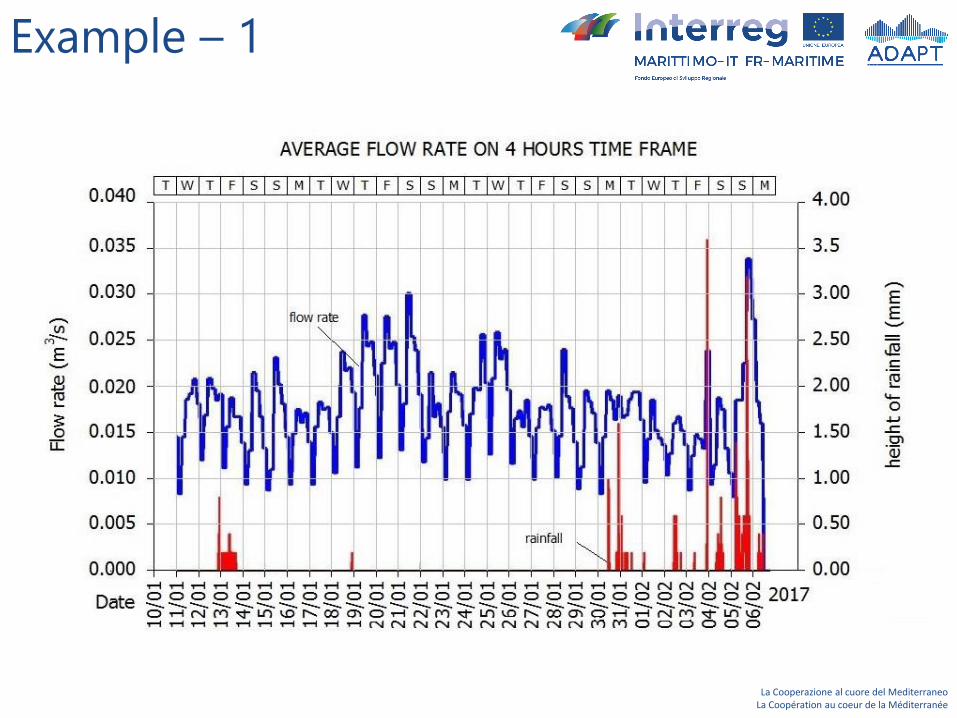
Example – 1
La Cooperazione al cuore del MediterraneoLa Coopération au coeur de la Méditerranée
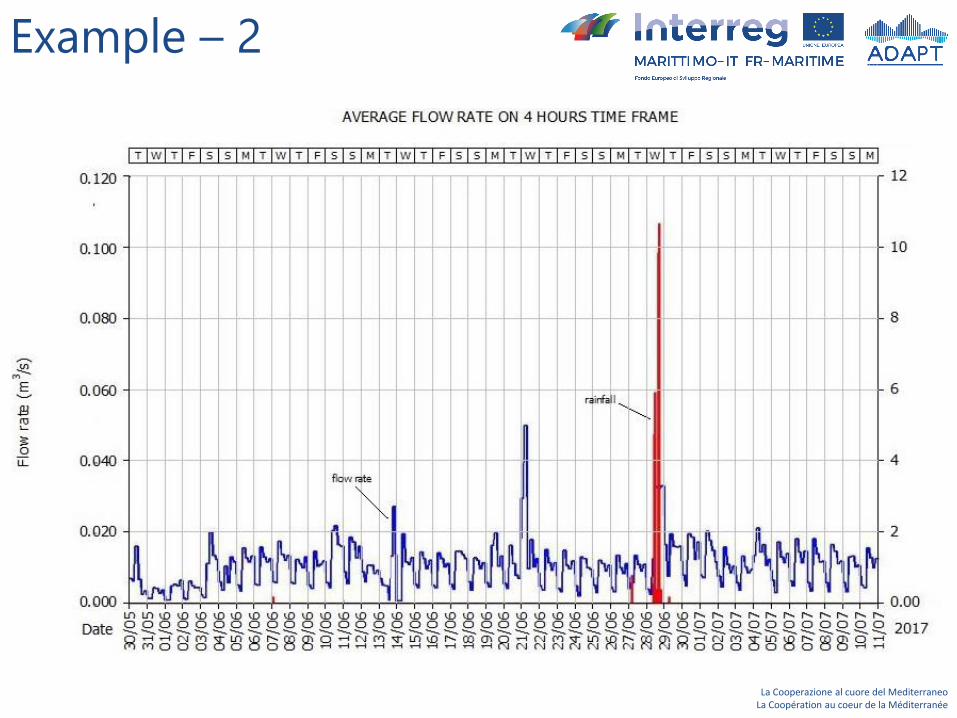
Example – 2
La Cooperazione al cuore del MediterraneoLa Coopération au coeur de la Méditerranée
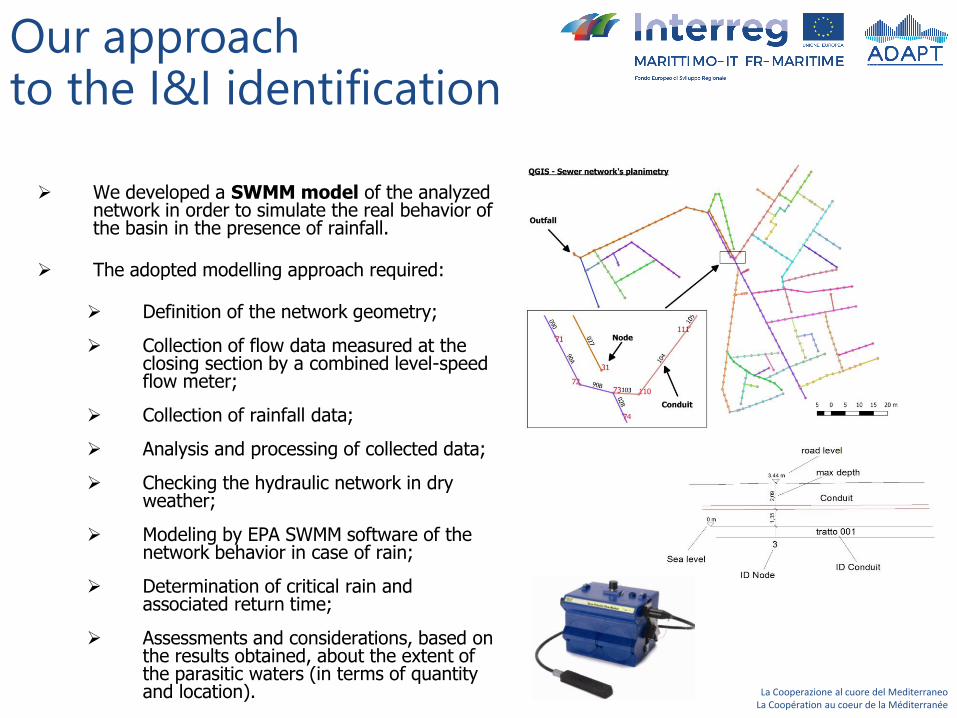
Our approachto the I&I identification
➢ We developed a SWMM model of the analyzed network in order to simulate the real behavior of the basin in the presence of rainfall.
➢ The adopted modelling approach required:
➢ Definition of the network geometry;
➢ Collection of flow data measured at the closing section by a combined level-speed flow meter;
➢ Collection of rainfall data;
➢ Analysis and processing of collected data;
➢ Checking the hydraulic network in dry weather;
➢ Modeling by EPA SWMM software of the network behavior in case of rain;
➢ Determination of critical rain and associated return time;
➢ Assessments and considerations, based on the results obtained, about the extent of the parasitic waters (in terms of quantity and location).
La Cooperazione al cuore del MediterraneoLa Coopération au coeur de la Méditerranée
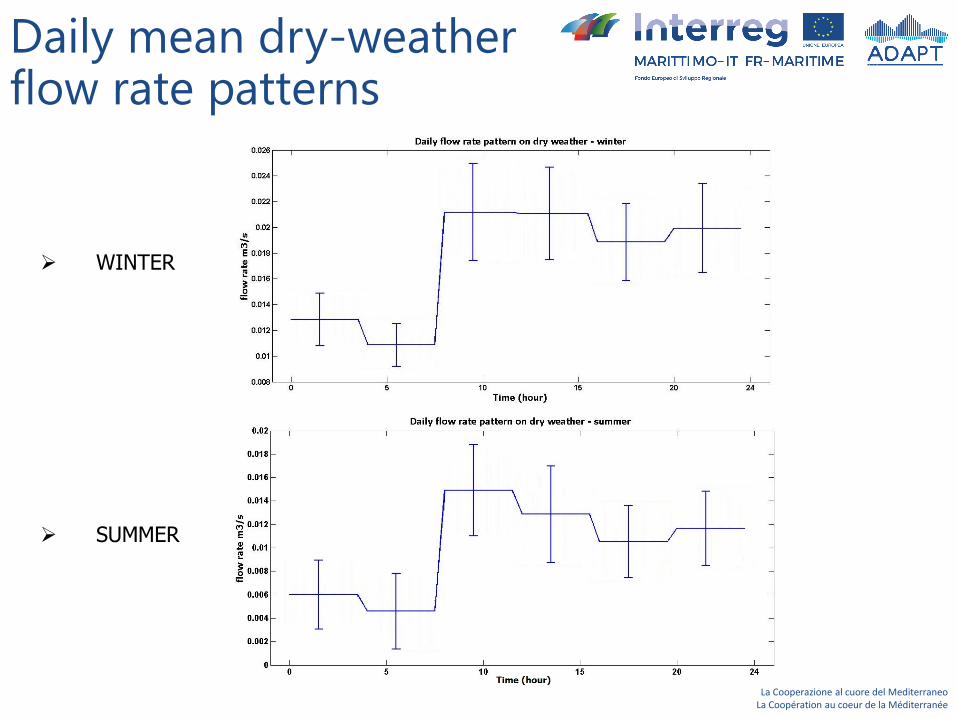
Daily mean dry-weatherflow rate patterns
➢ WINTER
➢ SUMMER
La Cooperazione al cuore del MediterraneoLa Coopération au coeur de la Méditerranée
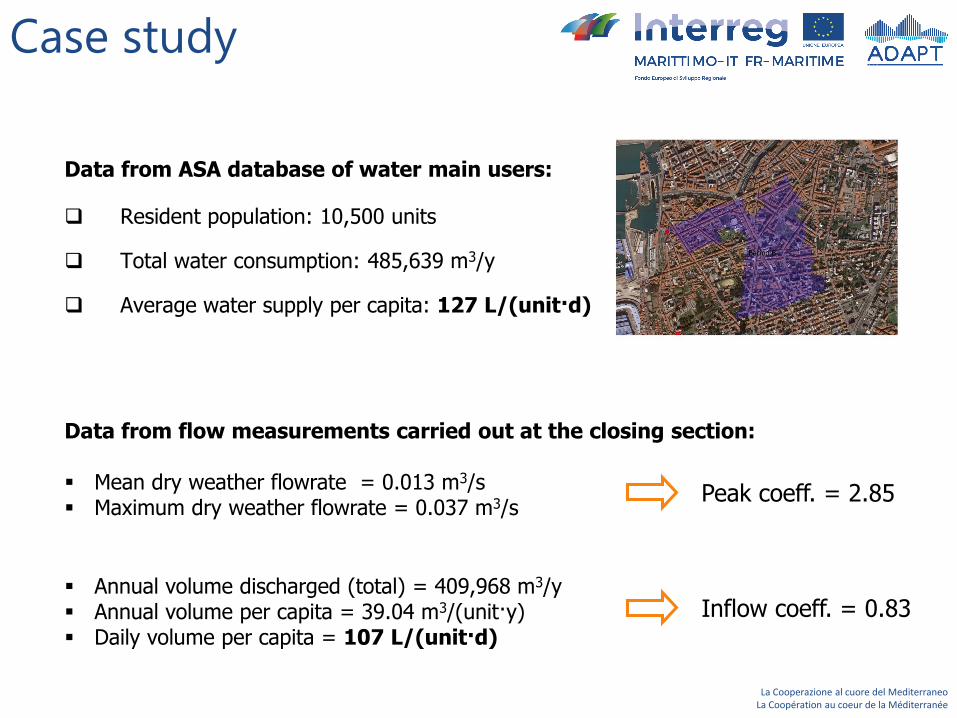
Case study
❑ Resident population: 10,500 units
❑ Total water consumption: 485,639 m3/y
❑ Average water supply per capita: 127 L/(unit·d)
Data from flow measurements carried out at the closing section:
▪ Mean dry weather flowrate = 0.013 m3/s▪ Maximum dry weather flowrate = 0.037 m3/s
Peak coeff. = 2.85
▪ Annual volume discharged (total) = 409,968 m3/y▪ Annual volume per capita = 39.04 m3/(unit·y)▪ Daily volume per capita = 107 L/(unit·d)
Inflow coeff. = 0.83
Data from ASA database of water main users:
La Cooperazione al cuore del MediterraneoLa Coopération au coeur de la Méditerranée
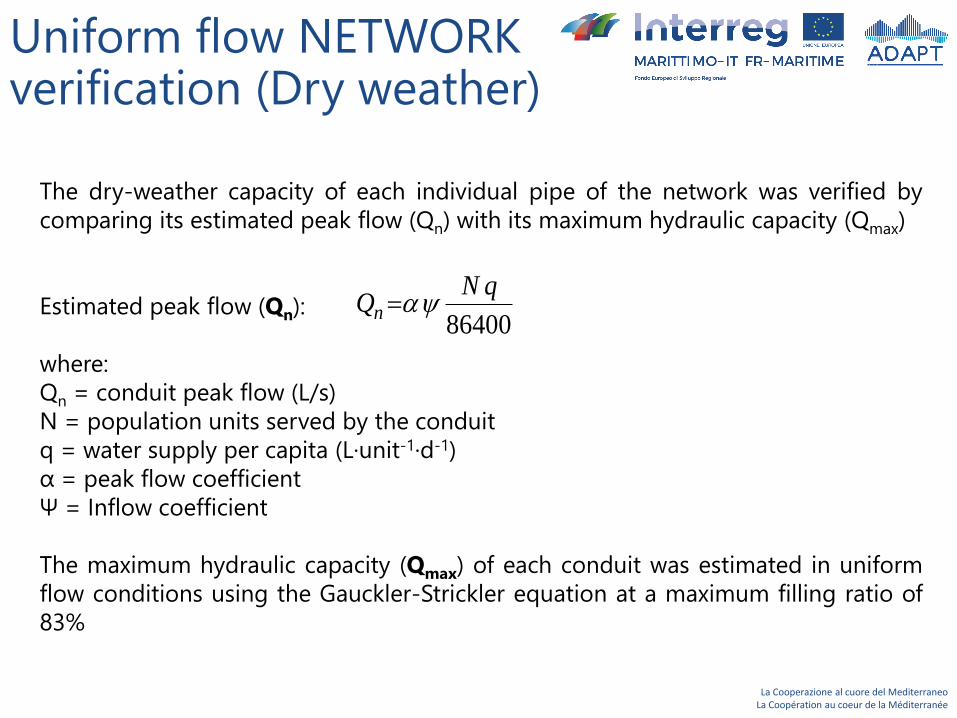
Uniform flow NETWORKverification (Dry weather)
The dry-weather capacity of each individual pipe of the network was verified by
comparing its estimated peak flow (Qn) with its maximum hydraulic capacity (Qmax)
Estimated peak flow (Qn):
where:
Qn = conduit peak flow (L/s)
N = population units served by the conduit
q = water supply per capita (L·unit-1·d-1)
α = peak flow coefficient
Ψ = Inflow coefficient
The maximum hydraulic capacity (Qmax) of each conduit was estimated in uniform
flow conditions using the Gauckler-Strickler equation at a maximum filling ratio of
83%
86400n
N qQ =
La Cooperazione al cuore del MediterraneoLa Coopération au coeur de la Méditerranée
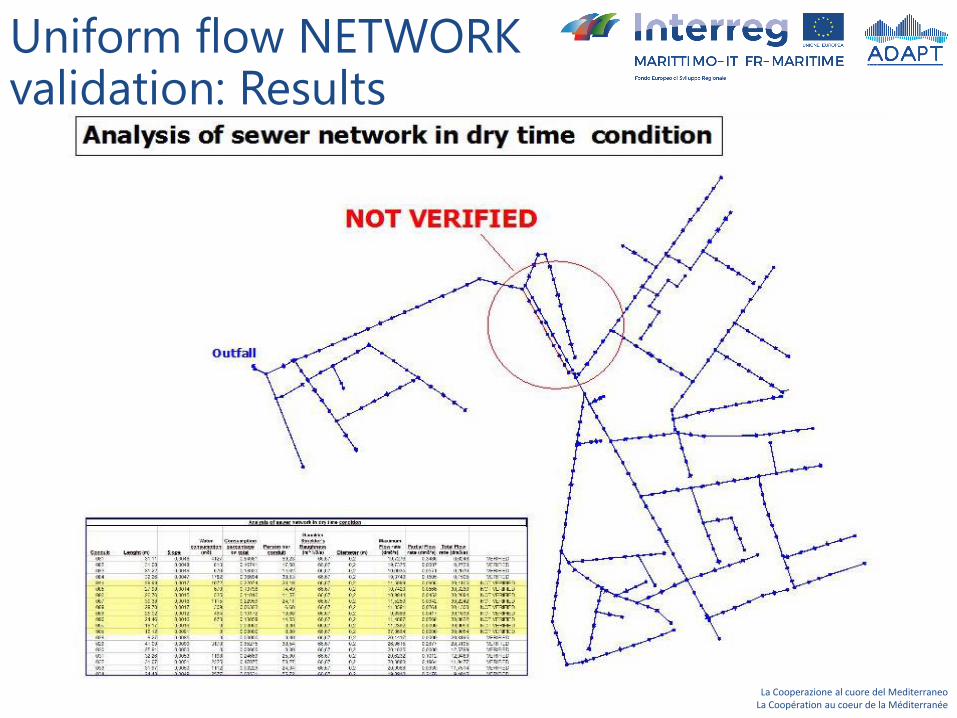
Uniform flow NETWORKvalidation: Results
La Cooperazione al cuore del MediterraneoLa Coopération au coeur de la Méditerranée
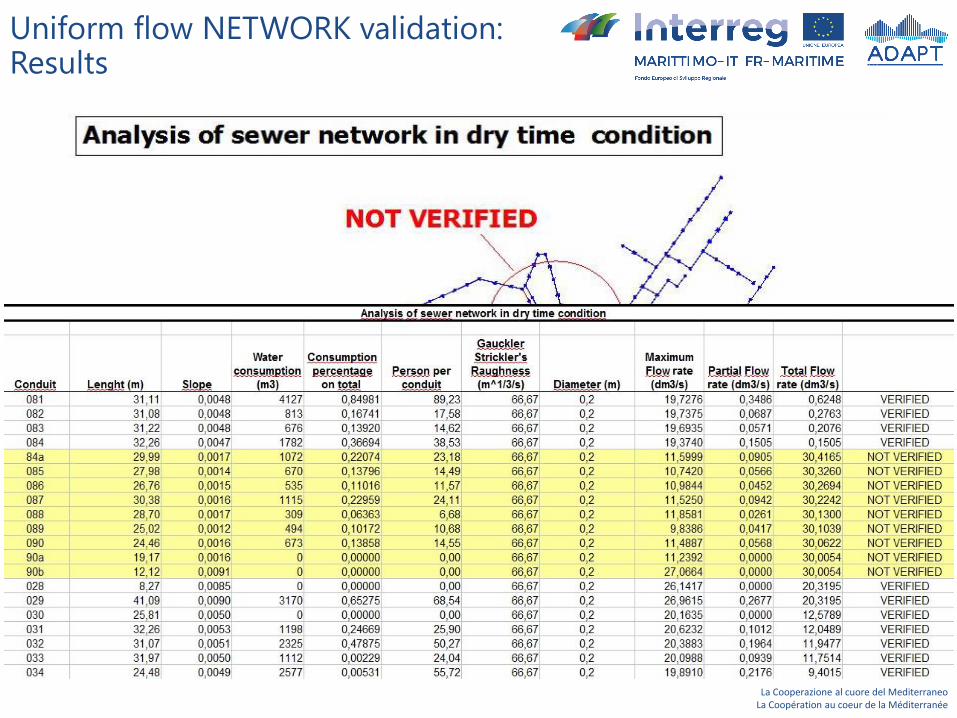
Uniform flow NETWORK validation:Results
La Cooperazione al cuore del MediterraneoLa Coopération au coeur de la Méditerranée
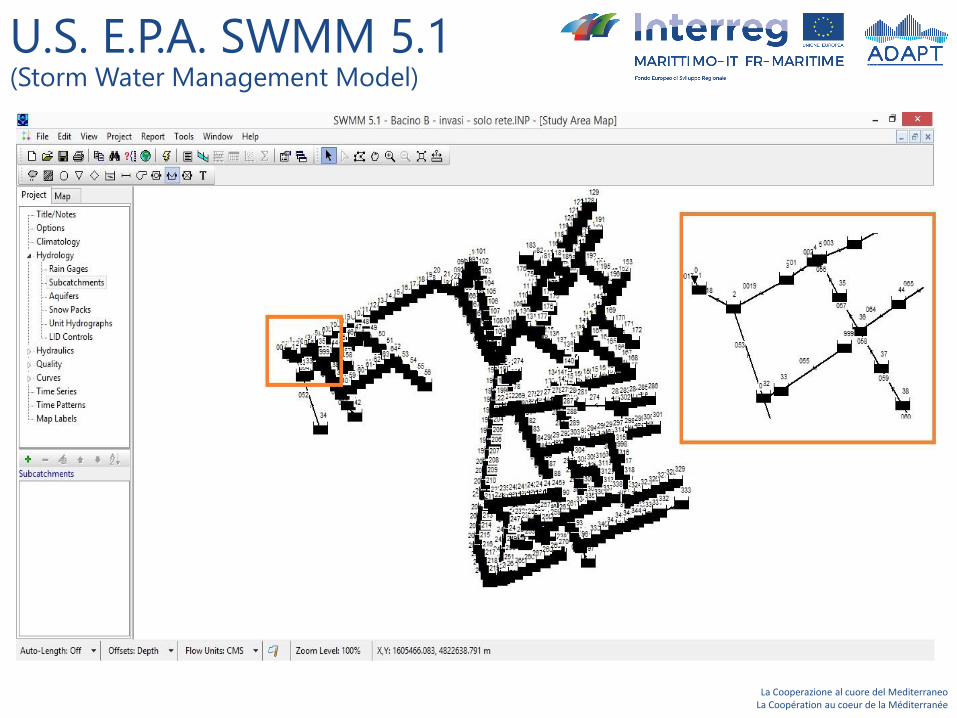
U.S. E.P.A. SWMM 5.1(Storm Water Management Model)
La Cooperazione al cuore del MediterraneoLa Coopération au coeur de la Méditerranée
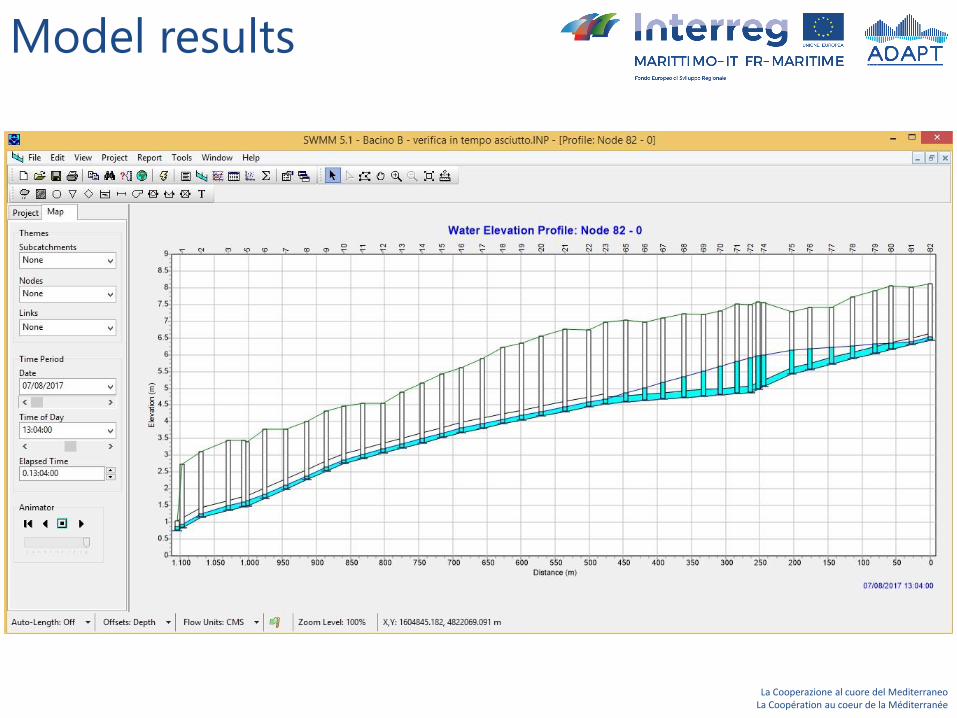
Model results
La Cooperazione al cuore del MediterraneoLa Coopération au coeur de la Méditerranée
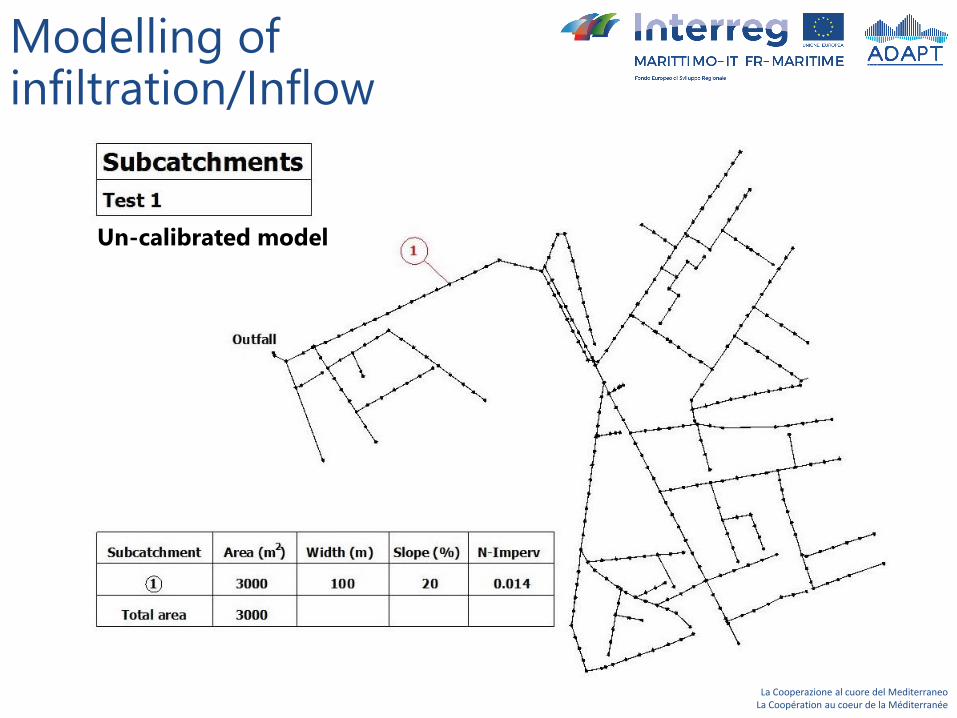
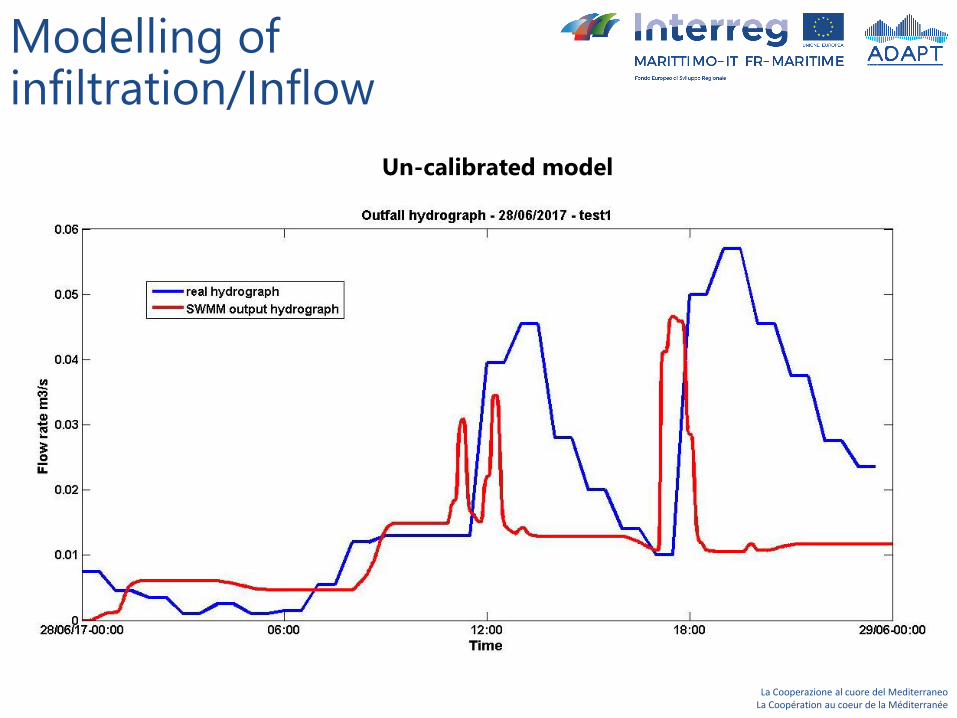
Modelling ofinfiltration/Inflow
Un-calibrated model
La Cooperazione al cuore del MediterraneoLa Coopération au coeur de la Méditerranée
Modelling ofinfiltration/Inflow
Un-calibrated model
La Cooperazione al cuore del MediterraneoLa Coopération au coeur de la Méditerranée
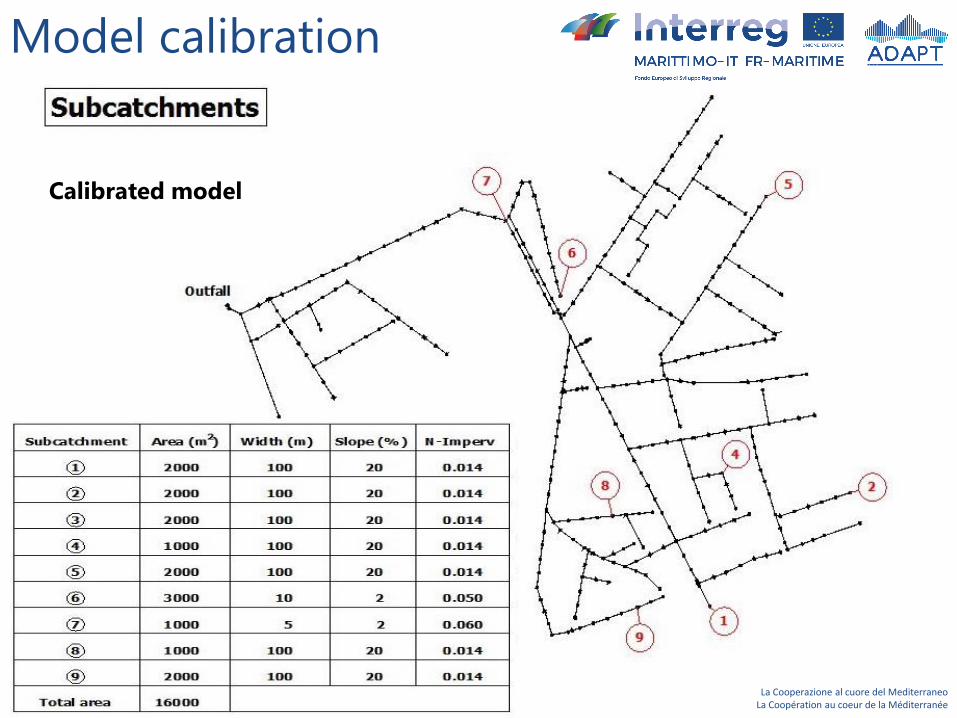
Model calibration
Calibrated model
La Cooperazione al cuore del MediterraneoLa Coopération au coeur de la Méditerranée
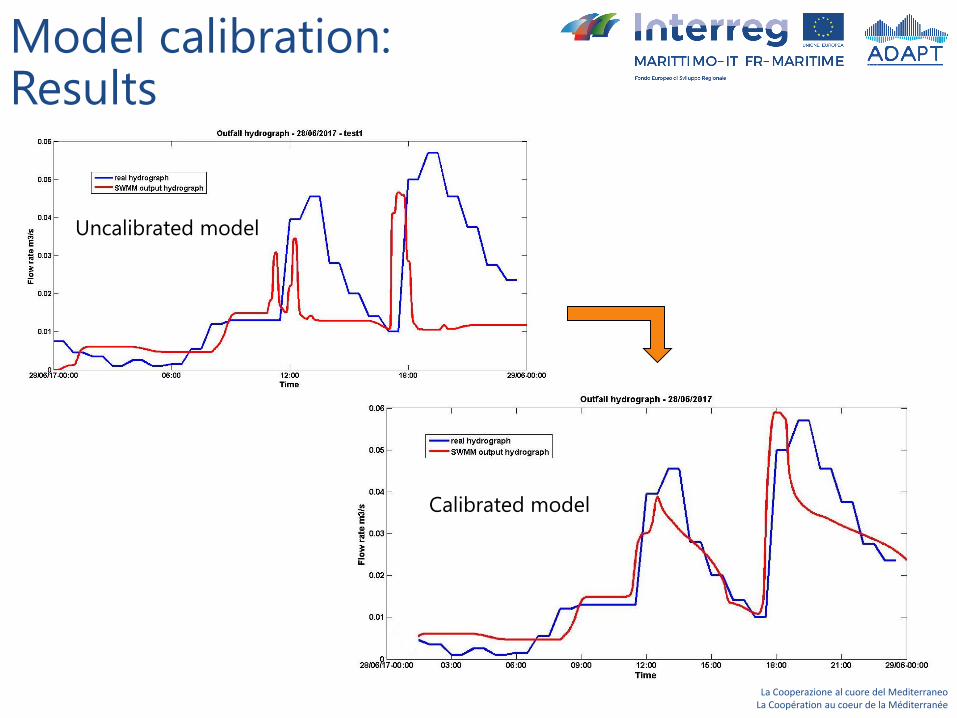
Model calibration: Results
Calibrated model
Uncalibrated model
La Cooperazione al cuore del MediterraneoLa Coopération au coeur de la Méditerranée
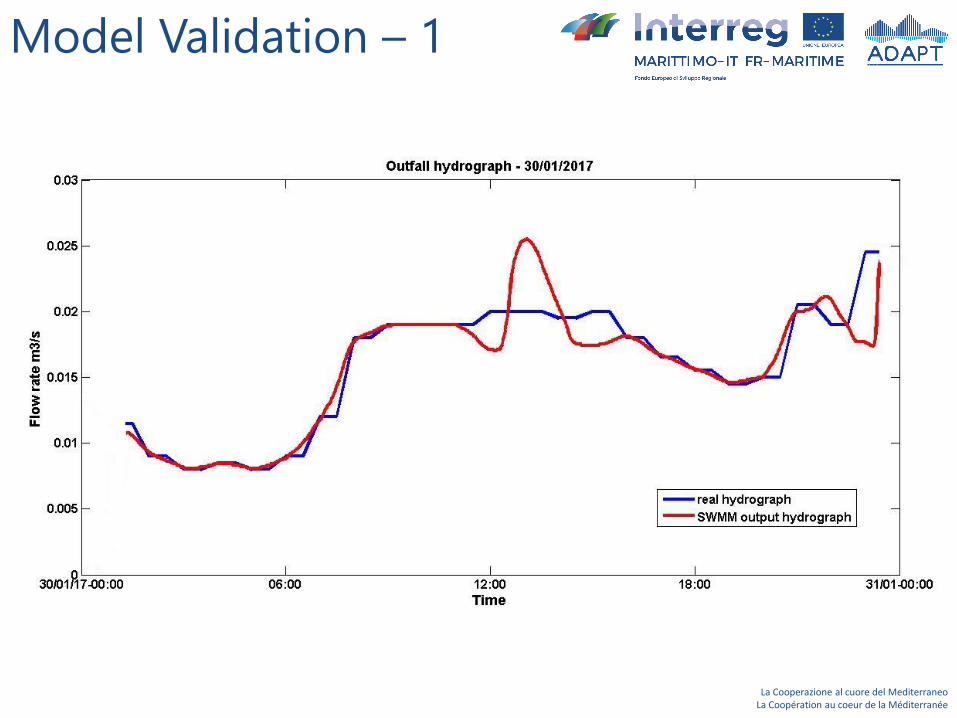
Model Validation – 1
La Cooperazione al cuore del MediterraneoLa Coopération au coeur de la Méditerranée
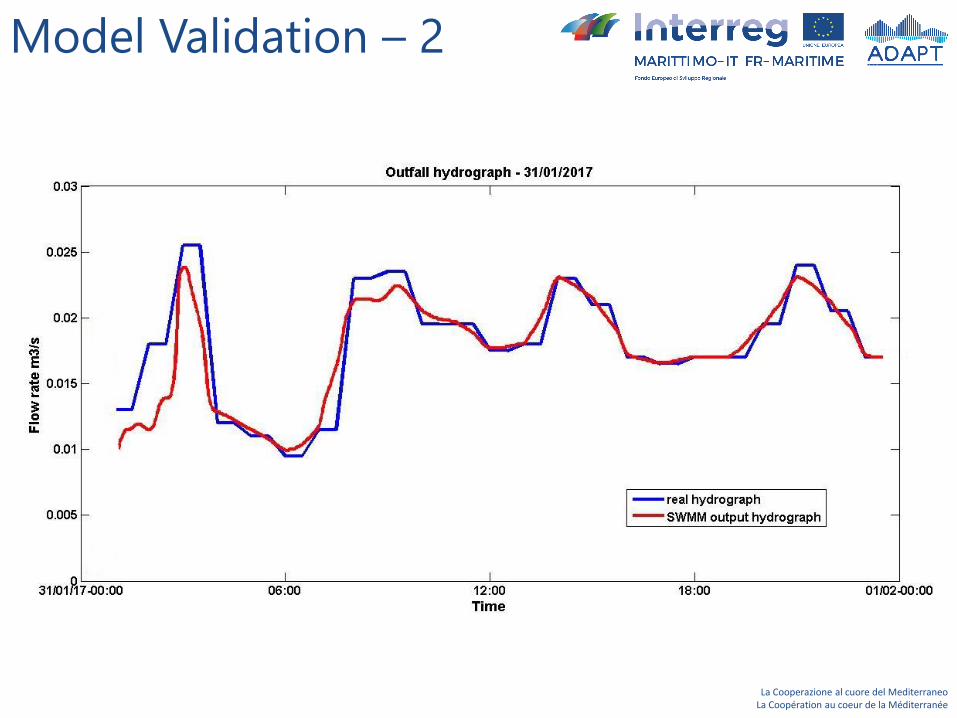
Model Validation – 2
La Cooperazione al cuore del MediterraneoLa Coopération au coeur de la Méditerranée
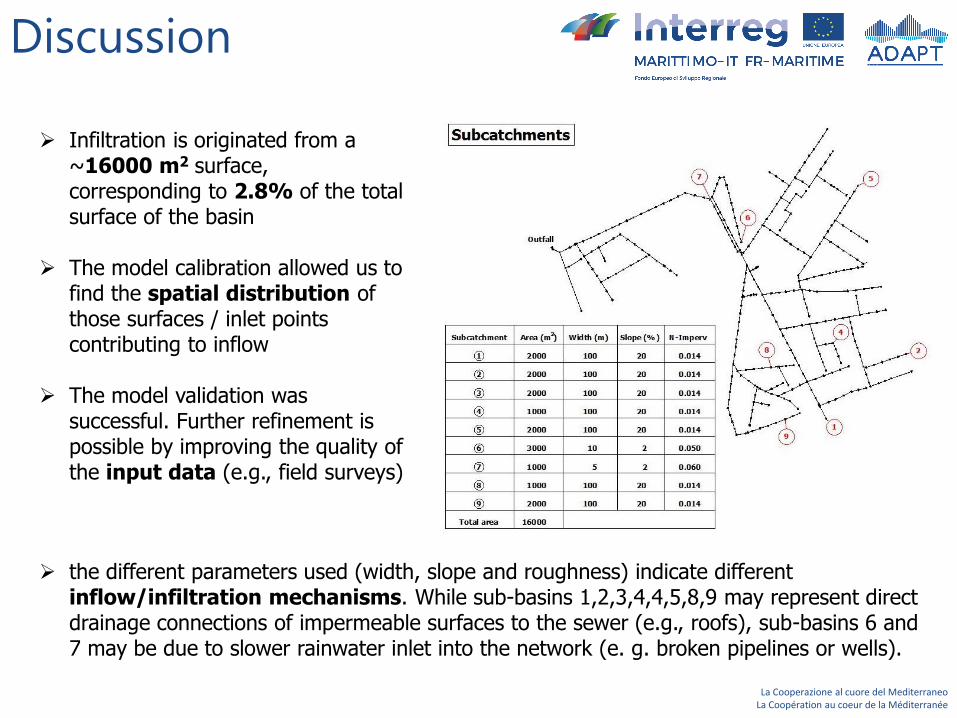
Discussion
➢ Infiltration is originated from a ~16000 m2 surface, corresponding to 2.8% of the total surface of the basin
➢ The model calibration allowed us to find the spatial distribution of those surfaces / inlet points contributing to inflow
➢ The model validation was successful. Further refinement is possible by improving the quality of the input data (e.g., field surveys)
➢ the different parameters used (width, slope and roughness) indicate different inflow/infiltration mechanisms. While sub-basins 1,2,3,4,4,5,8,9 may represent direct drainage connections of impermeable surfaces to the sewer (e.g., roofs), sub-basins 6 and 7 may be due to slower rainwater inlet into the network (e. g. broken pipelines or wells).
La Cooperazione al cuore del MediterraneoLa Coopération au coeur de la Méditerranée
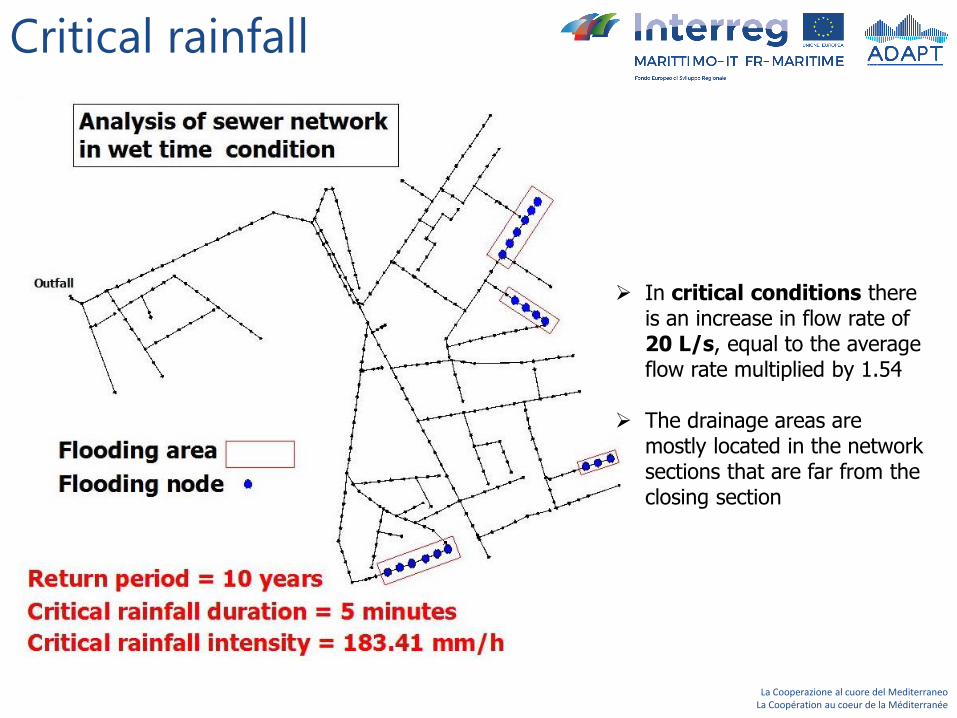
Critical rainfall
➢ In critical conditions there is an increase in flow rate of 20 L/s, equal to the average flow rate multiplied by 1.54
➢ The drainage areas are mostly located in the network sections that are far from the closing section
La Cooperazione al cuore del MediterraneoLa Coopération au coeur de la Méditerranée
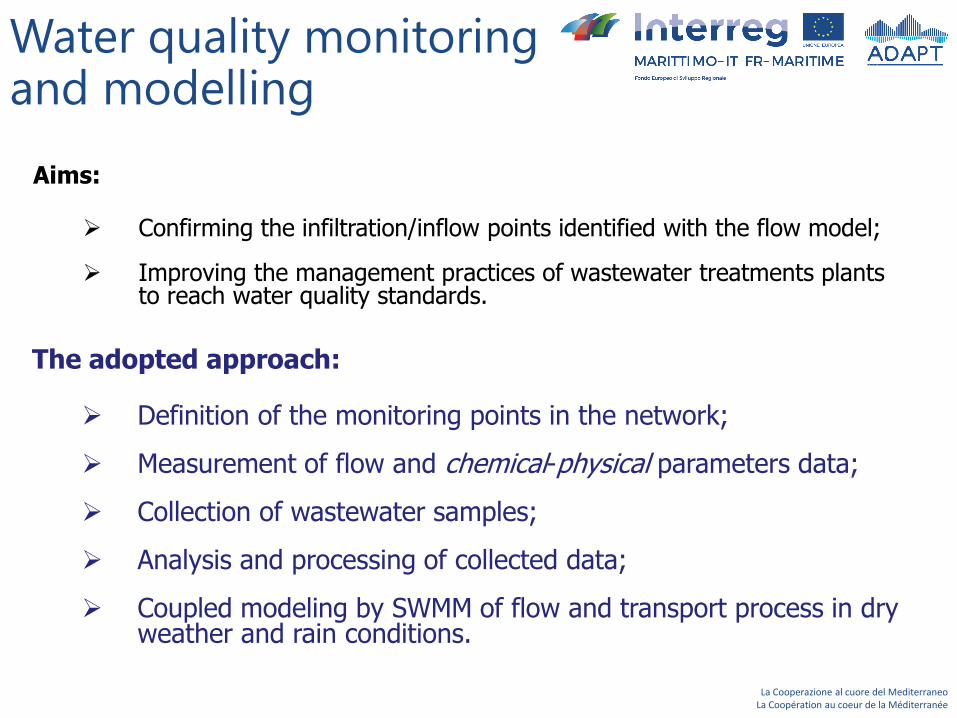
Water quality monitoringand modelling
The adopted approach:
➢ Definition of the monitoring points in the network;
➢ Measurement of flow and chemical-physical parameters data;
➢ Collection of wastewater samples;
➢ Analysis and processing of collected data;
➢ Coupled modeling by SWMM of flow and transport process in dry weather and rain conditions.
Aims:
➢ Confirming the infiltration/inflow points identified with the flow model;
➢ Improving the management practices of wastewater treatments plants to reach water quality standards.
La Cooperazione al cuore del MediterraneoLa Coopération au coeur de la Méditerranée
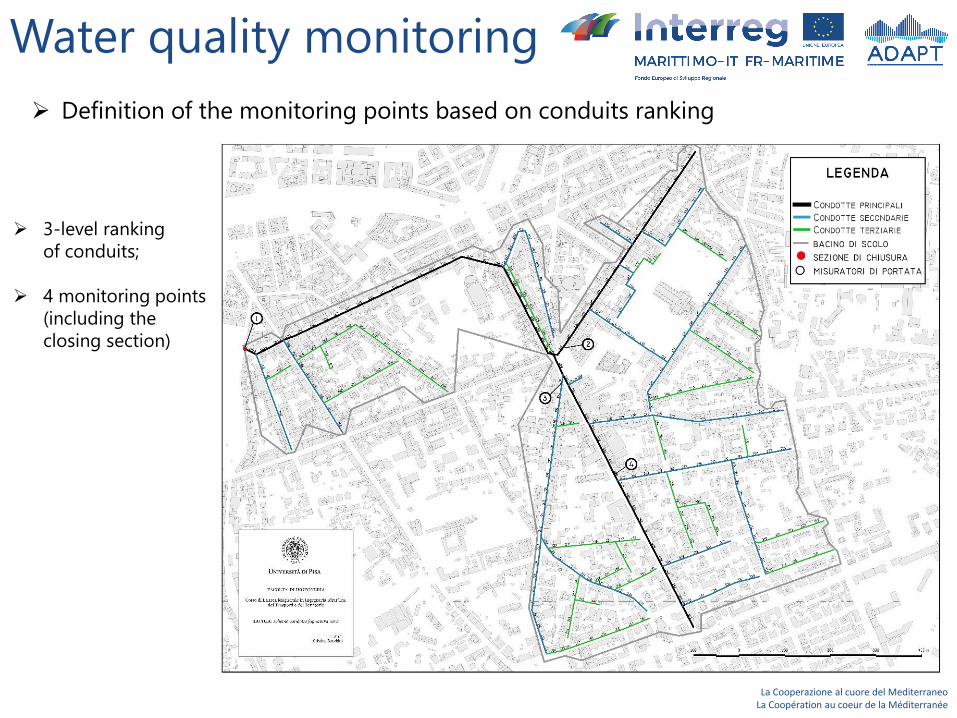
Water quality monitoring
➢ Definition of the monitoring points based on conduits ranking
➢ 3-level ranking
of conduits;
➢ 4 monitoring points
(including the
closing section)
La Cooperazione al cuore del MediterraneoLa Coopération au coeur de la Méditerranée
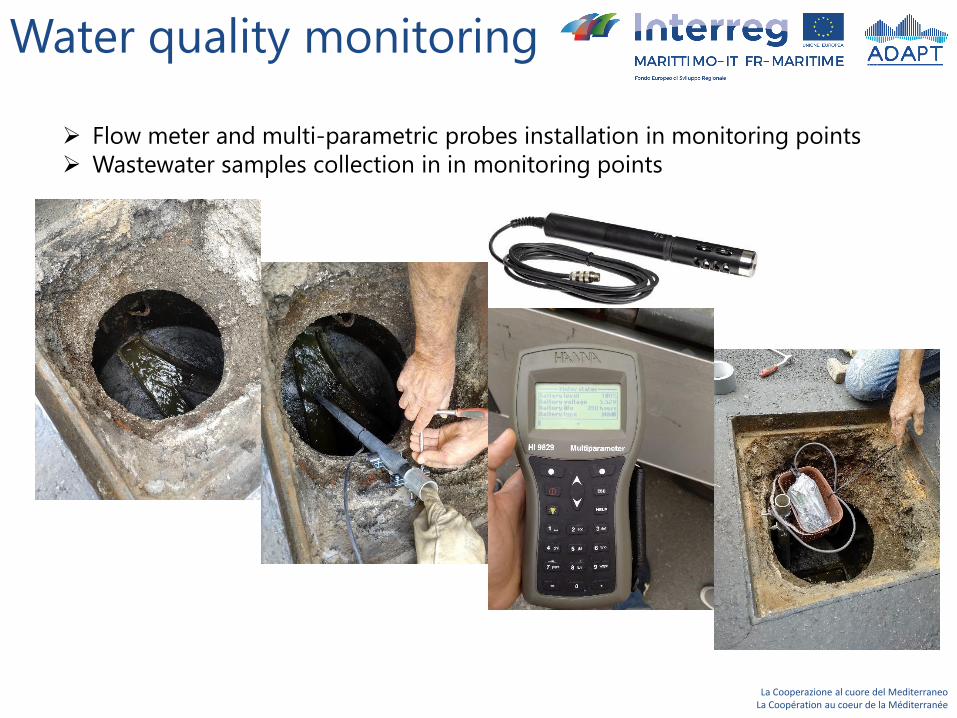
Water quality monitoring
➢ Flow meter and multi-parametric probes installation in monitoring points
➢ Wastewater samples collection in in monitoring points
La Cooperazione al cuore del MediterraneoLa Coopération au coeur de la Méditerranée
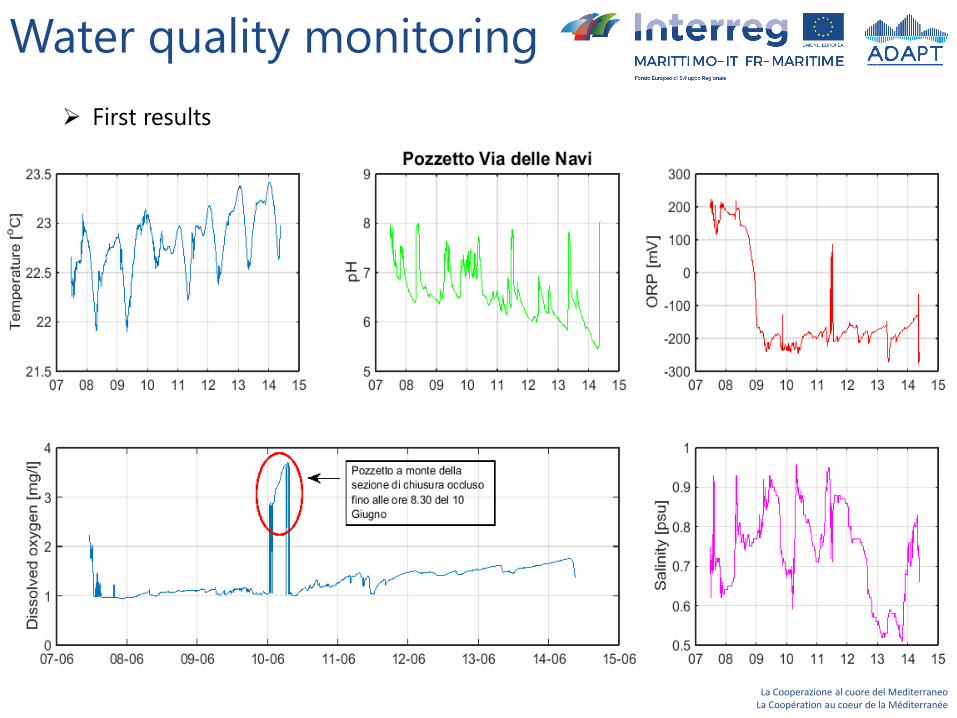
Water quality monitoring
➢ First results
La Cooperazione al cuore del MediterraneoLa Coopération au coeur de la Méditerranée
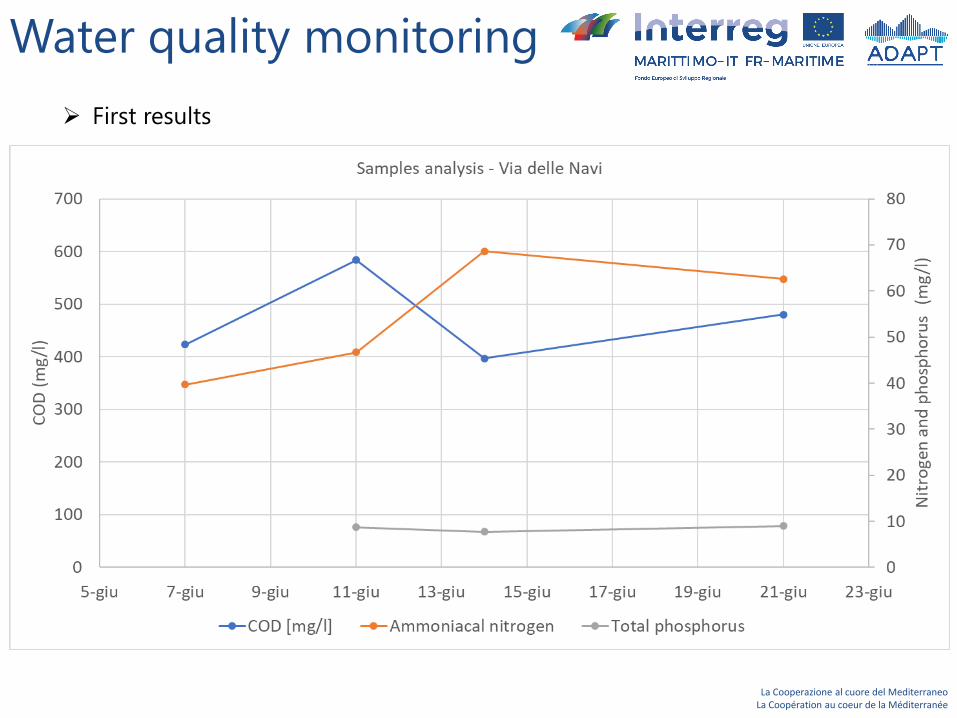
Water quality monitoring
➢ First results
La Cooperazione al cuore del MediterraneoLa Coopération au coeur de la Méditerranée
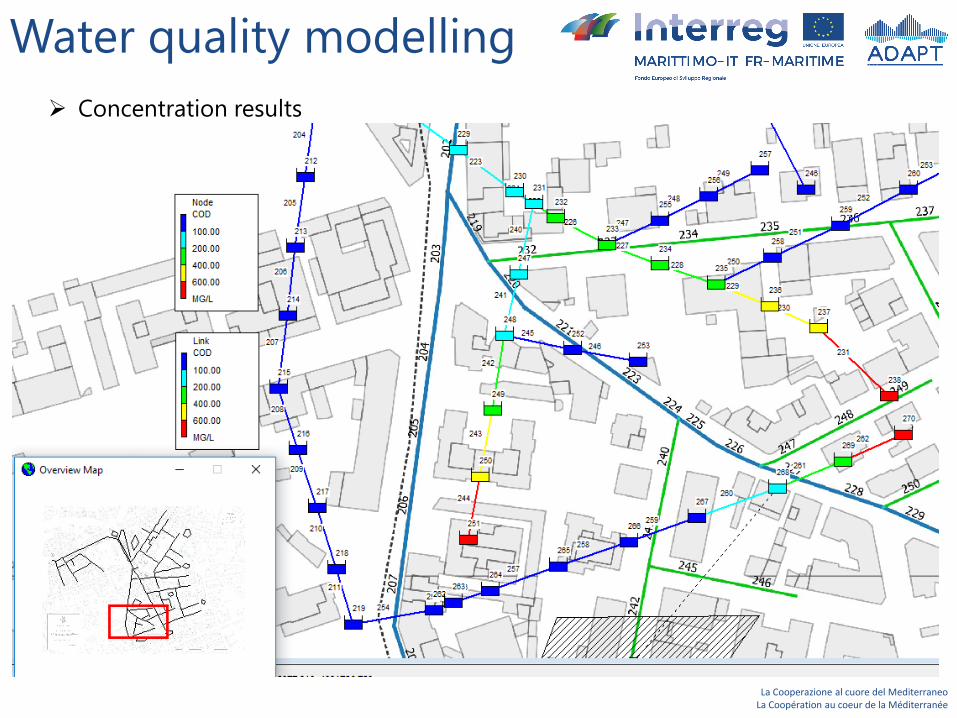
Water quality modelling
➢ Concentration results
La Cooperazione al cuore del MediterraneoLa Coopération au coeur de la Méditerranée
Conclusions• We developed an approach, based on modelling, to identify and locate the possible
infiltration/inflow points in the network
• We applied the model to a portion of the sanitary sewer network of Livorno
• We calibrated the model with flow measurements at the closing section of the studied basin
• The model was successfully validated
Future steps• Extend the study area, possibly to the entire sewer network
• Develop algorithms to automatically identify the most critical sections of the network
• Define network maintenance and adaptation, and suggesting wastewater treatment management rules
• Define a priority scale that takes into account the costs and benefits of the possible interventions
La Cooperazione al cuore del MediterraneoLa Coopération au coeur de la Méditerranée
Grazie per l’attenzione
Merci pour l’attention
www.interreg-maritime.eu/adapt