Rete nefrologica: il modello HUB and Spoke per la Dialisi ... · La DP in Italia: Censimento 2016...
46
Ospedale E. Bassini Rete nefrologica: il modello HUB and Spoke per la Dialisi Peritoneale: Progetto Lombardo Vincenzo La Milia Nefrologia e Dialisi – Ospedale Bassini, Cinisello Balsamo, Milano
Transcript of Rete nefrologica: il modello HUB and Spoke per la Dialisi ... · La DP in Italia: Censimento 2016...
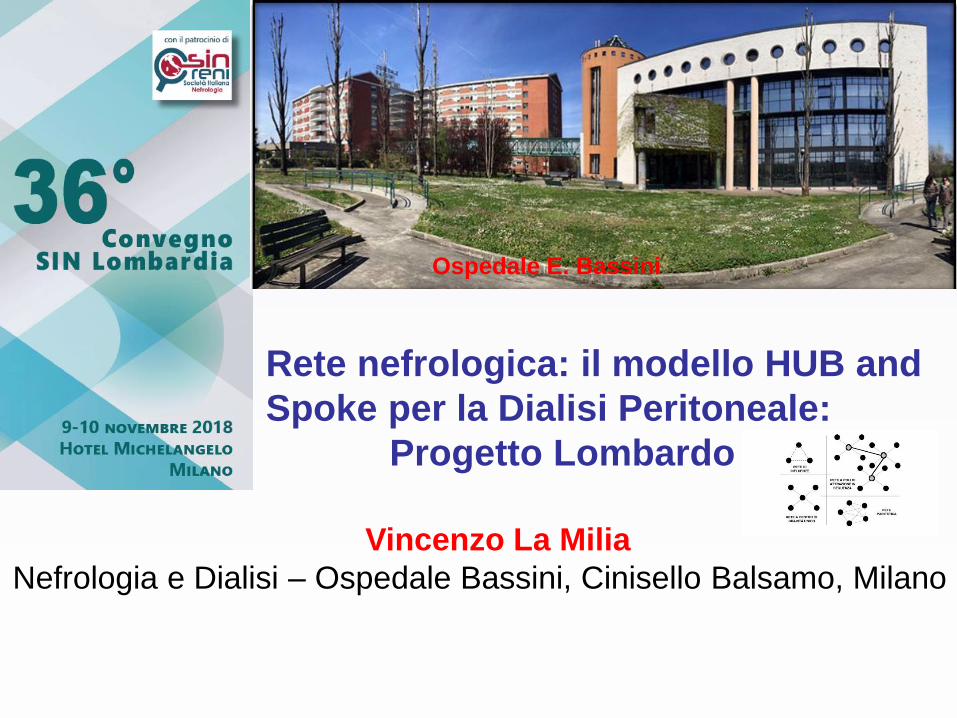
Ospedale E. Bassini
Rete nefrologica: il modello HUB and
Spoke per la Dialisi Peritoneale:
Progetto Lombardo
Vincenzo La Milia
Nefrologia e Dialisi – Ospedale Bassini, Cinisello Balsamo, Milano
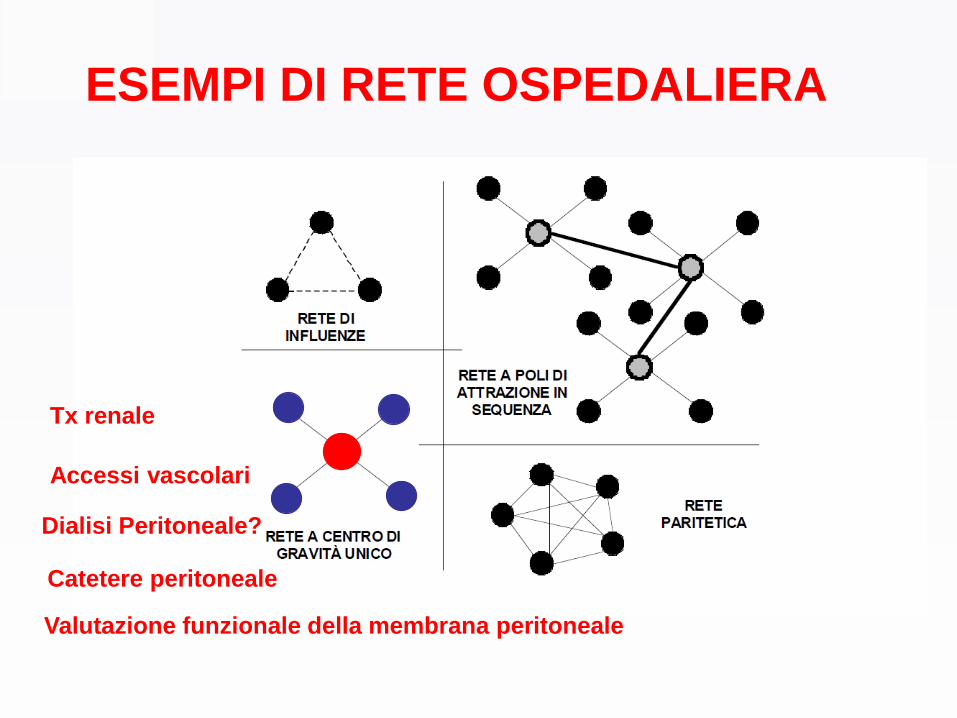
ESEMPI DI RETE OSPEDALIERA
Tx renale
Accessi vascolari
Dialisi Peritoneale?
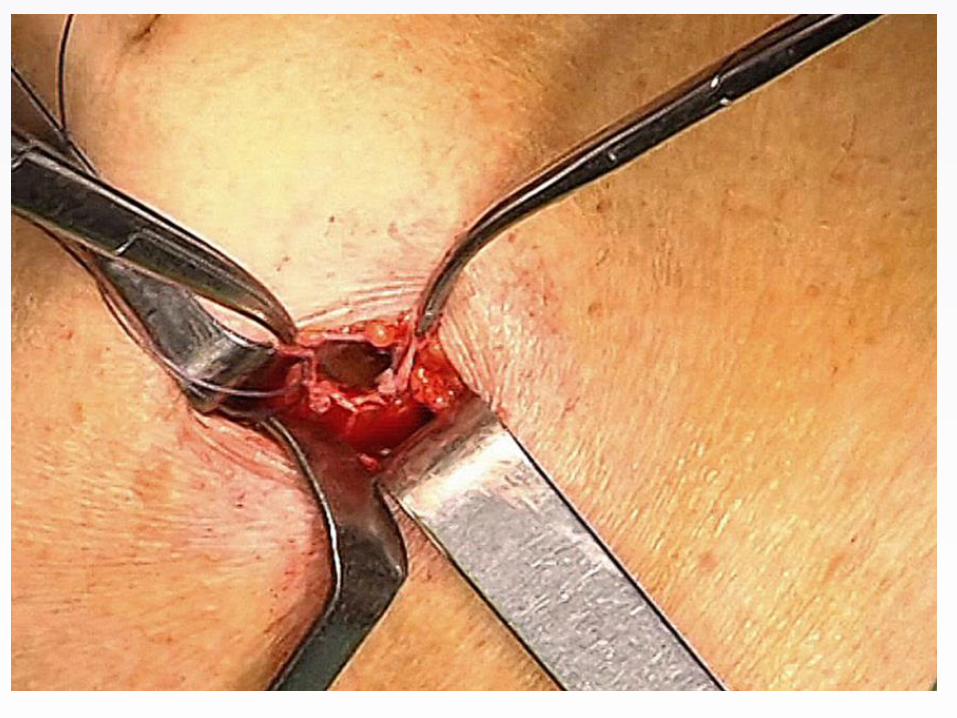
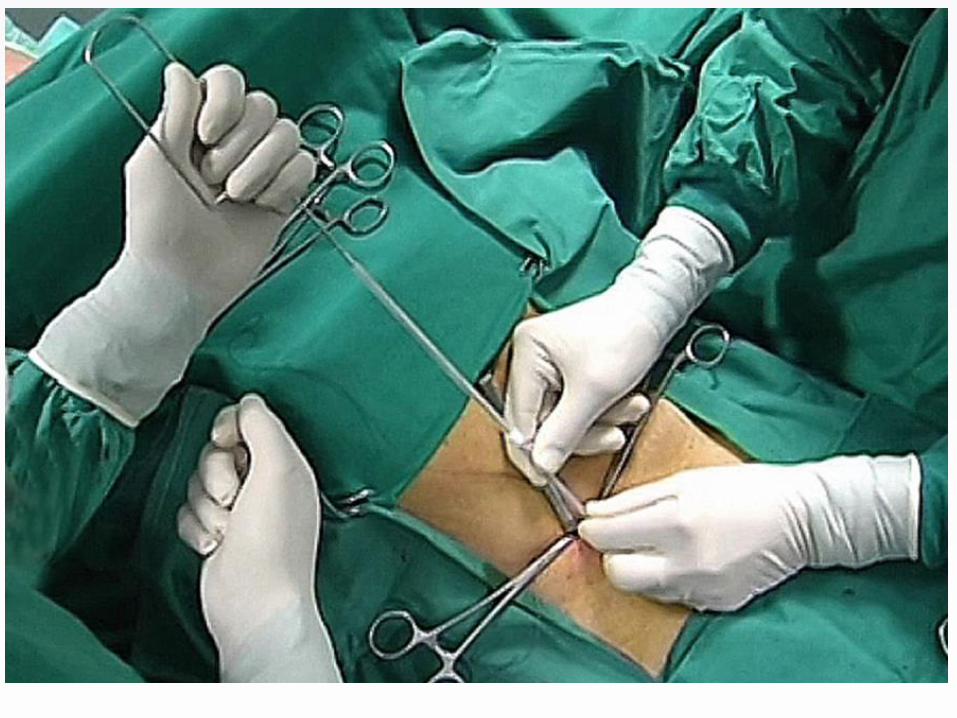
Catetere peritoneale
Valutazione funzionale della membrana peritoneale
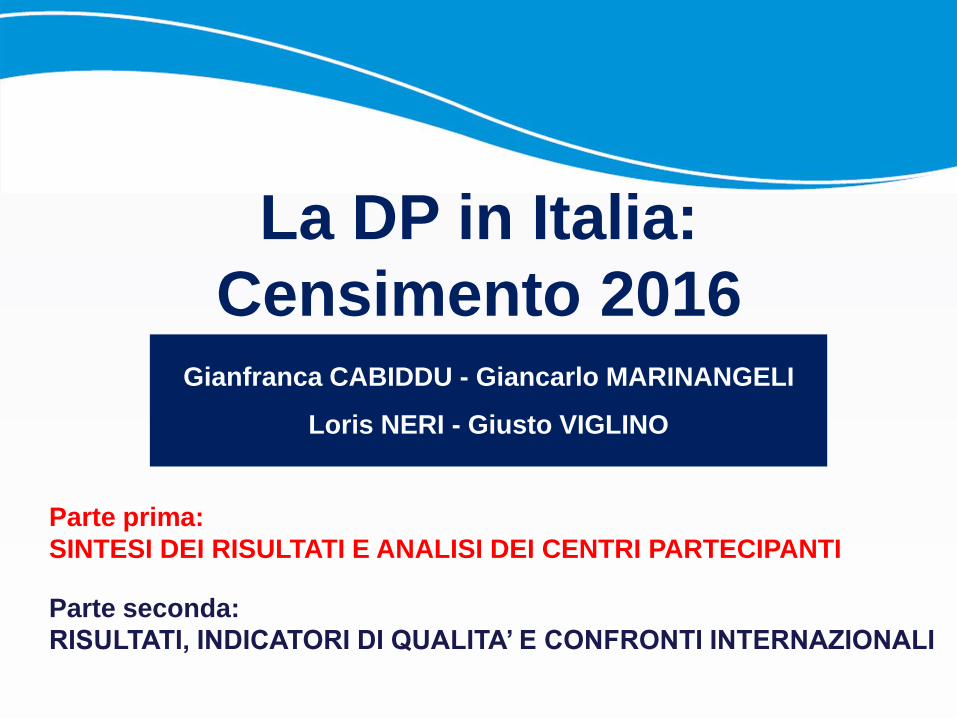
La DP in Italia:
Censimento 2016
Parte prima:
SINTESI DEI RISULTATI E ANALISI DEI CENTRI PARTECIPANTI
Gianfranca CABIDDU - Giancarlo MARINANGELI
Loris NERI - Giusto VIGLINO
Parte seconda:
RISULTATI, INDICATORI DI QUALITA’ E CONFRONTI INTERNAZIONALI
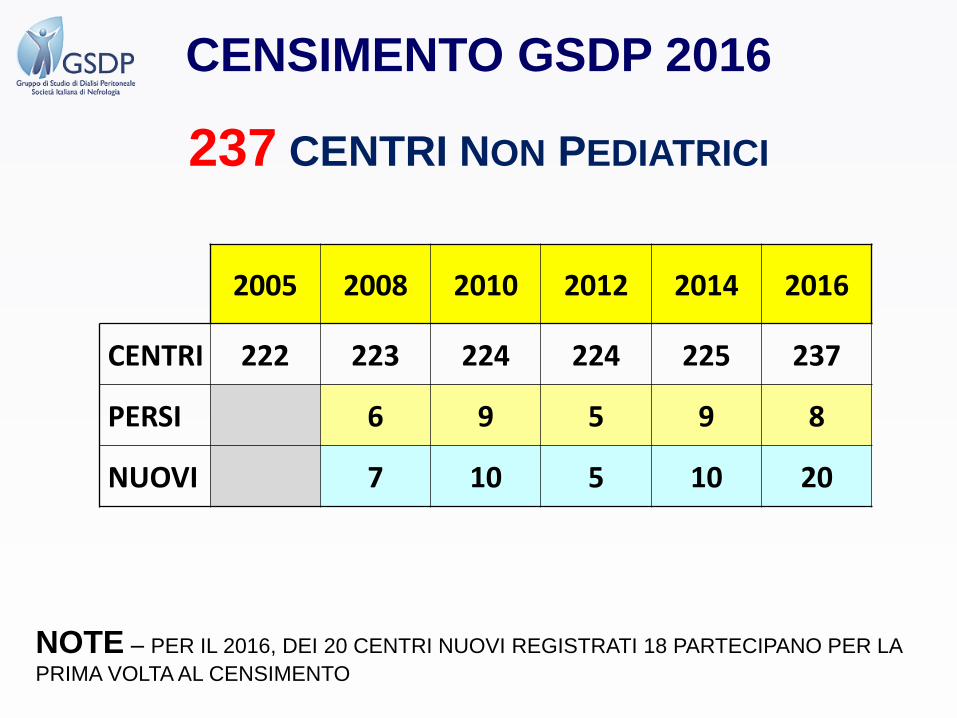
237 CENTRI NON PEDIATRICI
CENSIMENTO GSDP 2016
2005 2008 2010 2012 2014 2016
CENTRI 222 223 224 224 225 237
PERSI 6 9 5 9 8
NUOVI 7 10 5 10 20
NOTE – PER IL 2016, DEI 20 CENTRI NUOVI REGISTRATI 18 PARTECIPANO PER LA
PRIMA VOLTA AL CENSIMENTO
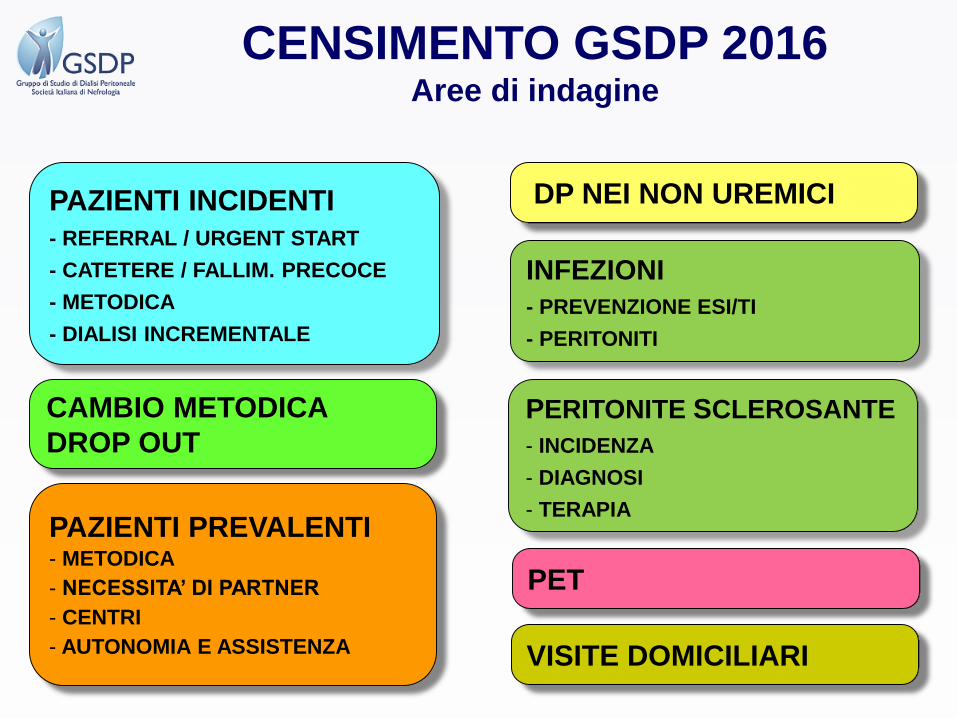
CENSIMENTO GSDP 2016Aree di indagine
DP NEI NON UREMICI
CAMBIO METODICA
DROP OUT
PAZIENTI INCIDENTI
- REFERRAL / URGENT START
- CATETERE / FALLIM. PRECOCE
- METODICA
- DIALISI INCREMENTALE
PAZIENTI PREVALENTI- METODICA
- NECESSITA’ DI PARTNER
- CENTRI
- AUTONOMIA E ASSISTENZA
INFEZIONI
- PREVENZIONE ESI/TI
- PERITONITI
PET
VISITE DOMICILIARI
PERITONITE SCLEROSANTE
- INCIDENZA
- DIAGNOSI
- TERAPIA
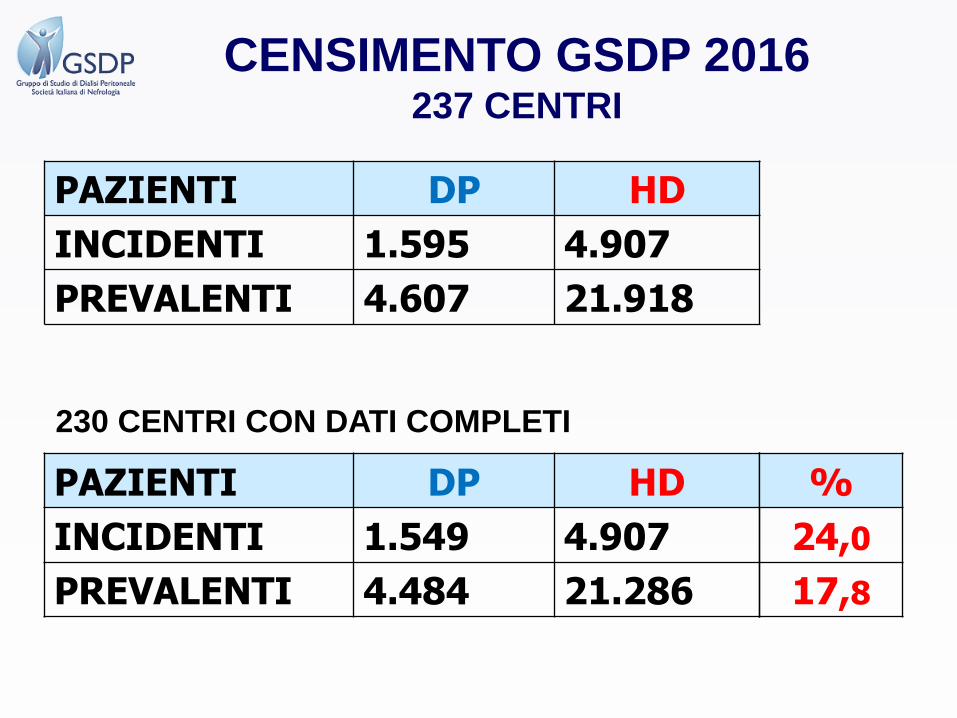
PAZIENTI DP HD
INCIDENTI 1.595 4.907
PREVALENTI 4.607 21.918
PAZIENTI DP HD
INCIDENTI 1.549 4.907
PREVALENTI 4.484 21.286
%
24,0
17,8
230 CENTRI CON DATI COMPLETI
CENSIMENTO GSDP 2016237 CENTRI
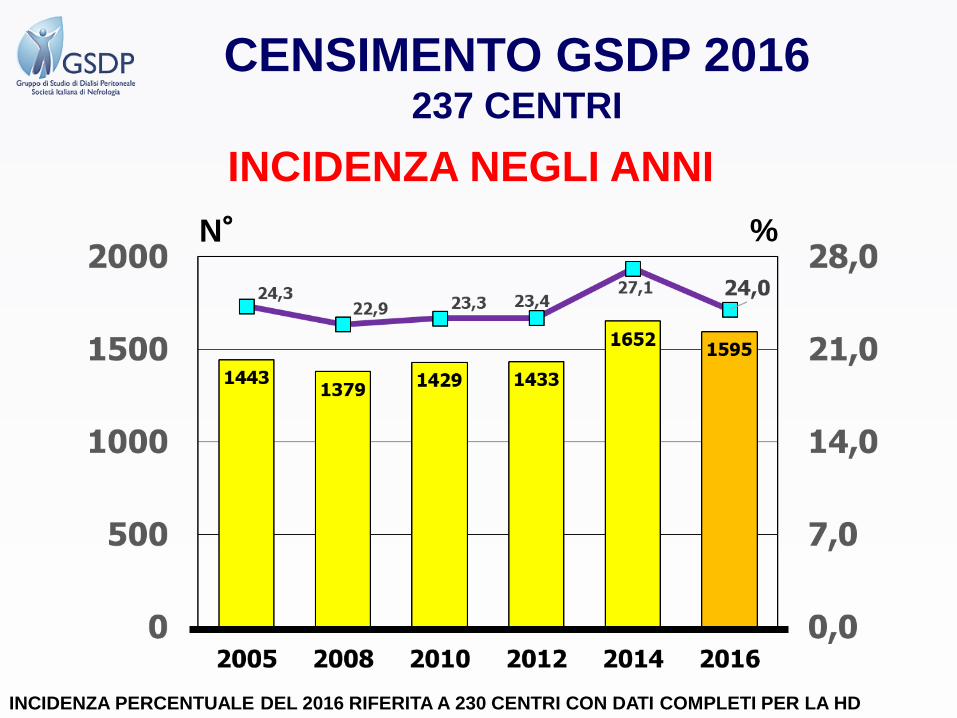
INCIDENZA NEGLI ANNI
N° %
CENSIMENTO GSDP 2016237 CENTRI
INCIDENZA PERCENTUALE DEL 2016 RIFERITA A 230 CENTRI CON DATI COMPLETI PER LA HD

N° %
PER IL 2004 LA PREVALENZA E’ RIPORTATA DAL CENS-SIN 2004 (CENS GSDP 2005 – PREV N.D.)
LA PREVALENZA PERCENTUALE DEL 2016 E’ RIFERITA A 230 CENTRI CON DATI COMPLETI PER LA HD
PREVALENZA NEGLI ANNI
CENSIMENTO GSDP 2016237 CENTRI
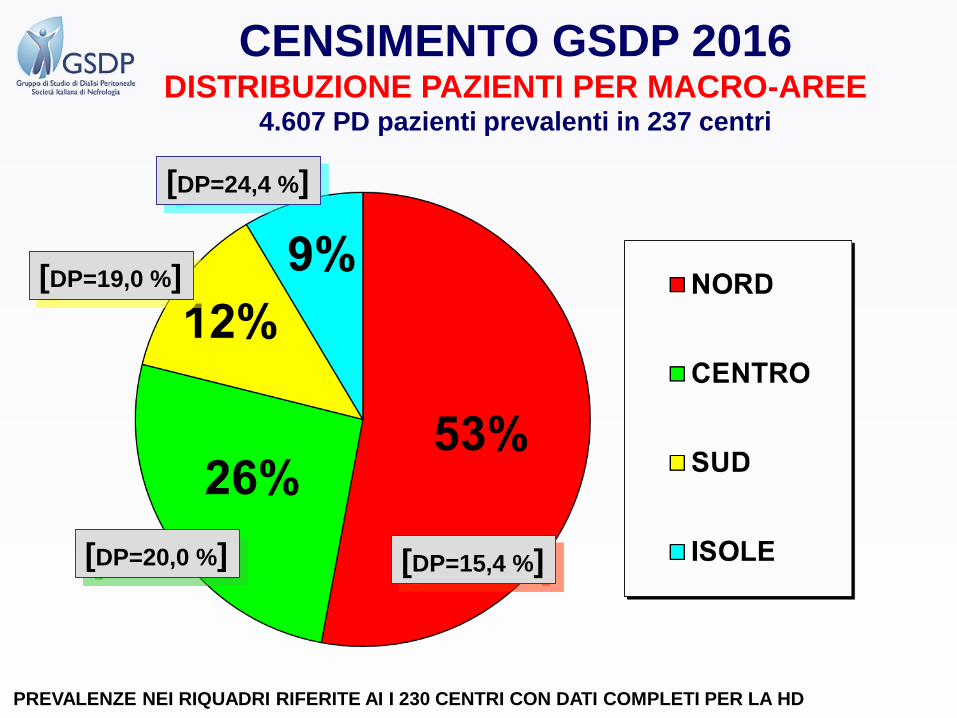
CENSIMENTO GSDP 2016DISTRIBUZIONE PAZIENTI PER MACRO-AREE
4.607 PD pazienti prevalenti in 237 centri
[DP=15,4 %][DP=20,0 %]
[DP=19,0 %]
[DP=24,4 %]
PREVALENZE NEI RIQUADRI RIFERITE AI I 230 CENTRI CON DATI COMPLETI PER LA HD
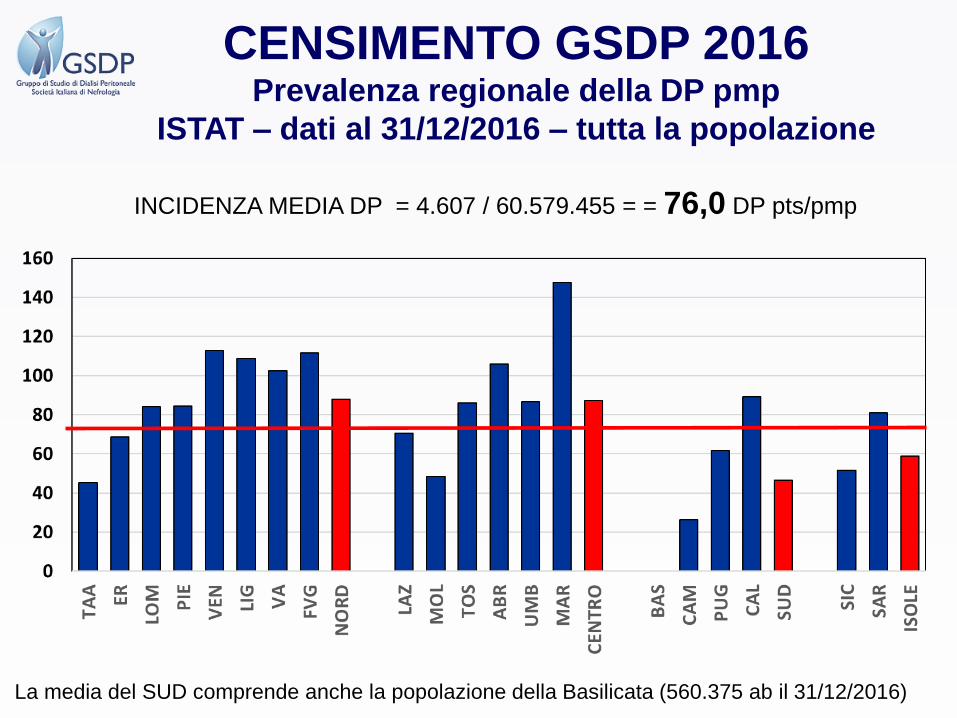
CENSIMENTO GSDP 2016Prevalenza regionale della DP pmp
ISTAT – dati al 31/12/2016 – tutta la popolazione
INCIDENZA MEDIA DP = 4.607 / 60.579.455 = = 76,0 DP pts/pmp
La media del SUD comprende anche la popolazione della Basilicata (560.375 ab il 31/12/2016)

CENSIMENTO GSDP 2016PREVALENZA DELLA DP NELLE 20 REGIONI
NUMERO PAZIENTI PREVALENTI
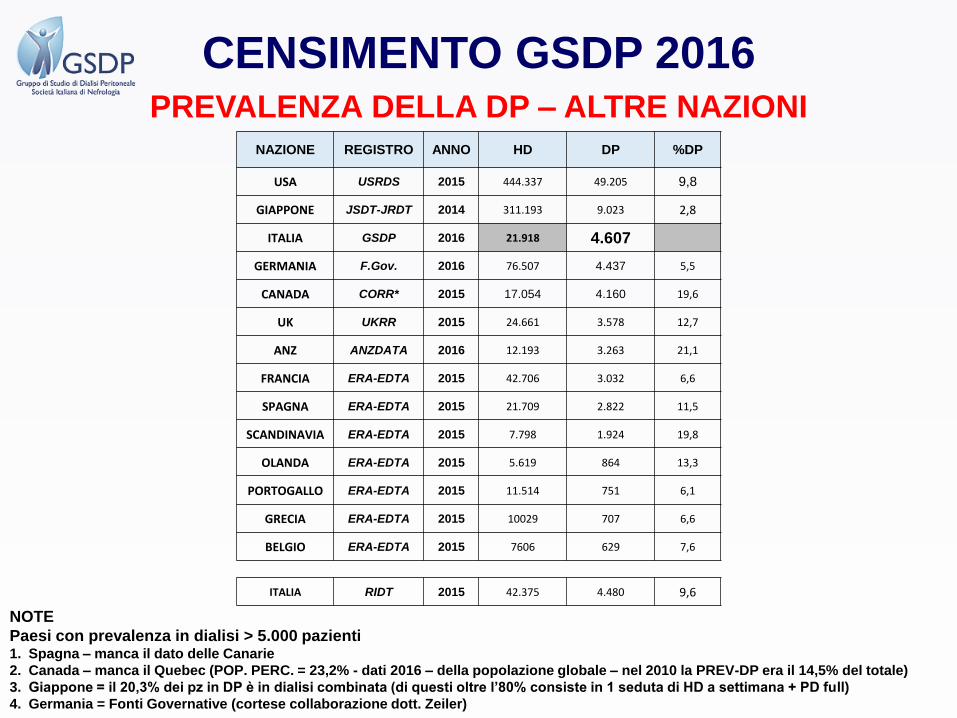
CENSIMENTO GSDP 2016PREVALENZA DELLA DP – ALTRE NAZIONI
NOTE
Paesi con prevalenza in dialisi > 5.000 pazienti1. Spagna – manca il dato delle Canarie
2. Canada – manca il Quebec (POP. PERC. = 23,2% - dati 2016 – della popolazione globale – nel 2010 la PREV-DP era il 14,5% del totale)
3. Giappone = il 20,3% dei pz in DP è in dialisi combinata (di questi oltre l’80% consiste in 1 seduta di HD a settimana + PD full)
4. Germania = Fonti Governative (cortese collaborazione dott. Zeiler)
NAZIONE REGISTRO ANNO HD DP %DP
USA USRDS 2015 444.337 49.205 9,8
GIAPPONE JSDT-JRDT 2014 311.193 9.023 2,8
ITALIA GSDP 2016 21.918 4.607
GERMANIA F.Gov. 2016 76.507 4.437 5,5
CANADA CORR* 2015 17.054 4.160 19,6
UK UKRR 2015 24.661 3.578 12,7
ANZ ANZDATA 2016 12.193 3.263 21,1
FRANCIA ERA-EDTA 2015 42.706 3.032 6,6
SPAGNA ERA-EDTA 2015 21.709 2.822 11,5
SCANDINAVIA ERA-EDTA 2015 7.798 1.924 19,8
OLANDA ERA-EDTA 2015 5.619 864 13,3
PORTOGALLO ERA-EDTA 2015 11.514 751 6,1
GRECIA ERA-EDTA 2015 10029 707 6,6
BELGIO ERA-EDTA 2015 7606 629 7,6
ITALIA RIDT 2015 42.375 4.480 9,6
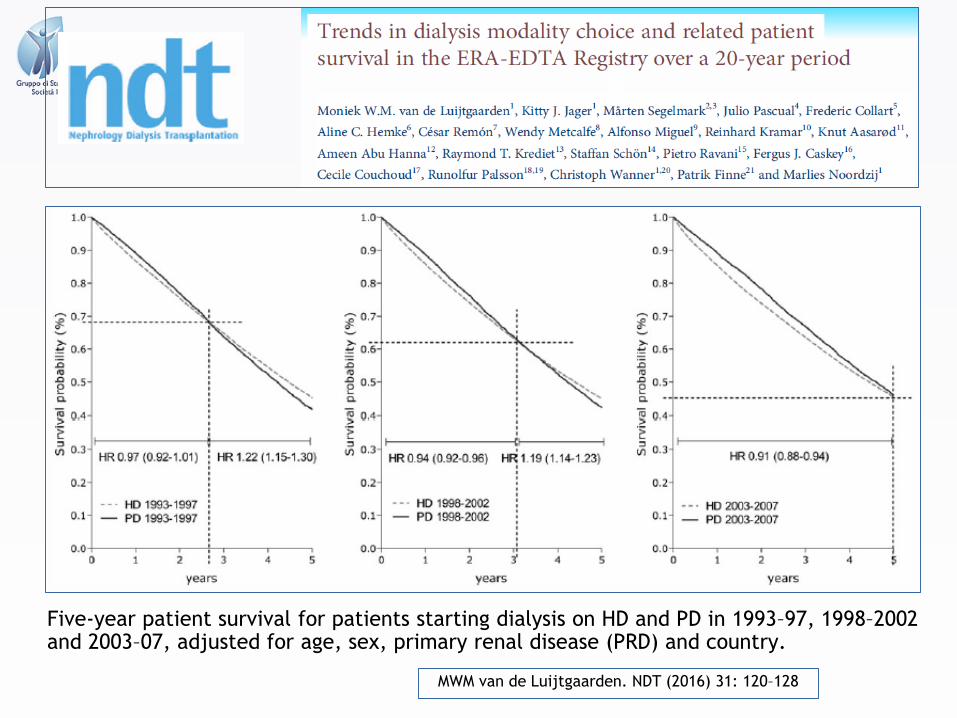
MWM van de Luijtgaarden. NDT (2016) 31: 120–128
Five-year patient survival for patients starting dialysis on HD and PD in 1993–97, 1998–2002 and 2003–07, adjusted for age, sex, primary renal disease (PRD) and country.

Extracorporea
CAPD
APD0 10 20 30 40 50 60 70 80 90 100
Time
0,3
0,4
0,5
0,6
0,7
0,8
0,9
1,0C
um
ula
tive
Pro
po
rtio
n S
urv
ivin
g
P=0.0000
Sopravvivenza del metodo di trattamento (considerando come drop-out SOLO I PASSAGGI AD ALTRA METODICA
● decessi e trapianto = censored)

512 pz
11,8
498 pz
12,4
504 pz
12,4
CENSIMENTO GSDP 2016CAUSE DI DROP OUT IN HD NEGLI ANNI
511 pz
12,3
528 pz
12,4554 pz
12,5
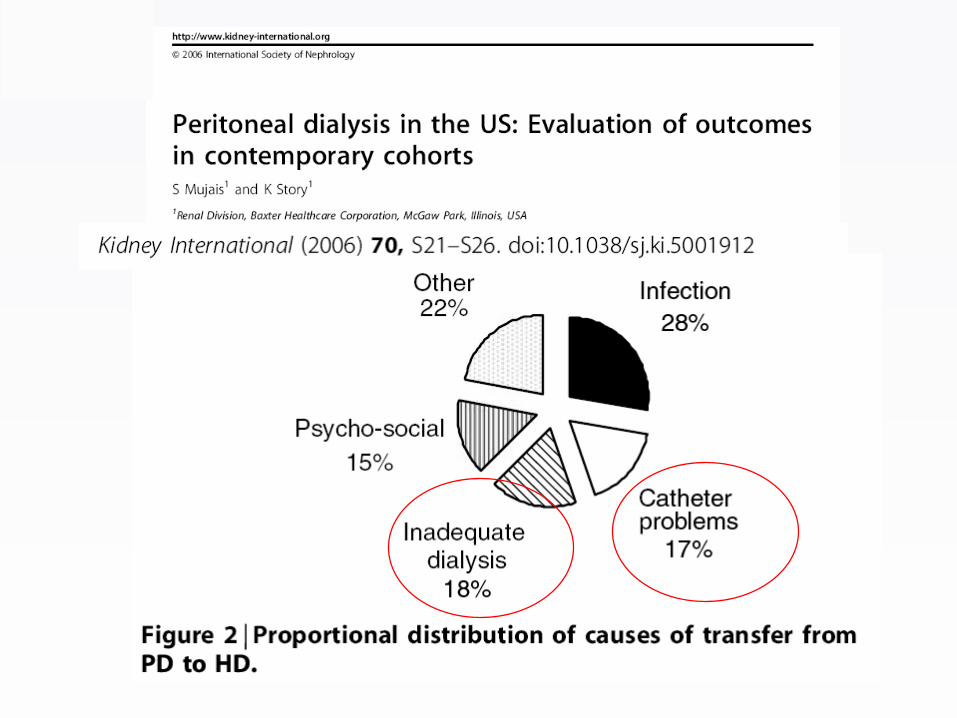
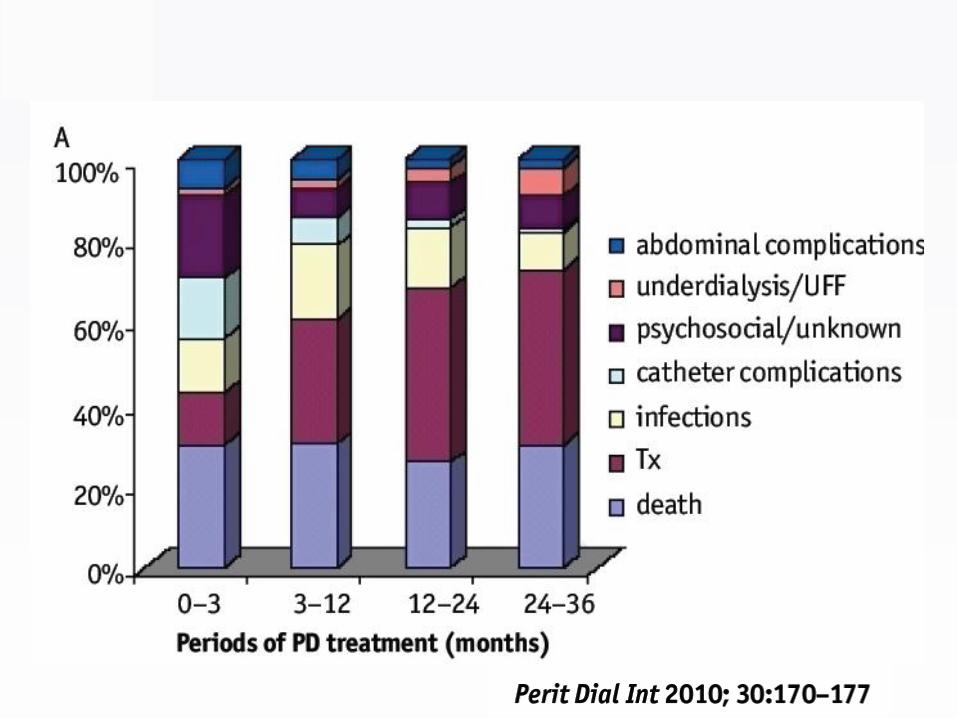
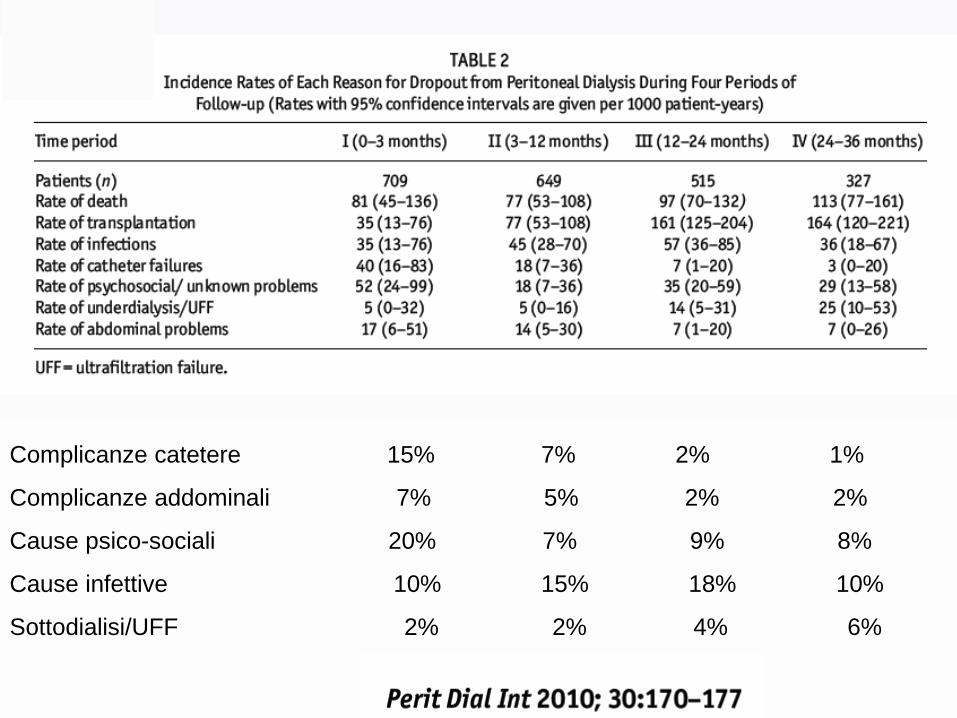
Complicanze catetere 15% 7% 2% 1%
Complicanze addominali 7% 5% 2% 2%
Cause psico-sociali 20% 7% 9% 8%
Cause infettive 10% 15% 18% 10%
Sottodialisi/UFF 2% 2% 4% 6%
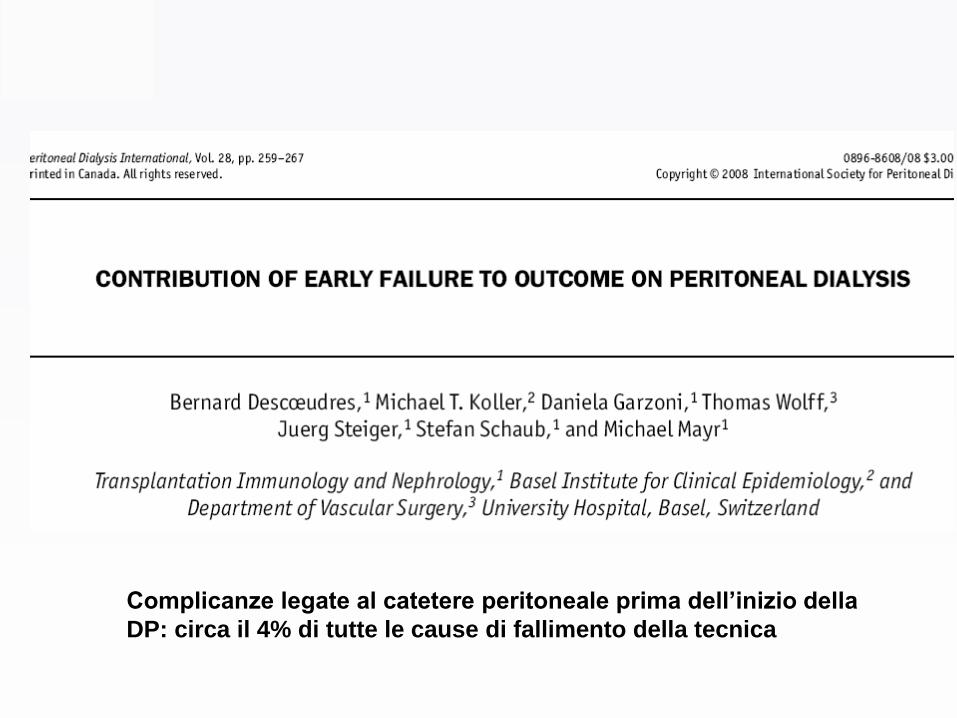
Complicanze legate al catetere peritoneale prima dell’inizio della
DP: circa il 4% di tutte le cause di fallimento della tecnica
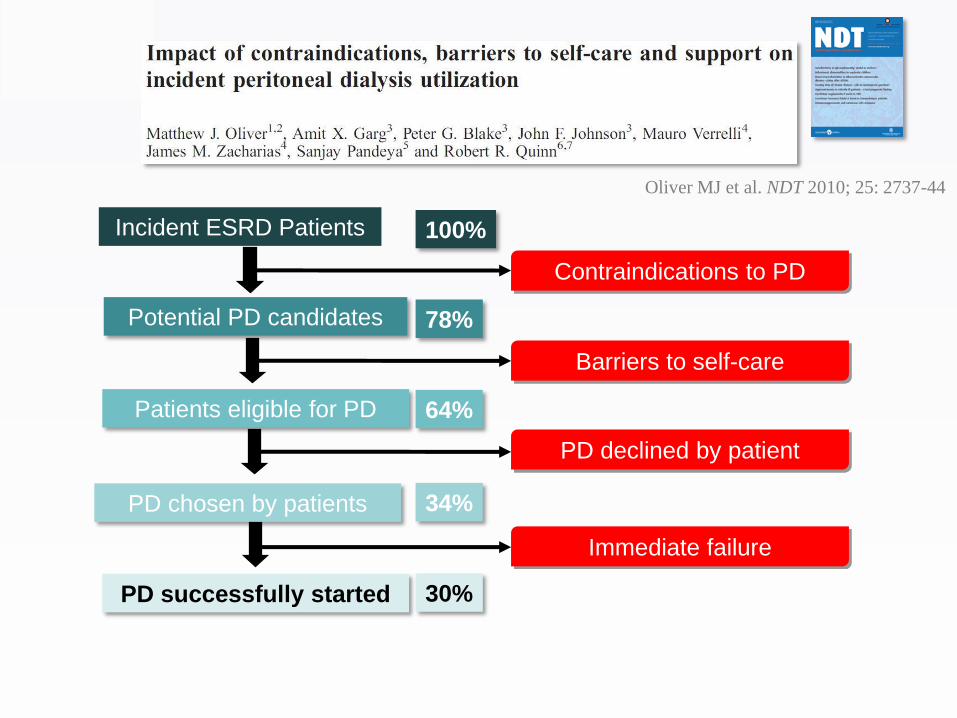
Incident ESRD Patients
Potential PD candidates
Patients eligible for PD
PD chosen by patients
PD successfully started
Contraindications to PD
Barriers to self-care
PD declined by patient
Immediate failure
Oliver MJ et al. NDT 2010; 25: 2737-44
100%
78%
64%
34%
30%
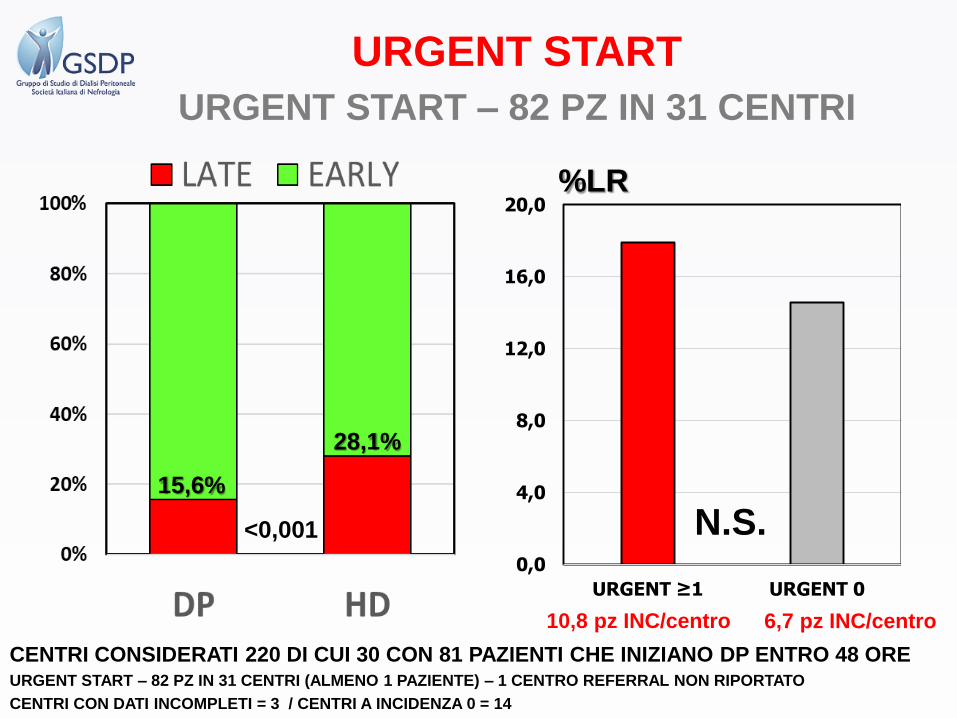
CENTRI CONSIDERATI 220 DI CUI 30 CON 81 PAZIENTI CHE INIZIANO DP ENTRO 48 OREURGENT START – 82 PZ IN 31 CENTRI (ALMENO 1 PAZIENTE) – 1 CENTRO REFERRAL NON RIPORTATO
CENTRI CON DATI INCOMPLETI = 3 / CENTRI A INCIDENZA 0 = 14
URGENT START
URGENT START – 82 PZ IN 31 CENTRI
0,0
4,0
8,0
12,0
16,0
20,0
URGENT ≥1 URGENT 0
N.S.
10,8 pz INC/centro 6,7 pz INC/centro
%LR
15,6%
28,1%
<0,001

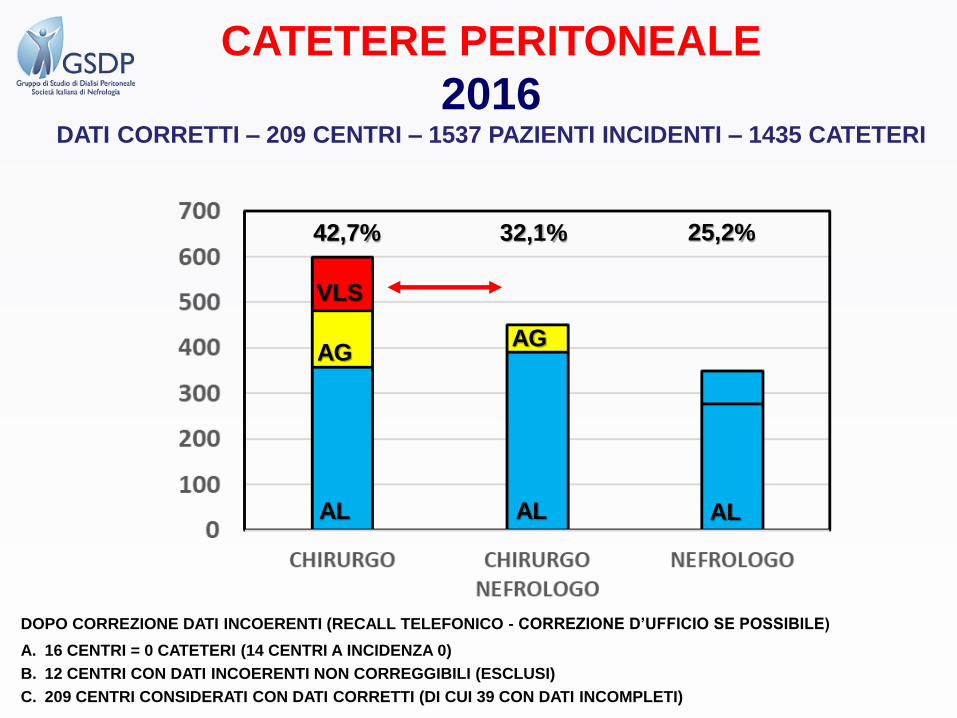
CATETERE PERITONEALE
2016DATI CORRETTI – 209 CENTRI – 1537 PAZIENTI INCIDENTI – 1435 CATETERI
42,7% 32,1% 25,2%
VLS
DOPO CORREZIONE DATI INCOERENTI (RECALL TELEFONICO - CORREZIONE D’UFFICIO SE POSSIBILE)
A. 16 CENTRI = 0 CATETERI (14 CENTRI A INCIDENZA 0)
B. 12 CENTRI CON DATI INCOERENTI NON CORREGGIBILI (ESCLUSI)
C. 209 CENTRI CONSIDERATI CON DATI CORRETTI (DI CUI 39 CON DATI INCOMPLETI)
AL AL AL
AGAG
VLS
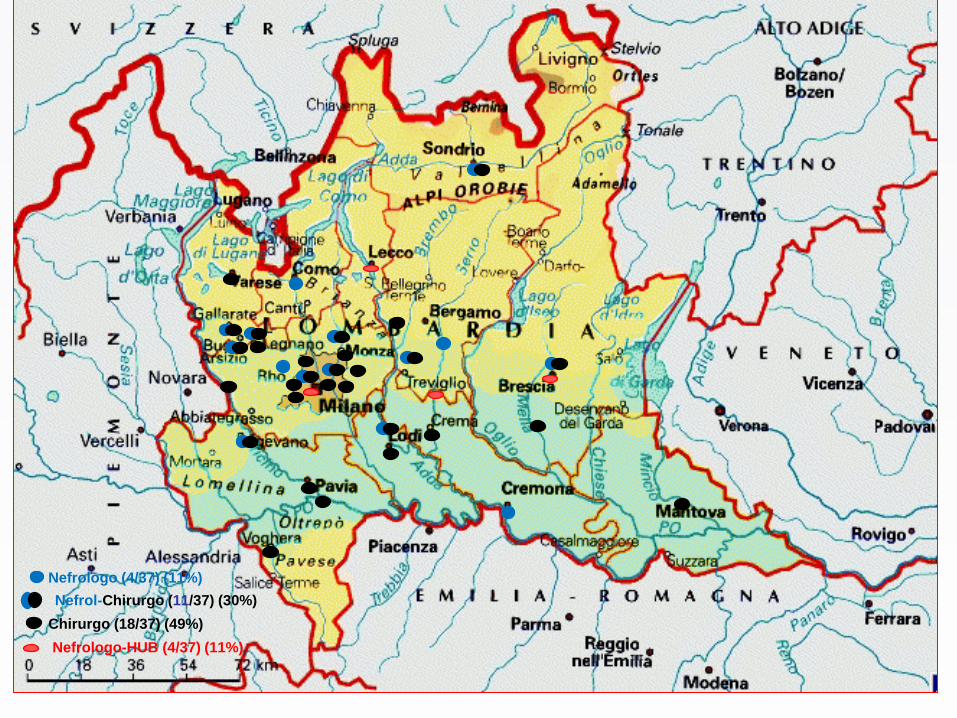
Nefrologo (4/37) (11%)
Chirurgo (18/37) (49%)
Nefrol-Chirurgo (11/37) (30%)
Nefrologo-HUB (4/37) (11%)
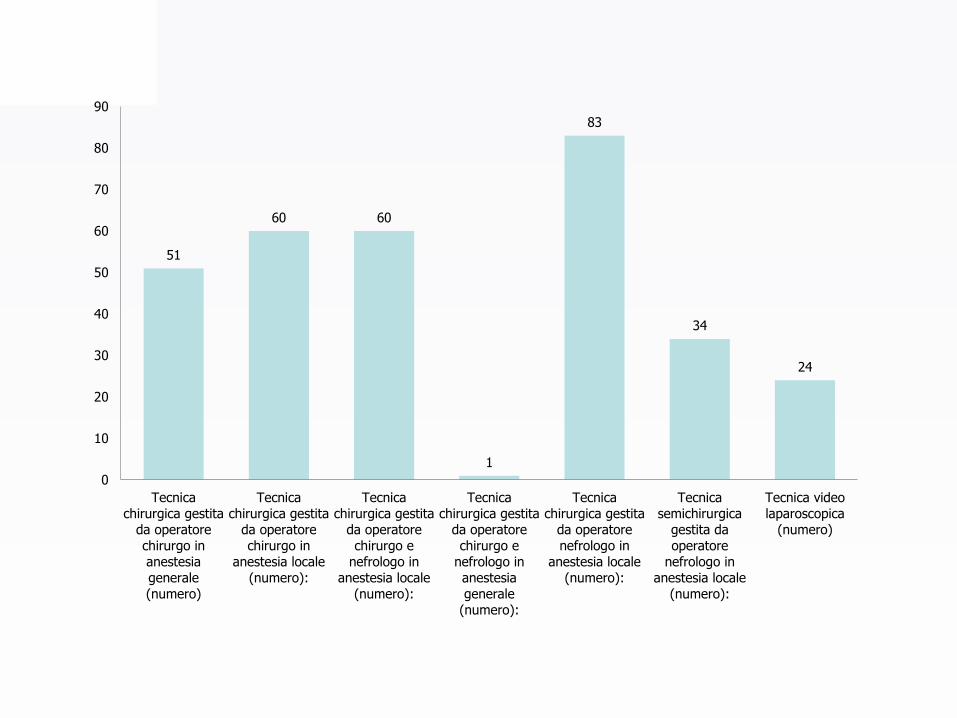
51
60 60
1
83
34
24
0
10
20
30
40
50
60
70
80
90
Tecnicachirurgica gestita
da operatorechirurgo inanestesiagenerale(numero)
Tecnicachirurgica gestita
da operatorechirurgo in
anestesia locale(numero):
Tecnicachirurgica gestita
da operatorechirurgo e
nefrologo inanestesia locale
(numero):
Tecnicachirurgica gestita
da operatorechirurgo e
nefrologo inanestesiagenerale
(numero):
Tecnicachirurgica gestita
da operatorenefrologo in
anestesia locale(numero):
Tecnicasemichirurgica
gestita daoperatore
nefrologo inanestesia locale
(numero):
Tecnica videolaparoscopica
(numero)
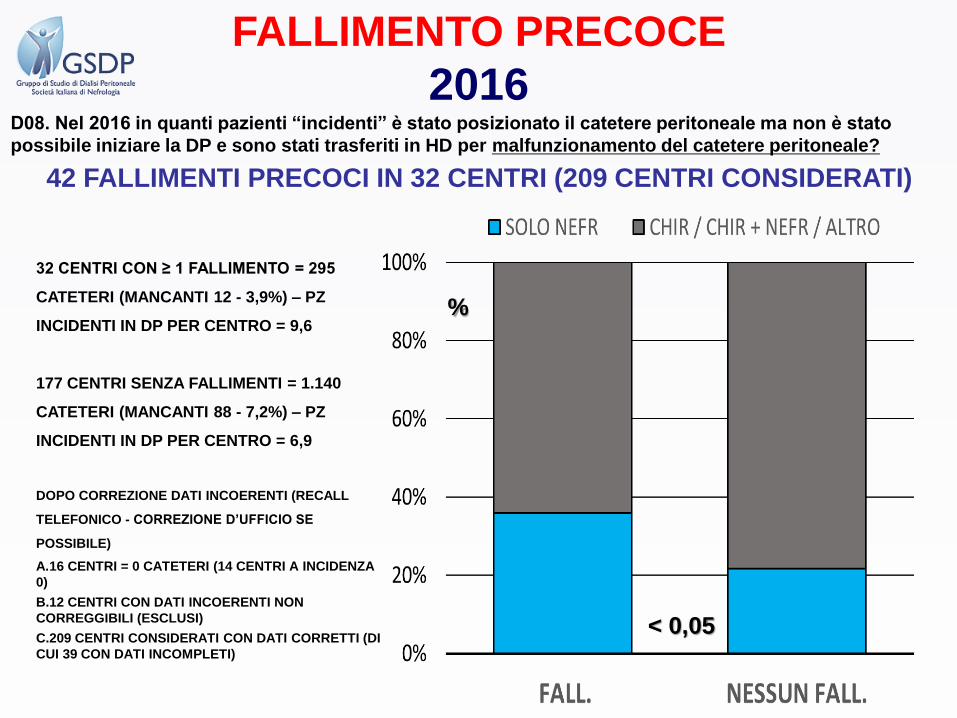
D08. Nel 2016 in quanti pazienti “incidenti” è stato posizionato il catetere peritoneale ma non è stato
possibile iniziare la DP e sono stati trasferiti in HD per malfunzionamento del catetere peritoneale?
FALLIMENTO PRECOCE
2016
42 FALLIMENTI PRECOCI IN 32 CENTRI (209 CENTRI CONSIDERATI)
32 CENTRI CON ≥ 1 FALLIMENTO = 295
CATETERI (MANCANTI 12 - 3,9%) – PZ
INCIDENTI IN DP PER CENTRO = 9,6
177 CENTRI SENZA FALLIMENTI = 1.140
CATETERI (MANCANTI 88 - 7,2%) – PZ
INCIDENTI IN DP PER CENTRO = 6,9
DOPO CORREZIONE DATI INCOERENTI (RECALL
TELEFONICO - CORREZIONE D’UFFICIO SE
POSSIBILE)
A.16 CENTRI = 0 CATETERI (14 CENTRI A INCIDENZA
0)
B.12 CENTRI CON DATI INCOERENTI NON
CORREGGIBILI (ESCLUSI)
C.209 CENTRI CONSIDERATI CON DATI CORRETTI (DI
CUI 39 CON DATI INCOMPLETI)
%
< 0,05
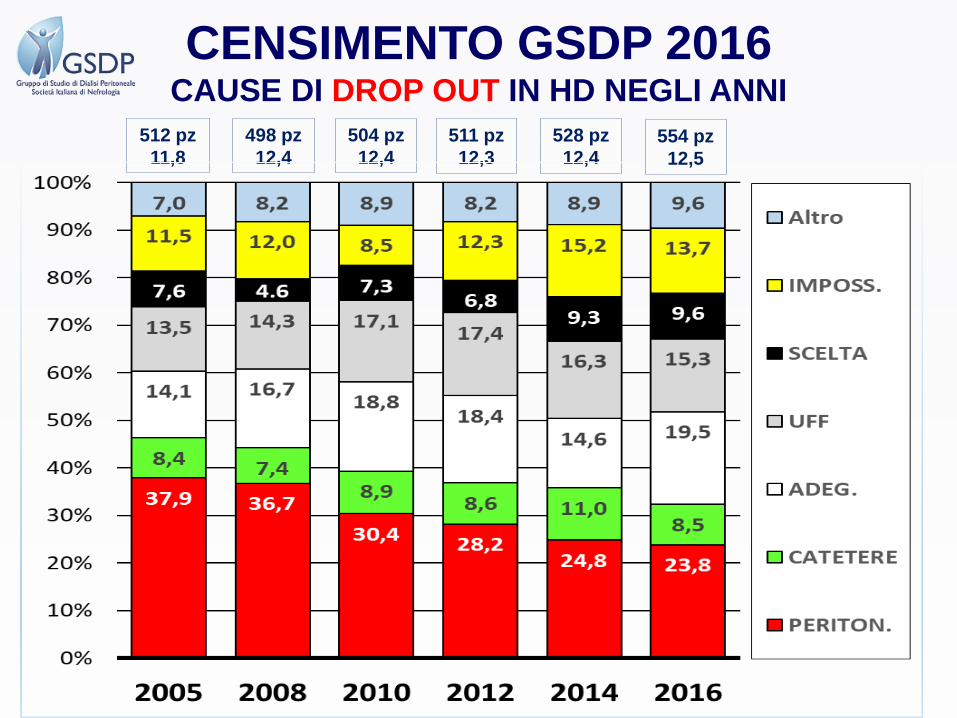
512 pz
11,8
498 pz
12,4
504 pz
12,4
CENSIMENTO GSDP 2016CAUSE DI DROP OUT IN HD NEGLI ANNI
511 pz
12,3
528 pz
12,4554 pz
12,5
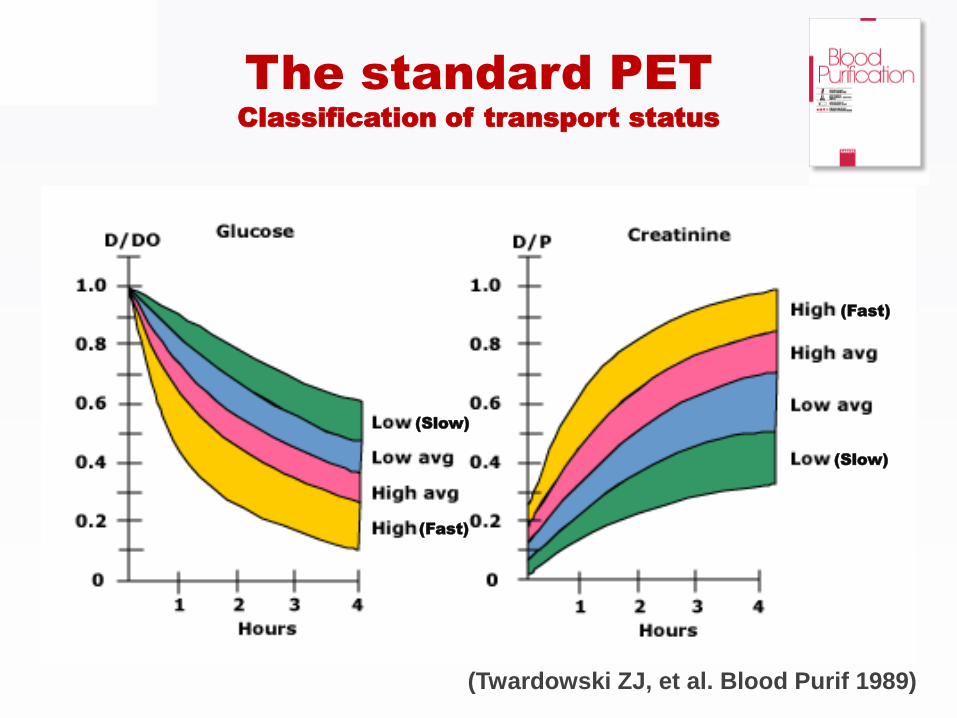
(Twardowski ZJ, et al. Blood Purif 1989)
The standard PETClassification of transport status
(Fast)
(Fast)
(Slow)
(Slow)
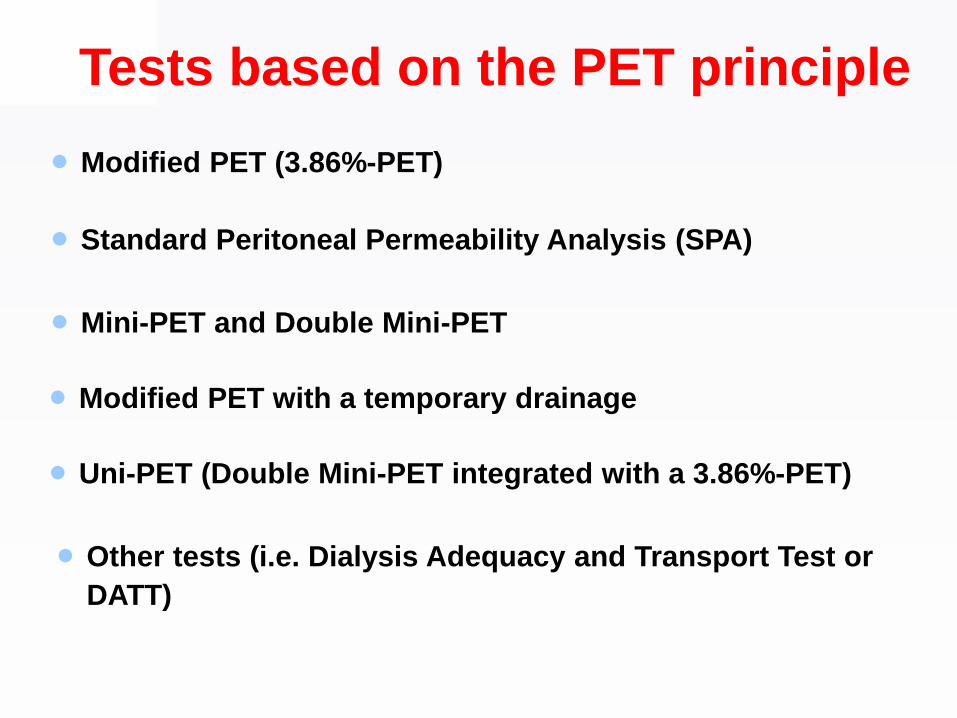
Modified PET (3.86%-PET)
Mini-PET and Double Mini-PET
Standard Peritoneal Permeability Analysis (SPA)
Modified PET with a temporary drainage
Uni-PET (Double Mini-PET integrated with a 3.86%-PET)
Other tests (i.e. Dialysis Adequacy and Transport Test or
DATT)
Tests based on the PET principle
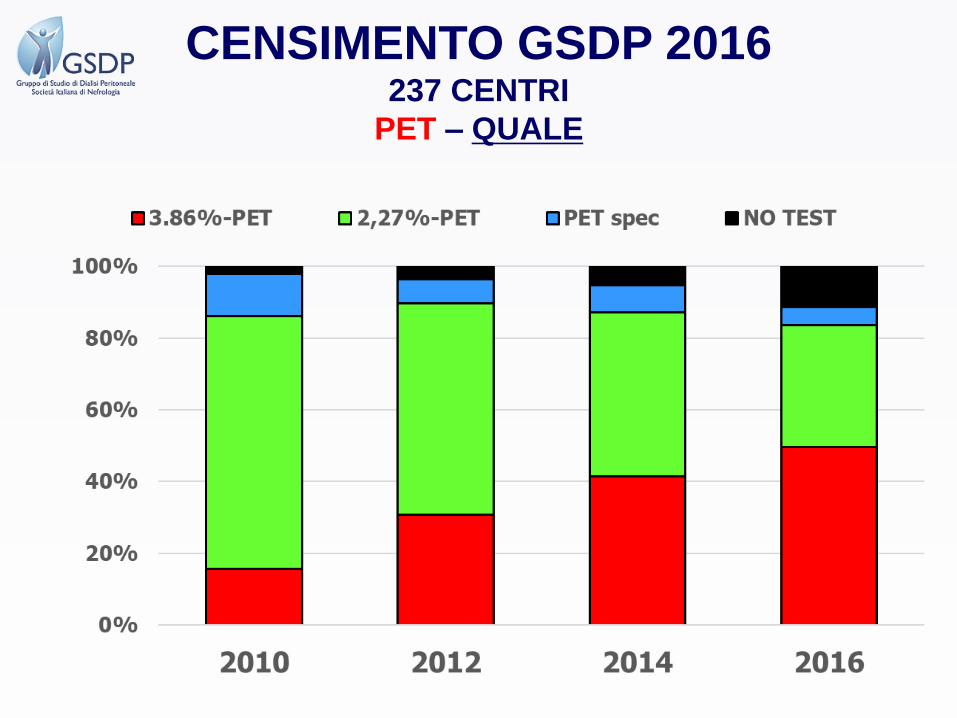
CENSIMENTO GSDP 2016237 CENTRI
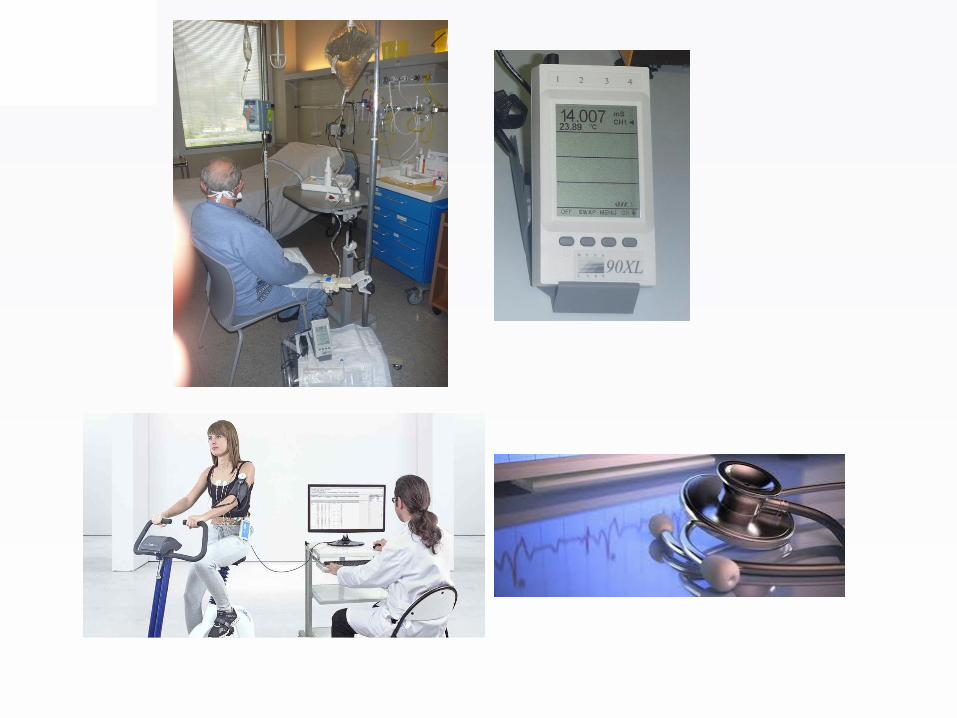
PET – QUALE
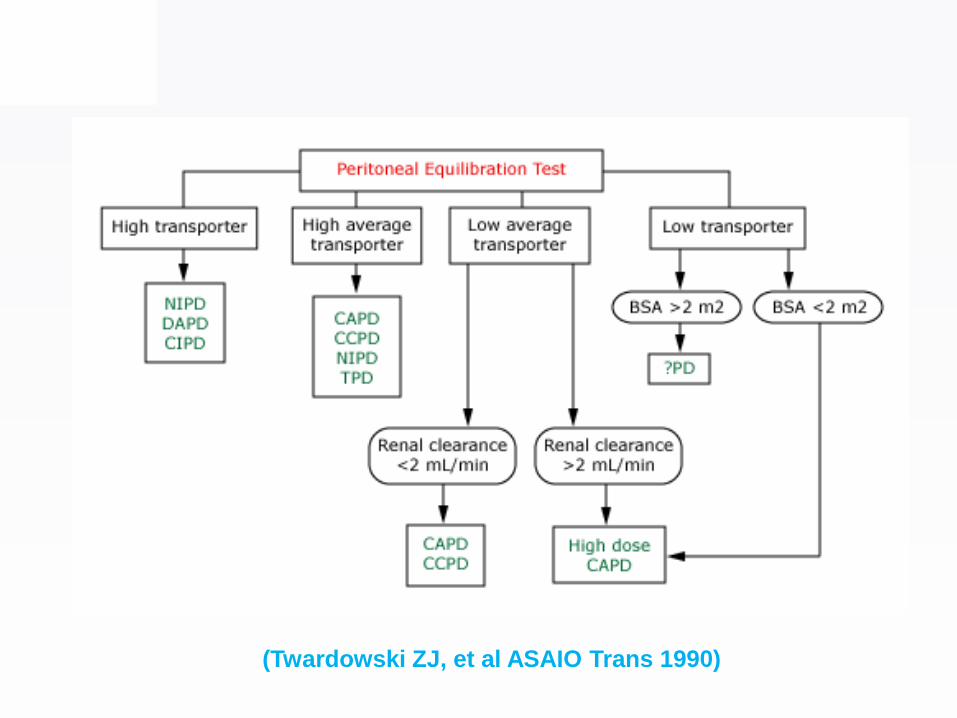
(Twardowski ZJ, et al ASAIO Trans 1990)

(Twardowski ZJ, et al ASAIO Trans 1990)(Twardowski ZJ, et al ASAIO Trans 1990)
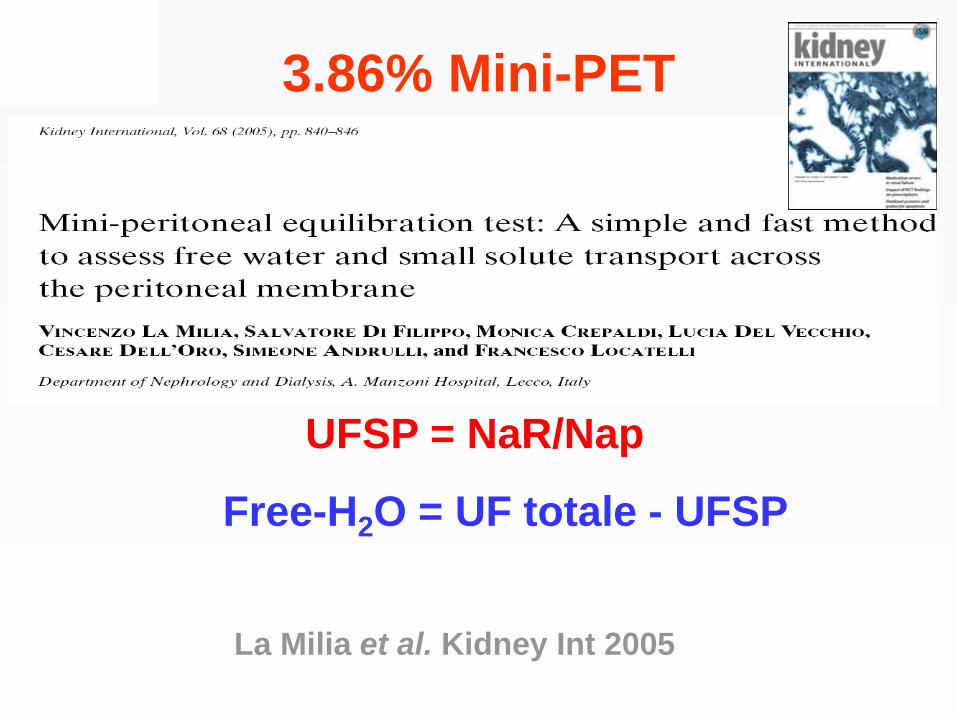
We suggested a method to assess UFSP based on Na
removal divided by plasma Na during a peritoneal equilibration
test lasting one hour: the Mini-PET
La Milia et al. Kidney Int 2005
UFSP = NaR/Nap
Free-H2O = UF totale - UFSP
3.86% Mini-PETThe dip of dialysate sodium concentration or the dialysate to
plasma ratio (D/PNa) obtained with modified 3.86% PET is useful to
study free-water transport but is not able to quantify it
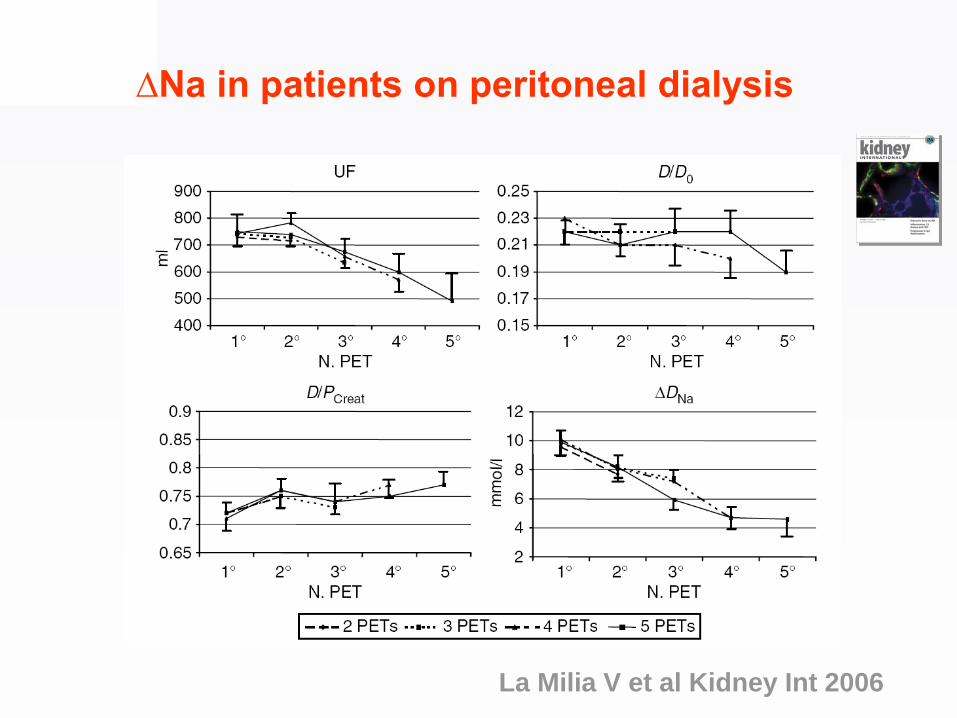
La Milia V et al Kidney Int 2006
∆Na in patients on peritoneal dialysis
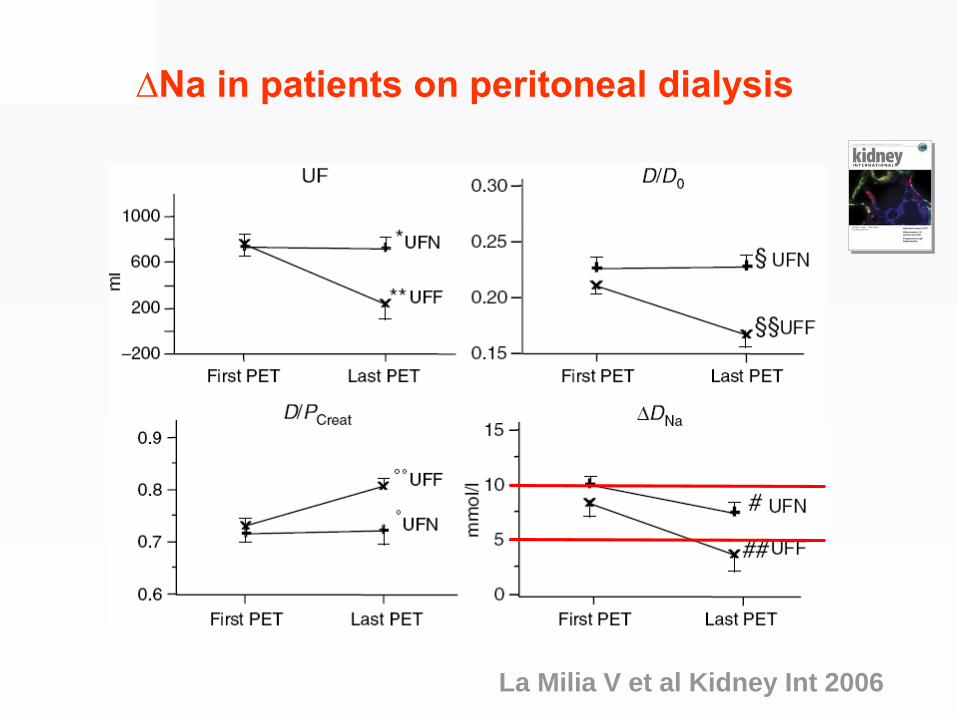
La Milia V et al Kidney Int 2006
∆Na in patients on peritoneal dialysis

J Am Soc Nephrol October 2015 26: 2521–2533

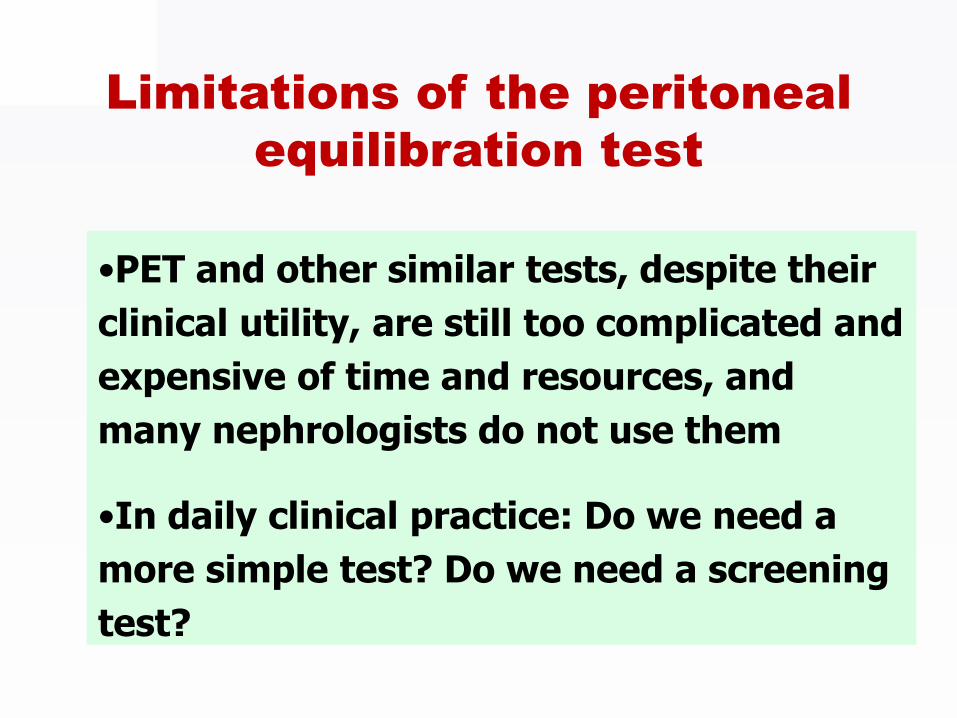
Limitations of the peritoneal
equilibration test
•PET and other similar tests, despite their
clinical utility, are still too complicated and
expensive of time and resources, and
many nephrologists do not use them
•In daily clinical practice: Do we need a
more simple test? Do we need a screening
test?
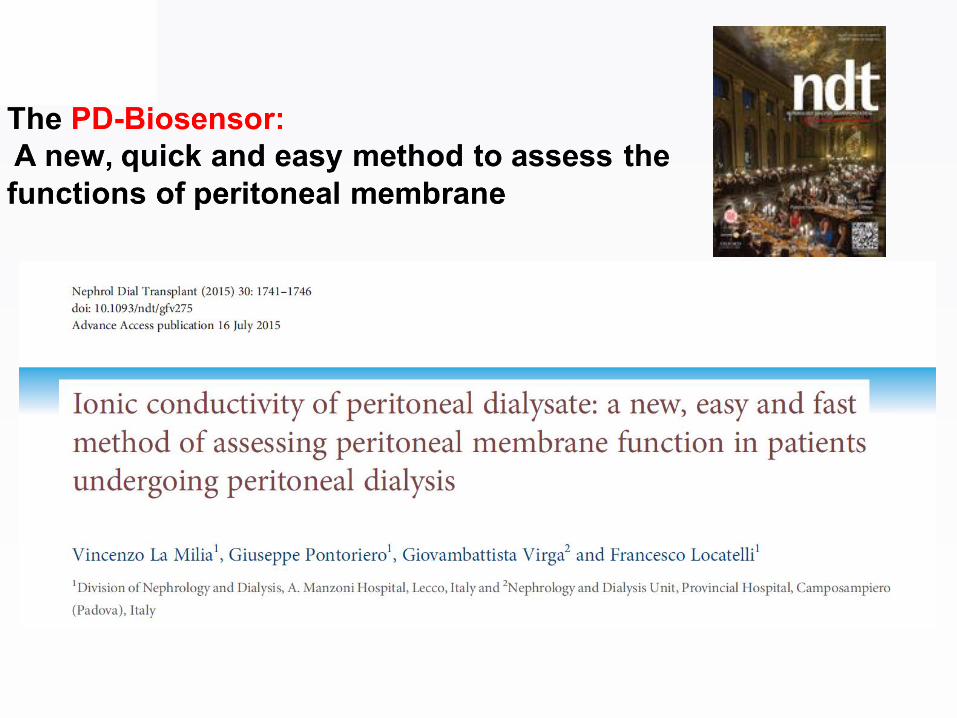
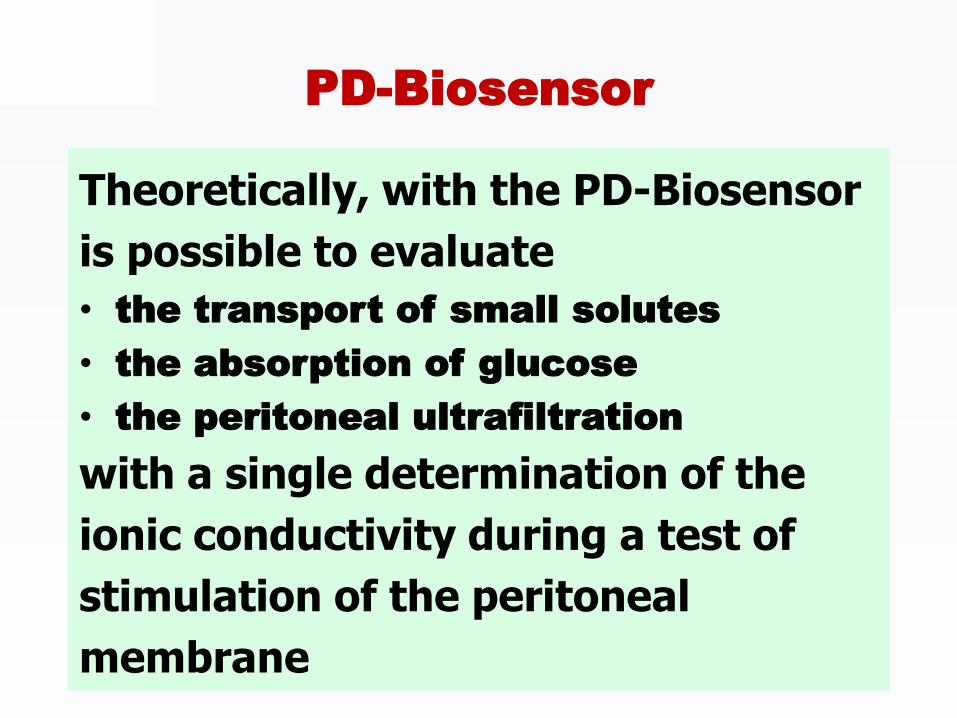
PD-Biosensor
Theoretically, with the PD-Biosensor
is possible to evaluate
• the transport of small solutes
• the absorption of glucose
• the peritoneal ultrafiltration
with a single determination of the
ionic conductivity during a test of
stimulation of the peritoneal
membrane
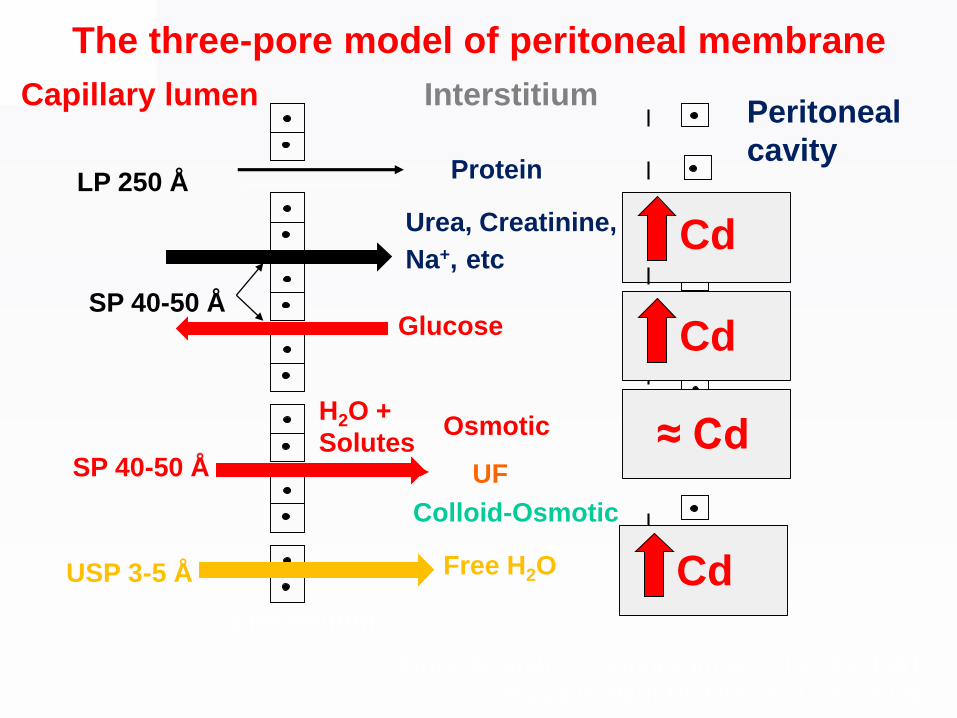
LP 250 ÅProtein
SP 40-50 Å
Urea, Creatinine,
Na+, etc
Glucose
USP 3-5 Å
Osmotic
UF
Free H2O
H2O +
Solutes
Colloid-Osmotic
Capillary lumen InterstitiumPeritoneal
cavity
EndoteliumMesotelium
SP 40-50 Å
Rippe B, Stelin G. Kidney Int 40: 315-325, 1991
Rippe B. Perit Dial Int 24: 10-27, 2004
The three-pore model of peritoneal membrane
Cd
Cd
≈ Cd
Cd
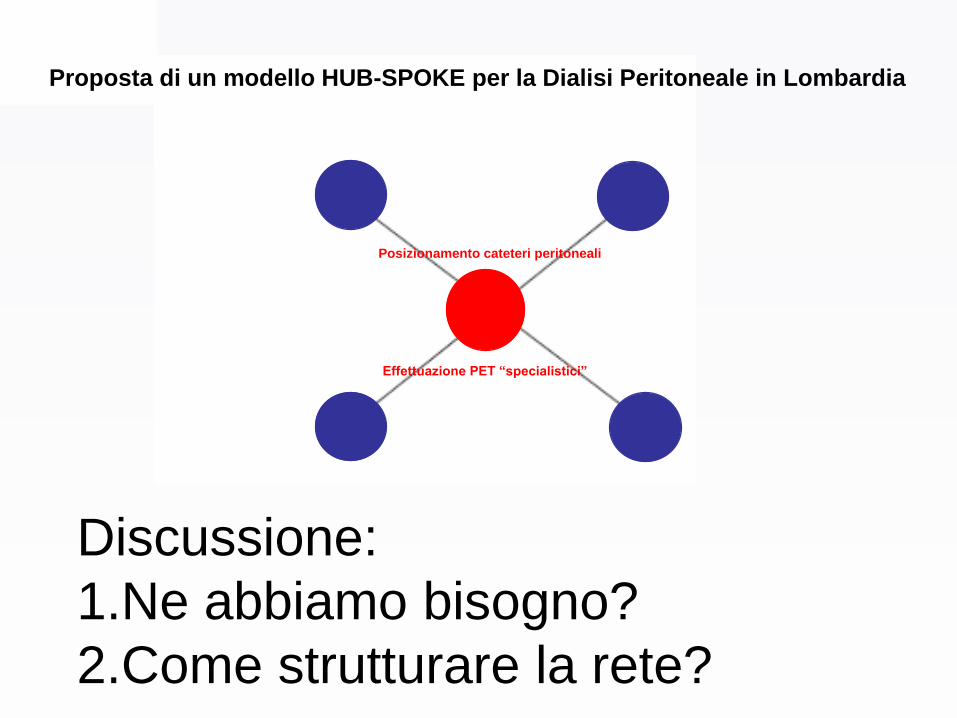
Posizionamento cateteri peritoneali
Effettuazione PET “specialistici”
Proposta di un modello HUB-SPOKE per la Dialisi Peritoneale in Lombardia
Discussione:
1.Ne abbiamo bisogno?
2.Come strutturare la rete?