RELAZIONE TRANSFRONTALIERA SULLA QUALITÀ …...RELAZIONE TRASNFRONTALIERA SULLA QUALITÀ...
23
RELAZIONE TRANSFRONTALIERA SULLA QUALITÀ DELL’ARIA Gorizia – Nova Gorica - S. Peter Vrtojba Trieste - Koper ANNO 2017
Transcript of RELAZIONE TRANSFRONTALIERA SULLA QUALITÀ …...RELAZIONE TRASNFRONTALIERA SULLA QUALITÀ...
RELAZIONE TRANSFRONTALIERA SULLA QUALITÀ DELL’ARIA Gorizia – Nova Gorica - S. Peter Vrtojba
Trieste - Koper
ANNO 2017
RELAZIONE TRASNFRONTALIERA SULLA QUALITÀ DELL’ARIA ANNO 2017
1
pa Friuli Venezia Giulia
RELAZIONE TRANSFRONTALIERA SULLA QUALITÀ DELL’ARIA: Gorizia-Nova Gorica- S. Peter Vrtojba
Trieste – Koper
ANNO 2017
a cura di
Agenzia Regionale per la Protezione dell’Ambiente del Friuli Venezia Giulia
Republic of Slovenia, Ministry of the Environment and Spatial Planning, Slovenian Environment Agency
Palmanova, 26/10/2018
RELAZIONE TRASNFRONTALIERA SULLA QUALITÀ DELL’ARIA ANNO 2017
2
Valutazione integrata della qualità dell'aria transfrontaliera nell'area di Gorizia - Nova Gorica - S. Peter Vrtojba Agenzia Regionale per la Protezione dell’Ambiente del Friuli Venezia Giulia Repubblica di Slovenia, Ministero dell'ambiente e pianificazione territoriale, Agenzia slovena per l'ambiente
Sintesi non tecnica
Questo lavoro fornisce la valutazione della qualità dell'aria nella zona di Gorizia - Nova Gorica - S. Peter Vrtojba, riportanto il livello dell'inquinamento atmosferico associato all’insieme delle varie sorgenti presenti nella zona (valori di fondo) negli anni dal 2009 al 2017. Questa valutazione potrà essere usata per la stima degli impatti locali di fonti emissive circoscritte (ad es. impianti industriali, strade ad alto flusso, ecc.) che non sono state prese in considerazione in questa valutazione su scala di bacino.
Questo lavoro è stato svolto tenendo conto di inquinanti ubiquitari, ad esempio biossido di azoto (NO2), particolato (PM10 e PM2,5) e ozono (O3).
L’elaborazione di questo studio è stata effettuata nell'ambito del quadro concettuale DPSIR, in base al quale la qualità dell'aria (cioè il livello dell'inquinamento di fondo) è il risultato di pressioni ambientali (cioè emissioni di inquinanti di diversa origine) modulate in base a forzanti o determinanti esterni (ad es. orografia).
L'area di Gorizia-Nova Gorica-S. Peter Vrtojba beneficia di un clima generalmente favorevole alla dispersione degli inquinanti grazie alla valle Isonzo- Soča e all’orografia con il suo regime di brezza.
La densità emissiva dell'area è piuttosto moderata se confrontata con agglomerati urbani simili. Per la parte italiana dell'area indagata, di cui è disponibile un inventario completo delle emissioni, i maggiori contributi delle emissioni di azoto sono correlati alle centrali elettriche, ai trasporti stradali e al riscaldamento domestico. Le principali fonti di particolato sono rappresentate dal riscaldamento domestico (in particolare la combustione del legno) e dal trasporto su strada. Le emissioni di composti organici volatili sono principalmente legate all'uso di solventi.
Per quanto riguarda il livello di qualità dell'aria nel periodo 2009-2017, gli ossidi di azoto rivelano una moderata tendenza alla riduzione, in particolare grazie al rinnovo del parco veicolare circolante, e non rappresentano un problema, dal momento che gli standard di qualità dell'aria dell'UE sono soddisfatti. Grazie al regime dei venti, neppure le concentrazioni di polveri aerodisperse (sia nella frazione grossolana che in quella fine) rappresentano un problema per questa zona. Nella zona di Nova Gorica i livelli più elevati di PM10 sono stati misurati nel 2009 e nel 2010, periodo durante il quale sono stati effettuati lavori di costruzione nelle vicinanze della stazione di monitoraggio. Ancora elevate restano le concentrazioni di ozono troposferico, che permangono al di sopra della soglia stabilita dalla legislazione dell'UE in questo settore e in altre regioni limitrofe. L’elevato tasso di ozono è anche legato al fatto che gli inquinanti in grado di reagire con esso ed eliminarlo risultano poco presenti.
RELAZIONE TRASNFRONTALIERA SULLA QUALITÀ DELL’ARIA ANNO 2017
3
Valutazione integrata della qualità dell'aria transfrontaliera nell'area di Koper - Trieste Agenzia Regionale per la Protezione dell’Ambiente del Friuli Venezia Giulia Repubblica di Slovenia, Ministero dell'ambiente e pianificazione territoriale, Agenzia slovena per l'ambiente
Sintesi non tecnica
Questo lavoro fornisce la valutazione della qualità dell'aria nella zona di Koper - Trieste, riportando il livello dell'inquinamento atmosferico associato al complesso delle varie sorgenti presenti in zona (valori di fondo) negli anni dal 2009 al 2017. Questa valutazione potrà essere usata per la stima degli impatti locali di fonti emissive circoscritte (ad es. impianti industriali, strade ad alto flusso, ecc.) che non sono state prese in considerazione in questa valutazione su scala di bacino.
Questo lavoro è stato svolto tenendo conto di inquinanti ubiquitari, ad esempio biossido di azoto (NO2), particolato (PM10 e PM2,5) e ozono (O3).
L’elaborazione di questo studio è stata effettuata nell'ambito del quadro concettuale DPSIR, in base al quale la qualità dell'aria (cioè il livello dell'inquinamento di fondo) è il risultato di pressioni ambientali (cioè emissioni di inquinanti di diversa origine) modulate in base a forzanti o determinanti esterni (ad es. orografia).
L'area di Koper - Trieste risente di un clima generalmente favorevole per la dispersione degli inquinanti grazie alla presenza del mare Adriatico e del suo regime di brezza marina.
La densità emissiva dell'area è rilevante se confrontata con agglomerati urbani simili. Per la parte italiana dell'area indagata, di cui è disponibile un inventario completo delle emissioni, i principali contributi di zolfo e ossidi di azoto sono dati dal trasporto navale, dalle combustioni industriali e dalle centrali elettriche. Le principali fonti di particolato sono rappresentate dal trasporto navale, dalle industrie, dal riscaldamento domestico (in particolare dalla combustione del legno) e dal trasporto su strada. Le emissioni di composti organici volatili sono principalmente legate all'uso di solventi e all'attività biogenica.
Per quanto riguarda il livello di qualità dell'aria nel periodo 2009-2017, gli ossidi di azoto rivelano una moderata tendenza alla riduzione, in particolare grazie al rinnovo del parco veicolare circolante, e non rappresentano un problema, dal momento che gli standard di qualità dell'aria dell'UE sono soddisfatti. Grazie al regime dei venti, neppure le concentrazioni di polveri aerodisperse rappresentano un problema per questa zona, anche se l'area di Trieste pare essere caratterizzata da valori più elevati di particolato a causa della vicinanza degli impianti industriali e portuali alla città. Le concentrazioni di ozono troposferico nella parte slovena sono purtroppo al di sopra della soglia stabilita dalla legislazione dell'UE come in molte altre regioni limitrofe. Le basse concentrazioni di ozono sul versante italiano sono dovute alle caratteristiche del sito di monitoraggio; per determinare i livelli di ozono anche nei dintorni di Trieste è stata installata una nuova stazione di monitoraggio.
RELAZIONE TRASNFRONTALIERA SULLA QUALITÀ DELL’ARIA ANNO 2017
4
Joined cross-border air quality assessment in the Area of Gorizia – Nova Gorica – S. Peter Vrtojba Regional Agency for Environmental Protection of Friuli Venezia Giulia Republic of Slovenia, Ministry of the Environment and Spatial Planning, Slovenian Environment Agency
Non-technical summary
This work supplies the air quality assessment over the Gorizia-Nova Gorica-S. Peter Vrtojba area, defining the background level of atmospheric pollution. The definition of background air quality level is a mandatory step for the evaluation of possible impacts of atmospheric pollution on health and environment and for the correct estimate of potential effects of local sources (e.g., industrial plants, high flux roads, etc.) whose effects are superimposed over the background level and, for this reason, cannot be taken into account in this kind of basin-scale assessments. This work is carried out keeping into account ubiquitous pollutants, e.g, nitrogen dioxide (NO2), particulate matter (PM10 and PM2.5) and ozone (O3).
This work is carried out within the DPSIR conceptual framework, according which air quality (i.e., background level of pollution ) is the result of environmental pressures (i.e., emissions of pollutants from different sources) modulated according to external forces or constrains (i.e., meteorology and orography).
The area of Gorizia-Nova Gorica-S. Peter Vrtojba benefits from a generally favorable climate thanks to the Isonzo-Soča valley and orography with its breeze regime.
The emission density of the area is quite moderate when compared with similar urban agglomerates. For the Italian portion of the study area, where a complete emission inventory is available, major contributions of nitrogen emissions are related to power plants, road transports and domestic heating. Major sources of particulate matter are represented by domestic heating (wood combustion in particular) and road transport. According to volatile organic compounds, emissions related to solvents usage are quite relevant.
Concerning air quality level during the period 2009-2017, nitrogen oxides reveal a moderate reduction trend, in particular thanks to the improvement in vehicle fleet, and are not a problem, since EU air quality standards are satisfied. Because of winds regime, concentrations of particular matter (both in the coarse and fine fraction) are not a problem over this zone. In the area of Nova Gorica higher levels of PM10 were measured particularly in 2009 and 2010, when construction work in the vicinity of monitoring station still was carried out. Still high remains the concentrations of ground level ozone, which are unfortunately above the threshold fixed by EU legislation in this area and in other neighboring regions. This is even related to the relatively low values of the other pollutants which are not enough to react with ozone and cannot deplete it.
RELAZIONE TRASNFRONTALIERA SULLA QUALITÀ DELL’ARIA ANNO 2017
5
Introduction
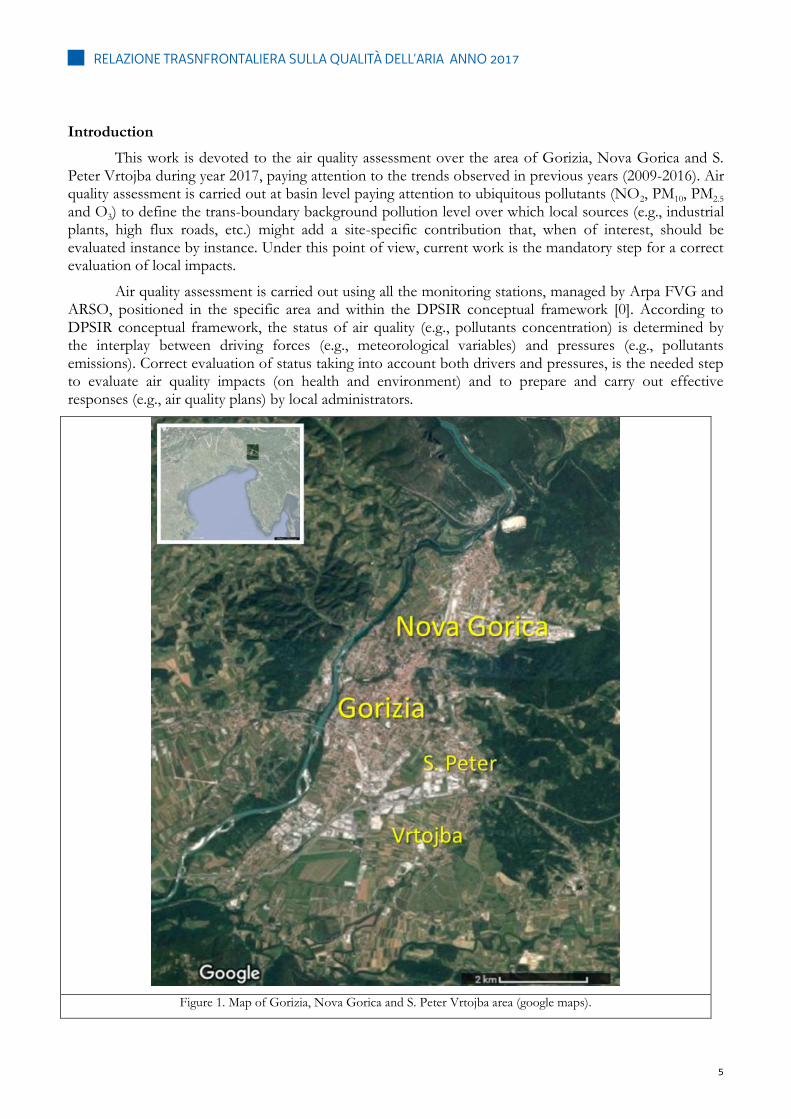
This work is devoted to the air quality assessment over the area of Gorizia, Nova Gorica and S. Peter Vrtojba during year 2017, paying attention to the trends observed in previous years (2009-2016). Air quality assessment is carried out at basin level paying attention to ubiquitous pollutants (NO2, PM10, PM2.5
and O3) to define the trans-boundary background pollution level over which local sources (e.g., industrial plants, high flux roads, etc.) might add a site-specific contribution that, when of interest, should be evaluated instance by instance. Under this point of view, current work is the mandatory step for a correct evaluation of local impacts.
Air quality assessment is carried out using all the monitoring stations, managed by Arpa FVG and ARSO, positioned in the specific area and within the DPSIR conceptual framework [0]. According to DPSIR conceptual framework, the status of air quality (e.g., pollutants concentration) is determined by the interplay between driving forces (e.g., meteorological variables) and pressures (e.g., pollutants emissions). Correct evaluation of status taking into account both drivers and pressures, is the needed step to evaluate air quality impacts (on health and environment) and to prepare and carry out effective responses (e.g., air quality plans) by local administrators.
Figure 1. Map of Gorizia, Nova Gorica and S. Peter Vrtojba area (google maps).
RELAZIONE TRASNFRONTALIERA SULLA QUALITÀ DELL’ARIA ANNO 2017
6
Air Quality Drivers
Among drivers, the most important aspects that need to be considered are orography and microclimate. Concerning orography, the area of Gorizia-Nova Gorica-S. Peter Vrtojba is almost completely bounded by mountains and open toward south only along the Isonzo/Soča river valley. Moreover, being north Adriatic not particularly far from this area, roughly 15 km, it helps in keeping relatively high temperate of this area in spite of its latitude. The northward shielding exerted by mountains and the neighborhood of the sea gave to this area the name of “Austrian Nice” during 19th century. The geological characteristics of this area, where bedrock is mainly composed by sandstone, helps to keep mild the climate through its high conductivity [1].
Under the meteorological point of view, this area is rarely affected by fog thanks to the mountain breezes, even if rarely wind intensity reaches large intensities apart beneath thunderstorms.
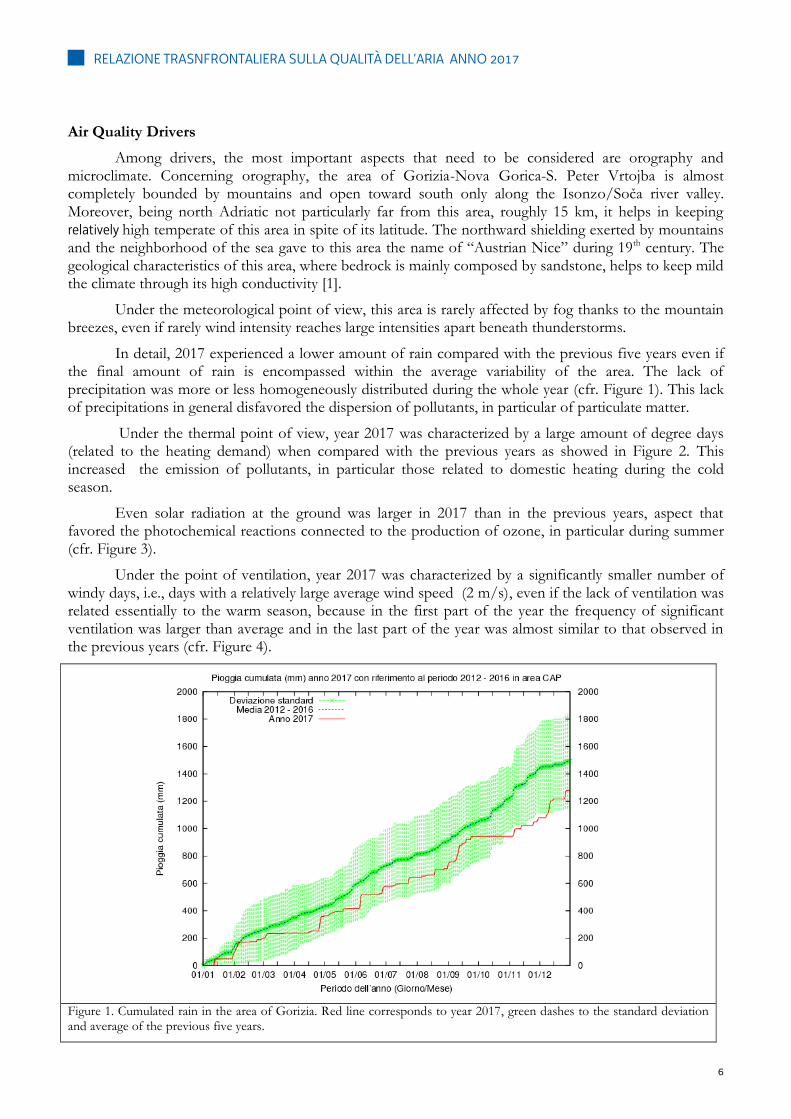
In detail, 2017 experienced a lower amount of rain compared with the previous five years even if the final amount of rain is encompassed within the average variability of the area. The lack of precipitation was more or less homogeneously distributed during the whole year (cfr. Figure 1). This lack of precipitations in general disfavored the dispersion of pollutants, in particular of particulate matter.
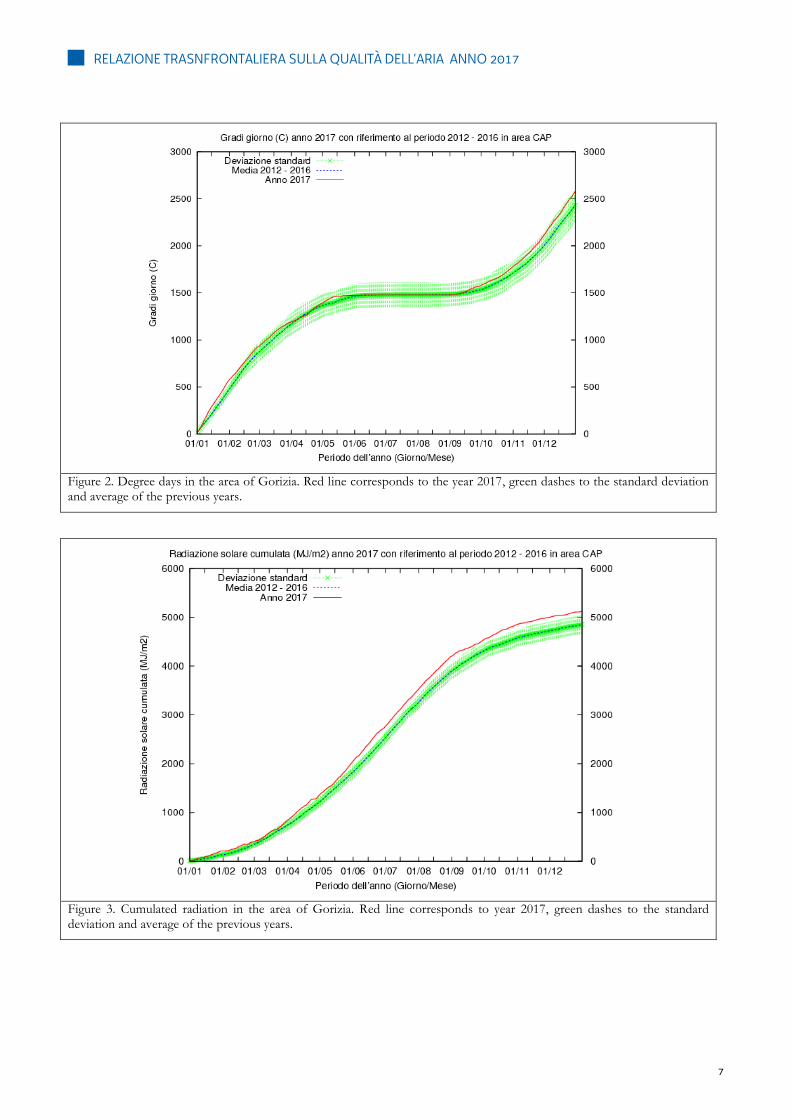
Under the thermal point of view, year 2017 was characterized by a large amount of degree days (related to the heating demand) when compared with the previous years as showed in Figure 2. This increased the emission of pollutants, in particular those related to domestic heating during the cold season.
Even solar radiation at the ground was larger in 2017 than in the previous years, aspect that favored the photochemical reactions connected to the production of ozone, in particular during summer (cfr. Figure 3).
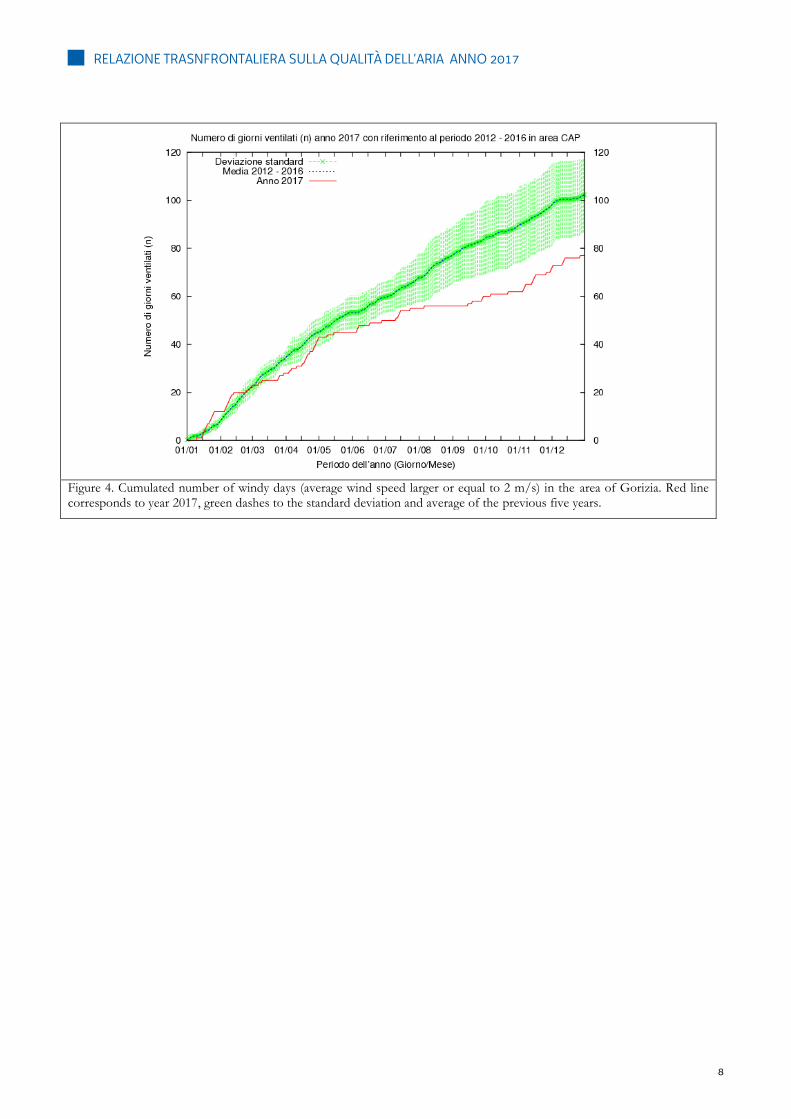
Under the point of ventilation, year 2017 was characterized by a significantly smaller number of windy days, i.e., days with a relatively large average wind speed (2 m/s), even if the lack of ventilation was related essentially to the warm season, because in the first part of the year the frequency of significant ventilation was larger than average and in the last part of the year was almost similar to that observed in the previous years (cfr. Figure 4).
Figure 1. Cumulated rain in the area of Gorizia. Red line corresponds to year 2017, green dashes to the standard deviation and average of the previous five years.
RELAZIONE TRASNFRONTALIERA SULLA QUALITÀ DELL’ARIA ANNO 2017
7
Figure 2. Degree days in the area of Gorizia. Red line corresponds to the year 2017, green dashes to the standard deviation and average of the previous years.
Figure 3. Cumulated radiation in the area of Gorizia. Red line corresponds to year 2017, green dashes to the standard deviation and average of the previous years.
RELAZIONE TRASNFRONTALIERA SULLA QUALITÀ DELL’ARIA ANNO 2017
8
Figure 4. Cumulated number of windy days (average wind speed larger or equal to 2 m/s) in the area of Gorizia. Red line corresponds to year 2017, green dashes to the standard deviation and average of the previous five years.
RELAZIONE TRASNFRONTALIERA SULLA QUALITÀ DELL’ARIA ANNO 2017
9
Air Quality Pressures
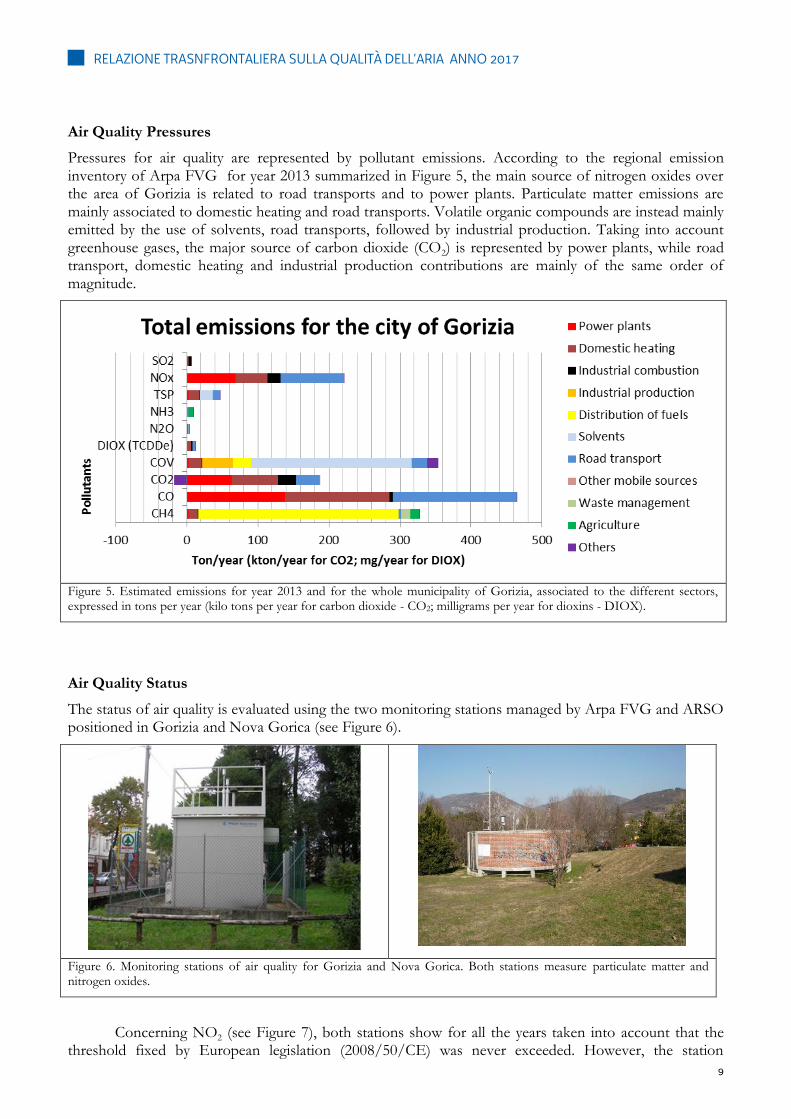
Pressures for air quality are represented by pollutant emissions. According to the regional emission inventory of Arpa FVG for year 2013 summarized in Figure 5, the main source of nitrogen oxides over the area of Gorizia is related to road transports and to power plants. Particulate matter emissions are mainly associated to domestic heating and road transports. Volatile organic compounds are instead mainly emitted by the use of solvents, road transports, followed by industrial production. Taking into account greenhouse gases, the major source of carbon dioxide (CO2) is represented by power plants, while road transport, domestic heating and industrial production contributions are mainly of the same order of magnitude.
Figure 5. Estimated emissions for year 2013 and for the whole municipality of Gorizia, associated to the different sectors, expressed in tons per year (kilo tons per year for carbon dioxide - CO2; milligrams per year for dioxins - DIOX).
Air Quality Status
The status of air quality is evaluated using the two monitoring stations managed by Arpa FVG and ARSO positioned in Gorizia and Nova Gorica (see Figure 6).
Figure 6. Monitoring stations of air quality for Gorizia and Nova Gorica. Both stations measure particulate matter and nitrogen oxides.
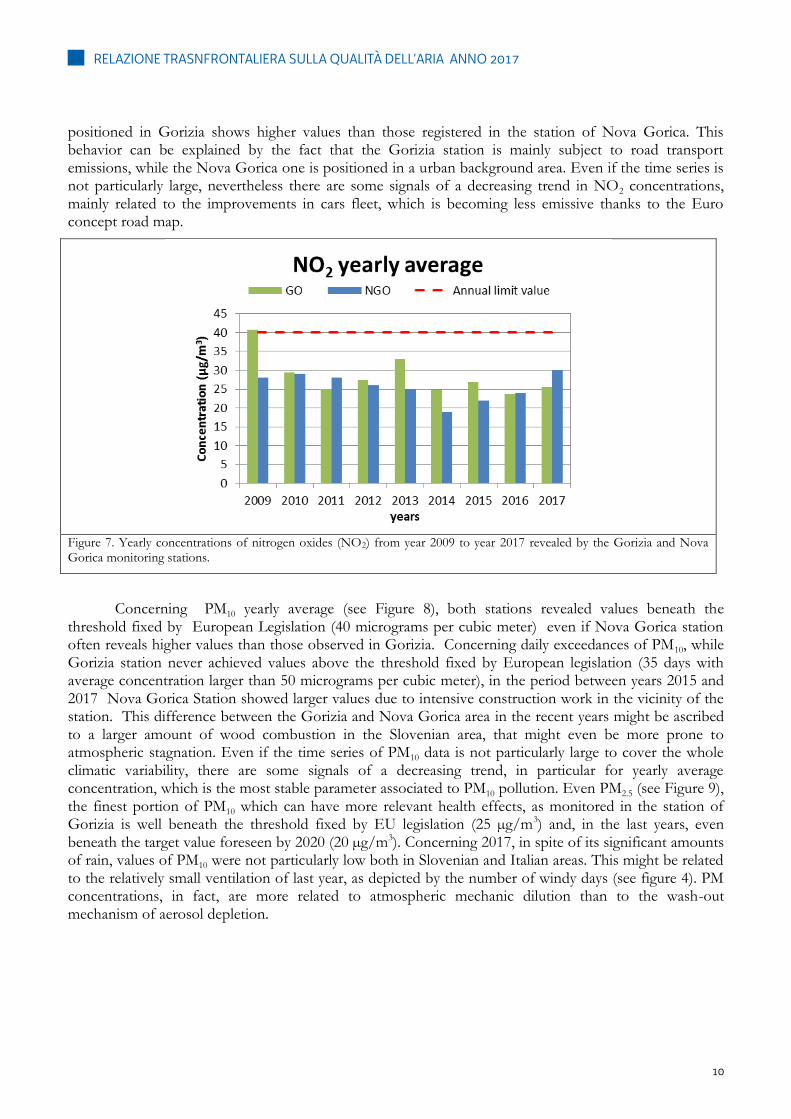
Concerning NO2 (see Figure 7), both stations show for all the years taken into account that the threshold fixed by European legislation (2008/50/CE) was never exceeded. However, the station
RELAZIONE TRASNFRONTALIERA SULLA QUALITÀ DELL’ARIA ANNO 2017
10
positioned in Gorizia shows higher values than those registered in the station of Nova Gorica. This behavior can be explained by the fact that the Gorizia station is mainly subject to road transport emissions, while the Nova Gorica one is positioned in a urban background area. Even if the time series is not particularly large, nevertheless there are some signals of a decreasing trend in NO2 concentrations, mainly related to the improvements in cars fleet, which is becoming less emissive thanks to the Euro concept road map.
Figure 7. Yearly concentrations of nitrogen oxides (NO2) from year 2009 to year 2017 revealed by the Gorizia and Nova Gorica monitoring stations.
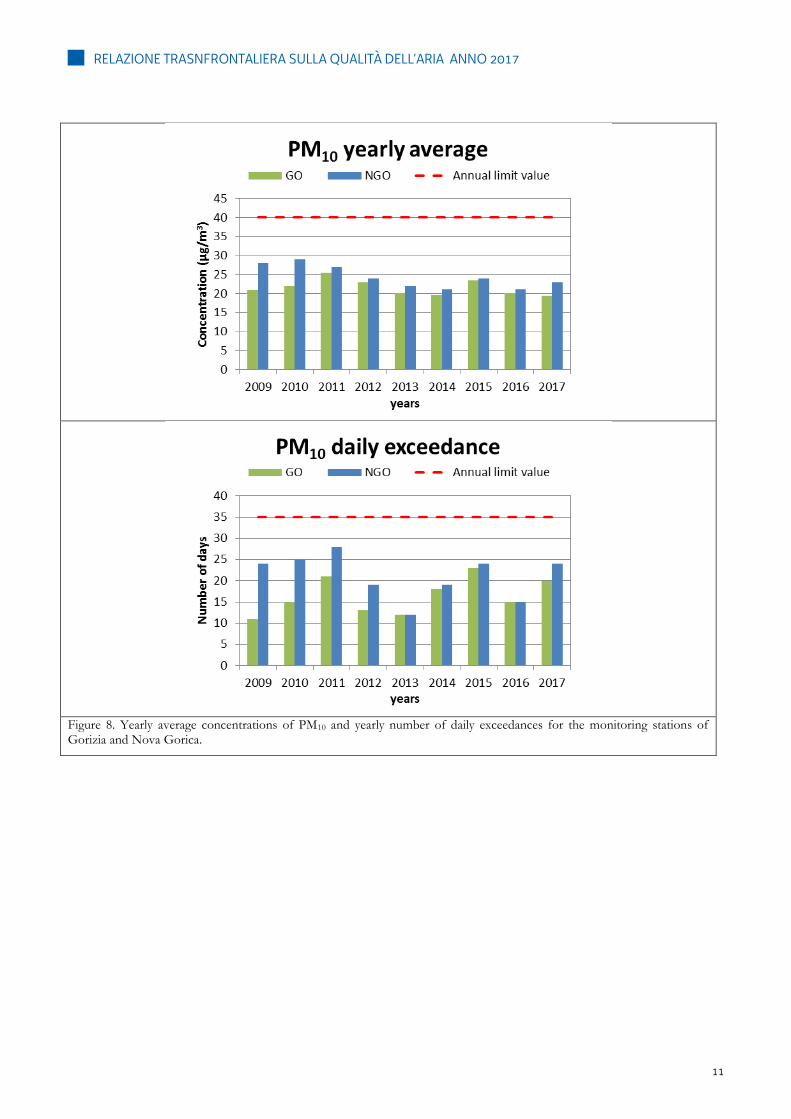
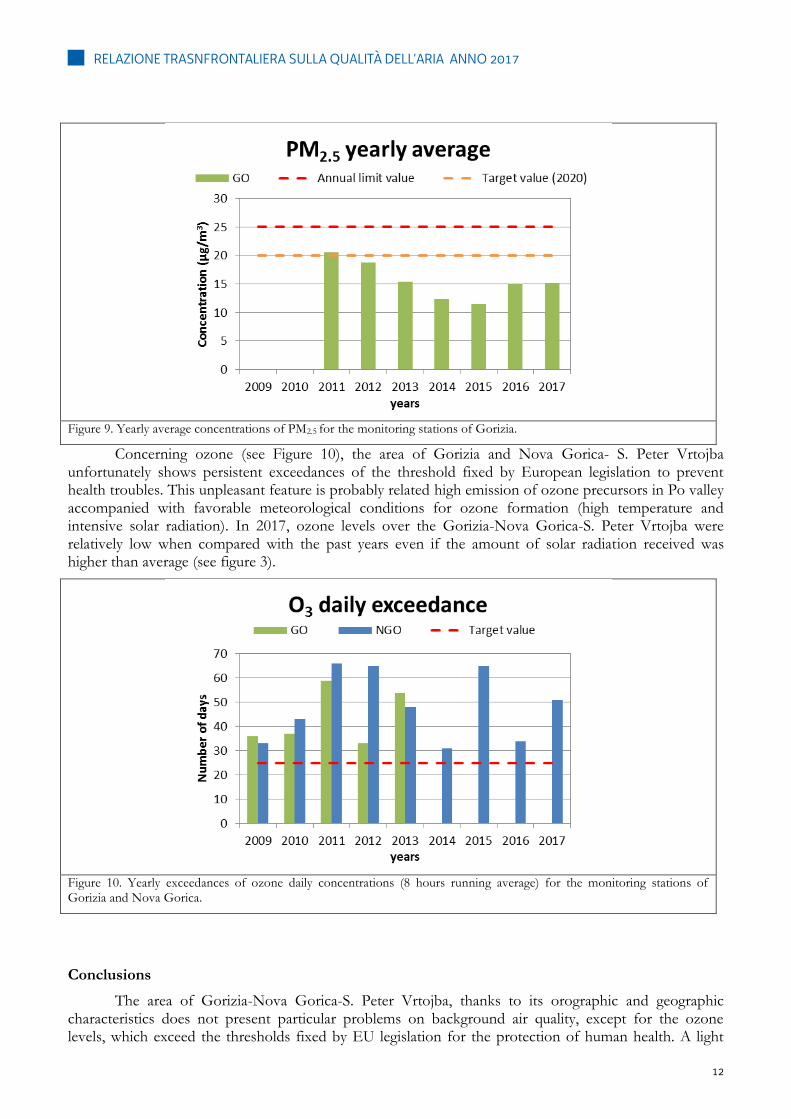
Concerning PM10 yearly average (see Figure 8), both stations revealed values beneath the threshold fixed by European Legislation (40 micrograms per cubic meter) even if Nova Gorica station often reveals higher values than those observed in Gorizia. Concerning daily exceedances of PM10, while Gorizia station never achieved values above the threshold fixed by European legislation (35 days with average concentration larger than 50 micrograms per cubic meter), in the period between years 2015 and 2017 Nova Gorica Station showed larger values due to intensive construction work in the vicinity of the station. This difference between the Gorizia and Nova Gorica area in the recent years might be ascribed to a larger amount of wood combustion in the Slovenian area, that might even be more prone to atmospheric stagnation. Even if the time series of PM10 data is not particularly large to cover the whole climatic variability, there are some signals of a decreasing trend, in particular for yearly average concentration, which is the most stable parameter associated to PM10 pollution. Even PM2.5 (see Figure 9), the finest portion of PM10 which can have more relevant health effects, as monitored in the station of Gorizia is well beneath the threshold fixed by EU legislation (25 µg/m3) and, in the last years, even beneath the target value foreseen by 2020 (20 µg/m3). Concerning 2017, in spite of its significant amounts of rain, values of PM10 were not particularly low both in Slovenian and Italian areas. This might be related to the relatively small ventilation of last year, as depicted by the number of windy days (see figure 4). PM concentrations, in fact, are more related to atmospheric mechanic dilution than to the wash-out mechanism of aerosol depletion.
RELAZIONE TRASNFRONTALIERA SULLA QUALITÀ DELL’ARIA ANNO 2017
11
Figure 8. Yearly average concentrations of PM10 and yearly number of daily exceedances for the monitoring stations of Gorizia and Nova Gorica.
RELAZIONE TRASNFRONTALIERA SULLA QUALITÀ DELL’ARIA ANNO 2017
12
Figure 9. Yearly average concentrations of PM2.5 for the monitoring stations of Gorizia.
Concerning ozone (see Figure 10), the area of Gorizia and Nova Gorica- S. Peter Vrtojba unfortunately shows persistent exceedances of the threshold fixed by European legislation to prevent health troubles. This unpleasant feature is probably related high emission of ozone precursors in Po valley accompanied with favorable meteorological conditions for ozone formation (high temperature and intensive solar radiation). In 2017, ozone levels over the Gorizia-Nova Gorica-S. Peter Vrtojba were relatively low when compared with the past years even if the amount of solar radiation received was higher than average (see figure 3).
Figure 10. Yearly exceedances of ozone daily concentrations (8 hours running average) for the monitoring stations of Gorizia and Nova Gorica.
Conclusions
The area of Gorizia-Nova Gorica-S. Peter Vrtojba, thanks to its orographic and geographic characteristics does not present particular problems on background air quality, except for the ozone levels, which exceed the thresholds fixed by EU legislation for the protection of human health. A light
RELAZIONE TRASNFRONTALIERA SULLA QUALITÀ DELL’ARIA ANNO 2017
13
increase of particulate matter concentration is observed over Nova Gorica, probably related to a larger impact of domestic heating. However, future studies are needed to confirm or reject this hypothesis.
A negative trend in nitrogen dioxide is observed over this area, mainly related to the improvement and evolution of the vehicles fleet.
Concerning 2017, it can be generally considered as a favorable year for air quality because, even if meteorological drivers were in favor of an high degree of pollution, the observed values for ozone and PM result comparable with those obtained in the previous years. Relatively contained ozone levels might be even related to the reduction in NOx and VOC emissions due to the policies adopted at EU level for these pollutants.
References
[0] DPSIR framework: https://en.wikipedia.org/wiki/DPSIR
[1] R. Gratton, 2004. Atti del IV Convegno Regionale di Meteorologia. Edizioni Unione Meteorologica del Friuli Venezia Giulia, pp. 35-37.
[2] Guidebook on emission inventories http://www.eea.europa.eu/themes/air/emep-eea-air-pollutant-emission-inventory-guidebook [3] Directive 2008/50/CE http://eur-lex.europa.eu/LexUriServ/LexUriServ.do?uri=OJ:L:2008:152:0001:0044:IT:PDF [4] web site of Arso http://www.arso.si/vreme/
[5] web site of Arpa http://www.arpa.fvg.it/cms/tema/aria/
[6] Yearly annual report on Air Quality over Friuli Venezia Giulia. http://www.arpa.fvg.it/export/sites/default/tema/aria/utilita/Documenti_e_presentazioni/tecnico_scientifiche_docs/Relazione_qa_2017_FVG.pdf
RELAZIONE TRASNFRONTALIERA SULLA QUALITÀ DELL’ARIA ANNO 2017
14
Joined cross-border air quality assessment in the Area of Koper – Trieste
Regional Agency for Environmental Protection of Friuli Venezia Giulia Republic of Slovenia, Ministry of the Environment and Spatial Planning, Slovenian Environment Agency Non-technical summary
This work supplies the air quality assessment over the Koper - Trieste area, defining the background level of atmospheric pollution. The definition of background air quality level is a mandatory step for the evaluation of possible impacts of atmospheric pollution on health and environment and for the correct estimate of potential effects of local sources (e.g., industrial plants, high flux roads, etc.) whose effects are superimposed over the background level and, for this reason, cannot be taken into account in this kind of basin-scale assessments. This work is carried out keeping into account ubiquitous pollutants, e.g, nitrogen dioxide (NO2), particulate matter (PM10) and ozone (O3).
This work is carried out within the DPSIR conceptual framework, according which air quality (i.e., background level of pollution) is the result of environmental pressures (i.e., emissions of pollutants from different sources) modulated according to external forces or constrains (i.e., meteorology and orography).
The area of Koper - Trieste benefits from a generally favorable climate thanks to the presence of the Adriatic sea and its breeze regime.
The emission density of the area is relevant when compared with similar urban agglomerates. For the Italian portion of the study area, where a complete emission inventory is available, major contributions of sulfur and nitrogen oxides are related primarily to naval transport, than to industrial combustions and power plants. Major sources of particulate matter are represented by naval transport, industrial production, domestic heating (wood combustion in particular) and road transport. According to volatile organic compounds, emissions related to solvents usage and biogenic activity are quite relevant.
Concerning air quality level during the period 2009-2017, nitrogen oxides reveal a moderate reduction trend, in particular thanks to the improvement in vehicle fleet, and are not a problem, since EU air quality standards are satisfied. Because of winds regime, concentrations of particular matter are not a problem over this zone, even if the area of Trieste seems to be characterized by higher values of particulate matter because of the proximity of industrial and port facilities to the city. Ground level ozone concentrations in the Slovenian side are unfortunately above the threshold fixed by EU legislation as in many other neighboring regions. Lower levels of ozone on the Italian side are due to the characteristics of monitoring site and a new monitoring position has been installed to determine ozone levels even in the Trieste surroundings.
RELAZIONE TRASNFRONTALIERA SULLA QUALITÀ DELL’ARIA ANNO 2017
15
Introduction
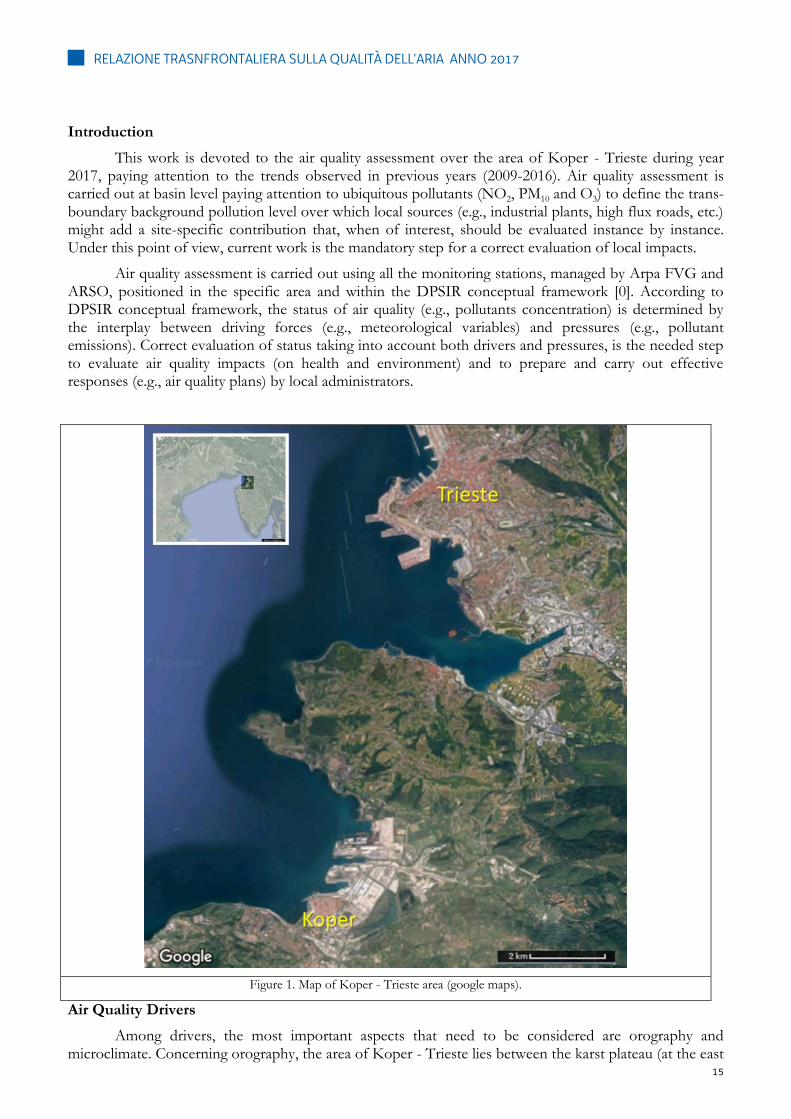
This work is devoted to the air quality assessment over the area of Koper - Trieste during year 2017, paying attention to the trends observed in previous years (2009-2016). Air quality assessment is carried out at basin level paying attention to ubiquitous pollutants (NO2, PM10 and O3) to define the trans-boundary background pollution level over which local sources (e.g., industrial plants, high flux roads, etc.) might add a site-specific contribution that, when of interest, should be evaluated instance by instance. Under this point of view, current work is the mandatory step for a correct evaluation of local impacts.
Air quality assessment is carried out using all the monitoring stations, managed by Arpa FVG and ARSO, positioned in the specific area and within the DPSIR conceptual framework [0]. According to DPSIR conceptual framework, the status of air quality (e.g., pollutants concentration) is determined by the interplay between driving forces (e.g., meteorological variables) and pressures (e.g., pollutant emissions). Correct evaluation of status taking into account both drivers and pressures, is the needed step to evaluate air quality impacts (on health and environment) and to prepare and carry out effective responses (e.g., air quality plans) by local administrators.
Figure 1. Map of Koper - Trieste area (google maps).
Air Quality Drivers
Among drivers, the most important aspects that need to be considered are orography and microclimate. Concerning orography, the area of Koper - Trieste lies between the karst plateau (at the east
RELAZIONE TRASNFRONTALIERA SULLA QUALITÀ DELL’ARIA ANNO 2017
16
side) and the Adriatic sea (at the west side); since it is a coastal area it is subjected to the breeze regime and this helps in keeping relatively high temperate of this area in spite of its latitude. Anyway its particular orography determines the sporadic presence of a strong and cold northeasterly wind called “Bora” [1].
Under the meteorological point of view, this area is rarely affected by fog thanks to the breezes or the presence of Bora.
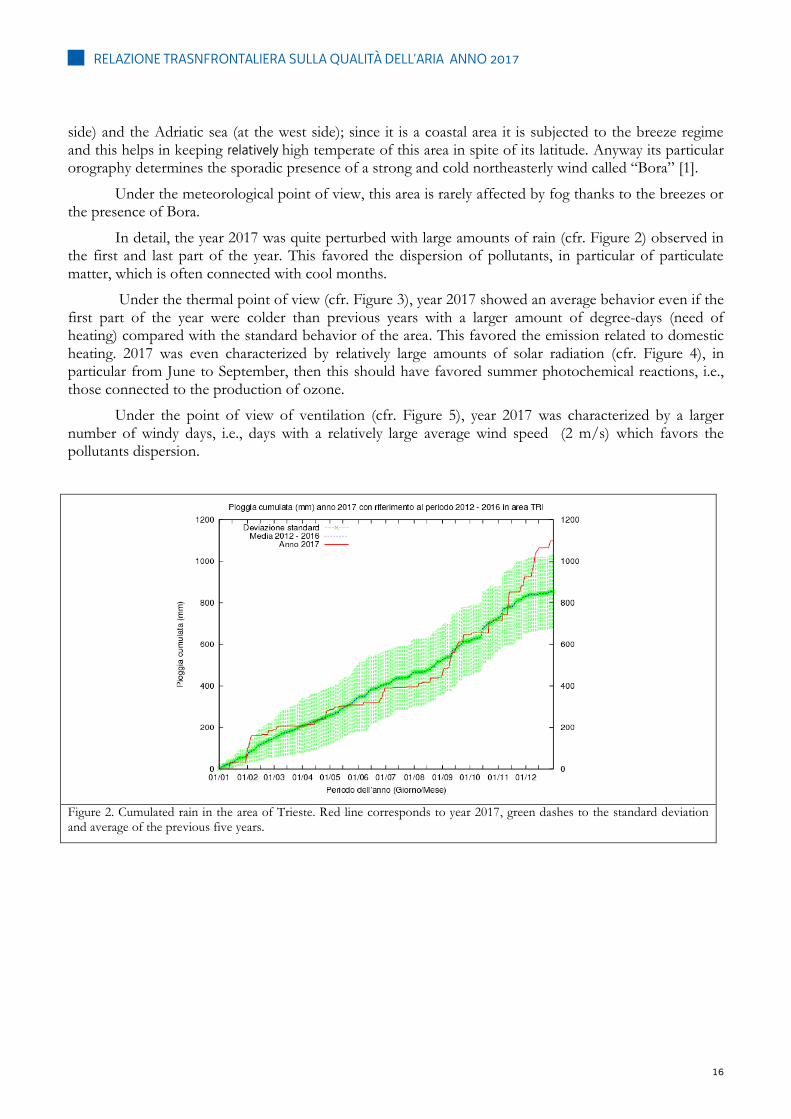
In detail, the year 2017 was quite perturbed with large amounts of rain (cfr. Figure 2) observed in the first and last part of the year. This favored the dispersion of pollutants, in particular of particulate matter, which is often connected with cool months.
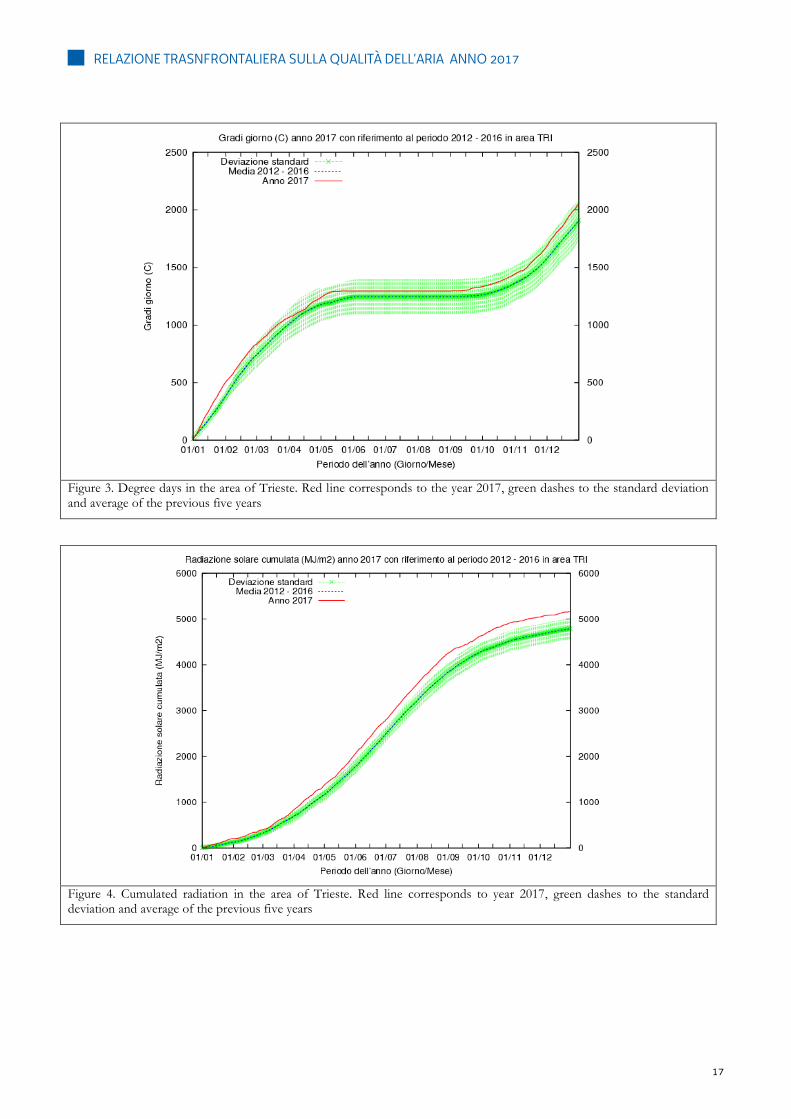
Under the thermal point of view (cfr. Figure 3), year 2017 showed an average behavior even if the first part of the year were colder than previous years with a larger amount of degree-days (need of heating) compared with the standard behavior of the area. This favored the emission related to domestic heating. 2017 was even characterized by relatively large amounts of solar radiation (cfr. Figure 4), in particular from June to September, then this should have favored summer photochemical reactions, i.e., those connected to the production of ozone.
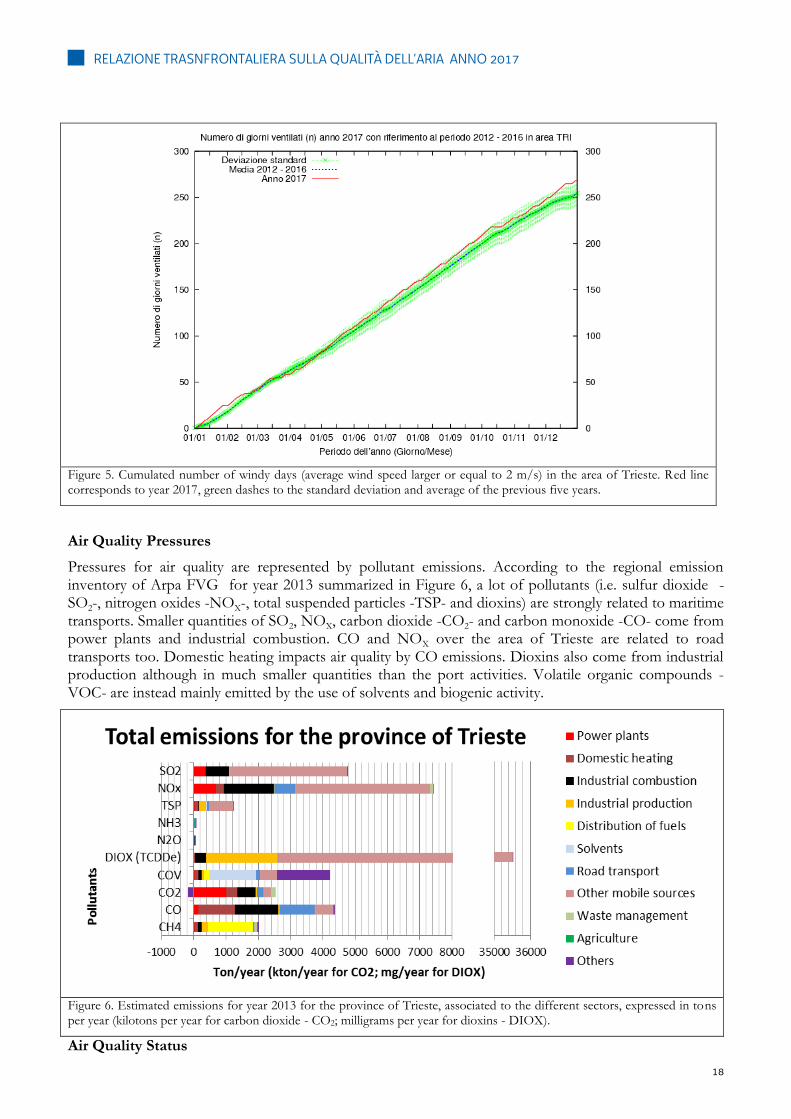
Under the point of view of ventilation (cfr. Figure 5), year 2017 was characterized by a larger number of windy days, i.e., days with a relatively large average wind speed (2 m/s) which favors the pollutants dispersion.
Figure 2. Cumulated rain in the area of Trieste. Red line corresponds to year 2017, green dashes to the standard deviation and average of the previous five years.
RELAZIONE TRASNFRONTALIERA SULLA QUALITÀ DELL’ARIA ANNO 2017
17
Figure 3. Degree days in the area of Trieste. Red line corresponds to the year 2017, green dashes to the standard deviation and average of the previous five years
Figure 4. Cumulated radiation in the area of Trieste. Red line corresponds to year 2017, green dashes to the standard deviation and average of the previous five years
RELAZIONE TRASNFRONTALIERA SULLA QUALITÀ DELL’ARIA ANNO 2017
18
Figure 5. Cumulated number of windy days (average wind speed larger or equal to 2 m/s) in the area of Trieste. Red line corresponds to year 2017, green dashes to the standard deviation and average of the previous five years.
Air Quality Pressures
Pressures for air quality are represented by pollutant emissions. According to the regional emission inventory of Arpa FVG for year 2013 summarized in Figure 6, a lot of pollutants (i.e. sulfur dioxide -SO2-, nitrogen oxides -NOX-, total suspended particles -TSP- and dioxins) are strongly related to maritime transports. Smaller quantities of SO2, NOX, carbon dioxide -CO2- and carbon monoxide -CO- come from power plants and industrial combustion. CO and NOX over the area of Trieste are related to road transports too. Domestic heating impacts air quality by CO emissions. Dioxins also come from industrial production although in much smaller quantities than the port activities. Volatile organic compounds -VOC- are instead mainly emitted by the use of solvents and biogenic activity.
Figure 6. Estimated emissions for year 2013 for the province of Trieste, associated to the different sectors, expressed in tons per year (kilotons per year for carbon dioxide - CO2; milligrams per year for dioxins - DIOX).
Air Quality Status
RELAZIONE TRASNFRONTALIERA SULLA QUALITÀ DELL’ARIA ANNO 2017
19
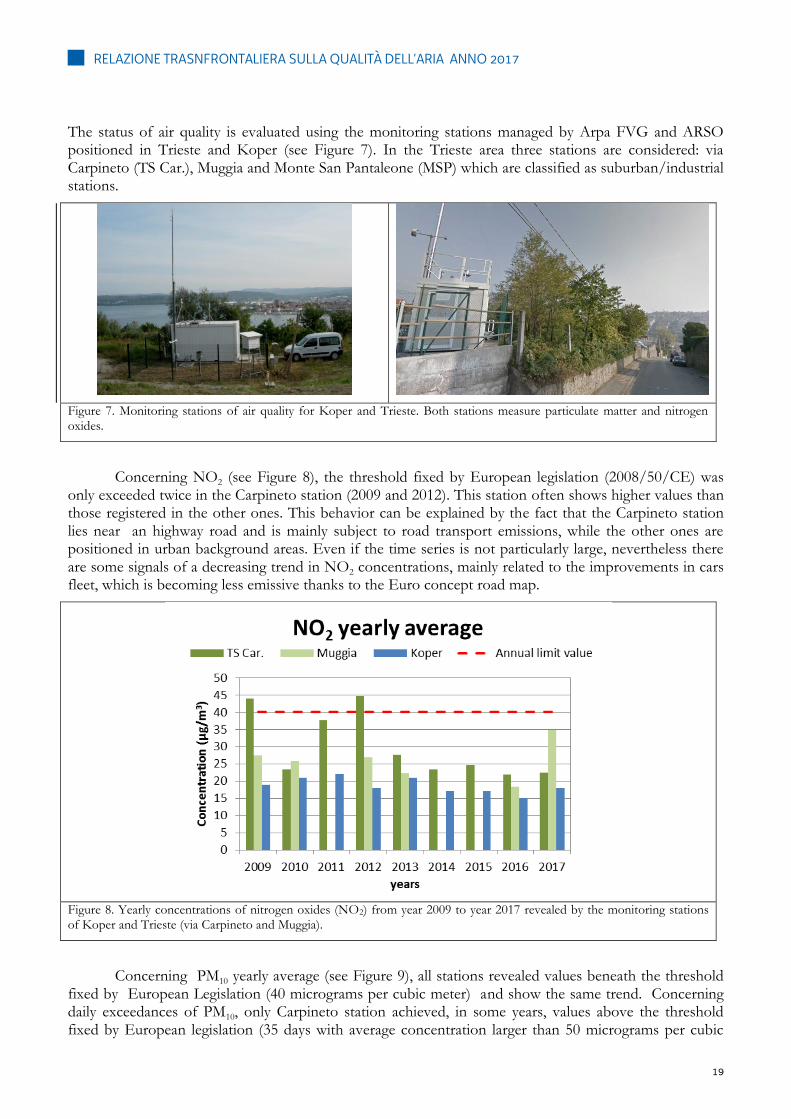
The status of air quality is evaluated using the monitoring stations managed by Arpa FVG and ARSO positioned in Trieste and Koper (see Figure 7). In the Trieste area three stations are considered: via Carpineto (TS Car.), Muggia and Monte San Pantaleone (MSP) which are classified as suburban/industrial stations.
Figure 7. Monitoring stations of air quality for Koper and Trieste. Both stations measure particulate matter and nitrogen oxides.
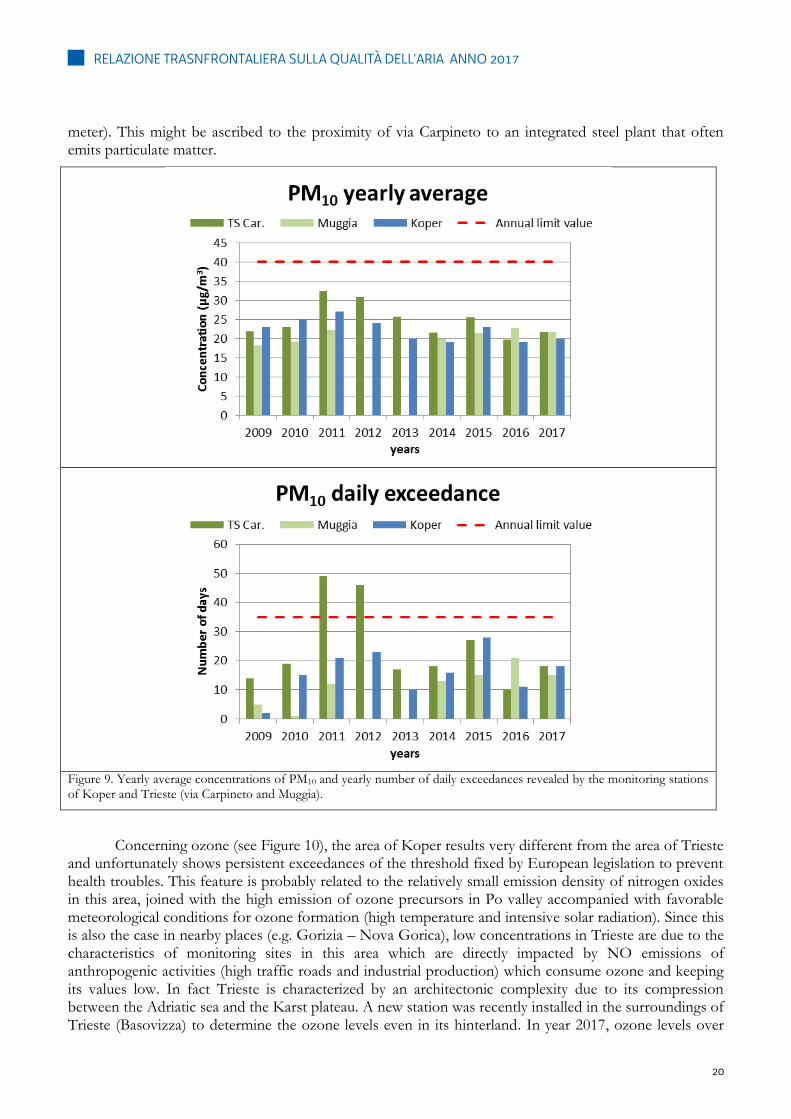
Concerning NO2 (see Figure 8), the threshold fixed by European legislation (2008/50/CE) was only exceeded twice in the Carpineto station (2009 and 2012). This station often shows higher values than those registered in the other ones. This behavior can be explained by the fact that the Carpineto station lies near an highway road and is mainly subject to road transport emissions, while the other ones are positioned in urban background areas. Even if the time series is not particularly large, nevertheless there are some signals of a decreasing trend in NO2 concentrations, mainly related to the improvements in cars fleet, which is becoming less emissive thanks to the Euro concept road map.
Figure 8. Yearly concentrations of nitrogen oxides (NO2) from year 2009 to year 2017 revealed by the monitoring stations of Koper and Trieste (via Carpineto and Muggia).
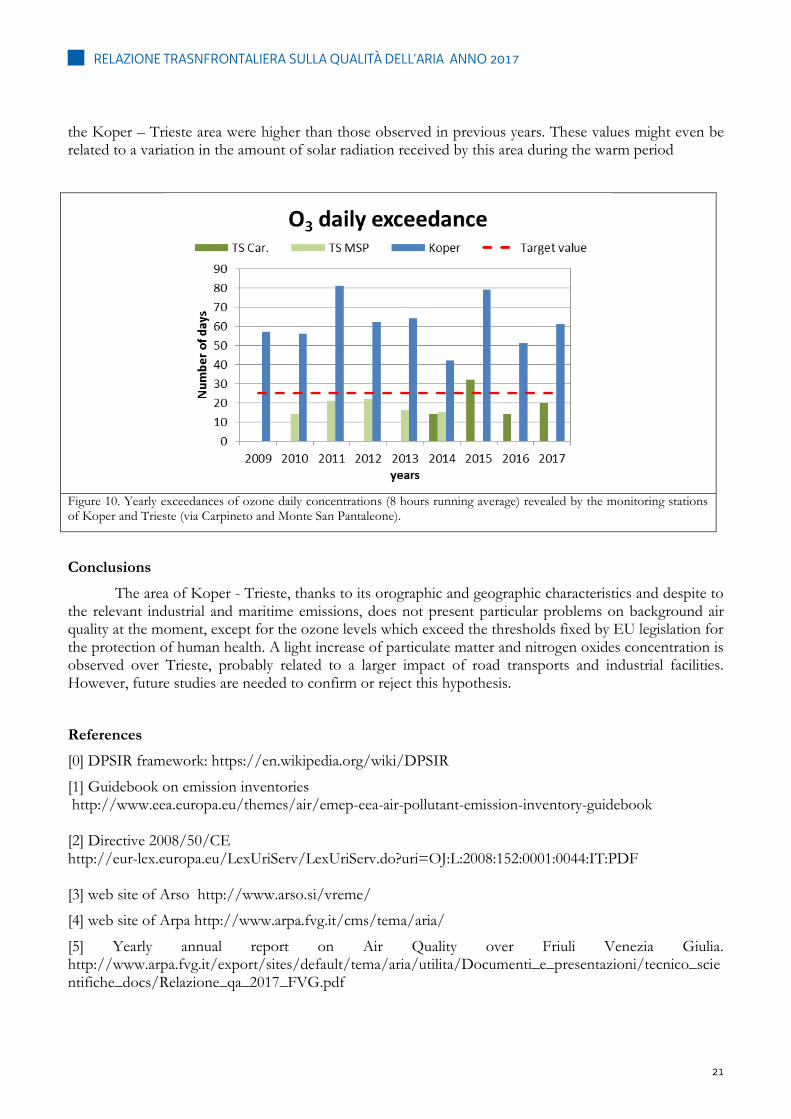
Concerning PM10 yearly average (see Figure 9), all stations revealed values beneath the threshold fixed by European Legislation (40 micrograms per cubic meter) and show the same trend. Concerning daily exceedances of PM10, only Carpineto station achieved, in some years, values above the threshold fixed by European legislation (35 days with average concentration larger than 50 micrograms per cubic
RELAZIONE TRASNFRONTALIERA SULLA QUALITÀ DELL’ARIA ANNO 2017
20
meter). This might be ascribed to the proximity of via Carpineto to an integrated steel plant that often emits particulate matter.
Figure 9. Yearly average concentrations of PM10 and yearly number of daily exceedances revealed by the monitoring stations of Koper and Trieste (via Carpineto and Muggia).
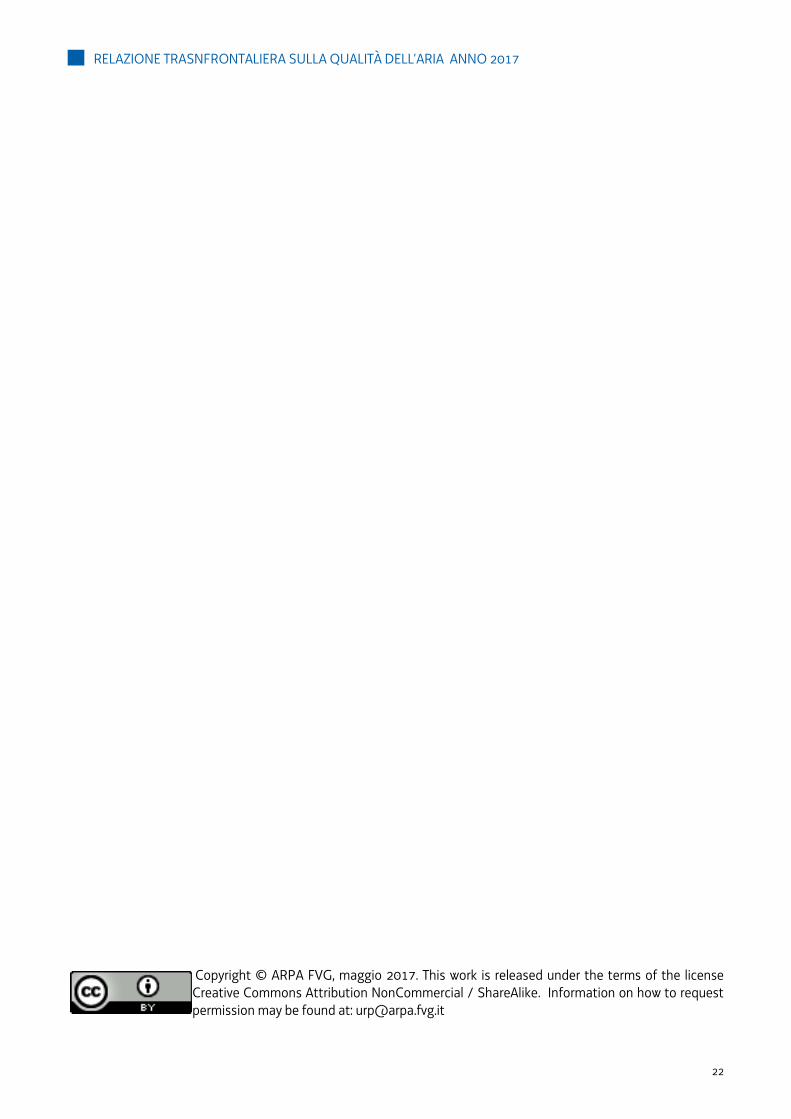
Concerning ozone (see Figure 10), the area of Koper results very different from the area of Trieste and unfortunately shows persistent exceedances of the threshold fixed by European legislation to prevent health troubles. This feature is probably related to the relatively small emission density of nitrogen oxides in this area, joined with the high emission of ozone precursors in Po valley accompanied with favorable meteorological conditions for ozone formation (high temperature and intensive solar radiation). Since this is also the case in nearby places (e.g. Gorizia – Nova Gorica), low concentrations in Trieste are due to the characteristics of monitoring sites in this area which are directly impacted by NO emissions of anthropogenic activities (high traffic roads and industrial production) which consume ozone and keeping its values low. In fact Trieste is characterized by an architectonic complexity due to its compression between the Adriatic sea and the Karst plateau. A new station was recently installed in the surroundings of Trieste (Basovizza) to determine the ozone levels even in its hinterland. In year 2017, ozone levels over
RELAZIONE TRASNFRONTALIERA SULLA QUALITÀ DELL’ARIA ANNO 2017
21
the Koper – Trieste area were higher than those observed in previous years. These values might even be related to a variation in the amount of solar radiation received by this area during the warm period
Figure 10. Yearly exceedances of ozone daily concentrations (8 hours running average) revealed by the monitoring stations of Koper and Trieste (via Carpineto and Monte San Pantaleone).
Conclusions
The area of Koper - Trieste, thanks to its orographic and geographic characteristics and despite to the relevant industrial and maritime emissions, does not present particular problems on background air quality at the moment, except for the ozone levels which exceed the thresholds fixed by EU legislation for the protection of human health. A light increase of particulate matter and nitrogen oxides concentration is observed over Trieste, probably related to a larger impact of road transports and industrial facilities. However, future studies are needed to confirm or reject this hypothesis.
References
[0] DPSIR framework: https://en.wikipedia.org/wiki/DPSIR
[1] Guidebook on emission inventories http://www.eea.europa.eu/themes/air/emep-eea-air-pollutant-emission-inventory-guidebook [2] Directive 2008/50/CE http://eur-lex.europa.eu/LexUriServ/LexUriServ.do?uri=OJ:L:2008:152:0001:0044:IT:PDF [3] web site of Arso http://www.arso.si/vreme/
[4] web site of Arpa http://www.arpa.fvg.it/cms/tema/aria/
[5] Yearly annual report on Air Quality over Friuli Venezia Giulia. http://www.arpa.fvg.it/export/sites/default/tema/aria/utilita/Documenti_e_presentazioni/tecnico_scientifiche_docs/Relazione_qa_2017_FVG.pdf
RELAZIONE TRASNFRONTALIERA SULLA QUALITÀ DELL’ARIA ANNO 2017
22
Copyright © ARPA FVG, maggio 2017. This work is released under the terms of the license Creative Commons Attribution NonCommercial / ShareAlike. Information on how to request permission may be found at: [email protected]


![PROTOCOLLO ITACA 2011 Relazione di calcoloD. Qualità ambiente indoor 20 0,45 E. Qualità del servizio 5 0,23 PRESTAZIONI ASSOLUTE CRITERIO PUNTEGGIO PESO [%] PUNTEGGIO PESATO A. Qualità](https://static.fdocumenti.com/doc/165x107/5f87b01a451e3034680f7ad4/protocollo-itaca-2011-relazione-di-calcolo-d-qualit-ambiente-indoor-20-045-e.jpg)