Primo rapporto sullo stato dei conflitti nella città di Roma
Upload
cavallopazzo55Category
view
17download
5description
Indicatori di sviluppo umano

rapportosullosv iluppoumano2007-2008 2��
Tabelle dell’indice di sviluppo umano
Le tabelle dell’indice di sviluppo umano of-frono una valutazione complessiva dei risultati raggiunti dai paesi in diversi ambiti dello svi-luppo umano. Le tabelle principali sono orga-nizzate per argomenti, come si evince dai loro titoli. Esse includono dati relativi a 175 paesi membri delle Nazioni Unite – quelli per i quali è stato possibile calcolare l’indice di sviluppo umano (isu) – più la Regione amministrativa speciale di Hong Kong della Repubblica po-polare cinese (ras) e i Territori Occupati Pa-lestinesi. A causa della mancanza di dati validi, comparabili a livello internazionale, l’isu non è stato calcolato per i rimanenti 17 stati membri delle Nazioni Unite. In alternativa, per questi paesi è fornita, nella tabella 1a, una serie di indi-catori fondamentali di sviluppo umano.
Nelle tabelle, i paesi e le aree sono classifi-cati in base al loro valore isu. Per individuare un paese all’interno delle tabelle, occorre fare riferimento all’Indice per paesi, riportato al ter-mine del volume, nel quale i paesi sono elencati in ordine alfabetico con la relativa posizione isu. Salvo diversa indicazione, i dati presentati nelle tabelle si riferiscono per la maggior parte al 2005 e sono quelli a disposizione dell’Ufficio per il rapporto sullo sviluppo umano (hdro) alla data del 1° luglio 2007.
Fonti e definizioni
L’hdro è innanzi tutto un utilizzatore, non un produttore di statistiche. Esso si affida ad agenzie internazionali di raccolta dati dotate del mandato, delle risorse e delle competenze necessarie a raccogliere e compilare dati inter-nazionali sulla base di indicatori statistici spe-
cifici. Le fonti per tutti i dati utilizzati nella compilazione delle tabelle degli indicatori sono segnalate sotto forma di brevi citazioni alla fine di ogni tabella. I riferimenti completi sono ri-portati nella sezione Riferimenti statistici. Se un’agenzia fornisce dati provenienti da un’al-tra fonte, nelle note alle tabelle sono citate en-trambe. Tuttavia, se un’agenzia si è basata sulle opere di molte fonti diverse, nella nota è indicata come fonte soltanto l’agenzia stessa. Per garan-tire che tutti i calcoli possano essere facilmente replicati, le note relative alle fonti indicano inol-tre le componenti originali dei dati utilizzati nei calcoli effettuati dall’hdro. Gli indicatori per i quali è possibile fornire definizioni brevi e si-gnificative sono inclusi nella Definizione dei ter-mini statistici. Altre informazioni significative figurano nelle note alla fine di ogni tabella. Per informazioni tecniche più dettagliate riguardo a questi indicatori, si possono consultare i siti internet delle agenzie di raccolta dati perti-nenti, tramite il sito del Rapporto sullo sviluppo umano, http://hdr.undp.org/statistics/.
Incoerenze tra stime nazionali e internazionali
Per elaborare le serie di dati internazionali, spesso le agenzie di raccolta dati applicano norme e procedure di armonizzazione interna-zionali, per rendere più confrontabili i dati tra i diversi paesi. Se i dati internazionali si basano su statistiche nazionali, come avviene di solito, può essere necessario rettificare i dati nazio-nali. Se per un paese non sono disponibili dati, un’agenzia internazionale può produrre una stima basata su altre informazioni pertinenti. Inoltre, date le difficoltà di coordinamento tra agenzie nazionali e internazionali di raccolta dati, le serie di dati internazionali non sempre
Indicazioniperlaletturaenotealletabelle

270 rapportosullosv iluppoumano2007-2008
incorporano i dati nazionali più recenti. Tutti questi fattori possono determinare differenze sostanziali tra stime nazionali e stime interna-zionali.
Il Rapporto ha spesso evidenziato la pre-senza di questo tipo di discrepanze. Allorché sono emerse incongruenze tra i dati, l’hdro ha agevolato i contatti tra autorità statistiche na-zionali e internazionali affinché risolvessero il problema. In molti casi, questo metodo ha mi-gliorato le statistiche presentate nel Rapporto. L’hdro continua a insistere sulla necessità di migliorare la raccolta di dati a livello interna-zionale e svolge un ruolo attivo a sostegno degli sforzi profusi a tal fine; collabora con le agen-zie nazionali e gli organismi internazionali per migliorare la coerenza dei dati, tramite una co-municazione più sistematica e una verifica più efficace della qualità.
Comparabilità nel tempo
A causa di revisioni periodiche dei dati o di modifiche della metodologia, spesso le statisti-che presentate nelle diverse edizioni del Rap-porto non sono confrontabili. Per questo mo-tivo, l’hdro sconsiglia vivamente analisi delle tendenze sulla base dei dati forniti di volta in volta nelle varie edizioni del Rapporto. Analo-gamente, si sconsiglia il confronto tra i valori e le posizioni isu presentati nelle diverse edizioni del Rapporto. Per un’analisi dell’andamento dell’isu basata su dati e metodologia coerenti, fare riferimento alla tabella 2 (Progressione del-l’indice di sviluppo umano).
Classificazione dei paesi
I paesi sono classificati in quattro modi: per li-vello di sviluppo umano, per reddito, per prin-cipali aggregati mondiali e per regione (si veda Classificazione dei paesi). Queste designazioni non esprimono necessariamente un giudizio sullo stadio di sviluppo di un determinato paese o area. Il termine paese nell’accezione usata nel testo e nelle tabelle è riferito a territori o aree.
Classificazione per livello di sviluppo umano. I paesi inclusi nell’isu sono classificati in tre gruppi, sulla base dei risultati raggiunti in ter-
mini di sviluppo umano: sviluppo umano ele-vato (isu pari o superiore a 0,800), sviluppo umano medio (isu compreso tra 0,500 e 0,799) e sviluppo umano basso (isu inferiore a 0,500).
Classificazione per reddito. I paesi sono rag-gruppati in funzione del reddito, secondo le classificazioni della Banca mondiale: reddito elevato (reddito nazionale lordo pro capite pari o superiore a 10 726 dollari nel 2005), reddito medio (876-10 725 dollari) e reddito basso (pari o inferiore a 875 dollari).
Principale classificazione mondiale. I tre gruppi globali sono: paesi in via di sviluppo, Europa centrale e orientale e Comunità di stati indipendenti (csi) e Organizzazione per la coo-perazione e lo sviluppo economico (ocse). Questi gruppi non si escludono a vicenda. (Sostituendo il gruppo ocse con il gruppo ocse a reddito elevato ed escludendo la Corea del Sud si cree-rebbero gruppi che si escludono a vicenda). Se non diversamente specificato, la classificazione mondo rappresenta l’universo dei 194 paesi e aree considerati, cioè i 192 stati membri delle Nazioni Unite più Hong Kong e i Territori Oc-cupati Palestinesi.
Classificazione regionale. I paesi in via di svi-luppo sono ulteriormente suddivisi in regioni: stati arabi, Asia orientale e Pacifico, America La-tina e Caraibi (Messico incluso), Asia meridio-nale, Europa meridionale e Africa subsahariana. Questa classificazione regionale è coerente con gli Uffici regionali del Programma delle Na-zioni Unite per lo sviluppo. Un’ulteriore clas-sificazione è paesi meno sviluppati, secondo la definizione delle Nazioni Unite (un-ohrlls 2007).
Aggregati e tassi di crescita
Aggregati. Gli aggregati per le classificazioni descritte sono presentati alla fine delle tabelle, se ciò ha rilevanza dal punto di vista analitico e se sono disponibili sufficienti dati. Gli aggregati che rappresentano il totale per la classificazione (per esempio per la popolazione) sono contras-segnati da una T. Tutti gli altri aggregati sono medie ponderate.
In generale, per un raggruppamento di paesi si indica un valore aggregato soltanto se sono di-
rapportosullosv iluppoumano2007-2008 271
sponibili dati per almeno la metà dei paesi e se i dati rappresentano almeno i due terzi del peso complessivo del gruppo. L’hdro non integra i dati mancanti allo scopo di aggregarli. Per que-sto motivo, salvo diversa indicazione, i valori aggregati per ogni classificazione rappresentano soltanto i paesi per cui si dispone di dati, si rife-riscono all’anno o al periodo specificato e si ba-sano esclusivamente sui dati forniti dalle fonti principali elencate. In mancanza di adeguate procedure di ponderazione, i valori aggregati non sono riportati.
Gli aggregati per indici, tassi di crescita e in-dicatori che coprono più di un singolo periodo si riferiscono solo ai paesi per cui esistono dati per tutti i periodi compresi nell’intervallo tem-porale. In assenza di valori aggregati per una o più regioni, gli aggregati per la classificazione mondo, che si riferisce soltanto all’universo dei 194 paesi e aree, non sempre sono riportati.
Nel presente Rapporto, gli aggregati non saranno sempre conformi a quelli presentati in altre pubblicazioni, a causa di differenze nella classificazione dei paesi e nella metodologia. Ove indicato, gli aggregati sono calcolati dal-l’agenzia statistica che fornisce i dati per l’in-dicatore.
Tassi di crescita. I tassi di crescita plurien-nali sono espressi in termini di tassi di varia-zione medi annui. Per calcolare i tassi di cre-scita, l’hdro utilizza solo la posizione iniziale e quella finale. I tassi di crescita da un anno all’altro sono espressi in termini di variazione percentuale annua.
Note sui paesi
Salvo diverse indicazioni, i dati relativi alla Cina non comprendono la provincia di Taiwan e le regioni amministrative speciali di Hong Kong e di Macao. Nella maggior parte dei casi, i dati per l’Eritrea precedenti al 1992 sono inclusi nei dati relativi all’Etiopia. Salvo diverse indica-zioni, i dati per la Germania si riferiscono alla Germania unificata. Salvo diverse indicazioni, fino al 1999 i dati per l’Indonesia comprendono Timor Est. I dati relativi alla Giordania non comprendono la Cisgiordania. I dati economici relativi alla Tanzania si riferiscono esclusiva-
mente alla parte continentale del paese. I dati per il Sudan spesso si basano su informazioni relative alla parte settentrionale del paese. Ser-bia e Montenegro sono diventati due stati in-dipendenti nel giugno 2006, ma, in assenza di dati separati per i due stati indipendenti, sono riportati i dati relativi allo stato unitario, con relativa nota di segnalazione. I dati relativi allo Yemen si riferiscono a questo paese a partire dal 1990 in avanti, mentre per gli anni precedenti si riportano i dati aggregati relativi all’ex Repub-blica democratica popolare dello Yemen e all’ex Repubblica araba dello Yemen.
Modifica delle tabelle degli indicatori esistenti e introduzione di nuove tabelle
Quest’anno, sono state modificate alcune tabelle esistenti e ne sono state introdotte tre nuove, per rendere le tabelle degli indicatori più rilevanti ai fini dell’individuazione di politiche specifiche e per legarle al tema del Rapporto di quest’anno. In risposta ad alcune raccomandazioni formu-late nella revisione isg-meg effettuata nel 2006, sono inoltre stati introdotti nuovi indicatori. Di conseguenza, alcune tabelle non corrispondono alle tabelle degli indicatori recanti lo stesso nu-mero nel Rapporto del 2006.
Modifica delle tabelle esistenti
La tabella «Energia e ambiente» (tabella 21 nel Rapporto del 2006) è stata ampliata e sud-divisa in quattro tabelle: «Energia e ambiente» (tabella 22), «Fonti energetiche» (tabella 23), «Emissioni e depositi di anidride carbonica» (tabella 24) e «Stato dei principali trattati am-bientali internazionali» (tabella 25).
Nella tabella «Energia e ambiente» (tabella 22) sono stati introdotti i seguenti nuovi indi-catori:• variazione percentuale dei consumi di elet-
tricità tra il 1990 e il 2004;• tasso di elettrificazione;• persone prive di accesso all’elettricità;• variazione dell’intensità energetica (pil pro
capite per unità di impiego energetico) tra il 1990 e il 2004;

272 rapportosullosv iluppoumano2007-2008
• superficie forestale in percentuale della su-perficie complessiva;
• superficie forestale complessiva nel 2005;• variazione assoluta della superficie fore-
stale tra il 1990 e il 2005;• variazione percentuale media annua della
superficie forestale tra il 1990 e il 2005.Questi indicatori possono essere usati per
verificare i progressi nell’accesso all’energia moderna, per ridurre l’intensità energetica della crescita del pil e per determinare i tassi di deforestazione o di rimboschimento nei di-versi paesi.
La tabella «Fonti energetiche» (tabella 23) è completamente nuova e riporta la quota dell’offerta totale di energia primaria pro-veniente da diverse fonti: combustibili fos-sili (carbone, petrolio e gas naturale), energie rinnovabili (idroelettrica, solare, eolica, geo-termica e da biomasse e rifiuti) e altre fonti (nucleare). Nella tabella figura anche l’offerta totale di energia primaria.
La tabella «Emissioni e depositi di ani-dride carbonica» (tabella 24) raggruppa gli indicatori relativi alle emissioni di co2 prece-dentemente contenuti nella tabella originaria relativa a energia e ambiente e introduce alcuni nuovi indicatori, tra cui:• emissioni totali di co2 e variazione percen-
tuale media annua tra il 1990 e il 2004;• quota per paese delle emissioni mondiali
totali di co2;• emissioni di co2 pro capite (impronta eco-
logica);• emissioni di co2 per unità di impiego ener-
getico (intensità di emissioni dell’energia);• emissioni di co2 per unità di pil (intensità
di emissioni della crescita);• emissioni di co2 da biomasse forestali e de-
positi totali di carbonio nelle foreste.La tabella «Stato dei principali trattati
ambientali internazionali» (tabella 25) amplia l’insieme di trattati ambientali compresi nella tabella originaria relativa a energia e ambiente e li presenta in una tabella distinta.
Nel presente Rapporto, la tabella «Vit-time del crimine» (tabella 23 nel Rapporto del 2006) è stata eliminata, in assenza di una nuova edizione dello Studio internazionale
sulle vittime del crimine, sul quale la tabella si basava dal 2000-2001. È stata sostituita da una tabella relativa a Criminalità e giustizia (ta-bella 27), contenente informazioni su tassi di omicidio, popolazione in carcere e abolizione o mantenimento della pena capitale.
Tabelle introdotte in risposta ad alcune raccomandazioni formulate nella revisione isg-meg
Elaborare statistiche disaggregate per genere e confrontabili tra diversi paesi, per valutare i progressi verso l’eliminazione di tutte le forme di discriminazione nei confronti delle donne e degli uomini, è un’impresa difficile. In risposta ad alcune raccomandazioni formulate nella re-visione isg-meg, si è provveduto a introdurre nuovi indicatori della partecipazione alla forza lavoro, disaggregati per genere, per i paesi non appartenenti all’ocse, e a modificare una ta-bella di indicatori esistente, al fine di fornire maggiori informazioni.
In precedenza, le informazioni sulla disoc-cupazione si riferivano soltanto ai paesi ocse, a causa della mancanza di dati comparabili per altri paesi. La nuova tabella 21, oltre ai dati re-lativi a uomini e donne, contiene dati statistici sulla forza lavoro, quali l’occupazione e la di-soccupazione totale, la distribuzione dell’oc-cupazione per attività economica e i tassi di partecipazione nel settore informale.
La tabella 32, «Genere, carico di lavoro e ripartizione del tempo», è una modifica della tabella 28 del Rapporto del 2006 e fornisce dati sul modo in cui le donne e gli uomini riparti-scono il proprio tempo tra attività di mercato e non di mercato. Le attività non di mercato sono state ulteriormente suddivise, per fornire dati sul tempo che le donne e gli uomini de-dicano quotidianamente alla preparazione dei pasti e alle pulizie, alla cura dei bambini, ad altre attività come la cura personale, e al tempo libero e ad altre attività sociali.
L’hdro continuerà a collaborare con orga-nismi nazionali, regionali e internazionali al fine di migliorare la disponibilità e la qualità dei dati disaggregati per genere.
rapportosullosv iluppoumano2007-2008 273
Conversioni monetarie
In tutto il Rapporto, per le unità monetarie originariamente comunicate in valute diverse dal dollaro, è stato indicato il valore stimato equivalente in dollari. Per le conversioni, sono stati applicati i tassi di cambio del «pe-riodo medio» per l’anno specifico; alle valute per le quali non è specificato l’anno, è stato invece applicato il tasso annuo del «periodo medio» più recente disponibile, indicato nel rapporto International Financial Statistics del Fondo monetario internazionale di set-tembre 2007.
Simboli
In assenza dei termini annuale, tasso annuale o tasso di crescita, un trattino tra due anni, per esempio 1995-2000, indica che i dati sono stati raccolti durante uno degli anni specificati. Una barra tra due anni, per esempio 1998/2001, in-dica un valore medio per gli anni specificati, salvo diversa indicazione. Sono stati usati i se-guenti simboli:
.. Dati non disponibili(.) Maggiore (o minore) di zero, ma abba-
stanza basso da poter essere arrotondato a zero al numero indicato di posizioni decimali
< Minore di— Non applicabileT Totale
Nota alla tabella 1: sull’indice di sviluppo umano di quest’anno
L’indice di sviluppo umano (isu) è un indice composito che misura la media dei risultati ottenuti da un paese in relazione a tre aspetti fondamentali dello sviluppo umano: una vita lunga e sana, l’accesso alla conoscenza e condizioni di vita dignitose. Questi aspetti fondamentali sono rispettivamente misu-rati in base all’aspettativa di vita alla nascita, al tasso di alfabetizzazione degli adulti e al tasso lordo complessivo di scolarità ai livelli di istruzione primario, secondario e terziario, e al prodotto interno lordo (pil) pro capite in
dollari a parità di potere d’acquisto (dollari ppa). L’indice è costruito sulla base di indica-tori disponibili a livello globale, utilizzando una metodologia semplice e trasparente (si veda Nota tecnica 1).
Sebbene il concetto di sviluppo umano sia molto più ampio rispetto a quanto sia in grado di misurare un qualsiasi indice composito, l’isu è una valida alternativa al pil pro capite quale misura sintetica del benessere umano, e rappre-senta un utile «punto di accesso» alle ricche informazioni contenute nelle successive tabelle di indicatori dei diversi aspetti dello sviluppo umano.
La disponibilità di dati determina la copertura isu dei paesi
Nel presente Rapporto, l’isu si riferisce al 2005 e copre 175 stati membri delle Nazioni Unite, più Hong Kong e i Territori Occupati Palestinesi.
Per permettere il confronto tra paesi, l’isu è calcolato, per quanto possibile, sulla base di dati derivanti dalle principali agenzie statisti-che internazionali e disponibili al momento della redazione del Rapporto (si veda qui di seguito Fonti internazionali primarie di dati). Tuttavia, per alcuni paesi, presso tali agenzie non sono disponibili dati relativi a una o più delle quattro componenti dell’isu. Per tale mo-tivo, quest’anno, 17 stati membri delle Nazioni Unite non possono essere inclusi nella classifi-cazione isu: nella tabella 1a, in alternativa, per questi paesi è fornito un insieme di dati isu fon-damentali.
In rarissimi casi, l’hdro ha compiuto ten-tativi specifici per reperire stime presso altre fonti internazionali, regionali o nazionali, al-lorché le agenzie internazionali primarie non disponevano di dati relativi a una o due com-ponenti dell’isu per un paese. In pochissimi casi, l’hdro ha elaborato una propria stima. Le stime provenienti da fonti diverse dalle agen-zie internazionali primarie sono espressamente documentate nelle note alla tabella 1: variano in termini di qualità e attendibilità e non sono presenti in altre tabelle di indicatori che ripor-tano dati analoghi.
274 rapportosullosv iluppoumano2007-2008
Fonti internazionali primarie di dati
Aspettativa di vita alla nascita. Le stime relative all’aspettativa di vita alla nascita sono desunte dalle World Population Prospects 1950-2050: The 2006 Revision (onu 2007e), la fonte uffi-ciale delle stime e proiezioni demografiche delle Nazioni Unite. Il documento è redatto con ca-denza biennale dalla Divisione per la popola-zione (unpd) del Dipartimento per gli affari economici e sociali delle Nazioni Unite, sulla base di dati provenienti dai registri anagrafici nazionali, dai censimenti e dalle indagini de-mografiche.
Nella revisione del 2006, l’unpd ha incor-porato i dati nazionali disponibili sino alla fine del 2006. Per valutare l’impatto dell’hiv/aids, le stime più recenti relative alla diffusione del-l’hiv, preparate dal Programma congiunto delle Nazioni Unite per l’hiv/aids (unaids), sono associate a una serie di ipotesi sulle tendenze de-mografiche e sulla mortalità delle persone, sia infette sia non infette, in ciascuno dei 62 paesi in cui si è proceduto a elaborare un modello del-l’impatto della malattia.
La disponibilità di nuovi dati empirici sul-l’epidemia di hiv/aids e sulle tendenze demo-grafiche spesso richiede un adeguamento delle stime precedenti. Le recenti stime dell’unaids indicano un calo nel tasso di transizione di nuovi individui nel gruppo ad alto rischio. Sulla base di questi e altri fattori, nelle World Population Prospects 1950-2050: The 2006 Re-vision sono state introdotte diverse modifiche metodologiche, che hanno prodotto aumenti significativi nelle stime dell’aspettativa di vita alla nascita relative ad alcuni paesi. In primo luogo, la revisione del 2006 incorpora una so-pravvivenza più lunga per le persone infette che ricevono un trattamento. In secondo luogo, le proiezioni indicano un calo nel tasso di trasmis-sione da madre a figlio, in percentuali che va-riano in funzione dei progressi compiuti in ogni paese per ampliare l’accesso al trattamento. Le stime relative all’aspettativa di vita pubblicate dall’unpd di norma consistono in valori medi quinquennali, sebbene la Divisione produca anche stime annuali, basate sull’interpolazione delle medie quinquennali. Le stime dell’aspetta-
tiva di vita per il 2005 indicate nella tabella 1 e quelle su cui si basa la tabella 2 sono ricavate da tali dati interpolati. Per maggiori informazioni sulle World Population Prospects 1950-2050: The 2006 Revision, si veda www.un.org/esa/po pulation/unpop.htm.
Tasso di alfabetizzazione degli adulti. Nel presente Rapporto, si usano i dati relativi ai tassi di alfabetizzazione degli adulti ricavati dal Censimento di aprile 2007 (unesco Istituto di statistica 2007a) dell’Istituto di statistica (uis) dell’Organizzazione delle Nazioni Unite per l’educazione, la scienza e la cultura (une-sco), il quale associa stime nazionali dirette a stime recenti basate sul suo modello globale per le proiezioni relative all’alfabetizzazione per età, messo a punto nel 2007. Le stime na-zionali, rese disponibili grazie al lavoro mirato dell’uis volto a raccogliere dati recenti sull’alfa-betizzazione presso i vari paesi, sono desunte da censimenti o indagini nazionali condotte tra il 1995 e il 2005. In assenza di stime recenti, si fa ricorso alle precedenti stime dell’uis, elaborate nel luglio 2002 e basate principalmente su dati nazionali raccolti prima del 1995.
Molti paesi a reddito elevato, avendo conse-guito alti livelli di alfabetizzazione, non raccol-gono più statistiche di base sull’alfabetizzazione e non sono quindi inclusi nei dati dell’uis. Nel calcolo dell’isu, per i paesi a reddito elevato che non registrano i dati sull’alfabetizzazione degli adulti, si ipotizza un tasso di alfabetizzazione del 99,0 per cento.
Nella raccolta di dati sull’alfabetizzazione, molti paesi stimano il numero di persone alfa-betizzate sulla base dei dati forniti direttamente dagli interpellati. Alcuni usano i dati relativi al livello di istruzione come indicatore indiretto, ma le misure relative alla frequenza scolastica o al conseguimento di un livello di istruzione possono discordare. Poiché le definizioni e le metodologie di raccolta dati variano da paese a paese, è opportuno fare un uso prudente delle stime relative all’alfabetizzazione.
L’uis, in collaborazione con altri organismi, prosegue il lavoro di messa a punto di una meto-dologia alternativa per la misurazione del livello di alfabetizzazione, il Programma di valutazione e monitoraggio dell’alfabetizzazione (lamp). Il

rapportosullosv iluppoumano2007-2008 27�
lamp mira a spingersi oltre le semplici categorie attuali di «alfabetizzato» e «analfabeta», for-nendo informazioni su uno spettro continuo di competenze alfabetiche. L’auspicio è che i tassi di alfabetizzazione forniti dal lamp producano infine stime più attendibili.
Tasso di scolarità complessivo lordo al livello primario, secondario e terziario. I tassi di sco-larità lordi sono elaborati dall’uis (unesco Istituto di statistica 2007c), sulla base dei dati sulla scolarità raccolti dai governi nazionali (in genere derivano da fonti amministrative) e dei dati demografici tratti dalle World Population Prospects 1950-2040: The 2004 Revision. I tassi sono calcolati dividendo il numero di studenti iscritti ai livelli di istruzione primaria, seconda-ria e terziaria per la popolazione totale nella fa-scia di età teorica corrispondente a tali livelli. Si ipotizza per tutti i paesi che la fascia di età teo-rica per l’istruzione terziaria sia quella dei cin-que anni immediatamente successivi al termine della scuola secondaria superiore.
Benché inteso come indicatore indiretto del livello di istruzione, il tasso di scolarità comples-sivo lordo non riflette la qualità dei risultati nel campo dell’istruzione. Anche quando è usato per rilevare l’accesso alle opportunità di appren-dimento, il tasso di scolarità complessivo lordo può celare importanti differenze tra i vari paesi, a causa delle differenze presenti nell’intervallo di età corrispondente a un livello di istruzione e nella durata dei corsi di studio. Anche la ripeti-zione delle classi e i tassi di abbandono possono falsare i dati. Misure quali la media degli anni di scolarizzazione di una popolazione o l’aspetta-tiva di vita scolastica potrebbero rappresentare in modo più accurato il successo scolastico e idealmente dovrebbero sostituire il tasso di sco-larità lordo nell’isu. Tuttavia, questi dati non sono ancora regolarmente disponibili per un numero sufficiente di paesi.
Secondo la definizione attuale, il tasso di scolarità complessivo lordo misura la scolarità nel paese preso in esame e quindi esclude gli studenti che studiano all’estero dal tasso di sco-larità del paese d’origine. I dati attuali relativi a numerosi paesi di piccole dimensioni, dove è prassi comune frequentare corsi di studio di livello terziario all’estero, potrebbero sottosti-
mare in misura significativa l’accesso all’istru-zione o il successo scolastico della popolazione e determinare così un valore isu inferiore.
pil pro capite (dollari ppa). Nei confronti tra le condizioni di vita presenti nei vari paesi, le statistiche economiche devono essere con-vertite in termini di parità di potere d’acquisto (ppa) per eliminare le differenze tra i prezzi a livello nazionale. Per 168 paesi, i dati relativi al pil pro capite (dollari ppa) per l’isu sono forniti dalla Banca mondiale (Banca mondiale 2007b), sulla base dei dati sui prezzi tratti dalle più recenti indagini dell’International Compa-rison Program (icp) e del pil in valuta locale ricavato dai dati contabili nazionali. L’ultimo ciclo di indagini dell’icp, condotto tra il 1993 e il 1996, ha riguardato 118 paesi, per i quali la ppa è calcolata direttamente per estrapolazione dagli ultimi risultati di riferimento. Per i paesi non rientranti nelle indagini dell’icp, le stime sono ricavate con il metodo della regressione econometrica. Per i paesi non compresi nelle stime della Banca mondiale, si usano le stime della ppa fornite dalle Penn World Tables del-l’Università della Pennsylvania (Heston, Sum-mers e Aten 2006).
Nonostante i notevoli progressi compiuti negli ultimi decenni, l’attuale serie di dati re-lativi alla ppa risente di diversi limiti, tra cui la mancanza di copertura universale, di puntualità dei dati e di uniformità in termini di qualità dei risultati provenienti da diverse regioni e paesi. Per colmare le lacune nella copertura tramite il metodo della regressione econometrica sono ne-cessarie ipotesi molto solide, mentre l’estrapola-zione, nel corso del tempo, implica che i risultati diventano meno attendibili con l’aumentare della distanza tra l’anno di riferimento dell’in-dagine e l’anno in corso. L’importanza della ppa per l’analisi economica evidenzia la necessità di migliorare i dati relativi a questo fattore. È stato lanciato un nuovo ciclo del millennio dell’icp, che promette dati relativi alla ppa di gran lunga migliori per l’analisi della politica economica. La pubblicazione dei primi risultati è attesa per fine 2007 o inizio 2008. Per informazioni in merito all’icp e alla metodologia relativa alla ppa, si veda il sito dell’icp all’indirizzo www.worldbank.org/data/icp.
27� rapportosullosv iluppoumano2007-2008
Confronti nel tempo e tra le diverse edizioni del Rapporto
L’isu è uno strumento importante per moni-torare l’andamento dello sviluppo umano nel lungo periodo. Per agevolare l’analisi delle ten-denze nei vari paesi, l’isu è calcolato a intervalli quinquennali per il periodo 1975-2005. Que-ste stime, presentate nella tabella 2, si basano su una metodologia coerente e su dati tendenziali comparabili, disponibili al momento della ste-sura del Rapporto.
Poiché le agenzie statistiche internazionali provvedono al miglioramento costante delle loro serie di dati, compreso l’aggiornamento perio-dico dei dati storici, le variazioni annuali nei va-lori e nelle classificazioni isu presentate nelle di-verse edizioni del Rapporto sullo sviluppo umano spesso riflettono le revisioni dei dati – sia speci-fiche per un paese sia rispetto ad altri paesi – più che i cambiamenti reali intervenuti in un deter-minato paese. Le variazioni occasionali nella co-pertura dei paesi possono inoltre influenzare la classificazione isu di un paese, anche se si usa una metodologia coerente per calcolare l’isu. Di conseguenza, la posizione isu di un paese può risultare notevolmente inferiore tra due Rap-porti consecutivi, ma, se si usano dati aggiornati e comparabili per ricostruire l’isu relativo agli anni recenti, la posizione e il valore isu di fatto possono rivelare un miglioramento.
Per questi motivi, l’analisi dell’andamento dell’isu non si dovrebbe basare su dati tratti da diverse edizioni del Rapporto. La tabella 2 fornisce informazioni aggiornate sull’anda-mento dell’isu, basate su dati e metodologia coerenti.
L’isu per i paesi a sviluppo umano elevato
Nel presente Rapporto, l’isu è costruito al fine di confrontare i risultati dei vari paesi in rela-zione con tutti gli aspetti fondamentali dello sviluppo umano. Gli indicatori scelti non sono quindi necessariamente quelli più adatti a evidenziare le distinzioni tra i paesi ricchi. Gli indicatori attualmente usati nell’indice producono differenze minime tra i paesi con l’isu più elevato e quindi le posizioni alte della classificazione isu spesso riflettono solo diffe-renze esigue negli indicatori di base. Per i paesi ad alto reddito, un indice alternativo – l’in-dice di povertà umana, riportato nella tabella 4 – può fornire una migliore misura delle pri-vazioni ancora esistenti tra le popolazioni di questi paesi e contribuire a orientare le politi-che pubbliche.
Per maggiori informazioni sull’uso e sui li-miti dell’isu e degli indicatori che lo compon-gono, si veda il sito http://hdr.undo-org/stati stics.
rapportosullosv iluppoumano2007-2008 277
acronimieabbreviazioni
aie Agenzia internazionale per l’energiaaus Assistenza ufficiale allo sviluppocas Comitato per l’assistenza allo sviluppo (ocse)cdiac Centro di analisi delle informazioni
sull’anidride carbonica del dipartimento dell’Energia degli Stati Uniti
co2 Anidride carbonicaco2e Anidride carbonica equivalentecsi Comunità di stati indipendentidhs Demographic and Health Surveysdots Trattamento di breve durata sotto sorveglianza
diretta [metodo di individuazione e cura della tubercolosi]
em-dat Banca dati internazionale per le catastrofifao Organizzazione per l’alimentazione e
l’agricolturagco2/km grammi per chilometrogt Gigatonnellata (un miliardo di tonnellate)gwh Gigawatt all’orahdro Ufficio per il Rapporto sullo sviluppo umanohiv/aids Virus dell’immunodeficienza umana/
Sindrome da immunodeficienza acquisitaials Indagine internazionale sull’alfabetizzazione
degli adultiicps Centro internazionale di studi sul carcereicse Classificazione internazionale tipo della
posizione nella professioneidmc Centro di monitoraggio sugli sfollati interniiiss International Institute of Strategic Studiesilolex Banca dati dell’oil sulle norme internazionali
del lavoroipu-1 Indice di povertà umana (per i paesi in via di
sviluppo)ipu-2 Indice di povertà umana (per i paesi ocse,
dell’Europa centrale e orientale e della csi)isced Classificazione internazionale tipo
dell’istruzioneisco Classificazione internazionale tipo delle
occupazioniisg Indice di sviluppo di genereisic Classificazione internazionale tipo, per
industrie, di tutti i rami di attività economicheisu Indice di sviluppo umanokgpe Chilogrammi di petrolio equivalentelis Luxembourg Income Studies
meg Misura dell’empowerment di generemics Multiple Indicator Cluster Surveysmt Megatonnellata (un milione di tonnellate)mw Megawattocse Organizzazione per la cooperazione e lo
sviluppo economicooil Organizzazione internazionale del lavorooms Organizzazione mondiale della sanitàonu Organizzazione delle Nazioni Uniteosm Obiettivi di sviluppo del millenniopil Prodotto interno lordoppa Parità di potere d’acquistor&s Ricerca e svilupporas Regione amministrativa speciale (Cina)rnl Reddito nazionale lordosipri Istituto internazionale di ricerca sulla pace
di Stoccolmasitc Classificazione tipo del commercio
internazionaletfyr Ex repubblica jugoslava (di Macedonia)tsl Tasso di scolarità lordouip Unione interparlamentareuit Unione internazionale delle telecomunicazioniunaids Programma congiunto delle Nazioni Unite per
l’hiv/aidsunctad Conferenza delle Nazioni Unite per il
commercio e lo sviluppoundp Programma delle Nazioni Unite per lo
sviluppounesco Organizzazione delle Nazioni Unite per
l’educazione, la scienza e la culturaunfpa Fondo delle Nazioni Unite per le attività
demograficheunhcr Alto commissariato delle Nazioni Unite per
i rifugiatiunicef Fondo delle Nazioni Unite per l’infanziaunodc Ufficio delle Nazioni Unite contro la droga e
il crimineun-orhlls Ufficio delle Nazioni Unite dell’alto
rappresentante per i paesi meno sviluppati, i paesi in via di sviluppo senza sbocco sul mare e i piccoli stati insulari in via di sviluppo
wipo Organizzazione mondiale della proprietà intellettuale

Avvertenza dell’editore
I tempi ristretti imposti alla traduzione dall’uscita contemporanea in tutto il mondo del Rapporto impediscono di ricomporre la traduzione degli indicatori e delle relative note all’interno delle tabelle che compaiono nella ricca sezione compresa tra la pagina 287 e la pagina 412 del Rapporto sullo sviluppo umano 2007-2008.
Come ogni anno tuttavia di ogni indicatore forniamo la traduzione a parte, al fine di rispettare l’esigenza dei lettori italiani di comprendere con precisione gli studi, i dati, le statistiche e i loro fondamenti: la corrispondenza dei termini inglesi con quelli italiani si trova alle pp. 279-286.
Anche i nomi delle singole nazioni rimangono esposti in inglese nelle tabelle, ma il corrispondente italiano è tradotto nell’indice alfabetico dei paesi di p. 436: il numero chiave posto accanto a ciascun paese esprime la sua posizione nella gradu-atoria dell’Indice di Sviluppo Umano (isu) che compare nelle tabelle.
rapportosullosv iluppoumano2007-2008 27�
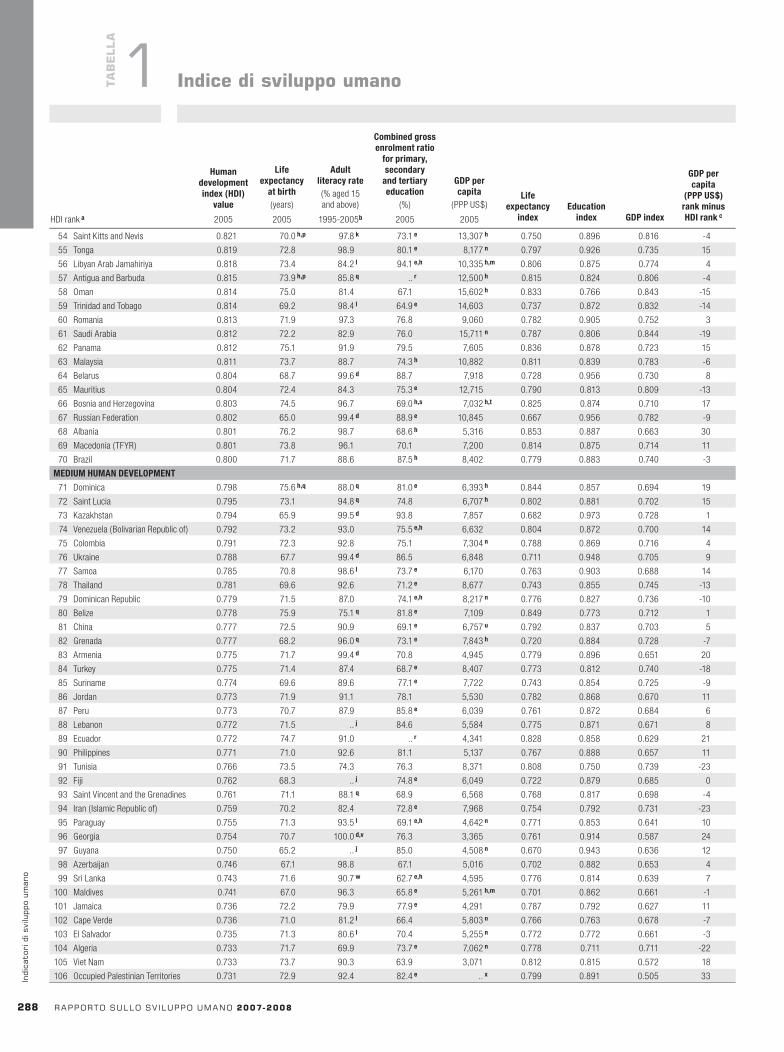
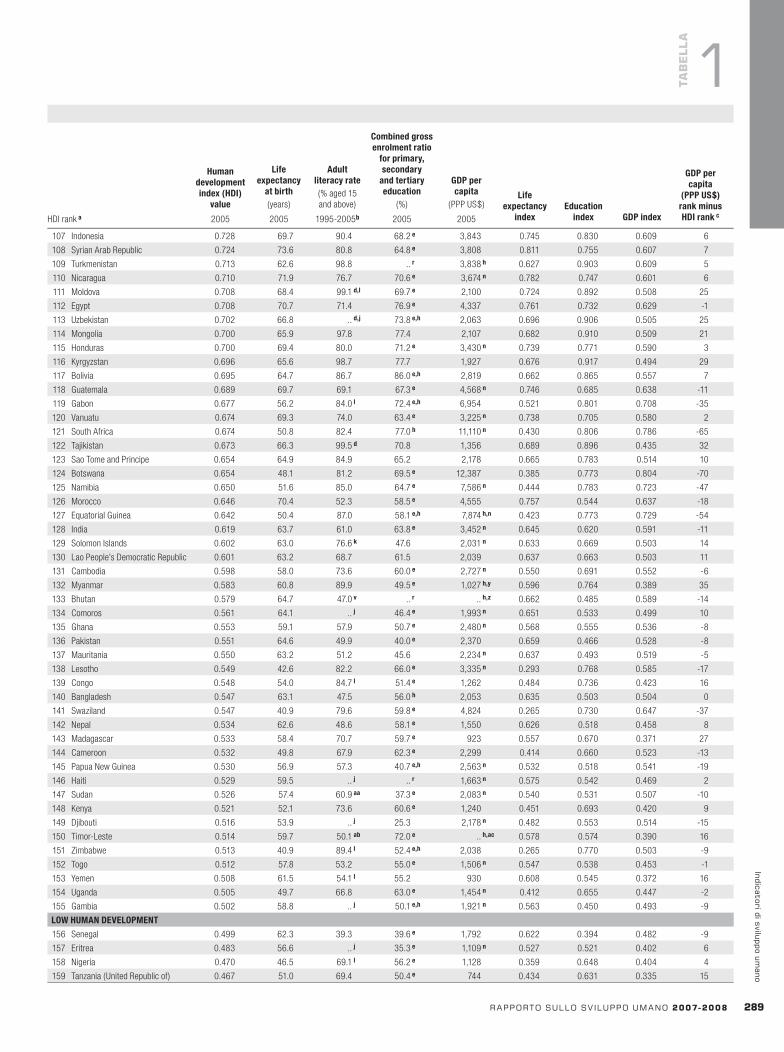
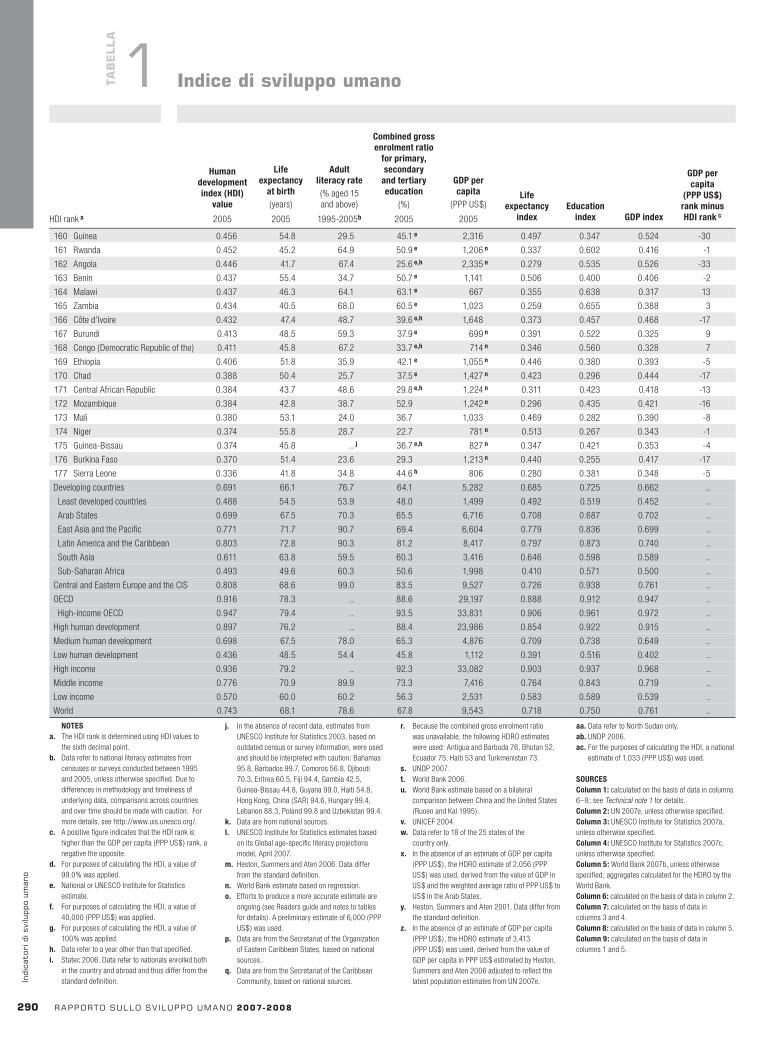
1. Indicedisviluppoumano 287Human development index(hdi)value / Valore dell’indice di sviluppo umano(isu)Life expectancy at birth (years) / Aspettativa di vita alla nascita (anni)Adult literacy rate (% aged 15 and above) / Tasso di alfabetizzazione degli adulti (% dai 15 anni in su)Combined gross enrolment ratio for primary, secondary and tertiary education (%) / Tasso di scolarità complessivo lordo al livello primario, secondario e terziario (%)gdp per capita (ppp us$) / pil pro capite (dollari ppa)Life expectancy index / Indice di aspettativa di vitaEducation index / Indice di istruzionegdpindex / Indice del pil
gdpper capita(pppus$)rank minushdi rank / Posizione pilpro capite (dollari ppa) meno posizione isu
1a.Indicatoriessenzialiperaltripaesimembridell’ONU 291Human development index components / Componenti dell’indice di sviluppo umanoLife expectancy at birth (years) / Aspettativa di vita alla nascita (anni)Adult literacy rate(% aged 15 and above) / Tasso di alfabetizzazione degli adulti (% dai 15 anni in su)Combined gross enrolment ratio for primary, secondary and tertiary education(%) / Tasso di scolarità complessivo lordo al livello primario, secondario e terziario (%)gdp per capita (ppp us$) / pil pro capite (dollari ppa)Total population (thousands) / Popolazione totale (migliaia)Total fertility rate (births per woman) / Tasso di fertilità totale (parti per donna)mdgUnder-five mortality rate (per 1,000 live births) / osmTasso di mortalità sotto i 5 anni di età (ogni 1000 nati vivi)mdgNet primary enrolment rate (%) / osmTasso di scolarità netto al livello primario (%)hiv prevalence (% aged 15-49) / Diffusione dell’hiv(% 15-49 anni d’età)mdgPopulation undernourished (% of total population) / osmPersone malnutrite (% della popolazione totale)mdgPopulation using an improved water source (%) / osmPopolazione che usa una fonte idrica migliorata (%)
2. Progressionedell’indicedisviluppoumano 292
3. Povertàumanaedireddito:paesiinviadisviluppo 296Human poverty index (hpi-1) / Indice di povertà umana (ipu-1)Rank / PosizioneValue (%) / Valore (%)Probability at birth of not surviving to age 40(% of cohort) / Probabilità alla nascita di non sopravvivere fino a 40 anni d’età (% della coorte)Adult illiteracy rate (% aged 15 and older) / Tasso di analfabetismo degli adulti (% dai 15 anni in su)Population not using an improved water source (%) / Popolazione che non usa una fonte idrica migliorata (%)mdgChildren underweight for age (% under age 5) / osmBambini sottopeso rispetto all’età (% sotto i 5 anni d’età) mdgPopulation below income poverty line / osmPopolazione al di sotto della linea di povertà $ 1 a day / 1 dollaro al giorno$ 2 a day / 2 dollari al giornoNational poverty line / Linea di povertà nazionalehpi-1 rank minus income poverty rank / Posizione ipu-1 meno posizione povertà di reddito
4. Povertàumanaedireddito:OCSE,Europacentro-orientaleeCSI 299Human poverty index (hpi-2) / Indice di povertà umana (ipu-2)
Indicedelletabelle
280 rapportosullosv iluppoumano2007-2008
Rank / PosizioneValue (%) / Valore (%)Probability at birth of not surviving to age 60 (% of cohort) / Probabilità alla nascita di non sopravvivere fino a 60 anni (% della coorte)Population lacking functional literacy skills (% aged 16-65) / Persone prive di abilità funzionali di lettura e di scrittura (% 16-65 anni d’età)Long-term unemployment (as % of labour force) / Disoccupazione di lungo periodo (in % della forza lavoro)Population below income poverty line / Popolazione al di sotto della linea di povertà50% of median income / 50% del reddito mediano$11 a day / 11 dollari al giorno$4 dollar a day / 4 dollari al giornohpi-2 rank minus income poverty line rank / Posizione ipu-2 meno posizione povertà di reddito
5. Andamentidemografici 301Total population (millions) / Popolazione totale (milioni)Annual population growth rate (%) / Tasso di crescita annuo della popolazione (%)Urban population (% of total) / Popolazione urbana (% del totale)Population under age 15 (% of total) / Popolazione di età inferiore ai 15 anni (% del totale)Population aged 65 and above (% of total) / Popolazione di età pari o superiore a 65 anni (% del totale)Total fertility rate (births per woman) / Tasso di fertilità totale (parti per donna)
6. Impegnonelcampodellasanità:risorse,accessoeservizi 305Health expenditure / Spesa sanitariaPublic (% of gdp) / Pubblica (% del pil)Private (% of gdp) / Privata (% del pil)Per capita (pppus$) / Pro capite (dollari ppa)mdg One-year olds fully immunized / osm Bambini di un anno vaccinatiAgainst tuberculosis (%) / Contro la tubercolosi (%) Against measles (%) / Contro il morbillo (%)Children with diarrhoea receiving horal rehydration and continued feeding (% under age 5) / Bambini affetti da diarrea che ricevono la terapia di reidratazione orale e alimentazione continua (% sotto i 5 anni d’età)mdgContraceptive prevalence rate (% of married women ages 15-49) / osmTasso di diffusione della contraccezione (% delle donne sposate di 15-49 anni d’età)mdgBirths attended by skilled health personnel (%) / osmParti assistiti da personale sanitario qualificato (%)Physicians (per 100,000 people) / Medici (ogni 100 000 individui)
7. Acqua,serviziigienico-sanitariestatonutrizionale 309mdgPopulation using improved sanitation (%) / osmPopolazione che usa servizi igienico-sanitari migliorati (%)mdgPopulation using an improved water source (%) / osmPopolazione che usa una fonte idrica migliorata (%)mdgPopulation undernourished (% of total population) / osmPersone malnutrite (% della popolazione totale)mdgChildren under weight for age (% of children under age 5) / osmBambini sottopeso rispetto all’età (% sotto i 5 anni d’età)Children under height for age (% of children under age 5) / Bambini di statura troppo bassa rispetto all’età (% sotto i 5 anni d’età)Infants with low birthweight (%) / Neonati con un basso peso alla nascita (%)
8. Disuguaglianzenelcampodellasalutematernaeinfantile 313Survey year / Anno dell’indagineBirths attended by skilled health personal (%) / Parti assistiti da personale sanitario qualificato (%) Poorest 20% / 20% più poveroRichest 20% / 20% più riccoOne-year-olds fully immunized (%) / Bambini di un anno vaccinati (%)Poorest 20% / 20% più poveroRichest 20% / 20% più riccoChildren under height for age (% under age 5) / Bambini di statura troppo bassa rispetto all’età (% di età inferiore ai 5 anni)Poorest 20% / 20% più poveroRichest 20% / 20% più riccoInfant mortality rate (per 1,000 live births) / Tasso di mortalità infantile (ogni 1000 nati vivi)Under-five mortality rate (per 1,000 live births) / Tasso di mortalità sotto i 5 anni di età (ogni 1000 nati vivi)
9. Principalicrisierischisanitariglobali 315
rapportosullosv iluppoumano2007-2008 281
hiv prevalence (% aged 15-49) / Diffusione dell’hiv(% 15-49 anni d’età)mdgCondom use at last high-risk sex (% ages 15-24) / osm Tasso di utilizzo del preservativo durante l’ultimo rapporto sessuale ad alto rischio (% 15-24 anni d’età)Women / DonneMen / UominimdgAntimalarial measures/osm Misure antimalaricheUse of insecticide-treated bednets (% of children under five) / Uso di letti dotati di zanzariere trattate con insetticida (% dei bambini di età inferiore ai 5 anni)Fevers treated with antimalarial drugs (% of children under five) / Febbri curate con farmaci antimalarici (% dei bambini di età inferiore ai 5 anni)mdgTuberculosis cases / osm Casi di tubercolosiPrevalence (per 100,000 people) / Diffusione (ogni 100 000 individui).Detected under dots(%) / Individuati con la strategia dots(%)Cured under dots(%) / Trattati con la strategia dots(%)Prevalence of smoking (% of adults) / Diffusione del fumo (% degli adulti)Women / DonneMen / Uomini
10.Sopravvivenza:progressiearretramenti 319Life expectancy at birth (years) / Aspettativa di vita alla nascita (anni)mdg Infant mortality rate (per 1,000 live births) / osm Tasso di mortalità infantile (ogni 1000 nati vivi)mdg Under-five mortality rate (per 1,000 live births) / osm Tasso di mortalità sotto i 5 anni d’età (ogni 1000 nati vivi)Probability at birth of surviving to age 65 (% of cohort) / Probabilità alla nascita di sopravvivere fino a 65 anni (% della coorte)Female / DonneMale / Uominimdg Maternal mortality ratio (per 100,000 live births) / osm Tasso di mortalità materna (ogni 100 000 nati vivi)Reported / DichiaratoAdjusted / Rettificato
11.Impegnonelcampodell’istruzione:spesapubblica 323Public expenditure on education as a % of gdp / Spesa pubblica per l’istruzione in % del pil
Public expenditure on education as a % of total government expenditure / Spesa pubblica per l’istruzione in % della spesa pubblica totaleCurrent public expenditure on education by level (% of total current public expenditure on education) / Spesa pubblica corrente per l’istruzione suddivisa per livello (in % sul totale della spesa pubblica corrente per l’istruzione)Pre-primary and primary / Preprimario e primarioSecondary and post-secondary non-tertiary / Secondario e postsecondario (non terziario)Tertiary / Terziario
12.Alfabetizzazioneescolarità 327Adult literacy rate (% aged 15 and older) / Tasso di alfabetizzazione degli adulti (% dai 15 anni in su)mdg Youth literacy rate (% aged 15-24) / osm Tasso di alfabetizzazione dei giovani (% 15-24 anni d’età)mdg Net primary enrolment rate (%) / osm Tasso di scolarità netto al livello primario (%)Net secondary enrolment rate (%) / Tasso di scolarità netto al livello secondario (%)mdg Children reaching grade 5 (% of grade 1 cohort) / osm Bambini che raggiungono la classe V (% della coorte della classe I)Tertiary students in science, engineering, manufacturing and construction (% of tertiary students) / Studenti di livello terziario iscritti a facoltà scientifiche, ingegneristiche, manifatturiere e delle costruzioni (% degli studenti di livello terziario)
13.Tecnologia:diffusioneecreazione 331mdg Telephone mainlines (per 1,000 people) / osm Linee telefoniche principali (ogni 1000 individui)mdg Cellular subscribers (per 1,000 people) / osm Abbonati a servizi di telefonia mobile (ogni 1000 individui)mdg Internet users (per 1,000 people) / osm Utenti di Internet (ogni 1000 individui)Patents granted to residents (per million people) / Brevetti concessi ai residenti (ogni milione di individui)Receipts of royalties and license fees (us$ per person) / Entrate da royalties e diritti di licenza (dollari per individuo)Research and development (r&d) expenditures (% of gdp) / Spese per ricerca e sviluppo (r&s) (% del pil)Researchers in r&d (per million people) / Ricercatori impegnati nella r&s (ogni milione di individui)
14.Andamentodell’economia 335gdpus$ billions/pil miliardi di dollarigdppppus$ billions/pil miliardi di dollari ppa
gdpper capita / pil pro capite
282 rapportosullosv iluppoumano2007-2008
us$ / dollari2005 pppus$ / dollari ppa 2005annual growth rate (%) / Tasso di crescita annuo (%)Highest value during 1975-2005 (2005 pppus$) / Massimo valore nel 1975-2005 (dollari ppa 2005)Year of highest value / Anno di massimo valore Average annual change in consumer price index (%) / Variazione media annua dell’indice dei prezzi al consumo (%)
15.Disuguaglianzadiredditoediconsumo 339Survey year / Anno dell’indaginemdg Share of income or expenditure (%) / osm Quota di reddito o di consumo (%)Poorest 10% / 10% più poveroPoorest 20% / 20% più poveroRichest 20% / 20% più riccoRichest 10% / 10% più riccoInequality measures / Misure di disuguaglianzaRichest 10% to poorest 10% / Rapporto tra il 10% più ricco e il 10% più poveroRichest 20% to poorest 20% / Rapporto tra il 20% più ricco e il 20% più poveroGini index / Indice di Gini
16.Strutturadelcommercio 343Imports of goods and services (% of gdp) / Importazioni di beni e servizi (% del pil)Exports of goods and services (% of gdp) / Esportazioni di beni e servizi (% del pil)Primary exports (% of merchandise exports) / Esportazioni di prodotti primari (% delle esportazioni di merci)Manufactured exports (% of merchandise exports) / Esportazioni di prodotti lavorati (% delle esportazioni di merci)High technology exports (% of manufactured exports) / Esportazioni di prodotti ad alta tecnologia (% delle esportazioni di prodotti lavorati)Terms of trade / Termini di scambio
17.SpeseperaiutideipaesiCAS/OCSE 347mdgNet official development assistance(oda)disbursed, total (us$millions) / osm Assistenza ufficiale allo sviluppo (aus) netta elargitaTotale (milioni di dollari)As % of gni / In % dell’rnl
oda per capita of donor country (2005 us$) / aus pro capite del paese donatore (dollari 2005)mdgoda to least developed countries (% of total) / osm aus per i paesi meno sviluppati (% del totale)mdgodato basic social services (% of total allocable by sector) / osmausa favore dei servizi sociali di base (% del totale ripartibile per settore)mdgUntied bilateral oda(%of total) / osmausbilaterale non vincolata (% del totale)
18.Flussidiaiuti,capitaleprivatoedebito 348Official development assistance (oda) received (net disbursements) / Assistenza ufficiale allo sviluppo (aus) ricevuta (esborsi netti)Total (us$ millions) / Totale (milioni di dollari)Per capita (us$) / Pro capite (dollari)As % of gdp / In % del pil
Net foreign direct investment inflows (% of gdp) / Flussi netti d’investimenti esteri diretti (% del pil)Other private flows (% of gdp) / Altri flussi privati (% del pil)mdgTotal debt service / osmservizio del debito totaleAs % of gdp/In % del pil
As % exports of goods, services and net income from abroad / In % delle esportazioni di beni, servizi ed entrate nette dall’estero
19.Prioritànellaspesapubblica 352Public expenditure on health (% of gdp) / Spesa pubblica per la sanità (% del pil)Public expenditure on education (% of gdp) / Spesa pubblica per l’istruzione (% del pil)Military expenditure (% of gdp) / Spese militari (% del pil)Total debt service (% of gdp) / Servizio del debito totale (% del pil)
20.DisoccupazioneneipaesiOCSE 356Unemployed people (thousands) / Disoccupati (migliaia)Unemployment rate / Tasso di disoccupazione
rapportosullosv iluppoumano2007-2008 283
Total (% of labour force) / Totale (% della forza lavoro)Average annual (% of labour force) / Medio annuo (% della forza lavoro)Female (% of male rate) / Femminile (in % di quello maschile)mdgYouth unemployment rate / osmTasso di disoccupazione giovanileTotal (% of labour force aged 15-24) / Totale (% della forza lavoro di 15-24 anni d’età)female (% of male rate) / Femminile (in % di quello maschile)Long-term unemployment (% of total unemployment) / Disoccupazione di lungo periodo (% della disoccupazione totale)Women / DonneMen / Uomini
21.DisoccupazioneeoccupazionenelsettoreinformaleneipaesinonOCSE 357Unemployed people (thousands) / Disoccupati (migliaia)Unemployment rate / Tasso di disoccupazioneTotal (% of labour force) / Totale (in % della forza lavoro)Female (% of male rate) / Femminile (in % di quello maschile)Employment by economic activity / Occupazione per attività economicaTotal (thousands) / Totale (migliaia)Agricolture (%) / Agricoltura (%)Industry (%) / Industria (%)Services (%) / Servizi (%)Employment in informal sector as a % of non-agricultural employment / Occupazione nel settore informale in % dell’occupazione in settori diversi dall’agricolturaSurvey year / Anno dell’indagineBoth sexes (%) / Entrambi i sessi (%)Female (%) / Femminile (%)Male (%) / Maschile (%)
22.Energiaeambiente 360Electricity consumption per capita / Consumo pro capite di elettricità(kilowatt-hours) / (kilowattora)(% change) / (variazione %)Electrification rate (%) / Tasso di elettrificazione (%)Population without electricity (millions) / Persone prive di accesso all’elettricità (milioni)gdp per unit of energy use / Intensità energetica(pilper unità di impiego energetico)(2000 pppus$ per kg of oil equivalent) / (dollari ppa 2000 per kg di petrolio equivalente)(% change) / (variazione %)Forest area / Superficie forestale% of total land area / % della superficie complessivaTotal (thousand sq km) / Totale (migliaia di km2)Total change (thousand sq km) / Variazione totale (migliaia di km2)Average annual change (%) / Variazione media annua (%)
23.Fontienergetiche 364Total primary energy supply (mt of oil equivalent) / Offerta di energia primaria totale (mt di petrolio equivalente)Share of TPES / Quota dell’offerta di energia primaria complessivaFossil fuels / Combustibili fossiliCoal (%) / Carbone (%)Oil (%) / Petrolio (%)Natural gas (%) / Gas naturale (%)Renewable energy / Energie rinnovabiliHydro, solar, wind and geothermal (%) / Energia elettrica, solare, eolica e geotermica (%)Biomass and waste (%) / Biomasse e rifiuti (%)Other / Altri tipi di energiaNuclear (%) / Nucleare (%)
24.Emissioniedepositidianidridecarbonica 368Carbon dioxide emissions / Emissioni di anidride carbonicaTotal (mt co2) / Totali (mtco2)
284 rapportosullosv iluppoumano2007-2008
Annual change (%) / Variazione annua (%)Share of world total (%) / Quota sul totale mondiale (%)Per capita (t co2) / Pro capite (tco2)Carbon intensity of energy – co2 emissions per unit of energy use (kt of co2 per kt of oil equivalent) / Intensità di emissioni dell’energia – emissioni di co2 per unità di impiego energetico (kt di co2 per kt di petrolio equivalente)Carbon intensity of growth – co2 emissions per unit of gdp (kt of co2 per million 2000 ppp us$) / Intensità di emissioni della crescita – emissioni di co2 per unità di pil(kt di co2 per milione di dollari 2000 ppa)Carbon dioxide emissions from forest biomass (mt co2 / year) / Emissioni di anidride carbonica da biomasse forestali (mtco2 / anno)Carbon stocks in forest biomass (mt carbon) / Depositi di carbonio in biomasse forestali (mt di carbonio)
25.Statodeiprincipalitrattatiambientaliinternazionali 372Cartagena Protocol on Biosafety / Protocollo di Cartagena sulla biosicurezzaFramework Convention on Climate Change / Convenzione quadro sui cambiamenti climaticiKyoto Protocol to the Framework Convention on Climate Change / Protocollo di Kyoto sulla Convenzione quadro sui cambiamenti climaticiConvention on Biological Diversity / Convenzione sulla diversità biologicaVienna Convention for the Protection of the Ozone Layer / Convenzione di Vienna per la protezione dello strato d’ozonoMontreal Protocol on Substances that deplete the Ozone Layer / Protocollo di Montréal sulle sostanze che riducono lo strato di ozonoStockholm Convention on Persistent Organic Pollutants / Convenzione di Stoccolma sugli inquinanti organici persistentiConvention on the Law of the Sea / Convenzione sul diritto del mareConvention to Combat Desertification / Convenzione per la lotta contro la desertificazione
26.Rifugiatiearmamenti 376Internally displaced people (thousands) / Profughi interni (migliaia)Refugees / Rifugiati By country of asylum (thousands) / Per paese d’asilo (migliaia)By country of origin (thousands) / Per paese d’origine (migliaia)Conventional arms transfers (1990 prices) / Trasferimenti di armi convenzionali (prezzi del 1990)Imports (us$ millions) / Importazioni (milioni di dollari)Exports / Esportazionius$ millions / Milioni di dollariShare / QuotaTotal armed forces / Forze armate totaliThousands / MigliaiaIndex (1985 = 100) / Indice (1985 = 100)
27.Criminalitàegiustizia 380Intentional homicides (per 100,000 people) / Omicidi intenzionali (ogni 100 000 individui) Prison population / Popolazione carcerariaTotal / Totale(Per 100,000 people) / (Ogni 100 000 individui)Female (% of total) / Femminile (% del totale) Year in which countries have partially or completely abolished the death penalty / Anno in cui i paesi hanno abolito la pena di morte, parzialmente o completamente
28.Indicedisviluppodigenere 384Gender-related development index (gdi) / Indice di sviluppo di genere (isg)Rank / PosizioneValue / ValoreLife expectancy at birth (years) / Aspettativa di vita alla nascita (anni)Female / DonneMale / UominiAdult literacy rate (% aged 15 and older) / Tasso di alfabetizzazione degli adulti (% dai 15 anni in su)Female / DonneMale / UominiCombined gross enrolment ratio for primary, secondary and tertiary education (%) / Tasso di scolarità complessivo lordo al livello primario, secondario e terziario (%)Female / DonneMale / Uomini
rapportosullosv iluppoumano2007-2008 28�
Estimated earned income (pppus$) / Reddito da lavoro stimato (dollari ppa)Female / DonneMale / Uominihdi rank minus gdi rank / Posizione isu meno posizione isg
29.Misuradell’empowermentdigenere 388Gender empowerment measure (gem) / Misura dell’empowerment di genere (meg)Rank / PosizioneValue / Valoremdg Seats in parliament held by women (% of total) / osmSeggi parlamentari occupati da donne (% del totale)Female legislators, senior officials and managers (% of total) / Legislatori, alti funzionari e dirigenti donne (% del totale)Femal professional and technical workers (% of total) / Lavoratori professionali e tecnici donne (% del totale)Ratio of estimated female to male earned income / Rapporto tra il reddito stimato percepito dalle donne e quello percepito dagli uomini
30.Disuguaglianzadigenerenell’istruzione 392Adult literacy / Alfabetizzazione degli adultiFemale rate (% aged 15 and older) / Donne (% dai 15 anni in su)Ratio of female rate to male rate / Rapporto tra tasso maschile e tasso femminilemdgYouth literacy / osm Alfabetizzazione dei giovaniFemale rate (% aged 15-24) / Donne (% 15-24 anni d’età)Ratio of female rate to male rate / Rapporto tra tasso maschile e tasso femminileNet primary enrolment / Tasso di scolarità netto al livello primarioFemale rate (%) / Donne (%)Ratio of female rate to male rate / Rapporto tra tasso maschile e tasso femminilemdgGross primary enrolment / osm Tasso di scolarità complessivo lordo al livello primarioFemale ratio (%) / Donne (%) Ratio of female rate to male rate / Rapporto tra tasso maschile e tasso femminilemdgGross secondary enrolment / osm Tasso di scolarità complessivo lordo al livello secondario Female ratio (%) / Donne (%) Ratio of female rate to male rate / Rapporto tra tasso maschile e tasso femminilemdgGross tertiary enrolment / osm Tasso di scolarità complessivo lordo al livello terziarioFemale ratio (%) / Donne (%) Ratio of female rate to male rate / Rapporto tra tasso maschile e tasso femminile
31.Disuguaglianzadigenerenell’attivitàeconomica 396Female economic activity (ages 15 and older) / Attività economica femminile (dai 15 anni in su)Rate (%) / Tasso (%)Index / IndiceAs % of male rate / In % del tasso maschileEmployment by economic activity (%) / Occupazione per attività economica (%)Agriculture / AgricolturaWomen / DonneMen / UominiIndustry / IndustriaWomen / DonneMen / UominiServices / ServiziWomen / DonneMen / UominiContributing family workers (%) / Coadiuvanti di attività economiche familiari (%)Women / DonneMen / Uomini
32.Genere,caricodilavoroeripartizionedeltempo 400Year / AnnoTotal work in market and nonmarket activities (hours and minutes per day) / Lavoro totale in attività di mercato e non di mercato (ore e minuti al giorno)Women / Donne
28� rapportosullosv iluppoumano2007-2008
Men / UominiMarket activities (as % of total work time) / Attività di mercato (in % del tempo di lavoro totale)Women / DonneMen / UominiSpecific nonmarket activities / Attività non di mercato specificheCooking and cleaning (hours and minutes per day) / Preparazione dei pasti e pulizia (ore e minuti al giorno)Women / DonneMen / UominiCare of children (hours and minutes per day) / Assistenza ai bambini (ore e minuti al giorno)Women / DonneMen / UominiOther activities / Altre attivitàFree time (hours and minutes per day) / Tempo libero (ore e minuti al giorno)Women / DonneMen / UominiPersonal care (hours and minutes per day) / Cura personale (ore e minuti al giorno)Women / DonneMen / Uomini
33.Partecipazionepoliticadelledonne 401Year women received right / Anno in cui le donne hanno ottenuto il dirittoTo vote / Di votareTo stand for election / Di candidarsi alle elezioniYear first woman elected (E) or appointed (A) to parliament / Anno in cui è stata eletta (E) o nominata (A) in parlamento la prima donnaWomen in government at ministerial level (% of total) / Donne che ricoprono incarichi ministeriali nel governo (% del totale)mdg Seats in parliament held by women (% of total) / osm Seggi parlamentari occupati da donne (% del totale)Lower or single house / Camera bassa o unicaupper house or senate / Camera alta o senato
34.Statodeiprincipalistrumentiinternazionaliperlatuteladeidirittiumani 405International Convention on the Prevention and Punishment of the Crime of Genocide / Convenzione internazionale sulla prevenzione e la punizione del delitto di genocidioInternational Convention on the Elimination of All Forms of Racial Discrimination / Convenzione internazionale per l’eliminazione di tutte le forme di discriminazione razzialeInternational Covenant on Civil and Political Rights / Patto internazionale sui diritti civili e politiciInternational Covenant on Economic, Social and Cultural Rights / Patto internazionale sui diritti economici, sociali e culturaliConvention on the Elimination of All Forms of Discrimination Against Women / Convenzione sull’eliminazione di tutte le forme di discriminazione a danno delle donneConvention Against Torture and Other Cruel, Inhuman or Degrading Treatment or Punishment / Convenzione contro la tortura e altri trattamenti o pene crudeli, inumani o degradantiConvention on the Rights of the Child / Convenzione sui diritti dell’infanzia
35.Statodelleconvenzionifondamentalisuidirittideilavoratori 409Freedom of association and collective bargaining / Libertà di associazione e contrattazione collettivaConvention 87 / Convenzione 87Convention 98 / Convenzione 98Elimination of forced and compulsory labour / Eliminazione del lavoro forzato e obbligatorioConvention 29 / Convenzione 29Convention 105 / Convenzione 105Elimination of discrimination in respect of employment and occupation / Eliminazione della discriminazione nell’occupazione e nella professioneConvention 100 / Convenzione 100Convention 111 / Convenzione 111Abolition of child labour / Abolizione del lavoro minorileConvention 138 / Convenzione 138Convention 182 / Convenzione 182

HDI ranka
Humandevelopmentindex(HDI)
value
Lifeexpectancy
atbirth(years)
Adultliteracyrate(% aged 15 and above)
Combinedgrossenrolmentratio
forprimary,secondary
andtertiaryeducation
(%)
GDPpercapita
(PPP US$)Life
expectancyindex
Educationindex GDPindex
GDPpercapita
(PPPUS$)rankminusHDIrankc2005 2005 1995-2005b 2005 2005
rapportosullosv iluppoumano2007-2008 287
indicatoridisviluppoumano
TaB
ELLa
1 Monitorarelosviluppoumano:accrescerelescelteindividuali…
Indicedisviluppoumano
HIGHHUMANDEVELOPMENT
1 Iceland 0.968 81.5 ..d 95.4e 36,510 0.941 0.978 0.985 4
2 Norway 0.968 79.8 ..d 99.2 41,420f 0.913 0.991 1.000 1
3 Australia 0.962 80.9 ..d 113.0g 31,794 0.931 0.993 0.962 13
4 Canada 0.961 80.3 ..d 99.2e,h 33,375 0.921 0.991 0.970 6
5 Ireland 0.959 78.4 ..d 99.9 38,505 0.890 0.993 0.994 -1
6 Sweden 0.956 80.5 ..d 95.3 32,525 0.925 0.978 0.965 7
7 Switzerland 0.955 81.3 ..d 85.7 35,633 0.938 0.946 0.981 -1
8 Japan 0.953 82.3 ..d 85.9 31,267 0.954 0.946 0.959 9
9 Netherlands 0.953 79.2 ..d 98.4 32,684 0.904 0.988 0.966 3
10 France 0.952 80.2 ..d 96.5 30,386 0.919 0.982 0.954 8
11 Finland 0.952 78.9 ..d 101.0g 32,153 0.898 0.993 0.964 3
12 United States 0.951 77.9 ..d 93.3 41,890f 0.881 0.971 1.000 -10
13 Spain 0.949 80.5 ..d 98.0 27,169 0.925 0.987 0.935 11
14 Denmark 0.949 77.9 ..d 102.7g 33,973 0.881 0.993 0.973 -6
15 Austria 0.948 79.4 ..d 91.9 33,700 0.907 0.966 0.971 -6
16 United Kingdom 0.946 79.0 ..d 93.0e 33,238 0.900 0.970 0.969 -5
17 Belgium 0.946 78.8 ..d 95.1 32,119 0.897 0.977 0.963 -2
18 Luxembourg 0.944 78.4 ..d 84.7i 60,228f 0.891 0.942 1.000 -17
19 New Zealand 0.943 79.8 ..d 108.4g 24,996 0.913 0.993 0.922 9
20 Italy 0.941 80.3 98.4 90.6 28,529 0.922 0.958 0.944 1
21 Hong Kong, China (SAR) 0.937 81.9 ..j 76.3 34,833 0.949 0.885 0.977 -14
22 Germany 0.935 79.1 ..d 88.0e 29,461 0.902 0.953 0.949 -2
23 Israel 0.932 80.3 97.1k 89.6 25,864 0.921 0.946 0.927 3
24 Greece 0.926 78.9 96.0 99.0 23,381 0.898 0.970 0.910 5
25 Singapore 0.922 79.4 92.5 87.3h,k 29,663 0.907 0.908 0.950 -6
26 Korea (Republic of) 0.921 77.9 ..d 96.0 22,029 0.882 0.980 0.900 6
27 Slovenia 0.917 77.4 99.7d,l 94.3 22,273 0.874 0.974 0.902 4
28 Cyprus 0.903 79.0 96.8 77.6e 22,699h 0.900 0.904 0.905 2
29 Portugal 0.897 77.7 93.8l 89.8 20,410 0.879 0.925 0.888 6
30 Brunei Darussalam 0.894 76.7 92.7 77.7 28,161h,m 0.862 0.877 0.941 -8
31 Barbados 0.892 76.6 ..d,j 88.9h 17,297h,m 0.861 0.956 0.860 8
32 Czech Republic 0.891 75.9 ..d 82.9 20,538 0.849 0.936 0.889 2
33 Kuwait 0.891 77.3 93.3 74.9 26,321n 0.871 0.871 0.930 -8
34 Malta 0.878 79.1 87.9 80.9 19,189 0.901 0.856 0.877 2
35 Qatar 0.875 75.0 89.0 77.7 27,664h,m 0.834 0.852 0.938 -12
36 Hungary 0.874 72.9 ..d,j 89.3 17,887 0.799 0.958 0.866 2
37 Poland 0.870 75.2 ..d,j 87.2 13,847 0.836 0.951 0.823 11
38 Argentina 0.869 74.8 97.2 89.7h 14,280 0.831 0.947 0.828 9
39 United Arab Emirates 0.868 78.3 88.7l 59.9e,h 25,514n 0.889 0.791 0.925 -12
40 Chile 0.867 78.3 95.7 82.9 12,027 0.889 0.914 0.799 15
41 Bahrain 0.866 75.2 86.5 86.1 21,482 0.837 0.864 0.896 -8
42 Slovakia 0.863 74.2 ..d 78.3 15,871 0.821 0.921 0.846 -1
43 Lithuania 0.862 72.5 99.6d 91.4 14,494 0.792 0.965 0.831 3
44 Estonia 0.860 71.2 99.8d 92.4 15,478 0.770 0.968 0.842 0
45 Latvia 0.855 72.0 99.7d 90.2 13,646 0.784 0.961 0.821 4
46 Uruguay 0.852 75.9 96.8 88.9e,h 9,962 0.848 0.942 0.768 16
47 Croatia 0.850 75.3 98.1 73.5h 13,042 0.839 0.899 0.813 4
48 Costa Rica 0.846 78.5 94.9 73.0e 10,180n 0.891 0.876 0.772 13
49 Bahamas 0.845 72.3 ..j 70.8 18,380h 0.789 0.875 0.870 -12
50 Seychelles 0.843 72.7h,k 91.8 82.2e 16,106 0.795 0.886 0.848 -10
51 Cuba 0.838 77.7 99.8d 87.6 6,000o 0.879 0.952 0.683 43
52 Mexico 0.829 75.6 91.6 75.6 10,751 0.843 0.863 0.781 7
53 Bulgaria 0.824 72.7 98.2 81.5 9,032 0.795 0.926 0.752 11
HDI ranka
Humandevelopmentindex(HDI)
value
Lifeexpectancy
atbirth(years)
Adultliteracyrate(% aged 15 and above)
Combinedgrossenrolmentratio
forprimary,secondary
andtertiaryeducation
(%)
GDPpercapita
(PPP US$)Life
expectancyindex
Educationindex GDPindex
GDPpercapita
(PPPUS$)rankminusHDIrankc2005 2005 1995-2005b 2005 2005 HDI ranka
Humandevelopmentindex(HDI)
value
Lifeexpectancy
atbirth(years)
Adultliteracyrate(% aged 15 and above)
Combinedgrossenrolmentratio
forprimary,secondary
andtertiaryeducation
(%)
GDPpercapita
(PPP US$)Life
expectancyindex
Educationindex GDPindex
GDPpercapita
(PPPUS$)rankminusHDIrankc2005 2005 1995-2005b 2005 2005
288 rapportosullosv iluppoumano2007-2008
indi
cato
rid
isvi
lupp
oum
ano
TaB
ELLa
1
54 Saint Kitts and Nevis 0.821 70.0h,p 97.8k 73.1e 13,307h 0.750 0.896 0.816 -4
55 Tonga 0.819 72.8 98.9 80.1e 8,177n 0.797 0.926 0.735 15
56 Libyan Arab Jamahiriya 0.818 73.4 84.2l 94.1e,h 10,335h,m 0.806 0.875 0.774 4
57 Antigua and Barbuda 0.815 73.9h,p 85.8q ..r 12,500h 0.815 0.824 0.806 -4
58 Oman 0.814 75.0 81.4 67.1 15,602h 0.833 0.766 0.843 -15
59 Trinidad and Tobago 0.814 69.2 98.4l 64.9e 14,603 0.737 0.872 0.832 -14
60 Romania 0.813 71.9 97.3 76.8 9,060 0.782 0.905 0.752 3
61 Saudi Arabia 0.812 72.2 82.9 76.0 15,711n 0.787 0.806 0.844 -19
62 Panama 0.812 75.1 91.9 79.5 7,605 0.836 0.878 0.723 15
63 Malaysia 0.811 73.7 88.7 74.3h 10,882 0.811 0.839 0.783 -6
64 Belarus 0.804 68.7 99.6d 88.7 7,918 0.728 0.956 0.730 8
65 Mauritius 0.804 72.4 84.3 75.3e 12,715 0.790 0.813 0.809 -13
66 Bosnia and Herzegovina 0.803 74.5 96.7 69.0h,s 7,032h,t 0.825 0.874 0.710 17
67 Russian Federation 0.802 65.0 99.4d 88.9e 10,845 0.667 0.956 0.782 -9
68 Albania 0.801 76.2 98.7 68.6h 5,316 0.853 0.887 0.663 30
69 Macedonia (TFYR) 0.801 73.8 96.1 70.1 7,200 0.814 0.875 0.714 11
70 Brazil 0.800 71.7 88.6 87.5h 8,402 0.779 0.883 0.740 -3
MEDIUMHUMANDEVELOPMENT
71 Dominica 0.798 75.6h,q 88.0q 81.0e 6,393h 0.844 0.857 0.694 19
72 Saint Lucia 0.795 73.1 94.8q 74.8 6,707h 0.802 0.881 0.702 15
73 Kazakhstan 0.794 65.9 99.5d 93.8 7,857 0.682 0.973 0.728 1
74 Venezuela (Bolivarian Republic of) 0.792 73.2 93.0 75.5e,h 6,632 0.804 0.872 0.700 14
75 Colombia 0.791 72.3 92.8 75.1 7,304n 0.788 0.869 0.716 4
76 Ukraine 0.788 67.7 99.4d 86.5 6,848 0.711 0.948 0.705 9
77 Samoa 0.785 70.8 98.6l 73.7e 6,170 0.763 0.903 0.688 14
78 Thailand 0.781 69.6 92.6 71.2e 8,677 0.743 0.855 0.745 -13
79 Dominican Republic 0.779 71.5 87.0 74.1e,h 8,217n 0.776 0.827 0.736 -10
80 Belize 0.778 75.9 75.1q 81.8e 7,109 0.849 0.773 0.712 1
81 China 0.777 72.5 90.9 69.1e 6,757u 0.792 0.837 0.703 5
82 Grenada 0.777 68.2 96.0q 73.1e 7,843h 0.720 0.884 0.728 -7
83 Armenia 0.775 71.7 99.4d 70.8 4,945 0.779 0.896 0.651 20
84 Turkey 0.775 71.4 87.4 68.7e 8,407 0.773 0.812 0.740 -18
85 Suriname 0.774 69.6 89.6 77.1e 7,722 0.743 0.854 0.725 -9
86 Jordan 0.773 71.9 91.1 78.1 5,530 0.782 0.868 0.670 11
87 Peru 0.773 70.7 87.9 85.8e 6,039 0.761 0.872 0.684 6
88 Lebanon 0.772 71.5 ..j 84.6 5,584 0.775 0.871 0.671 8
89 Ecuador 0.772 74.7 91.0 ..r 4,341 0.828 0.858 0.629 21
90 Philippines 0.771 71.0 92.6 81.1 5,137 0.767 0.888 0.657 11
91 Tunisia 0.766 73.5 74.3 76.3 8,371 0.808 0.750 0.739 -23
92 Fiji 0.762 68.3 ..j 74.8e 6,049 0.722 0.879 0.685 0
93 Saint Vincent and the Grenadines 0.761 71.1 88.1q 68.9 6,568 0.768 0.817 0.698 -4
94 Iran ( Islamic Republic of) 0.759 70.2 82.4 72.8e 7,968 0.754 0.792 0.731 -23
95 Paraguay 0.755 71.3 93.5l 69.1e,h 4,642n 0.771 0.853 0.641 10
96 Georgia 0.754 70.7 100.0d,v 76.3 3,365 0.761 0.914 0.587 24
97 Guyana 0.750 65.2 ..j 85.0 4,508n 0.670 0.943 0.636 12
98 Azerbaijan 0.746 67.1 98.8 67.1 5,016 0.702 0.882 0.653 4
99 Sri Lanka 0.743 71.6 90.7w 62.7e,h 4,595 0.776 0.814 0.639 7
100 Maldives 0.741 67.0 96.3 65.8e 5,261h,m 0.701 0.862 0.661 -1
101 Jamaica 0.736 72.2 79.9 77.9e 4,291 0.787 0.792 0.627 11
102 Cape Verde 0.736 71.0 81.2l 66.4 5,803n 0.766 0.763 0.678 -7
103 El Salvador 0.735 71.3 80.6l 70.4 5,255n 0.772 0.772 0.661 -3
104 Algeria 0.733 71.7 69.9 73.7e 7,062n 0.778 0.711 0.711 -22
105 Viet Nam 0.733 73.7 90.3 63.9 3,071 0.812 0.815 0.572 18
106 Occupied Palestinian Territories 0.731 72.9 92.4 82.4e ..x 0.799 0.891 0.505 33
Indicedisviluppoumano
HDI ranka
Humandevelopmentindex(HDI)
value
Lifeexpectancy
atbirth(years)
Adultliteracyrate(% aged 15 and above)
Combinedgrossenrolmentratio
forprimary,secondary
andtertiaryeducation
(%)
GDPpercapita
(PPP US$)Life
expectancyindex
Educationindex GDPindex
GDPpercapita
(PPPUS$)rankminusHDIrankc2005 2005 1995-2005b 2005 2005
rapportosullosv iluppoumano2007-2008 28�
indicatoridisviluppoumano
TaB
ELLa
1
107 Indonesia 0.728 69.7 90.4 68.2e 3,843 0.745 0.830 0.609 6
108 Syrian Arab Republic 0.724 73.6 80.8 64.8e 3,808 0.811 0.755 0.607 7
109 Turkmenistan 0.713 62.6 98.8 ..r 3,838h 0.627 0.903 0.609 5
110 Nicaragua 0.710 71.9 76.7 70.6e 3,674n 0.782 0.747 0.601 6
111 Moldova 0.708 68.4 99.1d,l 69.7e 2,100 0.724 0.892 0.508 25
112 Egypt 0.708 70.7 71.4 76.9e 4,337 0.761 0.732 0.629 -1
113 Uzbekistan 0.702 66.8 ..d,j 73.8e,h 2,063 0.696 0.906 0.505 25
114 Mongolia 0.700 65.9 97.8 77.4 2,107 0.682 0.910 0.509 21
115 Honduras 0.700 69.4 80.0 71.2e 3,430n 0.739 0.771 0.590 3
116 Kyrgyzstan 0.696 65.6 98.7 77.7 1,927 0.676 0.917 0.494 29
117 Bolivia 0.695 64.7 86.7 86.0e,h 2,819 0.662 0.865 0.557 7
118 Guatemala 0.689 69.7 69.1 67.3e 4,568n 0.746 0.685 0.638 -11
119 Gabon 0.677 56.2 84.0l 72.4e,h 6,954 0.521 0.801 0.708 -35
120 Vanuatu 0.674 69.3 74.0 63.4e 3,225n 0.738 0.705 0.580 2
121 South Africa 0.674 50.8 82.4 77.0h 11,110n 0.430 0.806 0.786 -65
122 Tajikistan 0.673 66.3 99.5d 70.8 1,356 0.689 0.896 0.435 32
123 Sao Tome and Principe 0.654 64.9 84.9 65.2 2,178 0.665 0.783 0.514 10
124 Botswana 0.654 48.1 81.2 69.5e 12,387 0.385 0.773 0.804 -70
125 Namibia 0.650 51.6 85.0 64.7e 7,586n 0.444 0.783 0.723 -47
126 Morocco 0.646 70.4 52.3 58.5e 4,555 0.757 0.544 0.637 -18
127 Equatorial Guinea 0.642 50.4 87.0 58.1e,h 7,874h,n 0.423 0.773 0.729 -54
128 India 0.619 63.7 61.0 63.8e 3,452n 0.645 0.620 0.591 -11
129 Solomon Islands 0.602 63.0 76.6k 47.6 2,031n 0.633 0.669 0.503 14
130 Lao People’s Democratic Republic 0.601 63.2 68.7 61.5 2,039 0.637 0.663 0.503 11
131 Cambodia 0.598 58.0 73.6 60.0e 2,727n 0.550 0.691 0.552 -6
132 Myanmar 0.583 60.8 89.9 49.5e 1,027h,y 0.596 0.764 0.389 35
133 Bhutan 0.579 64.7 47.0v ..r ..h,z 0.662 0.485 0.589 -14
134 Comoros 0.561 64.1 ..j 46.4e 1,993n 0.651 0.533 0.499 10
135 Ghana 0.553 59.1 57.9 50.7e 2,480n 0.568 0.555 0.536 -8
136 Pakistan 0.551 64.6 49.9 40.0e 2,370 0.659 0.466 0.528 -8
137 Mauritania 0.550 63.2 51.2 45.6 2,234n 0.637 0.493 0.519 -5
138 Lesotho 0.549 42.6 82.2 66.0e 3,335n 0.293 0.768 0.585 -17
139 Congo 0.548 54.0 84.7l 51.4e 1,262 0.484 0.736 0.423 16
140 Bangladesh 0.547 63.1 47.5 56.0h 2,053 0.635 0.503 0.504 0
141 Swaziland 0.547 40.9 79.6 59.8e 4,824 0.265 0.730 0.647 -37
142 Nepal 0.534 62.6 48.6 58.1e 1,550 0.626 0.518 0.458 8
143 Madagascar 0.533 58.4 70.7 59.7e 923 0.557 0.670 0.371 27
144 Cameroon 0.532 49.8 67.9 62.3e 2,299 0.414 0.660 0.523 -13
145 Papua New Guinea 0.530 56.9 57.3 40.7e,h 2,563n 0.532 0.518 0.541 -19
146 Haiti 0.529 59.5 ..j ..r 1,663n 0.575 0.542 0.469 2
147 Sudan 0.526 57.4 60.9aa 37.3e 2,083n 0.540 0.531 0.507 -10
148 Kenya 0.521 52.1 73.6 60.6e 1,240 0.451 0.693 0.420 9
149 Djibouti 0.516 53.9 ..j 25.3 2,178n 0.482 0.553 0.514 -15
150 Timor-Leste 0.514 59.7 50.1ab 72.0e ..h,ac 0.578 0.574 0.390 16
151 Zimbabwe 0.513 40.9 89.4l 52.4e,h 2,038 0.265 0.770 0.503 -9
152 Togo 0.512 57.8 53.2 55.0e 1,506n 0.547 0.538 0.453 -1
153 Yemen 0.508 61.5 54.1l 55.2 930 0.608 0.545 0.372 16
154 Uganda 0.505 49.7 66.8 63.0e 1,454n 0.412 0.655 0.447 -2
155 Gambia 0.502 58.8 ..j 50.1e,h 1,921n 0.563 0.450 0.493 -9
LOWHUMANDEVELOPMENT
156 Senegal 0.499 62.3 39.3 39.6e 1,792 0.622 0.394 0.482 -9
157 Eritrea 0.483 56.6 ..j 35.3e 1,109n 0.527 0.521 0.402 6
158 Nigeria 0.470 46.5 69.1l 56.2e 1,128 0.359 0.648 0.404 4
159 Tanzania (United Republic of) 0.467 51.0 69.4 50.4e 744 0.434 0.631 0.335 15
HDI ranka
Humandevelopmentindex(HDI)
value
Lifeexpectancy
atbirth(years)
Adultliteracyrate(% aged 15 and above)
Combinedgrossenrolmentratio
forprimary,secondary
andtertiaryeducation
(%)
GDPpercapita
(PPP US$)Life
expectancyindex
Educationindex GDPindex
GDPpercapita
(PPPUS$)rankminusHDIrankc2005 2005 1995-2005b 2005 2005
Humandevelopmentindexcomponents MDGPopulationusinganimproved
watersource
(%)
Lifeexpectancy
atbirth(years)
Adultliteracyrate
(% aged 15 and above)
Combinedgrossenrolmentratio
forprimary,secondaryand
tertiaryeducation(%)
GDPpercapita(PPP US$)
Totalpopulation(thousands)
Totalfertility
rate(births
per woman)
MDGUnder-fivemortality
rate(per 1,000 live births)
MDGNet
primaryenrolment
rate(%)
HIVprevalencea
(% aged 15–49)
MDGPopulation
under-nourished(% of total population)
2005 1995–2005b 2005 2005 2005 2000–05 2005 2005 2005 2002/04c 2004
2�0 rapportosullosv iluppoumano2007-2008
indi
cato
rid
isvi
lupp
oum
ano
TaB
ELLa
1
NOTESa. The HDI rank is determined using HDI values to
the sixth decimal point. b. Data refer to national literacy estimates from
censuses or surveys conducted between 1995 and 2005, unless otherwise specified. Due to differences in methodology and timeliness of underlying data, comparisons across countries and over time should be made with caution. For more details, see http://www.uis.unesco.org/.
c. A positive figure indicates that the HDI rank is higher than the GDP per capita (PPP US$) rank, a negative the opposite.
d. For purposes of calculating the HDI, a value of 99.0% was applied.
e. National or UNESCO Institute for Statistics estimate.
f. For purposes of calculating the HDI, a value of 40,000 (PPP US$) was applied.
g. For purposes of calculating the HDI, a value of 100% was applied.
h. Data refer to a year other than that specified.i. Statec 2006. Data refer to nationals enrolled both
in the country and abroad and thus differ from the standard definition.
j. In the absence of recent data, estimates from UNESCO Institute for Statistics 2003, based on outdated census or survey information, were used and should be interpreted with caution: Bahamas 95.8, Barbados 99.7, Comoros 56.8, Djibouti 70.3, Eritrea 60.5, Fiji 94.4, Gambia 42.5, Guinea-Bissau 44.8, Guyana 99.0, Haiti 54.8, Hong Kong, China (SAR) 94.6, Hungary 99.4, Lebanon 88.3, Poland 99.8 and Uzbekistan 99.4.
k. Data are from national sources.l. UNESCO Institute for Statistics estimates based
on its Global age-specific literacy projections model, April 2007.
m. Heston, Summers and Aten 2006. Data differ from the standard definition.
n. World Bank estimate based on regression.o. Efforts to produce a more accurate estimate are
ongoing (see Readers guide and notes to tables for details). A preliminary estimate of 6,000 (PPP US$) was used.
p. Data are from the Secretariat of the Organization of Eastern Caribbean States, based on national sources.
q. Data are from the Secretariat of the Caribbean Community, based on national sources.
r. Because the combined gross enrolment ratio was unavailable, the following HDRO estimates were used: Antigua and Barbuda 76, Bhutan 52, Ecuador 75, Haiti 53 and Turkmenistan 73.
s. UNDP 2007.t. World Bank 2006.u. World Bank estimate based on a bilateral
comparison between China and the United States (Ruoen and Kai 1995).
v. UNICEF 2004.w. Data refer to 18 of the 25 states of the
country only.x. In the absence of an estimate of GDP per capita
(PPP US$), the HDRO estimate of 2,056 (PPP US$) was used, derived from the value of GDP in US$ and the weighted average ratio of PPP US$ to US$ in the Arab States.
y. Heston, Summers and Aten 2001. Data differ from the standard definition.
z. In the absence of an estimate of GDP per capita (PPP US$), the HDRO estimate of 3,413 (PPP US$) was used, derived from the value of GDP per capita in PPP US$ estimated by Heston, Summers and Aten 2006 adjusted to reflect the latest population estimates from UN 2007e.
aa. Data refer to North Sudan only.ab. UNDP 2006.ac. For the purposes of calculating the HDI, a national
estimate of 1,033 (PPP US$) was used.
SOURCESColumn1: calculated on the basis of data in columns 6–8; see Technical note 1 for details.Column2: UN 2007e, unless otherwise specified.Column3: UNESCO Institute for Statistics 2007a, unless otherwise specified.Column4: UNESCO Institute for Statistics 2007c, unless otherwise specified.Column5: World Bank 2007b, unless otherwise specified; aggregates calculated for the HDRO by the World Bank.Column6: calculated on the basis of data in column 2.Column7: calculated on the basis of data in columns 3 and 4.Column8: calculated on the basis of data in column 5.Column9: calculated on the basis of data in columns 1 and 5.
160 Guinea 0.456 54.8 29.5 45.1e 2,316 0.497 0.347 0.524 -30
161 Rwanda 0.452 45.2 64.9 50.9e 1,206n 0.337 0.602 0.416 -1
162 Angola 0.446 41.7 67.4 25.6e,h 2,335n 0.279 0.535 0.526 -33
163 Benin 0.437 55.4 34.7 50.7e 1,141 0.506 0.400 0.406 -2
164 Malawi 0.437 46.3 64.1 63.1e 667 0.355 0.638 0.317 13
165 Zambia 0.434 40.5 68.0 60.5e 1,023 0.259 0.655 0.388 3
166 Côte d’Ivoire 0.432 47.4 48.7 39.6e,h 1,648 0.373 0.457 0.468 -17
167 Burundi 0.413 48.5 59.3 37.9e 699n 0.391 0.522 0.325 9
168 Congo (Democratic Republic of the) 0.411 45.8 67.2 33.7e,h 714n 0.346 0.560 0.328 7
169 Ethiopia 0.406 51.8 35.9 42.1e 1,055n 0.446 0.380 0.393 -5
170 Chad 0.388 50.4 25.7 37.5e 1,427n 0.423 0.296 0.444 -17
171 Central African Republic 0.384 43.7 48.6 29.8e,h 1,224n 0.311 0.423 0.418 -13
172 Mozambique 0.384 42.8 38.7 52.9 1,242n 0.296 0.435 0.421 -16
173 Mali 0.380 53.1 24.0 36.7 1,033 0.469 0.282 0.390 -8
174 Niger 0.374 55.8 28.7 22.7 781n 0.513 0.267 0.343 -1
175 Guinea-Bissau 0.374 45.8 ..j 36.7e,h 827n 0.347 0.421 0.353 -4
176 Burkina Faso 0.370 51.4 23.6 29.3 1,213n 0.440 0.255 0.417 -17
177 Sierra Leone 0.336 41.8 34.8 44.6h 806 0.280 0.381 0.348 -5
Developing countries 0.691 66.1 76.7 64.1 5,282 0.685 0.725 0.662 ..
Least developed countries 0.488 54.5 53.9 48.0 1,499 0.492 0.519 0.452 ..
Arab States 0.699 67.5 70.3 65.5 6,716 0.708 0.687 0.702 ..
East Asia and the Pacific 0.771 71.7 90.7 69.4 6,604 0.779 0.836 0.699 ..
Latin America and the Caribbean 0.803 72.8 90.3 81.2 8,417 0.797 0.873 0.740 ..
South Asia 0.611 63.8 59.5 60.3 3,416 0.646 0.598 0.589 ..
Sub-Saharan Africa 0.493 49.6 60.3 50.6 1,998 0.410 0.571 0.500 ..
Central and Eastern Europe and the CIS 0.808 68.6 99.0 83.5 9,527 0.726 0.938 0.761 ..
OECD 0.916 78.3 .. 88.6 29,197 0.888 0.912 0.947 ..
High-income OECD 0.947 79.4 .. 93.5 33,831 0.906 0.961 0.972 ..
High human development 0.897 76.2 .. 88.4 23,986 0.854 0.922 0.915 ..
Medium human development 0.698 67.5 78.0 65.3 4,876 0.709 0.738 0.649 ..
Low human development 0.436 48.5 54.4 45.8 1,112 0.391 0.516 0.402 ..
High income 0.936 79.2 .. 92.3 33,082 0.903 0.937 0.968 ..
Middle income 0.776 70.9 89.9 73.3 7,416 0.764 0.843 0.719 ..
Low income 0.570 60.0 60.2 56.3 2,531 0.583 0.589 0.539 ..
World 0.743 68.1 78.6 67.8 9,543 0.718 0.750 0.761 ..
Indicedisviluppoumano
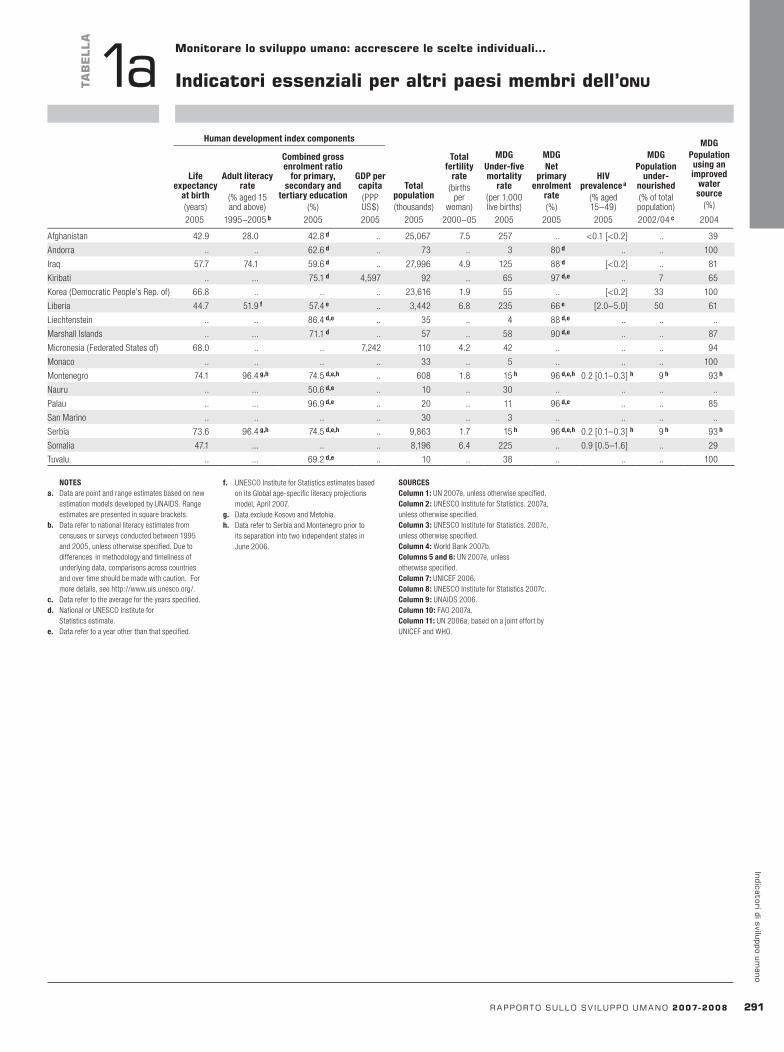
Humandevelopmentindexcomponents MDGPopulationusinganimproved
watersource
(%)
Lifeexpectancy
atbirth(years)
Adultliteracyrate
(% aged 15 and above)
Combinedgrossenrolmentratio
forprimary,secondaryand
tertiaryeducation(%)
GDPpercapita(PPP US$)
Totalpopulation(thousands)
Totalfertility
rate(births
per woman)
MDGUnder-fivemortality
rate(per 1,000 live births)
MDGNet
primaryenrolment
rate(%)
HIVprevalencea
(% aged 15–49)
MDGPopulation
under-nourished(% of total population)
2005 1995–2005b 2005 2005 2005 2000–05 2005 2005 2005 2002/04c 2004
rapportosullosv iluppoumano2007-2008 2�1
indicatoridisviluppoumano
Monitorarelosviluppoumano:accrescerelescelteindividuali…
TaB
ELLa
1a Indicatoriessenzialiperaltripaesimembridell’onu
NOTESa. Data are point and range estimates based on new
estimation models developed by UNAIDS. Range estimates are presented in square brackets.
b. Data refer to national literacy estimates from censuses or surveys conducted between 1995 and 2005, unless otherwise specified. Due to differences in methodology and timeliness of underlying data, comparisons across countries and over time should be made with caution. For more details, see http://www.uis.unesco.org/.
c. Data refer to the average for the years specified.d. National or UNESCO Institute for
Statistics estimate.e. Data refer to a year other than that specified.
f. UNESCO Institute for Statistics estimates based on its Global age-specific literacy projections model, April 2007.
g. Data exclude Kosovo and Metohia.h. Data refer to Serbia and Montenegro prior to
its separation into two independent states in June 2006.
SOURCESColumn1: UN 2007e, unless otherwise specified.Column2: UNESCO Institute for Statistics. 2007a, unless otherwise specified.Column3: UNESCO Institute for Statistics. 2007c, unless otherwise specified.Column4: World Bank 2007b.Columns5and6: UN 2007e, unless otherwise specified.Column7: UNICEF 2006.Column8: UNESCO Institute for Statistics 2007c.Column9: UNAIDS 2006.Column10: FAO 2007a.Column11: UN 2006a, based on a joint effort by UNICEF and WHO.
Afghanistan 42.9 28.0 42.8d .. 25,067 7.5 257 .. <0.1 [<0.2] .. 39
Andorra .. .. 62.6d .. 73 .. 3 80d .. .. 100
Iraq 57.7 74.1 59.6d .. 27,996 4.9 125 88d [<0.2] .. 81
Kiribati .. ... 75.1d 4,597 92 .. 65 97d,e .. 7 65
Korea (Democratic People’s Rep. of) 66.8 .. .. .. 23,616 1.9 55 .. [<0.2] 33 100
Liberia 44.7 51.9f 57.4e .. 3,442 6.8 235 66e [2.0–5.0] 50 61
Liechtenstein .. .. 86.4d,e .. 35 .. 4 88d,e .. .. ..
Marshall Islands .. ... 71.1d .. 57 .. 58 90d,e .. .. 87
Micronesia (Federated States of) 68.0 .. .. 7,242 110 4.2 42 .. .. .. 94
Monaco .. .. .. .. 33 .. 5 .. .. .. 100
Montenegro 74.1 96.4g,h 74.5d,e,h .. 608 1.8 15h 96d,e,h 0.2 [0.1–0.3] h 9h 93h
Nauru .. ... 50.6d,e .. 10 .. 30 .. .. .. ..
Palau .. ... 96.9d,e .. 20 .. 11 96d,e .. .. 85
San Marino .. .. .. .. 30 .. 3 .. .. .. ..
Serbia 73.6 96.4g,h 74.5d,e,h .. 9,863 1.7 15h 96d,e,h 0.2 [0.1–0.3] h 9h 93h
Somalia 47.1 ... .. .. 8,196 6.4 225 .. 0.9 [0.5–1.6] .. 29
Tuvalu .. ... 69.2d,e .. 10 .. 38 .. .. .. 100
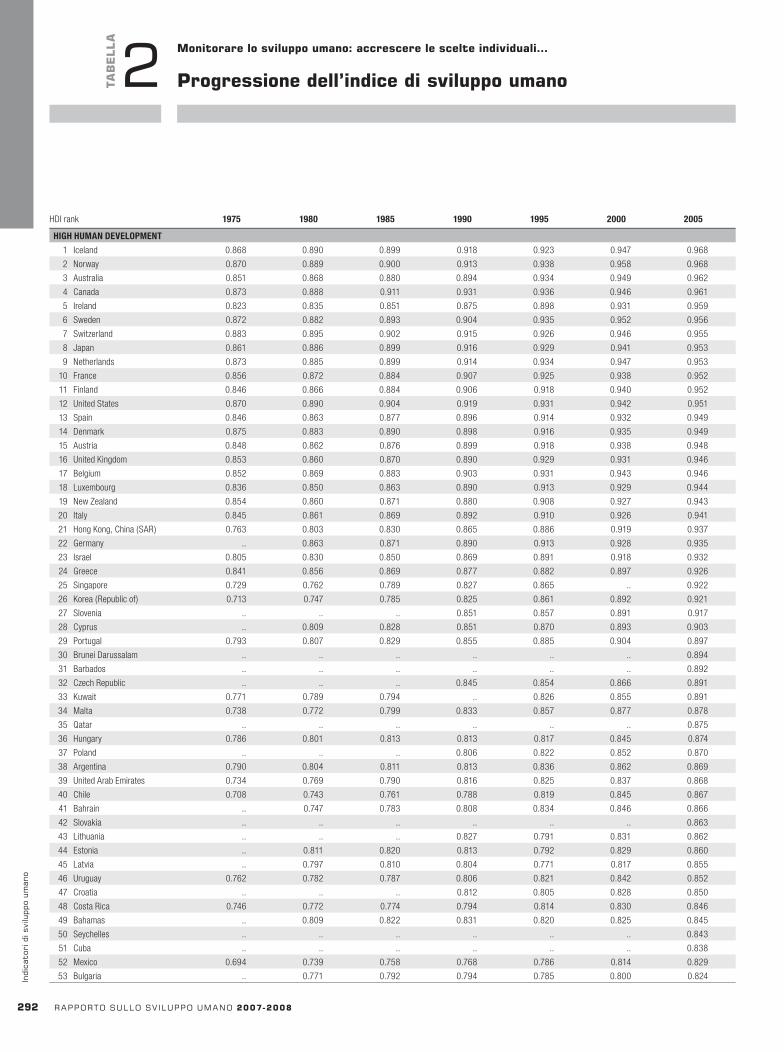
HDI rank 1975 1980 1985 1990 1995 2000 2005 HDI rank 1975 1980 1985 1990 1995 2000 2005
2�2 rapportosullosv iluppoumano2007-2008
indi
cato
rid
isvi
lupp
oum
ano
TaB
ELLa
2 Monitorarelosviluppoumano:accrescerelescelteindividuali…
progressionedell’indicedisviluppoumano
HIGHHUMANDEVELOPMENT
1 Iceland 0.868 0.890 0.899 0.918 0.923 0.947 0.968
2 Norway 0.870 0.889 0.900 0.913 0.938 0.958 0.968
3 Australia 0.851 0.868 0.880 0.894 0.934 0.949 0.962
4 Canada 0.873 0.888 0.911 0.931 0.936 0.946 0.961
5 Ireland 0.823 0.835 0.851 0.875 0.898 0.931 0.959
6 Sweden 0.872 0.882 0.893 0.904 0.935 0.952 0.956
7 Switzerland 0.883 0.895 0.902 0.915 0.926 0.946 0.955
8 Japan 0.861 0.886 0.899 0.916 0.929 0.941 0.953
9 Netherlands 0.873 0.885 0.899 0.914 0.934 0.947 0.953
10 France 0.856 0.872 0.884 0.907 0.925 0.938 0.952
11 Finland 0.846 0.866 0.884 0.906 0.918 0.940 0.952
12 United States 0.870 0.890 0.904 0.919 0.931 0.942 0.951
13 Spain 0.846 0.863 0.877 0.896 0.914 0.932 0.949
14 Denmark 0.875 0.883 0.890 0.898 0.916 0.935 0.949
15 Austria 0.848 0.862 0.876 0.899 0.918 0.938 0.948
16 United Kingdom 0.853 0.860 0.870 0.890 0.929 0.931 0.946
17 Belgium 0.852 0.869 0.883 0.903 0.931 0.943 0.946
18 Luxembourg 0.836 0.850 0.863 0.890 0.913 0.929 0.944
19 New Zealand 0.854 0.860 0.871 0.880 0.908 0.927 0.943
20 Italy 0.845 0.861 0.869 0.892 0.910 0.926 0.941
21 Hong Kong, China (SAR) 0.763 0.803 0.830 0.865 0.886 0.919 0.937
22 Germany .. 0.863 0.871 0.890 0.913 0.928 0.935
23 Israel 0.805 0.830 0.850 0.869 0.891 0.918 0.932
24 Greece 0.841 0.856 0.869 0.877 0.882 0.897 0.926
25 Singapore 0.729 0.762 0.789 0.827 0.865 .. 0.922
26 Korea (Republic of) 0.713 0.747 0.785 0.825 0.861 0.892 0.921
27 Slovenia .. .. .. 0.851 0.857 0.891 0.917
28 Cyprus .. 0.809 0.828 0.851 0.870 0.893 0.903
29 Portugal 0.793 0.807 0.829 0.855 0.885 0.904 0.897
30 Brunei Darussalam .. .. .. .. .. .. 0.894
31 Barbados .. .. .. .. .. .. 0.892
32 Czech Republic .. .. .. 0.845 0.854 0.866 0.891
33 Kuwait 0.771 0.789 0.794 .. 0.826 0.855 0.891
34 Malta 0.738 0.772 0.799 0.833 0.857 0.877 0.878
35 Qatar .. .. .. .. .. .. 0.875
36 Hungary 0.786 0.801 0.813 0.813 0.817 0.845 0.874
37 Poland .. .. .. 0.806 0.822 0.852 0.870
38 Argentina 0.790 0.804 0.811 0.813 0.836 0.862 0.869
39 United Arab Emirates 0.734 0.769 0.790 0.816 0.825 0.837 0.868
40 Chile 0.708 0.743 0.761 0.788 0.819 0.845 0.867
41 Bahrain .. 0.747 0.783 0.808 0.834 0.846 0.866
42 Slovakia .. .. .. .. .. .. 0.863
43 Lithuania .. .. .. 0.827 0.791 0.831 0.862
44 Estonia .. 0.811 0.820 0.813 0.792 0.829 0.860
45 Latvia .. 0.797 0.810 0.804 0.771 0.817 0.855
46 Uruguay 0.762 0.782 0.787 0.806 0.821 0.842 0.852
47 Croatia .. .. .. 0.812 0.805 0.828 0.850
48 Costa Rica 0.746 0.772 0.774 0.794 0.814 0.830 0.846
49 Bahamas .. 0.809 0.822 0.831 0.820 0.825 0.845
50 Seychelles .. .. .. .. .. .. 0.843
51 Cuba .. .. .. .. .. .. 0.838
52 Mexico 0.694 0.739 0.758 0.768 0.786 0.814 0.829
53 Bulgaria .. 0.771 0.792 0.794 0.785 0.800 0.824

HDI rank 1975 1980 1985 1990 1995 2000 2005
rapportosullosv iluppoumano2007-2008 2�3
indicatoridisviluppoumano
TaB
ELLa
2
54 Saint Kitts and Nevis .. .. .. .. .. .. 0.821
55 Tonga .. .. .. .. .. .. 0.819
56 Libyan Arab Jamahiriya .. .. .. .. .. .. 0.818
57 Antigua and Barbuda .. .. .. .. .. .. 0.815
58 Oman 0.487 0.547 0.641 0.697 0.741 0.779 0.814
59 Trinidad and Tobago 0.756 0.784 0.782 0.784 0.785 0.796 0.814
60 Romania .. 0.786 0.792 0.777 0.772 0.780 0.813
61 Saudi Arabia 0.611 0.666 0.684 0.717 0.748 0.788 0.812
62 Panama 0.718 0.737 0.751 0.752 0.775 0.797 0.812
63 Malaysia 0.619 0.662 0.696 0.725 0.763 0.790 0.811
64 Belarus .. .. .. 0.790 0.755 0.778 0.804
65 Mauritius .. 0.662 0.692 0.728 0.751 0.781 0.804
66 Bosnia and Herzegovina .. .. .. .. .. .. 0.803
67 Russian Federation .. .. .. 0.815 0.771 0.782 0.802
68 Albania .. 0.675 0.694 0.704 0.705 0.746 0.801
69 Macedonia (TFYR) .. .. .. .. .. .. 0.801
70 Brazil 0.649 0.685 0.700 0.723 0.753 0.789 0.800
MEDIUMHUMANDEVELOPMENT
71 Dominica .. .. .. .. .. .. 0.798
72 Saint Lucia .. .. .. .. .. .. 0.795
73 Kazakhstan .. .. .. 0.771 0.724 0.738 0.794
74 Venezuela (Bolivarian Republic of) 0.723 0.737 0.743 0.762 0.770 0.776 0.792
75 Colombia 0.663 0.694 0.709 0.729 0.753 0.772 0.791
76 Ukraine .. .. .. 0.809 0.756 0.761 0.788
77 Samoa .. .. 0.709 0.721 0.740 0.765 0.785
78 Thailand 0.615 0.654 0.679 0.712 0.745 0.761 0.781
79 Dominican Republic 0.628 0.660 0.684 0.697 0.723 0.757 0.779
80 Belize .. 0.712 0.718 0.750 0.777 0.795 0.778
81 China 0.530 0.559 0.595 0.634 0.691 0.732 0.777
82 Grenada .. .. .. .. .. .. 0.777
83 Armenia .. .. .. 0.737 0.701 0.738 0.775
84 Turkey 0.594 0.615 0.651 0.683 0.717 0.753 0.775
85 Suriname .. .. .. .. .. .. 0.774
86 Jordan .. 0.647 0.669 0.684 0.710 0.751 0.773
87 Peru 0.647 0.676 0.699 0.710 0.737 0.763 0.773
88 Lebanon .. .. .. 0.692 0.730 0.748 0.772
89 Ecuador 0.636 0.678 0.699 0.714 0.734 .. 0.772
90 Philippines 0.655 0.688 0.692 0.721 0.739 0.758 0.771
91 Tunisia 0.519 0.575 0.626 0.662 0.702 0.741 0.766
92 Fiji 0.665 0.688 0.702 .. 0.743 0.747 0.762
93 Saint Vincent and the Grenadines .. .. .. .. .. .. 0.761
94 Iran ( Islamic Republic of) 0.571 0.578 0.615 0.653 0.693 0.722 0.759
95 Paraguay 0.667 0.701 0.707 0.718 0.737 0.749 0.755
96 Georgia .. .. .. .. .. .. 0.754
97 Guyana 0.682 0.684 0.675 0.679 0.699 0.722 0.750
98 Azerbaijan .. .. .. .. .. .. 0.746
99 Sri Lanka 0.619 0.656 0.683 0.702 0.721 0.731 0.743
100 Maldives .. .. .. .. .. .. 0.741
101 Jamaica 0.686 0.689 0.690 0.713 0.728 0.744 0.736
102 Cape Verde .. .. 0.589 0.627 0.678 0.709 0.736
103 El Salvador 0.595 0.590 0.611 0.653 0.692 0.716 0.735
104 Algeria 0.511 0.562 0.613 0.652 0.672 0.702 0.733
105 Viet Nam .. .. 0.590 0.620 0.672 0.711 0.733
106 Occupied Palestinian Territories .. .. .. .. .. .. 0.731

HDI rank 1975 1980 1985 1990 1995 2000 2005
2�4 rapportosullosv iluppoumano2007-2008
indi
cato
rid
isvi
lupp
oum
ano
TaB
ELLa
2 progressionedell’indicedisviluppoumano
107 Indonesia 0.471 0.533 0.585 0.626 0.670 0.692 0.728
108 Syrian Arab Republic 0.547 0.593 0.628 0.646 0.676 0.690 0.724
109 Turkmenistan .. .. .. .. .. .. 0.713
110 Nicaragua 0.583 0.593 0.601 0.610 0.637 0.671 0.710
111 Moldova .. 0.700 0.722 0.740 0.684 0.683 0.708
112 Egypt 0.434 0.482 0.532 0.575 0.613 0.659 0.708
113 Uzbekistan .. .. .. 0.704 0.683 0.691 0.702
114 Mongolia .. .. 0.637 0.654 0.638 0.667 0.700
115 Honduras 0.528 0.578 0.611 0.634 0.653 0.668 0.700
116 Kyrgyzstan .. .. .. .. .. .. 0.696
117 Bolivia 0.519 0.553 0.580 0.606 0.639 0.677 0.695
118 Guatemala 0.514 0.550 0.566 0.592 0.626 0.667 0.689
119 Gabon .. .. .. .. .. .. 0.677
120 Vanuatu .. .. .. .. .. .. 0.674
121 South Africa 0.650 0.670 0.699 0.731 0.745 0.707 0.674
122 Tajikistan .. .. 0.705 0.703 0.638 0.640 0.673
123 Sao Tome and Principe .. .. .. .. .. .. 0.654
124 Botswana 0.509 0.571 0.624 0.674 0.658 0.631 0.654
125 Namibia .. .. .. .. 0.698 0.657 0.650
126 Morocco 0.435 0.483 0.519 0.551 0.581 0.613 0.646
127 Equatorial Guinea .. .. 0.484 0.505 0.529 0.606 0.642
128 India 0.419 0.450 0.487 0.521 0.551 0.578 0.619
129 Solomon Islands .. .. .. .. .. .. 0.602
130 Lao People’s Democratic Republic .. .. 0.448 0.478 0.524 0.563 0.601
131 Cambodia .. .. .. .. 0.540 0.547 0.598
132 Myanmar .. .. .. .. .. .. 0.583
133 Bhutan .. .. .. .. .. .. 0.579
134 Comoros .. 0.483 0.500 0.506 0.521 0.540 0.561
135 Ghana 0.442 0.471 0.486 0.517 0.542 0.568 0.553
136 Pakistan 0.367 0.394 0.427 0.467 0.497 0.516 0.551
137 Mauritania 0.383 0.410 0.435 0.455 0.487 0.509 0.550
138 Lesotho 0.499 0.541 0.571 0.605 0.616 0.581 0.549
139 Congo 0.478 0.520 0.567 0.559 0.546 0.518 0.548
140 Bangladesh 0.347 0.365 0.392 0.422 0.453 0.511 0.547
141 Swaziland 0.527 0.561 0.588 0.633 0.641 0.592 0.547
142 Nepal 0.301 0.338 0.380 0.427 0.469 0.502 0.534
143 Madagascar 0.407 0.444 0.440 0.450 0.463 0.493 0.533
144 Cameroon 0.422 0.468 0.523 0.529 0.513 0.525 0.532
145 Papua New Guinea 0.431 0.462 0.481 0.495 0.532 0.544 0.530
146 Haiti .. 0.442 0.462 0.472 0.487 .. 0.529
147 Sudan 0.354 0.381 0.400 0.429 0.463 0.491 0.526
148 Kenya 0.466 0.514 0.534 0.556 0.544 0.529 0.521
149 Djibouti .. .. .. 0.476 0.485 0.490 0.516
150 Timor-Leste .. .. .. .. .. .. 0.514
151 Zimbabwe 0.550 0.579 0.645 0.654 0.613 0.541 0.513
152 Togo 0.423 0.473 0.469 0.496 0.514 0.521 0.512
153 Yemen .. .. .. 0.402 0.439 0.473 0.508
154 Uganda .. .. 0.420 0.434 0.433 0.480 0.505
155 Gambia 0.290 .. .. .. 0.436 0.472 0.502
LOWHUMANDEVELOPMENT
156 Senegal 0.342 0.367 0.401 0.428 0.449 0.473 0.499
157 Eritrea .. .. .. .. 0.435 0.459 0.483
158 Nigeria 0.321 0.378 0.391 0.411 0.432 0.445 0.470
159 Tanzania (United Republic of) .. .. .. 0.421 0.419 0.433 0.467

HDI rank 1975 1980 1985 1990 1995 2000 2005
rapportosullosv iluppoumano2007-2008 2��
indicatoridisviluppoumano
TaB
ELLa
2
NOTE The human development index values in this table
were calculated using a consistent methodology and data series. They are not strictly comparable with those in earlier Human Development Reports. For detailed discussion, see Readers guide and notes on tables.
SOURCESColumns1–6: calculated on the basis of data on life expectancy from UN 2007e; data on adult literacy rates from UNESCO Institute for Statistics 2003 and 2007a; data on combined gross enrolment ratios from UNESCO Institute for Statistics 1999 and 2007c and data on GDP per capita (2005 PPP US$) from World Bank 2007b.Column7: column 1 of indicator table 1.
160 Guinea .. .. .. .. .. .. 0.456
161 Rwanda 0.337 0.385 0.403 0.340 0.330 0.418 0.452
162 Angola .. .. .. .. .. .. 0.446
163 Benin 0.312 0.344 0.367 0.374 0.403 0.424 0.437
164 Malawi 0.330 0.355 0.370 0.388 0.444 0.431 0.437
165 Zambia 0.470 0.478 0.489 0.477 0.439 0.420 0.434
166 Côte d’Ivoire 0.419 0.448 0.453 0.450 0.436 0.432 0.432
167 Burundi 0.290 0.318 0.352 0.366 0.347 0.368 0.413
168 Congo (Democratic Republic of the) 0.414 0.423 0.430 0.423 0.391 0.375 0.411
169 Ethiopia .. .. 0.311 0.332 0.347 0.379 0.406
170 Chad 0.296 0.298 0.342 0.364 0.377 0.397 0.388
171 Central African Republic 0.350 0.371 0.394 0.398 0.390 0.394 0.384
172 Mozambique .. 0.304 0.291 0.317 0.335 0.375 0.384
173 Mali 0.245 0.268 0.272 0.296 0.321 0.352 0.380
174 Niger 0.246 0.264 0.261 0.279 0.296 0.321 0.374
175 Guinea-Bissau 0.267 0.271 0.300 0.322 0.350 0.365 0.374
176 Burkina Faso 0.257 0.280 0.305 0.321 0.337 0.353 0.370
177 Sierra Leone .. .. .. .. .. .. 0.336
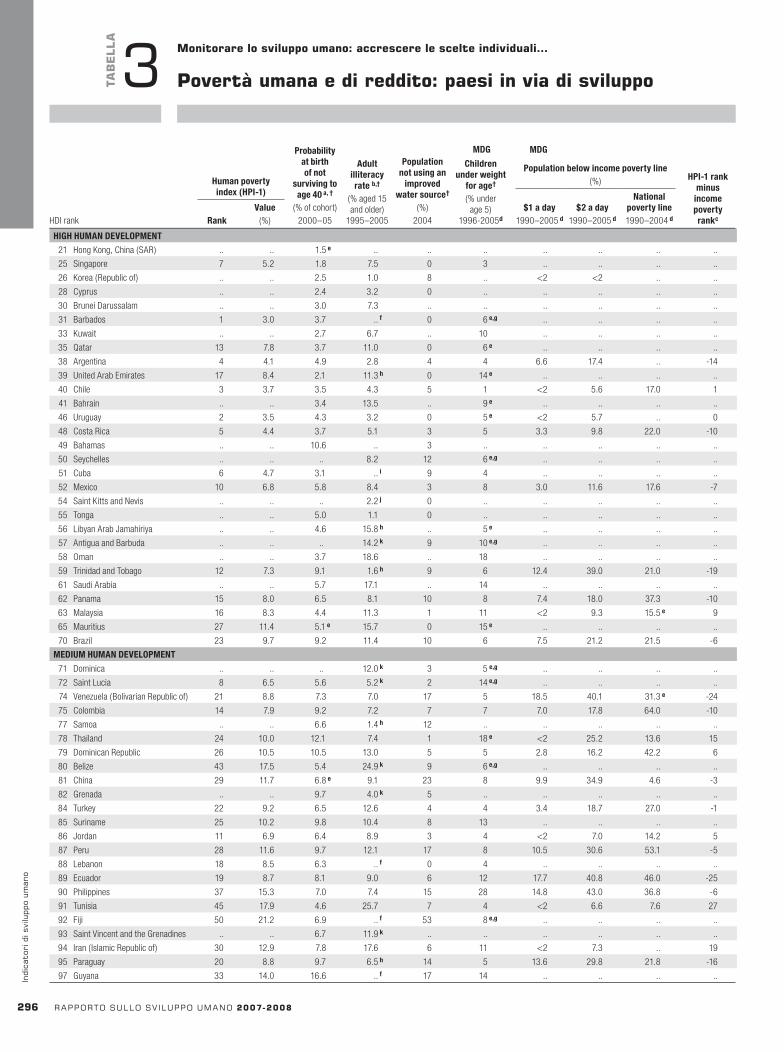
HDI rank
Humanpovertyindex(HPI-1)
Probabilityatbirthofnot
survivingtoage40a,†
(% of cohort)2000–05
Adultilliteracyrateb,†
(% aged 15 and older)
1995–2005
Populationnotusingan
improvedwatersource†
(%)2004
MDG MDG
Childrenunderweight
forage†
(% under age 5)
1996-2005d
Populationbelowincomepovertyline(%) HPI-1rank
minusincomepovertyrankc
$1aday1990–2005d
$2aday1990–2005d
Nationalpovertyline1990–2004dRank
Value(%) HDI rank
Humanpovertyindex(HPI-1)
Probabilityatbirthofnot
survivingtoage40a,†
(% of cohort)2000–05
Adultilliteracyrateb,†
(% aged 15 and older)
1995–2005
Populationnotusingan
improvedwatersource†
(%)2004
MDG MDG
Childrenunderweight
forage†
(% under age 5)
1996-2005d
Populationbelowincomepovertyline(%) HPI-1rank
minusincomepovertyrankc
$1aday1990–2005d
$2aday1990–2005d
Nationalpovertyline1990–2004dRank
Value(%)
2�� rapportosullosv iluppoumano2007-2008
indi
cato
rid
isvi
lupp
oum
ano
Monitorarelosviluppoumano:accrescerelescelteindividuali…
TaB
ELLa
3 povertàumanaedireddito:paesiinviadisviluppo
HIGHHUMANDEVELOPMENT
21 Hong Kong, China (SAR) .. .. 1.5e .. .. .. .. .. .. ..
25 Singapore 7 5.2 1.8 7.5 0 3 .. .. .. ..
26 Korea (Republic of) .. .. 2.5 1.0 8 .. <2 <2 .. ..
28 Cyprus .. .. 2.4 3.2 0 .. .. .. .. ..
30 Brunei Darussalam .. .. 3.0 7.3 .. .. .. .. .. ..
31 Barbados 1 3.0 3.7 ..f 0 6e,g .. .. .. ..
33 Kuwait .. .. 2.7 6.7 .. 10 .. .. .. ..
35 Qatar 13 7.8 3.7 11.0 0 6e .. .. .. ..
38 Argentina 4 4.1 4.9 2.8 4 4 6.6 17.4 .. -14
39 United Arab Emirates 17 8.4 2.1 11.3h 0 14e .. .. .. ..
40 Chile 3 3.7 3.5 4.3 5 1 <2 5.6 17.0 1
41 Bahrain .. .. 3.4 13.5 .. 9e .. .. .. ..
46 Uruguay 2 3.5 4.3 3.2 0 5e <2 5.7 .. 0
48 Costa Rica 5 4.4 3.7 5.1 3 5 3.3 9.8 22.0 -10
49 Bahamas .. .. 10.6 .. 3 .. .. .. .. ..
50 Seychelles .. .. .. 8.2 12 6e,g .. .. .. ..
51 Cuba 6 4.7 3.1 ..i 9 4 .. .. .. ..
52 Mexico 10 6.8 5.8 8.4 3 8 3.0 11.6 17.6 -7
54 Saint Kitts and Nevis .. .. .. 2.2j 0 .. .. .. .. ..
55 Tonga .. .. 5.0 1.1 0 .. .. .. .. ..
56 Libyan Arab Jamahiriya .. .. 4.6 15.8h .. 5e .. .. .. ..
57 Antigua and Barbuda .. .. .. 14.2k 9 10e,g .. .. .. ..
58 Oman .. .. 3.7 18.6 .. 18 .. .. .. ..
59 Trinidad and Tobago 12 7.3 9.1 1.6h 9 6 12.4 39.0 21.0 -19
61 Saudi Arabia .. .. 5.7 17.1 .. 14 .. .. .. ..
62 Panama 15 8.0 6.5 8.1 10 8 7.4 18.0 37.3 -10
63 Malaysia 16 8.3 4.4 11.3 1 11 <2 9.3 15.5e 9
65 Mauritius 27 11.4 5.1e 15.7 0 15e .. .. .. ..
70 Brazil 23 9.7 9.2 11.4 10 6 7.5 21.2 21.5 -6
MEDIUMHUMANDEVELOPMENT
71 Dominica .. .. .. 12.0k 3 5e,g .. .. .. ..
72 Saint Lucia 8 6.5 5.6 5.2k 2 14e,g .. .. .. ..
74 Venezuela (Bolivarian Republic of) 21 8.8 7.3 7.0 17 5 18.5 40.1 31.3e -24
75 Colombia 14 7.9 9.2 7.2 7 7 7.0 17.8 64.0 -10
77 Samoa .. .. 6.6 1.4h 12 .. .. .. .. ..
78 Thailand 24 10.0 12.1 7.4 1 18e <2 25.2 13.6 15
79 Dominican Republic 26 10.5 10.5 13.0 5 5 2.8 16.2 42.2 6
80 Belize 43 17.5 5.4 24.9k 9 6e,g .. .. .. ..
81 China 29 11.7 6.8e 9.1 23 8 9.9 34.9 4.6 -3
82 Grenada .. .. 9.7 4.0k 5 .. .. .. .. ..
84 Turkey 22 9.2 6.5 12.6 4 4 3.4 18.7 27.0 -1
85 Suriname 25 10.2 9.8 10.4 8 13 .. .. .. ..
86 Jordan 11 6.9 6.4 8.9 3 4 <2 7.0 14.2 5
87 Peru 28 11.6 9.7 12.1 17 8 10.5 30.6 53.1 -5
88 Lebanon 18 8.5 6.3 ..f 0 4 .. .. .. ..
89 Ecuador 19 8.7 8.1 9.0 6 12 17.7 40.8 46.0 -25
90 Philippines 37 15.3 7.0 7.4 15 28 14.8 43.0 36.8 -6
91 Tunisia 45 17.9 4.6 25.7 7 4 <2 6.6 7.6 27
92 Fiji 50 21.2 6.9 ..f 53 8e,g .. .. .. ..
93 Saint Vincent and the Grenadines .. .. 6.7 11.9k .. .. .. .. .. ..
94 Iran ( Islamic Republic of) 30 12.9 7.8 17.6 6 11 <2 7.3 .. 19
95 Paraguay 20 8.8 9.7 6.5h 14 5 13.6 29.8 21.8 -16
97 Guyana 33 14.0 16.6 ..f 17 14 .. .. .. ..
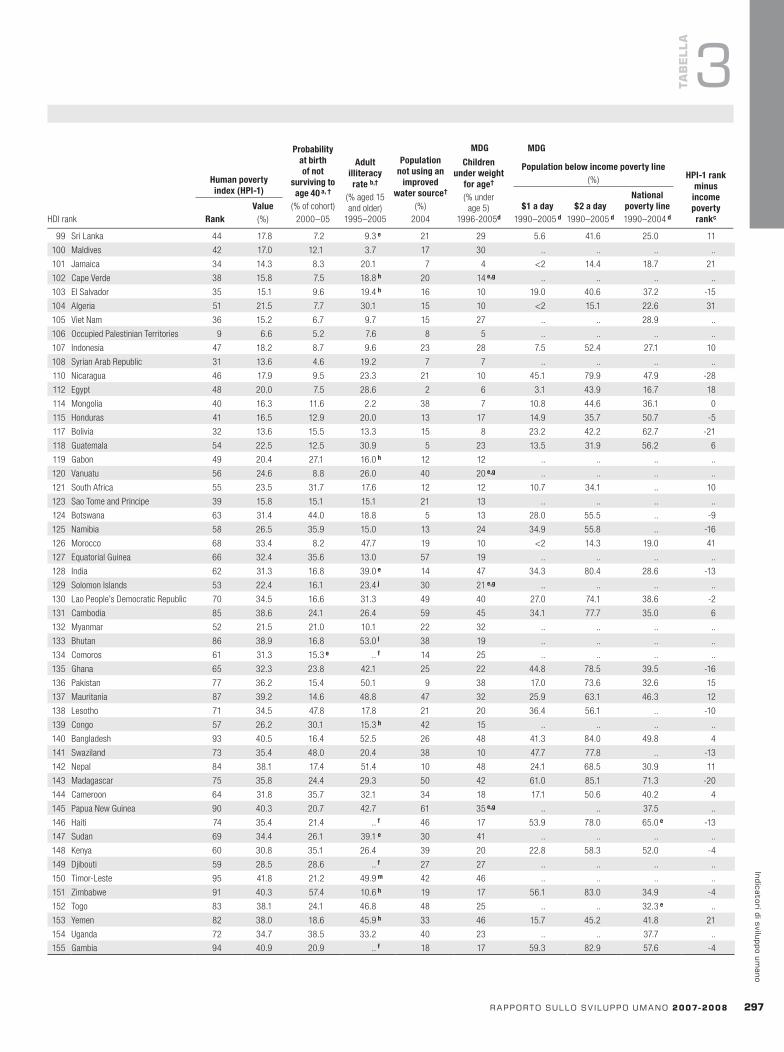
HDI rank
Humanpovertyindex(HPI-1)
Probabilityatbirthofnot
survivingtoage40a,†
(% of cohort)2000–05
Adultilliteracyrateb,†
(% aged 15 and older)
1995–2005
Populationnotusingan
improvedwatersource†
(%)2004
MDG MDG
Childrenunderweight
forage†
(% under age 5)
1996-2005d
Populationbelowincomepovertyline(%) HPI-1rank
minusincomepovertyrankc
$1aday1990–2005d
$2aday1990–2005d
Nationalpovertyline1990–2004dRank
Value(%)
rapportosullosv iluppoumano2007-2008 2�7
indicatoridisviluppoumano
TaB
ELLa
3
99 Sri Lanka 44 17.8 7.2 9.3e 21 29 5.6 41.6 25.0 11
100 Maldives 42 17.0 12.1 3.7 17 30 .. .. .. ..
101 Jamaica 34 14.3 8.3 20.1 7 4 <2 14.4 18.7 21
102 Cape Verde 38 15.8 7.5 18.8h 20 14e,g .. .. .. ..
103 El Salvador 35 15.1 9.6 19.4h 16 10 19.0 40.6 37.2 -15
104 Algeria 51 21.5 7.7 30.1 15 10 <2 15.1 22.6 31
105 Viet Nam 36 15.2 6.7 9.7 15 27 .. .. 28.9 ..
106 Occupied Palestinian Territories 9 6.6 5.2 7.6 8 5 .. .. .. ..
107 Indonesia 47 18.2 8.7 9.6 23 28 7.5 52.4 27.1 10
108 Syrian Arab Republic 31 13.6 4.6 19.2 7 7 .. .. .. ..
110 Nicaragua 46 17.9 9.5 23.3 21 10 45.1 79.9 47.9 -28
112 Egypt 48 20.0 7.5 28.6 2 6 3.1 43.9 16.7 18
114 Mongolia 40 16.3 11.6 2.2 38 7 10.8 44.6 36.1 0
115 Honduras 41 16.5 12.9 20.0 13 17 14.9 35.7 50.7 -5
117 Bolivia 32 13.6 15.5 13.3 15 8 23.2 42.2 62.7 -21
118 Guatemala 54 22.5 12.5 30.9 5 23 13.5 31.9 56.2 6
119 Gabon 49 20.4 27.1 16.0h 12 12 .. .. .. ..
120 Vanuatu 56 24.6 8.8 26.0 40 20e,g .. .. .. ..
121 South Africa 55 23.5 31.7 17.6 12 12 10.7 34.1 .. 10
123 Sao Tome and Principe 39 15.8 15.1 15.1 21 13 .. .. .. ..
124 Botswana 63 31.4 44.0 18.8 5 13 28.0 55.5 .. -9
125 Namibia 58 26.5 35.9 15.0 13 24 34.9 55.8 .. -16
126 Morocco 68 33.4 8.2 47.7 19 10 <2 14.3 19.0 41
127 Equatorial Guinea 66 32.4 35.6 13.0 57 19 .. .. .. ..
128 India 62 31.3 16.8 39.0e 14 47 34.3 80.4 28.6 -13
129 Solomon Islands 53 22.4 16.1 23.4j 30 21e,g .. .. .. ..
130 Lao People’s Democratic Republic 70 34.5 16.6 31.3 49 40 27.0 74.1 38.6 -2
131 Cambodia 85 38.6 24.1 26.4 59 45 34.1 77.7 35.0 6
132 Myanmar 52 21.5 21.0 10.1 22 32 .. .. .. ..
133 Bhutan 86 38.9 16.8 53.0l 38 19 .. .. .. ..
134 Comoros 61 31.3 15.3e ..f 14 25 .. .. .. ..
135 Ghana 65 32.3 23.8 42.1 25 22 44.8 78.5 39.5 -16
136 Pakistan 77 36.2 15.4 50.1 9 38 17.0 73.6 32.6 15
137 Mauritania 87 39.2 14.6 48.8 47 32 25.9 63.1 46.3 12
138 Lesotho 71 34.5 47.8 17.8 21 20 36.4 56.1 .. -10
139 Congo 57 26.2 30.1 15.3h 42 15 .. .. .. ..
140 Bangladesh 93 40.5 16.4 52.5 26 48 41.3 84.0 49.8 4
141 Swaziland 73 35.4 48.0 20.4 38 10 47.7 77.8 .. -13
142 Nepal 84 38.1 17.4 51.4 10 48 24.1 68.5 30.9 11
143 Madagascar 75 35.8 24.4 29.3 50 42 61.0 85.1 71.3 -20
144 Cameroon 64 31.8 35.7 32.1 34 18 17.1 50.6 40.2 4
145 Papua New Guinea 90 40.3 20.7 42.7 61 35e,g .. .. 37.5 ..
146 Haiti 74 35.4 21.4 ..f 46 17 53.9 78.0 65.0e -13
147 Sudan 69 34.4 26.1 39.1e 30 41 .. .. .. ..
148 Kenya 60 30.8 35.1 26.4 39 20 22.8 58.3 52.0 -4
149 Djibouti 59 28.5 28.6 ..f 27 27 .. .. .. ..
150 Timor-Leste 95 41.8 21.2 49.9m 42 46 .. .. .. ..
151 Zimbabwe 91 40.3 57.4 10.6h 19 17 56.1 83.0 34.9 -4
152 Togo 83 38.1 24.1 46.8 48 25 .. .. 32.3e ..
153 Yemen 82 38.0 18.6 45.9h 33 46 15.7 45.2 41.8 21
154 Uganda 72 34.7 38.5 33.2 40 23 .. .. 37.7 ..
155 Gambia 94 40.9 20.9 ..f 18 17 59.3 82.9 57.6 -4
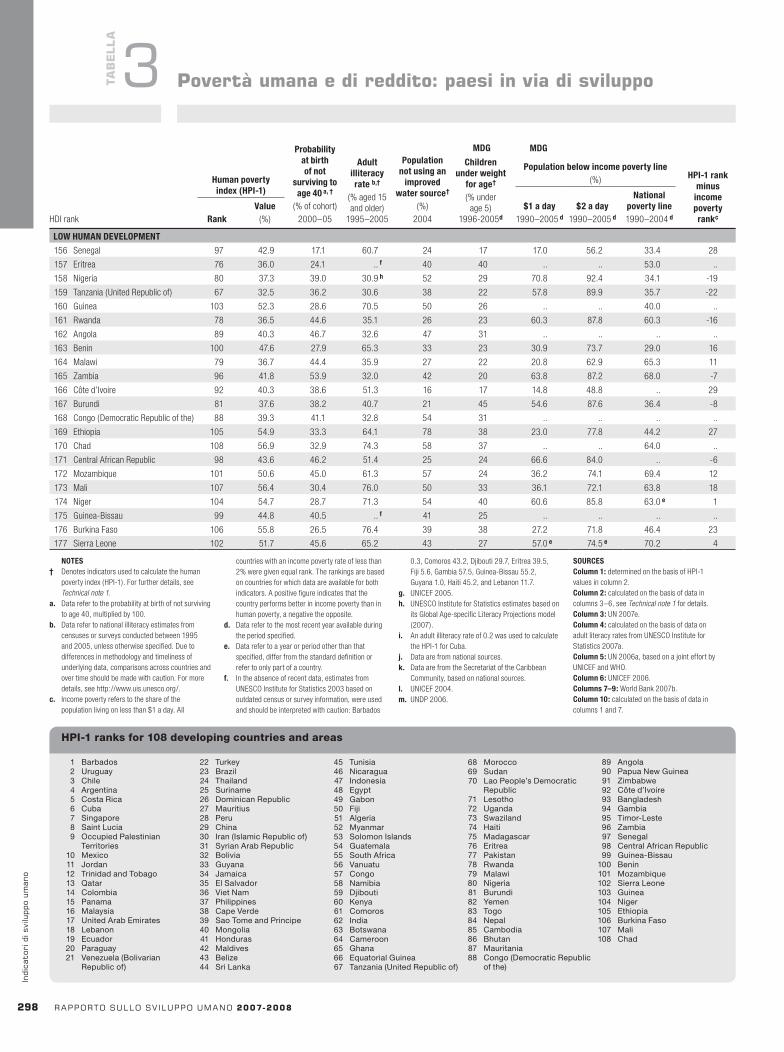
HDI rank
Humanpovertyindex(HPI-2)a
Probabilityatbirthof
notsurvivingtoage60b,†
(% of cohort)2000–05
Peoplelacking
functionalliteracyskillsc,†
(% aged 16–65)
1994–2003e
Long-termunemployment†
(as % of labour force)2006
Populationbelowincomepovertyline(%)
HPI-2rankminus
incomepovertyrankd
50%ofmedian
income†
2000–04e
$11aday1994–95e
$4aday2000–04eRank
Value(%)HDI rank
Humanpovertyindex(HPI-1)
Probabilityatbirthofnot
survivingtoage40a,†
(% of cohort)2000–05
Adultilliteracyrateb,†
(% aged 15 and older)
1995–2005
Populationnotusingan
improvedwatersource†
(%)2004
MDG MDG
Childrenunderweight
forage†
(% under age 5)
1996-2005d
Populationbelowincomepovertyline(%) HPI-1rank
minusincomepovertyrankc
$1aday1990–2005d
$2aday1990–2005d
Nationalpovertyline1990–2004dRank
Value(%)
2�8 rapportosullosv iluppoumano2007-2008
indi
cato
rid
isvi
lupp
oum
ano
TaB
ELLa
3 povertàumanaedireddito:paesiinviadisviluppo
1 Barbados 2 Uruguay 3 Chile 4 Argentina 5 Costa Rica 6 Cuba 7 Singapore 8 Saint Lucia 9 Occupied Palestinian
Territories 10 Mexico 11 Jordan 12 Trinidad and Tobago 13 Qatar 14 Colombia 15 Panama 16 Malaysia 17 United Arab Emirates 18 Lebanon 19 Ecuador 20 Paraguay 21 Venezuela (Bolivarian
Republic of)
22 Turkey 23 Brazil 24 Thailand 25 Suriname 26 Dominican Republic 27 Mauritius 28 Peru 29 China 30 Iran (Islamic Republic of) 31 Syrian Arab Republic 32 Bolivia 33 Guyana 34 Jamaica 35 El Salvador 36 Viet Nam 37 Philippines 38 Cape Verde 39 Sao Tome and Principe 40 Mongolia 41 Honduras 42 Maldives 43 Belize 44 Sri Lanka
45 Tunisia 46 Nicaragua 47 Indonesia 48 Egypt 49 Gabon 50 Fiji 51 Algeria 52 Myanmar 53 Solomon Islands 54 Guatemala 55 South Africa 56 Vanuatu 57 Congo 58 Namibia 59 Djibouti 60 Kenya 61 Comoros 62 India 63 Botswana 64 Cameroon 65 Ghana 66 Equatorial Guinea 67 Tanzania (United Republic of)
68 Morocco 69 Sudan 70 Lao People’s Democratic
Republic 71 Lesotho 72 Uganda 73 Swaziland 74 Haiti 75 Madagascar 76 Eritrea 77 Pakistan 78 Rwanda 79 Malawi 80 Nigeria 81 Burundi 82 Yemen 83 Togo 84 Nepal 85 Cambodia 86 Bhutan 87 Mauritania 88 Congo (Democratic Republic
of the)
89 Angola 90 Papua New Guinea 91 Zimbabwe 92 Côte d’Ivoire 93 Bangladesh 94 Gambia 95 Timor-Leste 96 Zambia 97 Senegal 98 Central African Republic 99 Guinea-Bissau 100 Benin 101 Mozambique 102 Sierra Leone 103 Guinea 104 Niger 105 Ethiopia 106 Burkina Faso 107 Mali 108 Chad
HPI-1 ranks for 108 developing countries and areas
NOTES† Denotes indicators used to calculate the human
poverty index (HPI-1). For further details, see Technical note 1.
a. Data refer to the probability at birth of not surviving to age 40, multiplied by 100.
b. Data refer to national illiteracy estimates from censuses or surveys conducted between 1995 and 2005, unless otherwise specified. Due to differences in methodology and timeliness of underlying data, comparisons across countries and over time should be made with caution. For more details, see http://www.uis.unesco.org/.
c. Income poverty refers to the share of the population living on less than $1 a day. All
countries with an income poverty rate of less than 2% were given equal rank. The rankings are based on countries for which data are available for both indicators. A positive figure indicates that the country performs better in income poverty than in human poverty, a negative the opposite.
d. Data refer to the most recent year available during the period specified.
e. Data refer to a year or period other than that specified, differ from the standard definition or refer to only part of a country.
f. In the absence of recent data, estimates from UNESCO Institute for Statistics 2003 based on outdated census or survey information, were used and should be interpreted with caution: Barbados
0.3, Comoros 43.2, Djibouti 29.7, Eritrea 39.5, Fiji 5.6, Gambia 57.5, Guinea-Bissau 55.2, Guyana 1.0, Haiti 45.2, and Lebanon 11.7.
g. UNICEF 2005.h. UNESCO Institute for Statistics estimates based on
its Global Age-specific Literacy Projections model (2007).
i. An adult illiteracy rate of 0.2 was used to calculate the HPI-1 for Cuba.
j. Data are from national sources.k. Data are from the Secretariat of the Caribbean
Community, based on national sources.l. UNICEF 2004.m. UNDP 2006.
SOURCESColumn1: determined on the basis of HPI-1 values in column 2.Column2: calculated on the basis of data in columns 3–6, see Technical note 1 for details.Column3: UN 2007e.Column4: calculated on the basis of data on adult literacy rates from UNESCO Institute for Statistics 2007a.Column5: UN 2006a, based on a joint effort by UNICEF and WHO.Column6: UNICEF 2006. Columns7–9: World Bank 2007b. Column10: calculated on the basis of data in columns 1 and 7.
LOWHUMANDEVELOPMENT
156 Senegal 97 42.9 17.1 60.7 24 17 17.0 56.2 33.4 28
157 Eritrea 76 36.0 24.1 ..f 40 40 .. .. 53.0 ..
158 Nigeria 80 37.3 39.0 30.9h 52 29 70.8 92.4 34.1 -19
159 Tanzania (United Republic of) 67 32.5 36.2 30.6 38 22 57.8 89.9 35.7 -22
160 Guinea 103 52.3 28.6 70.5 50 26 .. .. 40.0 ..
161 Rwanda 78 36.5 44.6 35.1 26 23 60.3 87.8 60.3 -16
162 Angola 89 40.3 46.7 32.6 47 31 .. .. .. ..
163 Benin 100 47.6 27.9 65.3 33 23 30.9 73.7 29.0 16
164 Malawi 79 36.7 44.4 35.9 27 22 20.8 62.9 65.3 11
165 Zambia 96 41.8 53.9 32.0 42 20 63.8 87.2 68.0 -7
166 Côte d’Ivoire 92 40.3 38.6 51.3 16 17 14.8 48.8 .. 29
167 Burundi 81 37.6 38.2 40.7 21 45 54.6 87.6 36.4 -8
168 Congo (Democratic Republic of the) 88 39.3 41.1 32.8 54 31 .. .. .. ..
169 Ethiopia 105 54.9 33.3 64.1 78 38 23.0 77.8 44.2 27
170 Chad 108 56.9 32.9 74.3 58 37 .. .. 64.0 ..
171 Central African Republic 98 43.6 46.2 51.4 25 24 66.6 84.0 .. -6
172 Mozambique 101 50.6 45.0 61.3 57 24 36.2 74.1 69.4 12
173 Mali 107 56.4 30.4 76.0 50 33 36.1 72.1 63.8 18
174 Niger 104 54.7 28.7 71.3 54 40 60.6 85.8 63.0e 1
175 Guinea-Bissau 99 44.8 40.5 ..f 41 25 .. .. .. ..
176 Burkina Faso 106 55.8 26.5 76.4 39 38 27.2 71.8 46.4 23
177 Sierra Leone 102 51.7 45.6 65.2 43 27 57.0e 74.5e 70.2 4
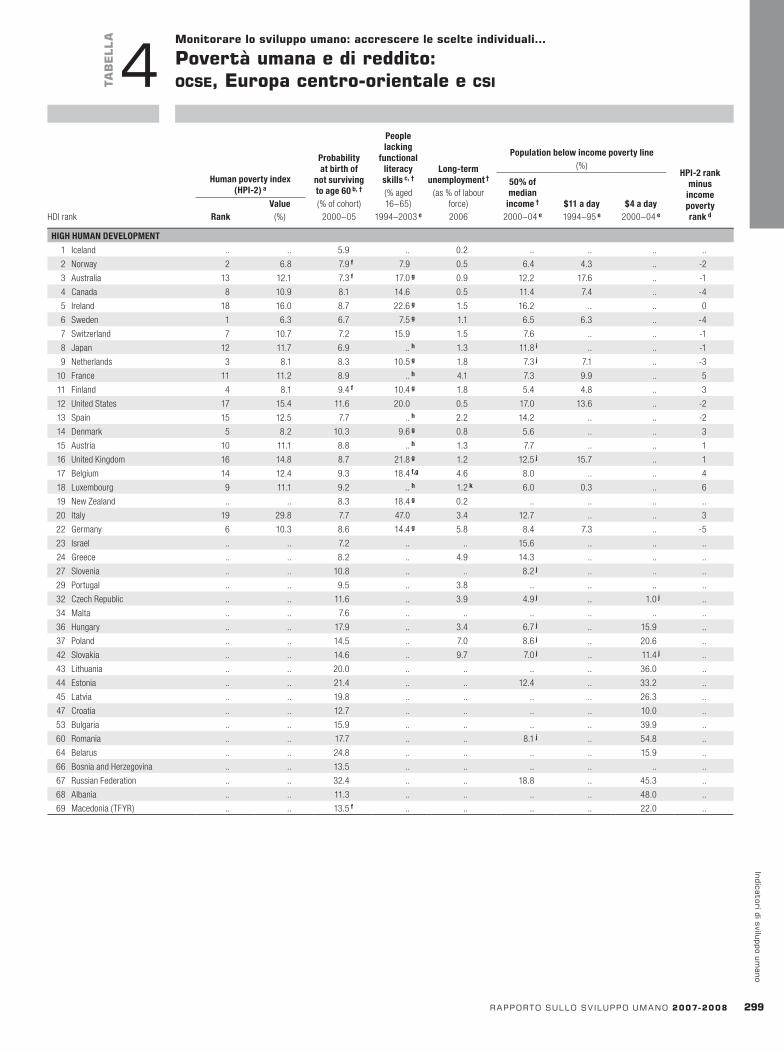
HDI rank
Humanpovertyindex(HPI-2)a
Probabilityatbirthof
notsurvivingtoage60b,†
(% of cohort)2000–05
Peoplelacking
functionalliteracyskillsc,†
(% aged 16–65)
1994–2003e
Long-termunemployment†
(as % of labour force)2006
Populationbelowincomepovertyline(%)
HPI-2rankminus
incomepovertyrankd
50%ofmedian
income†
2000–04e
$11aday1994–95e
$4aday2000–04eRank
Value(%)
rapportosullosv iluppoumano2007-2008 2��
indicatoridisviluppoumano
povertàumanaedireddito:ocse,Europacentro-orientaleecsi
Monitorarelosviluppoumano:accrescerelescelteindividuali…
TaB
ELLa
4
HIGHHUMANDEVELOPMENT
1 Iceland .. .. 5.9 .. 0.2 .. .. .. ..
2 Norway 2 6.8 7.9f 7.9 0.5 6.4 4.3 .. -2
3 Australia 13 12.1 7.3f 17.0g 0.9 12.2 17.6 .. -1
4 Canada 8 10.9 8.1 14.6 0.5 11.4 7.4 .. -4
5 Ireland 18 16.0 8.7 22.6g 1.5 16.2 .. .. 0
6 Sweden 1 6.3 6.7 7.5g 1.1 6.5 6.3 .. -4
7 Switzerland 7 10.7 7.2 15.9 1.5 7.6 .. .. -1
8 Japan 12 11.7 6.9 ..h 1.3 11.8i .. .. -1
9 Netherlands 3 8.1 8.3 10.5g 1.8 7.3j 7.1 .. -3
10 France 11 11.2 8.9 ..h 4.1 7.3 9.9 .. 5
11 Finland 4 8.1 9.4f 10.4g 1.8 5.4 4.8 .. 3
12 United States 17 15.4 11.6 20.0 0.5 17.0 13.6 .. -2
13 Spain 15 12.5 7.7 ..h 2.2 14.2 .. .. -2
14 Denmark 5 8.2 10.3 9.6g 0.8 5.6 .. .. 3
15 Austria 10 11.1 8.8 ..h 1.3 7.7 .. .. 1
16 United Kingdom 16 14.8 8.7 21.8g 1.2 12.5j 15.7 .. 1
17 Belgium 14 12.4 9.3 18.4f,g 4.6 8.0 .. .. 4
18 Luxembourg 9 11.1 9.2 ..h 1.2k 6.0 0.3 .. 6
19 New Zealand .. .. 8.3 18.4g 0.2 .. .. .. ..
20 Italy 19 29.8 7.7 47.0 3.4 12.7 .. .. 3
22 Germany 6 10.3 8.6 14.4g 5.8 8.4 7.3 .. -5
23 Israel .. .. 7.2 .. .. 15.6 .. .. ..
24 Greece .. .. 8.2 .. 4.9 14.3 .. .. ..
27 Slovenia .. .. 10.8 .. .. 8.2j .. .. ..
29 Portugal .. .. 9.5 .. 3.8 .. .. .. ..
32 Czech Republic .. .. 11.6 .. 3.9 4.9j .. 1.0j ..
34 Malta .. .. 7.6 .. .. .. .. .. ..
36 Hungary .. .. 17.9 .. 3.4 6.7j .. 15.9 ..
37 Poland .. .. 14.5 .. 7.0 8.6j .. 20.6 ..
42 Slovakia .. .. 14.6 .. 9.7 7.0j .. 11.4j ..
43 Lithuania .. .. 20.0 .. .. .. .. 36.0 ..
44 Estonia .. .. 21.4 .. .. 12.4 .. 33.2 ..
45 Latvia .. .. 19.8 .. .. .. .. 26.3 ..
47 Croatia .. .. 12.7 .. .. .. .. 10.0 ..
53 Bulgaria .. .. 15.9 .. .. .. .. 39.9 ..
60 Romania .. .. 17.7 .. .. 8.1j .. 54.8 ..
64 Belarus .. .. 24.8 .. .. .. .. 15.9 ..
66 Bosnia and Herzegovina .. .. 13.5 .. .. .. .. .. ..
67 Russian Federation .. .. 32.4 .. .. 18.8 .. 45.3 ..
68 Albania .. .. 11.3 .. .. .. .. 48.0 ..
69 Macedonia (TFYR) .. .. 13.5f .. .. .. .. 22.0 ..
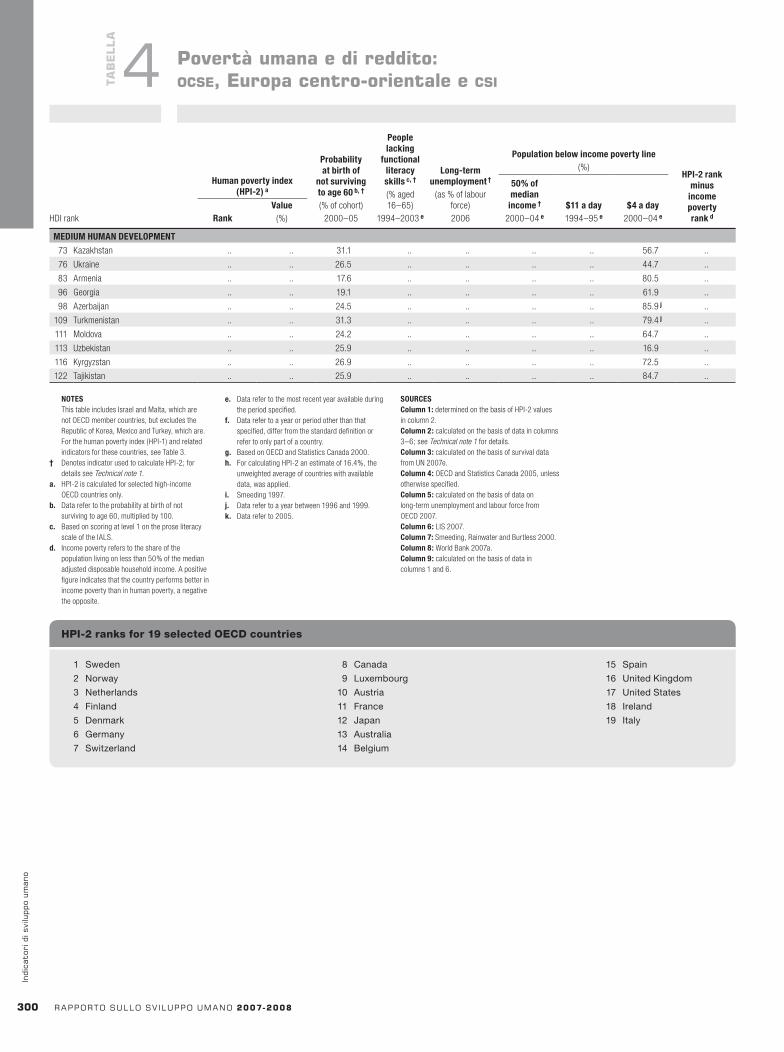
HDI rank
Humanpovertyindex(HPI-2)a
Probabilityatbirthof
notsurvivingtoage60b,†
(% of cohort)2000–05
Peoplelacking
functionalliteracyskillsc,†
(% aged 16–65)
1994–2003e
Long-termunemployment†
(as % of labour force)2006
Populationbelowincomepovertyline(%)
HPI-2rankminus
incomepovertyrankd
50%ofmedian
income†
2000–04e
$11aday1994–95e
$4aday2000–04eRank
Value(%) HDI rank
Totalpopulation(millions)
Annualpopulationgrowthrate
(%) Urbanpopulationa
(% of total)
Populationunderage15
(% of total)
Populationaged65andolder
(% of total)
Totalfertilityrate
(births per woman)
1975–2005
2005–2015b
1970–1975c
2000–2005c1975 2005 2015b 1975 2005 2015b 2005 2015b 2005 2015b
300 rapportosullosv iluppoumano2007-2008
indi
cato
rid
isvi
lupp
oum
ano
NOTES This table includes Israel and Malta, which are
not OECD member countries, but excludes the Republic of Korea, Mexico and Turkey, which are. For the human poverty index (HPI-1) and related indicators for these countries, see Table 3.
† Denotes indicator used to calculate HPI-2; for details see Technical note 1.
a. HPI-2 is calculated for selected high-income OECD countries only.
b. Data refer to the probability at birth of not surviving to age 60, multiplied by 100.
c. Based on scoring at level 1 on the prose literacy scale of the IALS.
d. Income poverty refers to the share of the population living on less than 50% of the median adjusted disposable household income. A positive figure indicates that the country performs better in income poverty than in human poverty, a negative the opposite.
e. Data refer to the most recent year available during the period specified.
f. Data refer to a year or period other than that specified, differ from the standard definition or refer to only part of a country.
g. Based on OECD and Statistics Canada 2000. h. For calculating HPI-2 an estimate of 16.4%, the
unweighted average of countries with available data, was applied.
i. Smeeding 1997.j. Data refer to a year between 1996 and 1999.k. Data refer to 2005.
SOURCESColumn1: determined on the basis of HPI-2 values in column 2.Column2: calculated on the basis of data in columns 3–6; see Technical note 1 for details.Column3: calculated on the basis of survival data from UN 2007e. Column4: OECD and Statistics Canada 2005, unless otherwise specified.Column5: calculated on the basis of data on long-term unemployment and labour force from OECD 2007. Column6: LIS 2007.Column7: Smeeding, Rainwater and Burtless 2000. Column8: World Bank 2007a. Column9: calculated on the basis of data in columns 1 and 6.
1 Sweden
2 Norway
3 Netherlands
4 Finland
5 Denmark
6 Germany
7 Switzerland
8 Canada
9 Luxembourg
10 Austria
11 France
12 Japan
13 Australia
14 Belgium
15 Spain
16 United Kingdom
17 United States
18 Ireland
19 Italy
HPI-2 ranks for 19 selected OECD countries
povertàumanaedireddito:ocse,Europacentro-orientaleecsiTa
BELLa
4
MEDIUMHUMANDEVELOPMENT
73 Kazakhstan .. .. 31.1 .. .. .. .. 56.7 ..
76 Ukraine .. .. 26.5 .. .. .. .. 44.7 ..
83 Armenia .. .. 17.6 .. .. .. .. 80.5 ..
96 Georgia .. .. 19.1 .. .. .. .. 61.9 ..
98 Azerbaijan .. .. 24.5 .. .. .. .. 85.9j ..
109 Turkmenistan .. .. 31.3 .. .. .. .. 79.4j ..
111 Moldova .. .. 24.2 .. .. .. .. 64.7 ..
113 Uzbekistan .. .. 25.9 .. .. .. .. 16.9 ..
116 Kyrgyzstan .. .. 26.9 .. .. .. .. 72.5 ..
122 Tajikistan .. .. 25.9 .. .. .. .. 84.7 ..
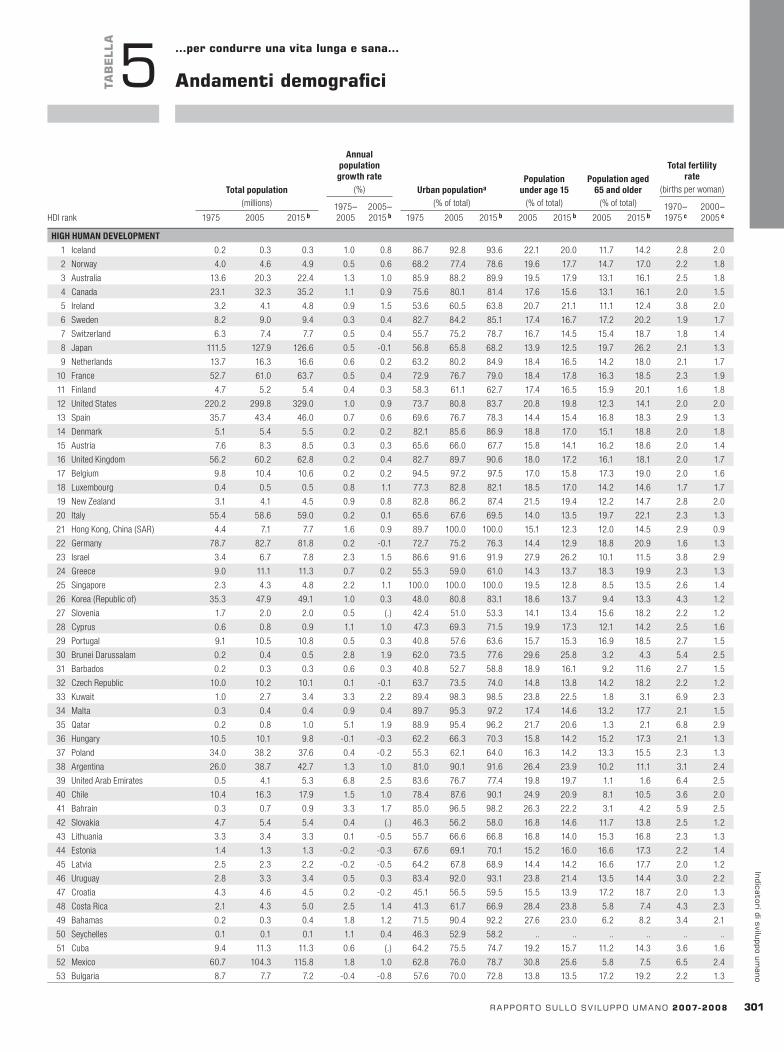
HDI rank
Totalpopulation(millions)
Annualpopulationgrowthrate
(%) Urbanpopulationa
(% of total)
Populationunderage15
(% of total)
Populationaged65andolder
(% of total)
Totalfertilityrate
(births per woman)
1975–2005
2005–2015b
1970–1975c
2000–2005c1975 2005 2015b 1975 2005 2015b 2005 2015b 2005 2015b
rapportosullosv iluppoumano2007-2008 301
indicatoridisviluppoumano
TaB
ELLa
5 …percondurreunavitalungaesana…
andamentidemografici
HIGHHUMANDEVELOPMENT
1 Iceland 0.2 0.3 0.3 1.0 0.8 86.7 92.8 93.6 22.1 20.0 11.7 14.2 2.8 2.0
2 Norway 4.0 4.6 4.9 0.5 0.6 68.2 77.4 78.6 19.6 17.7 14.7 17.0 2.2 1.8
3 Australia 13.6 20.3 22.4 1.3 1.0 85.9 88.2 89.9 19.5 17.9 13.1 16.1 2.5 1.8
4 Canada 23.1 32.3 35.2 1.1 0.9 75.6 80.1 81.4 17.6 15.6 13.1 16.1 2.0 1.5
5 Ireland 3.2 4.1 4.8 0.9 1.5 53.6 60.5 63.8 20.7 21.1 11.1 12.4 3.8 2.0
6 Sweden 8.2 9.0 9.4 0.3 0.4 82.7 84.2 85.1 17.4 16.7 17.2 20.2 1.9 1.7
7 Switzerland 6.3 7.4 7.7 0.5 0.4 55.7 75.2 78.7 16.7 14.5 15.4 18.7 1.8 1.4
8 Japan 111.5 127.9 126.6 0.5 -0.1 56.8 65.8 68.2 13.9 12.5 19.7 26.2 2.1 1.3
9 Netherlands 13.7 16.3 16.6 0.6 0.2 63.2 80.2 84.9 18.4 16.5 14.2 18.0 2.1 1.7
10 France 52.7 61.0 63.7 0.5 0.4 72.9 76.7 79.0 18.4 17.8 16.3 18.5 2.3 1.9
11 Finland 4.7 5.2 5.4 0.4 0.3 58.3 61.1 62.7 17.4 16.5 15.9 20.1 1.6 1.8
12 United States 220.2 299.8 329.0 1.0 0.9 73.7 80.8 83.7 20.8 19.8 12.3 14.1 2.0 2.0
13 Spain 35.7 43.4 46.0 0.7 0.6 69.6 76.7 78.3 14.4 15.4 16.8 18.3 2.9 1.3
14 Denmark 5.1 5.4 5.5 0.2 0.2 82.1 85.6 86.9 18.8 17.0 15.1 18.8 2.0 1.8
15 Austria 7.6 8.3 8.5 0.3 0.3 65.6 66.0 67.7 15.8 14.1 16.2 18.6 2.0 1.4
16 United Kingdom 56.2 60.2 62.8 0.2 0.4 82.7 89.7 90.6 18.0 17.2 16.1 18.1 2.0 1.7
17 Belgium 9.8 10.4 10.6 0.2 0.2 94.5 97.2 97.5 17.0 15.8 17.3 19.0 2.0 1.6
18 Luxembourg 0.4 0.5 0.5 0.8 1.1 77.3 82.8 82.1 18.5 17.0 14.2 14.6 1.7 1.7
19 New Zealand 3.1 4.1 4.5 0.9 0.8 82.8 86.2 87.4 21.5 19.4 12.2 14.7 2.8 2.0
20 Italy 55.4 58.6 59.0 0.2 0.1 65.6 67.6 69.5 14.0 13.5 19.7 22.1 2.3 1.3
21 Hong Kong, China (SAR) 4.4 7.1 7.7 1.6 0.9 89.7 100.0 100.0 15.1 12.3 12.0 14.5 2.9 0.9
22 Germany 78.7 82.7 81.8 0.2 -0.1 72.7 75.2 76.3 14.4 12.9 18.8 20.9 1.6 1.3
23 Israel 3.4 6.7 7.8 2.3 1.5 86.6 91.6 91.9 27.9 26.2 10.1 11.5 3.8 2.9
24 Greece 9.0 11.1 11.3 0.7 0.2 55.3 59.0 61.0 14.3 13.7 18.3 19.9 2.3 1.3
25 Singapore 2.3 4.3 4.8 2.2 1.1 100.0 100.0 100.0 19.5 12.8 8.5 13.5 2.6 1.4
26 Korea (Republic of) 35.3 47.9 49.1 1.0 0.3 48.0 80.8 83.1 18.6 13.7 9.4 13.3 4.3 1.2
27 Slovenia 1.7 2.0 2.0 0.5 (.) 42.4 51.0 53.3 14.1 13.4 15.6 18.2 2.2 1.2
28 Cyprus 0.6 0.8 0.9 1.1 1.0 47.3 69.3 71.5 19.9 17.3 12.1 14.2 2.5 1.6
29 Portugal 9.1 10.5 10.8 0.5 0.3 40.8 57.6 63.6 15.7 15.3 16.9 18.5 2.7 1.5
30 Brunei Darussalam 0.2 0.4 0.5 2.8 1.9 62.0 73.5 77.6 29.6 25.8 3.2 4.3 5.4 2.5
31 Barbados 0.2 0.3 0.3 0.6 0.3 40.8 52.7 58.8 18.9 16.1 9.2 11.6 2.7 1.5
32 Czech Republic 10.0 10.2 10.1 0.1 -0.1 63.7 73.5 74.0 14.8 13.8 14.2 18.2 2.2 1.2
33 Kuwait 1.0 2.7 3.4 3.3 2.2 89.4 98.3 98.5 23.8 22.5 1.8 3.1 6.9 2.3
34 Malta 0.3 0.4 0.4 0.9 0.4 89.7 95.3 97.2 17.4 14.6 13.2 17.7 2.1 1.5
35 Qatar 0.2 0.8 1.0 5.1 1.9 88.9 95.4 96.2 21.7 20.6 1.3 2.1 6.8 2.9
36 Hungary 10.5 10.1 9.8 -0.1 -0.3 62.2 66.3 70.3 15.8 14.2 15.2 17.3 2.1 1.3
37 Poland 34.0 38.2 37.6 0.4 -0.2 55.3 62.1 64.0 16.3 14.2 13.3 15.5 2.3 1.3
38 Argentina 26.0 38.7 42.7 1.3 1.0 81.0 90.1 91.6 26.4 23.9 10.2 11.1 3.1 2.4
39 United Arab Emirates 0.5 4.1 5.3 6.8 2.5 83.6 76.7 77.4 19.8 19.7 1.1 1.6 6.4 2.5
40 Chile 10.4 16.3 17.9 1.5 1.0 78.4 87.6 90.1 24.9 20.9 8.1 10.5 3.6 2.0
41 Bahrain 0.3 0.7 0.9 3.3 1.7 85.0 96.5 98.2 26.3 22.2 3.1 4.2 5.9 2.5
42 Slovakia 4.7 5.4 5.4 0.4 (.) 46.3 56.2 58.0 16.8 14.6 11.7 13.8 2.5 1.2
43 Lithuania 3.3 3.4 3.3 0.1 -0.5 55.7 66.6 66.8 16.8 14.0 15.3 16.8 2.3 1.3
44 Estonia 1.4 1.3 1.3 -0.2 -0.3 67.6 69.1 70.1 15.2 16.0 16.6 17.3 2.2 1.4
45 Latvia 2.5 2.3 2.2 -0.2 -0.5 64.2 67.8 68.9 14.4 14.2 16.6 17.7 2.0 1.2
46 Uruguay 2.8 3.3 3.4 0.5 0.3 83.4 92.0 93.1 23.8 21.4 13.5 14.4 3.0 2.2
47 Croatia 4.3 4.6 4.5 0.2 -0.2 45.1 56.5 59.5 15.5 13.9 17.2 18.7 2.0 1.3
48 Costa Rica 2.1 4.3 5.0 2.5 1.4 41.3 61.7 66.9 28.4 23.8 5.8 7.4 4.3 2.3
49 Bahamas 0.2 0.3 0.4 1.8 1.2 71.5 90.4 92.2 27.6 23.0 6.2 8.2 3.4 2.1
50 Seychelles 0.1 0.1 0.1 1.1 0.4 46.3 52.9 58.2 .. .. .. .. .. ..
51 Cuba 9.4 11.3 11.3 0.6 (.) 64.2 75.5 74.7 19.2 15.7 11.2 14.3 3.6 1.6
52 Mexico 60.7 104.3 115.8 1.8 1.0 62.8 76.0 78.7 30.8 25.6 5.8 7.5 6.5 2.4
53 Bulgaria 8.7 7.7 7.2 -0.4 -0.8 57.6 70.0 72.8 13.8 13.5 17.2 19.2 2.2 1.3

HDI rank
Totalpopulation(millions)
Annualpopulationgrowthrate
(%) Urbanpopulationa
(% of total)
Populationunderage15
(% of total)
Populationaged65andolder
(% of total)
Totalfertilityrate
(births per woman)
1975–2005
2005–2015b
1970–1975c
2000–2005c1975 2005 2015b 1975 2005 2015b 2005 2015b 2005 2015bHDI rank
Totalpopulation(millions)
Annualpopulationgrowthrate
(%) Urbanpopulationa
(% of total)
Populationunderage15
(% of total)
Populationaged65andolder
(% of total)
Totalfertilityrate
(births per woman)
1975–2005
2005–2015b
1970–1975c
2000–2005c1975 2005 2015b 1975 2005 2015b 2005 2015b 2005 2015b
302 rapportosullosv iluppoumano2007-2008
indi
cato
rid
isvi
lupp
oum
ano
TaB
ELLa
5 andamentidemografici
54 Saint Kitts and Nevis (.) (.) 0.1 0.3 1.2 35.0 32.2 33.5 .. .. .. .. .. ..
55 Tonga 0.1 0.1 0.1 0.2 0.4 20.3 24.0 27.4 37.5 33.9 6.4 6.8 5.5 3.7
56 Libyan Arab Jamahiriya 2.5 5.9 7.1 2.9 1.9 57.3 84.8 87.4 30.3 29.4 3.8 4.9 7.6 3.0
57 Antigua and Barbuda 0.1 0.1 0.1 0.3 1.1 34.2 39.1 44.7 .. .. .. .. .. ..
58 Oman 0.9 2.5 3.1 3.4 2.0 34.1 71.5 72.3 33.8 28.6 2.6 3.6 7.2 3.7
59 Trinidad and Tobago 1.0 1.3 1.4 0.9 0.4 11.4 12.2 15.8 22.2 20.8 6.5 8.2 3.5 1.6
60 Romania 21.2 21.6 20.6 0.1 -0.5 42.8 53.7 56.1 15.7 14.7 14.8 15.7 2.6 1.3
61 Saudi Arabia 7.3 23.6 29.3 3.9 2.1 58.3 81.0 83.2 34.5 30.7 2.8 3.3 7.3 3.8
62 Panama 1.7 3.2 3.8 2.1 1.6 49.0 70.8 77.9 30.4 27.2 6.0 7.5 4.9 2.7
63 Malaysia 12.3 25.7 30.0 2.5 1.6 37.7 67.3 75.4 31.4 27.3 4.4 5.8 5.2 2.9
64 Belarus 9.4 9.8 9.3 0.1 -0.6 50.6 72.2 76.7 15.7 14.4 14.4 13.7 2.3 1.2
65 Mauritius 0.9 1.2 1.3 1.1 0.7 43.4 42.4 44.1 24.4 20.9 6.6 8.3 3.2 1.9
66 Bosnia and Herzegovina 3.7 3.9 3.9 0.1 (.) 31.3 45.7 51.8 17.6 13.9 13.7 16.3 2.6 1.3
67 Russian Federation 134.2 144.0 136.5 0.2 -0.5 66.9 73.0 72.6 15.1 15.9 13.8 13.1 2.0 1.3
68 Albania 2.4 3.2 3.3 0.9 0.6 32.7 45.4 52.8 26.3 22.3 8.4 10.6 4.7 2.2
69 Macedonia (TFYR) 1.7 2.0 2.0 0.6 (.) 50.6 68.9 75.1 19.7 16.2 11.1 13.0 3.0 1.6
70 Brazil 108.1 186.8 210.0 1.8 1.2 61.7 84.2 88.2 27.8 25.4 6.1 7.7 4.7 2.3
MEDIUMHUMANDEVELOPMENT
71 Dominica 0.1 0.1 0.1 (.) -0.1 55.3 72.9 76.4 .. .. .. .. .. ..
72 Saint Lucia 0.1 0.2 0.2 1.3 1.1 25.2 27.6 29.0 27.9 25.4 7.2 7.3 5.7 2.2
73 Kazakhstan 14.1 15.2 16.3 0.2 0.7 52.6 57.3 60.3 24.2 24.9 8.0 7.5 3.5 2.0
74 Venezuela (Bolivarian Republic of) 12.7 26.7 31.3 2.5 1.6 75.8 93.4 95.9 31.3 27.9 5.0 6.6 4.9 2.7
75 Colombia 25.3 44.9 50.7 1.9 1.2 60.0 72.7 75.7 30.3 25.4 5.1 6.8 5.0 2.5
76 Ukraine 49.0 46.9 43.4 -0.1 -0.8 58.4 67.8 70.2 14.7 13.9 16.1 15.9 2.2 1.2
77 Samoa 0.2 0.2 0.2 0.7 0.8 21.0 22.4 24.9 40.8 33.8 4.6 4.8 5.7 4.4
78 Thailand 42.2 63.0 66.8 1.3 0.6 23.8 32.3 36.2 21.7 19.7 7.8 10.2 5.0 1.8
79 Dominican Republic 5.3 9.5 10.9 2.0 1.4 45.7 66.8 73.6 33.5 30.5 5.6 6.7 5.7 3.0
80 Belize 0.1 0.3 0.3 2.4 2.0 50.2 48.3 51.2 37.6 32.0 4.2 4.6 6.3 3.4
81 China 927.8d 1,313.0d 1,388.6d 1.2d 0.6d 17.4 40.4 49.2 21.6 18.5 7.7 9.6 4.9 1.7
82 Grenada 0.1 0.1 0.1 0.4 0.1 32.6 30.6 32.2 34.2 26.7 6.8 6.0 4.6 2.4
83 Armenia 2.8 3.0 3.0 0.2 -0.1 63.6 64.1 64.1 20.8 17.5 12.1 11.0 3.0 1.3
84 Turkey 41.2 73.0 82.1 1.9 1.2 41.6 67.3 71.9 28.3 24.4 5.6 6.5 5.3 2.2
85 Suriname 0.4 0.5 0.5 0.7 0.5 49.5 73.9 77.4 29.8 26.2 6.3 7.3 5.3 2.6
86 Jordan 1.9 5.5 6.9 3.5 2.2 57.7 82.3 85.3 37.2 32.2 3.2 3.9 7.8 3.5
87 Peru 15.2 27.3 30.8 2.0 1.2 61.5 72.6 74.9 31.8 27.4 5.6 6.7 6.0 2.7
88 Lebanon 2.7 4.0 4.4 1.3 1.0 67.0 86.6 87.9 28.6 24.6 7.2 7.6 4.8 2.3
89 Ecuador 6.9 13.1 14.6 2.1 1.1 42.4 62.8 67.6 32.6 28.2 5.9 7.5 6.0 2.8
90 Philippines 42.0 84.6 101.1 2.3 1.8 35.6 62.7 69.6 36.2 32.5 3.8 4.7 6.0 3.5
91 Tunisia 5.7 10.1 11.2 1.9 1.0 49.9 65.3 69.1 26.0 22.5 6.3 6.7 6.2 2.0
92 Fiji 0.6 0.8 0.9 1.2 0.5 36.7 50.8 56.1 32.9 28.7 4.2 6.0 4.2 3.0
93 Saint Vincent and the Grenadines 0.1 0.1 0.1 0.7 0.4 27.0 45.9 50.0 29.3 26.8 6.5 7.0 5.5 2.3
94 Iran ( Islamic Republic of) 33.3 69.4 79.4 2.4 1.3 45.7 66.9 71.9 28.8 25.6 4.5 4.9 6.4 2.1
95 Paraguay 2.8 5.9 7.0 2.5 1.7 39.0 58.5 64.4 35.8 31.4 4.8 5.8 5.4 3.5
96 Georgia 4.9 4.5 4.2 -0.3 -0.7 49.5 52.2 53.8 18.9 15.9 14.3 14.4 2.6 1.5
97 Guyana 0.7 0.7 0.7 (.) -0.3 30.0 28.2 29.4 31.1 25.3 5.7 8.2 4.9 2.4
98 Azerbaijan 5.7 8.4 9.0 1.3 0.8 51.9 51.5 52.8 25.3 20.6 7.2 6.8 4.3 1.7
99 Sri Lanka 13.7 19.1 20.0 1.1 0.4 19.5 15.1 15.7 24.2 21.4 6.5 9.3 4.1 2.0
100 Maldives 0.1 0.3 0.4 2.6 1.8 17.3 29.6 34.8 34.0 29.0 3.8 3.9 7.0 2.8
101 Jamaica 2.0 2.7 2.8 1.0 0.5 44.1 53.1 56.7 31.7 27.9 7.5 7.9 5.0 2.6
102 Cape Verde 0.3 0.5 0.6 2.0 2.1 21.4 57.3 64.3 39.5 35.6 4.3 3.3 7.0 3.8
103 El Salvador 4.1 6.7 7.6 1.6 1.3 41.5 59.8 63.2 34.1 29.7 5.5 6.5 6.1 2.9
104 Algeria 16.0 32.9 38.1 2.4 1.5 40.3 63.3 69.3 29.6 26.7 4.5 5.0 7.4 2.5
105 Viet Nam 48.0 85.0 96.5 1.9 1.3 18.8 26.4 31.6 29.6 25.0 5.6 5.8 6.7 2.3
106 Occupied Palestinian Territories 1.3 3.8 5.1 3.7 3.0 59.6 71.6 72.9 45.9 41.9 3.1 3.0 7.7 5.6
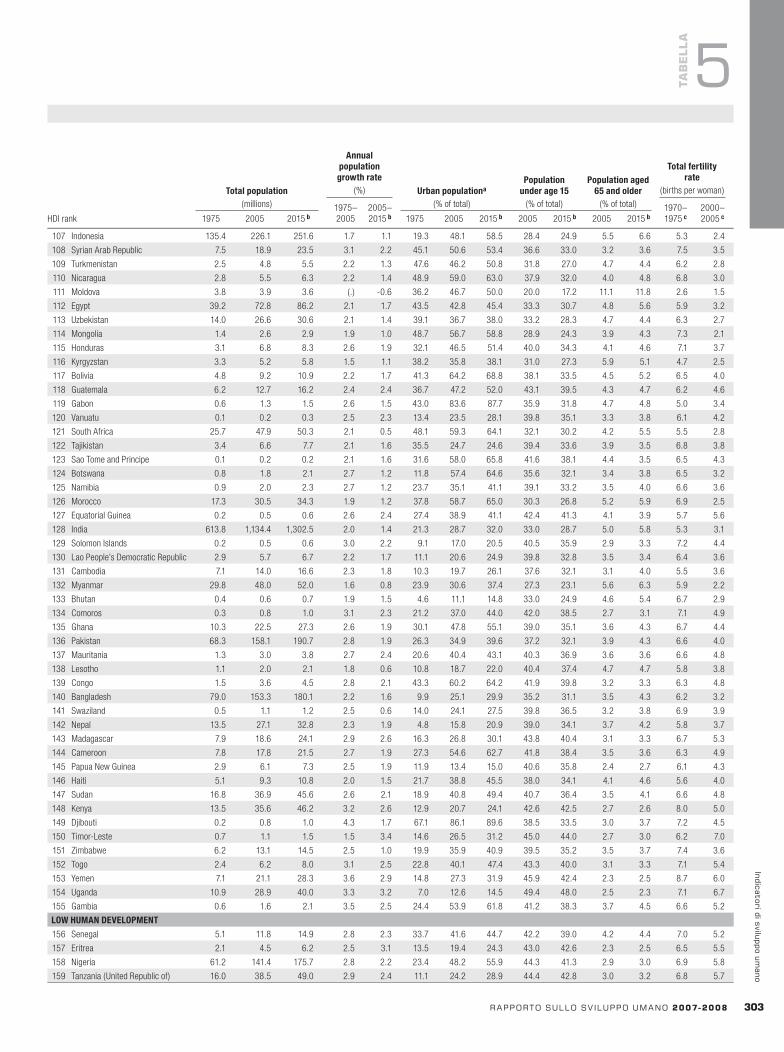
HDI rank
Totalpopulation(millions)
Annualpopulationgrowthrate
(%) Urbanpopulationa
(% of total)
Populationunderage15
(% of total)
Populationaged65andolder
(% of total)
Totalfertilityrate
(births per woman)
1975–2005
2005–2015b
1970–1975c
2000–2005c1975 2005 2015b 1975 2005 2015b 2005 2015b 2005 2015b
rapportosullosv iluppoumano2007-2008 303
indicatoridisviluppoumano
TaB
ELLa
5
107 Indonesia 135.4 226.1 251.6 1.7 1.1 19.3 48.1 58.5 28.4 24.9 5.5 6.6 5.3 2.4
108 Syrian Arab Republic 7.5 18.9 23.5 3.1 2.2 45.1 50.6 53.4 36.6 33.0 3.2 3.6 7.5 3.5
109 Turkmenistan 2.5 4.8 5.5 2.2 1.3 47.6 46.2 50.8 31.8 27.0 4.7 4.4 6.2 2.8
110 Nicaragua 2.8 5.5 6.3 2.2 1.4 48.9 59.0 63.0 37.9 32.0 4.0 4.8 6.8 3.0
111 Moldova 3.8 3.9 3.6 (.) -0.6 36.2 46.7 50.0 20.0 17.2 11.1 11.8 2.6 1.5
112 Egypt 39.2 72.8 86.2 2.1 1.7 43.5 42.8 45.4 33.3 30.7 4.8 5.6 5.9 3.2
113 Uzbekistan 14.0 26.6 30.6 2.1 1.4 39.1 36.7 38.0 33.2 28.3 4.7 4.4 6.3 2.7
114 Mongolia 1.4 2.6 2.9 1.9 1.0 48.7 56.7 58.8 28.9 24.3 3.9 4.3 7.3 2.1
115 Honduras 3.1 6.8 8.3 2.6 1.9 32.1 46.5 51.4 40.0 34.3 4.1 4.6 7.1 3.7
116 Kyrgyzstan 3.3 5.2 5.8 1.5 1.1 38.2 35.8 38.1 31.0 27.3 5.9 5.1 4.7 2.5
117 Bolivia 4.8 9.2 10.9 2.2 1.7 41.3 64.2 68.8 38.1 33.5 4.5 5.2 6.5 4.0
118 Guatemala 6.2 12.7 16.2 2.4 2.4 36.7 47.2 52.0 43.1 39.5 4.3 4.7 6.2 4.6
119 Gabon 0.6 1.3 1.5 2.6 1.5 43.0 83.6 87.7 35.9 31.8 4.7 4.8 5.0 3.4
120 Vanuatu 0.1 0.2 0.3 2.5 2.3 13.4 23.5 28.1 39.8 35.1 3.3 3.8 6.1 4.2
121 South Africa 25.7 47.9 50.3 2.1 0.5 48.1 59.3 64.1 32.1 30.2 4.2 5.5 5.5 2.8
122 Tajikistan 3.4 6.6 7.7 2.1 1.6 35.5 24.7 24.6 39.4 33.6 3.9 3.5 6.8 3.8
123 Sao Tome and Principe 0.1 0.2 0.2 2.1 1.6 31.6 58.0 65.8 41.6 38.1 4.4 3.5 6.5 4.3
124 Botswana 0.8 1.8 2.1 2.7 1.2 11.8 57.4 64.6 35.6 32.1 3.4 3.8 6.5 3.2
125 Namibia 0.9 2.0 2.3 2.7 1.2 23.7 35.1 41.1 39.1 33.2 3.5 4.0 6.6 3.6
126 Morocco 17.3 30.5 34.3 1.9 1.2 37.8 58.7 65.0 30.3 26.8 5.2 5.9 6.9 2.5
127 Equatorial Guinea 0.2 0.5 0.6 2.6 2.4 27.4 38.9 41.1 42.4 41.3 4.1 3.9 5.7 5.6
128 India 613.8 1,134.4 1,302.5 2.0 1.4 21.3 28.7 32.0 33.0 28.7 5.0 5.8 5.3 3.1
129 Solomon Islands 0.2 0.5 0.6 3.0 2.2 9.1 17.0 20.5 40.5 35.9 2.9 3.3 7.2 4.4
130 Lao People’s Democratic Republic 2.9 5.7 6.7 2.2 1.7 11.1 20.6 24.9 39.8 32.8 3.5 3.4 6.4 3.6
131 Cambodia 7.1 14.0 16.6 2.3 1.8 10.3 19.7 26.1 37.6 32.1 3.1 4.0 5.5 3.6
132 Myanmar 29.8 48.0 52.0 1.6 0.8 23.9 30.6 37.4 27.3 23.1 5.6 6.3 5.9 2.2
133 Bhutan 0.4 0.6 0.7 1.9 1.5 4.6 11.1 14.8 33.0 24.9 4.6 5.4 6.7 2.9
134 Comoros 0.3 0.8 1.0 3.1 2.3 21.2 37.0 44.0 42.0 38.5 2.7 3.1 7.1 4.9
135 Ghana 10.3 22.5 27.3 2.6 1.9 30.1 47.8 55.1 39.0 35.1 3.6 4.3 6.7 4.4
136 Pakistan 68.3 158.1 190.7 2.8 1.9 26.3 34.9 39.6 37.2 32.1 3.9 4.3 6.6 4.0
137 Mauritania 1.3 3.0 3.8 2.7 2.4 20.6 40.4 43.1 40.3 36.9 3.6 3.6 6.6 4.8
138 Lesotho 1.1 2.0 2.1 1.8 0.6 10.8 18.7 22.0 40.4 37.4 4.7 4.7 5.8 3.8
139 Congo 1.5 3.6 4.5 2.8 2.1 43.3 60.2 64.2 41.9 39.8 3.2 3.3 6.3 4.8
140 Bangladesh 79.0 153.3 180.1 2.2 1.6 9.9 25.1 29.9 35.2 31.1 3.5 4.3 6.2 3.2
141 Swaziland 0.5 1.1 1.2 2.5 0.6 14.0 24.1 27.5 39.8 36.5 3.2 3.8 6.9 3.9
142 Nepal 13.5 27.1 32.8 2.3 1.9 4.8 15.8 20.9 39.0 34.1 3.7 4.2 5.8 3.7
143 Madagascar 7.9 18.6 24.1 2.9 2.6 16.3 26.8 30.1 43.8 40.4 3.1 3.3 6.7 5.3
144 Cameroon 7.8 17.8 21.5 2.7 1.9 27.3 54.6 62.7 41.8 38.4 3.5 3.6 6.3 4.9
145 Papua New Guinea 2.9 6.1 7.3 2.5 1.9 11.9 13.4 15.0 40.6 35.8 2.4 2.7 6.1 4.3
146 Haiti 5.1 9.3 10.8 2.0 1.5 21.7 38.8 45.5 38.0 34.1 4.1 4.6 5.6 4.0
147 Sudan 16.8 36.9 45.6 2.6 2.1 18.9 40.8 49.4 40.7 36.4 3.5 4.1 6.6 4.8
148 Kenya 13.5 35.6 46.2 3.2 2.6 12.9 20.7 24.1 42.6 42.5 2.7 2.6 8.0 5.0
149 Djibouti 0.2 0.8 1.0 4.3 1.7 67.1 86.1 89.6 38.5 33.5 3.0 3.7 7.2 4.5
150 Timor-Leste 0.7 1.1 1.5 1.5 3.4 14.6 26.5 31.2 45.0 44.0 2.7 3.0 6.2 7.0
151 Zimbabwe 6.2 13.1 14.5 2.5 1.0 19.9 35.9 40.9 39.5 35.2 3.5 3.7 7.4 3.6
152 Togo 2.4 6.2 8.0 3.1 2.5 22.8 40.1 47.4 43.3 40.0 3.1 3.3 7.1 5.4
153 Yemen 7.1 21.1 28.3 3.6 2.9 14.8 27.3 31.9 45.9 42.4 2.3 2.5 8.7 6.0
154 Uganda 10.9 28.9 40.0 3.3 3.2 7.0 12.6 14.5 49.4 48.0 2.5 2.3 7.1 6.7
155 Gambia 0.6 1.6 2.1 3.5 2.5 24.4 53.9 61.8 41.2 38.3 3.7 4.5 6.6 5.2
LOWHUMANDEVELOPMENT
156 Senegal 5.1 11.8 14.9 2.8 2.3 33.7 41.6 44.7 42.2 39.0 4.2 4.4 7.0 5.2
157 Eritrea 2.1 4.5 6.2 2.5 3.1 13.5 19.4 24.3 43.0 42.6 2.3 2.5 6.5 5.5
158 Nigeria 61.2 141.4 175.7 2.8 2.2 23.4 48.2 55.9 44.3 41.3 2.9 3.0 6.9 5.8
159 Tanzania (United Republic of) 16.0 38.5 49.0 2.9 2.4 11.1 24.2 28.9 44.4 42.8 3.0 3.2 6.8 5.7
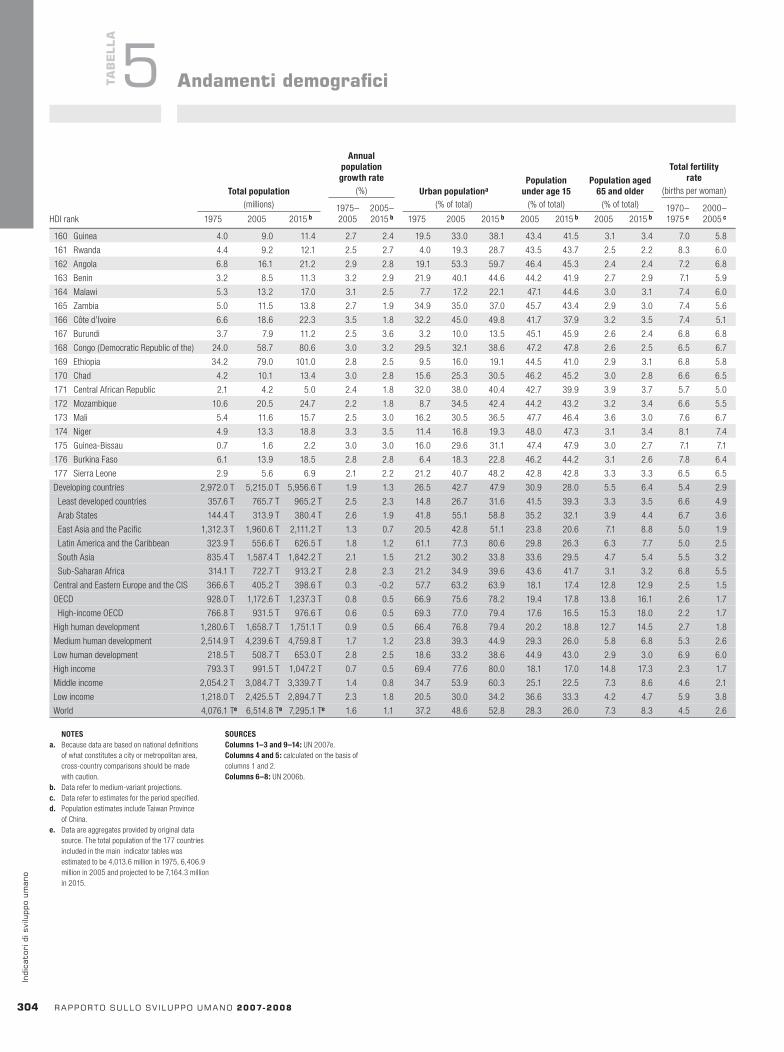
Healthexpenditure
MDGOne-year-oldsfullyimmunized
Childrenwithdiarrhoea
receivingoralrehydration
andcontinuedfeeding
(% under age 5)
MDGContraceptive
prevalenceratea
(% of married women aged
15–49)
MDGBirths
attendedbyskilledhealth
personnel(%)
Physicians(per 100,000
people)
HDI rank
Againsttuberculosis
(%)
Againstmeasles
(%)Public
(% of GDP)Private
(% of GDP)Percapita(PPP US$)
2004 2004 2004 2005 2005 1998–2005b 1997–2005b 1997–2005b 2000–04bHDI rank
Totalpopulation(millions)
Annualpopulationgrowthrate
(%) Urbanpopulationa
(% of total)
Populationunderage15
(% of total)
Populationaged65andolder
(% of total)
Totalfertilityrate
(births per woman)
1975–2005
2005–2015b
1970–1975c
2000–2005c1975 2005 2015b 1975 2005 2015b 2005 2015b 2005 2015b
304 rapportosullosv iluppoumano2007-2008
indi
cato
rid
isvi
lupp
oum
ano
TaB
ELLa
5 andamentidemografici
NOTESa. Because data are based on national definitions
of what constitutes a city or metropolitan area, cross-country comparisons should be made with caution.
b. Data refer to medium-variant projections.c. Data refer to estimates for the period specified.d. Population estimates include Taiwan Province
of China.e. Data are aggregates provided by original data
source. The total population of the 177 countries included in the main indicator tables was estimated to be 4,013.6 million in 1975, 6,406.9 million in 2005 and projected to be 7,164.3 million in 2015.
SOURCESColumns1–3and9–14: UN 2007e.Columns4and5: calculated on the basis of columns 1 and 2.Columns6–8: UN 2006b.
160 Guinea 4.0 9.0 11.4 2.7 2.4 19.5 33.0 38.1 43.4 41.5 3.1 3.4 7.0 5.8
161 Rwanda 4.4 9.2 12.1 2.5 2.7 4.0 19.3 28.7 43.5 43.7 2.5 2.2 8.3 6.0
162 Angola 6.8 16.1 21.2 2.9 2.8 19.1 53.3 59.7 46.4 45.3 2.4 2.4 7.2 6.8
163 Benin 3.2 8.5 11.3 3.2 2.9 21.9 40.1 44.6 44.2 41.9 2.7 2.9 7.1 5.9
164 Malawi 5.3 13.2 17.0 3.1 2.5 7.7 17.2 22.1 47.1 44.6 3.0 3.1 7.4 6.0
165 Zambia 5.0 11.5 13.8 2.7 1.9 34.9 35.0 37.0 45.7 43.4 2.9 3.0 7.4 5.6
166 Côte d’Ivoire 6.6 18.6 22.3 3.5 1.8 32.2 45.0 49.8 41.7 37.9 3.2 3.5 7.4 5.1
167 Burundi 3.7 7.9 11.2 2.5 3.6 3.2 10.0 13.5 45.1 45.9 2.6 2.4 6.8 6.8
168 Congo (Democratic Republic of the) 24.0 58.7 80.6 3.0 3.2 29.5 32.1 38.6 47.2 47.8 2.6 2.5 6.5 6.7
169 Ethiopia 34.2 79.0 101.0 2.8 2.5 9.5 16.0 19.1 44.5 41.0 2.9 3.1 6.8 5.8
170 Chad 4.2 10.1 13.4 3.0 2.8 15.6 25.3 30.5 46.2 45.2 3.0 2.8 6.6 6.5
171 Central African Republic 2.1 4.2 5.0 2.4 1.8 32.0 38.0 40.4 42.7 39.9 3.9 3.7 5.7 5.0
172 Mozambique 10.6 20.5 24.7 2.2 1.8 8.7 34.5 42.4 44.2 43.2 3.2 3.4 6.6 5.5
173 Mali 5.4 11.6 15.7 2.5 3.0 16.2 30.5 36.5 47.7 46.4 3.6 3.0 7.6 6.7
174 Niger 4.9 13.3 18.8 3.3 3.5 11.4 16.8 19.3 48.0 47.3 3.1 3.4 8.1 7.4
175 Guinea-Bissau 0.7 1.6 2.2 3.0 3.0 16.0 29.6 31.1 47.4 47.9 3.0 2.7 7.1 7.1
176 Burkina Faso 6.1 13.9 18.5 2.8 2.8 6.4 18.3 22.8 46.2 44.2 3.1 2.6 7.8 6.4
177 Sierra Leone 2.9 5.6 6.9 2.1 2.2 21.2 40.7 48.2 42.8 42.8 3.3 3.3 6.5 6.5
Developing countries 2,972.0 T 5,215.0 T 5,956.6 T 1.9 1.3 26.5 42.7 47.9 30.9 28.0 5.5 6.4 5.4 2.9
Least developed countries 357.6 T 765.7 T 965.2 T 2.5 2.3 14.8 26.7 31.6 41.5 39.3 3.3 3.5 6.6 4.9
Arab States 144.4 T 313.9 T 380.4 T 2.6 1.9 41.8 55.1 58.8 35.2 32.1 3.9 4.4 6.7 3.6
East Asia and the Pacific 1,312.3 T 1,960.6 T 2,111.2 T 1.3 0.7 20.5 42.8 51.1 23.8 20.6 7.1 8.8 5.0 1.9
Latin America and the Caribbean 323.9 T 556.6 T 626.5 T 1.8 1.2 61.1 77.3 80.6 29.8 26.3 6.3 7.7 5.0 2.5
South Asia 835.4 T 1,587.4 T 1,842.2 T 2.1 1.5 21.2 30.2 33.8 33.6 29.5 4.7 5.4 5.5 3.2
Sub-Saharan Africa 314.1 T 722.7 T 913.2 T 2.8 2.3 21.2 34.9 39.6 43.6 41.7 3.1 3.2 6.8 5.5
Central and Eastern Europe and the CIS 366.6 T 405.2 T 398.6 T 0.3 -0.2 57.7 63.2 63.9 18.1 17.4 12.8 12.9 2.5 1.5
OECD 928.0 T 1,172.6 T 1,237.3 T 0.8 0.5 66.9 75.6 78.2 19.4 17.8 13.8 16.1 2.6 1.7
High-income OECD 766.8 T 931.5 T 976.6 T 0.6 0.5 69.3 77.0 79.4 17.6 16.5 15.3 18.0 2.2 1.7
High human development 1,280.6 T 1,658.7 T 1,751.1 T 0.9 0.5 66.4 76.8 79.4 20.2 18.8 12.7 14.5 2.7 1.8
Medium human development 2,514.9 T 4,239.6 T 4,759.8 T 1.7 1.2 23.8 39.3 44.9 29.3 26.0 5.8 6.8 5.3 2.6
Low human development 218.5 T 508.7 T 653.0 T 2.8 2.5 18.6 33.2 38.6 44.9 43.0 2.9 3.0 6.9 6.0
High income 793.3 T 991.5 T 1,047.2 T 0.7 0.5 69.4 77.6 80.0 18.1 17.0 14.8 17.3 2.3 1.7
Middle income 2,054.2 T 3,084.7 T 3,339.7 T 1.4 0.8 34.7 53.9 60.3 25.1 22.5 7.3 8.6 4.6 2.1
Low income 1,218.0 T 2,425.5 T 2,894.7 T 2.3 1.8 20.5 30.0 34.2 36.6 33.3 4.2 4.7 5.9 3.8
World 4,076.1 Te 6,514.8 Te 7,295.1 Te 1.6 1.1 37.2 48.6 52.8 28.3 26.0 7.3 8.3 4.5 2.6
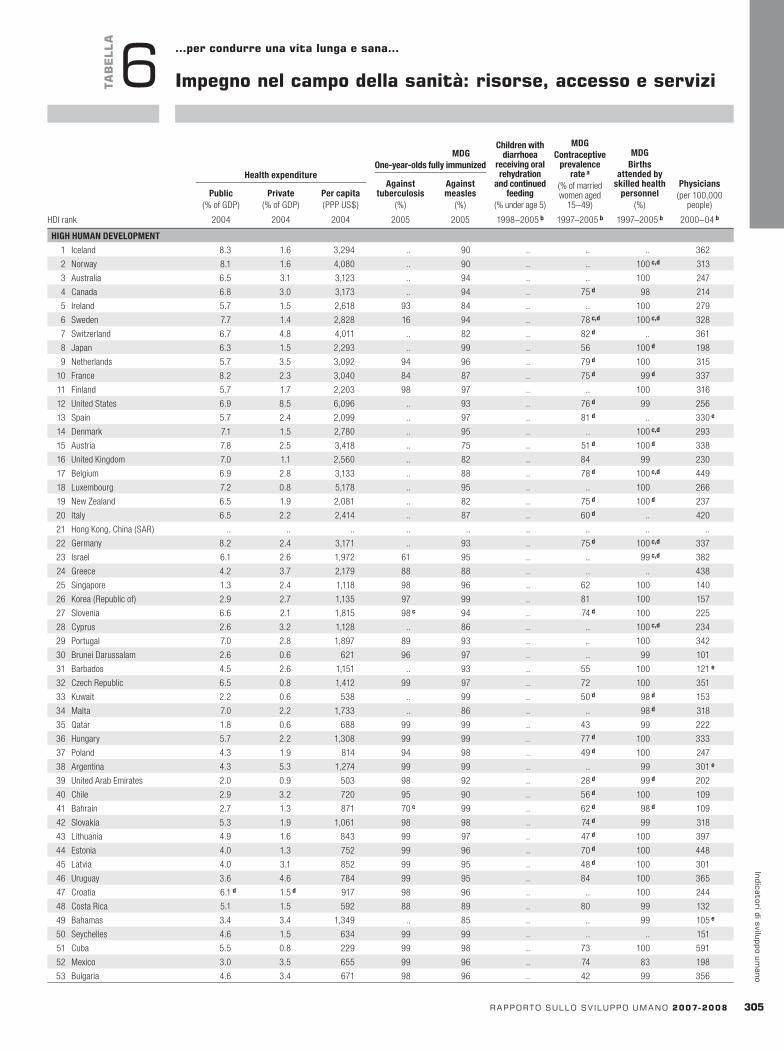
Healthexpenditure
MDGOne-year-oldsfullyimmunized
Childrenwithdiarrhoea
receivingoralrehydration
andcontinuedfeeding
(% under age 5)
MDGContraceptive
prevalenceratea
(% of married women aged
15–49)
MDGBirths
attendedbyskilledhealth
personnel(%)
Physicians(per 100,000
people)
HDI rank
Againsttuberculosis
(%)
Againstmeasles
(%)Public
(% of GDP)Private
(% of GDP)Percapita(PPP US$)
2004 2004 2004 2005 2005 1998–2005b 1997–2005b 1997–2005b 2000–04b
rapportosullosv iluppoumano2007-2008 30�
indicatoridisviluppoumano
TaB
ELLa
6 …percondurreunavitalungaesana…
Impegnonelcampodellasanità:risorse,accessoeservizi
HIGHHUMANDEVELOPMENT
1 Iceland 8.3 1.6 3,294 .. 90 .. .. .. 362
2 Norway 8.1 1.6 4,080 .. 90 .. .. 100c,d 313
3 Australia 6.5 3.1 3,123 .. 94 .. .. 100 247
4 Canada 6.8 3.0 3,173 .. 94 .. 75d 98 214
5 Ireland 5.7 1.5 2,618 93 84 .. .. 100 279
6 Sweden 7.7 1.4 2,828 16 94 .. 78c,d 100c,d 328
7 Switzerland 6.7 4.8 4,011 .. 82 .. 82d .. 361
8 Japan 6.3 1.5 2,293 .. 99 .. 56 100d 198
9 Netherlands 5.7 3.5 3,092 94 96 .. 79d 100 315
10 France 8.2 2.3 3,040 84 87 .. 75d 99d 337
11 Finland 5.7 1.7 2,203 98 97 .. .. 100 316
12 United States 6.9 8.5 6,096 .. 93 .. 76d 99 256
13 Spain 5.7 2.4 2,099 .. 97 .. 81d .. 330e
14 Denmark 7.1 1.5 2,780 .. 95 .. .. 100c,d 293
15 Austria 7.8 2.5 3,418 .. 75 .. 51d 100d 338
16 United Kingdom 7.0 1.1 2,560 .. 82 .. 84 99 230
17 Belgium 6.9 2.8 3,133 .. 88 .. 78d 100c,d 449
18 Luxembourg 7.2 0.8 5,178 .. 95 .. .. 100 266
19 New Zealand 6.5 1.9 2,081 .. 82 .. 75d 100d 237
20 Italy 6.5 2.2 2,414 .. 87 .. 60d .. 420
21 Hong Kong, China (SAR) .. .. .. .. .. .. .. .. ..
22 Germany 8.2 2.4 3,171 .. 93 .. 75d 100c,d 337
23 Israel 6.1 2.6 1,972 61 95 .. .. 99c,d 382
24 Greece 4.2 3.7 2,179 88 88 .. .. .. 438
25 Singapore 1.3 2.4 1,118 98 96 .. 62 100 140
26 Korea (Republic of) 2.9 2.7 1,135 97 99 .. 81 100 157
27 Slovenia 6.6 2.1 1,815 98c 94 .. 74d 100 225
28 Cyprus 2.6 3.2 1,128 .. 86 .. .. 100c,d 234
29 Portugal 7.0 2.8 1,897 89 93 .. .. 100 342
30 Brunei Darussalam 2.6 0.6 621 96 97 .. .. 99 101
31 Barbados 4.5 2.6 1,151 .. 93 .. 55 100 121e
32 Czech Republic 6.5 0.8 1,412 99 97 .. 72 100 351
33 Kuwait 2.2 0.6 538 .. 99 .. 50d 98d 153
34 Malta 7.0 2.2 1,733 .. 86 .. .. 98d 318
35 Qatar 1.8 0.6 688 99 99 .. 43 99 222
36 Hungary 5.7 2.2 1,308 99 99 .. 77d 100 333
37 Poland 4.3 1.9 814 94 98 .. 49d 100 247
38 Argentina 4.3 5.3 1,274 99 99 .. .. 99 301e
39 United Arab Emirates 2.0 0.9 503 98 92 .. 28d 99d 202
40 Chile 2.9 3.2 720 95 90 .. 56d 100 109
41 Bahrain 2.7 1.3 871 70c 99 .. 62d 98d 109
42 Slovakia 5.3 1.9 1,061 98 98 .. 74d 99 318
43 Lithuania 4.9 1.6 843 99 97 .. 47d 100 397
44 Estonia 4.0 1.3 752 99 96 .. 70d 100 448
45 Latvia 4.0 3.1 852 99 95 .. 48d 100 301
46 Uruguay 3.6 4.6 784 99 95 .. 84 100 365
47 Croatia 6.1d 1.5d 917 98 96 .. .. 100 244
48 Costa Rica 5.1 1.5 592 88 89 .. 80 99 132
49 Bahamas 3.4 3.4 1,349 .. 85 .. .. 99 105e
50 Seychelles 4.6 1.5 634 99 99 .. .. .. 151
51 Cuba 5.5 0.8 229 99 98 .. 73 100 591
52 Mexico 3.0 3.5 655 99 96 .. 74 83 198
53 Bulgaria 4.6 3.4 671 98 96 .. 42 99 356
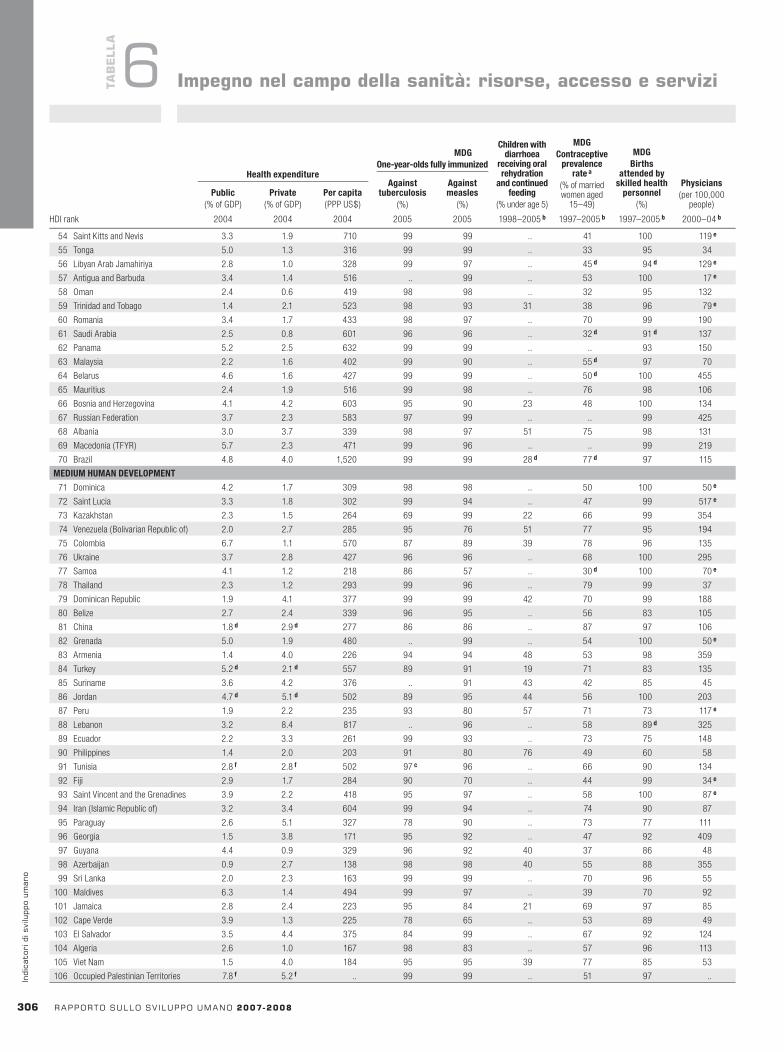
Healthexpenditure
MDGOne-year-oldsfullyimmunized
Childrenwithdiarrhoea
receivingoralrehydration
andcontinuedfeeding
(% under age 5)
MDGContraceptive
prevalenceratea
(% of married women aged
15–49)
MDGBirths
attendedbyskilledhealth
personnel(%)
Physicians(per 100,000
people)
HDI rank
Againsttuberculosis
(%)
Againstmeasles
(%)Public
(% of GDP)Private
(% of GDP)Percapita(PPP US$)
2004 2004 2004 2005 2005 1998–2005b 1997–2005b 1997–2005b 2000–04b
30� rapportosullosv iluppoumano2007-2008
indi
cato
rid
isvi
lupp
oum
ano
Impegnonelcampodellasanità:risorse,accessoeserviziTaB
ELLa
6
54 Saint Kitts and Nevis 3.3 1.9 710 99 99 .. 41 100 119e
55 Tonga 5.0 1.3 316 99 99 .. 33 95 34
56 Libyan Arab Jamahiriya 2.8 1.0 328 99 97 .. 45d 94d 129e
57 Antigua and Barbuda 3.4 1.4 516 .. 99 .. 53 100 17e
58 Oman 2.4 0.6 419 98 98 .. 32 95 132
59 Trinidad and Tobago 1.4 2.1 523 98 93 31 38 96 79e
60 Romania 3.4 1.7 433 98 97 .. 70 99 190
61 Saudi Arabia 2.5 0.8 601 96 96 .. 32d 91d 137
62 Panama 5.2 2.5 632 99 99 .. .. 93 150
63 Malaysia 2.2 1.6 402 99 90 .. 55d 97 70
64 Belarus 4.6 1.6 427 99 99 .. 50d 100 455
65 Mauritius 2.4 1.9 516 99 98 .. 76 98 106
66 Bosnia and Herzegovina 4.1 4.2 603 95 90 23 48 100 134
67 Russian Federation 3.7 2.3 583 97 99 .. .. 99 425
68 Albania 3.0 3.7 339 98 97 51 75 98 131
69 Macedonia (TFYR) 5.7 2.3 471 99 96 .. .. 99 219
70 Brazil 4.8 4.0 1,520 99 99 28d 77d 97 115
MEDIUMHUMANDEVELOPMENT
71 Dominica 4.2 1.7 309 98 98 .. 50 100 50e
72 Saint Lucia 3.3 1.8 302 99 94 .. 47 99 517e
73 Kazakhstan 2.3 1.5 264 69 99 22 66 99 354
74 Venezuela (Bolivarian Republic of) 2.0 2.7 285 95 76 51 77 95 194
75 Colombia 6.7 1.1 570 87 89 39 78 96 135
76 Ukraine 3.7 2.8 427 96 96 .. 68 100 295
77 Samoa 4.1 1.2 218 86 57 .. 30d 100 70e
78 Thailand 2.3 1.2 293 99 96 .. 79 99 37
79 Dominican Republic 1.9 4.1 377 99 99 42 70 99 188
80 Belize 2.7 2.4 339 96 95 .. 56 83 105
81 China 1.8d 2.9d 277 86 86 .. 87 97 106
82 Grenada 5.0 1.9 480 .. 99 .. 54 100 50e
83 Armenia 1.4 4.0 226 94 94 48 53 98 359
84 Turkey 5.2d 2.1d 557 89 91 19 71 83 135
85 Suriname 3.6 4.2 376 .. 91 43 42 85 45
86 Jordan 4.7d 5.1d 502 89 95 44 56 100 203
87 Peru 1.9 2.2 235 93 80 57 71 73 117e
88 Lebanon 3.2 8.4 817 .. 96 .. 58 89d 325
89 Ecuador 2.2 3.3 261 99 93 .. 73 75 148
90 Philippines 1.4 2.0 203 91 80 76 49 60 58
91 Tunisia 2.8f 2.8f 502 97c 96 .. 66 90 134
92 Fiji 2.9 1.7 284 90 70 .. 44 99 34e
93 Saint Vincent and the Grenadines 3.9 2.2 418 95 97 .. 58 100 87e
94 Iran ( Islamic Republic of) 3.2 3.4 604 99 94 .. 74 90 87
95 Paraguay 2.6 5.1 327 78 90 .. 73 77 111
96 Georgia 1.5 3.8 171 95 92 .. 47 92 409
97 Guyana 4.4 0.9 329 96 92 40 37 86 48
98 Azerbaijan 0.9 2.7 138 98 98 40 55 88 355
99 Sri Lanka 2.0 2.3 163 99 99 .. 70 96 55
100 Maldives 6.3 1.4 494 99 97 .. 39 70 92
101 Jamaica 2.8 2.4 223 95 84 21 69 97 85
102 Cape Verde 3.9 1.3 225 78 65 .. 53 89 49
103 El Salvador 3.5 4.4 375 84 99 .. 67 92 124
104 Algeria 2.6 1.0 167 98 83 .. 57 96 113
105 Viet Nam 1.5 4.0 184 95 95 39 77 85 53
106 Occupied Palestinian Territories 7.8f 5.2f .. 99 99 .. 51 97 ..

Healthexpenditure
MDGOne-year-oldsfullyimmunized
Childrenwithdiarrhoea
receivingoralrehydration
andcontinuedfeeding
(% under age 5)
MDGContraceptive
prevalenceratea
(% of married women aged
15–49)
MDGBirths
attendedbyskilledhealth
personnel(%)
Physicians(per 100,000
people)
HDI rank
Againsttuberculosis
(%)
Againstmeasles
(%)Public
(% of GDP)Private
(% of GDP)Percapita(PPP US$)
2004 2004 2004 2005 2005 1998–2005b 1997–2005b 1997–2005b 2000–04b
rapportosullosv iluppoumano2007-2008 307
indicatoridisviluppoumano
TaB
ELLa
6
107 Indonesia 1.0 1.8 118 82 72 56 57 72 13
108 Syrian Arab Republic 2.2 2.5 109 99 98 .. 48 77d 140
109 Turkmenistan 3.3 1.5 245 99 99 .. 62 97 418
110 Nicaragua 3.9 4.3 231 88c 96 49 69 67 37
111 Moldova 4.2 3.2 138 97 97 52 68 100 264
112 Egypt 2.2 3.7 258 98 98 29 59 74 54
113 Uzbekistan 2.4 2.7 160 93 99 33 68 96 274
114 Mongolia 4.0 2.0 141 99 99 66 69 97 263
115 Honduras 4.0 3.2 197 91 92 .. 62 56 57
116 Kyrgyzstan 2.3 3.3 102 96 99 16d 60 98 251
117 Bolivia 4.1 2.7 186 93 64 54 58 67 122
118 Guatemala 2.3 3.4 256 96 77 22 43 41 90e
119 Gabon 3.1 1.4 264 89 55 44 33 86 29
120 Vanuatu 3.1 1.0 123 65 70 .. 28 88 11e
121 South Africa 3.5 5.1 748 97 82 37 60 92 77
122 Tajikistan 1.0 3.4 54 98 84 29 34 71 203
123 Sao Tome and Principe 9.9 1.6 141 98 88 44 29 76 49
124 Botswana 4.0 2.4 504 99 90 7 48 94 40
125 Namibia 4.7 2.1 407 95 73 39 44 76 30
126 Morocco 1.7 3.4 234 95 97 46 63 63 51
127 Equatorial Guinea 1.2 0.4 223 73 51 36 .. 65 30
128 India 0.9 4.1 91 75 58 22 47 43 60
129 Solomon Islands 5.6 0.3 114 84 72 .. 11d 85 13e
130 Lao People’s Democratic Republic 0.8 3.1 74 65 41 37 32 19 ..
131 Cambodia 1.7 5.0 140 87 79 59 24 32 16
132 Myanmar 0.3 1.9 38 76 72 48 34 57 36
133 Bhutan 3.0 1.6 93 99 93 .. 31 37 5
134 Comoros 1.6 1.2 25 90 80 31 26 62 15
135 Ghana 2.8 3.9 95 99 83 40 25 47 15
136 Pakistan 0.4 1.8 48 82 78 33d 28 31 74
137 Mauritania 2.0 0.9 43 87 61 28 8 57 11
138 Lesotho 5.5 1.0 139 96 85 53 37 55 5
139 Congo 1.2 1.3 30 85c 56 .. 44 86 20
140 Bangladesh 0.9 2.2 64 99 81 52 58 13 26
141 Swaziland 4.0 2.3 367 84 60 24 48 74 16
142 Nepal 1.5 4.1 71 87 74 43 38 11 21
143 Madagascar 1.8 1.2 29 72 59 47 27 51 29
144 Cameroon 1.5 3.7 83 77 68 43 26 62 19
145 Papua New Guinea 3.0 0.6 147 73 60 .. 26d 41 5
146 Haiti 2.9 4.7 82 71 54 41 28 24 25e
147 Sudan 1.5 2.6 54 57 60 38 7 87 22
148 Kenya 1.8 2.3 86 85 69 33 39 42 14
149 Djibouti 4.4 1.9 87 52 65 .. 9 61 18
150 Timor-Leste 8.8 2.4 143 70 48 .. 10 18 10
151 Zimbabwe 3.5 4.0 139 98 85 80 54 73 16
152 Togo 1.1 4.4 63 96 70 25 26 61 4
153 Yemen 1.9 3.1 82 66 76 23d 23 27 33
154 Uganda 2.5 5.1 135 92 86 29 20 39 8
155 Gambia 1.8 5.0 88 89 84 38 18 55 11
LOWHUMANDEVELOPMENT
156 Senegal 2.4 3.5 72 92 74 33 12 58 6
157 Eritrea 1.8 2.7 27 91 84 54 8 28 5
158 Nigeria 1.4 3.2 53 48 35 28 13 35 28
159 Tanzania (United Republic of) 1.7 2.3 29 91 91 53 26 43 2
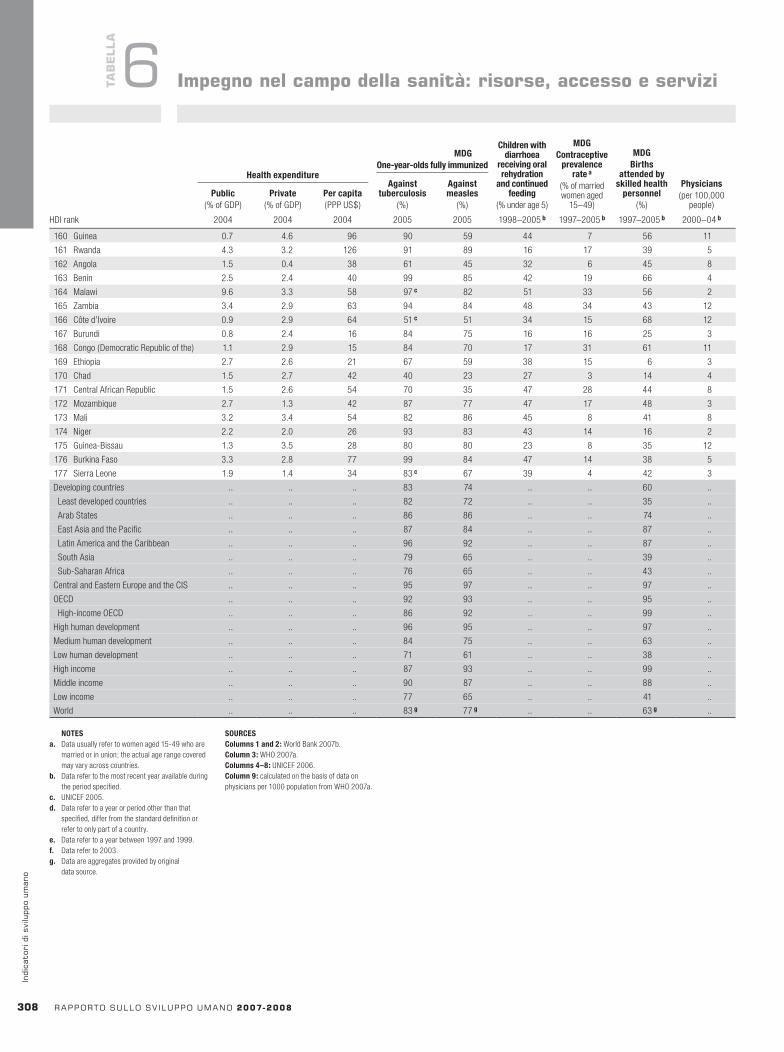
HDI rank
MDGPopulationusing
improvedsanitation(%)
MDGPopulationusingan
improvedwatersource(%)
MDGPopulationundernourished
(% of total population)
MDGChildren
underweightforage
(% of children under age 5)
Childrenunderheight
forage(% of children under age 5)
Infantswithlow
birthweight(%)
1990 2004 1990 2004 1990/92a 2002/04a 1996–2005b 1996–2005b 1998–2005b
Healthexpenditure
MDGOne-year-oldsfullyimmunized
Childrenwithdiarrhoea
receivingoralrehydration
andcontinuedfeeding
(% under age 5)
MDGContraceptive
prevalenceratea
(% of married women aged
15–49)
MDGBirths
attendedbyskilledhealth
personnel(%)
Physicians(per 100,000
people)
HDI rank
Againsttuberculosis
(%)
Againstmeasles
(%)Public
(% of GDP)Private
(% of GDP)Percapita(PPP US$)
2004 2004 2004 2005 2005 1998–2005b 1997–2005b 1997–2005b 2000–04b
308 rapportosullosv iluppoumano2007-2008
indi
cato
rid
isvi
lupp
oum
ano
Impegnonelcampodellasanità:risorse,accessoeserviziTaB
ELLa
6
NOTESa. Data usually refer to women aged 15-49 who are
married or in union; the actual age range covered may vary across countries.
b. Data refer to the most recent year available during the period specified.
c. UNICEF 2005.d. Data refer to a year or period other than that
specified, differ from the standard definition or refer to only part of a country.
e. Data refer to a year between 1997 and 1999.f. Data refer to 2003.g. Data are aggregates provided by original
data source.
SOURCESColumns1and2: World Bank 2007b.Column3: WHO 2007a.Columns4–8: UNICEF 2006.Column9: calculated on the basis of data on physicians per 1000 population from WHO 2007a.
160 Guinea 0.7 4.6 96 90 59 44 7 56 11
161 Rwanda 4.3 3.2 126 91 89 16 17 39 5
162 Angola 1.5 0.4 38 61 45 32 6 45 8
163 Benin 2.5 2.4 40 99 85 42 19 66 4
164 Malawi 9.6 3.3 58 97c 82 51 33 56 2
165 Zambia 3.4 2.9 63 94 84 48 34 43 12
166 Côte d’Ivoire 0.9 2.9 64 51c 51 34 15 68 12
167 Burundi 0.8 2.4 16 84 75 16 16 25 3
168 Congo (Democratic Republic of the) 1.1 2.9 15 84 70 17 31 61 11
169 Ethiopia 2.7 2.6 21 67 59 38 15 6 3
170 Chad 1.5 2.7 42 40 23 27 3 14 4
171 Central African Republic 1.5 2.6 54 70 35 47 28 44 8
172 Mozambique 2.7 1.3 42 87 77 47 17 48 3
173 Mali 3.2 3.4 54 82 86 45 8 41 8
174 Niger 2.2 2.0 26 93 83 43 14 16 2
175 Guinea-Bissau 1.3 3.5 28 80 80 23 8 35 12
176 Burkina Faso 3.3 2.8 77 99 84 47 14 38 5
177 Sierra Leone 1.9 1.4 34 83c 67 39 4 42 3
Developing countries .. .. .. 83 74 .. .. 60 ..
Least developed countries .. .. .. 82 72 .. .. 35 ..
Arab States .. .. .. 86 86 .. .. 74 ..
East Asia and the Pacific .. .. .. 87 84 .. .. 87 ..
Latin America and the Caribbean .. .. .. 96 92 .. .. 87 ..
South Asia .. .. .. 79 65 .. .. 39 ..
Sub-Saharan Africa .. .. .. 76 65 .. .. 43 ..
Central and Eastern Europe and the CIS .. .. .. 95 97 .. .. 97 ..
OECD .. .. .. 92 93 .. .. 95 ..
High-income OECD .. .. .. 86 92 .. .. 99 ..
High human development .. .. .. 96 95 .. .. 97 ..
Medium human development .. .. .. 84 75 .. .. 63 ..
Low human development .. .. .. 71 61 .. .. 38 ..
High income .. .. .. 87 93 .. .. 99 ..
Middle income .. .. .. 90 87 .. .. 88 ..
Low income .. .. .. 77 65 .. .. 41 ..
World .. .. .. 83g 77g .. .. 63g ..
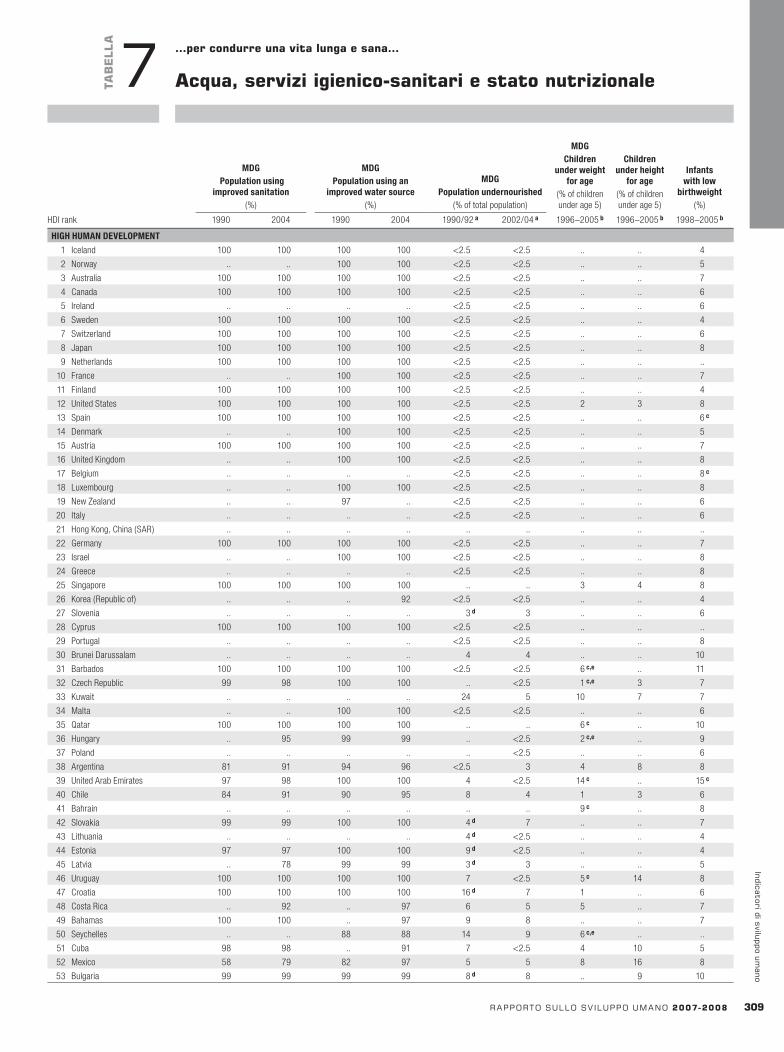
HDI rank
MDGPopulationusing
improvedsanitation(%)
MDGPopulationusingan
improvedwatersource(%)
MDGPopulationundernourished
(% of total population)
MDGChildren
underweightforage
(% of children under age 5)
Childrenunderheight
forage(% of children under age 5)
Infantswithlow
birthweight(%)
1990 2004 1990 2004 1990/92a 2002/04a 1996–2005b 1996–2005b 1998–2005b
rapportosullosv iluppoumano2007-2008 30�
indicatoridisviluppoumano
TaB
ELLa
7 …percondurreunavitalungaesana…
acqua,serviziigienico-sanitariestatonutrizionale
HIGHHUMANDEVELOPMENT
1 Iceland 100 100 100 100 <2.5 <2.5 .. .. 4
2 Norway .. .. 100 100 <2.5 <2.5 .. .. 5
3 Australia 100 100 100 100 <2.5 <2.5 .. .. 7
4 Canada 100 100 100 100 <2.5 <2.5 .. .. 6
5 Ireland .. .. .. .. <2.5 <2.5 .. .. 6
6 Sweden 100 100 100 100 <2.5 <2.5 .. .. 4
7 Switzerland 100 100 100 100 <2.5 <2.5 .. .. 6
8 Japan 100 100 100 100 <2.5 <2.5 .. .. 8
9 Netherlands 100 100 100 100 <2.5 <2.5 .. .. ..
10 France .. .. 100 100 <2.5 <2.5 .. .. 7
11 Finland 100 100 100 100 <2.5 <2.5 .. .. 4
12 United States 100 100 100 100 <2.5 <2.5 2 3 8
13 Spain 100 100 100 100 <2.5 <2.5 .. .. 6c
14 Denmark .. .. 100 100 <2.5 <2.5 .. .. 5
15 Austria 100 100 100 100 <2.5 <2.5 .. .. 7
16 United Kingdom .. .. 100 100 <2.5 <2.5 .. .. 8
17 Belgium .. .. .. .. <2.5 <2.5 .. .. 8c
18 Luxembourg .. .. 100 100 <2.5 <2.5 .. .. 8
19 New Zealand .. .. 97 .. <2.5 <2.5 .. .. 6
20 Italy .. .. .. .. <2.5 <2.5 .. .. 6
21 Hong Kong, China (SAR) .. .. .. .. .. .. .. .. ..
22 Germany 100 100 100 100 <2.5 <2.5 .. .. 7
23 Israel .. .. 100 100 <2.5 <2.5 .. .. 8
24 Greece .. .. .. .. <2.5 <2.5 .. .. 8
25 Singapore 100 100 100 100 .. .. 3 4 8
26 Korea (Republic of) .. .. .. 92 <2.5 <2.5 .. .. 4
27 Slovenia .. .. .. .. 3d 3 .. .. 6
28 Cyprus 100 100 100 100 <2.5 <2.5 .. .. ..
29 Portugal .. .. .. .. <2.5 <2.5 .. .. 8
30 Brunei Darussalam .. .. .. .. 4 4 .. .. 10
31 Barbados 100 100 100 100 <2.5 <2.5 6c,e .. 11
32 Czech Republic 99 98 100 100 .. <2.5 1c,e 3 7
33 Kuwait .. .. .. .. 24 5 10 7 7
34 Malta .. .. 100 100 <2.5 <2.5 .. .. 6
35 Qatar 100 100 100 100 .. .. 6c .. 10
36 Hungary .. 95 99 99 .. <2.5 2c,e .. 9
37 Poland .. .. .. .. .. <2.5 .. .. 6
38 Argentina 81 91 94 96 <2.5 3 4 8 8
39 United Arab Emirates 97 98 100 100 4 <2.5 14c .. 15c
40 Chile 84 91 90 95 8 4 1 3 6
41 Bahrain .. .. .. .. .. .. 9c .. 8
42 Slovakia 99 99 100 100 4d 7 .. .. 7
43 Lithuania .. .. .. .. 4d <2.5 .. .. 4
44 Estonia 97 97 100 100 9d <2.5 .. .. 4
45 Latvia .. 78 99 99 3d 3 .. .. 5
46 Uruguay 100 100 100 100 7 <2.5 5c 14 8
47 Croatia 100 100 100 100 16d 7 1 .. 6
48 Costa Rica .. 92 .. 97 6 5 5 .. 7
49 Bahamas 100 100 .. 97 9 8 .. .. 7
50 Seychelles .. .. 88 88 14 9 6c,e .. ..
51 Cuba 98 98 .. 91 7 <2.5 4 10 5
52 Mexico 58 79 82 97 5 5 8 16 8
53 Bulgaria 99 99 99 99 8d 8 .. 9 10

HDI rank
MDGPopulationusing
improvedsanitation(%)
MDGPopulationusingan
improvedwatersource(%)
MDGPopulationundernourished
(% of total population)
MDGChildren
underweightforage
(% of children under age 5)
Childrenunderheight
forage(% of children under age 5)
Infantswithlow
birthweight(%)
1990 2004 1990 2004 1990/92a 2002/04a 1996–2005b 1996–2005b 1998–2005bHDI rank
MDGPopulationusing
improvedsanitation(%)
MDGPopulationusingan
improvedwatersource(%)
MDGPopulationundernourished
(% of total population)
MDGChildren
underweightforage
(% of children under age 5)
Childrenunderheight
forage(% of children under age 5)
Infantswithlow
birthweight(%)
1990 2004 1990 2004 1990/92a 2002/04a 1996–2005b 1996–2005b 1998–2005b
310 rapportosullosv iluppoumano2007-2008
indi
cato
rid
isvi
lupp
oum
ano
TaB
ELLa
7 acqua,serviziigienico-sanitariestatonutrizionale
54 Saint Kitts and Nevis 95 95 100 100 13 10 .. .. 9
55 Tonga 96 96 100 100 .. .. .. .. 0
56 Libyan Arab Jamahiriya 97 97 71 .. <2.5 <2.5 5c .. 7c
57 Antigua and Barbuda .. 95 .. 91 .. .. 10c,e .. 8
58 Oman 83 .. 80 .. .. .. 18 16 8
59 Trinidad and Tobago 100 100 92 91 13 10 6 5 23
60 Romania .. .. .. 57 .. <2.5 3 13 8
61 Saudi Arabia .. .. 90 .. 4 4 14 .. 11c
62 Panama 71 73 90 90 21 23 8 22 10
63 Malaysia .. 94 98 99 3 3 11 20 9
64 Belarus .. 84 100 100 .. 4 .. .. 5
65 Mauritius .. 94 100 100 6 5 15c .. 14
66 Bosnia and Herzegovina .. 95 97 97 9d 9 4 12 4
67 Russian Federation 87 87 94 97 4d 3 3c .. 6
68 Albania .. 91 96 96 5d 6 14 39 5
69 Macedonia (TFYR) .. .. .. .. 15d 5 6 1 6
70 Brazil 71 75 83 90 12 7 6 .. 8
MEDIUMHUMANDEVELOPMENT
71 Dominica .. 84 .. 97 4 8 5c,e .. 11
72 Saint Lucia .. 89 98 98 8 5 14c,e .. 10
73 Kazakhstan 72 72 87 86 .. 6 4 14 8
74 Venezuela (Bolivarian Republic of) .. 68 .. 83 11 18 5 17 9
75 Colombia 82 86 92 93 17 13 7 16 9
76 Ukraine .. 96 .. 96 .. <2.5 1 6 5
77 Samoa 98 100 91 88 11 4 .. 9 4c
78 Thailand 80 99 95 99 30 22 18c 16 9
79 Dominican Republic 52 78 84 95 27 29 5 12 11
80 Belize .. 47 .. 91 7 4 6c,e .. 6
81 China 23 44 70 77 16f 12f 8 19 4
82 Grenada 97 96 .. 95 9 7 .. .. 8
83 Armenia .. 83 .. 92 52d 24 4 18 7
84 Turkey 85 88 85 96 <2.5 3 4 19 16
85 Suriname .. 94 .. 92 13 8 13 15 13
86 Jordan 93 93 97 97 4 6 4 12 12
87 Peru 52 63 74 83 42 12 8 31 11
88 Lebanon .. 98 100 100 <2.5 3 4 6 6
89 Ecuador 63 89 73 94 8 6 12 29 16
90 Philippines 57 72 87 85 26 18 28 34 20
91 Tunisia 75 85 81 93 <2.5 <2.5 4 16 7
92 Fiji 68 72 .. 47 10 5 8c,e .. 10
93 Saint Vincent and the Grenadines .. .. .. .. 22 10 .. .. 10
94 Iran ( Islamic Republic of) 83 .. 92 94 4 4 11 20 7c
95 Paraguay 58 80 62 86 18 15 5 .. 9
96 Georgia 97 94 80 82 44d 9 3 15 7
97 Guyana .. 70 .. 83 21 8 14 14 13
98 Azerbaijan .. .. 68 77 34d 7 7 24 12
99 Sri Lanka 69 91 68 79 28 22 29 18 22
100 Maldives .. 59 96 83 17 10 30 32 22
101 Jamaica 75 80 92 93 14 9 4 5 10
102 Cape Verde .. 43 .. 80 .. .. 14c,e .. 13
103 El Salvador 51 62 67 84 12 11 10 25 7
104 Algeria 88 92 94 85 5 4 10 22 7
105 Viet Nam 36 61 65 85 31 16 27 43 9
106 Occupied Palestinian Territories .. 73 .. 92 .. 16 5 .. 9
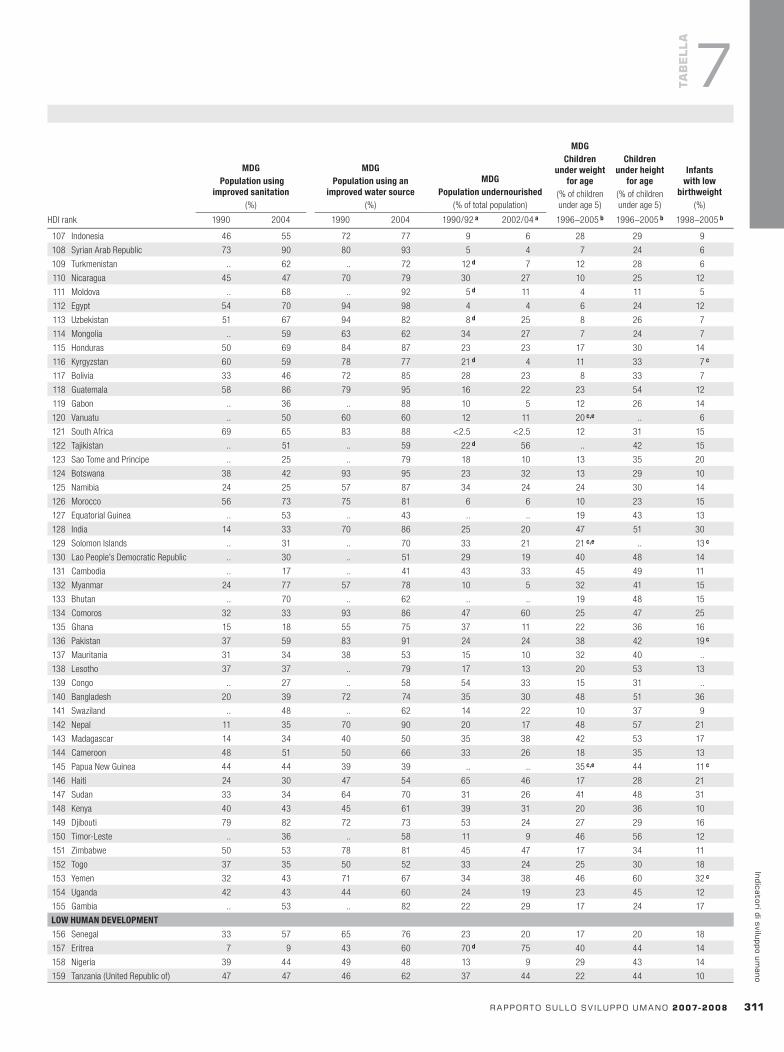
HDI rank
MDGPopulationusing
improvedsanitation(%)
MDGPopulationusingan
improvedwatersource(%)
MDGPopulationundernourished
(% of total population)
MDGChildren
underweightforage
(% of children under age 5)
Childrenunderheight
forage(% of children under age 5)
Infantswithlow
birthweight(%)
1990 2004 1990 2004 1990/92a 2002/04a 1996–2005b 1996–2005b 1998–2005b
rapportosullosv iluppoumano2007-2008 311
indicatoridisviluppoumano
TaB
ELLa
7
107 Indonesia 46 55 72 77 9 6 28 29 9
108 Syrian Arab Republic 73 90 80 93 5 4 7 24 6
109 Turkmenistan .. 62 .. 72 12d 7 12 28 6
110 Nicaragua 45 47 70 79 30 27 10 25 12
111 Moldova .. 68 .. 92 5d 11 4 11 5
112 Egypt 54 70 94 98 4 4 6 24 12
113 Uzbekistan 51 67 94 82 8d 25 8 26 7
114 Mongolia .. 59 63 62 34 27 7 24 7
115 Honduras 50 69 84 87 23 23 17 30 14
116 Kyrgyzstan 60 59 78 77 21d 4 11 33 7c
117 Bolivia 33 46 72 85 28 23 8 33 7
118 Guatemala 58 86 79 95 16 22 23 54 12
119 Gabon .. 36 .. 88 10 5 12 26 14
120 Vanuatu .. 50 60 60 12 11 20c,e .. 6
121 South Africa 69 65 83 88 <2.5 <2.5 12 31 15
122 Tajikistan .. 51 .. 59 22d 56 .. 42 15
123 Sao Tome and Principe .. 25 .. 79 18 10 13 35 20
124 Botswana 38 42 93 95 23 32 13 29 10
125 Namibia 24 25 57 87 34 24 24 30 14
126 Morocco 56 73 75 81 6 6 10 23 15
127 Equatorial Guinea .. 53 .. 43 .. .. 19 43 13
128 India 14 33 70 86 25 20 47 51 30
129 Solomon Islands .. 31 .. 70 33 21 21c,e .. 13c
130 Lao People’s Democratic Republic .. 30 .. 51 29 19 40 48 14
131 Cambodia .. 17 .. 41 43 33 45 49 11
132 Myanmar 24 77 57 78 10 5 32 41 15
133 Bhutan .. 70 .. 62 .. .. 19 48 15
134 Comoros 32 33 93 86 47 60 25 47 25
135 Ghana 15 18 55 75 37 11 22 36 16
136 Pakistan 37 59 83 91 24 24 38 42 19c
137 Mauritania 31 34 38 53 15 10 32 40 ..
138 Lesotho 37 37 .. 79 17 13 20 53 13
139 Congo .. 27 .. 58 54 33 15 31 ..
140 Bangladesh 20 39 72 74 35 30 48 51 36
141 Swaziland .. 48 .. 62 14 22 10 37 9
142 Nepal 11 35 70 90 20 17 48 57 21
143 Madagascar 14 34 40 50 35 38 42 53 17
144 Cameroon 48 51 50 66 33 26 18 35 13
145 Papua New Guinea 44 44 39 39 .. .. 35c,e 44 11c
146 Haiti 24 30 47 54 65 46 17 28 21
147 Sudan 33 34 64 70 31 26 41 48 31
148 Kenya 40 43 45 61 39 31 20 36 10
149 Djibouti 79 82 72 73 53 24 27 29 16
150 Timor-Leste .. 36 .. 58 11 9 46 56 12
151 Zimbabwe 50 53 78 81 45 47 17 34 11
152 Togo 37 35 50 52 33 24 25 30 18
153 Yemen 32 43 71 67 34 38 46 60 32c
154 Uganda 42 43 44 60 24 19 23 45 12
155 Gambia .. 53 .. 82 22 29 17 24 17
LOWHUMANDEVELOPMENT
156 Senegal 33 57 65 76 23 20 17 20 18
157 Eritrea 7 9 43 60 70d 75 40 44 14
158 Nigeria 39 44 49 48 13 9 29 43 14
159 Tanzania (United Republic of) 47 47 46 62 37 44 22 44 10

HDI rankSurvey
year
Birthsattendedbyskilledhealth
personnel(%)
One-year-oldsfullyimmunizeda
(%)
Childrenunderheightforage(% under age 5)
Infantmortalityrateb
(per 1,000 live births)
Under-fivemortalityrateb
(per 1,000 live births)
Poorest20%
Richest20%
Poorest20%
Richest20%
Poorest20%
Richest20%
Poorest20%
Richest20%
Poorest20%
Richest20%HDI rank
MDGPopulationusing
improvedsanitation(%)
MDGPopulationusingan
improvedwatersource(%)
MDGPopulationundernourished
(% of total population)
MDGChildren
underweightforage
(% of children under age 5)
Childrenunderheight
forage(% of children under age 5)
Infantswithlow
birthweight(%)
1990 2004 1990 2004 1990/92a 2002/04a 1996–2005b 1996–2005b 1998–2005b
312 rapportosullosv iluppoumano2007-2008
indi
cato
rid
isvi
lupp
oum
ano
TaB
ELLa
7 acqua,serviziigienico-sanitariestatonutrizionale
NOTESa. Data refer to the average for the years specified.b. Data refer to the most recent year available during
the period specified.c. Data refer to a year or period other than that
specified, differ from the standard definition or refer to only part of a country.
d. Data refer to the period 1993/95.e. UNICEF 2005.f. Data for China include Hong Kong SAR, Macao
SAR and Taiwan Province.g. Data are aggregates provided by original
data source.
SOURCESColumns1–4: UN 2006a, based on a joint effort by UNICEF and WHO.Columns5and6: FAO 2007a.Columns7and9: UNICEF 2006.Column8: WHO 2007a.
160 Guinea 14 18 44 50 39 24 26 39 16
161 Rwanda 37 42 59 74 43 33 23 48 9
162 Angola 29 31 36 53 58 35 31 51 12
163 Benin 12 33 63 67 20 12 23 39 16
164 Malawi 47 61 40 73 50 35 22 53 16
165 Zambia 44 55 50 58 48 46 20 53 12
166 Côte d’Ivoire 21 37 69 84 18 13 17 32 17
167 Burundi 44 36 69 79 48 66 45 63 16
168 Congo (Democratic Republic of the) 16 30 43 46 31 74 31 44 12
169 Ethiopia 3 13 23 22 69d 46 38 51 15
170 Chad 7 9 19 42 58 35 37 45 22
171 Central African Republic 23 27 52 75 50 44 24 45 14
172 Mozambique 20 32 36 43 66 44 24 47 15
173 Mali 36 46 34 50 29 29 33 43 23
174 Niger 7 13 39 46 41 32 40 54 13
175 Guinea-Bissau .. 35 .. 59 24 39 25 36 22
176 Burkina Faso 7 13 38 61 21 15 38 43 19
177 Sierra Leone .. 39 .. 57 46 51 27 38 23
Developing countries 33 49 71 79 21 17 .. .. ..
Least developed countries 22 37 51 59 38 35 .. .. ..
Arab States 61 71 84 86 .. .. .. .. ..
East Asia and the Pacific 30 50 72 79 17 12 .. .. ..
Latin America and the Caribbean 67 77 83 91 14 10 .. .. ..
South Asia 18 37 72 85 25 21 .. .. ..
Sub-Saharan Africa 32 37 48 55 36 32 .. .. ..
Central and Eastern Europe and the CIS .. .. 93 94 .. .. .. .. ..
OECD 94 96 97 99 .. .. .. .. ..
High-income OECD 100 100 100 100 .. .. .. .. ..
High human development 90 92 96 98 .. .. .. .. ..
Medium human development 30 48 73 82 20 16 .. .. ..
Low human development 26 34 43 49 36 34 .. .. ..
High income .. .. 100 100 .. .. .. .. ..
Middle income 46 61 78 84 14 11 .. .. ..
Low income 21 38 64 76 28 24 .. .. ..
World 49g 59g 78g 83g 20 17 .. .. ..
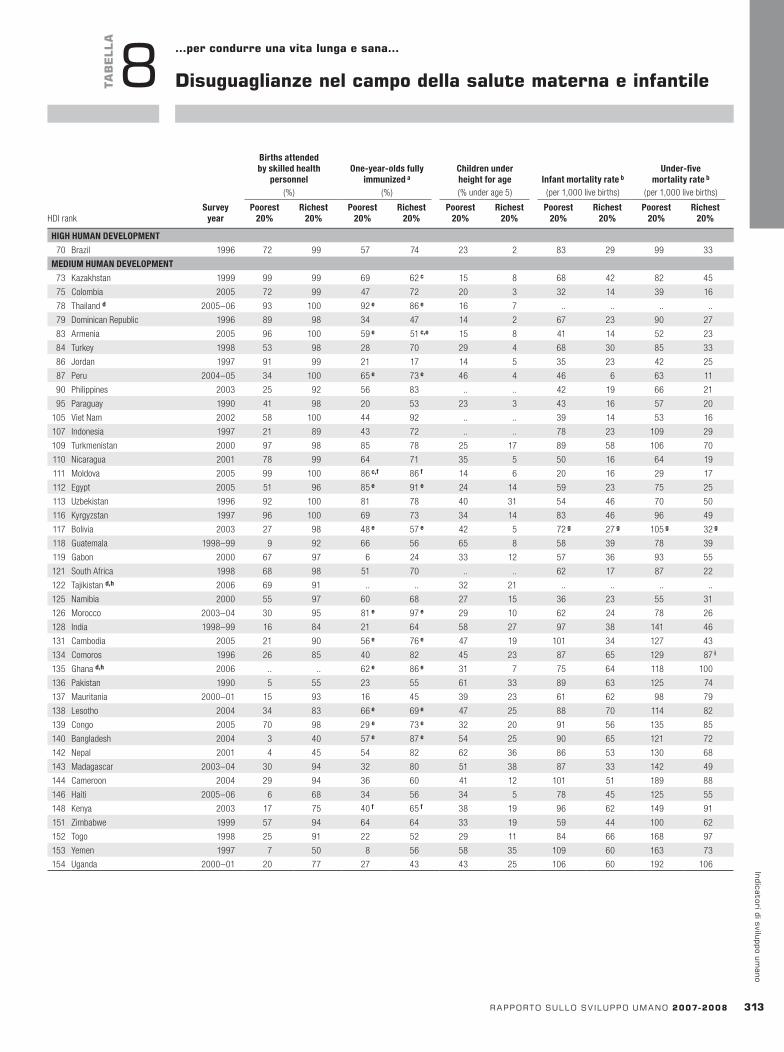
HDI rankSurvey
year
Birthsattendedbyskilledhealth
personnel(%)
One-year-oldsfullyimmunizeda
(%)
Childrenunderheightforage(% under age 5)
Infantmortalityrateb
(per 1,000 live births)
Under-fivemortalityrateb
(per 1,000 live births)
Poorest20%
Richest20%
Poorest20%
Richest20%
Poorest20%
Richest20%
Poorest20%
Richest20%
Poorest20%
Richest20%
rapportosullosv iluppoumano2007-2008 313
indicatoridisviluppoumano
TaB
ELLa
8 …percondurreunavitalungaesana…
Disuguaglianzenelcampodellasalutematernaeinfantile
HIGHHUMANDEVELOPMENT
70 Brazil 1996 72 99 57 74 23 2 83 29 99 33
MEDIUMHUMANDEVELOPMENT
73 Kazakhstan 1999 99 99 69 62c 15 8 68 42 82 45
75 Colombia 2005 72 99 47 72 20 3 32 14 39 16
78 Thailand d 2005–06 93 100 92e 86e 16 7 .. .. .. ..
79 Dominican Republic 1996 89 98 34 47 14 2 67 23 90 27
83 Armenia 2005 96 100 59e 51c,e 15 8 41 14 52 23
84 Turkey 1998 53 98 28 70 29 4 68 30 85 33
86 Jordan 1997 91 99 21 17 14 5 35 23 42 25
87 Peru 2004–05 34 100 65e 73e 46 4 46 6 63 11
90 Philippines 2003 25 92 56 83 .. .. 42 19 66 21
95 Paraguay 1990 41 98 20 53 23 3 43 16 57 20
105 Viet Nam 2002 58 100 44 92 .. .. 39 14 53 16
107 Indonesia 1997 21 89 43 72 .. .. 78 23 109 29
109 Turkmenistan 2000 97 98 85 78 25 17 89 58 106 70
110 Nicaragua 2001 78 99 64 71 35 5 50 16 64 19
111 Moldova 2005 99 100 86c,f 86f 14 6 20 16 29 17
112 Egypt 2005 51 96 85e 91e 24 14 59 23 75 25
113 Uzbekistan 1996 92 100 81 78 40 31 54 46 70 50
116 Kyrgyzstan 1997 96 100 69 73 34 14 83 46 96 49
117 Bolivia 2003 27 98 48e 57e 42 5 72g 27g 105g 32g
118 Guatemala 1998–99 9 92 66 56 65 8 58 39 78 39
119 Gabon 2000 67 97 6 24 33 12 57 36 93 55
121 South Africa 1998 68 98 51 70 .. .. 62 17 87 22
122 Tajikistan d,h 2006 69 91 .. .. 32 21 .. .. .. ..
125 Namibia 2000 55 97 60 68 27 15 36 23 55 31
126 Morocco 2003–04 30 95 81e 97e 29 10 62 24 78 26
128 India 1998–99 16 84 21 64 58 27 97 38 141 46
131 Cambodia 2005 21 90 56e 76e 47 19 101 34 127 43
134 Comoros 1996 26 85 40 82 45 23 87 65 129 87i
135 Ghana d,h 2006 .. .. 62e 86e 31 7 75 64 118 100
136 Pakistan 1990 5 55 23 55 61 33 89 63 125 74
137 Mauritania 2000–01 15 93 16 45 39 23 61 62 98 79
138 Lesotho 2004 34 83 66e 69e 47 25 88 70 114 82
139 Congo 2005 70 98 29e 73e 32 20 91 56 135 85
140 Bangladesh 2004 3 40 57e 87e 54 25 90 65 121 72
142 Nepal 2001 4 45 54 82 62 36 86 53 130 68
143 Madagascar 2003–04 30 94 32 80 51 38 87 33 142 49
144 Cameroon 2004 29 94 36 60 41 12 101 51 189 88
146 Haiti 2005–06 6 68 34 56 34 5 78 45 125 55
148 Kenya 2003 17 75 40f 65f 38 19 96 62 149 91
151 Zimbabwe 1999 57 94 64 64 33 19 59 44 100 62
152 Togo 1998 25 91 22 52 29 11 84 66 168 97
153 Yemen 1997 7 50 8 56 58 35 109 60 163 73
154 Uganda 2000–01 20 77 27 43 43 25 106 60 192 106
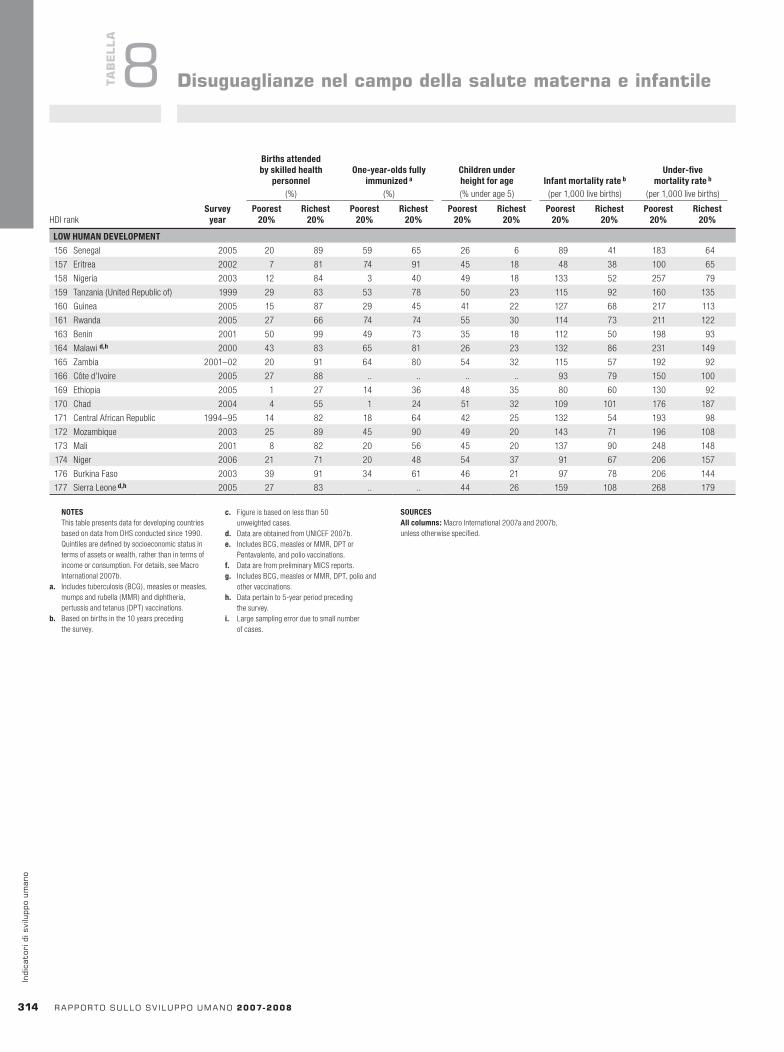
MDGCondomuseatlast
high-risksexb
(% aged 15–24)
MDG MDG MDG MDG MDG
Tuberculosiscases
Prevalenceofsmoking(% of adults)f
Antimalarialmeasures
HIVprevalencea
(% aged 15–49)
Useofinsecticide-
treatedbednets
Feverstreatedwithantimalarial
drugs
HDI rank
Prevalencec
(per 100,000 people)
DetectedunderDOTSd
(%)
CuredunderDOTSe
(%)(% of children under five)Women1999–2005g
Men1999–2005g
Women Men2005 1999–2005g 1999–2005g 2005 2005 2004 2002–04g 2002–04gHDI rank
Surveyyear
Birthsattendedbyskilledhealth
personnel(%)
One-year-oldsfullyimmunizeda
(%)
Childrenunderheightforage(% under age 5)
Infantmortalityrateb
(per 1,000 live births)
Under-fivemortalityrateb
(per 1,000 live births)
Poorest20%
Richest20%
Poorest20%
Richest20%
Poorest20%
Richest20%
Poorest20%
Richest20%
Poorest20%
Richest20%
314 rapportosullosv iluppoumano2007-2008
indi
cato
rid
isvi
lupp
oum
ano
Disuguaglianzenelcampodellasalutematernaeinfantile
NOTES This table presents data for developing countries
based on data from DHS conducted since 1990. Quintiles are defined by socioeconomic status in terms of assets or wealth, rather than in terms of income or consumption. For details, see Macro International 2007b.
a. Includes tuberculosis (BCG), measles or measles, mumps and rubella (MMR) and diphtheria, pertussis and tetanus (DPT) vaccinations.
b. Based on births in the 10 years preceding the survey.
c. Figure is based on less than 50 unweighted cases.
d. Data are obtained from UNICEF 2007b.e. Includes BCG, measles or MMR, DPT or
Pentavalente, and polio vaccinations.f. Data are from preliminary MICS reports.g. Includes BCG, measles or MMR, DPT, polio and
other vaccinations.h. Data pertain to 5-year period preceding
the survey.i. Large sampling error due to small number
of cases.
SOURCESAllcolumns: Macro International 2007a and 2007b, unless otherwise specified.
LOWHUMANDEVELOPMENT
156 Senegal 2005 20 89 59 65 26 6 89 41 183 64
157 Eritrea 2002 7 81 74 91 45 18 48 38 100 65
158 Nigeria 2003 12 84 3 40 49 18 133 52 257 79
159 Tanzania (United Republic of) 1999 29 83 53 78 50 23 115 92 160 135
160 Guinea 2005 15 87 29 45 41 22 127 68 217 113
161 Rwanda 2005 27 66 74 74 55 30 114 73 211 122
163 Benin 2001 50 99 49 73 35 18 112 50 198 93
164 Malawi d,h 2000 43 83 65 81 26 23 132 86 231 149
165 Zambia 2001–02 20 91 64 80 54 32 115 57 192 92
166 Côte d’Ivoire 2005 27 88 .. .. .. .. 93 79 150 100
169 Ethiopia 2005 1 27 14 36 48 35 80 60 130 92
170 Chad 2004 4 55 1 24 51 32 109 101 176 187
171 Central African Republic 1994–95 14 82 18 64 42 25 132 54 193 98
172 Mozambique 2003 25 89 45 90 49 20 143 71 196 108
173 Mali 2001 8 82 20 56 45 20 137 90 248 148
174 Niger 2006 21 71 20 48 54 37 91 67 206 157
176 Burkina Faso 2003 39 91 34 61 46 21 97 78 206 144
177 Sierra Leoned,h 2005 27 83 .. .. 44 26 159 108 268 179
TaB
ELLa
8
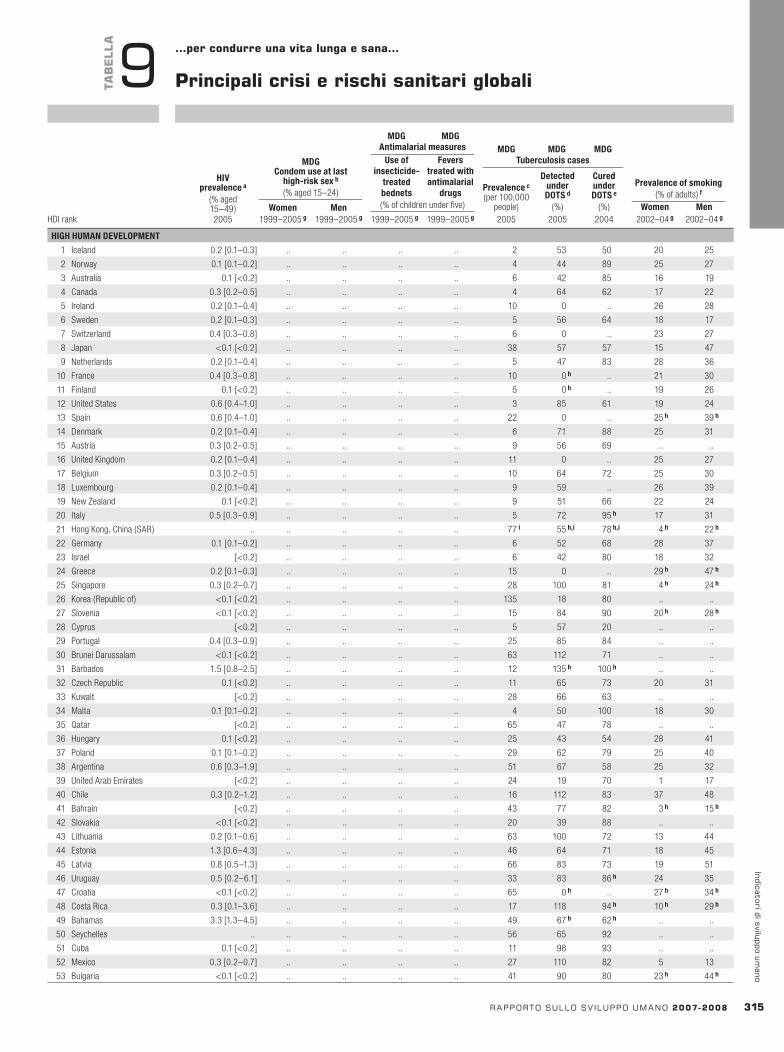
MDGCondomuseatlast
high-risksexb
(% aged 15–24)
MDG MDG MDG MDG MDG
Tuberculosiscases
Prevalenceofsmoking(% of adults)f
Antimalarialmeasures
HIVprevalencea
(% aged 15–49)
Useofinsecticide-
treatedbednets
Feverstreatedwithantimalarial
drugs
HDI rank
Prevalencec
(per 100,000 people)
DetectedunderDOTSd
(%)
CuredunderDOTSe
(%)(% of children under five)Women1999–2005g
Men1999–2005g
Women Men2005 1999–2005g 1999–2005g 2005 2005 2004 2002–04g 2002–04g
rapportosullosv iluppoumano2007-2008 31�
indicatoridisviluppoumano
TaB
ELLa
9 …percondurreunavitalungaesana…
principalicrisierischisanitariglobali
HIGHHUMANDEVELOPMENT
1 Iceland 0.2 [0.1–0.3] .. .. .. .. 2 53 50 20 25
2 Norway 0.1 [0.1–0.2] .. .. .. .. 4 44 89 25 27
3 Australia 0.1 [<0.2] .. .. .. .. 6 42 85 16 19
4 Canada 0.3 [0.2–0.5] .. .. .. .. 4 64 62 17 22
5 Ireland 0.2 [0.1–0.4] .. .. .. .. 10 0 .. 26 28
6 Sweden 0.2 [0.1–0.3] .. .. .. .. 5 56 64 18 17
7 Switzerland 0.4 [0.3–0.8] .. .. .. .. 6 0 .. 23 27
8 Japan <0.1 [<0.2] .. .. .. .. 38 57 57 15 47
9 Netherlands 0.2 [0.1–0.4] .. .. .. .. 5 47 83 28 36
10 France 0.4 [0.3–0.8] .. .. .. .. 10 0h .. 21 30
11 Finland 0.1 [<0.2] .. .. .. .. 5 0h .. 19 26
12 United States 0.6 [0.4–1.0] .. .. .. .. 3 85 61 19 24
13 Spain 0.6 [0.4–1.0] .. .. .. .. 22 0 .. 25h 39h
14 Denmark 0.2 [0.1–0.4] .. .. .. .. 6 71 88 25 31
15 Austria 0.3 [0.2–0.5] .. .. .. .. 9 56 69 .. ..
16 United Kingdom 0.2 [0.1–0.4] .. .. .. .. 11 0 .. 25 27
17 Belgium 0.3 [0.2–0.5] .. .. .. .. 10 64 72 25 30
18 Luxembourg 0.2 [0.1–0.4] .. .. .. .. 9 59 .. 26 39
19 New Zealand 0.1 [<0.2] .. .. .. .. 9 51 66 22 24
20 Italy 0.5 [0.3–0.9] .. .. .. .. 5 72 95h 17 31
21 Hong Kong, China (SAR) .. .. .. .. .. 77i 55h,i 78h,i 4h 22h
22 Germany 0.1 [0.1–0.2] .. .. .. .. 6 52 68 28 37
23 Israel [<0.2] .. .. .. .. 6 42 80 18 32
24 Greece 0.2 [0.1–0.3] .. .. .. .. 15 0 .. 29h 47h
25 Singapore 0.3 [0.2–0.7] .. .. .. .. 28 100 81 4h 24h
26 Korea (Republic of) <0.1 [<0.2] .. .. .. .. 135 18 80 .. ..
27 Slovenia <0.1 [<0.2] .. .. .. .. 15 84 90 20h 28h
28 Cyprus [<0.2] .. .. .. .. 5 57 20 .. ..
29 Portugal 0.4 [0.3–0.9] .. .. .. .. 25 85 84 .. ..
30 Brunei Darussalam <0.1 [<0.2] .. .. .. .. 63 112 71 .. ..
31 Barbados 1.5 [0.8–2.5] .. .. .. .. 12 135h 100h .. ..
32 Czech Republic 0.1 [<0.2] .. .. .. .. 11 65 73 20 31
33 Kuwait [<0.2] .. .. .. .. 28 66 63 .. ..
34 Malta 0.1 [0.1–0.2] .. .. .. .. 4 50 100 18 30
35 Qatar [<0.2] .. .. .. .. 65 47 78 .. ..
36 Hungary 0.1 [<0.2] .. .. .. .. 25 43 54 28 41
37 Poland 0.1 [0.1–0.2] .. .. .. .. 29 62 79 25 40
38 Argentina 0.6 [0.3–1.9] .. .. .. .. 51 67 58 25 32
39 United Arab Emirates [<0.2] .. .. .. .. 24 19 70 1 17
40 Chile 0.3 [0.2–1.2] .. .. .. .. 16 112 83 37 48
41 Bahrain [<0.2] .. .. .. .. 43 77 82 3h 15h
42 Slovakia <0.1 [<0.2] .. .. .. .. 20 39 88 .. ..
43 Lithuania 0.2 [0.1–0.6] .. .. .. .. 63 100 72 13 44
44 Estonia 1.3 [0.6–4.3] .. .. .. .. 46 64 71 18 45
45 Latvia 0.8 [0.5–1.3] .. .. .. .. 66 83 73 19 51
46 Uruguay 0.5 [0.2–6.1] .. .. .. .. 33 83 86h 24 35
47 Croatia <0.1 [<0.2] .. .. .. .. 65 0h .. 27h 34h
48 Costa Rica 0.3 [0.1–3.6] .. .. .. .. 17 118 94h 10h 29h
49 Bahamas 3.3 [1.3–4.5] .. .. .. .. 49 67h 62h .. ..
50 Seychelles .. .. .. .. .. 56 65 92 .. ..
51 Cuba 0.1 [<0.2] .. .. .. .. 11 98 93 .. ..
52 Mexico 0.3 [0.2–0.7] .. .. .. .. 27 110 82 5 13
53 Bulgaria <0.1 [<0.2] .. .. .. .. 41 90 80 23h 44h
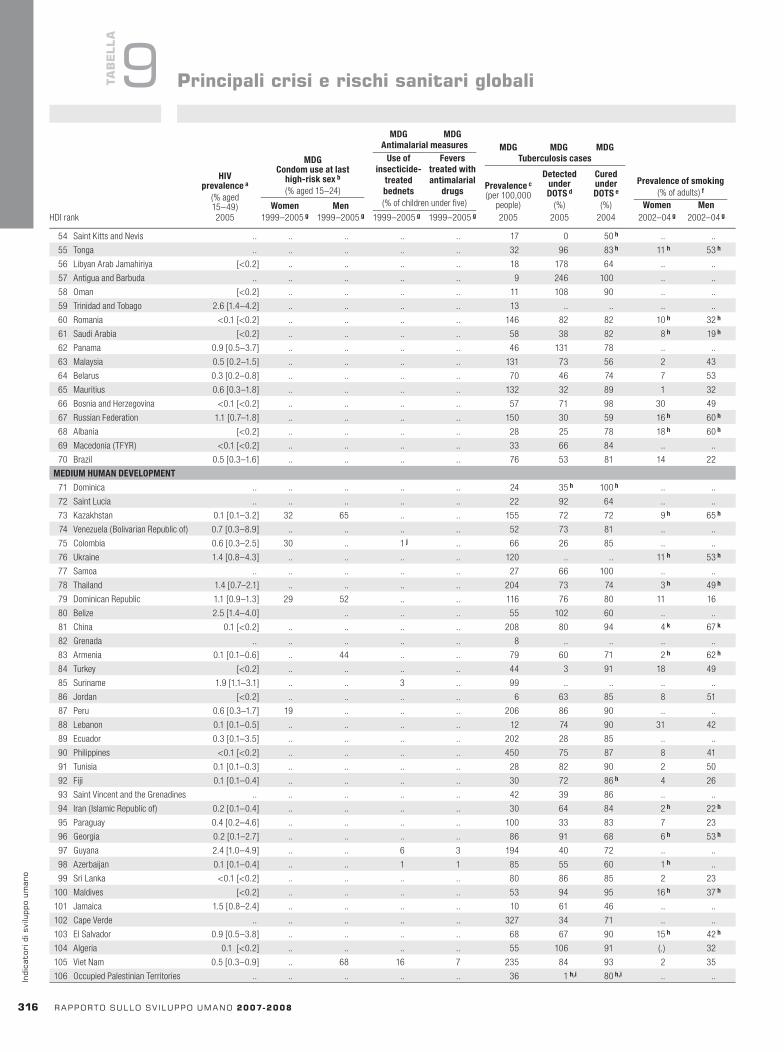
MDGCondomuseatlast
high-risksexb
(% aged 15–24)
MDG MDG MDG MDG MDG
Tuberculosiscases
Prevalenceofsmoking(% of adults)f
Antimalarialmeasures
HIVprevalencea
(% aged 15–49)
Useofinsecticide-
treatedbednets
Feverstreatedwithantimalarial
drugs
HDI rank
Prevalencec
(per 100,000 people)
DetectedunderDOTSd
(%)
CuredunderDOTSe
(%)(% of children under five)Women1999–2005g
Men1999–2005g
Women Men2005 1999–2005g 1999–2005g 2005 2005 2004 2002–04g 2002–04g
31� rapportosullosv iluppoumano2007-2008
indi
cato
rid
isvi
lupp
oum
ano
TaB
ELLa
9 principalicrisierischisanitariglobali
54 Saint Kitts and Nevis .. .. .. .. .. 17 0 50h .. ..
55 Tonga .. .. .. .. .. 32 96 83h 11h 53h
56 Libyan Arab Jamahiriya [<0.2] .. .. .. .. 18 178 64 .. ..
57 Antigua and Barbuda .. .. .. .. .. 9 246 100 .. ..
58 Oman [<0.2] .. .. .. .. 11 108 90 .. ..
59 Trinidad and Tobago 2.6 [1.4–4.2] .. .. .. .. 13 .. .. .. ..
60 Romania <0.1 [<0.2] .. .. .. .. 146 82 82 10h 32h
61 Saudi Arabia [<0.2] .. .. .. .. 58 38 82 8h 19h
62 Panama 0.9 [0.5–3.7] .. .. .. .. 46 131 78 .. ..
63 Malaysia 0.5 [0.2–1.5] .. .. .. .. 131 73 56 2 43
64 Belarus 0.3 [0.2–0.8] .. .. .. .. 70 46 74 7 53
65 Mauritius 0.6 [0.3–1.8] .. .. .. .. 132 32 89 1 32
66 Bosnia and Herzegovina <0.1 [<0.2] .. .. .. .. 57 71 98 30 49
67 Russian Federation 1.1 [0.7–1.8] .. .. .. .. 150 30 59 16h 60h
68 Albania [<0.2] .. .. .. .. 28 25 78 18h 60h
69 Macedonia (TFYR) <0.1 [<0.2] .. .. .. .. 33 66 84 .. ..
70 Brazil 0.5 [0.3–1.6] .. .. .. .. 76 53 81 14 22
MEDIUMHUMANDEVELOPMENT
71 Dominica .. .. .. .. .. 24 35h 100h .. ..
72 Saint Lucia .. .. .. .. .. 22 92 64 .. ..
73 Kazakhstan 0.1 [0.1–3.2] 32 65 .. .. 155 72 72 9h 65h
74 Venezuela (Bolivarian Republic of) 0.7 [0.3–8.9] .. .. .. .. 52 73 81 .. ..
75 Colombia 0.6 [0.3–2.5] 30 .. 1j .. 66 26 85 .. ..
76 Ukraine 1.4 [0.8–4.3] .. .. .. .. 120 .. .. 11h 53h
77 Samoa .. .. .. .. .. 27 66 100 .. ..
78 Thailand 1.4 [0.7–2.1] .. .. .. .. 204 73 74 3h 49h
79 Dominican Republic 1.1 [0.9–1.3] 29 52 .. .. 116 76 80 11 16
80 Belize 2.5 [1.4–4.0] .. .. .. 55 102 60 .. ..
81 China 0.1 [<0.2] .. .. .. .. 208 80 94 4k 67k
82 Grenada .. .. .. .. .. 8 .. .. .. ..
83 Armenia 0.1 [0.1–0.6] .. 44 .. .. 79 60 71 2h 62h
84 Turkey [<0.2] .. .. .. .. 44 3 91 18 49
85 Suriname 1.9 [1.1–3.1] .. .. 3 .. 99 .. .. .. ..
86 Jordan [<0.2] .. .. .. .. 6 63 85 8 51
87 Peru 0.6 [0.3–1.7] 19 .. .. .. 206 86 90 .. ..
88 Lebanon 0.1 [0.1–0.5] .. .. .. .. 12 74 90 31 42
89 Ecuador 0.3 [0.1–3.5] .. .. .. .. 202 28 85 .. ..
90 Philippines <0.1 [<0.2] .. .. .. .. 450 75 87 8 41
91 Tunisia 0.1 [0.1–0.3] .. .. .. .. 28 82 90 2 50
92 Fiji 0.1 [0.1–0.4] .. .. .. .. 30 72 86h 4 26
93 Saint Vincent and the Grenadines .. .. .. .. .. 42 39 86 .. ..
94 Iran ( Islamic Republic of) 0.2 [0.1–0.4] .. .. .. .. 30 64 84 2h 22h
95 Paraguay 0.4 [0.2–4.6] .. .. .. .. 100 33 83 7 23
96 Georgia 0.2 [0.1–2.7] .. .. .. .. 86 91 68 6h 53h
97 Guyana 2.4 [1.0–4.9] .. .. 6 3 194 40 72 .. ..
98 Azerbaijan 0.1 [0.1–0.4] .. .. 1 1 85 55 60 1h ..
99 Sri Lanka <0.1 [<0.2] .. .. .. .. 80 86 85 2 23
100 Maldives [<0.2] .. .. .. .. 53 94 95 16h 37h
101 Jamaica 1.5 [0.8–2.4] .. .. .. .. 10 61 46 .. ..
102 Cape Verde .. .. .. .. .. 327 34 71 .. ..
103 El Salvador 0.9 [0.5–3.8] .. .. .. .. 68 67 90 15h 42h
104 Algeria 0.1 [<0.2] .. .. .. .. 55 106 91 (.) 32
105 Viet Nam 0.5 [0.3–0.9] .. 68 16 7 235 84 93 2 35
106 Occupied Palestinian Territories .. .. .. .. .. 36 1h,i 80h,i .. ..
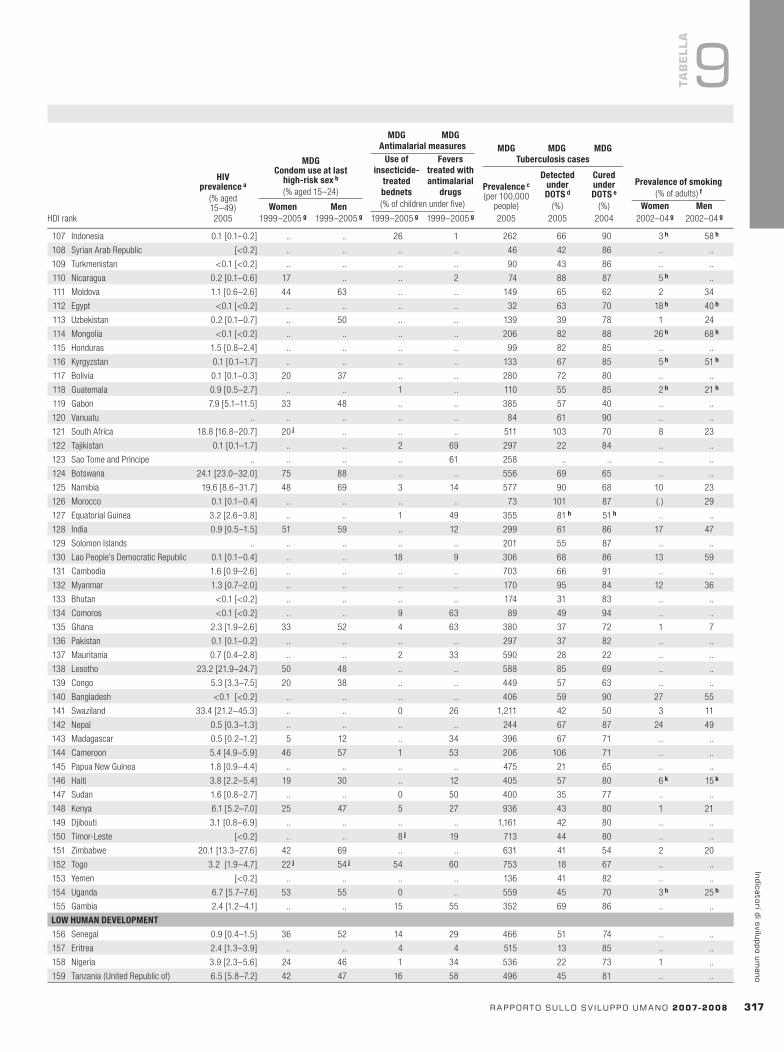
MDGCondomuseatlast
high-risksexb
(% aged 15–24)
MDG MDG MDG MDG MDG
Tuberculosiscases
Prevalenceofsmoking(% of adults)f
Antimalarialmeasures
HIVprevalencea
(% aged 15–49)
Useofinsecticide-
treatedbednets
Feverstreatedwithantimalarial
drugs
HDI rank
Prevalencec
(per 100,000 people)
DetectedunderDOTSd
(%)
CuredunderDOTSe
(%)(% of children under five)Women1999–2005g
Men1999–2005g
Women Men2005 1999–2005g 1999–2005g 2005 2005 2004 2002–04g 2002–04g
rapportosullosv iluppoumano2007-2008 317
indicatoridisviluppoumano
TaB
ELLa
9
107 Indonesia 0.1 [0.1–0.2] .. .. 26 1 262 66 90 3h 58h
108 Syrian Arab Republic [<0.2] .. .. .. .. 46 42 86 .. ..
109 Turkmenistan <0.1 [<0.2] .. .. .. .. 90 43 86 .. ..
110 Nicaragua 0.2 [0.1–0.6] 17 .. .. 2 74 88 87 5h ..
111 Moldova 1.1 [0.6–2.6] 44 63 .. .. 149 65 62 2 34
112 Egypt <0.1 [<0.2] .. .. .. .. 32 63 70 18h 40h
113 Uzbekistan 0.2 [0.1–0.7] .. 50 .. .. 139 39 78 1 24
114 Mongolia <0.1 [<0.2] .. .. .. .. 206 82 88 26h 68h
115 Honduras 1.5 [0.8–2.4] .. .. .. .. 99 82 85 .. ..
116 Kyrgyzstan 0.1 [0.1–1.7] .. .. .. .. 133 67 85 5h 51h
117 Bolivia 0.1 [0.1–0.3] 20 37 .. .. 280 72 80 .. ..
118 Guatemala 0.9 [0.5–2.7] .. .. 1 .. 110 55 85 2h 21h
119 Gabon 7.9 [5.1–11.5] 33 48 .. .. 385 57 40 .. ..
120 Vanuatu .. .. .. .. .. 84 61 90 .. ..
121 South Africa 18.8 [16.8–20.7] 20j .. .. .. 511 103 70 8 23
122 Tajikistan 0.1 [0.1–1.7] .. .. 2 69 297 22 84 .. ..
123 Sao Tome and Principe .. .. .. .. 61 258 .. .. .. ..
124 Botswana 24.1 [23.0–32.0] 75 88 .. .. 556 69 65 .. ..
125 Namibia 19.6 [8.6–31.7] 48 69 3 14 577 90 68 10 23
126 Morocco 0.1 [0.1–0.4] .. .. .. .. 73 101 87 (.) 29
127 Equatorial Guinea 3.2 [2.6–3.8] .. .. 1 49 355 81h 51h .. ..
128 India 0.9 [0.5–1.5] 51 59 .. 12 299 61 86 17 47
129 Solomon Islands .. .. .. .. .. 201 55 87 .. ..
130 Lao People’s Democratic Republic 0.1 [0.1–0.4] .. .. 18 9 306 68 86 13 59
131 Cambodia 1.6 [0.9–2.6] .. .. .. .. 703 66 91 .. ..
132 Myanmar 1.3 [0.7–2.0] .. .. .. .. 170 95 84 12 36
133 Bhutan <0.1 [<0.2] .. .. .. .. 174 31 83 .. ..
134 Comoros <0.1 [<0.2] .. .. 9 63 89 49 94 .. ..
135 Ghana 2.3 [1.9–2.6] 33 52 4 63 380 37 72 1 7
136 Pakistan 0.1 [0.1–0.2] .. .. .. .. 297 37 82 .. ..
137 Mauritania 0.7 [0.4–2.8] .. .. 2 33 590 28 22 .. ..
138 Lesotho 23.2 [21.9–24.7] 50 48 .. .. 588 85 69 .. ..
139 Congo 5.3 [3.3–7.5] 20 38 .. .. 449 57 63 .. ..
140 Bangladesh <0.1 [<0.2] .. .. .. .. 406 59 90 27 55
141 Swaziland 33.4 [21.2–45.3] .. .. 0 26 1,211 42 50 3 11
142 Nepal 0.5 [0.3–1.3] .. .. .. .. 244 67 87 24 49
143 Madagascar 0.5 [0.2–1.2] 5 12 .. 34 396 67 71 .. ..
144 Cameroon 5.4 [4.9–5.9] 46 57 1 53 206 106 71 .. ..
145 Papua New Guinea 1.8 [0.9–4.4] .. .. .. .. 475 21 65 .. ..
146 Haiti 3.8 [2.2–5.4] 19 30 .. 12 405 57 80 6k 15k
147 Sudan 1.6 [0.8–2.7] .. .. 0 50 400 35 77 .. ..
148 Kenya 6.1 [5.2–7.0] 25 47 5 27 936 43 80 1 21
149 Djibouti 3.1 [0.8–6.9] .. .. .. .. 1,161 42 80 .. ..
150 Timor-Leste [<0.2] .. .. 8j 19 713 44 80 .. ..
151 Zimbabwe 20.1 [13.3–27.6] 42 69 .. .. 631 41 54 2 20
152 Togo 3.2 [1.9–4.7] 22j 54j 54 60 753 18 67 .. ..
153 Yemen [<0.2] .. .. .. .. 136 41 82 .. ..
154 Uganda 6.7 [5.7–7.6] 53 55 0 .. 559 45 70 3h 25h
155 Gambia 2.4 [1.2–4.1] .. .. 15 55 352 69 86 .. ..
LOWHUMANDEVELOPMENT
156 Senegal 0.9 [0.4–1.5] 36 52 14 29 466 51 74 .. ..
157 Eritrea 2.4 [1.3–3.9] .. .. 4 4 515 13 85 .. ..
158 Nigeria 3.9 [2.3–5.6] 24 46 1 34 536 22 73 1 ..
159 Tanzania (United Republic of) 6.5 [5.8–7.2] 42 47 16 58 496 45 81 .. ..

HDI rank
Lifeexpectancyatbirth(years)
MDGInfantmortalityrate(per 1,000 live births)
MDGUnder-five
mortalityrate(per 1,000 live births)
Probabilityatbirthofsurvivingtoage65a
(% of cohort)
MDGMaternalmortalityratio(per 100,000 live births)
Female Male Reportedb Adjustedc
1970–75d 2000–05d 1970 2005 1970 2005 2000–05d 2000–05d 1990–2005e 2005
MDGCondomuseatlast
high-risksexb
(% aged 15–24)
MDG MDG MDG MDG MDG
Tuberculosiscases
Prevalenceofsmoking(% of adults)f
Antimalarialmeasures
HIVprevalencea
(% aged 15–49)
Useofinsecticide-
treatedbednets
Feverstreatedwithantimalarial
drugs
HDI rank
Prevalencec
(per 100,000 people)
DetectedunderDOTSd
(%)
CuredunderDOTSe
(%)(% of children under five)Women1999–2005g
Men1999–2005g
Women Men2005 1999–2005g 1999–2005g 2005 2005 2004 2002–04g 2002–04g
318 rapportosullosv iluppoumano2007-2008
indi
cato
rid
isvi
lupp
oum
ano
TaB
ELLa
9 principalicrisierischisanitariglobali
NOTESa. Data are point and range estimates based on new
estimation models developed by UNAIDS. Range estimates are presented in square brackets.
b. Because of data limitations, comparisons across countries should be made with caution. Data for some countries may refer only to part of the country or differ from the standard definition.
c. Data refer to all forms of tuberculosis.d. Calculated by dividing the new smear-positive
cases of tuberculosis detected under DOTS, the internationally recommended tuberculosis control strategy, by the estimated annual incidence of new smear-positive cases. Values can exceed 100% because of intense case detection in an area
with a backlog of chronic cases, overreporting (for example, double counting), overdiagnosis or underestimation of incidence (WHO 2007b).
e. Data are the share of new smear-positive cases registered for treatment under the DOTS case detection and treatment strategy that were successfully treated.
f. The age range varies among countries, but in most is 18 and older or 15 and older.
g. Data refer to the most recent year available during the period specified.
h. Data refer to a period other than that specified.i. UN 2006a.j. UNICEF 2005.k. Data refer to 2005.
SOURCESColumn1: UNAIDS 2006.Columns2–5: UNICEF 2006.Columns6–8: WHO 2007a.Columns9and10: World Bank 2007b, based on data from the Tobacco Atlas, 2nd edition (2006).
160 Guinea 1.5 [1.2–1.8] 17 32 4 56 431 56 72 .. ..
161 Rwanda 3.1 [2.9–3.2] 26 40 5 13 673 29 77 .. ..
162 Angola 3.7 [2.3–5.3] .. .. 2 63 333 85 68 .. ..
163 Benin 1.8 [1.2–2.5] 19 34 7 60 144 83 83 .. ..
164 Malawi 14.1 [6.9–21.4] 35 47 15 28 518 39 71 5 21
165 Zambia 17.0 [15.9–18.1] 35 40 7 52 618 52 83 1 16
166 Côte d’Ivoire 7.1 [4.3–9.7] 25j 56j 4 58 659 38 71 .. ..
167 Burundi 3.3 [2.7–3.8] .. .. 1 31 602 30 78 .. ..
168 Congo (Democratic Republic of the) 3.2 [1.8–4.9] .. .. 1 45 541 72 85 .. ..
169 Ethiopia [0.9–3.5] 17 30 1 3 546 33 79 (.) 6
170 Chad 3.5 [1.7–6.0] 17 25 1j 44 495 22 69 .. ..
171 Central African Republic 10.7 [4.5–17.2] .. .. 2 69 483 40 91 .. ..
172 Mozambique 16.1 [12.5–20.0] 29 33 .. 15 597 49 77 .. ..
173 Mali 1.7 [1.3–2.1] 14 30 8 38 578 21 71 .. ..
174 Niger 1.1 [0.5–1.9] 7j 30j 6 48 294 50 61 .. ..
175 Guinea-Bissau 3.8 [2.1–6.0] .. .. 7 58 293 79 75 .. ..
176 Burkina Faso 2.0 [1.5–2.5] 54 67 2 50 461 18 67 .. ..
177 Sierra Leone 1.6 [0.9–2.4] .. .. 2 61 905 37 82 .. ..
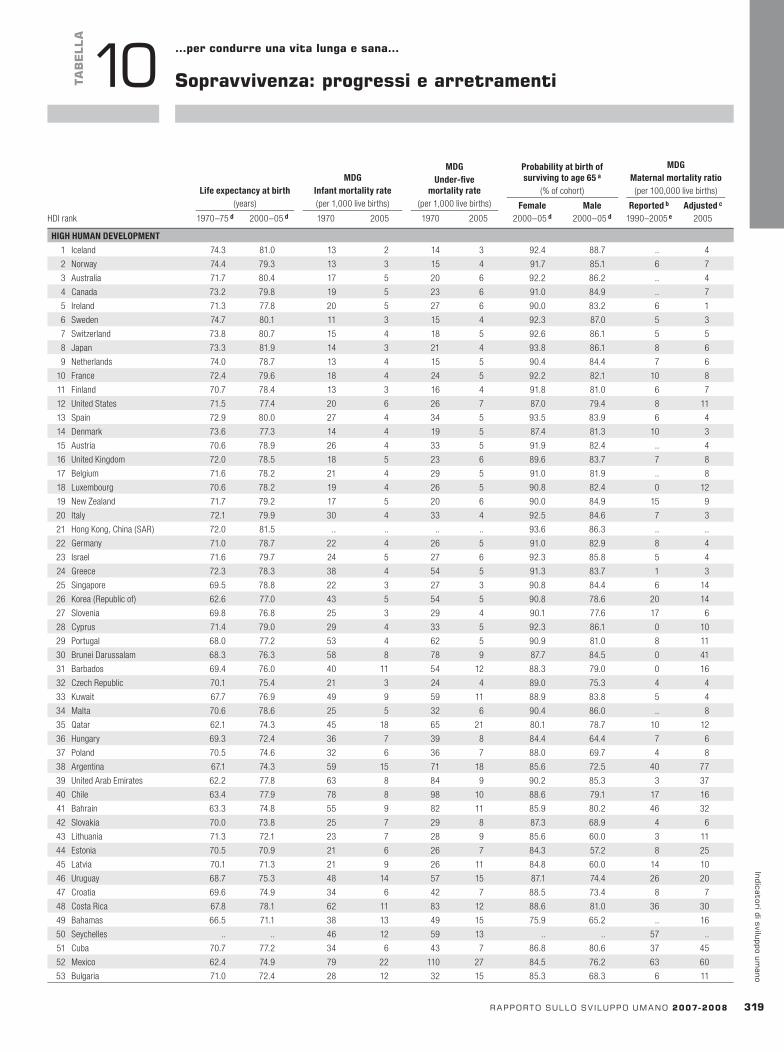
HDI rank
Lifeexpectancyatbirth(years)
MDGInfantmortalityrate(per 1,000 live births)
MDGUnder-five
mortalityrate(per 1,000 live births)
Probabilityatbirthofsurvivingtoage65a
(% of cohort)
MDGMaternalmortalityratio(per 100,000 live births)
Female Male Reportedb Adjustedc
1970–75d 2000–05d 1970 2005 1970 2005 2000–05d 2000–05d 1990–2005e 2005
rapportosullosv iluppoumano2007-2008 31�
indicatoridisviluppoumano
TaB
ELLa
10 …percondurreunavitalungaesana…
Sopravvivenza:progressiearretramenti
HIGHHUMANDEVELOPMENT
1 Iceland 74.3 81.0 13 2 14 3 92.4 88.7 .. 4
2 Norway 74.4 79.3 13 3 15 4 91.7 85.1 6 7
3 Australia 71.7 80.4 17 5 20 6 92.2 86.2 .. 4
4 Canada 73.2 79.8 19 5 23 6 91.0 84.9 .. 7
5 Ireland 71.3 77.8 20 5 27 6 90.0 83.2 6 1
6 Sweden 74.7 80.1 11 3 15 4 92.3 87.0 5 3
7 Switzerland 73.8 80.7 15 4 18 5 92.6 86.1 5 5
8 Japan 73.3 81.9 14 3 21 4 93.8 86.1 8 6
9 Netherlands 74.0 78.7 13 4 15 5 90.4 84.4 7 6
10 France 72.4 79.6 18 4 24 5 92.2 82.1 10 8
11 Finland 70.7 78.4 13 3 16 4 91.8 81.0 6 7
12 United States 71.5 77.4 20 6 26 7 87.0 79.4 8 11
13 Spain 72.9 80.0 27 4 34 5 93.5 83.9 6 4
14 Denmark 73.6 77.3 14 4 19 5 87.4 81.3 10 3
15 Austria 70.6 78.9 26 4 33 5 91.9 82.4 .. 4
16 United Kingdom 72.0 78.5 18 5 23 6 89.6 83.7 7 8
17 Belgium 71.6 78.2 21 4 29 5 91.0 81.9 .. 8
18 Luxembourg 70.6 78.2 19 4 26 5 90.8 82.4 0 12
19 New Zealand 71.7 79.2 17 5 20 6 90.0 84.9 15 9
20 Italy 72.1 79.9 30 4 33 4 92.5 84.6 7 3
21 Hong Kong, China (SAR) 72.0 81.5 .. .. .. .. 93.6 86.3 .. ..
22 Germany 71.0 78.7 22 4 26 5 91.0 82.9 8 4
23 Israel 71.6 79.7 24 5 27 6 92.3 85.8 5 4
24 Greece 72.3 78.3 38 4 54 5 91.3 83.7 1 3
25 Singapore 69.5 78.8 22 3 27 3 90.8 84.4 6 14
26 Korea (Republic of) 62.6 77.0 43 5 54 5 90.8 78.6 20 14
27 Slovenia 69.8 76.8 25 3 29 4 90.1 77.6 17 6
28 Cyprus 71.4 79.0 29 4 33 5 92.3 86.1 0 10
29 Portugal 68.0 77.2 53 4 62 5 90.9 81.0 8 11
30 Brunei Darussalam 68.3 76.3 58 8 78 9 87.7 84.5 0 41
31 Barbados 69.4 76.0 40 11 54 12 88.3 79.0 0 16
32 Czech Republic 70.1 75.4 21 3 24 4 89.0 75.3 4 4
33 Kuwait 67.7 76.9 49 9 59 11 88.9 83.8 5 4
34 Malta 70.6 78.6 25 5 32 6 90.4 86.0 .. 8
35 Qatar 62.1 74.3 45 18 65 21 80.1 78.7 10 12
36 Hungary 69.3 72.4 36 7 39 8 84.4 64.4 7 6
37 Poland 70.5 74.6 32 6 36 7 88.0 69.7 4 8
38 Argentina 67.1 74.3 59 15 71 18 85.6 72.5 40 77
39 United Arab Emirates 62.2 77.8 63 8 84 9 90.2 85.3 3 37
40 Chile 63.4 77.9 78 8 98 10 88.6 79.1 17 16
41 Bahrain 63.3 74.8 55 9 82 11 85.9 80.2 46 32
42 Slovakia 70.0 73.8 25 7 29 8 87.3 68.9 4 6
43 Lithuania 71.3 72.1 23 7 28 9 85.6 60.0 3 11
44 Estonia 70.5 70.9 21 6 26 7 84.3 57.2 8 25
45 Latvia 70.1 71.3 21 9 26 11 84.8 60.0 14 10
46 Uruguay 68.7 75.3 48 14 57 15 87.1 74.4 26 20
47 Croatia 69.6 74.9 34 6 42 7 88.5 73.4 8 7
48 Costa Rica 67.8 78.1 62 11 83 12 88.6 81.0 36 30
49 Bahamas 66.5 71.1 38 13 49 15 75.9 65.2 .. 16
50 Seychelles .. .. 46 12 59 13 .. .. 57 ..
51 Cuba 70.7 77.2 34 6 43 7 86.8 80.6 37 45
52 Mexico 62.4 74.9 79 22 110 27 84.5 76.2 63 60
53 Bulgaria 71.0 72.4 28 12 32 15 85.3 68.3 6 11

HDI rank
Lifeexpectancyatbirth(years)
MDGInfantmortalityrate(per 1,000 live births)
MDGUnder-five
mortalityrate(per 1,000 live births)
Probabilityatbirthofsurvivingtoage65a
(% of cohort)
MDGMaternalmortalityratio(per 100,000 live births)
Female Male Reportedb Adjustedc
1970–75d 2000–05d 1970 2005 1970 2005 2000–05d 2000–05d 1990–2005e 2005HDI rank
Lifeexpectancyatbirth(years)
MDGInfantmortalityrate(per 1,000 live births)
MDGUnder-five
mortalityrate(per 1,000 live births)
Probabilityatbirthofsurvivingtoage65a
(% of cohort)
MDGMaternalmortalityratio(per 100,000 live births)
Female Male Reportedb Adjustedc
1970–75d 2000–05d 1970 2005 1970 2005 2000–05d 2000–05d 1990–2005e 2005
320 rapportosullosv iluppoumano2007-2008
indi
cato
rid
isvi
lupp
oum
ano
TaB
ELLa
10 Sopravvivenza:progressiearretramenti
54 Saint Kitts and Nevis .. .. .. 18 .. 20 .. .. 250 ..
55 Tonga 65.6 72.3 40 20 50 24 78.2 73.8 .. ..
56 Libyan Arab Jamahiriya 52.8 72.7 105 18 160 19 82.1 72.2 77 97
57 Antigua and Barbuda .. .. .. 11 .. 12 .. .. 65 ..
58 Oman 52.1 74.2 126 10 200 12 84.9 79.5 23 64
59 Trinidad and Tobago 65.9 69.0 49 17 57 19 72.1 63.8 45 45
60 Romania 69.2 71.3 46 16 57 19 83.7 66.3 17 24
61 Saudi Arabia 53.9 71.6 118 21 185 26 82.0 73.7 .. 18
62 Panama 66.2 74.7 46 19 68 24 85.9 77.4 40 83
63 Malaysia 63.0 73.0 46 10 70 12 83.1 72.9 30 62
64 Belarus 71.5 68.4 31 10 37 12 81.3 50.7 17 18
65 Mauritius 62.9 72.0 64 13 86 15 80.9 66.4 22 15
66 Bosnia and Herzegovina 67.5 74.1 60 13 82 15 85.3 74.4 8 3
67 Russian Federation 69.0 64.8 29 14 36 18 76.0 42.1 32 28
68 Albania 67.7 75.7 78 16 109 18 89.5 79.7 17 92
69 Macedonia (TFYR) 67.5 73.4 85 15 119 17 84.3 75.3 21 10
70 Brazil 59.5 71.0 95 31 135 33 78.5 64.2 72 110
MEDIUMHUMANDEVELOPMENT
71 Dominica .. .. .. 13 .. 15 .. .. 67 ..
72 Saint Lucia 65.3 72.5 .. 12 .. 14 78.2 72.3 35 ..
73 Kazakhstan 63.1 64.9 .. 63 .. 73 73.7 45.8 42 140
74 Venezuela (Bolivarian Republic of) 65.7 72.8 48 18 62 21 82.6 71.9 58 57
75 Colombia 61.6 71.7 68 17 105 21 81.8 69.0 84 120
76 Ukraine 70.1 67.6 22 13 27 17 79.5 50.4 13 18
77 Samoa 56.1 70.0 73 24 101 29 78.6 65.1 .. ..
78 Thailand 60.4 68.6 74 18 102 21 75.5 57.8 24 110
79 Dominican Republic 59.6 70.8 91 26 127 31 76.7 65.7 180 150
80 Belize 67.6 75.6 .. 15 .. 17 86.8 77.3 140 52
81 China 63.2f 72.0f 85 23 120 27 80.9f 73.8f 51 45
82 Grenada 64.6 67.7 .. 17 .. 21 73.8 67.0 1 ..
83 Armenia 70.8 71.4 .. 26 .. 29 81.9 66.9 22 39
84 Turkey 57.0 70.8 150 26 201 29 82.3 71.9 130g 44
85 Suriname 64.0 69.1 .. 30 .. 39 76.9 63.3 150 72
86 Jordan 56.5 71.3 77 22 107 26 78.2 70.9 41 62
87 Peru 55.4 69.9 119 23 174 27 77.5 68.0 190 240
88 Lebanon 65.4 71.0 45 27 54 30 80.6 72.1 100g 150
89 Ecuador 58.8 74.2 87 22 140 25 84.0 74.0 80 110
90 Philippines 58.1 70.3 56 25 90 33 79.3 70.7 170 230
91 Tunisia 55.6 73.0 135 20 201 24 85.3 76.5 69 100
92 Fiji 60.6 67.8 50 16 65 18 72.9 62.0 38 210
93 Saint Vincent and the Grenadines 61.6 70.6 .. 17 .. 20 79.9 71.3 93 ..
94 Iran ( Islamic Republic of) 55.2 69.5 122 31 191 36 78.3 71.1 37 140
95 Paraguay 65.8 70.8 58 20 78 23 77.7 70.8 180 150
96 Georgia 68.2 70.5 .. 41 .. 45 83.0 66.1 52 66
97 Guyana 60.0 63.6 .. 47 .. 63 66.8 55.0 120 470
98 Azerbaijan 65.6 66.8 .. 74 .. 89 76.0 61.2 19 82
99 Sri Lanka 65.0 70.8 65 12 100 14 81.3 62.8 43 58
100 Maldives 51.4 65.6 157 33 255 42 67.7 66.2 140 120
101 Jamaica 69.0 72.0 49 17 64 20 78.3 69.1 110 26
102 Cape Verde 57.5 70.2 .. 26 .. 35 80.3 68.3 76 210
103 El Salvador 58.2 70.7 111 23 162 27 78.5 68.3 170 170
104 Algeria 54.5 71.0 143 34 220 39 78.9 75.9 120 180
105 Viet Nam 50.3 73.0 55 16 87 19 82.7 76.0 170 150
106 Occupied Palestinian Territories 56.5 72.4 .. 21 .. 23 81.8 75.5 .. ..

HDI rank
Lifeexpectancyatbirth(years)
MDGInfantmortalityrate(per 1,000 live births)
MDGUnder-five
mortalityrate(per 1,000 live births)
Probabilityatbirthofsurvivingtoage65a
(% of cohort)
MDGMaternalmortalityratio(per 100,000 live births)
Female Male Reportedb Adjustedc
1970–75d 2000–05d 1970 2005 1970 2005 2000–05d 2000–05d 1990–2005e 2005
rapportosullosv iluppoumano2007-2008 321
indicatoridisviluppoumano
TaB
ELLa
10
107 Indonesia 49.2 68.6 104 28 172 36 75.8 68.1 310 420
108 Syrian Arab Republic 57.3 73.1 90 14 123 15 83.6 76.4 65 130
109 Turkmenistan 59.1 62.4 .. 81 .. 104 70.8 52.1 14 130
110 Nicaragua 55.2 70.8 113 30 165 37 77.3 67.0 83 170
111 Moldova 64.8 67.9 53 14 70 16 75.5 56.7 22 22
112 Egypt 51.1 69.8 157 28 235 33 80.2 70.4 84 130
113 Uzbekistan 63.6 66.5 83 57 101 68 73.3 60.0 30 24
114 Mongolia 53.8 65.0 .. 39 .. 49 68.0 55.3 93 46
115 Honduras 53.9 68.6 116 31 170 40 76.6 62.1 110 280
116 Kyrgyzstan 61.2 65.3 104 58 130 67 74.4 56.3 49 150
117 Bolivia 46.7 63.9 147 52 243 65 69.0 61.0 30 290
118 Guatemala 53.7 69.0 115 32 168 43 77.6 65.4 150 290
119 Gabon 48.7 56.8 .. 60 .. 91 53.8 48.9 520 520
120 Vanuatu 54.0 68.4 107 31 155 38 75.6 68.2 68 ..
121 South Africa 53.7 53.4 .. 55 .. 68 46.0 33.9 150 400
122 Tajikistan 60.9 65.9 108 59 140 71 72.0 61.9 37 170
123 Sao Tome and Principe 56.5 64.3 .. 75 .. 118 72.7 65.2 100 ..
124 Botswana 56.0 46.6 99 87 142 120 31.9 24.4 330 380
125 Namibia 53.9 51.5 85 46 135 62 41.9 34.3 270 210
126 Morocco 52.9 69.6 119 36 184 40 79.4 71.2 230 240
127 Equatorial Guinea 40.5 49.3 .. 123 .. 205 44.7 39.7 .. 680
128 India 50.7 62.9 127 56 202 74 66.1 57.4 540 450
129 Solomon Islands 55.5 62.3 70 24 97 29 63.6 59.6 550g 220
130 Lao People’s Democratic Republic 46.5 61.9 145 62 218 79 63.7 57.9 410 660
131 Cambodia 40.3 56.8 .. 98 .. 143 57.8 43.7 440 590
132 Myanmar 53.1 59.9 122 75 179 105 64.1 50.7 230 380
133 Bhutan 41.8 63.5 156 65 267 75 67.6 61.3 260 440
134 Comoros 48.9 63.0 159 53 215 71 66.9 58.3 380 400
135 Ghana 49.9 58.5 111 68 186 112 56.5 54.3 210g 560
136 Pakistan 51.9 63.6 120 79 181 99 66.6 63.2 530 320
137 Mauritania 48.4 62.2 151 78 250 125 69.4 60.4 750 820
138 Lesotho 49.8 44.6 140 102 186 132 30.7 21.9 760 960
139 Congo 54.9 53.0 100 81 160 108 45.9 39.7 .. 740
140 Bangladesh 45.3 62.0 145 54 239 73 63.2 59.0 320 570
141 Swaziland 49.6 43.9 132 110 196 160 31.1 22.9 230 390
142 Nepal 44.0 61.3 165 56 250 74 61.3 58.4 540 830
143 Madagascar 44.9 57.3 109 74 180 119 58.1 52.1 470 510
144 Cameroon 47.0 49.9 127 87 215 149 42.5 39.9 670 1,000
145 Papua New Guinea 44.7 56.7 110 55 158 74 54.3 40.3 370g 470
146 Haiti 48.0 58.1 148 84 221 120 57.5 50.8 520 670
147 Sudan 45.1 56.4 104 62 172 90 55.3 49.7 550g 450
148 Kenya 53.6 51.0 96 79 156 120 42.5 37.0 410 560
149 Djibouti 44.4 53.4 .. 88 .. 133 50.4 43.7 74 650
150 Timor-Leste 40.0 58.3 .. 52 .. 61 57.3 52.9 .. 380
151 Zimbabwe 55.6 40.0 86 81 138 132 18.0 15.0 1,100 880
152 Togo 49.8 57.6 128 78 216 139 61.2 52.8 480 510
153 Yemen 39.8 60.3 202 76 303 102 61.7 55.0 370 430
154 Uganda 51.0 47.8 100 79 170 136 36.6 33.6 510 550
155 Gambia 38.3 58.0 180 97 311 137 61.4 54.8 730 690
LOWHUMANDEVELOPMENT
156 Senegal 45.8 61.6 164 77 279 136 69.7 60.7 430 980
157 Eritrea 44.1 55.2 143 50 237 78 50.2 36.4 1,000 450
158 Nigeria 42.8 46.6 140 100 265 194 40.6 37.0 .. 1,100
159 Tanzania (United Republic of) 47.6 49.7 129 76 218 122 41.0 36.0 580 950
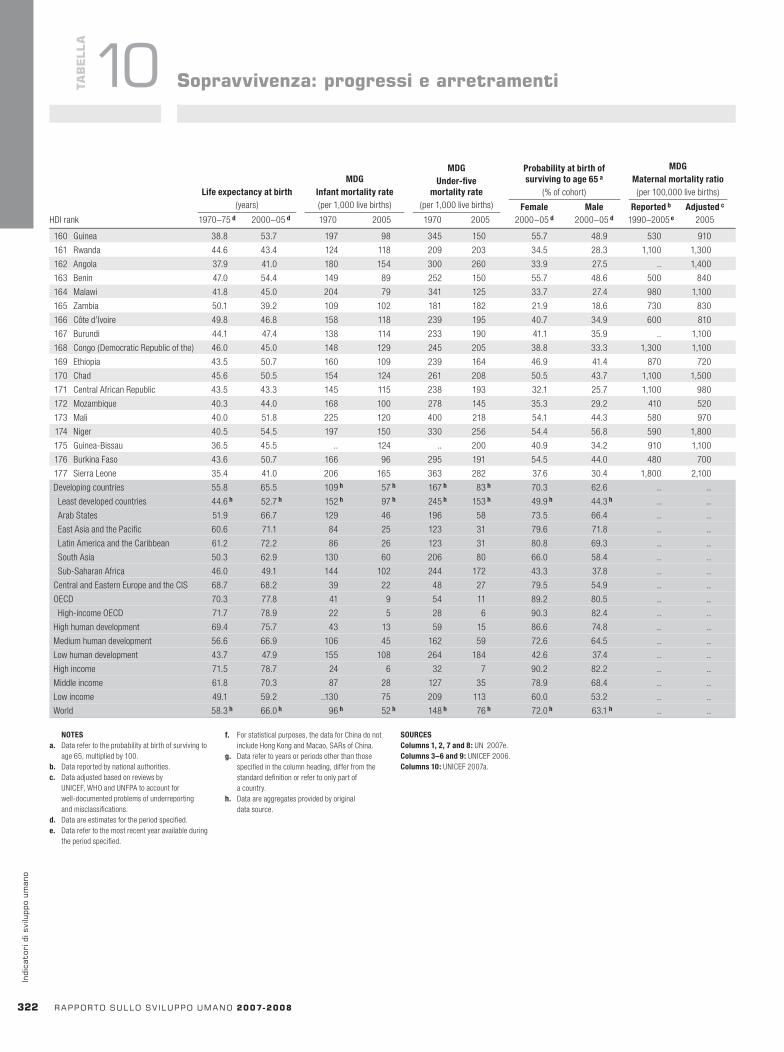
HDI rank
Lifeexpectancyatbirth(years)
MDGInfantmortalityrate(per 1,000 live births)
MDGUnder-five
mortalityrate(per 1,000 live births)
Probabilityatbirthofsurvivingtoage65a
(% of cohort)
MDGMaternalmortalityratio(per 100,000 live births)
Female Male Reportedb Adjustedc
1970–75d 2000–05d 1970 2005 1970 2005 2000–05d 2000–05d 1990–2005e 2005 HDI rank
PublicexpenditureoneducationCurrentpublicexpenditureoneducationbylevela
(% of total current public expenditure on education)
Asa%ofGDPAsa%oftotal
governmentexpenditurePre-primaryandprimary
Secondaryandpost-secondarynon-tertiary Tertiary
1991 2002–05b 1991 2002–05b 1991 2002–05b 1991 2002–05b 1991 2002–05b
322 rapportosullosv iluppoumano2007-2008
indi
cato
rid
isvi
lupp
oum
ano
NOTESa. Data refer to the probability at birth of surviving to
age 65, multiplied by 100.b. Data reported by national authorities.c. Data adjusted based on reviews by
UNICEF, WHO and UNFPA to account for well-documented problems of underreporting and misclassifications.
d. Data are estimates for the period specified.e. Data refer to the most recent year available during
the period specified.
f. For statistical purposes, the data for China do not include Hong Kong and Macao, SARs of China.
g. Data refer to years or periods other than those specified in the column heading, differ from the standard definition or refer to only part of a country.
h. Data are aggregates provided by original data source.
SOURCESColumns1,2,7and8: UN 2007e.Columns3–6and9: UNICEF 2006. Columns10: UNICEF 2007a.
TaB
ELLa
10 Sopravvivenza:progressiearretramenti
160 Guinea 38.8 53.7 197 98 345 150 55.7 48.9 530 910
161 Rwanda 44.6 43.4 124 118 209 203 34.5 28.3 1,100 1,300
162 Angola 37.9 41.0 180 154 300 260 33.9 27.5 .. 1,400
163 Benin 47.0 54.4 149 89 252 150 55.7 48.6 500 840
164 Malawi 41.8 45.0 204 79 341 125 33.7 27.4 980 1,100
165 Zambia 50.1 39.2 109 102 181 182 21.9 18.6 730 830
166 Côte d’Ivoire 49.8 46.8 158 118 239 195 40.7 34.9 600 810
167 Burundi 44.1 47.4 138 114 233 190 41.1 35.9 .. 1,100
168 Congo (Democratic Republic of the) 46.0 45.0 148 129 245 205 38.8 33.3 1,300 1,100
169 Ethiopia 43.5 50.7 160 109 239 164 46.9 41.4 870 720
170 Chad 45.6 50.5 154 124 261 208 50.5 43.7 1,100 1,500
171 Central African Republic 43.5 43.3 145 115 238 193 32.1 25.7 1,100 980
172 Mozambique 40.3 44.0 168 100 278 145 35.3 29.2 410 520
173 Mali 40.0 51.8 225 120 400 218 54.1 44.3 580 970
174 Niger 40.5 54.5 197 150 330 256 54.4 56.8 590 1,800
175 Guinea-Bissau 36.5 45.5 .. 124 .. 200 40.9 34.2 910 1,100
176 Burkina Faso 43.6 50.7 166 96 295 191 54.5 44.0 480 700
177 Sierra Leone 35.4 41.0 206 165 363 282 37.6 30.4 1,800 2,100
Developing countries 55.8 65.5 109h 57h 167h 83h 70.3 62.6 .. ..
Least developed countries 44.6h 52.7h 152h 97h 245h 153h 49.9h 44.3h .. ..
Arab States 51.9 66.7 129 46 196 58 73.5 66.4 .. ..
East Asia and the Pacific 60.6 71.1 84 25 123 31 79.6 71.8 .. ..
Latin America and the Caribbean 61.2 72.2 86 26 123 31 80.8 69.3 .. ..
South Asia 50.3 62.9 130 60 206 80 66.0 58.4 .. ..
Sub-Saharan Africa 46.0 49.1 144 102 244 172 43.3 37.8 .. ..
Central and Eastern Europe and the CIS 68.7 68.2 39 22 48 27 79.5 54.9 .. ..
OECD 70.3 77.8 41 9 54 11 89.2 80.5 .. ..
High-income OECD 71.7 78.9 22 5 28 6 90.3 82.4 .. ..
High human development 69.4 75.7 43 13 59 15 86.6 74.8 .. ..
Medium human development 56.6 66.9 106 45 162 59 72.6 64.5 .. ..
Low human development 43.7 47.9 155 108 264 184 42.6 37.4 .. ..
High income 71.5 78.7 24 6 32 7 90.2 82.2 .. ..
Middle income 61.8 70.3 87 28 127 35 78.9 68.4 .. ..
Low income 49.1 59.2 ..130 75 209 113 60.0 53.2 .. ..
World 58.3h 66.0h 96h 52h 148h 76h 72.0h 63.1h .. ..
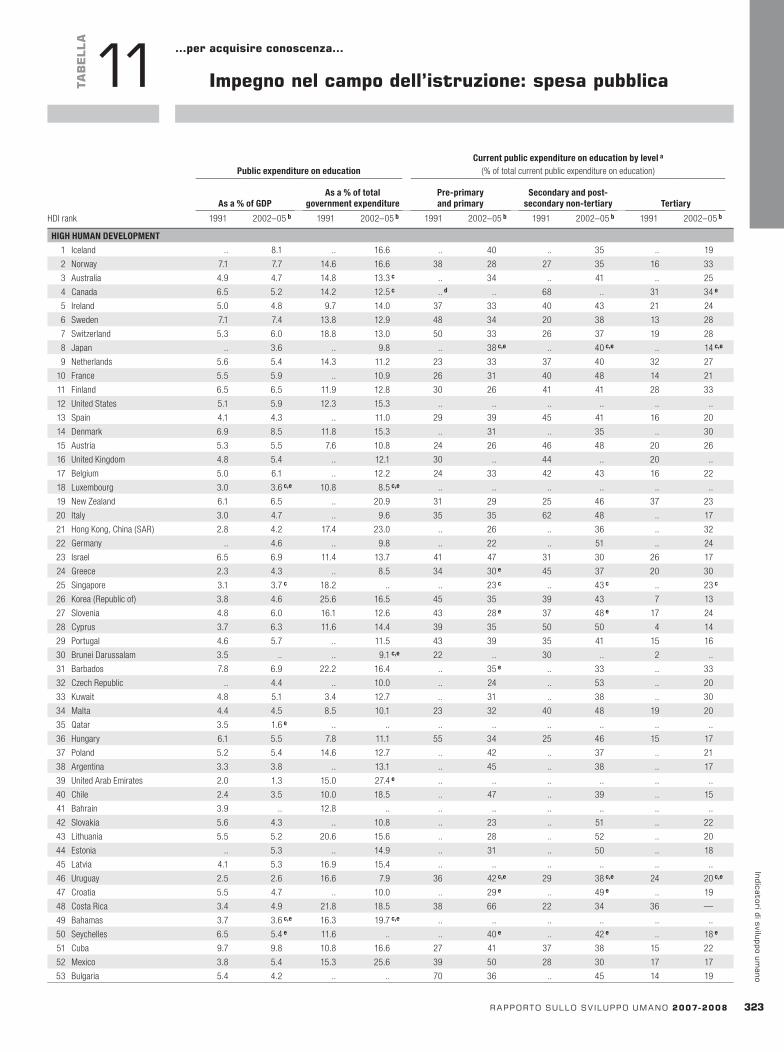
HDI rank
PublicexpenditureoneducationCurrentpublicexpenditureoneducationbylevela
(% of total current public expenditure on education)
Asa%ofGDPAsa%oftotal
governmentexpenditurePre-primaryandprimary
Secondaryandpost-secondarynon-tertiary Tertiary
1991 2002–05b 1991 2002–05b 1991 2002–05b 1991 2002–05b 1991 2002–05b
rapportosullosv iluppoumano2007-2008 323
indicatoridisviluppoumano
TaB
ELLa
11 Impegnonelcampodell’istruzione:spesapubblica
…peracquisireconoscenza…
HIGHHUMANDEVELOPMENT
1 Iceland .. 8.1 .. 16.6 .. 40 .. 35 .. 19
2 Norway 7.1 7.7 14.6 16.6 38 28 27 35 16 33
3 Australia 4.9 4.7 14.8 13.3c .. 34 .. 41 .. 25
4 Canada 6.5 5.2 14.2 12.5c ..d .. 68 .. 31 34e
5 Ireland 5.0 4.8 9.7 14.0 37 33 40 43 21 24
6 Sweden 7.1 7.4 13.8 12.9 48 34 20 38 13 28
7 Switzerland 5.3 6.0 18.8 13.0 50 33 26 37 19 28
8 Japan .. 3.6 .. 9.8 .. 38c,e .. 40c,e .. 14c,e
9 Netherlands 5.6 5.4 14.3 11.2 23 33 37 40 32 27
10 France 5.5 5.9 .. 10.9 26 31 40 48 14 21
11 Finland 6.5 6.5 11.9 12.8 30 26 41 41 28 33
12 United States 5.1 5.9 12.3 15.3 .. .. .. .. .. ..
13 Spain 4.1 4.3 .. 11.0 29 39 45 41 16 20
14 Denmark 6.9 8.5 11.8 15.3 .. 31 .. 35 .. 30
15 Austria 5.3 5.5 7.6 10.8 24 26 46 48 20 26
16 United Kingdom 4.8 5.4 .. 12.1 30 .. 44 .. 20 ..
17 Belgium 5.0 6.1 .. 12.2 24 33 42 43 16 22
18 Luxembourg 3.0 3.6c,e 10.8 8.5c,e .. .. .. .. .. ..
19 New Zealand 6.1 6.5 .. 20.9 31 29 25 46 37 23
20 Italy 3.0 4.7 .. 9.6 35 35 62 48 .. 17
21 Hong Kong, China (SAR) 2.8 4.2 17.4 23.0 .. 26 .. 36 .. 32
22 Germany .. 4.6 .. 9.8 .. 22 .. 51 .. 24
23 Israel 6.5 6.9 11.4 13.7 41 47 31 30 26 17
24 Greece 2.3 4.3 .. 8.5 34 30e 45 37 20 30
25 Singapore 3.1 3.7c 18.2 .. .. 23c .. 43c .. 23c
26 Korea (Republic of) 3.8 4.6 25.6 16.5 45 35 39 43 7 13
27 Slovenia 4.8 6.0 16.1 12.6 43 28e 37 48e 17 24
28 Cyprus 3.7 6.3 11.6 14.4 39 35 50 50 4 14
29 Portugal 4.6 5.7 .. 11.5 43 39 35 41 15 16
30 Brunei Darussalam 3.5 .. .. 9.1c,e 22 .. 30 .. 2 ..
31 Barbados 7.8 6.9 22.2 16.4 .. 35e .. 33 .. 33
32 Czech Republic .. 4.4 .. 10.0 .. 24 .. 53 .. 20
33 Kuwait 4.8 5.1 3.4 12.7 .. 31 .. 38 .. 30
34 Malta 4.4 4.5 8.5 10.1 23 32 40 48 19 20
35 Qatar 3.5 1.6e .. .. .. .. .. .. .. ..
36 Hungary 6.1 5.5 7.8 11.1 55 34 25 46 15 17
37 Poland 5.2 5.4 14.6 12.7 .. 42 .. 37 .. 21
38 Argentina 3.3 3.8 .. 13.1 .. 45 .. 38 .. 17
39 United Arab Emirates 2.0 1.3 15.0 27.4e .. .. .. .. .. ..
40 Chile 2.4 3.5 10.0 18.5 .. 47 .. 39 .. 15
41 Bahrain 3.9 .. 12.8 .. .. .. .. .. .. ..
42 Slovakia 5.6 4.3 .. 10.8 .. 23 .. 51 .. 22
43 Lithuania 5.5 5.2 20.6 15.6 .. 28 .. 52 .. 20
44 Estonia .. 5.3 .. 14.9 .. 31 .. 50 .. 18
45 Latvia 4.1 5.3 16.9 15.4 .. .. .. .. .. ..
46 Uruguay 2.5 2.6 16.6 7.9 36 42c,e 29 38c,e 24 20c,e
47 Croatia 5.5 4.7 .. 10.0 .. 29e .. 49e .. 19
48 Costa Rica 3.4 4.9 21.8 18.5 38 66 22 34 36 —
49 Bahamas 3.7 3.6c,e 16.3 19.7c,e .. .. .. .. .. ..
50 Seychelles 6.5 5.4e 11.6 .. .. 40e .. 42e .. 18e
51 Cuba 9.7 9.8 10.8 16.6 27 41 37 38 15 22
52 Mexico 3.8 5.4 15.3 25.6 39 50 28 30 17 17
53 Bulgaria 5.4 4.2 .. .. 70 36 .. 45 14 19
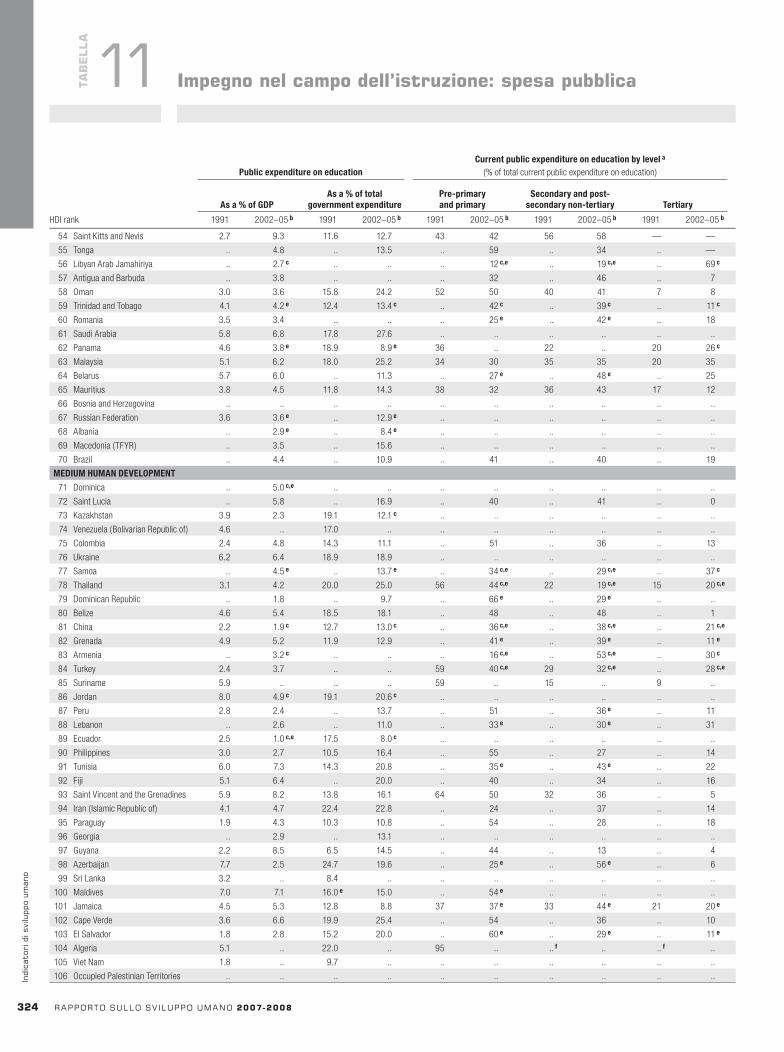
HDI rank
PublicexpenditureoneducationCurrentpublicexpenditureoneducationbylevela
(% of total current public expenditure on education)
Asa%ofGDPAsa%oftotal
governmentexpenditurePre-primaryandprimary
Secondaryandpost-secondarynon-tertiary Tertiary
1991 2002–05b 1991 2002–05b 1991 2002–05b 1991 2002–05b 1991 2002–05b HDI rank
PublicexpenditureoneducationCurrentpublicexpenditureoneducationbylevela
(% of total current public expenditure on education)
Asa%ofGDPAsa%oftotal
governmentexpenditurePre-primaryandprimary
Secondaryandpost-secondarynon-tertiary Tertiary
1991 2002–05b 1991 2002–05b 1991 2002–05b 1991 2002–05b 1991 2002–05b
324 rapportosullosv iluppoumano2007-2008
indi
cato
rid
isvi
lupp
oum
ano
TaB
ELLa
11 Impegnonelcampodell’istruzione:spesapubblica
54 Saint Kitts and Nevis 2.7 9.3 11.6 12.7 43 42 56 58 — —
55 Tonga .. 4.8 .. 13.5 .. 59 .. 34 .. —
56 Libyan Arab Jamahiriya .. 2.7c .. .. .. 12c,e .. 19c,e .. 69c
57 Antigua and Barbuda .. 3.8 .. .. .. 32 .. 46 .. 7
58 Oman 3.0 3.6 15.8 24.2 52 50 40 41 7 8
59 Trinidad and Tobago 4.1 4.2e 12.4 13.4c .. 42c .. 39c .. 11c
60 Romania 3.5 3.4 .. .. .. 25e .. 42e .. 18
61 Saudi Arabia 5.8 6.8 17.8 27.6 .. .. .. .. .. ..
62 Panama 4.6 3.8e 18.9 8.9e 36 .. 22 .. 20 26c
63 Malaysia 5.1 6.2 18.0 25.2 34 30 35 35 20 35
64 Belarus 5.7 6.0 .. 11.3 .. 27e .. 48e .. 25
65 Mauritius 3.8 4.5 11.8 14.3 38 32 36 43 17 12
66 Bosnia and Herzegovina .. .. .. .. .. .. .. .. .. ..
67 Russian Federation 3.6 3.6e .. 12.9e .. .. .. .. .. ..
68 Albania .. 2.9e .. 8.4e .. .. .. .. .. ..
69 Macedonia (TFYR) .. 3.5 .. 15.6 .. .. .. .. .. ..
70 Brazil .. 4.4 .. 10.9 .. 41 .. 40 .. 19
MEDIUMHUMANDEVELOPMENT
71 Dominica .. 5.0c,e .. .. .. .. .. .. .. ..
72 Saint Lucia .. 5.8 .. 16.9 .. 40 .. 41 .. 0
73 Kazakhstan 3.9 2.3 19.1 12.1c .. .. .. .. .. ..
74 Venezuela (Bolivarian Republic of) 4.6 .. 17.0 .. .. .. .. .. .. ..
75 Colombia 2.4 4.8 14.3 11.1 .. 51 .. 36 .. 13
76 Ukraine 6.2 6.4 18.9 18.9 .. .. .. .. .. ..
77 Samoa .. 4.5e .. 13.7e .. 34c,e .. 29c,e .. 37c
78 Thailand 3.1 4.2 20.0 25.0 56 44c,e 22 19c,e 15 20c,e
79 Dominican Republic .. 1.8 .. 9.7 .. 66e .. 29e .. ..
80 Belize 4.6 5.4 18.5 18.1 .. 48 .. 48 .. 1
81 China 2.2 1.9c 12.7 13.0c .. 36c,e .. 38c,e .. 21c,e
82 Grenada 4.9 5.2 11.9 12.9 .. 41e .. 39e .. 11e
83 Armenia .. 3.2c .. .. .. 16c,e .. 53c,e .. 30c
84 Turkey 2.4 3.7 .. .. 59 40c,e 29 32c,e .. 28c,e
85 Suriname 5.9 .. .. .. 59 .. 15 .. 9 ..
86 Jordan 8.0 4.9c 19.1 20.6c .. .. .. .. .. ..
87 Peru 2.8 2.4 .. 13.7 .. 51 .. 36e .. 11
88 Lebanon .. 2.6 .. 11.0 .. 33e .. 30e .. 31
89 Ecuador 2.5 1.0c,e 17.5 8.0c .. .. .. .. .. ..
90 Philippines 3.0 2.7 10.5 16.4 .. 55 .. 27 .. 14
91 Tunisia 6.0 7.3 14.3 20.8 .. 35e .. 43e .. 22
92 Fiji 5.1 6.4 .. 20.0 .. 40 .. 34 .. 16
93 Saint Vincent and the Grenadines 5.9 8.2 13.8 16.1 64 50 32 36 .. 5
94 Iran ( Islamic Republic of) 4.1 4.7 22.4 22.8 .. 24 .. 37 .. 14
95 Paraguay 1.9 4.3 10.3 10.8 .. 54 .. 28 .. 18
96 Georgia .. 2.9 .. 13.1 .. .. .. .. .. ..
97 Guyana 2.2 8.5 6.5 14.5 .. 44 .. 13 .. 4
98 Azerbaijan 7.7 2.5 24.7 19.6 .. 25e .. 56e .. 6
99 Sri Lanka 3.2 .. 8.4 .. .. .. .. .. .. ..
100 Maldives 7.0 7.1 16.0e 15.0 .. 54e .. .. .. ..
101 Jamaica 4.5 5.3 12.8 8.8 37 37e 33 44e 21 20e
102 Cape Verde 3.6 6.6 19.9 25.4 .. 54 .. 36 .. 10
103 El Salvador 1.8 2.8 15.2 20.0 .. 60e .. 29e .. 11e
104 Algeria 5.1 .. 22.0 .. 95 .. ..f .. ..f ..
105 Viet Nam 1.8 .. 9.7 .. .. .. .. .. .. ..
106 Occupied Palestinian Territories .. .. .. .. .. .. .. .. .. ..
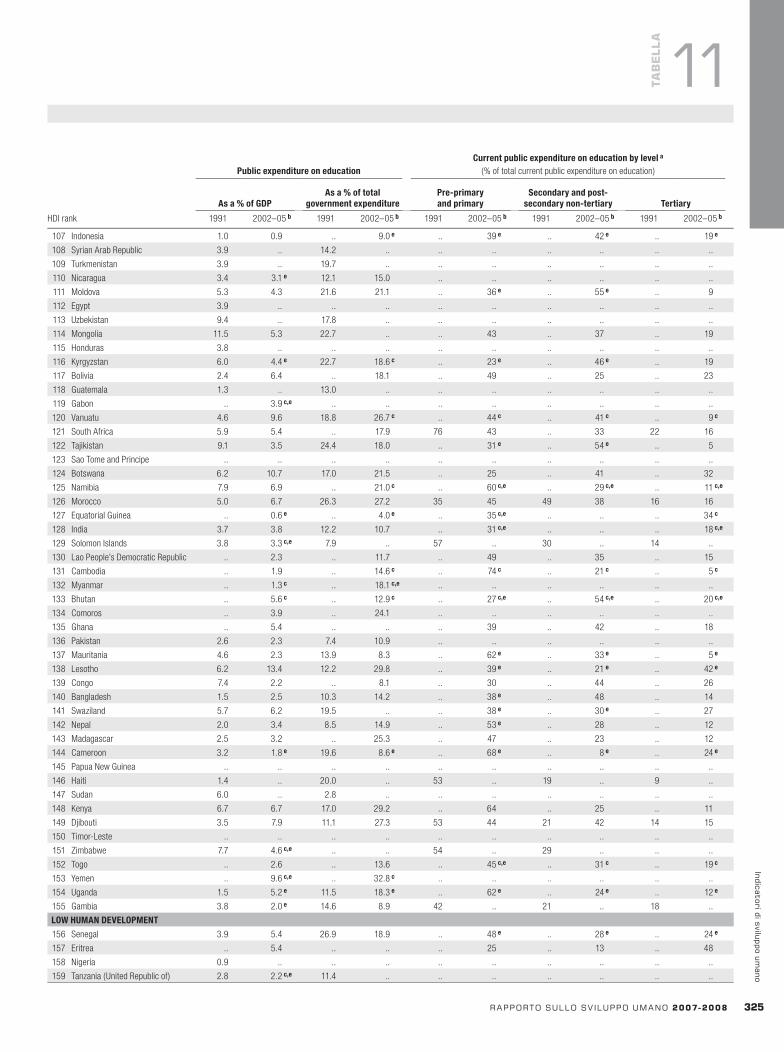
HDI rank
PublicexpenditureoneducationCurrentpublicexpenditureoneducationbylevela
(% of total current public expenditure on education)
Asa%ofGDPAsa%oftotal
governmentexpenditurePre-primaryandprimary
Secondaryandpost-secondarynon-tertiary Tertiary
1991 2002–05b 1991 2002–05b 1991 2002–05b 1991 2002–05b 1991 2002–05b
rapportosullosv iluppoumano2007-2008 32�
indicatoridisviluppoumano
TaB
ELLa
11
107 Indonesia 1.0 0.9 .. 9.0e .. 39e .. 42e .. 19e
108 Syrian Arab Republic 3.9 .. 14.2 .. .. .. .. .. .. ..
109 Turkmenistan 3.9 .. 19.7 .. .. .. .. .. .. ..
110 Nicaragua 3.4 3.1e 12.1 15.0 .. .. .. .. .. ..
111 Moldova 5.3 4.3 21.6 21.1 .. 36e .. 55e .. 9
112 Egypt 3.9 .. .. .. .. .. .. .. .. ..
113 Uzbekistan 9.4 .. 17.8 .. .. .. .. .. .. ..
114 Mongolia 11.5 5.3 22.7 .. .. 43 .. 37 .. 19
115 Honduras 3.8 .. .. .. .. .. .. .. .. ..
116 Kyrgyzstan 6.0 4.4e 22.7 18.6c .. 23e .. 46e .. 19
117 Bolivia 2.4 6.4 .. 18.1 .. 49 .. 25 .. 23
118 Guatemala 1.3 .. 13.0 .. .. .. .. .. .. ..
119 Gabon .. 3.9c,e .. .. .. .. .. .. .. ..
120 Vanuatu 4.6 9.6 18.8 26.7c .. 44c .. 41c .. 9c
121 South Africa 5.9 5.4 .. 17.9 76 43 .. 33 22 16
122 Tajikistan 9.1 3.5 24.4 18.0 .. 31e .. 54e .. 5
123 Sao Tome and Principe .. .. .. .. .. .. .. .. .. ..
124 Botswana 6.2 10.7 17.0 21.5 .. 25 .. 41 .. 32
125 Namibia 7.9 6.9 .. 21.0c .. 60c,e .. 29c,e .. 11c,e
126 Morocco 5.0 6.7 26.3 27.2 35 45 49 38 16 16
127 Equatorial Guinea .. 0.6e .. 4.0e .. 35c,e .. .. .. 34c
128 India 3.7 3.8 12.2 10.7 .. 31c,e .. .. .. 18c,e
129 Solomon Islands 3.8 3.3c,e 7.9 .. 57 .. 30 .. 14 ..
130 Lao People’s Democratic Republic .. 2.3 .. 11.7 .. 49 .. 35 .. 15
131 Cambodia .. 1.9 .. 14.6c .. 74c .. 21c .. 5c
132 Myanmar .. 1.3c .. 18.1c,e .. .. .. .. .. ..
133 Bhutan .. 5.6c .. 12.9c .. 27c,e .. 54c,e .. 20c,e
134 Comoros .. 3.9 .. 24.1 .. .. .. .. .. ..
135 Ghana .. 5.4 .. .. .. 39 .. 42 .. 18
136 Pakistan 2.6 2.3 7.4 10.9 .. .. .. .. .. ..
137 Mauritania 4.6 2.3 13.9 8.3 .. 62e .. 33e .. 5e
138 Lesotho 6.2 13.4 12.2 29.8 .. 39e .. 21e .. 42e
139 Congo 7.4 2.2 .. 8.1 .. 30 .. 44 .. 26
140 Bangladesh 1.5 2.5 10.3 14.2 .. 38e .. 48 .. 14
141 Swaziland 5.7 6.2 19.5 .. .. 38e .. 30e .. 27
142 Nepal 2.0 3.4 8.5 14.9 .. 53e .. 28 .. 12
143 Madagascar 2.5 3.2 .. 25.3 .. 47 .. 23 .. 12
144 Cameroon 3.2 1.8e 19.6 8.6e .. 68e .. 8e .. 24e
145 Papua New Guinea .. .. .. .. .. .. .. .. .. ..
146 Haiti 1.4 .. 20.0 .. 53 .. 19 .. 9 ..
147 Sudan 6.0 .. 2.8 .. .. .. .. .. .. ..
148 Kenya 6.7 6.7 17.0 29.2 .. 64 .. 25 .. 11
149 Djibouti 3.5 7.9 11.1 27.3 53 44 21 42 14 15
150 Timor-Leste .. .. .. .. .. .. .. .. .. ..
151 Zimbabwe 7.7 4.6c,e .. .. 54 .. 29 .. .. ..
152 Togo .. 2.6 .. 13.6 .. 45c,e .. 31c .. 19c
153 Yemen .. 9.6c,e .. 32.8c .. .. .. .. .. ..
154 Uganda 1.5 5.2e 11.5 18.3e .. 62e .. 24e .. 12e
155 Gambia 3.8 2.0e 14.6 8.9 42 .. 21 .. 18 ..
LOWHUMANDEVELOPMENT
156 Senegal 3.9 5.4 26.9 18.9 .. 48e .. 28e .. 24e
157 Eritrea .. 5.4 .. .. .. 25 .. 13 .. 48
158 Nigeria 0.9 .. .. .. .. .. .. .. .. ..
159 Tanzania (United Republic of) 2.8 2.2c,e 11.4 .. .. .. .. .. .. ..
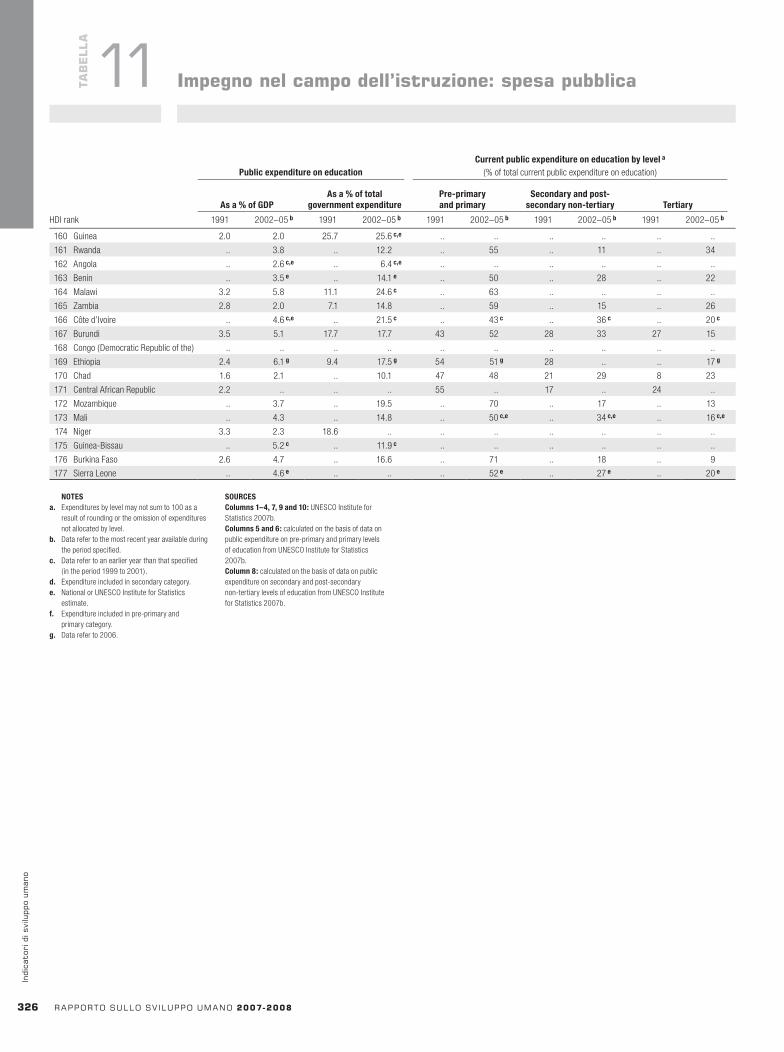
HDI rank
PublicexpenditureoneducationCurrentpublicexpenditureoneducationbylevela
(% of total current public expenditure on education)
Asa%ofGDPAsa%oftotal
governmentexpenditurePre-primaryandprimary
Secondaryandpost-secondarynon-tertiary Tertiary
1991 2002–05b 1991 2002–05b 1991 2002–05b 1991 2002–05b 1991 2002–05b HDI rank
Adultliteracyrate(% aged 15 and older)
MDGYouthliteracyrate
(% aged 15–24)
MDGNetprimary
enrolmentrate(%)
Netsecondaryenrolmentratea
(%)
MDGChildrenreaching
grade5
(% of grade 1 students)
Tertiarystudentsinscience,engineering,
manufacturingandconstruction
(% of tertiary students)1985–1994b
1995–2005c
1985–1994b
1995–2005c 1991 2005 1991 2005 1991 2004 1999–2005d
32� rapportosullosv iluppoumano2007-2008
indi
cato
rid
isvi
lupp
oum
ano
NOTESa. Expenditures by level may not sum to 100 as a
result of rounding or the omission of expenditures not allocated by level.
b. Data refer to the most recent year available during the period specified.
c. Data refer to an earlier year than that specified (in the period 1999 to 2001).
d. Expenditure included in secondary category.e. National or UNESCO Institute for Statistics
estimate.f. Expenditure included in pre-primary and
primary category.g. Data refer to 2006.
SOURCESColumns1–4,7,9and10: UNESCO Institute for Statistics 2007b.Columns5and6: calculated on the basis of data on public expenditure on pre-primary and primary levels of education from UNESCO Institute for Statistics 2007b.Column8: calculated on the basis of data on public expenditure on secondary and post-secondary non-tertiary levels of education from UNESCO Institute for Statistics 2007b.
TaB
ELLa
11 Impegnonelcampodell’istruzione:spesapubblica
160 Guinea 2.0 2.0 25.7 25.6c,e .. .. .. .. .. ..
161 Rwanda .. 3.8 .. 12.2 .. 55 .. 11 .. 34
162 Angola .. 2.6c,e .. 6.4c,e .. .. .. .. .. ..
163 Benin .. 3.5e .. 14.1e .. 50 .. 28 .. 22
164 Malawi 3.2 5.8 11.1 24.6c .. 63 .. .. .. ..
165 Zambia 2.8 2.0 7.1 14.8 .. 59 .. 15 .. 26
166 Côte d’Ivoire .. 4.6c,e .. 21.5c .. 43c .. 36c .. 20c
167 Burundi 3.5 5.1 17.7 17.7 43 52 28 33 27 15
168 Congo (Democratic Republic of the) .. .. .. .. .. .. .. .. .. ..
169 Ethiopia 2.4 6.1g 9.4 17.5g 54 51g 28 .. .. 17g
170 Chad 1.6 2.1 .. 10.1 47 48 21 29 8 23
171 Central African Republic 2.2 .. .. .. 55 .. 17 .. 24 ..
172 Mozambique .. 3.7 .. 19.5 .. 70 .. 17 .. 13
173 Mali .. 4.3 .. 14.8 .. 50c,e .. 34c,e .. 16c,e
174 Niger 3.3 2.3 18.6 .. .. .. .. .. .. ..
175 Guinea-Bissau .. 5.2c .. 11.9c .. .. .. .. .. ..
176 Burkina Faso 2.6 4.7 .. 16.6 .. 71 .. 18 .. 9
177 Sierra Leone .. 4.6e .. .. .. 52e .. 27e .. 20e
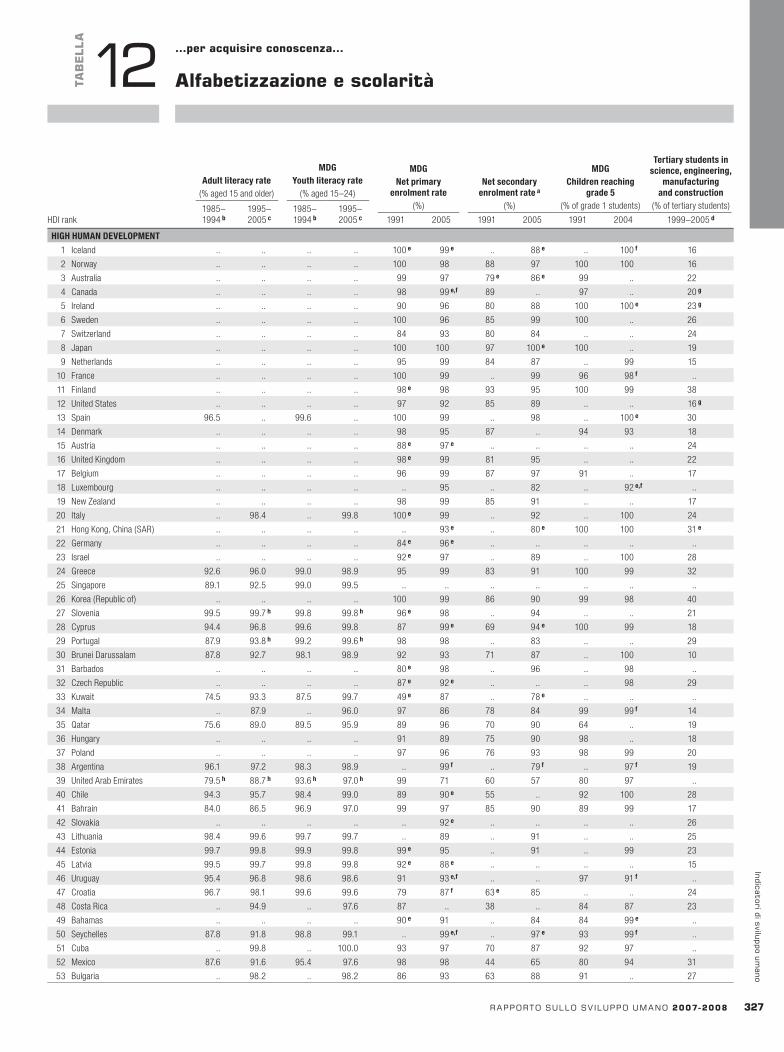
HDI rank
Adultliteracyrate(% aged 15 and older)
MDGYouthliteracyrate
(% aged 15–24)
MDGNetprimary
enrolmentrate(%)
Netsecondaryenrolmentratea
(%)
MDGChildrenreaching
grade5
(% of grade 1 students)
Tertiarystudentsinscience,engineering,
manufacturingandconstruction
(% of tertiary students)1985–1994b
1995–2005c
1985–1994b
1995–2005c 1991 2005 1991 2005 1991 2004 1999–2005d
rapportosullosv iluppoumano2007-2008 327
indicatoridisviluppoumano
TaB
ELLa
12 …peracquisireconoscenza…
alfabetizzazioneescolarità
HIGHHUMANDEVELOPMENT
1 Iceland .. .. .. .. 100e 99e .. 88e .. 100f 16
2 Norway .. .. .. .. 100 98 88 97 100 100 16
3 Australia .. .. .. .. 99 97 79e 86e 99 .. 22
4 Canada .. .. .. .. 98 99e,f 89 .. 97 .. 20g
5 Ireland .. .. .. .. 90 96 80 88 100 100e 23g
6 Sweden .. .. .. .. 100 96 85 99 100 .. 26
7 Switzerland .. .. .. .. 84 93 80 84 .. .. 24
8 Japan .. .. .. .. 100 100 97 100e 100 .. 19
9 Netherlands .. .. .. .. 95 99 84 87 .. 99 15
10 France .. .. .. .. 100 99 .. 99 96 98f ..
11 Finland .. .. .. .. 98e 98 93 95 100 99 38
12 United States .. .. .. .. 97 92 85 89 .. .. 16g
13 Spain 96.5 .. 99.6 .. 100 99 .. 98 .. 100e 30
14 Denmark .. .. .. .. 98 95 87 .. 94 93 18
15 Austria .. .. .. .. 88e 97e .. .. .. .. 24
16 United Kingdom .. .. .. .. 98e 99 81 95 .. .. 22
17 Belgium .. .. .. .. 96 99 87 97 91 .. 17
18 Luxembourg .. .. .. .. .. 95 .. 82 .. 92e,f ..
19 New Zealand .. .. .. .. 98 99 85 91 .. .. 17
20 Italy .. 98.4 .. 99.8 100e 99 .. 92 .. 100 24
21 Hong Kong, China (SAR) .. .. .. .. .. 93e .. 80e 100 100 31e
22 Germany .. .. .. .. 84e 96e .. .. .. .. ..
23 Israel .. .. .. .. 92e 97 .. 89 .. 100 28
24 Greece 92.6 96.0 99.0 98.9 95 99 83 91 100 99 32
25 Singapore 89.1 92.5 99.0 99.5 .. .. .. .. .. .. ..
26 Korea (Republic of) .. .. .. .. 100 99 86 90 99 98 40
27 Slovenia 99.5 99.7h 99.8 99.8h 96e 98 .. 94 .. .. 21
28 Cyprus 94.4 96.8 99.6 99.8 87 99e 69 94e 100 99 18
29 Portugal 87.9 93.8h 99.2 99.6h 98 98 .. 83 .. .. 29
30 Brunei Darussalam 87.8 92.7 98.1 98.9 92 93 71 87 .. 100 10
31 Barbados .. .. .. .. 80e 98 .. 96 .. 98 ..
32 Czech Republic .. .. .. .. 87e 92e .. .. .. 98 29
33 Kuwait 74.5 93.3 87.5 99.7 49e 87 .. 78e .. .. ..
34 Malta .. 87.9 .. 96.0 97 86 78 84 99 99f 14
35 Qatar 75.6 89.0 89.5 95.9 89 96 70 90 64 .. 19
36 Hungary .. .. .. .. 91 89 75 90 98 .. 18
37 Poland .. .. .. .. 97 96 76 93 98 99 20
38 Argentina 96.1 97.2 98.3 98.9 .. 99f .. 79f .. 97f 19
39 United Arab Emirates 79.5h 88.7h 93.6h 97.0h 99 71 60 57 80 97 ..
40 Chile 94.3 95.7 98.4 99.0 89 90e 55 .. 92 100 28
41 Bahrain 84.0 86.5 96.9 97.0 99 97 85 90 89 99 17
42 Slovakia .. .. .. .. .. 92e .. .. .. .. 26
43 Lithuania 98.4 99.6 99.7 99.7 .. 89 .. 91 .. .. 25
44 Estonia 99.7 99.8 99.9 99.8 99e 95 .. 91 .. 99 23
45 Latvia 99.5 99.7 99.8 99.8 92e 88e .. .. .. .. 15
46 Uruguay 95.4 96.8 98.6 98.6 91 93e,f .. .. 97 91f ..
47 Croatia 96.7 98.1 99.6 99.6 79 87f 63e 85 .. .. 24
48 Costa Rica .. 94.9 .. 97.6 87 .. 38 .. 84 87 23
49 Bahamas .. .. .. .. 90e 91 .. 84 84 99e ..
50 Seychelles 87.8 91.8 98.8 99.1 .. 99e,f .. 97e 93 99f ..
51 Cuba .. 99.8 .. 100.0 93 97 70 87 92 97 ..
52 Mexico 87.6 91.6 95.4 97.6 98 98 44 65 80 94 31
53 Bulgaria .. 98.2 .. 98.2 86 93 63 88 91 .. 27

HDI rank
Adultliteracyrate(% aged 15 and older)
MDGYouthliteracyrate
(% aged 15–24)
MDGNetprimary
enrolmentrate(%)
Netsecondaryenrolmentratea
(%)
MDGChildrenreaching
grade5
(% of grade 1 students)
Tertiarystudentsinscience,engineering,
manufacturingandconstruction
(% of tertiary students)1985–1994b
1995–2005c
1985–1994b
1995–2005c 1991 2005 1991 2005 1991 2004 1999–2005d HDI rank
Adultliteracyrate(% aged 15 and older)
MDGYouthliteracyrate
(% aged 15–24)
MDGNetprimary
enrolmentrate(%)
Netsecondaryenrolmentratea
(%)
MDGChildrenreaching
grade5
(% of grade 1 students)
Tertiarystudentsinscience,engineering,
manufacturingandconstruction
(% of tertiary students)1985–1994b
1995–2005c
1985–1994b
1995–2005c 1991 2005 1991 2005 1991 2004 1999–2005d
328 rapportosullosv iluppoumano2007-2008
indi
cato
rid
isvi
lupp
oum
ano
TaB
ELLa
12 alfabetizzazioneescolarità
54 Saint Kitts and Nevis .. .. .. .. .. 93e .. 86e .. 87f ..
55 Tonga .. 98.9 .. 99.3 .. 95e .. 68e,f .. 89e ..
56 Libyan Arab Jamahiriya 74.7h 84.2h 94.9h 98.0h 96e .. .. .. .. .. 31
57 Antigua and Barbuda .. .. .. .. .. .. .. .. .. .. ..
58 Oman .. 81.4 .. 97.3 69 76 .. 75 97 98 20e,g
59 Trinidad and Tobago 97.1h 98.4h 99.3h 99.5h 91 90e .. 69e .. 91e 36
60 Romania 96.7 97.3 99.1 97.8 81e 93 .. 80 .. .. 25g
61 Saudi Arabia 70.8 82.9 87.9 95.8 59 78 31 66 83 96 17
62 Panama 88.8 91.9 95.1 96.1 .. 98 .. 64 .. 85 20g
63 Malaysia 82.9 88.7 95.6 97.2 .. 95f .. 76f 97 98f 40
64 Belarus 97.9 99.6 99.8 99.8 86e 89 .. 89 .. .. 27
65 Mauritius 79.9 84.3 91.2 94.5 91 95 .. 82e 97 97 26
66 Bosnia and Herzegovina .. 96.7 .. 99.8 .. .. .. .. .. .. ..
67 Russian Federation 98.0 99.4 99.7 99.7 99e 92e .. .. .. .. ..
68 Albania .. 98.7 .. 99.4 95e 94f .. 74e,f .. .. 12
69 Macedonia (TFYR) 94.1 96.1 98.9 98.7 94 92 .. 82 .. .. 26
70 Brazil .. 88.6 .. 96.8 85 95f 17 78f 73 .. 16
MEDIUMHUMANDEVELOPMENT
71 Dominica .. .. .. .. .. 84e .. .. 75 93 ..
72 Saint Lucia .. .. .. .. 95e 97 .. 68e 96 96 ..
73 Kazakhstan 97.5 99.5 99.7 99.8 89e 91 .. 92 .. .. ..
74 Venezuela (Bolivarian Republic of) 89.8 93.0 95.4 97.2 87 91 18 63 86 91 ..
75 Colombia 81.4 92.8 90.5 98.0 69 87 34 55e 76 81 33
76 Ukraine .. 99.4 .. 99.8 80e 83 .. 79 .. .. 27
77 Samoa 98.1h 98.6h 99.1h 99.3h .. 90e,f .. 66e,f .. 94f 14
78 Thailand .. 92.6 .. 98.0 76e 88i .. 64i .. .. ..
79 Dominican Republic .. 87.0 .. 94.2 57e 88 .. 53 .. 86 ..
80 Belize 70.3 .. 76.4 .. 94e 94 31 71e 67 91f 9g
81 China 77.8 90.9 94.3 98.9 97 .. .. .. 86 .. ..
82 Grenada .. .. .. .. .. 84e .. 79e .. 79f ..
83 Armenia 98.8 99.4 99.9 99.8 .. 79 .. 84 .. .. 7g
84 Turkey 79.2 87.4 92.5 95.6 89 89 42 67e 98 97 21g
85 Suriname .. 89.6 .. 94.9 81e 94 .. 75e .. .. 19
86 Jordan .. 91.1 .. 99.0 94 89 .. 79 .. 96 22
87 Peru 87.2 87.9 95.4 97.1 .. 96 .. 70 .. 90 ..
88 Lebanon .. .. .. .. 73e 92 .. .. .. 93 24
89 Ecuador 88.3 91.0 96.2 96.4 98e 98e,f .. 52f .. 76e,f ..
90 Philippines 93.6 92.6 96.6 95.1 96e 94 .. 61 .. 75 27g
91 Tunisia .. 74.3 .. 94.3 94 97 .. 65e 86 97 31g
92 Fiji .. .. .. .. .. 96e .. 83e 87 99f ..
93 Saint Vincent and the Grenadines .. .. .. .. .. 90 .. 64e .. 88e,f ..
94 Iran ( Islamic Republic of) 65.5 82.4 87.0 97.4 92e 95 .. 77 90 88f 40
95 Paraguay 90.3 93.5h 95.6 95.9h 94 88f 26 .. 74 81f ..
96 Georgia .. .. .. .. 97e 93f .. 81f .. .. 23
97 Guyana .. .. .. .. 89 .. 67 .. .. 64e,f 14
98 Azerbaijan .. 98.8 .. 99.9 89 85 .. 78 .. .. ..
99 Sri Lanka .. 90.7j .. 95.6j . 97e,f .. .. 92 .. ..
100 Maldives 96.0 96.3 98.2 98.2 .. 79 .. 63e .. 92 ..
101 Jamaica .. 79.9k .. ..k 96 90e 64 78e .. 90f ..
102 Cape Verde 62.8 81.2h 88.2 96.3h 91e 90 .. 58 .. 93 ..
103 El Salvador 74.1 80.6h 84.9 88.5h .. 93 .. 53e 58 69e 23
104 Algeria 49.6 69.9 74.3 90.1 89 97 53 66e,f 95 96 18g
105 Viet Nam 87.6 90.3 93.7 93.9 90e 88 .. 69e .. 87e,f 20
106 Occupied Palestinian Territories .. 92.4 .. 99.0 .. 80 .. 95 .. .. 18
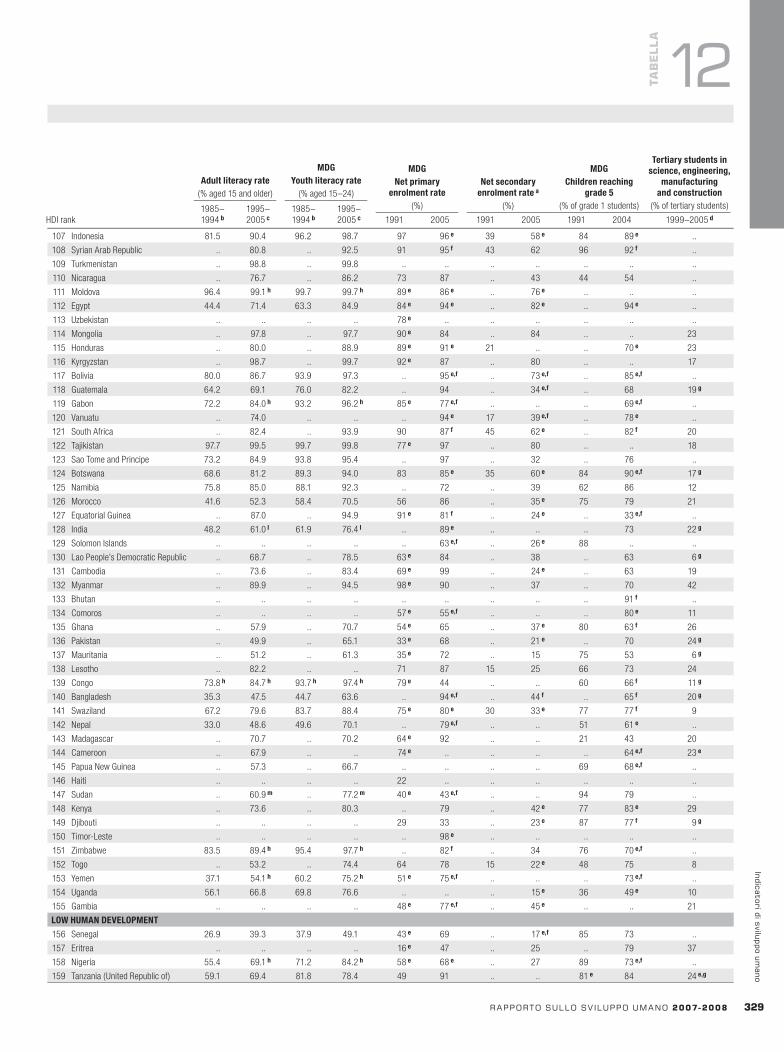
HDI rank
Adultliteracyrate(% aged 15 and older)
MDGYouthliteracyrate
(% aged 15–24)
MDGNetprimary
enrolmentrate(%)
Netsecondaryenrolmentratea
(%)
MDGChildrenreaching
grade5
(% of grade 1 students)
Tertiarystudentsinscience,engineering,
manufacturingandconstruction
(% of tertiary students)1985–1994b
1995–2005c
1985–1994b
1995–2005c 1991 2005 1991 2005 1991 2004 1999–2005d
rapportosullosv iluppoumano2007-2008 32�
indicatoridisviluppoumano
TaB
ELLa
12
107 Indonesia 81.5 90.4 96.2 98.7 97 96e 39 58e 84 89e ..
108 Syrian Arab Republic .. 80.8 .. 92.5 91 95f 43 62 96 92f ..
109 Turkmenistan .. 98.8 .. 99.8 .. .. .. .. .. .. ..
110 Nicaragua .. 76.7 .. 86.2 73 87 .. 43 44 54 ..
111 Moldova 96.4 99.1h 99.7 99.7h 89e 86e .. 76e .. .. ..
112 Egypt 44.4 71.4 63.3 84.9 84e 94e .. 82e .. 94e ..
113 Uzbekistan .. .. .. .. 78e .. .. .. .. .. ..
114 Mongolia .. 97.8 .. 97.7 90e 84 .. 84 .. .. 23
115 Honduras .. 80.0 .. 88.9 89e 91e 21 .. .. 70e 23
116 Kyrgyzstan .. 98.7 .. 99.7 92e 87 .. 80 .. .. 17
117 Bolivia 80.0 86.7 93.9 97.3 .. 95e,f .. 73e,f .. 85e,f ..
118 Guatemala 64.2 69.1 76.0 82.2 .. 94 .. 34e,f .. 68 19g
119 Gabon 72.2 84.0h 93.2 96.2h 85e 77e,f .. .. .. 69e,f ..
120 Vanuatu .. 74.0 .. .. .. 94e 17 39e,f .. 78e ..
121 South Africa .. 82.4 .. 93.9 90 87f 45 62e .. 82f 20
122 Tajikistan 97.7 99.5 99.7 99.8 77e 97 .. 80 .. .. 18
123 Sao Tome and Principe 73.2 84.9 93.8 95.4 .. 97 .. 32 .. 76 ..
124 Botswana 68.6 81.2 89.3 94.0 83 85e 35 60e 84 90e,f 17g
125 Namibia 75.8 85.0 88.1 92.3 .. 72 .. 39 62 86 12
126 Morocco 41.6 52.3 58.4 70.5 56 86 .. 35e 75 79 21
127 Equatorial Guinea .. 87.0 .. 94.9 91e 81f .. 24e .. 33e,f ..
128 India 48.2 61.0l 61.9 76.4l .. 89e .. .. .. 73 22g
129 Solomon Islands .. .. .. .. .. 63e,f .. 26e 88 .. ..
130 Lao People’s Democratic Republic .. 68.7 .. 78.5 63e 84 .. 38 .. 63 6g
131 Cambodia .. 73.6 .. 83.4 69e 99 .. 24e .. 63 19
132 Myanmar .. 89.9 .. 94.5 98e 90 .. 37 .. 70 42
133 Bhutan .. .. .. .. .. .. .. .. .. 91f ..
134 Comoros .. .. .. .. 57e 55e,f .. .. .. 80e 11
135 Ghana .. 57.9 .. 70.7 54e 65 .. 37e 80 63f 26
136 Pakistan .. 49.9 .. 65.1 33e 68 .. 21e .. 70 24g
137 Mauritania .. 51.2 .. 61.3 35e 72 .. 15 75 53 6g
138 Lesotho .. 82.2 .. .. 71 87 15 25 66 73 24
139 Congo 73.8h 84.7h 93.7h 97.4h 79e 44 .. .. 60 66f 11g
140 Bangladesh 35.3 47.5 44.7 63.6 .. 94e,f .. 44f .. 65f 20g
141 Swaziland 67.2 79.6 83.7 88.4 75e 80e 30 33e 77 77f 9
142 Nepal 33.0 48.6 49.6 70.1 .. 79e,f .. .. 51 61e ..
143 Madagascar .. 70.7 .. 70.2 64e 92 .. .. 21 43 20
144 Cameroon .. 67.9 .. .. 74e .. .. .. .. 64e,f 23e
145 Papua New Guinea .. 57.3 .. 66.7 .. .. .. .. 69 68e,f ..
146 Haiti .. .. .. .. 22 .. .. .. .. .. ..
147 Sudan .. 60.9m .. 77.2m 40e 43e,f .. .. 94 79 ..
148 Kenya .. 73.6 .. 80.3 .. 79 .. 42e 77 83e 29
149 Djibouti .. .. .. .. 29 33 .. 23e 87 77f 9g
150 Timor-Leste .. .. .. .. .. 98e .. .. .. .. ..
151 Zimbabwe 83.5 89.4h 95.4 97.7h .. 82f .. 34 76 70e,f ..
152 Togo .. 53.2 .. 74.4 64 78 15 22e 48 75 8
153 Yemen 37.1 54.1h 60.2 75.2h 51e 75e,f .. .. .. 73e,f ..
154 Uganda 56.1 66.8 69.8 76.6 .. .. .. 15e 36 49e 10
155 Gambia .. .. .. .. 48e 77e,f .. 45e .. .. 21
LOWHUMANDEVELOPMENT
156 Senegal 26.9 39.3 37.9 49.1 43e 69 .. 17e,f 85 73 ..
157 Eritrea .. .. .. .. 16e 47 .. 25 .. 79 37
158 Nigeria 55.4 69.1h 71.2 84.2h 58e 68e .. 27 89 73e,f ..
159 Tanzania (United Republic of) 59.1 69.4 81.8 78.4 49 91 .. .. 81e 84 24e,g
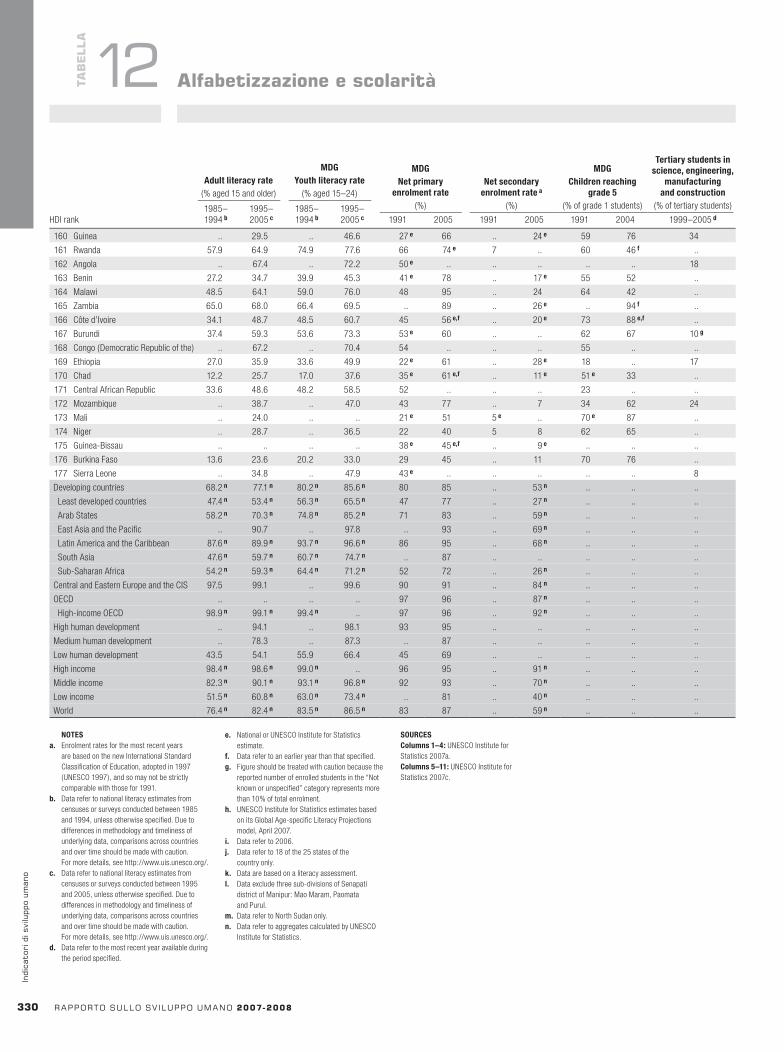
HDI rank
Adultliteracyrate(% aged 15 and older)
MDGYouthliteracyrate
(% aged 15–24)
MDGNetprimary
enrolmentrate(%)
Netsecondaryenrolmentratea
(%)
MDGChildrenreaching
grade5
(% of grade 1 students)
Tertiarystudentsinscience,engineering,
manufacturingandconstruction
(% of tertiary students)1985–1994b
1995–2005c
1985–1994b
1995–2005c 1991 2005 1991 2005 1991 2004 1999–2005d HDI rank
MDGTelephonemainlinesa
(per 1,000 people)
MDGCellularsubscribersa
(per 1,000 people)
MDGInternetusers
(per 1,000 people)
Patentsgrantedtoresidents(per million
people)
Receiptsofroyaltiesandlicence
fees(US$ per person)
Researchand
development(R&D)
expenditures(% of GDP)
ResearchersinR&D
(per million people)
1990 2005 1990 2005 1990 2005 2000–05b 2005 2000–05b 1990–2005b
330 rapportosullosv iluppoumano2007-2008
indi
cato
rid
isvi
lupp
oum
ano
TaB
ELLa
12 alfabetizzazioneescolarità
NOTESa. Enrolment rates for the most recent years
are based on the new International Standard Classification of Education, adopted in 1997 (UNESCO 1997), and so may not be strictly comparable with those for 1991.
b. Data refer to national literacy estimates from censuses or surveys conducted between 1985 and 1994, unless otherwise specified. Due to differences in methodology and timeliness of underlying data, comparisons across countries and over time should be made with caution. For more details, see http://www.uis.unesco.org/.
c. Data refer to national literacy estimates from censuses or surveys conducted between 1995 and 2005, unless otherwise specified. Due to differences in methodology and timeliness of underlying data, comparisons across countries and over time should be made with caution. For more details, see http://www.uis.unesco.org/.
d. Data refer to the most recent year available during the period specified.
e. National or UNESCO Institute for Statistics estimate.
f. Data refer to an earlier year than that specified.g. Figure should be treated with caution because the
reported number of enrolled students in the “Not known or unspecified” category represents more than 10% of total enrolment.
h. UNESCO Institute for Statistics estimates based on its Global Age-specific Literacy Projections model, April 2007.
i. Data refer to 2006.j. Data refer to 18 of the 25 states of the
country only.k. Data are based on a literacy assessment.l. Data exclude three sub-divisions of Senapati
district of Manipur: Mao Maram, Paomata and Purul.
m. Data refer to North Sudan only.n. Data refer to aggregates calculated by UNESCO
Institute for Statistics.
SOURCESColumns1–4: UNESCO Institute for Statistics 2007a. Columns5–11: UNESCO Institute for Statistics 2007c.
160 Guinea .. 29.5 .. 46.6 27e 66 .. 24e 59 76 34
161 Rwanda 57.9 64.9 74.9 77.6 66 74e 7 .. 60 46f ..
162 Angola .. 67.4 .. 72.2 50e .. .. .. .. .. 18
163 Benin 27.2 34.7 39.9 45.3 41e 78 .. 17e 55 52 ..
164 Malawi 48.5 64.1 59.0 76.0 48 95 .. 24 64 42 ..
165 Zambia 65.0 68.0 66.4 69.5 .. 89 .. 26e .. 94f ..
166 Côte d’Ivoire 34.1 48.7 48.5 60.7 45 56e,f .. 20e 73 88e,f ..
167 Burundi 37.4 59.3 53.6 73.3 53e 60 .. .. 62 67 10g
168 Congo (Democratic Republic of the) .. 67.2 .. 70.4 54 .. .. .. 55 .. ..
169 Ethiopia 27.0 35.9 33.6 49.9 22e 61 .. 28e 18 .. 17
170 Chad 12.2 25.7 17.0 37.6 35e 61e,f .. 11e 51e 33 ..
171 Central African Republic 33.6 48.6 48.2 58.5 52 .. .. .. 23 .. ..
172 Mozambique .. 38.7 .. 47.0 43 77 .. 7 34 62 24
173 Mali .. 24.0 .. .. 21e 51 5e .. 70e 87 ..
174 Niger .. 28.7 .. 36.5 22 40 5 8 62 65 ..
175 Guinea-Bissau .. .. .. .. 38e 45e,f .. 9e .. .. ..
176 Burkina Faso 13.6 23.6 20.2 33.0 29 45 .. 11 70 76 ..
177 Sierra Leone .. 34.8 .. 47.9 43e .. .. .. .. .. 8
Developing countries 68.2n 77.1n 80.2n 85.6n 80 85 .. 53n .. .. ..
Least developed countries 47.4n 53.4n 56.3n 65.5n 47 77 .. 27n .. .. ..
Arab States 58.2n 70.3n 74.8n 85.2n 71 83 .. 59n .. .. ..
East Asia and the Pacific .. 90.7 .. 97.8 .. 93 .. 69n .. .. ..
Latin America and the Caribbean 87.6n 89.9n 93.7n 96.6n 86 95 .. 68n .. .. ..
South Asia 47.6n 59.7n 60.7n 74.7n .. 87 .. .. .. .. ..
Sub-Saharan Africa 54.2n 59.3n 64.4n 71.2n 52 72 .. 26n .. .. ..
Central and Eastern Europe and the CIS 97.5 99.1 .. 99.6 90 91 .. 84n .. .. ..
OECD .. .. .. .. 97 96 .. 87n .. .. ..
High-income OECD 98.9n 99.1n 99.4n .. 97 96 .. 92n .. .. ..
High human development .. 94.1 .. 98.1 93 95 .. .. .. .. ..
Medium human development .. 78.3 .. 87.3 .. 87 .. .. .. .. ..
Low human development 43.5 54.1 55.9 66.4 45 69 .. .. .. .. ..
High income 98.4n 98.6n 99.0n .. 96 95 .. 91n .. .. ..
Middle income 82.3n 90.1n 93.1n 96.8n 92 93 .. 70n .. .. ..
Low income 51.5n 60.8n 63.0n 73.4n .. 81 .. 40n .. .. ..
World 76.4n 82.4n 83.5n 86.5n 83 87 .. 59n .. .. ..
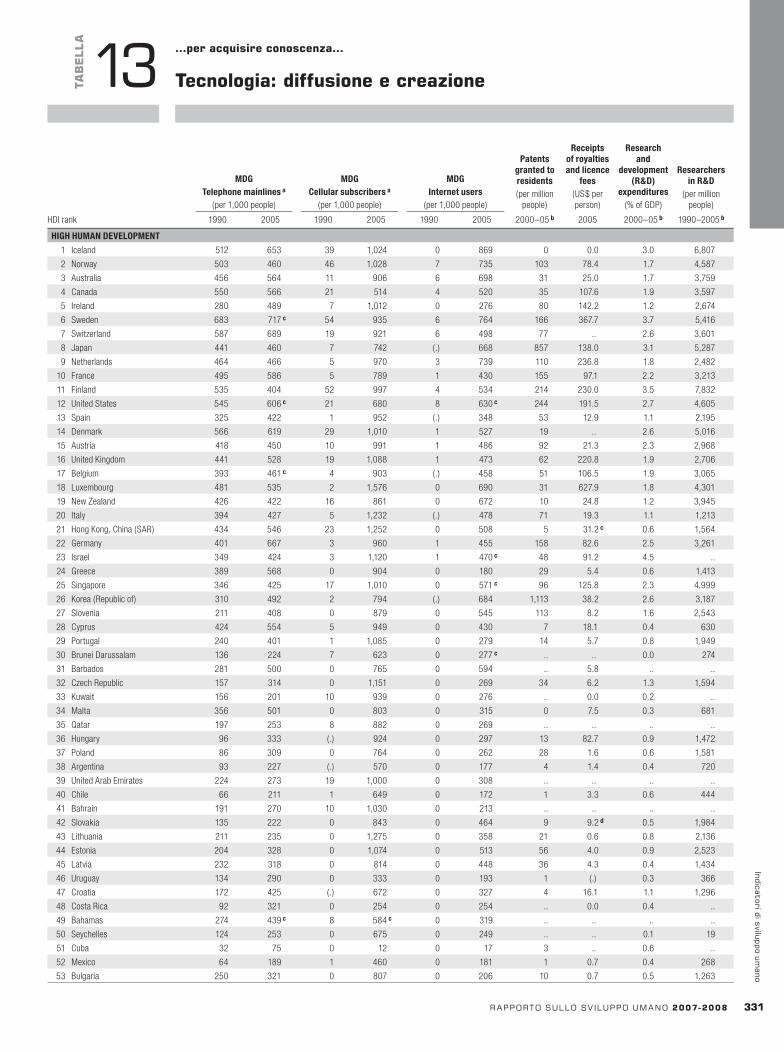
HDI rank
MDGTelephonemainlinesa
(per 1,000 people)
MDGCellularsubscribersa
(per 1,000 people)
MDGInternetusers
(per 1,000 people)
Patentsgrantedtoresidents(per million
people)
Receiptsofroyaltiesandlicence
fees(US$ per person)
Researchand
development(R&D)
expenditures(% of GDP)
ResearchersinR&D
(per million people)
1990 2005 1990 2005 1990 2005 2000–05b 2005 2000–05b 1990–2005b
rapportosullosv iluppoumano2007-2008 331
indicatoridisviluppoumano
TaB
ELLa
13
HIGHHUMANDEVELOPMENT
1 Iceland 512 653 39 1,024 0 869 0 0.0 3.0 6,807
2 Norway 503 460 46 1,028 7 735 103 78.4 1.7 4,587
3 Australia 456 564 11 906 6 698 31 25.0 1.7 3,759
4 Canada 550 566 21 514 4 520 35 107.6 1.9 3,597
5 Ireland 280 489 7 1,012 0 276 80 142.2 1.2 2,674
6 Sweden 683 717c 54 935 6 764 166 367.7 3.7 5,416
7 Switzerland 587 689 19 921 6 498 77 .. 2.6 3,601
8 Japan 441 460 7 742 (.) 668 857 138.0 3.1 5,287
9 Netherlands 464 466 5 970 3 739 110 236.8 1.8 2,482
10 France 495 586 5 789 1 430 155 97.1 2.2 3,213
11 Finland 535 404 52 997 4 534 214 230.0 3.5 7,832
12 United States 545 606c 21 680 8 630c 244 191.5 2.7 4,605
13 Spain 325 422 1 952 (.) 348 53 12.9 1.1 2,195
14 Denmark 566 619 29 1,010 1 527 19 .. 2.6 5,016
15 Austria 418 450 10 991 1 486 92 21.3 2.3 2,968
16 United Kingdom 441 528 19 1,088 1 473 62 220.8 1.9 2,706
17 Belgium 393 461c 4 903 (.) 458 51 106.5 1.9 3,065
18 Luxembourg 481 535 2 1,576 0 690 31 627.9 1.8 4,301
19 New Zealand 426 422 16 861 0 672 10 24.8 1.2 3,945
20 Italy 394 427 5 1,232 (.) 478 71 19.3 1.1 1,213
21 Hong Kong, China (SAR) 434 546 23 1,252 0 508 5 31.2c 0.6 1,564
22 Germany 401 667 3 960 1 455 158 82.6 2.5 3,261
23 Israel 349 424 3 1,120 1 470c 48 91.2 4.5 ..
24 Greece 389 568 0 904 0 180 29 5.4 0.6 1,413
25 Singapore 346 425 17 1,010 0 571c 96 125.8 2.3 4,999
26 Korea (Republic of) 310 492 2 794 (.) 684 1,113 38.2 2.6 3,187
27 Slovenia 211 408 0 879 0 545 113 8.2 1.6 2,543
28 Cyprus 424 554 5 949 0 430 7 18.1 0.4 630
29 Portugal 240 401 1 1,085 0 279 14 5.7 0.8 1,949
30 Brunei Darussalam 136 224 7 623 0 277c .. .. 0.0 274
31 Barbados 281 500 0 765 0 594 .. 5.8 .. ..
32 Czech Republic 157 314 0 1,151 0 269 34 6.2 1.3 1,594
33 Kuwait 156 201 10 939 0 276 .. 0.0 0.2 ..
34 Malta 356 501 0 803 0 315 0 7.5 0.3 681
35 Qatar 197 253 8 882 0 269 .. .. .. ..
36 Hungary 96 333 (.) 924 0 297 13 82.7 0.9 1,472
37 Poland 86 309 0 764 0 262 28 1.6 0.6 1,581
38 Argentina 93 227 (.) 570 0 177 4 1.4 0.4 720
39 United Arab Emirates 224 273 19 1,000 0 308 .. .. .. ..
40 Chile 66 211 1 649 0 172 1 3.3 0.6 444
41 Bahrain 191 270 10 1,030 0 213 .. .. .. ..
42 Slovakia 135 222 0 843 0 464 9 9.2d 0.5 1,984
43 Lithuania 211 235 0 1,275 0 358 21 0.6 0.8 2,136
44 Estonia 204 328 0 1,074 0 513 56 4.0 0.9 2,523
45 Latvia 232 318 0 814 0 448 36 4.3 0.4 1,434
46 Uruguay 134 290 0 333 0 193 1 (.) 0.3 366
47 Croatia 172 425 (.) 672 0 327 4 16.1 1.1 1,296
48 Costa Rica 92 321 0 254 0 254 .. 0.0 0.4 ..
49 Bahamas 274 439c 8 584c 0 319 .. .. .. ..
50 Seychelles 124 253 0 675 0 249 .. .. 0.1 19
51 Cuba 32 75 0 12 0 17 3 .. 0.6 ..
52 Mexico 64 189 1 460 0 181 1 0.7 0.4 268
53 Bulgaria 250 321 0 807 0 206 10 0.7 0.5 1,263
…peracquisireconoscenza…
Tecnologia:diffusioneecreazione

HDI rank
MDGTelephonemainlinesa
(per 1,000 people)
MDGCellularsubscribersa
(per 1,000 people)
MDGInternetusers
(per 1,000 people)
Patentsgrantedtoresidents(per million
people)
Receiptsofroyaltiesandlicence
fees(US$ per person)
Researchand
development(R&D)
expenditures(% of GDP)
ResearchersinR&D
(per million people)
1990 2005 1990 2005 1990 2005 2000–05b 2005 2000–05b 1990–2005b
332 rapportosullosv iluppoumano2007-2008
indi
cato
rid
isvi
lupp
oum
ano
TaB
ELLa
13 Tecnologia:diffusioneecreazione
54 Saint Kitts and Nevis 231 532c 0 213c 0 .. .. 0.0 .. ..
55 Tonga 46 .. 0 161c 0 29 .. .. .. 45,454
56 Libyan Arab Jamahiriya 51 133d 0 41c 0 36c .. 0.0c .. 361
57 Antigua and Barbuda 252 467c 0 663c 0 350 .. 0.0 .. ..
58 Oman 57 103 1 519 0 111 .. .. .. ..
59 Trinidad and Tobago 136 248 0 613 0 123c .. .. 0.1 ..
60 Romania 102 203 0 617 0 208c 24 2.2 0.4 976
61 Saudi Arabia 75 164 1 575 0 70c (.) 0.0 .. ..
62 Panama 90 136 0 418 0 64 .. 0.0 0.3 97
63 Malaysia 89 172 5 771 0 435 .. 1.1 0.7 299
64 Belarus 154 336 0 419 0 347 76 0.3 0.6 ..
65 Mauritius 53 289 2 574 0 146c .. (.) 0.4 360
66 Bosnia and Herzegovina .. 248 0 408 0 206 3 .. .. ..
67 Russian Federation 140 280 0 838 0 152 135 1.8 1.2 3,319
68 Albania 12 88c 0 405c 0 60 .. 0.2 .. ..
69 Macedonia (TFYR) 150 262 0 620 0 79 11 1.5 0.3 504
70 Brazil 63 230c (.) 462 0 195 1 0.5 1.0 344
MEDIUMHUMANDEVELOPMENT
71 Dominica 161 293c 0 585c 0 361 .. 0.0 .. ..
72 Saint Lucia 127 .. 0 573c 0 339c 0 .. 0.4e ..
73 Kazakhstan 82 167c 0 327 0 27c 83 (.) 0.2 629
74 Venezuela (Bolivarian Republic of) 75 136 (.) 470 0 125 1 0.0 0.3 ..
75 Colombia 69 168 0 479 0 104 (.) 0.2 0.2 109
76 Ukraine 135 256c 0 366 0 97 52 0.5 1.2 ..
77 Samoa 25 73d 0 130 0 32 0 .. .. ..
78 Thailand 24 110 1 430c 0 110 1 0.3 0.3 287
79 Dominican Republic 48 101 (.) 407 0 169 .. 0.0 .. ..
80 Belize 92 114 0 319 0 130 .. .. .. ..
81 China 6 269 (.) 302 0 85 16 0.1 1.4 708
82 Grenada 162 309c 2 410c 0 182 .. 0.0 .. ..
83 Armenia 158 192c 0 106 0 53 39 .. 0.3 ..
84 Turkey 122 263 1 605 0 222 1 0.0c 0.7 341
85 Suriname 91 180 0 518 0 71 .. .. .. ..
86 Jordan 78 119c (.) 304c 0 118c .. .. .. 1,927
87 Peru 26 80 (.) 200 0 164 (.) 0.1 0.1 226
88 Lebanon 144 277 0 277 0 196 .. 0.0c .. ..
89 Ecuador 48 129 0 472 0 47 0 0.0c 0.1 50
90 Philippines 10 41 0 419 0 54c (.) 0.1 0.1 48
91 Tunisia 37 125 (.) 566 0 95 .. 1.4 0.6 1,013
92 Fiji 59 122d 0 229 0 77 .. .. .. ..
93 Saint Vincent and the Grenadines 120 189 0 593 0 84 0 .. 0.2 ..
94 Iran ( Islamic Republic of) 40 278 0 106 0 103 8 .. 0.7 1,279
95 Paraguay 27 54 0 320 0 34 .. 33.2 0.1 79
96 Georgia 99 151c 0 326 0 39c 42 2.1 0.3 ..
97 Guyana 22 147 0 375 0 213 .. 47.9 .. ..
98 Azerbaijan 87 130 0 267 0 81 .. (.) 0.3 ..
99 Sri Lanka 7 63 (.) 171 0 14c 3 .. 0.1 128
100 Maldives 29 98 0 466 0 59c .. 8.6 .. ..
101 Jamaica 44 129 0 1,017 0 404c 1 4.7 0.1 ..
102 Cape Verde 23 141 0 161 0 49 .. 0.2d .. 127
103 El Salvador 24 141 0 350 0 93 .. 0.4 0.1e 47
104 Algeria 32 78 (.) 416 0 58 1 .. .. ..
105 Viet Nam 1 191 0 115 0 129 (.) .. 0.2 115
106 Occupied Palestinian Territories .. 96 0 302 0 67 .. .. .. ..
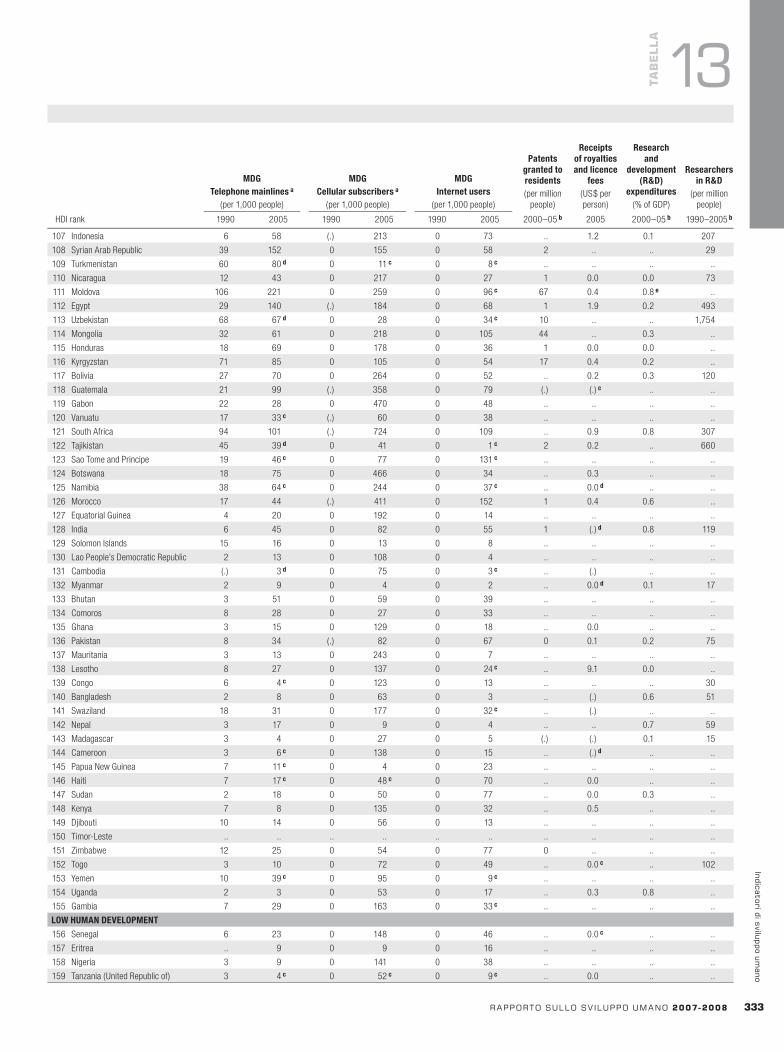
HDI rank
MDGTelephonemainlinesa
(per 1,000 people)
MDGCellularsubscribersa
(per 1,000 people)
MDGInternetusers
(per 1,000 people)
Patentsgrantedtoresidents(per million
people)
Receiptsofroyaltiesandlicence
fees(US$ per person)
Researchand
development(R&D)
expenditures(% of GDP)
ResearchersinR&D
(per million people)
1990 2005 1990 2005 1990 2005 2000–05b 2005 2000–05b 1990–2005b
rapportosullosv iluppoumano2007-2008 333
indicatoridisviluppoumano
TaB
ELLa
13
107 Indonesia 6 58 (.) 213 0 73 .. 1.2 0.1 207
108 Syrian Arab Republic 39 152 0 155 0 58 2 .. .. 29
109 Turkmenistan 60 80d 0 11c 0 8c .. .. .. ..
110 Nicaragua 12 43 0 217 0 27 1 0.0 0.0 73
111 Moldova 106 221 0 259 0 96c 67 0.4 0.8e ..
112 Egypt 29 140 (.) 184 0 68 1 1.9 0.2 493
113 Uzbekistan 68 67d 0 28 0 34c 10 .. .. 1,754
114 Mongolia 32 61 0 218 0 105 44 .. 0.3 ..
115 Honduras 18 69 0 178 0 36 1 0.0 0.0 ..
116 Kyrgyzstan 71 85 0 105 0 54 17 0.4 0.2 ..
117 Bolivia 27 70 0 264 0 52 .. 0.2 0.3 120
118 Guatemala 21 99 (.) 358 0 79 (.) (.)c .. ..
119 Gabon 22 28 0 470 0 48 .. .. .. ..
120 Vanuatu 17 33c (.) 60 0 38 .. .. .. ..
121 South Africa 94 101 (.) 724 0 109 .. 0.9 0.8 307
122 Tajikistan 45 39d 0 41 0 1c 2 0.2 .. 660
123 Sao Tome and Principe 19 46c 0 77 0 131c .. .. .. ..
124 Botswana 18 75 0 466 0 34 .. 0.3 .. ..
125 Namibia 38 64c 0 244 0 37c .. 0.0d .. ..
126 Morocco 17 44 (.) 411 0 152 1 0.4 0.6 ..
127 Equatorial Guinea 4 20 0 192 0 14 .. .. .. ..
128 India 6 45 0 82 0 55 1 (.)d 0.8 119
129 Solomon Islands 15 16 0 13 0 8 .. .. .. ..
130 Lao People’s Democratic Republic 2 13 0 108 0 4 .. .. .. ..
131 Cambodia (.) 3d 0 75 0 3c .. (.) .. ..
132 Myanmar 2 9 0 4 0 2 .. 0.0d 0.1 17
133 Bhutan 3 51 0 59 0 39 .. .. .. ..
134 Comoros 8 28 0 27 0 33 .. .. .. ..
135 Ghana 3 15 0 129 0 18 .. 0.0 .. ..
136 Pakistan 8 34 (.) 82 0 67 0 0.1 0.2 75
137 Mauritania 3 13 0 243 0 7 .. .. .. ..
138 Lesotho 8 27 0 137 0 24c .. 9.1 0.0 ..
139 Congo 6 4c 0 123 0 13 .. .. .. 30
140 Bangladesh 2 8 0 63 0 3 .. (.) 0.6 51
141 Swaziland 18 31 0 177 0 32c .. (.) .. ..
142 Nepal 3 17 0 9 0 4 .. .. 0.7 59
143 Madagascar 3 4 0 27 0 5 (.) (.) 0.1 15
144 Cameroon 3 6c 0 138 0 15 .. (.)d .. ..
145 Papua New Guinea 7 11c 0 4 0 23 .. .. .. ..
146 Haiti 7 17c 0 48c 0 70 .. 0.0 .. ..
147 Sudan 2 18 0 50 0 77 .. 0.0 0.3 ..
148 Kenya 7 8 0 135 0 32 .. 0.5 .. ..
149 Djibouti 10 14 0 56 0 13 .. .. .. ..
150 Timor-Leste .. .. .. .. .. .. .. .. .. ..
151 Zimbabwe 12 25 0 54 0 77 0 .. .. ..
152 Togo 3 10 0 72 0 49 .. 0.0c .. 102
153 Yemen 10 39c 0 95 0 9c .. .. .. ..
154 Uganda 2 3 0 53 0 17 .. 0.3 0.8 ..
155 Gambia 7 29 0 163 0 33c .. .. .. ..
LOWHUMANDEVELOPMENT
156 Senegal 6 23 0 148 0 46 .. 0.0c .. ..
157 Eritrea .. 9 0 9 0 16 .. .. .. ..
158 Nigeria 3 9 0 141 0 38 .. .. .. ..
159 Tanzania (United Republic of) 3 4c 0 52c 0 9c .. 0.0 .. ..
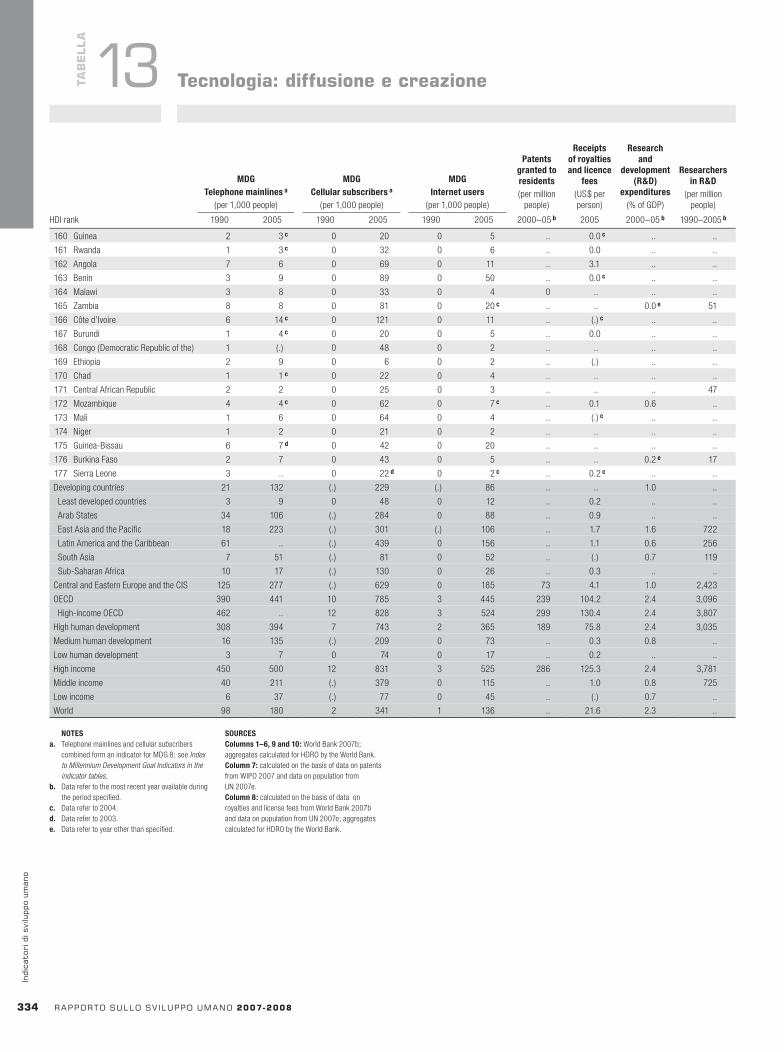
HDI rank
GDP
GDPpercapita
Averageannualchangeinconsumerpriceindex
(%)US$ 2005
2005 PPP US$a 2005
Annualgrowthrate(%)
Highestvalueduring1975–20052005 PPP
US$ a
Yearofhighestvalue
US$ billions 2005
PPP US$ billions 2005 1975–2005 1990–2005 1990–2005 2004–05HDI rank
MDGTelephonemainlinesa
(per 1,000 people)
MDGCellularsubscribersa
(per 1,000 people)
MDGInternetusers
(per 1,000 people)
Patentsgrantedtoresidents(per million
people)
Receiptsofroyaltiesandlicence
fees(US$ per person)
Researchand
development(R&D)
expenditures(% of GDP)
ResearchersinR&D
(per million people)
1990 2005 1990 2005 1990 2005 2000–05b 2005 2000–05b 1990–2005b
334 rapportosullosv iluppoumano2007-2008
indi
cato
rid
isvi
lupp
oum
ano
NOTESa. Telephone mainlines and cellular subscribers
combined form an indicator for MDG 8; see Index to Millennium Development Goal Indicators in the indicator tables.
b. Data refer to the most recent year available during the period specified.
c. Data refer to 2004.d. Data refer to 2003.e. Data refer to year other than specified.
SOURCESColumns1–6,9and10: World Bank 2007b; aggregates calculated for HDRO by the World Bank. Column7: calculated on the basis of data on patents from WIPO 2007 and data on population from UN 2007e. Column8: calculated on the basis of data on royalties and license fees from World Bank 2007b and data on pupulation from UN 2007e; aggregates calculated for HDRO by the World Bank.
TaB
ELLa
13 Tecnologia:diffusioneecreazione
160 Guinea 2 3c 0 20 0 5 .. 0.0c .. ..
161 Rwanda 1 3c 0 32 0 6 .. 0.0 .. ..
162 Angola 7 6 0 69 0 11 .. 3.1 .. ..
163 Benin 3 9 0 89 0 50 .. 0.0c .. ..
164 Malawi 3 8 0 33 0 4 0 .. .. ..
165 Zambia 8 8 0 81 0 20c .. .. 0.0e 51
166 Côte d’Ivoire 6 14c 0 121 0 11 .. (.)c .. ..
167 Burundi 1 4c 0 20 0 5 .. 0.0 .. ..
168 Congo (Democratic Republic of the) 1 (.) 0 48 0 2 .. .. .. ..
169 Ethiopia 2 9 0 6 0 2 .. (.) .. ..
170 Chad 1 1c 0 22 0 4 .. .. .. ..
171 Central African Republic 2 2 0 25 0 3 .. .. .. 47
172 Mozambique 4 4c 0 62 0 7c .. 0.1 0.6 ..
173 Mali 1 6 0 64 0 4 .. (.)c .. ..
174 Niger 1 2 0 21 0 2 .. .. .. ..
175 Guinea-Bissau 6 7d 0 42 0 20 .. .. .. ..
176 Burkina Faso 2 7 0 43 0 5 .. .. 0.2e 17
177 Sierra Leone 3 .. 0 22d 0 2c .. 0.2c .. ..
Developing countries 21 132 (.) 229 (.) 86 .. .. 1.0 ..
Least developed countries 3 9 0 48 0 12 .. 0.2 .. ..
Arab States 34 106 (.) 284 0 88 .. 0.9 .. ..
East Asia and the Pacific 18 223 (.) 301 (.) 106 .. 1.7 1.6 722
Latin America and the Caribbean 61 .. (.) 439 0 156 .. 1.1 0.6 256
South Asia 7 51 (.) 81 0 52 .. (.) 0.7 119
Sub-Saharan Africa 10 17 (.) 130 0 26 .. 0.3 .. ..
Central and Eastern Europe and the CIS 125 277 (.) 629 0 185 73 4.1 1.0 2,423
OECD 390 441 10 785 3 445 239 104.2 2.4 3,096
High-income OECD 462 .. 12 828 3 524 299 130.4 2.4 3,807
High human development 308 394 7 743 2 365 189 75.8 2.4 3,035
Medium human development 16 135 (.) 209 0 73 .. 0.3 0.8 ..
Low human development 3 7 0 74 0 17 .. 0.2 .. ..
High income 450 500 12 831 3 525 286 125.3 2.4 3,781
Middle income 40 211 (.) 379 0 115 .. 1.0 0.8 725
Low income 6 37 (.) 77 0 45 .. (.) 0.7 ..
World 98 180 2 341 1 136 .. 21.6 2.3 ..
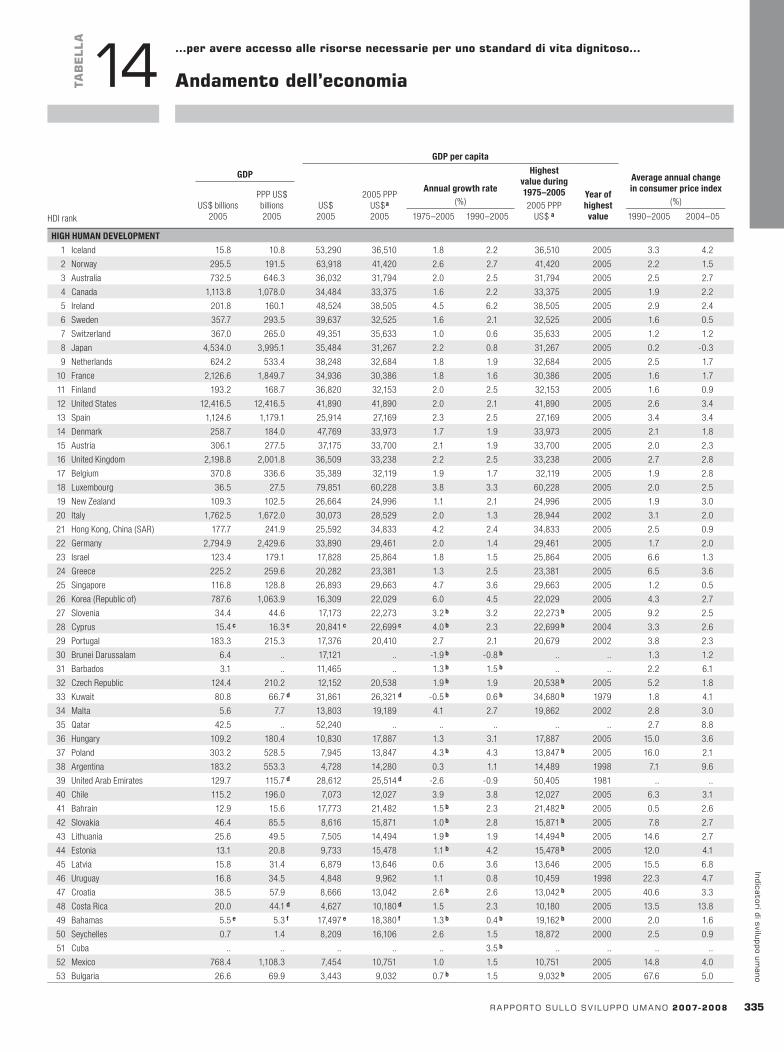
HDI rank
GDP
GDPpercapita
Averageannualchangeinconsumerpriceindex
(%)US$ 2005
2005 PPP US$a 2005
Annualgrowthrate(%)
Highestvalueduring1975–20052005 PPP
US$ a
Yearofhighestvalue
US$ billions 2005
PPP US$ billions 2005 1975–2005 1990–2005 1990–2005 2004–05
rapportosullosv iluppoumano2007-2008 33�
indicatoridisviluppoumano
TaB
ELLa
14 …peravereaccessoallerisorsenecessarieperunostandarddivitadignitoso…
andamentodell’economia
HIGHHUMANDEVELOPMENT
1 Iceland 15.8 10.8 53,290 36,510 1.8 2.2 36,510 2005 3.3 4.2
2 Norway 295.5 191.5 63,918 41,420 2.6 2.7 41,420 2005 2.2 1.5
3 Australia 732.5 646.3 36,032 31,794 2.0 2.5 31,794 2005 2.5 2.7
4 Canada 1,113.8 1,078.0 34,484 33,375 1.6 2.2 33,375 2005 1.9 2.2
5 Ireland 201.8 160.1 48,524 38,505 4.5 6.2 38,505 2005 2.9 2.4
6 Sweden 357.7 293.5 39,637 32,525 1.6 2.1 32,525 2005 1.6 0.5
7 Switzerland 367.0 265.0 49,351 35,633 1.0 0.6 35,633 2005 1.2 1.2
8 Japan 4,534.0 3,995.1 35,484 31,267 2.2 0.8 31,267 2005 0.2 -0.3
9 Netherlands 624.2 533.4 38,248 32,684 1.8 1.9 32,684 2005 2.5 1.7
10 France 2,126.6 1,849.7 34,936 30,386 1.8 1.6 30,386 2005 1.6 1.7
11 Finland 193.2 168.7 36,820 32,153 2.0 2.5 32,153 2005 1.6 0.9
12 United States 12,416.5 12,416.5 41,890 41,890 2.0 2.1 41,890 2005 2.6 3.4
13 Spain 1,124.6 1,179.1 25,914 27,169 2.3 2.5 27,169 2005 3.4 3.4
14 Denmark 258.7 184.0 47,769 33,973 1.7 1.9 33,973 2005 2.1 1.8
15 Austria 306.1 277.5 37,175 33,700 2.1 1.9 33,700 2005 2.0 2.3
16 United Kingdom 2,198.8 2,001.8 36,509 33,238 2.2 2.5 33,238 2005 2.7 2.8
17 Belgium 370.8 336.6 35,389 32,119 1.9 1.7 32,119 2005 1.9 2.8
18 Luxembourg 36.5 27.5 79,851 60,228 3.8 3.3 60,228 2005 2.0 2.5
19 New Zealand 109.3 102.5 26,664 24,996 1.1 2.1 24,996 2005 1.9 3.0
20 Italy 1,762.5 1,672.0 30,073 28,529 2.0 1.3 28,944 2002 3.1 2.0
21 Hong Kong, China (SAR) 177.7 241.9 25,592 34,833 4.2 2.4 34,833 2005 2.5 0.9
22 Germany 2,794.9 2,429.6 33,890 29,461 2.0 1.4 29,461 2005 1.7 2.0
23 Israel 123.4 179.1 17,828 25,864 1.8 1.5 25,864 2005 6.6 1.3
24 Greece 225.2 259.6 20,282 23,381 1.3 2.5 23,381 2005 6.5 3.6
25 Singapore 116.8 128.8 26,893 29,663 4.7 3.6 29,663 2005 1.2 0.5
26 Korea (Republic of) 787.6 1,063.9 16,309 22,029 6.0 4.5 22,029 2005 4.3 2.7
27 Slovenia 34.4 44.6 17,173 22,273 3.2b 3.2 22,273b 2005 9.2 2.5
28 Cyprus 15.4c 16.3c 20,841c 22,699c 4.0b 2.3 22,699b 2004 3.3 2.6
29 Portugal 183.3 215.3 17,376 20,410 2.7 2.1 20,679 2002 3.8 2.3
30 Brunei Darussalam 6.4 .. 17,121 .. -1.9b -0.8b .. .. 1.3 1.2
31 Barbados 3.1 .. 11,465 .. 1.3b 1.5b .. .. 2.2 6.1
32 Czech Republic 124.4 210.2 12,152 20,538 1.9b 1.9 20,538b 2005 5.2 1.8
33 Kuwait 80.8 66.7d 31,861 26,321d -0.5b 0.6b 34,680b 1979 1.8 4.1
34 Malta 5.6 7.7 13,803 19,189 4.1 2.7 19,862 2002 2.8 3.0
35 Qatar 42.5 .. 52,240 .. .. .. .. .. 2.7 8.8
36 Hungary 109.2 180.4 10,830 17,887 1.3 3.1 17,887 2005 15.0 3.6
37 Poland 303.2 528.5 7,945 13,847 4.3b 4.3 13,847b 2005 16.0 2.1
38 Argentina 183.2 553.3 4,728 14,280 0.3 1.1 14,489 1998 7.1 9.6
39 United Arab Emirates 129.7 115.7d 28,612 25,514d -2.6 -0.9 50,405 1981 .. ..
40 Chile 115.2 196.0 7,073 12,027 3.9 3.8 12,027 2005 6.3 3.1
41 Bahrain 12.9 15.6 17,773 21,482 1.5b 2.3 21,482b 2005 0.5 2.6
42 Slovakia 46.4 85.5 8,616 15,871 1.0b 2.8 15,871b 2005 7.8 2.7
43 Lithuania 25.6 49.5 7,505 14,494 1.9b 1.9 14,494b 2005 14.6 2.7
44 Estonia 13.1 20.8 9,733 15,478 1.1b 4.2 15,478b 2005 12.0 4.1
45 Latvia 15.8 31.4 6,879 13,646 0.6 3.6 13,646 2005 15.5 6.8
46 Uruguay 16.8 34.5 4,848 9,962 1.1 0.8 10,459 1998 22.3 4.7
47 Croatia 38.5 57.9 8,666 13,042 2.6b 2.6 13,042b 2005 40.6 3.3
48 Costa Rica 20.0 44.1d 4,627 10,180d 1.5 2.3 10,180 2005 13.5 13.8
49 Bahamas 5.5e 5.3f 17,497e 18,380f 1.3b 0.4b 19,162b 2000 2.0 1.6
50 Seychelles 0.7 1.4 8,209 16,106 2.6 1.5 18,872 2000 2.5 0.9
51 Cuba .. .. .. .. .. 3.5b .. .. .. ..
52 Mexico 768.4 1,108.3 7,454 10,751 1.0 1.5 10,751 2005 14.8 4.0
53 Bulgaria 26.6 69.9 3,443 9,032 0.7b 1.5 9,032b 2005 67.6 5.0

HDI rank
GDP
GDPpercapita
Averageannualchangeinconsumerpriceindex
(%)US$ 2005
2005 PPP US$a 2005
Annualgrowthrate(%)
Highestvalueduring1975–20052005 PPP
US$ a
Yearofhighestvalue
US$ billions 2005
PPP US$ billions 2005 1975–2005 1990–2005 1990–2005 2004–05HDI rank
GDP
GDPpercapita
Averageannualchangeinconsumerpriceindex
(%)US$ 2005
2005 PPP US$a 2005
Annualgrowthrate(%)
Highestvalueduring1975–20052005 PPP
US$ a
Yearofhighestvalue
US$ billions 2005
PPP US$ billions 2005 1975–2005 1990–2005 1990–2005 2004–05
33� rapportosullosv iluppoumano2007-2008
indi
cato
rid
isvi
lupp
oum
ano
andamentodell’economiaTaB
ELLa
14
54 Saint Kitts and Nevis 0.5 0.6c 9,438 13,307c 4.9b 2.9 13,307b 2004 3.0 1.8
55 Tonga 0.2 0.8d 2,090 8,177d 1.8b 1.9 8,177b 2005 5.2 8.3
56 Libyan Arab Jamahiriya 38.8 .. 6,621 .. 2.5b .. .. .. 1.9 ..
57 Antigua and Barbuda 0.9 1.0c 10,578 12,500c 3.7b 1.5 12,500b 2004 .. ..
58 Oman 24.3c 38.4c 9,584c 15,602c 2.4b 1.8 15,602b 2004 0.1 1.2
59 Trinidad and Tobago 14.4 19.1 11,000 14,603 0.6 4.3 14,603 2005 5.1 6.9
60 Romania 98.6 196.0 4,556 9,060 -0.3b 1.6 9,060b 2005 66.5 9.0
61 Saudi Arabia 309.8 363.2d 13,399 15,711d -2.0 0.1 27,686 1977 0.4 0.7
62 Panama 15.5 24.6 4,786 7,605 1.0 2.2 7,605 2005 1.0 3.3
63 Malaysia 130.3 275.8 5,142 10,882 3.9 3.3 10,882 2005 2.9 3.0
64 Belarus 29.6 77.4 3,024 7,918 2.2b 2.2 7,918b 2005 144.6 10.3
65 Mauritius 6.3 15.8 5,059 12,715 4.4b 3.8 12,715b 2005 5.8 4.9
66 Bosnia and Herzegovina 9.9 .. 2,546 .. .. 12.7b .. .. .. ..
67 Russian Federation 763.7 1,552.0 5,336 10,845 -0.7b -0.1 11,947b 1989 53.5 12.7
68 Albania 8.4 16.6 2,678 5,316 0.9b 5.2 5,316b 2005 15.6 2.4
69 Macedonia (TFYR) 5.8 14.6 2,835 7,200 -0.1b -0.1 7,850b 1990 5.7 (.)
70 Brazil 796.1 1,566.3 4,271 8,402 0.7 1.1 8,402 2005 86.0 6.9
MEDIUMHUMANDEVELOPMENT
71 Dominica 0.3 0.4c 3,938 6,393c 3.1b 1.3 6,393b 2004 1.6 2.2
72 Saint Lucia 0.8 1.1c 5,007 6,707c 3.6b 0.9 6,707b 2004 2.7 3.9
73 Kazakhstan 57.1 119.0 3,772 7,857 2.0b 2.0 7,857b 2005 29.7 7.6
74 Venezuela (Bolivarian Republic of) 140.2 176.3d 5,275 6,632 -1.0 -1.0 8,756 1977 37.6 16.0
75 Colombia 122.3 333.1d 2,682 7,304d 1.4 0.6 7,304 2005 15.2 5.0
76 Ukraine 82.9 322.4 1,761 6,848 -3.8b -2.4 10,587b 1989 63.9 13.5
77 Samoa 0.4 1.1 2,184 6,170 1.4b 2.5 6,170b 2005 4.0 1.8
78 Thailand 176.6 557.4 2,750 8,677 4.9 2.7 8,677 2005 3.7 4.5
79 Dominican Republic 29.5 73.1d 3,317 8,217d 2.1 3.9 8,217 2005 10.5 4.2
80 Belize 1.1 2.1 3,786 7,109 3.1 2.3 7,120 2004 1.8 3.6
81 China 2,234.3 8,814.9g 1,713 6,757g 8.4 8.8 6,757 2005 5.1 1.8
82 Grenada 0.5 0.8c 4,451 7,843c 3.4b 2.5 8,264b 2003 2.0 ..
83 Armenia 4.9 14.9 1,625 4,945 4.4b 4.4 4,945b 2005 27.3 0.6
84 Turkey 362.5 605.9 5,030 8,407 1.8 1.7 8,407 2005 64.2 8.2
85 Suriname 1.3 3.5 2,986 7,722 -0.5 1.1 8,634 1978 60.7 ..
86 Jordan 12.7 30.3 2,323 5,530 0.5 1.6 5,613 1986 2.8 3.5
87 Peru 79.4 168.9 2,838 6,039 -0.3 2.2 6,097 1981 15.0 1.6
88 Lebanon 21.9 20.0 6,135 5,584 3.2b 2.8 5,586b 2004 .. ..
89 Ecuador 36.5 57.4 2,758 4,341 0.3 0.8 4,341 2005 34.1 2.4
90 Philippines 99.0 426.7 1,192 5,137 0.4 1.6 5,137 2005 6.6 7.6
91 Tunisia 28.7 84.0 2,860 8,371 2.3 3.3 8,371 2005 3.6 2.0
92 Fiji 2.7 5.1 3,219 6,049 0.9b 1.4b 6,056b 2004 3.1 2.4
93 Saint Vincent and the Grenadines 0.4 0.8 3,612 6,568 3.2 1.6 6,568 2005 1.8 3.7
94 Iran ( Islamic Republic of) 189.8 543.8 2,781 7,968 -0.2 2.3 9,311 1976 21.3 13.4
95 Paraguay 7.3 27.4d 1,242 4,642d 0.5 -0.6 5,430 1981 11.1 6.8
96 Georgia 6.4 15.1 1,429 3,365 -3.9 0.2 6,884 1985 12.8 8.2
97 Guyana 0.8 3.4d 1,048 4,508d 0.9 3.2 4,618 2004 5.5 6.3
98 Azerbaijan 12.6 42.1 1,498 5,016 (.)b (.) 5,310b 1990 66.4 9.5
99 Sri Lanka 23.5 90.2 1,196 4,595 3.2 3.7 4,595 2005 9.5 11.6
100 Maldives 0.8 .. 2,326 .. .. 3.8b .. .. 4.3 3.3
101 Jamaica 9.6 11.4 3,607 4,291 1.0 0.7 4,291 2005 16.6 15.3
102 Cape Verde 1.0 2.9d 1,940 5,803d 2.9b 3.4 5,803b 2005 3.9 0.4
103 El Salvador 17.0 36.2d 2,467 5,255d 0.3 1.6 5,745 1978 5.9 4.7
104 Algeria 102.3 232.0d 3,112 7,062d 0.1 1.1 7,062 2005 10.7 1.6
105 Viet Nam 52.4 255.3 631 3,071 5.2b 5.9 3,071b 2005 3.3 8.3
106 Occupied Palestinian Territories 4.0 .. 1,107 .. .. -2.9b .. .. .. ..
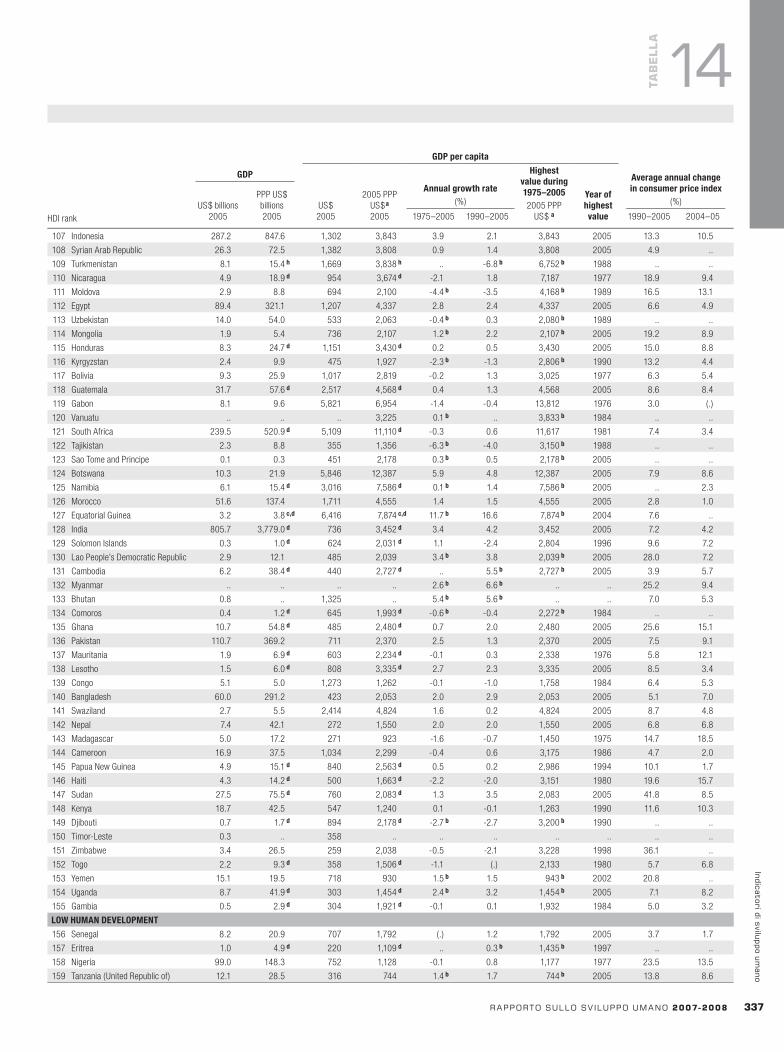
HDI rank
GDP
GDPpercapita
Averageannualchangeinconsumerpriceindex
(%)US$ 2005
2005 PPP US$a 2005
Annualgrowthrate(%)
Highestvalueduring1975–20052005 PPP
US$ a
Yearofhighestvalue
US$ billions 2005
PPP US$ billions 2005 1975–2005 1990–2005 1990–2005 2004–05
rapportosullosv iluppoumano2007-2008 337
indicatoridisviluppoumano
TaB
ELLa
14
107 Indonesia 287.2 847.6 1,302 3,843 3.9 2.1 3,843 2005 13.3 10.5
108 Syrian Arab Republic 26.3 72.5 1,382 3,808 0.9 1.4 3,808 2005 4.9 ..
109 Turkmenistan 8.1 15.4h 1,669 3,838h .. -6.8b 6,752b 1988 .. ..
110 Nicaragua 4.9 18.9d 954 3,674d -2.1 1.8 7,187 1977 18.9 9.4
111 Moldova 2.9 8.8 694 2,100 -4.4b -3.5 4,168b 1989 16.5 13.1
112 Egypt 89.4 321.1 1,207 4,337 2.8 2.4 4,337 2005 6.6 4.9
113 Uzbekistan 14.0 54.0 533 2,063 -0.4b 0.3 2,080b 1989 .. ..
114 Mongolia 1.9 5.4 736 2,107 1.2b 2.2 2,107b 2005 19.2 8.9
115 Honduras 8.3 24.7d 1,151 3,430d 0.2 0.5 3,430 2005 15.0 8.8
116 Kyrgyzstan 2.4 9.9 475 1,927 -2.3b -1.3 2,806b 1990 13.2 4.4
117 Bolivia 9.3 25.9 1,017 2,819 -0.2 1.3 3,025 1977 6.3 5.4
118 Guatemala 31.7 57.6d 2,517 4,568d 0.4 1.3 4,568 2005 8.6 8.4
119 Gabon 8.1 9.6 5,821 6,954 -1.4 -0.4 13,812 1976 3.0 (.)
120 Vanuatu .. .. .. 3,225 0.1b .. 3,833b 1984 .. ..
121 South Africa 239.5 520.9d 5,109 11,110d -0.3 0.6 11,617 1981 7.4 3.4
122 Tajikistan 2.3 8.8 355 1,356 -6.3b -4.0 3,150b 1988 .. ..
123 Sao Tome and Principe 0.1 0.3 451 2,178 0.3b 0.5 2,178b 2005 .. ..
124 Botswana 10.3 21.9 5,846 12,387 5.9 4.8 12,387 2005 7.9 8.6
125 Namibia 6.1 15.4d 3,016 7,586d 0.1b 1.4 7,586b 2005 .. 2.3
126 Morocco 51.6 137.4 1,711 4,555 1.4 1.5 4,555 2005 2.8 1.0
127 Equatorial Guinea 3.2 3.8c,d 6,416 7,874c,d 11.7b 16.6 7,874b 2004 7.6 ..
128 India 805.7 3,779.0d 736 3,452d 3.4 4.2 3,452 2005 7.2 4.2
129 Solomon Islands 0.3 1.0d 624 2,031d 1.1 -2.4 2,804 1996 9.6 7.2
130 Lao People’s Democratic Republic 2.9 12.1 485 2,039 3.4b 3.8 2,039b 2005 28.0 7.2
131 Cambodia 6.2 38.4d 440 2,727d .. 5.5b 2,727b 2005 3.9 5.7
132 Myanmar .. .. .. .. 2.6b 6.6b .. .. 25.2 9.4
133 Bhutan 0.8 .. 1,325 .. 5.4b 5.6b .. .. 7.0 5.3
134 Comoros 0.4 1.2d 645 1,993d -0.6b -0.4 2,272b 1984 .. ..
135 Ghana 10.7 54.8d 485 2,480d 0.7 2.0 2,480 2005 25.6 15.1
136 Pakistan 110.7 369.2 711 2,370 2.5 1.3 2,370 2005 7.5 9.1
137 Mauritania 1.9 6.9d 603 2,234d -0.1 0.3 2,338 1976 5.8 12.1
138 Lesotho 1.5 6.0d 808 3,335d 2.7 2.3 3,335 2005 8.5 3.4
139 Congo 5.1 5.0 1,273 1,262 -0.1 -1.0 1,758 1984 6.4 5.3
140 Bangladesh 60.0 291.2 423 2,053 2.0 2.9 2,053 2005 5.1 7.0
141 Swaziland 2.7 5.5 2,414 4,824 1.6 0.2 4,824 2005 8.7 4.8
142 Nepal 7.4 42.1 272 1,550 2.0 2.0 1,550 2005 6.8 6.8
143 Madagascar 5.0 17.2 271 923 -1.6 -0.7 1,450 1975 14.7 18.5
144 Cameroon 16.9 37.5 1,034 2,299 -0.4 0.6 3,175 1986 4.7 2.0
145 Papua New Guinea 4.9 15.1d 840 2,563d 0.5 0.2 2,986 1994 10.1 1.7
146 Haiti 4.3 14.2d 500 1,663d -2.2 -2.0 3,151 1980 19.6 15.7
147 Sudan 27.5 75.5d 760 2,083d 1.3 3.5 2,083 2005 41.8 8.5
148 Kenya 18.7 42.5 547 1,240 0.1 -0.1 1,263 1990 11.6 10.3
149 Djibouti 0.7 1.7d 894 2,178d -2.7b -2.7 3,200b 1990 .. ..
150 Timor-Leste 0.3 .. 358 .. .. .. .. .. .. ..
151 Zimbabwe 3.4 26.5 259 2,038 -0.5 -2.1 3,228 1998 36.1 ..
152 Togo 2.2 9.3d 358 1,506d -1.1 (.) 2,133 1980 5.7 6.8
153 Yemen 15.1 19.5 718 930 1.5b 1.5 943b 2002 20.8 ..
154 Uganda 8.7 41.9d 303 1,454d 2.4b 3.2 1,454b 2005 7.1 8.2
155 Gambia 0.5 2.9d 304 1,921d -0.1 0.1 1,932 1984 5.0 3.2
LOWHUMANDEVELOPMENT
156 Senegal 8.2 20.9 707 1,792 (.) 1.2 1,792 2005 3.7 1.7
157 Eritrea 1.0 4.9d 220 1,109d .. 0.3b 1,435b 1997 .. ..
158 Nigeria 99.0 148.3 752 1,128 -0.1 0.8 1,177 1977 23.5 13.5
159 Tanzania (United Republic of) 12.1 28.5 316 744 1.4b 1.7 744b 2005 13.8 8.6
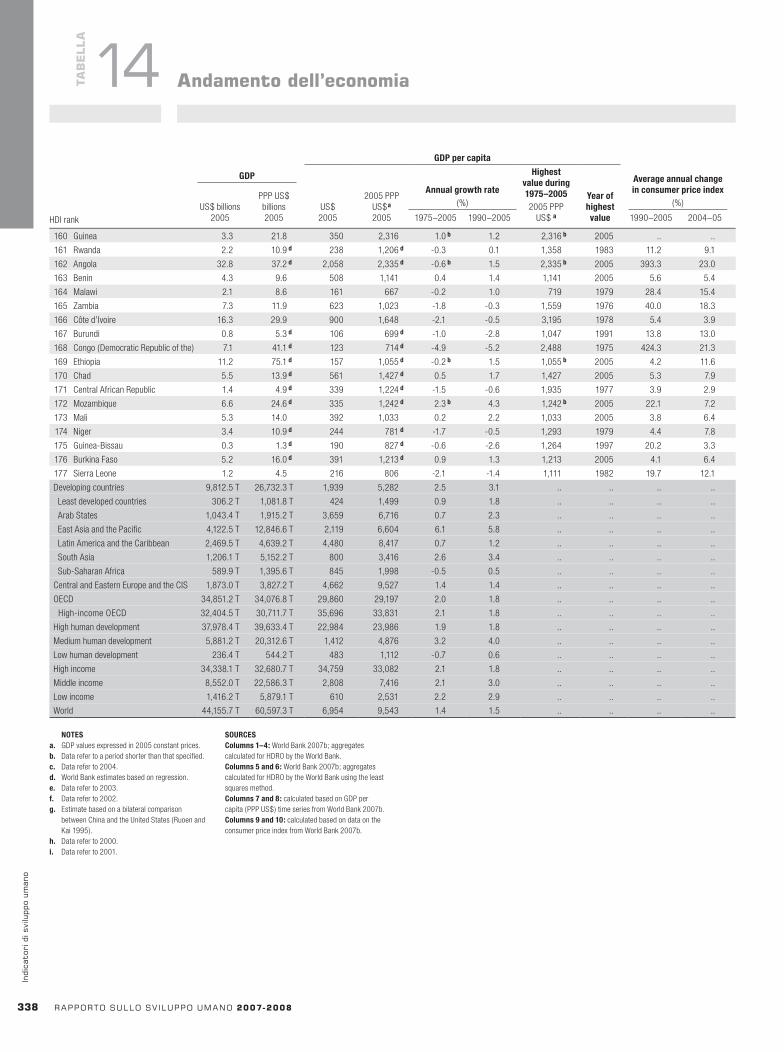
HDI rank Surveyyear
MDGShareofincomeorexpenditure
(%)
Inequalitymeasures
Richest10%topoorest
10%a
Richest20%topoorest
20%a GiniindexbPoorest10% Poorest20% Richest20% Richest10%HDI rank
GDP
GDPpercapita
Averageannualchangeinconsumerpriceindex
(%)US$ 2005
2005 PPP US$a 2005
Annualgrowthrate(%)
Highestvalueduring1975–20052005 PPP
US$ a
Yearofhighestvalue
US$ billions 2005
PPP US$ billions 2005 1975–2005 1990–2005 1990–2005 2004–05
338 rapportosullosv iluppoumano2007-2008
indi
cato
rid
isvi
lupp
oum
ano
TaB
ELLa
14 andamentodell’economia
NOTESa. GDP values expressed in 2005 constant prices.b. Data refer to a period shorter than that specified.c. Data refer to 2004.d. World Bank estimates based on regression.e. Data refer to 2003.f. Data refer to 2002.g. Estimate based on a bilateral comparison
between China and the United States (Ruoen and Kai 1995).
h. Data refer to 2000.i. Data refer to 2001.
SOURCESColumns1–4: World Bank 2007b; aggregates calculated for HDRO by the World Bank.Columns5and6: World Bank 2007b; aggregates calculated for HDRO by the World Bank using the least squares method.Columns7and8: calculated based on GDP per capita (PPP US$) time series from World Bank 2007b.Columns9and10: calculated based on data on the consumer price index from World Bank 2007b.
160 Guinea 3.3 21.8 350 2,316 1.0b 1.2 2,316b 2005 .. ..
161 Rwanda 2.2 10.9d 238 1,206d -0.3 0.1 1,358 1983 11.2 9.1
162 Angola 32.8 37.2d 2,058 2,335d -0.6b 1.5 2,335b 2005 393.3 23.0
163 Benin 4.3 9.6 508 1,141 0.4 1.4 1,141 2005 5.6 5.4
164 Malawi 2.1 8.6 161 667 -0.2 1.0 719 1979 28.4 15.4
165 Zambia 7.3 11.9 623 1,023 -1.8 -0.3 1,559 1976 40.0 18.3
166 Côte d’Ivoire 16.3 29.9 900 1,648 -2.1 -0.5 3,195 1978 5.4 3.9
167 Burundi 0.8 5.3d 106 699d -1.0 -2.8 1,047 1991 13.8 13.0
168 Congo (Democratic Republic of the) 7.1 41.1d 123 714d -4.9 -5.2 2,488 1975 424.3 21.3
169 Ethiopia 11.2 75.1d 157 1,055d -0.2b 1.5 1,055b 2005 4.2 11.6
170 Chad 5.5 13.9d 561 1,427d 0.5 1.7 1,427 2005 5.3 7.9
171 Central African Republic 1.4 4.9d 339 1,224d -1.5 -0.6 1,935 1977 3.9 2.9
172 Mozambique 6.6 24.6d 335 1,242d 2.3b 4.3 1,242b 2005 22.1 7.2
173 Mali 5.3 14.0 392 1,033 0.2 2.2 1,033 2005 3.8 6.4
174 Niger 3.4 10.9d 244 781d -1.7 -0.5 1,293 1979 4.4 7.8
175 Guinea-Bissau 0.3 1.3d 190 827d -0.6 -2.6 1,264 1997 20.2 3.3
176 Burkina Faso 5.2 16.0d 391 1,213d 0.9 1.3 1,213 2005 4.1 6.4
177 Sierra Leone 1.2 4.5 216 806 -2.1 -1.4 1,111 1982 19.7 12.1
Developing countries 9,812.5 T 26,732.3 T 1,939 5,282 2.5 3.1 .. .. .. ..
Least developed countries 306.2 T 1,081.8 T 424 1,499 0.9 1.8 .. .. .. ..
Arab States 1,043.4 T 1,915.2 T 3,659 6,716 0.7 2.3 .. .. .. ..
East Asia and the Pacific 4,122.5 T 12,846.6 T 2,119 6,604 6.1 5.8 .. .. .. ..
Latin America and the Caribbean 2,469.5 T 4,639.2 T 4,480 8,417 0.7 1.2 .. .. .. ..
South Asia 1,206.1 T 5,152.2 T 800 3,416 2.6 3.4 .. .. .. ..
Sub-Saharan Africa 589.9 T 1,395.6 T 845 1,998 -0.5 0.5 .. .. .. ..
Central and Eastern Europe and the CIS 1,873.0 T 3,827.2 T 4,662 9,527 1.4 1.4 .. .. .. ..
OECD 34,851.2 T 34,076.8 T 29,860 29,197 2.0 1.8 .. .. .. ..
High-income OECD 32,404.5 T 30,711.7 T 35,696 33,831 2.1 1.8 .. .. .. ..
High human development 37,978.4 T 39,633.4 T 22,984 23,986 1.9 1.8 .. .. .. ..
Medium human development 5,881.2 T 20,312.6 T 1,412 4,876 3.2 4.0 .. .. .. ..
Low human development 236.4 T 544.2 T 483 1,112 -0.7 0.6 .. .. .. ..
High income 34,338.1 T 32,680.7 T 34,759 33,082 2.1 1.8 .. .. .. ..
Middle income 8,552.0 T 22,586.3 T 2,808 7,416 2.1 3.0 .. .. .. ..
Low income 1,416.2 T 5,879.1 T 610 2,531 2.2 2.9 .. .. .. ..
World 44,155.7 T 60,597.3 T 6,954 9,543 1.4 1.5 .. .. .. ..

HDI rank Surveyyear
MDGShareofincomeorexpenditure
(%)
Inequalitymeasures
Richest10%topoorest
10%a
Richest20%topoorest
20%a GiniindexbPoorest10% Poorest20% Richest20% Richest10%
rapportosullosv iluppoumano2007-2008 33�
indicatoridisviluppoumano
TaB
ELLa
15 …peravereaccessoallerisorsenecessarieperunostandarddivitadignitoso…
Disuguaglianzadiredditoediconsumo
HIGHHUMANDEVELOPMENT
1 Iceland .. .. .. .. .. .. .. ..
2 Norway 2000c 3.9 9.6 37.2 23.4 6.1 3.9 25.8
3 Australia 1994c 2.0 5.9 41.3 25.4 12.5 7.0 35.2
4 Canada 2000c 2.6 7.2 39.9 24.8 9.4 5.5 32.6
5 Ireland 2000c 2.9 7.4 42.0 27.2 9.4 5.6 34.3
6 Sweden 2000c 3.6 9.1 36.6 22.2 6.2 4.0 25.0
7 Switzerland 2000c 2.9 7.6 41.3 25.9 9.0 5.5 33.7
8 Japan 1993c 4.8 10.6 35.7 21.7 4.5 3.4 24.9
9 Netherlands 1999c 2.5 7.6 38.7 22.9 9.2 5.1 30.9
10 France 1995c 2.8 7.2 40.2 25.1 9.1 5.6 32.7
11 Finland 2000c 4.0 9.6 36.7 22.6 5.6 3.8 26.9
12 United States 2000c 1.9 5.4 45.8 29.9 15.9 8.4 40.8
13 Spain 2000c 2.6 7.0 42.0 26.6 10.3 6.0 34.7
14 Denmark 1997c 2.6 8.3 35.8 21.3 8.1 4.3 24.7
15 Austria 2000c 3.3 8.6 37.8 23.0 6.9 4.4 29.1
16 United Kingdom 1999c 2.1 6.1 44.0 28.5 13.8 7.2 36.0
17 Belgium 2000c 3.4 8.5 41.4 28.1 8.2 4.9 33.0
18 Luxembourg .. .. .. .. .. .. .. ..
19 New Zealand 1997c 2.2 6.4 43.8 27.8 12.5 6.8 36.2
20 Italy 2000c 2.3 6.5 42.0 26.8 11.6 6.5 36.0
21 Hong Kong, China (SAR) 1996c 2.0 5.3 50.7 34.9 17.8 9.7 43.4
22 Germany 2000c 3.2 8.5 36.9 22.1 6.9 4.3 28.3
23 Israel 2001c 2.1 5.7 44.9 28.8 13.4 7.9 39.2
24 Greece 2000c 2.5 6.7 41.5 26.0 10.2 6.2 34.3
25 Singapore 1998c 1.9 5.0 49.0 32.8 17.7 9.7 42.5
26 Korea (Republic of) 1998c 2.9 7.9 37.5 22.5 7.8 4.7 31.6
27 Slovenia 1998d 3.6 9.1 35.7 21.4 5.9 3.9 28.4
28 Cyprus .. .. .. .. .. .. .. ..
29 Portugal 1997c 2.0 5.8 45.9 29.8 15.0 8.0 38.5
30 Brunei Darussalam .. .. .. .. .. .. .. ..
31 Barbados .. .. .. .. .. .. .. ..
32 Czech Republic 1996c 4.3 10.3 35.9 22.4 5.2 3.5 25.4
33 Kuwait .. .. .. .. .. .. .. ..
34 Malta .. .. .. .. .. .. .. ..
35 Qatar .. .. .. .. .. .. .. ..
36 Hungary 2002d 4.0 9.5 36.5 22.2 5.5 3.8 26.9
37 Poland 2002d 3.1 7.5 42.2 27.0 8.8 5.6 34.5
38 Argentinae 2004c 0.9 3.1 55.4 38.2 40.9 17.8 51.3
39 United Arab Emirates .. .. .. .. .. .. .. ..
40 Chile 2003c 1.4 3.8 60.0 45.0 33.0 15.7 54.9
41 Bahrain .. .. .. .. .. .. .. ..
42 Slovakia 1996c 3.1 8.8 34.8 20.9 6.7 4.0 25.8
43 Lithuania 2003d 2.7 6.8 43.2 27.7 10.4 6.3 36.0
44 Estonia 2003d 2.5 6.7 42.8 27.6 10.8 6.4 35.8
45 Latvia 2003d 2.5 6.6 44.7 29.1 11.6 6.8 37.7
46 Uruguaye 2003c 1.9 5.0 50.5 34.0 17.9 10.2 44.9
47 Croatia 2001d 3.4 8.3 39.6 24.5 7.3 4.8 29.0
48 Costa Rica 2003c 1.0 3.5 54.1 37.4 37.8 15.6 49.8
49 Bahamas .. .. .. .. .. .. .. ..
50 Seychelles .. .. .. .. .. .. .. ..
51 Cuba .. .. .. .. .. .. .. ..
52 Mexico 2004d 1.6 4.3 55.1 39.4 24.6 12.8 46.1
53 Bulgaria 2003d 3.4 8.7 38.3 23.9 7.0 4.4 29.2
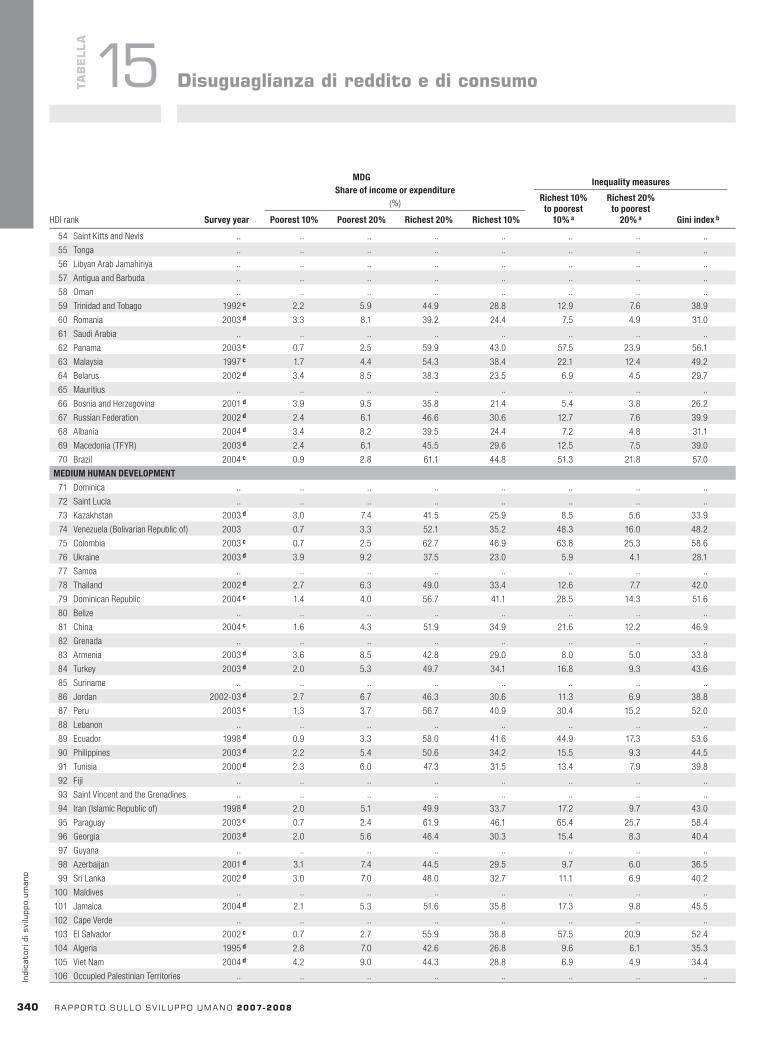
HDI rank Surveyyear
MDGShareofincomeorexpenditure
(%)
Inequalitymeasures
Richest10%topoorest
10%a
Richest20%topoorest
20%a GiniindexbPoorest10% Poorest20% Richest20% Richest10%HDI rank Surveyyear
MDGShareofincomeorexpenditure
(%)
Inequalitymeasures
Richest10%topoorest
10%a
Richest20%topoorest
20%a GiniindexbPoorest10% Poorest20% Richest20% Richest10%
340 rapportosullosv iluppoumano2007-2008
indi
cato
rid
isvi
lupp
oum
ano
TaB
ELLa
15 Disuguaglianzadiredditoediconsumo
54 Saint Kitts and Nevis .. .. .. .. .. .. .. ..
55 Tonga .. .. .. .. .. .. .. ..
56 Libyan Arab Jamahiriya .. .. .. .. .. .. .. ..
57 Antigua and Barbuda .. .. .. .. .. .. .. ..
58 Oman .. .. .. .. .. .. .. ..
59 Trinidad and Tobago 1992c 2.2 5.9 44.9 28.8 12.9 7.6 38.9
60 Romania 2003d 3.3 8.1 39.2 24.4 7.5 4.9 31.0
61 Saudi Arabia .. .. .. .. .. .. .. ..
62 Panama 2003c 0.7 2.5 59.9 43.0 57.5 23.9 56.1
63 Malaysia 1997c 1.7 4.4 54.3 38.4 22.1 12.4 49.2
64 Belarus 2002d 3.4 8.5 38.3 23.5 6.9 4.5 29.7
65 Mauritius .. .. .. .. .. .. .. ..
66 Bosnia and Herzegovina 2001d 3.9 9.5 35.8 21.4 5.4 3.8 26.2
67 Russian Federation 2002d 2.4 6.1 46.6 30.6 12.7 7.6 39.9
68 Albania 2004d 3.4 8.2 39.5 24.4 7.2 4.8 31.1
69 Macedonia (TFYR) 2003d 2.4 6.1 45.5 29.6 12.5 7.5 39.0
70 Brazil 2004c 0.9 2.8 61.1 44.8 51.3 21.8 57.0
MEDIUMHUMANDEVELOPMENT
71 Dominica .. .. .. .. .. .. .. ..
72 Saint Lucia .. .. .. .. .. .. .. ..
73 Kazakhstan 2003d 3.0 7.4 41.5 25.9 8.5 5.6 33.9
74 Venezuela (Bolivarian Republic of) 2003 0.7 3.3 52.1 35.2 48.3 16.0 48.2
75 Colombia 2003c 0.7 2.5 62.7 46.9 63.8 25.3 58.6
76 Ukraine 2003d 3.9 9.2 37.5 23.0 5.9 4.1 28.1
77 Samoa .. .. .. .. .. .. .. ..
78 Thailand 2002d 2.7 6.3 49.0 33.4 12.6 7.7 42.0
79 Dominican Republic 2004c 1.4 4.0 56.7 41.1 28.5 14.3 51.6
80 Belize .. .. .. .. .. .. .. ..
81 China 2004c 1.6 4.3 51.9 34.9 21.6 12.2 46.9
82 Grenada .. .. .. .. .. .. .. ..
83 Armenia 2003d 3.6 8.5 42.8 29.0 8.0 5.0 33.8
84 Turkey 2003d 2.0 5.3 49.7 34.1 16.8 9.3 43.6
85 Suriname .. .. .. .. .. .. .. ..
86 Jordan 2002-03d 2.7 6.7 46.3 30.6 11.3 6.9 38.8
87 Peru 2003c 1.3 3.7 56.7 40.9 30.4 15.2 52.0
88 Lebanon .. .. .. .. .. .. .. ..
89 Ecuador 1998d 0.9 3.3 58.0 41.6 44.9 17.3 53.6
90 Philippines 2003d 2.2 5.4 50.6 34.2 15.5 9.3 44.5
91 Tunisia 2000d 2.3 6.0 47.3 31.5 13.4 7.9 39.8
92 Fiji .. .. .. .. .. .. .. ..
93 Saint Vincent and the Grenadines .. .. .. .. .. .. .. ..
94 Iran ( Islamic Republic of) 1998d 2.0 5.1 49.9 33.7 17.2 9.7 43.0
95 Paraguay 2003c 0.7 2.4 61.9 46.1 65.4 25.7 58.4
96 Georgia 2003d 2.0 5.6 46.4 30.3 15.4 8.3 40.4
97 Guyana .. .. .. .. .. .. .. ..
98 Azerbaijan 2001d 3.1 7.4 44.5 29.5 9.7 6.0 36.5
99 Sri Lanka 2002d 3.0 7.0 48.0 32.7 11.1 6.9 40.2
100 Maldives .. .. .. .. .. .. .. ..
101 Jamaica 2004d 2.1 5.3 51.6 35.8 17.3 9.8 45.5
102 Cape Verde .. .. .. .. .. .. .. ..
103 El Salvador 2002c 0.7 2.7 55.9 38.8 57.5 20.9 52.4
104 Algeria 1995d 2.8 7.0 42.6 26.8 9.6 6.1 35.3
105 Viet Nam 2004d 4.2 9.0 44.3 28.8 6.9 4.9 34.4
106 Occupied Palestinian Territories .. .. .. .. .. .. .. ..
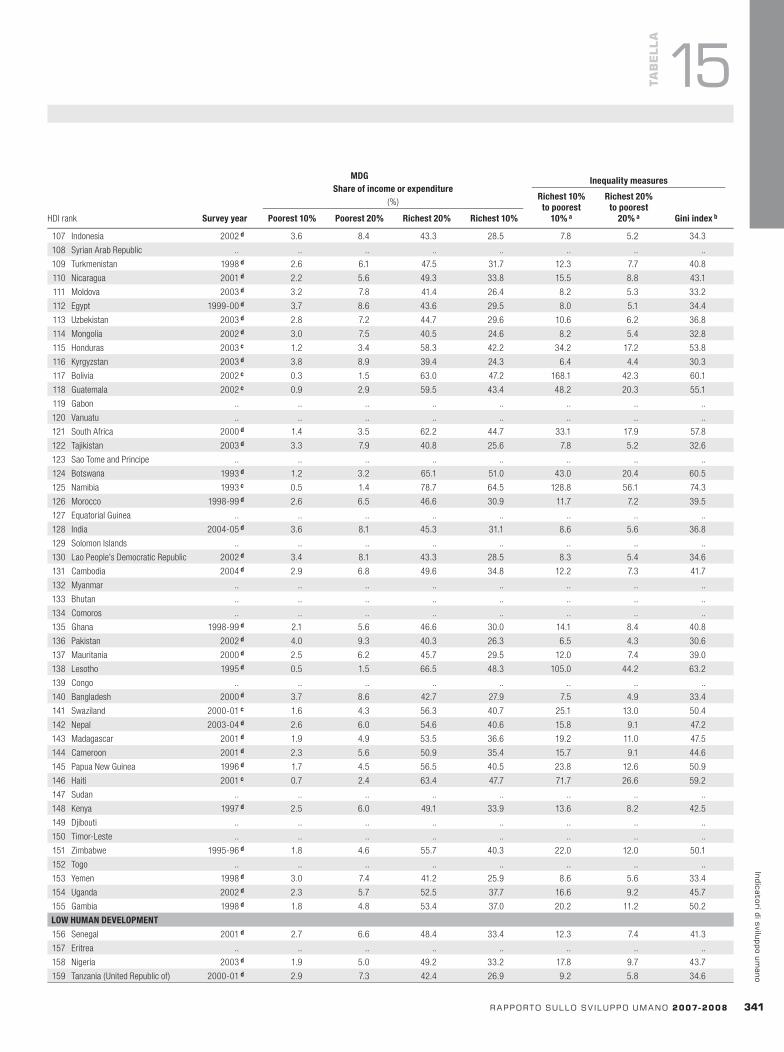
HDI rank Surveyyear
MDGShareofincomeorexpenditure
(%)
Inequalitymeasures
Richest10%topoorest
10%a
Richest20%topoorest
20%a GiniindexbPoorest10% Poorest20% Richest20% Richest10%
rapportosullosv iluppoumano2007-2008 341
indicatoridisviluppoumano
TaB
ELLa
15
107 Indonesia 2002d 3.6 8.4 43.3 28.5 7.8 5.2 34.3
108 Syrian Arab Republic .. .. .. .. .. .. .. ..
109 Turkmenistan 1998d 2.6 6.1 47.5 31.7 12.3 7.7 40.8
110 Nicaragua 2001d 2.2 5.6 49.3 33.8 15.5 8.8 43.1
111 Moldova 2003d 3.2 7.8 41.4 26.4 8.2 5.3 33.2
112 Egypt 1999-00d 3.7 8.6 43.6 29.5 8.0 5.1 34.4
113 Uzbekistan 2003d 2.8 7.2 44.7 29.6 10.6 6.2 36.8
114 Mongolia 2002d 3.0 7.5 40.5 24.6 8.2 5.4 32.8
115 Honduras 2003c 1.2 3.4 58.3 42.2 34.2 17.2 53.8
116 Kyrgyzstan 2003d 3.8 8.9 39.4 24.3 6.4 4.4 30.3
117 Bolivia 2002c 0.3 1.5 63.0 47.2 168.1 42.3 60.1
118 Guatemala 2002c 0.9 2.9 59.5 43.4 48.2 20.3 55.1
119 Gabon .. .. .. .. .. .. .. ..
120 Vanuatu .. .. .. .. .. .. .. ..
121 South Africa 2000d 1.4 3.5 62.2 44.7 33.1 17.9 57.8
122 Tajikistan 2003d 3.3 7.9 40.8 25.6 7.8 5.2 32.6
123 Sao Tome and Principe .. .. .. .. .. .. .. ..
124 Botswana 1993d 1.2 3.2 65.1 51.0 43.0 20.4 60.5
125 Namibia 1993c 0.5 1.4 78.7 64.5 128.8 56.1 74.3
126 Morocco 1998-99d 2.6 6.5 46.6 30.9 11.7 7.2 39.5
127 Equatorial Guinea .. .. .. .. .. .. .. ..
128 India 2004-05d 3.6 8.1 45.3 31.1 8.6 5.6 36.8
129 Solomon Islands .. .. .. .. .. .. .. ..
130 Lao People’s Democratic Republic 2002d 3.4 8.1 43.3 28.5 8.3 5.4 34.6
131 Cambodia 2004d 2.9 6.8 49.6 34.8 12.2 7.3 41.7
132 Myanmar .. .. .. .. .. .. .. ..
133 Bhutan .. .. .. .. .. .. .. ..
134 Comoros .. .. .. .. .. .. .. ..
135 Ghana 1998-99d 2.1 5.6 46.6 30.0 14.1 8.4 40.8
136 Pakistan 2002d 4.0 9.3 40.3 26.3 6.5 4.3 30.6
137 Mauritania 2000d 2.5 6.2 45.7 29.5 12.0 7.4 39.0
138 Lesotho 1995d 0.5 1.5 66.5 48.3 105.0 44.2 63.2
139 Congo .. .. .. .. .. .. .. ..
140 Bangladesh 2000d 3.7 8.6 42.7 27.9 7.5 4.9 33.4
141 Swaziland 2000-01c 1.6 4.3 56.3 40.7 25.1 13.0 50.4
142 Nepal 2003-04d 2.6 6.0 54.6 40.6 15.8 9.1 47.2
143 Madagascar 2001d 1.9 4.9 53.5 36.6 19.2 11.0 47.5
144 Cameroon 2001d 2.3 5.6 50.9 35.4 15.7 9.1 44.6
145 Papua New Guinea 1996d 1.7 4.5 56.5 40.5 23.8 12.6 50.9
146 Haiti 2001c 0.7 2.4 63.4 47.7 71.7 26.6 59.2
147 Sudan .. .. .. .. .. .. .. ..
148 Kenya 1997d 2.5 6.0 49.1 33.9 13.6 8.2 42.5
149 Djibouti .. .. .. .. .. .. .. ..
150 Timor-Leste .. .. .. .. .. .. .. ..
151 Zimbabwe 1995-96d 1.8 4.6 55.7 40.3 22.0 12.0 50.1
152 Togo .. .. .. .. .. .. .. ..
153 Yemen 1998d 3.0 7.4 41.2 25.9 8.6 5.6 33.4
154 Uganda 2002d 2.3 5.7 52.5 37.7 16.6 9.2 45.7
155 Gambia 1998d 1.8 4.8 53.4 37.0 20.2 11.2 50.2
LOWHUMANDEVELOPMENT
156 Senegal 2001d 2.7 6.6 48.4 33.4 12.3 7.4 41.3
157 Eritrea .. .. .. .. .. .. .. ..
158 Nigeria 2003d 1.9 5.0 49.2 33.2 17.8 9.7 43.7
159 Tanzania (United Republic of) 2000-01d 2.9 7.3 42.4 26.9 9.2 5.8 34.6

HDI rank
Importsofgoodsandservices
(% of GDP)
Exportsofgoodsandservices
(% of GDP)
Primaryexportsa
(% of merchandise exports)
Manufacturedexports(% of merchandise
exports)
High-technologyexports
(% of manufactured exports)
Termsoftrade
(2000=100)b
1990 2005 1990 2005 1990 2005 1990 2005 1990 2005 2004–05cHDI rank Surveyyear
MDGShareofincomeorexpenditure
(%)
Inequalitymeasures
Richest10%topoorest
10%a
Richest20%topoorest
20%a GiniindexbPoorest10% Poorest20% Richest20% Richest10%
342 rapportosullosv iluppoumano2007-2008
indi
cato
rid
isvi
lupp
oum
ano
TaB
ELLa
15 Disuguaglianzadiredditoediconsumo
NOTES Because the underlying household surveys differ
in method and in the type of data collected, the distribution data are not strictly comparable across countries.
a. Data show the ratio of the income or expenditure share of the richest group to that of the poorest. Because of rounding, results may differ from ratios calculated using the income or expenditure shares in columns 2-5.
b. A value of 0 represents absolute equality, and a value of 100 absolute inequality.
c. Data refer to income shares by percentiles of population, ranked by per capita income.
d. Data refer to expenditure shares by percentiles of population, ranked by per capita expenditure.
e. Data refer to urban areas only.
SOURCESColumns1–5and8: World Bank 2007b.Columns6and7: calculated based on data on income or expenditure from World Bank 2007b.
160 Guinea 2003d 2.9 7.0 46.1 30.7 10.5 6.6 38.6
161 Rwanda 2000d 2.1 5.3 53.0 38.2 18.6 9.9 46.8
162 Angola .. .. .. .. .. .. .. ..
163 Benin 2003d 3.1 7.4 44.5 29.0 9.4 6.0 36.5
164 Malawi 2004-05d 2.9 7.0 46.6 31.8 10.9 6.7 39.0
165 Zambia 2004d 1.2 3.6 55.1 38.8 32.3 15.3 50.8
166 Côte d’Ivoire 2002d 2.0 5.2 50.7 34.0 16.6 9.7 44.6
167 Burundi 1998d 1.7 5.1 48.0 32.8 19.3 9.5 42.4
168 Congo (Democratic Republic of the) .. .. .. .. .. .. .. ..
169 Ethiopia 1999-00d 3.9 9.1 39.4 25.5 6.6 4.3 30.0
170 Chad .. .. .. .. .. .. .. ..
171 Central African Republic 1993d 0.7 2.0 65.0 47.7 69.2 32.7 61.3
172 Mozambique 2002-03d 2.1 5.4 53.6 39.4 18.8 9.9 47.3
173 Mali 2001d 2.4 6.1 46.6 30.2 12.5 7.6 40.1
174 Niger 1995d 0.8 2.6 53.3 35.4 46.0 20.7 50.5
175 Guinea-Bissau 1993d 2.1 5.2 53.4 39.3 19.0 10.3 47.0
176 Burkina Faso 2003d 2.8 6.9 47.2 32.2 11.6 6.9 39.5
177 Sierra Leone 1989d 0.5 1.1 63.4 43.6 87.2 57.6 62.9
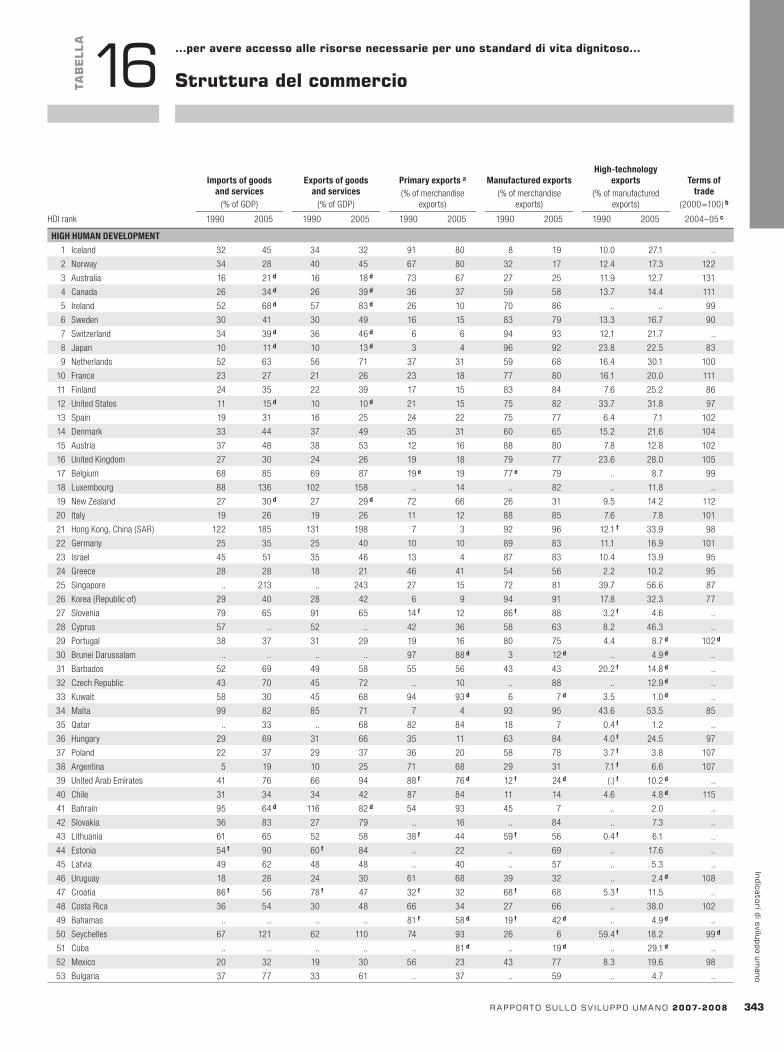
HDI rank
Importsofgoodsandservices
(% of GDP)
Exportsofgoodsandservices
(% of GDP)
Primaryexportsa
(% of merchandise exports)
Manufacturedexports(% of merchandise
exports)
High-technologyexports
(% of manufactured exports)
Termsoftrade
(2000=100)b
1990 2005 1990 2005 1990 2005 1990 2005 1990 2005 2004–05c
rapportosullosv iluppoumano2007-2008 343
indicatoridisviluppoumano
TaB
ELLa
16 …peravereaccessoallerisorsenecessarieperunostandarddivitadignitoso…
Strutturadelcommercio
HIGHHUMANDEVELOPMENT
1 Iceland 32 45 34 32 91 80 8 19 10.0 27.1 ..
2 Norway 34 28 40 45 67 80 32 17 12.4 17.3 122
3 Australia 16 21d 16 18d 73 67 27 25 11.9 12.7 131
4 Canada 26 34d 26 39d 36 37 59 58 13.7 14.4 111
5 Ireland 52 68d 57 83d 26 10 70 86 .. .. 99
6 Sweden 30 41 30 49 16 15 83 79 13.3 16.7 90
7 Switzerland 34 39d 36 46d 6 6 94 93 12.1 21.7 ..
8 Japan 10 11d 10 13d 3 4 96 92 23.8 22.5 83
9 Netherlands 52 63 56 71 37 31 59 68 16.4 30.1 100
10 France 23 27 21 26 23 18 77 80 16.1 20.0 111
11 Finland 24 35 22 39 17 15 83 84 7.6 25.2 86
12 United States 11 15d 10 10d 21 15 75 82 33.7 31.8 97
13 Spain 19 31 16 25 24 22 75 77 6.4 7.1 102
14 Denmark 33 44 37 49 35 31 60 65 15.2 21.6 104
15 Austria 37 48 38 53 12 16 88 80 7.8 12.8 102
16 United Kingdom 27 30 24 26 19 18 79 77 23.6 28.0 105
17 Belgium 68 85 69 87 19e 19 77e 79 .. 8.7 99
18 Luxembourg 88 136 102 158 .. 14 .. 82 .. 11.8 ..
19 New Zealand 27 30d 27 29d 72 66 26 31 9.5 14.2 112
20 Italy 19 26 19 26 11 12 88 85 7.6 7.8 101
21 Hong Kong, China (SAR) 122 185 131 198 7 3 92 96 12.1f 33.9 98
22 Germany 25 35 25 40 10 10 89 83 11.1 16.9 101
23 Israel 45 51 35 46 13 4 87 83 10.4 13.9 95
24 Greece 28 28 18 21 46 41 54 56 2.2 10.2 95
25 Singapore .. 213 .. 243 27 15 72 81 39.7 56.6 87
26 Korea (Republic of) 29 40 28 42 6 9 94 91 17.8 32.3 77
27 Slovenia 79 65 91 65 14f 12 86f 88 3.2f 4.6 ..
28 Cyprus 57 .. 52 .. 42 36 58 63 8.2 46.3 ..
29 Portugal 38 37 31 29 19 16 80 75 4.4 8.7d 102d
30 Brunei Darussalam .. .. .. .. 97 88d 3 12d .. 4.9d ..
31 Barbados 52 69 49 58 55 56 43 43 20.2f 14.8d ..
32 Czech Republic 43 70 45 72 .. 10 .. 88 .. 12.9d ..
33 Kuwait 58 30 45 68 94 93d 6 7d 3.5 1.0d ..
34 Malta 99 82 85 71 7 4 93 95 43.6 53.5 85
35 Qatar .. 33 .. 68 82 84 18 7 0.4f 1.2 ..
36 Hungary 29 69 31 66 35 11 63 84 4.0f 24.5 97
37 Poland 22 37 29 37 36 20 58 78 3.7f 3.8 107
38 Argentina 5 19 10 25 71 68 29 31 7.1f 6.6 107
39 United Arab Emirates 41 76 66 94 88f 76d 12f 24d (.)f 10.2d ..
40 Chile 31 34 34 42 87 84 11 14 4.6 4.8d 115
41 Bahrain 95 64d 116 82d 54 93 45 7 .. 2.0 ..
42 Slovakia 36 83 27 79 .. 16 .. 84 .. 7.3 ..
43 Lithuania 61 65 52 58 38f 44 59f 56 0.4f 6.1 ..
44 Estonia 54f 90 60f 84 .. 22 .. 69 .. 17.6 ..
45 Latvia 49 62 48 48 .. 40 .. 57 .. 5.3 ..
46 Uruguay 18 28 24 30 61 68 39 32 .. 2.4d 108
47 Croatia 86f 56 78f 47 32f 32 68f 68 5.3f 11.5 ..
48 Costa Rica 36 54 30 48 66 34 27 66 .. 38.0 102
49 Bahamas .. .. .. .. 81f 58d 19f 42d .. 4.9d ..
50 Seychelles 67 121 62 110 74 93 26 6 59.4f 18.2 99d
51 Cuba .. .. .. .. .. 81d .. 19d .. 29.1d ..
52 Mexico 20 32 19 30 56 23 43 77 8.3 19.6 98
53 Bulgaria 37 77 33 61 .. 37 .. 59 .. 4.7 ..
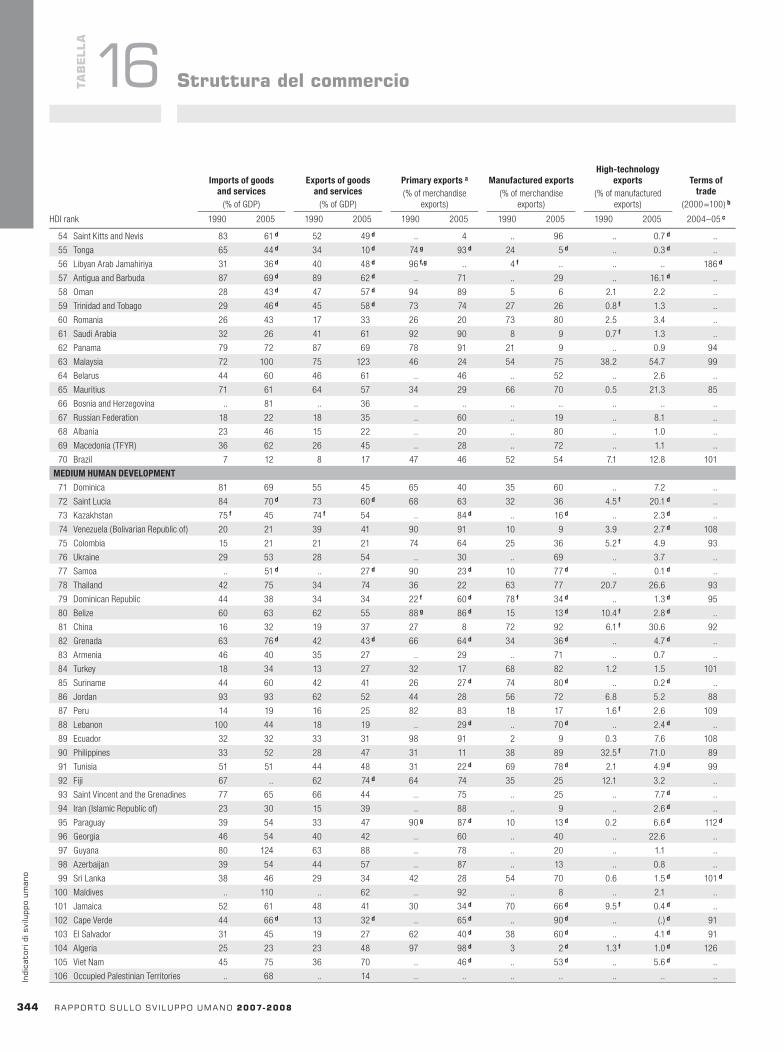
HDI rank
Importsofgoodsandservices
(% of GDP)
Exportsofgoodsandservices
(% of GDP)
Primaryexportsa
(% of merchandise exports)
Manufacturedexports(% of merchandise
exports)
High-technologyexports
(% of manufactured exports)
Termsoftrade
(2000=100)b
1990 2005 1990 2005 1990 2005 1990 2005 1990 2005 2004–05cHDI rank
Importsofgoodsandservices
(% of GDP)
Exportsofgoodsandservices
(% of GDP)
Primaryexportsa
(% of merchandise exports)
Manufacturedexports(% of merchandise
exports)
High-technologyexports
(% of manufactured exports)
Termsoftrade
(2000=100)b
1990 2005 1990 2005 1990 2005 1990 2005 1990 2005 2004–05c
344 rapportosullosv iluppoumano2007-2008
indi
cato
rid
isvi
lupp
oum
ano
TaB
ELLa
16 Strutturadelcommercio
54 Saint Kitts and Nevis 83 61d 52 49d .. 4 .. 96 .. 0.7d ..
55 Tonga 65 44d 34 10d 74g 93d 24 5d .. 0.3d ..
56 Libyan Arab Jamahiriya 31 36d 40 48d 96f,g .. 4f .. .. .. 186d
57 Antigua and Barbuda 87 69d 89 62d .. 71 .. 29 .. 16.1d ..
58 Oman 28 43d 47 57d 94 89 5 6 2.1 2.2 ..
59 Trinidad and Tobago 29 46d 45 58d 73 74 27 26 0.8f 1.3 ..
60 Romania 26 43 17 33 26 20 73 80 2.5 3.4 ..
61 Saudi Arabia 32 26 41 61 92 90 8 9 0.7f 1.3 ..
62 Panama 79 72 87 69 78 91 21 9 .. 0.9 94
63 Malaysia 72 100 75 123 46 24 54 75 38.2 54.7 99
64 Belarus 44 60 46 61 .. 46 .. 52 .. 2.6 ..
65 Mauritius 71 61 64 57 34 29 66 70 0.5 21.3 85
66 Bosnia and Herzegovina .. 81 .. 36 .. .. .. .. .. .. ..
67 Russian Federation 18 22 18 35 .. 60 .. 19 .. 8.1 ..
68 Albania 23 46 15 22 .. 20 .. 80 .. 1.0 ..
69 Macedonia (TFYR) 36 62 26 45 .. 28 .. 72 .. 1.1 ..
70 Brazil 7 12 8 17 47 46 52 54 7.1 12.8 101
MEDIUMHUMANDEVELOPMENT
71 Dominica 81 69 55 45 65 40 35 60 .. 7.2 ..
72 Saint Lucia 84 70d 73 60d 68 63 32 36 4.5f 20.1d ..
73 Kazakhstan 75f 45 74f 54 .. 84d .. 16d .. 2.3d ..
74 Venezuela (Bolivarian Republic of) 20 21 39 41 90 91 10 9 3.9 2.7d 108
75 Colombia 15 21 21 21 74 64 25 36 5.2f 4.9 93
76 Ukraine 29 53 28 54 .. 30 .. 69 .. 3.7 ..
77 Samoa .. 51d .. 27d 90 23d 10 77d .. 0.1d ..
78 Thailand 42 75 34 74 36 22 63 77 20.7 26.6 93
79 Dominican Republic 44 38 34 34 22f 60d 78f 34d .. 1.3d 95
80 Belize 60 63 62 55 88g 86d 15 13d 10.4f 2.8d ..
81 China 16 32 19 37 27 8 72 92 6.1f 30.6 92
82 Grenada 63 76d 42 43d 66 64d 34 36d .. 4.7d ..
83 Armenia 46 40 35 27 .. 29 .. 71 .. 0.7 ..
84 Turkey 18 34 13 27 32 17 68 82 1.2 1.5 101
85 Suriname 44 60 42 41 26 27d 74 80d .. 0.2d ..
86 Jordan 93 93 62 52 44 28 56 72 6.8 5.2 88
87 Peru 14 19 16 25 82 83 18 17 1.6f 2.6 109
88 Lebanon 100 44 18 19 .. 29d .. 70d .. 2.4d ..
89 Ecuador 32 32 33 31 98 91 2 9 0.3 7.6 108
90 Philippines 33 52 28 47 31 11 38 89 32.5f 71.0 89
91 Tunisia 51 51 44 48 31 22d 69 78d 2.1 4.9d 99
92 Fiji 67 .. 62 74d 64 74 35 25 12.1 3.2 ..
93 Saint Vincent and the Grenadines 77 65 66 44 .. 75 .. 25 .. 7.7d ..
94 Iran ( Islamic Republic of) 23 30 15 39 .. 88 .. 9 .. 2.6d ..
95 Paraguay 39 54 33 47 90g 87d 10 13d 0.2 6.6d 112d
96 Georgia 46 54 40 42 .. 60 .. 40 .. 22.6 ..
97 Guyana 80 124 63 88 .. 78 .. 20 .. 1.1 ..
98 Azerbaijan 39 54 44 57 .. 87 .. 13 .. 0.8 ..
99 Sri Lanka 38 46 29 34 42 28 54 70 0.6 1.5d 101d
100 Maldives .. 110 .. 62 .. 92 .. 8 .. 2.1 ..
101 Jamaica 52 61 48 41 30 34d 70 66d 9.5f 0.4d ..
102 Cape Verde 44 66d 13 32d .. 65d .. 90d .. (.)d 91
103 El Salvador 31 45 19 27 62 40d 38 60d .. 4.1d 91
104 Algeria 25 23 23 48 97 98d 3 2d 1.3f 1.0d 126
105 Viet Nam 45 75 36 70 .. 46d .. 53d .. 5.6d ..
106 Occupied Palestinian Territories .. 68 .. 14 .. .. .. .. .. .. ..

HDI rank
Importsofgoodsandservices
(% of GDP)
Exportsofgoodsandservices
(% of GDP)
Primaryexportsa
(% of merchandise exports)
Manufacturedexports(% of merchandise
exports)
High-technologyexports
(% of manufactured exports)
Termsoftrade
(2000=100)b
1990 2005 1990 2005 1990 2005 1990 2005 1990 2005 2004–05c
rapportosullosv iluppoumano2007-2008 34�
indicatoridisviluppoumano
TaB
ELLa
16
107 Indonesia 24 29 25 34 65 53 35 47 1.2 16.3 104
108 Syrian Arab Republic 28 40 28 37 64 87d 36 11d .. 1.0d ..
109 Turkmenistan .. 48 .. 65 .. 92d .. 7d .. 4.9d ..
110 Nicaragua 46 58 25 28 92 89 8 11 .. 5.2 91
111 Moldova 51 91 48 53 .. 61 .. 39 .. 2.7 ..
112 Egypt 33 33 20 30 57 64d 42 31d .. 0.6d 107
113 Uzbekistan 48 30 29 40 .. .. .. .. .. .. ..
114 Mongolia 49 84 22 76 .. 79 .. 21 .. 0.1 ..
115 Honduras 40 61 37 41 91 64 9 36 .. 2.2d 90
116 Kyrgyzstan 50 58 29 39 .. 35 .. 27 .. 2.2 ..
117 Bolivia 24 33 23 36 95 89 5 11 6.8f 9.2d 108
118 Guatemala 25 30 21 16 76 43 24 57 .. 3.2 93
119 Gabon 31 39 46 59 .. 93d .. 7d .. 14.5d 125
120 Vanuatu 77 .. 49 .. 87g 92d 13 8d 19.8 1.2d ..
121 South Africa 19 29 24 27 29f,h 43h 29f,h 57h 6.8f 6.6 109
122 Tajikistan 35 73 28 54 .. 87d .. 13d .. 41.8d ..
123 Sao Tome and Principe 72 99 14 40 .. .. .. .. .. .. 137
124 Botswana 50 35 55 51 ..i 13d,i ..i 86d,i .. 0.2d 92
125 Namibia 67 45 52 46 ..i 58d,i ..i 41d,i .. 2.9d 97
126 Morocco 32 43 26 36 48 35 52 65 .. 10.1 100
127 Equatorial Guinea 70 .. 32 .. .. .. .. .. .. .. 124
128 India 9 24 7 21 28 29 70 70 2.4 4.9d 76
129 Solomon Islands 73 46d 47 48d 109f,g .. .. .. .. .. ..
130 Lao People’s Democratic Republic 25 31 12 27 .. .. .. .. .. .. ..
131 Cambodia 13 74 6 65 .. 3d .. 97d .. 0.2d ..
132 Myanmar 5 .. 3 .. 89f .. 11f .. 3.0f .. 102
133 Bhutan 31 55 27 27 58f .. 42f .. .. .. ..
134 Comoros 37 35 14 12 .. 89d .. 8d .. 0.5d 58
135 Ghana 26 62 17 36 92f 88d 8f 12d 2.1f 9.3d 123
136 Pakistan 23 20 16 15 21 18 79 82 0.4 1.6 75
137 Mauritania 61 95 46 36 .. .. .. .. .. .. 95
138 Lesotho 122 88 17 48 ..i ..i ..i ..i .. .. 91
139 Congo 46 55 54 82 .. .. .. .. .. .. 121
140 Bangladesh 14 23 6 17 22g 10d 77 90d 0.1 (.)d 88
141 Swaziland 87 95 75 88 ..i 23d,i ..i 76d,i .. 0.5d 94
142 Nepal 21 33 11 16 17g 26d 83 74d .. 0.1d ..
143 Madagascar 28 40 17 26 85 76d 14 22d 7.5 0.8d 82
144 Cameroon 17 25 20 23 91 85 9 3 3.1 2.0 112
145 Papua New Guinea 49 54d 41 45d 89 94d 10 6d .. 39.4d ..
146 Haiti 20 45d 18 16d 15 .. 85 .. 13.8 .. 87
147 Sudan .. 28 .. 18 98f,g 99 2f (.) .. (.)d 121
148 Kenya 31 35 26 27 70 79d 30 21d 3.9 3.1d ..
149 Djibouti 78 54 54 37 44 .. 8 .. .. .. ..
150 Timor-Leste .. .. .. .. .. .. .. .. .. .. ..
151 Zimbabwe 23 53 23 43 68 72d 31 28d 1.5 0.9d 104
152 Togo 45 47 33 34 89 42 9 58 0.6f 0.1 30
153 Yemen 20 38 14 46 85f 96 15f 4 .. 5.3 ..
154 Uganda 19 27 7 13 .. 83 .. 17 .. 14.0 88
155 Gambia 72 65 60 45 .. 84g .. 17 .. 5.9 115
LOWHUMANDEVELOPMENT
156 Senegal 30 42 25 27 77 55 23 43 .. 11.7 96
157 Eritrea 45f 56 11f 9 .. .. .. .. .. .. 93
158 Nigeria 29 35 43 53 99f 98d 1f 2d .. 1.7d 122
159 Tanzania (United Republic of) 37 26 13 17 .. 85 .. 14 .. 0.8 100
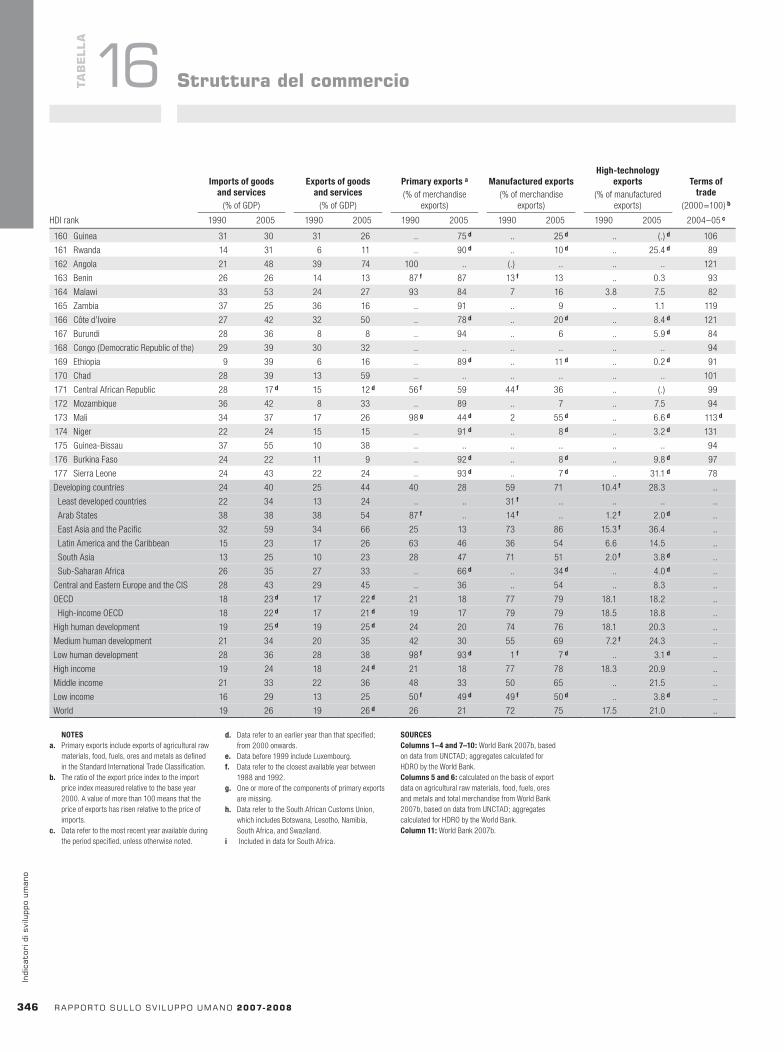
HDI rank
MDGNetofficialdevelopment
assistance(ODA)disbursed
ODApercapitaofdonorcountry
(2005 US$)
MDGODAtoleast
developedcountriesb
(% of total)
MDGODAtobasic
socialservicesc
(% of total allocable by sector)
MDGUntiedbilateralODA
(% of total)
Totala
(US$ millions) As%ofGNI
2005 1990d 2005 1990 2005 1990 2005 1996/97e 2004/05e 1990 2005HDI rank
Importsofgoodsandservices
(% of GDP)
Exportsofgoodsandservices
(% of GDP)
Primaryexportsa
(% of merchandise exports)
Manufacturedexports(% of merchandise
exports)
High-technologyexports
(% of manufactured exports)
Termsoftrade
(2000=100)b
1990 2005 1990 2005 1990 2005 1990 2005 1990 2005 2004–05c
34� rapportosullosv iluppoumano2007-2008
indi
cato
rid
isvi
lupp
oum
ano
TaB
ELLa
16 Strutturadelcommercio
NOTESa. Primary exports include exports of agricultural raw
materials, food, fuels, ores and metals as defined in the Standard International Trade Classification.
b. The ratio of the export price index to the import price index measured relative to the base year 2000. A value of more than 100 means that the price of exports has risen relative to the price of imports.
c. Data refer to the most recent year available during the period specified, unless otherwise noted.
d. Data refer to an earlier year than that specified; from 2000 onwards.
e. Data before 1999 include Luxembourg.f. Data refer to the closest available year between
1988 and 1992.g. One or more of the components of primary exports
are missing.h. Data refer to the South African Customs Union,
which includes Botswana, Lesotho, Namibia, South Africa, and Swaziland.
i Included in data for South Africa.
SOURCESColumns1–4and7–10: World Bank 2007b, based on data from UNCTAD; aggregates calculated for HDRO by the World Bank. Columns5and6: calculated on the basis of export data on agricultural raw materials, food, fuels, ores and metals and total merchandise from World Bank 2007b, based on data from UNCTAD; aggregates calculated for HDRO by the World Bank. Column11: World Bank 2007b.
160 Guinea 31 30 31 26 .. 75d .. 25d .. (.)d 106
161 Rwanda 14 31 6 11 .. 90d .. 10d .. 25.4d 89
162 Angola 21 48 39 74 100 .. (.) .. .. .. 121
163 Benin 26 26 14 13 87f 87 13f 13 .. 0.3 93
164 Malawi 33 53 24 27 93 84 7 16 3.8 7.5 82
165 Zambia 37 25 36 16 .. 91 .. 9 .. 1.1 119
166 Côte d’Ivoire 27 42 32 50 .. 78d .. 20d .. 8.4d 121
167 Burundi 28 36 8 8 .. 94 .. 6 .. 5.9d 84
168 Congo (Democratic Republic of the) 29 39 30 32 .. .. .. .. .. .. 94
169 Ethiopia 9 39 6 16 .. 89d .. 11d .. 0.2d 91
170 Chad 28 39 13 59 .. .. .. .. .. .. 101
171 Central African Republic 28 17d 15 12d 56f 59 44f 36 .. (.) 99
172 Mozambique 36 42 8 33 .. 89 .. 7 .. 7.5 94
173 Mali 34 37 17 26 98g 44d 2 55d .. 6.6d 113d
174 Niger 22 24 15 15 .. 91d .. 8d .. 3.2d 131
175 Guinea-Bissau 37 55 10 38 .. .. .. .. .. .. 94
176 Burkina Faso 24 22 11 9 .. 92d .. 8d .. 9.8d 97
177 Sierra Leone 24 43 22 24 .. 93d .. 7d .. 31.1d 78
Developing countries 24 40 25 44 40 28 59 71 10.4f 28.3 ..
Least developed countries 22 34 13 24 .. .. 31f .. .. .. ..
Arab States 38 38 38 54 87f .. 14f .. 1.2f 2.0d ..
East Asia and the Pacific 32 59 34 66 25 13 73 86 15.3f 36.4 ..
Latin America and the Caribbean 15 23 17 26 63 46 36 54 6.6 14.5 ..
South Asia 13 25 10 23 28 47 71 51 2.0f 3.8d ..
Sub-Saharan Africa 26 35 27 33 .. 66d .. 34d .. 4.0d ..
Central and Eastern Europe and the CIS 28 43 29 45 .. 36 .. 54 .. 8.3 ..
OECD 18 23d 17 22d 21 18 77 79 18.1 18.2 ..
High-income OECD 18 22d 17 21d 19 17 79 79 18.5 18.8 ..
High human development 19 25d 19 25d 24 20 74 76 18.1 20.3 ..
Medium human development 21 34 20 35 42 30 55 69 7.2f 24.3 ..
Low human development 28 36 28 38 98f 93d 1f 7d .. 3.1d ..
High income 19 24 18 24d 21 18 77 78 18.3 20.9 ..
Middle income 21 33 22 36 48 33 50 65 .. 21.5 ..
Low income 16 29 13 25 50f 49d 49f 50d .. 3.8d ..
World 19 26 19 26d 26 21 72 75 17.5 21.0 ..
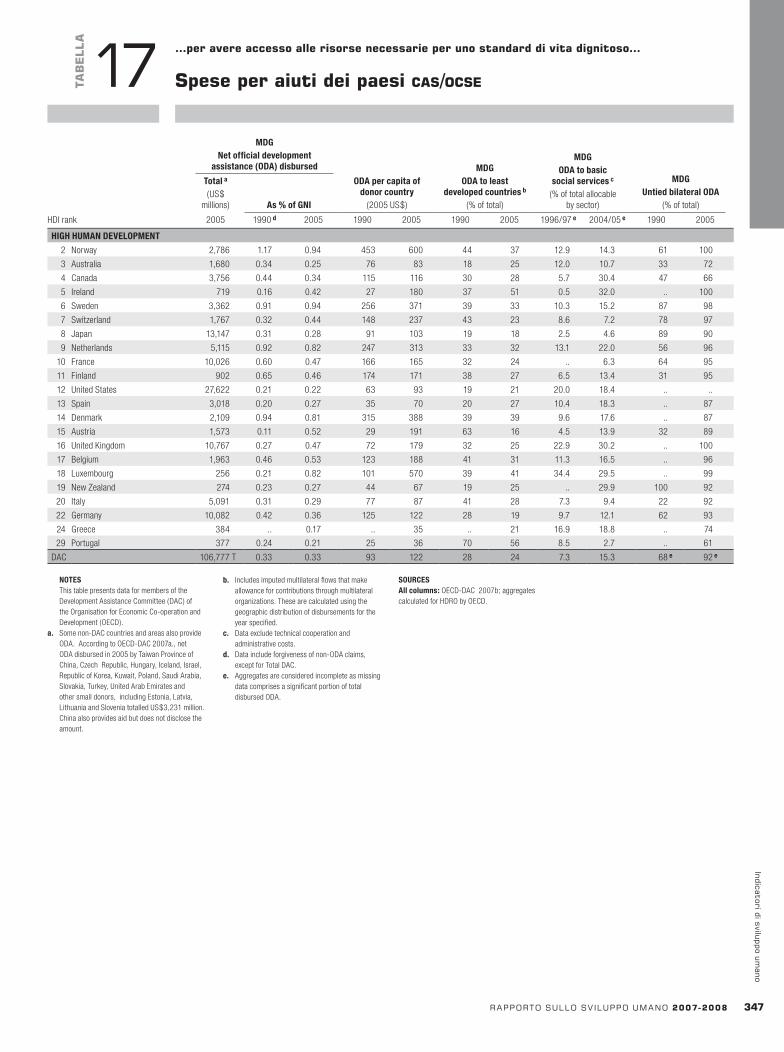
HDI rank
MDGNetofficialdevelopment
assistance(ODA)disbursed
ODApercapitaofdonorcountry
(2005 US$)
MDGODAtoleast
developedcountriesb
(% of total)
MDGODAtobasic
socialservicesc
(% of total allocable by sector)
MDGUntiedbilateralODA
(% of total)
Totala
(US$ millions) As%ofGNI
2005 1990d 2005 1990 2005 1990 2005 1996/97e 2004/05e 1990 2005
rapportosullosv iluppoumano2007-2008 347
indicatoridisviluppoumano
TaB
ELLa
17 …peravereaccessoallerisorsenecessarieperunostandarddivitadignitoso…
Speseperaiutideipaesicas/ocse
NOTES This table presents data for members of the
Development Assistance Committee (DAC) of the Organisation for Economic Co-operation and Development (OECD).
a. Some non-DAC countries and areas also provide ODA. According to OECD-DAC 2007a., net ODA disbursed in 2005 by Taiwan Province of China, Czech Republic, Hungary, Iceland, Israel, Republic of Korea, Kuwait, Poland, Saudi Arabia, Slovakia, Turkey, United Arab Emirates and other small donors, including Estonia, Latvia, Lithuania and Slovenia totalled US$3,231 million. China also provides aid but does not disclose the amount.
b. Includes imputed multilateral flows that make allowance for contributions through multilateral organizations. These are calculated using the geographic distribution of disbursements for the year specified.
c. Data exclude technical cooperation and administrative costs.
d. Data include forgiveness of non-ODA claims, except for Total DAC.
e. Aggregates are considered incomplete as missing data comprises a significant portion of total disbursed ODA.
SOURCESAllcolumns: OECD-DAC 2007b; aggregates calculated for HDRO by OECD.
HIGHHUMANDEVELOPMENT
2 Norway 2,786 1.17 0.94 453 600 44 37 12.9 14.3 61 100
3 Australia 1,680 0.34 0.25 76 83 18 25 12.0 10.7 33 72
4 Canada 3,756 0.44 0.34 115 116 30 28 5.7 30.4 47 66
5 Ireland 719 0.16 0.42 27 180 37 51 0.5 32.0 .. 100
6 Sweden 3,362 0.91 0.94 256 371 39 33 10.3 15.2 87 98
7 Switzerland 1,767 0.32 0.44 148 237 43 23 8.6 7.2 78 97
8 Japan 13,147 0.31 0.28 91 103 19 18 2.5 4.6 89 90
9 Netherlands 5,115 0.92 0.82 247 313 33 32 13.1 22.0 56 96
10 France 10,026 0.60 0.47 166 165 32 24 .. 6.3 64 95
11 Finland 902 0.65 0.46 174 171 38 27 6.5 13.4 31 95
12 United States 27,622 0.21 0.22 63 93 19 21 20.0 18.4 .. ..
13 Spain 3,018 0.20 0.27 35 70 20 27 10.4 18.3 .. 87
14 Denmark 2,109 0.94 0.81 315 388 39 39 9.6 17.6 .. 87
15 Austria 1,573 0.11 0.52 29 191 63 16 4.5 13.9 32 89
16 United Kingdom 10,767 0.27 0.47 72 179 32 25 22.9 30.2 .. 100
17 Belgium 1,963 0.46 0.53 123 188 41 31 11.3 16.5 .. 96
18 Luxembourg 256 0.21 0.82 101 570 39 41 34.4 29.5 .. 99
19 New Zealand 274 0.23 0.27 44 67 19 25 .. 29.9 100 92
20 Italy 5,091 0.31 0.29 77 87 41 28 7.3 9.4 22 92
22 Germany 10,082 0.42 0.36 125 122 28 19 9.7 12.1 62 93
24 Greece 384 .. 0.17 .. 35 .. 21 16.9 18.8 .. 74
29 Portugal 377 0.24 0.21 25 36 70 56 8.5 2.7 .. 61
DAC 106,777 T 0.33 0.33 93 122 28 24 7.3 15.3 68e 92e
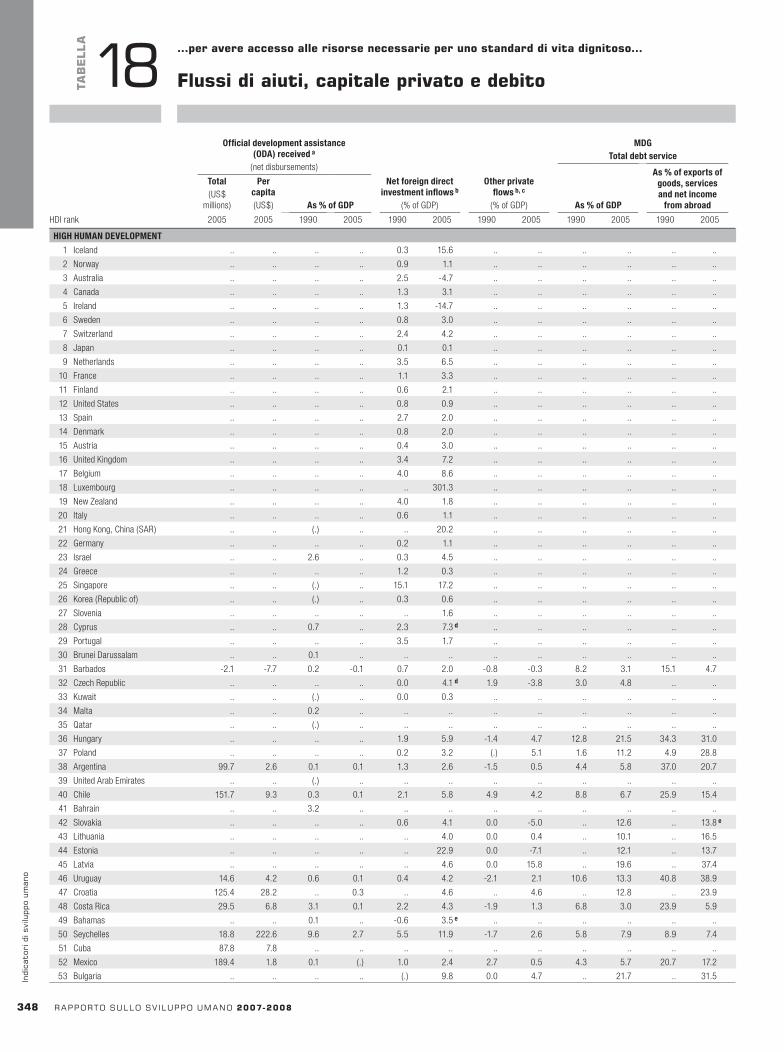
Officialdevelopmentassistance(ODA)receiveda
(net disbursements)
MDGTotaldebtservice
HDI rank
As%ofGDP
As%ofexportsofgoods,servicesandnetincome
fromabroad
Total(US$
millions)
Percapita(US$) As%ofGDP
Netforeigndirectinvestmentinflowsb
(% of GDP)
Otherprivateflowsb,c
(% of GDP)
2005 2005 1990 2005 1990 2005 1990 2005 1990 2005 1990 2005
348 rapportosullosv iluppoumano2007-2008
indi
cato
rid
isvi
lupp
oum
ano
TaB
ELLa
18 …peravereaccessoallerisorsenecessarieperunostandarddivitadignitoso…
Flussidiaiuti,capitaleprivatoedebito
HIGHHUMANDEVELOPMENT
1 Iceland .. .. .. .. 0.3 15.6 .. .. .. .. .. ..
2 Norway .. .. .. .. 0.9 1.1 .. .. .. .. .. ..
3 Australia .. .. .. .. 2.5 -4.7 .. .. .. .. .. ..
4 Canada .. .. .. .. 1.3 3.1 .. .. .. .. .. ..
5 Ireland .. .. .. .. 1.3 -14.7 .. .. .. .. .. ..
6 Sweden .. .. .. .. 0.8 3.0 .. .. .. .. .. ..
7 Switzerland .. .. .. .. 2.4 4.2 .. .. .. .. .. ..
8 Japan .. .. .. .. 0.1 0.1 .. .. .. .. .. ..
9 Netherlands .. .. .. .. 3.5 6.5 .. .. .. .. .. ..
10 France .. .. .. .. 1.1 3.3 .. .. .. .. .. ..
11 Finland .. .. .. .. 0.6 2.1 .. .. .. .. .. ..
12 United States .. .. .. .. 0.8 0.9 .. .. .. .. .. ..
13 Spain .. .. .. .. 2.7 2.0 .. .. .. .. .. ..
14 Denmark .. .. .. .. 0.8 2.0 .. .. .. .. .. ..
15 Austria .. .. .. .. 0.4 3.0 .. .. .. .. .. ..
16 United Kingdom .. .. .. .. 3.4 7.2 .. .. .. .. .. ..
17 Belgium .. .. .. .. 4.0 8.6 .. .. .. .. .. ..
18 Luxembourg .. .. .. .. .. 301.3 .. .. .. .. .. ..
19 New Zealand .. .. .. .. 4.0 1.8 .. .. .. .. .. ..
20 Italy .. .. .. .. 0.6 1.1 .. .. .. .. .. ..
21 Hong Kong, China (SAR) .. .. (.) .. .. 20.2 .. .. .. .. .. ..
22 Germany .. .. .. .. 0.2 1.1 .. .. .. .. .. ..
23 Israel .. .. 2.6 .. 0.3 4.5 .. .. .. .. .. ..
24 Greece .. .. .. .. 1.2 0.3 .. .. .. .. .. ..
25 Singapore .. .. (.) .. 15.1 17.2 .. .. .. .. .. ..
26 Korea (Republic of) .. .. (.) .. 0.3 0.6 .. .. .. .. .. ..
27 Slovenia .. .. .. .. .. 1.6 .. .. .. .. .. ..
28 Cyprus .. .. 0.7 .. 2.3 7.3d .. .. .. .. .. ..
29 Portugal .. .. .. .. 3.5 1.7 .. .. .. .. .. ..
30 Brunei Darussalam .. .. 0.1 .. .. .. .. .. .. .. .. ..
31 Barbados -2.1 -7.7 0.2 -0.1 0.7 2.0 -0.8 -0.3 8.2 3.1 15.1 4.7
32 Czech Republic .. .. .. .. 0.0 4.1d 1.9 -3.8 3.0 4.8 .. ..
33 Kuwait .. .. (.) .. 0.0 0.3 .. .. .. .. .. ..
34 Malta .. .. 0.2 .. .. .. .. .. .. .. .. ..
35 Qatar .. .. (.) .. .. .. .. .. .. .. .. ..
36 Hungary .. .. .. .. 1.9 5.9 -1.4 4.7 12.8 21.5 34.3 31.0
37 Poland .. .. .. .. 0.2 3.2 (.) 5.1 1.6 11.2 4.9 28.8
38 Argentina 99.7 2.6 0.1 0.1 1.3 2.6 -1.5 0.5 4.4 5.8 37.0 20.7
39 United Arab Emirates .. .. (.) .. .. .. .. .. .. .. .. ..
40 Chile 151.7 9.3 0.3 0.1 2.1 5.8 4.9 4.2 8.8 6.7 25.9 15.4
41 Bahrain .. .. 3.2 .. .. .. .. .. .. .. .. ..
42 Slovakia .. .. .. .. 0.6 4.1 0.0 -5.0 .. 12.6 .. 13.8e
43 Lithuania .. .. .. .. .. 4.0 0.0 0.4 .. 10.1 .. 16.5
44 Estonia .. .. .. .. .. 22.9 0.0 -7.1 .. 12.1 .. 13.7
45 Latvia .. .. .. .. .. 4.6 0.0 15.8 .. 19.6 .. 37.4
46 Uruguay 14.6 4.2 0.6 0.1 0.4 4.2 -2.1 2.1 10.6 13.3 40.8 38.9
47 Croatia 125.4 28.2 .. 0.3 .. 4.6 .. 4.6 .. 12.8 .. 23.9
48 Costa Rica 29.5 6.8 3.1 0.1 2.2 4.3 -1.9 1.3 6.8 3.0 23.9 5.9
49 Bahamas .. .. 0.1 .. -0.6 3.5e .. .. .. .. .. ..
50 Seychelles 18.8 222.6 9.6 2.7 5.5 11.9 -1.7 2.6 5.8 7.9 8.9 7.4
51 Cuba 87.8 7.8 .. .. .. .. .. .. .. .. .. ..
52 Mexico 189.4 1.8 0.1 (.) 1.0 2.4 2.7 0.5 4.3 5.7 20.7 17.2
53 Bulgaria .. .. .. .. (.) 9.8 0.0 4.7 .. 21.7 .. 31.5

Officialdevelopmentassistance(ODA)receiveda
(net disbursements)
MDGTotaldebtservice
HDI rank
As%ofGDP
As%ofexportsofgoods,servicesandnetincome
fromabroad
Total(US$
millions)
Percapita(US$) As%ofGDP
Netforeigndirectinvestmentinflowsb
(% of GDP)
Otherprivateflowsb,c
(% of GDP)
2005 2005 1990 2005 1990 2005 1990 2005 1990 2005 1990 2005
rapportosullosv iluppoumano2007-2008 34�
indicatoridisviluppoumano
TaB
ELLa
18
54 Saint Kitts and Nevis 3.5 73.3 5.1 0.8 30.6 10.4 -0.3 -3.2 1.9 10.6 2.9 22.8
55 Tonga 31.8 310.3 26.2 14.8 0.2 2.1 -0.1 0.0 1.7 1.9 2.9 ..
56 Libyan Arab Jamahiriya 24.4 .. (.) 0.1 .. .. .. .. .. .. .. ..
57 Antigua and Barbuda 7.2 89.3 1.2 0.8 .. .. .. .. .. .. .. ..
58 Oman 30.7 12.0 0.5 .. 1.2 0.8d 0.0 -0.1d .. 4.1d .. 7.5
59 Trinidad and Tobago -2.1 -1.6 0.4 (.) 2.2 7.7 -3.5 -1.0 8.9 2.6 19.3 5.4d
60 Romania .. .. .. .. (.) 6.7 (.) 7.7 (.) 7.0 0.3 18.3
61 Saudi Arabia 26.3 1.1 (.) (.) .. .. .. .. .. .. .. ..
62 Panama 19.5 6.0 1.9 0.1 2.6 6.6 -0.1 2.5 6.5 13.5 6.2 17.5
63 Malaysia 31.6 1.2 1.1 (.) 5.3 3.0 -4.2 -1.6 9.8 7.2 12.6 5.6
64 Belarus 53.8 .. .. 0.2 .. 1.0 0.0 0.1 .. 2.3 .. 3.7
65 Mauritius 31.9 25.6 3.7 0.5 1.7 0.6 1.9 (.) 6.5 4.5 8.8 7.2
66 Bosnia and Herzegovina 546.1 139.8 .. 5.5 .. 3.0 .. 2.8 .. 2.7 .. 4.9
67 Russian Federation .. .. .. .. .. 2.0 0.0 5.6 .. 5.5 .. 14.6
68 Albania 318.7 101.8 0.5 3.8 .. 3.1 0.0 0.4 .. 1.0 .. 2.5
69 Macedonia (TFYR) 230.3 113.2 .. 4.0 .. 1.7 0.0 2.8 .. 4.1 .. 8.6
70 Brazil 191.9 1.0 (.) (.) 0.2 1.9 -0.1 1.0 1.8 7.9 22.2 44.8
MEDIUMHUMANDEVELOPMENT
71 Dominica 15.2 210.7 11.8 5.3 7.7 9.2 -0.3 -0.2 3.5 6.0 5.6 13.2
72 Saint Lucia 11.1 66.8 3.1 1.3 11.3 13.1 -0.1 -0.6 1.6 4.0 2.1 7.1
73 Kazakhstan 229.2 15.1 .. 0.4 .. 3.5 0.0 11.9 .. 23.1 .. 42.1
74 Venezuela (Bolivarian Republic of) 48.7 1.8 0.2 (.) 1.0 2.1 -1.2 3.5 10.6 4.0 23.3 9.1
75 Colombia 511.1 11.2 0.2 0.4 1.2 8.5 -0.4 -0.2 9.7 8.3 40.9 35.3
76 Ukraine 409.6 .. .. 0.5 .. 9.4 0.0 4.8 .. 7.1 .. 13.0
77 Samoa 44.0 237.6 42.4 10.9 5.9 -0.9 0.0 0.0 4.9 5.5 5.8 17.3
78 Thailand -171.1 -2.7 0.9 -0.1 2.9 2.6 2.3 3.0 6.2 11.0 16.9 14.6
79 Dominican Republic 77.0 8.7 1.4 0.3 1.9 3.5 (.) 0.6 3.3 3.0 10.4 6.9
80 Belize 12.9 44.2 7.3 1.2 4.2 11.4 0.5 2.5 4.4 20.7 6.8 34.5
81 China 1,756.9 1.3 0.6 0.1 1.0 3.5 1.3 1.1 2.0 1.2 11.7 3.1
82 Grenada 44.9 421.3 6.2 9.5 5.8 5.6 0.1 -0.4 1.5 2.6 3.1 7.1
83 Armenia 193.3 64.1 .. 3.9 81.4 5.3 0.0 1.7 .. 2.8 .. 7.9
84 Turkey 464.0 6.4 0.8 0.1 0.5 2.7 0.8 6.5 4.9 11.6 29.4 39.1
85 Suriname 44.0 97.9 15.3 3.3 .. .. .. .. .. .. .. ..
86 Jordan 622.0 114.9 22.0 4.9 0.9 12.1 5.3 1.6 15.6 4.8 20.4 6.5
87 Peru 397.8 14.2 1.5 0.5 0.2 3.2 0.1 3.1 1.8 7.0 10.8 26.0
88 Lebanon 243.0 67.9 8.9 1.1 0.2 11.7 0.2 11.3 3.5 16.1 .. 17.7
89 Ecuador 209.5 15.8 1.5 0.6 1.2 4.5 0.6 1.6 10.5 11.4 32.5 30.6
90 Philippines 561.8 6.8 2.9 0.6 1.2 1.1 0.2 2.6 8.1 10.0 27.0 16.7
91 Tunisia 376.5 37.6 3.2 1.3 0.6 2.5 -1.6 -0.4 11.6 7.2 24.5 13.0
92 Fiji 64.0 75.5 3.7 2.3 6.9 -0.1 -1.2 -0.1 7.9 0.6 12.0 ..
93 Saint Vincent and the Grenadines 4.9 41.1 7.8 1.1 3.9 12.9 0.0 5.3 2.2 5.5 2.9 11.2
94 Iran ( Islamic Republic of) 104.0 1.5 0.1 0.1 -0.3 (.) (.) 0.3 0.6 1.3 3.2 ..
95 Paraguay 51.1 8.3 1.1 0.7 1.5 0.9 -0.2 (.) 6.2 6.7 12.4 11.4
96 Georgia 309.8 69.2 .. 4.8 .. 7.0 0.0 0.8 .. 2.9 .. 7.4
97 Guyana 136.8 182.1 42.4 17.4 2.0 9.8 -4.1 -0.1 74.5 4.2 .. 3.7
98 Azerbaijan 223.4 26.6 .. 1.8 (.) 13.4 0.0 0.1 .. 1.9 .. 2.6
99 Sri Lanka 1,189.3 60.7 9.1 5.1 0.5 1.2 0.1 -1.3 4.8 1.9 13.8 4.5
100 Maldives 66.8 203.0 9.7 8.7 2.6 1.2 0.5 0.6 4.1 4.4 4.8 6.9
101 Jamaica 35.7 13.5 5.9 0.4 3.0 7.1 -1.0 9.8 14.4 10.1 26.9 16.3
102 Cape Verde 160.6 316.9 31.1 16.3 0.1 5.5 (.) 0.4 1.7 3.4 4.8 6.4
103 El Salvador 199.4 29.0 7.2 1.2 (.) 3.0 0.1 2.7 4.3 3.8 15.3 8.6
104 Algeria 370.6 11.3 0.2 0.4 (.) 1.1 -0.7 -0.8 14.2 5.8 63.4 ..
105 Viet Nam 1,904.9 23.0 2.8 3.6 2.8 3.7 (.) 1.3 2.7 1.8 .. 2.6
106 Occupied Palestinian Territories 1,101.6 303.8 .. 27.4 .. .. .. .. .. .. .. ..

Officialdevelopmentassistance(ODA)receiveda
(net disbursements)
MDGTotaldebtservice
HDI rank
As%ofGDP
As%ofexportsofgoods,servicesandnetincome
fromabroad
Total(US$
millions)
Percapita(US$) As%ofGDP
Netforeigndirectinvestmentinflowsb
(% of GDP)
Otherprivateflowsb,c
(% of GDP)
2005 2005 1990 2005 1990 2005 1990 2005 1990 2005 1990 2005
3�0 rapportosullosv iluppoumano2007-2008
indi
cato
rid
isvi
lupp
oum
ano
TaB
ELLa
18 Flussidiaiuti,capitaleprivatoedebito
107 Indonesia 2,523.5 11.4 1.5 0.9 1.0 1.8 1.6 0.5 8.7 6.3 33.3 22.0d
108 Syrian Arab Republic 77.9 4.1 5.5 0.3 0.6 1.6 -0.1 (.) 9.7 0.8 21.8 1.9
109 Turkmenistan 28.3 5.8 .. 0.4 .. 0.8 0.0 -1.0 .. 3.8 .. ..
110 Nicaragua 740.1 134.9 32.6 15.1 0.1 4.9 2.0 0.3 1.6 3.5 3.9 6.9
111 Moldova 191.8 45.6 .. 6.6 .. 6.8 0.0 2.9 .. 8.6 .. 10.2
112 Egypt 925.9 12.5 12.6 1.0 1.7 6.0 -0.2 5.8 7.1 2.8 20.4 6.8
113 Uzbekistan 172.3 6.5 .. 1.2 .. 0.3 0.0 -1.7 .. 5.6 .. ..
114 Mongolia 211.9 82.9 0.6 11.3 .. 9.7 0.0 (.) .. 2.4 .. 2.9d
115 Honduras 680.8 94.5 14.7 8.2 1.4 5.6 1.0 0.7 12.8 4.6 35.3 7.2
116 Kyrgyzstan 268.5 52.1 .. 11.0 .. 1.7 0.0 (.) .. 5.2 .. 10.0
117 Bolivia 582.9 63.5 11.2 6.2 0.6 -3.0 -0.5 3.4 7.9 5.7 38.6 14.8
118 Guatemala 253.6 20.1 2.6 0.8 0.6 0.7 -0.1 (.) 3.0 1.5 13.6 5.8
119 Gabon 53.9 38.9 2.2 0.7 1.2 3.7 0.5 0.1 3.0 1.4 6.4 5.3d
120 Vanuatu 39.5 186.8 32.9 11.6 8.7 3.9 -0.1 0.0 1.6 0.7 2.1 1.3
121 South Africa 700.0 15.5 .. 0.3 -0.1 2.6 0.3 3.4 .. 2.0 .. 6.9
122 Tajikistan 241.4 37.1 .. 10.4 .. 2.4 0.0 -0.1 .. 3.4 .. 4.5
123 Sao Tome and Principe 31.9 203.8 94.0 45.2 .. 9.9 -0.2 0.0 4.9 13.8 34.4 ..
124 Botswana 70.9 40.2 3.8 0.7 2.5 2.7 -0.5 0.6 2.8 0.5 4.3 0.9
125 Namibia 123.4 60.7 5.1 2.0 .. .. .. .. .. .. .. ..
126 Morocco 651.8 21.6 4.1 1.3 0.6 3.0 1.2 0.3 6.9 5.3 21.5 11.3
127 Equatorial Guinea 39.0 77.5 45.6 1.2 8.4 57.6 0.0 0.0 3.9 0.1 12.1 ..
128 India 1,724.1 1.6 0.4 0.2 0.1 0.8 0.5 1.5 2.6 3.0 31.9 19.1e
129 Solomon Islands 198.2 415.0 21.6 66.5 4.9 -0.3 -1.5 -2.1 5.5 4.7 11.8 ..
130 Lao People’s Democratic Republic 295.7 49.9 17.2 10.3 0.7 1.0 0.0 7.9 1.0 6.0 8.7 ..
131 Cambodia 537.8 38.2 3.7 8.7 .. 6.1 0.0 0.0 2.7 0.5 .. 0.7
132 Myanmar 144.7 2.9 .. .. .. .. .. .. .. .. 18.4 3.8d
133 Bhutan 90.0 98.1 15.4 10.7 0.5 0.1 -0.9 0.0 1.7 0.8 .. ..
134 Comoros 25.2 42.0 17.9 6.5 0.2 0.3 0.0 0.0 0.4 1.0 2.3 ..
135 Ghana 1,119.9 50.6 9.5 10.4 0.3 1.0 -0.4 0.1 6.2 2.7 38.1 7.1
136 Pakistan 1,666.5 10.7 2.8 1.5 0.6 2.0 -0.2 1.3 4.8 2.2 21.3 10.2
137 Mauritania 190.4 62.0 23.2 10.3 0.7 6.2 -0.1 0.8 14.3 3.6 29.8 ..
138 Lesotho 68.8 38.3 22.6 4.7 2.8 6.3 (.) -0.5 3.8 3.7 4.2 5.0
139 Congo 1,448.9 362.3 7.8 28.5 -0.5 14.2 -3.6 0.0 19.0 2.3 35.3 2.4
140 Bangladesh 1,320.5 9.3 6.9 2.2 (.) 1.3 0.2 (.) 2.5 1.3 25.8 5.3
141 Swaziland 46.0 40.7 6.1 1.7 3.4 -0.6 -0.5 0.4 5.3 1.6 5.7 1.9
142 Nepal 427.9 15.8 11.7 5.8 0.2 (.) -0.4 (.) 1.9 1.6 15.7 4.6
143 Madagascar 929.2 49.9 12.9 18.4 0.7 0.6 -0.5 (.) 7.2 1.5 45.5 17.0
144 Cameroon 413.8 25.4 4.0 2.5 -1.0 0.1 -0.1 -0.3 4.6 4.7 20.3 15.4e
145 Papua New Guinea 266.1 45.2 12.8 5.4 4.8 0.7 1.5 -3.3 17.2 7.9 37.2 10.7
146 Haiti 515.0 60.4 5.8 12.1 0.3 0.2 0.0 0.0 1.3 1.4 11.1 3.7
147 Sudan 1,828.6 50.5 6.2 6.6 -0.2 8.4 0.0 0.2 0.4 1.4 8.7 6.5
148 Kenya 768.3 22.4 13.8 4.1 0.7 0.1 0.8 (.) 9.2 1.3 35.4 4.4
149 Djibouti 78.6 99.1 42.8 11.1 .. 3.2 -0.1 0.0 3.3 2.6 .. ..
150 Timor-Leste 184.7 189.4 .. 52.9 .. .. .. .. .. .. .. ..
151 Zimbabwe 367.7 28.3 3.8 10.9 -0.1 3.0 1.1 -0.5 5.4 6.7 23.1 ..
152 Togo 86.7 14.1 15.9 3.9 1.1 0.1 0.3 0.0 5.3 0.8 11.9 2.2d
153 Yemen 335.9 16.0 8.3 2.2 -2.7 -1.8 3.3 0.2 3.5 1.4 5.6 2.6
154 Uganda 1,198.0 41.6 15.4 13.7 -0.1 2.9 0.4 0.1 3.4 2.0 81.4 9.2
155 Gambia 58.2 38.3 30.7 12.6 4.5 11.3 -2.4 0.0 11.9 6.3 22.2 12.0
LOWHUMANDEVELOPMENT
156 Senegal 689.3 59.1 14.2 8.4 1.0 0.7 -0.2 0.2 5.7 2.3 19.9 11.8d
157 Eritrea 355.2 80.7 .. 36.6 .. 1.2 .. 0.0 .. 2.1 .. ..
158 Nigeria 6,437.3 48.9 0.9 6.5 2.1 2.0 -0.4 -0.2 11.7 9.0 22.6 15.8
159 Tanzania (United Republic of) 1,505.1 39.3 27.3 12.4 (.) 3.9 0.1 (.) 4.2 1.1 32.9 4.3

Officialdevelopmentassistance(ODA)receiveda
(net disbursements)
MDGTotaldebtservice
HDI rank
As%ofGDP
As%ofexportsofgoods,servicesandnetincome
fromabroad
Total(US$
millions)
Percapita(US$) As%ofGDP
Netforeigndirectinvestmentinflowsb
(% of GDP)
Otherprivateflowsb,c
(% of GDP)
2005 2005 1990 2005 1990 2005 1990 2005 1990 2005 1990 2005
rapportosullosv iluppoumano2007-2008 3�1
indicatoridisviluppoumano
TaB
ELLa
18
NOTES This table presents data for countries included
in Parts I and II of the DAC list of aid recipients (OECD-DAC 2007a). The denominator conventionally used when comparing official development assistance and total debt service to the size of the economy is GNI, not GDP (see Definitions of statistical terms ). GDP is used here, however, to allow comparability throughout the table. With few exceptions the denominators produce similar results.
a. ODA receipts are total net ODA flows from DAC countries as well as Taiwan Province of China, Czech Republic, Hungary, Iceland, Israel, Republic of Korea, Kuwait, Poland, Saudi Arabia, Slovakia, Turkey, United Arab Emirates and other small donors, including Estonia, Latvia, Lithuania
and Slovenia, and concessional lending from multilateral organizations. A negative value indicates that repayments of ODA loans exceed the amount of ODA received.
b. A negative value indicates that the capital flowing out of the country exceeds that flowing in.
c. Other private flows combine non-debt-creating portfolio equity investment flows, portfolio debt flows and bank and trade-related lending.
d. Data refer to 2004.e. Data refer to 2003.f. Mexico and Turkey were the only OECD
member states to receive ODA from these sources in 2005.
g. World total includes US$ 14,614 million not allocated either to individual countries or to specific regions.
SOURCESColumn1: OECD-DAC 2007b. Column2: Calculated on the basis of data on ODA and population from OECD-DAC 2007b.Columns3and4: Calculated on the basis of data on ODA from OECD-DAC 2007b and GDP from World Bank 2007b.Columns5and6: Calculated on the basis of data on foreign direct investment and GDP from World Bank 2007b and GDP from World Bank 2007b.Columns7and8: Calculated on the basis of data on portfolio investment, bank- and trade-related lending and GDP data from World Bank 2007b. Columns9and10: Calculated on the basis of data on debt service and GDP data from World Bank 2007b. Columns11and12: World Bank 2007b.
160 Guinea 182.1 19.4 10.3 5.5 0.6 3.1 -0.7 0.0 6.0 4.9 20.0 19.9d
161 Rwanda 576.0 63.7 11.1 26.7 0.3 0.4 -0.1 0.0 0.8 1.1 14.2 8.1
162 Angola 441.8 27.7 2.6 1.3 -3.3 -4.0 5.6 4.7 3.2 6.8 8.1 9.2
163 Benin 349.1 41.4 14.5 8.1 3.4 0.5 (.) -0.1 2.1 1.6 8.2 7.2d
164 Malawi 575.3 44.7 26.6 27.8 1.2 0.1 0.1 -0.1 7.1 4.6 29.3 ..
165 Zambia 945.0 81.0 14.4 13.0 6.2 3.6 -0.3 1.8 6.1 3.3 14.7 ..
166 Côte d’Ivoire 119.1 6.6 6.4 0.7 0.4 1.6 0.1 -0.8 11.7 2.8 35.4 5.5
167 Burundi 365.0 48.4 23.2 45.6 0.1 0.1 -0.5 -0.6 3.7 4.9 43.4 41.4
168 Congo (Democratic Republic of the) 1,827.6 31.8 9.6 25.7 0.2 5.7 -0.1 (.) 3.7 3.0 .. ..
169 Ethiopia 1,937.3 27.2 8.4 17.3 0.1 2.4 -0.5 1.0 2.0 0.8 39.0 4.1
170 Chad 379.8 39.0 17.9 6.9 0.5 12.9 (.) (.) 0.7 1.1 4.4 ..
171 Central African Republic 95.3 23.6 16.7 7.0 (.) 0.4 (.) 0.0 2.0 0.4 13.2 ..
172 Mozambique 1,285.9 65.0 40.5 19.4 0.4 1.6 1.0 -0.3 3.2 1.4 26.2 4.2
173 Mali 691.5 51.1 19.8 13.0 0.2 3.0 (.) 0.2 2.8 1.7 12.3 7.2d
174 Niger 515.4 36.9 15.6 15.1 1.6 0.4 0.4 -0.2 4.0 1.1 17.4 7.1d
175 Guinea-Bissau 79.1 49.9 51.8 26.3 0.8 3.3 (.) 0.0 3.5 10.8 31.1 40.2d
176 Burkina Faso 659.6 49.9 10.5 12.8 (.) 0.4 (.) (.) 1.1 0.9 6.8 ..
177 Sierra Leone 343.4 62.1 9.1 28.8 5.0 4.9 0.6 0.0 3.3 2.1 10.1 9.2
Developing countries 86,043.0 T 16.5 1.4 0.9 0.9 2.7 0.5 1.5 4.4 4.6 .. 13.0
Least developed countries 25,979.5 T 33.9 11.8 9.3 0.3 2.6 0.5 0.8 3.0 2.3 16.9 7.0
Arab States 29,612.0 T 94.3 2.9 3.0 .. .. .. 1.8 .. .. .. ..
East Asia and the Pacific 9,541.6 T 4.9 0.8 0.2 .. .. .. .. .. .. .. ..
Latin America and the Caribbean 6,249.5 T 11.3 0.5 0.3 0.8 2.9 0.5 1.2 4.0 6.6 23.7 22.9
South Asia 9,937.5 T 6.3 1.2 0.8 (.) 0.8 0.3 1.2 2.3 2.6 .. 15.4
Sub-Saharan Africa 30,167.7 T 41.7 5.7 5.1 0.4 2.4 0.3 1.7 .. .. .. ..
Central and Eastern Europe and the CIS 5,299.4 T 13.1 (.) 0.3 .. .. (.) 4.4 .. .. .. ..
OECD 759.4 Tf .. .. (.) 1.0 1.6 .. .. .. .. .. ..
High-income OECD 0.0 T 0.0 .. 0.0 1.0 1.6 .. .. ..
High human development 2,633.0 T 1.6 .. (.) 1.0 1.7 .. .. .. .. .. ..
Medium human development 40,160.4 T 9.4 1.8 0.7 0.7 2.8 0.6 1.9 4.8 3.7 22.2 10.3
Low human development 21,150.9 T 42.0 9.7 9.0 0.7 1.5 0.4 0.6 6.4 5.6 22.0 12.2
High income .. T .. .. .. 1.0 1.6 .. .. ..
Middle income 42,242.2 T 13.7 0.7 1.3 0.9 3.1 0.4 2.2 4.5 5.5 20.3 14.3
Low income 44,123.0 T 18.2 4.1 3.2 0.4 1.4 0.3 1.0 3.7 3.1 27.1 13.7
World 106,372.9 Tg 16.3 0.3 0.2 1.0 1.9 .. 2.0 .. 5.1 .. ..
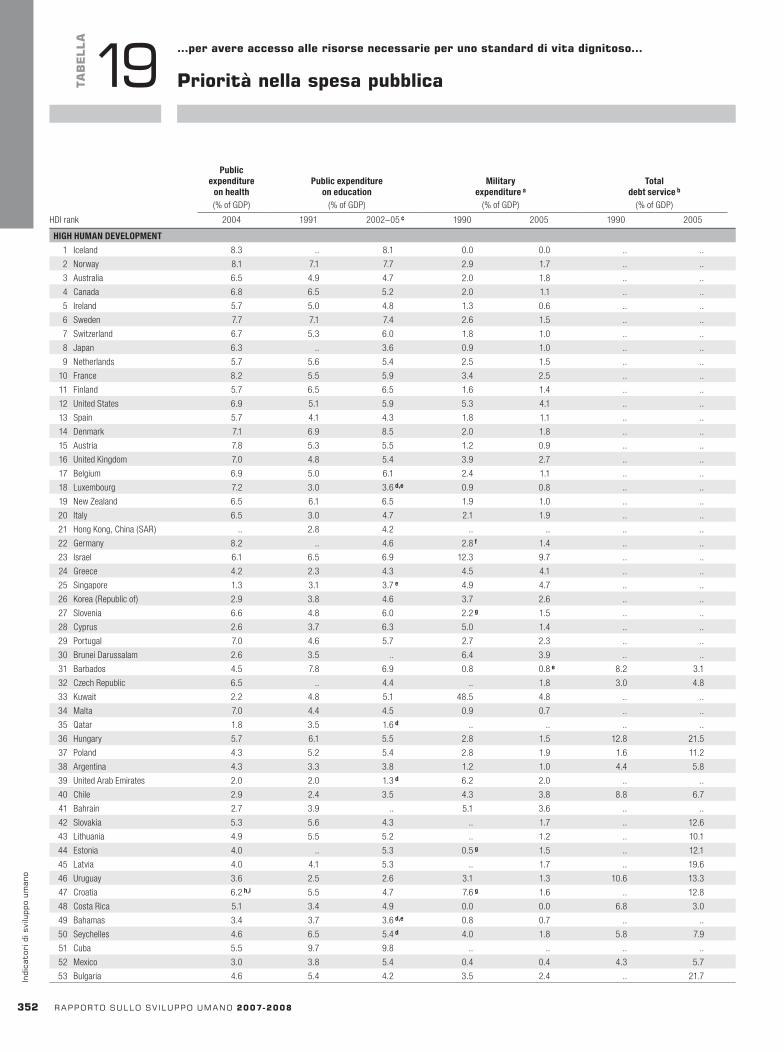
HDI rank
Publicexpenditure
onhealth(% of GDP)
Publicexpenditureoneducation
(% of GDP)
Militaryexpenditurea
(% of GDP)
Totaldebtserviceb
(% of GDP)
2004 1991 2002–05c 1990 2005 1990 2005HDI rank
Publicexpenditure
onhealth(% of GDP)
Publicexpenditureoneducation
(% of GDP)
Militaryexpenditurea
(% of GDP)
Totaldebtserviceb
(% of GDP)
2004 1991 2002–05c 1990 2005 1990 2005
3�2 rapportosullosv iluppoumano2007-2008
indi
cato
rid
isvi
lupp
oum
ano
TaB
ELLa
19 …peravereaccessoallerisorsenecessarieperunostandarddivitadignitoso…
prioritànellaspesapubblica
HIGHHUMANDEVELOPMENT
1 Iceland 8.3 .. 8.1 0.0 0.0 .. ..
2 Norway 8.1 7.1 7.7 2.9 1.7 .. ..
3 Australia 6.5 4.9 4.7 2.0 1.8 .. ..
4 Canada 6.8 6.5 5.2 2.0 1.1 .. ..
5 Ireland 5.7 5.0 4.8 1.3 0.6 .. ..
6 Sweden 7.7 7.1 7.4 2.6 1.5 .. ..
7 Switzerland 6.7 5.3 6.0 1.8 1.0 .. ..
8 Japan 6.3 .. 3.6 0.9 1.0 .. ..
9 Netherlands 5.7 5.6 5.4 2.5 1.5 .. ..
10 France 8.2 5.5 5.9 3.4 2.5 .. ..
11 Finland 5.7 6.5 6.5 1.6 1.4 .. ..
12 United States 6.9 5.1 5.9 5.3 4.1 .. ..
13 Spain 5.7 4.1 4.3 1.8 1.1 .. ..
14 Denmark 7.1 6.9 8.5 2.0 1.8 .. ..
15 Austria 7.8 5.3 5.5 1.2 0.9 .. ..
16 United Kingdom 7.0 4.8 5.4 3.9 2.7 .. ..
17 Belgium 6.9 5.0 6.1 2.4 1.1 .. ..
18 Luxembourg 7.2 3.0 3.6d,e 0.9 0.8 .. ..
19 New Zealand 6.5 6.1 6.5 1.9 1.0 .. ..
20 Italy 6.5 3.0 4.7 2.1 1.9 .. ..
21 Hong Kong, China (SAR) .. 2.8 4.2 .. .. .. ..
22 Germany 8.2 .. 4.6 2.8f 1.4 .. ..
23 Israel 6.1 6.5 6.9 12.3 9.7 .. ..
24 Greece 4.2 2.3 4.3 4.5 4.1 .. ..
25 Singapore 1.3 3.1 3.7e 4.9 4.7 .. ..
26 Korea (Republic of) 2.9 3.8 4.6 3.7 2.6 .. ..
27 Slovenia 6.6 4.8 6.0 2.2g 1.5 .. ..
28 Cyprus 2.6 3.7 6.3 5.0 1.4 .. ..
29 Portugal 7.0 4.6 5.7 2.7 2.3 .. ..
30 Brunei Darussalam 2.6 3.5 .. 6.4 3.9 .. ..
31 Barbados 4.5 7.8 6.9 0.8 0.8e 8.2 3.1
32 Czech Republic 6.5 .. 4.4 .. 1.8 3.0 4.8
33 Kuwait 2.2 4.8 5.1 48.5 4.8 .. ..
34 Malta 7.0 4.4 4.5 0.9 0.7 .. ..
35 Qatar 1.8 3.5 1.6d .. .. .. ..
36 Hungary 5.7 6.1 5.5 2.8 1.5 12.8 21.5
37 Poland 4.3 5.2 5.4 2.8 1.9 1.6 11.2
38 Argentina 4.3 3.3 3.8 1.2 1.0 4.4 5.8
39 United Arab Emirates 2.0 2.0 1.3d 6.2 2.0 .. ..
40 Chile 2.9 2.4 3.5 4.3 3.8 8.8 6.7
41 Bahrain 2.7 3.9 .. 5.1 3.6 .. ..
42 Slovakia 5.3 5.6 4.3 .. 1.7 .. 12.6
43 Lithuania 4.9 5.5 5.2 .. 1.2 .. 10.1
44 Estonia 4.0 .. 5.3 0.5g 1.5 .. 12.1
45 Latvia 4.0 4.1 5.3 .. 1.7 .. 19.6
46 Uruguay 3.6 2.5 2.6 3.1 1.3 10.6 13.3
47 Croatia 6.2h,i 5.5 4.7 7.6g 1.6 .. 12.8
48 Costa Rica 5.1 3.4 4.9 0.0 0.0 6.8 3.0
49 Bahamas 3.4 3.7 3.6d,e 0.8 0.7 .. ..
50 Seychelles 4.6 6.5 5.4d 4.0 1.8 5.8 7.9
51 Cuba 5.5 9.7 9.8 .. .. .. ..
52 Mexico 3.0 3.8 5.4 0.4 0.4 4.3 5.7
53 Bulgaria 4.6 5.4 4.2 3.5 2.4 .. 21.7
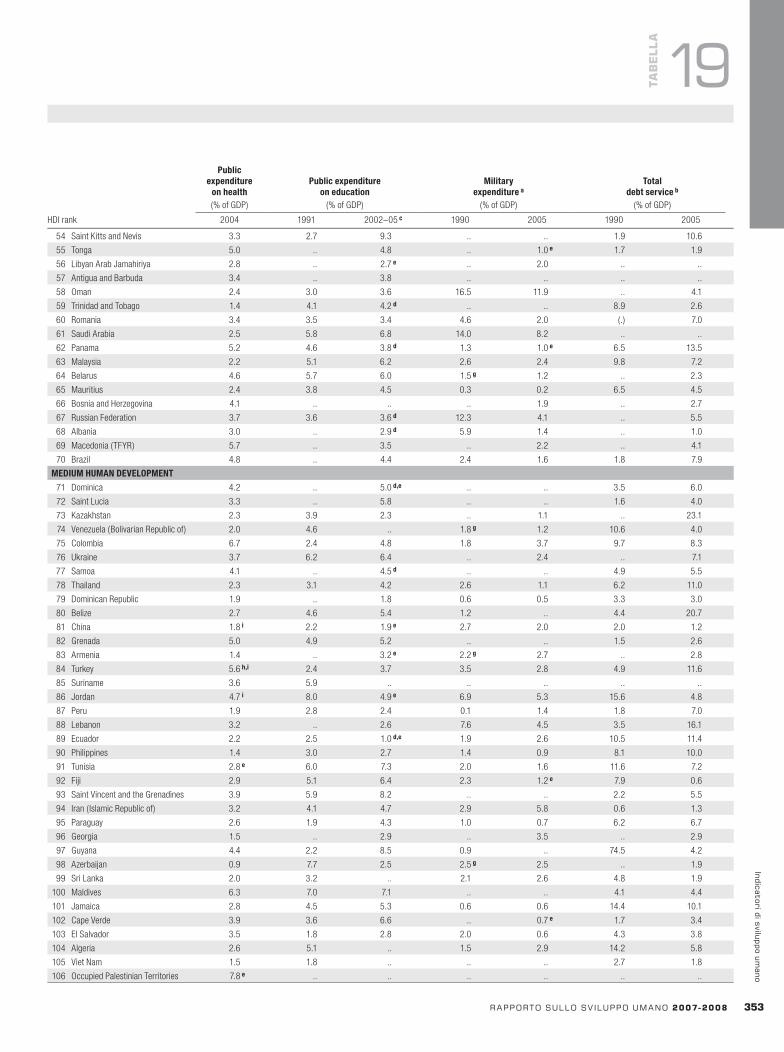
HDI rank
Publicexpenditure
onhealth(% of GDP)
Publicexpenditureoneducation
(% of GDP)
Militaryexpenditurea
(% of GDP)
Totaldebtserviceb
(% of GDP)
2004 1991 2002–05c 1990 2005 1990 2005
rapportosullosv iluppoumano2007-2008 3�3
indicatoridisviluppoumano
TaB
ELLa
19
54 Saint Kitts and Nevis 3.3 2.7 9.3 .. .. 1.9 10.6
55 Tonga 5.0 .. 4.8 .. 1.0e 1.7 1.9
56 Libyan Arab Jamahiriya 2.8 .. 2.7e .. 2.0 .. ..
57 Antigua and Barbuda 3.4 .. 3.8 .. .. .. ..
58 Oman 2.4 3.0 3.6 16.5 11.9 .. 4.1
59 Trinidad and Tobago 1.4 4.1 4.2d .. .. 8.9 2.6
60 Romania 3.4 3.5 3.4 4.6 2.0 (.) 7.0
61 Saudi Arabia 2.5 5.8 6.8 14.0 8.2 .. ..
62 Panama 5.2 4.6 3.8d 1.3 1.0e 6.5 13.5
63 Malaysia 2.2 5.1 6.2 2.6 2.4 9.8 7.2
64 Belarus 4.6 5.7 6.0 1.5g 1.2 .. 2.3
65 Mauritius 2.4 3.8 4.5 0.3 0.2 6.5 4.5
66 Bosnia and Herzegovina 4.1 .. .. .. 1.9 .. 2.7
67 Russian Federation 3.7 3.6 3.6d 12.3 4.1 .. 5.5
68 Albania 3.0 .. 2.9d 5.9 1.4 .. 1.0
69 Macedonia (TFYR) 5.7 .. 3.5 .. 2.2 .. 4.1
70 Brazil 4.8 .. 4.4 2.4 1.6 1.8 7.9
MEDIUMHUMANDEVELOPMENT
71 Dominica 4.2 .. 5.0d,e .. .. 3.5 6.0
72 Saint Lucia 3.3 .. 5.8 .. .. 1.6 4.0
73 Kazakhstan 2.3 3.9 2.3 .. 1.1 .. 23.1
74 Venezuela (Bolivarian Republic of) 2.0 4.6 .. 1.8g 1.2 10.6 4.0
75 Colombia 6.7 2.4 4.8 1.8 3.7 9.7 8.3
76 Ukraine 3.7 6.2 6.4 .. 2.4 .. 7.1
77 Samoa 4.1 .. 4.5d .. .. 4.9 5.5
78 Thailand 2.3 3.1 4.2 2.6 1.1 6.2 11.0
79 Dominican Republic 1.9 .. 1.8 0.6 0.5 3.3 3.0
80 Belize 2.7 4.6 5.4 1.2 .. 4.4 20.7
81 China 1.8i 2.2 1.9e 2.7 2.0 2.0 1.2
82 Grenada 5.0 4.9 5.2 .. .. 1.5 2.6
83 Armenia 1.4 .. 3.2e 2.2g 2.7 .. 2.8
84 Turkey 5.6h,i 2.4 3.7 3.5 2.8 4.9 11.6
85 Suriname 3.6 5.9 .. .. .. .. ..
86 Jordan 4.7i 8.0 4.9e 6.9 5.3 15.6 4.8
87 Peru 1.9 2.8 2.4 0.1 1.4 1.8 7.0
88 Lebanon 3.2 .. 2.6 7.6 4.5 3.5 16.1
89 Ecuador 2.2 2.5 1.0d,e 1.9 2.6 10.5 11.4
90 Philippines 1.4 3.0 2.7 1.4 0.9 8.1 10.0
91 Tunisia 2.8e 6.0 7.3 2.0 1.6 11.6 7.2
92 Fiji 2.9 5.1 6.4 2.3 1.2e 7.9 0.6
93 Saint Vincent and the Grenadines 3.9 5.9 8.2 .. .. 2.2 5.5
94 Iran ( Islamic Republic of) 3.2 4.1 4.7 2.9 5.8 0.6 1.3
95 Paraguay 2.6 1.9 4.3 1.0 0.7 6.2 6.7
96 Georgia 1.5 .. 2.9 .. 3.5 .. 2.9
97 Guyana 4.4 2.2 8.5 0.9 .. 74.5 4.2
98 Azerbaijan 0.9 7.7 2.5 2.5g 2.5 .. 1.9
99 Sri Lanka 2.0 3.2 .. 2.1 2.6 4.8 1.9
100 Maldives 6.3 7.0 7.1 .. .. 4.1 4.4
101 Jamaica 2.8 4.5 5.3 0.6 0.6 14.4 10.1
102 Cape Verde 3.9 3.6 6.6 .. 0.7e 1.7 3.4
103 El Salvador 3.5 1.8 2.8 2.0 0.6 4.3 3.8
104 Algeria 2.6 5.1 .. 1.5 2.9 14.2 5.8
105 Viet Nam 1.5 1.8 .. .. .. 2.7 1.8
106 Occupied Palestinian Territories 7.8e .. .. .. .. .. ..
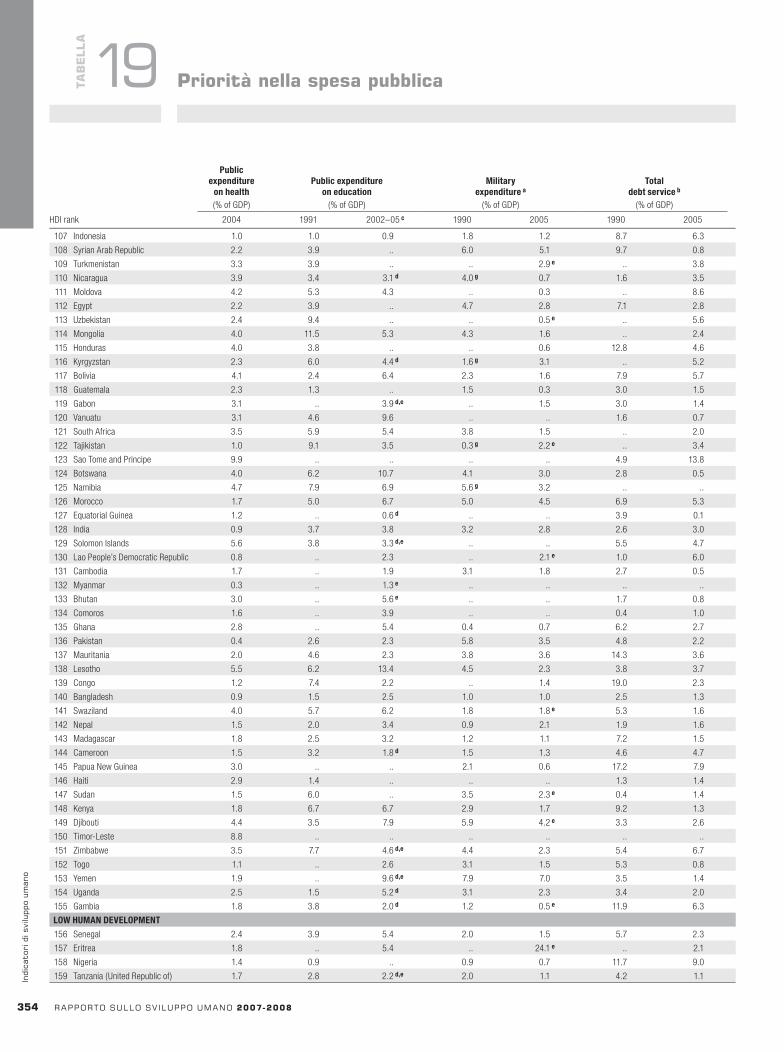
HDI rank
Publicexpenditure
onhealth(% of GDP)
Publicexpenditureoneducation
(% of GDP)
Militaryexpenditurea
(% of GDP)
Totaldebtserviceb
(% of GDP)
2004 1991 2002–05c 1990 2005 1990 2005HDI rank
Publicexpenditure
onhealth(% of GDP)
Publicexpenditureoneducation
(% of GDP)
Militaryexpenditurea
(% of GDP)
Totaldebtserviceb
(% of GDP)
2004 1991 2002–05c 1990 2005 1990 2005
3�4 rapportosullosv iluppoumano2007-2008
indi
cato
rid
isvi
lupp
oum
ano
TaB
ELLa
19 prioritànellaspesapubblica
107 Indonesia 1.0 1.0 0.9 1.8 1.2 8.7 6.3
108 Syrian Arab Republic 2.2 3.9 .. 6.0 5.1 9.7 0.8
109 Turkmenistan 3.3 3.9 .. .. 2.9e .. 3.8
110 Nicaragua 3.9 3.4 3.1d 4.0g 0.7 1.6 3.5
111 Moldova 4.2 5.3 4.3 .. 0.3 .. 8.6
112 Egypt 2.2 3.9 .. 4.7 2.8 7.1 2.8
113 Uzbekistan 2.4 9.4 .. .. 0.5e .. 5.6
114 Mongolia 4.0 11.5 5.3 4.3 1.6 .. 2.4
115 Honduras 4.0 3.8 .. .. 0.6 12.8 4.6
116 Kyrgyzstan 2.3 6.0 4.4d 1.6g 3.1 .. 5.2
117 Bolivia 4.1 2.4 6.4 2.3 1.6 7.9 5.7
118 Guatemala 2.3 1.3 .. 1.5 0.3 3.0 1.5
119 Gabon 3.1 .. 3.9d,e .. 1.5 3.0 1.4
120 Vanuatu 3.1 4.6 9.6 .. .. 1.6 0.7
121 South Africa 3.5 5.9 5.4 3.8 1.5 .. 2.0
122 Tajikistan 1.0 9.1 3.5 0.3g 2.2e .. 3.4
123 Sao Tome and Principe 9.9 .. .. .. .. 4.9 13.8
124 Botswana 4.0 6.2 10.7 4.1 3.0 2.8 0.5
125 Namibia 4.7 7.9 6.9 5.6g 3.2 .. ..
126 Morocco 1.7 5.0 6.7 5.0 4.5 6.9 5.3
127 Equatorial Guinea 1.2 .. 0.6d .. .. 3.9 0.1
128 India 0.9 3.7 3.8 3.2 2.8 2.6 3.0
129 Solomon Islands 5.6 3.8 3.3d,e .. .. 5.5 4.7
130 Lao People’s Democratic Republic 0.8 .. 2.3 .. 2.1e 1.0 6.0
131 Cambodia 1.7 .. 1.9 3.1 1.8 2.7 0.5
132 Myanmar 0.3 .. 1.3e .. .. .. ..
133 Bhutan 3.0 .. 5.6e .. .. 1.7 0.8
134 Comoros 1.6 .. 3.9 .. .. 0.4 1.0
135 Ghana 2.8 .. 5.4 0.4 0.7 6.2 2.7
136 Pakistan 0.4 2.6 2.3 5.8 3.5 4.8 2.2
137 Mauritania 2.0 4.6 2.3 3.8 3.6 14.3 3.6
138 Lesotho 5.5 6.2 13.4 4.5 2.3 3.8 3.7
139 Congo 1.2 7.4 2.2 .. 1.4 19.0 2.3
140 Bangladesh 0.9 1.5 2.5 1.0 1.0 2.5 1.3
141 Swaziland 4.0 5.7 6.2 1.8 1.8e 5.3 1.6
142 Nepal 1.5 2.0 3.4 0.9 2.1 1.9 1.6
143 Madagascar 1.8 2.5 3.2 1.2 1.1 7.2 1.5
144 Cameroon 1.5 3.2 1.8d 1.5 1.3 4.6 4.7
145 Papua New Guinea 3.0 .. .. 2.1 0.6 17.2 7.9
146 Haiti 2.9 1.4 .. .. .. 1.3 1.4
147 Sudan 1.5 6.0 .. 3.5 2.3e 0.4 1.4
148 Kenya 1.8 6.7 6.7 2.9 1.7 9.2 1.3
149 Djibouti 4.4 3.5 7.9 5.9 4.2e 3.3 2.6
150 Timor-Leste 8.8 .. .. .. .. .. ..
151 Zimbabwe 3.5 7.7 4.6d,e 4.4 2.3 5.4 6.7
152 Togo 1.1 .. 2.6 3.1 1.5 5.3 0.8
153 Yemen 1.9 .. 9.6d,e 7.9 7.0 3.5 1.4
154 Uganda 2.5 1.5 5.2d 3.1 2.3 3.4 2.0
155 Gambia 1.8 3.8 2.0d 1.2 0.5e 11.9 6.3
LOWHUMANDEVELOPMENT
156 Senegal 2.4 3.9 5.4 2.0 1.5 5.7 2.3
157 Eritrea 1.8 .. 5.4 .. 24.1e .. 2.1
158 Nigeria 1.4 0.9 .. 0.9 0.7 11.7 9.0
159 Tanzania (United Republic of) 1.7 2.8 2.2d,e 2.0 1.1 4.2 1.1
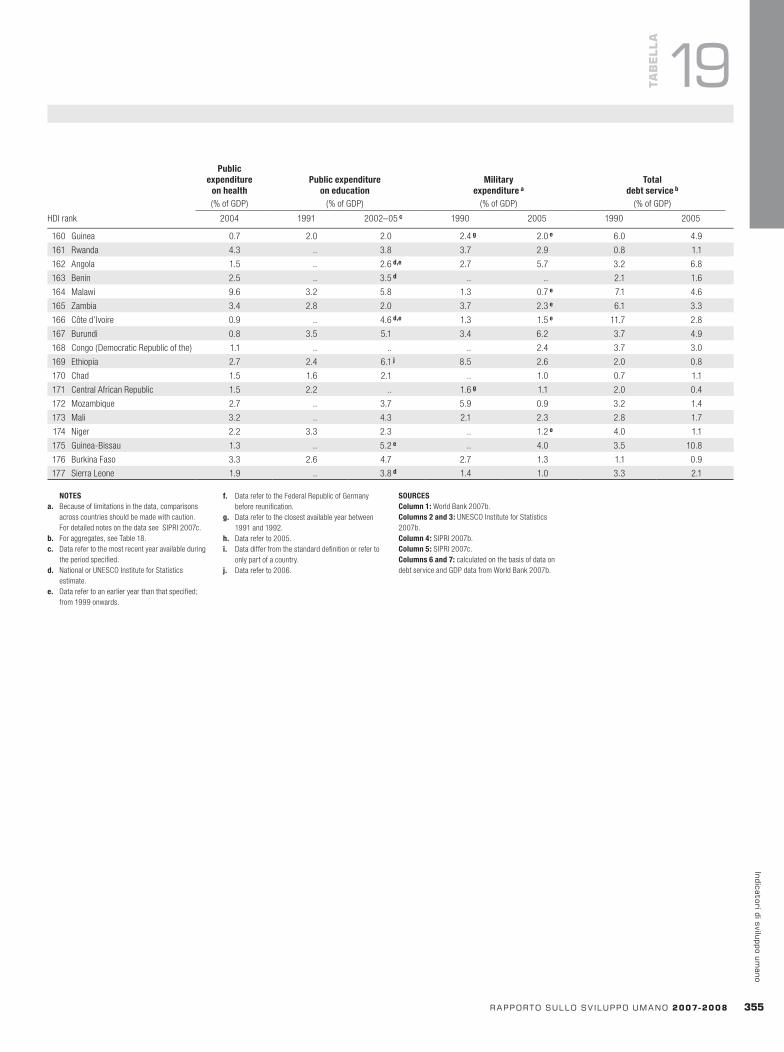
HDI rank
Publicexpenditure
onhealth(% of GDP)
Publicexpenditureoneducation
(% of GDP)
Militaryexpenditurea
(% of GDP)
Totaldebtserviceb
(% of GDP)
2004 1991 2002–05c 1990 2005 1990 2005
rapportosullosv iluppoumano2007-2008 3��
indicatoridisviluppoumano
TaB
ELLa
19
NOTESa. Because of limitations in the data, comparisons
across countries should be made with caution. For detailed notes on the data see SIPRI 2007c.
b. For aggregates, see Table 18.c. Data refer to the most recent year available during
the period specified.d. National or UNESCO Institute for Statistics
estimate.e. Data refer to an earlier year than that specified;
from 1999 onwards.
f. Data refer to the Federal Republic of Germany before reunification.
g. Data refer to the closest available year between 1991 and 1992.
h. Data refer to 2005.i. Data differ from the standard definition or refer to
only part of a country.j. Data refer to 2006.
SOURCESColumn1: World Bank 2007b.Columns2and3: UNESCO Institute for Statistics 2007b.Column4: SIPRI 2007b.Column5: SIPRI 2007c. Columns6and7: calculated on the basis of data on debt service and GDP data from World Bank 2007b.
160 Guinea 0.7 2.0 2.0 2.4g 2.0e 6.0 4.9
161 Rwanda 4.3 .. 3.8 3.7 2.9 0.8 1.1
162 Angola 1.5 .. 2.6d,e 2.7 5.7 3.2 6.8
163 Benin 2.5 .. 3.5d .. .. 2.1 1.6
164 Malawi 9.6 3.2 5.8 1.3 0.7e 7.1 4.6
165 Zambia 3.4 2.8 2.0 3.7 2.3e 6.1 3.3
166 Côte d’Ivoire 0.9 .. 4.6d,e 1.3 1.5e 11.7 2.8
167 Burundi 0.8 3.5 5.1 3.4 6.2 3.7 4.9
168 Congo (Democratic Republic of the) 1.1 .. .. .. 2.4 3.7 3.0
169 Ethiopia 2.7 2.4 6.1j 8.5 2.6 2.0 0.8
170 Chad 1.5 1.6 2.1 .. 1.0 0.7 1.1
171 Central African Republic 1.5 2.2 .. 1.6g 1.1 2.0 0.4
172 Mozambique 2.7 .. 3.7 5.9 0.9 3.2 1.4
173 Mali 3.2 .. 4.3 2.1 2.3 2.8 1.7
174 Niger 2.2 3.3 2.3 .. 1.2e 4.0 1.1
175 Guinea-Bissau 1.3 .. 5.2e .. 4.0 3.5 10.8
176 Burkina Faso 3.3 2.6 4.7 2.7 1.3 1.1 0.9
177 Sierra Leone 1.9 .. 3.8d 1.4 1.0 3.3 2.1
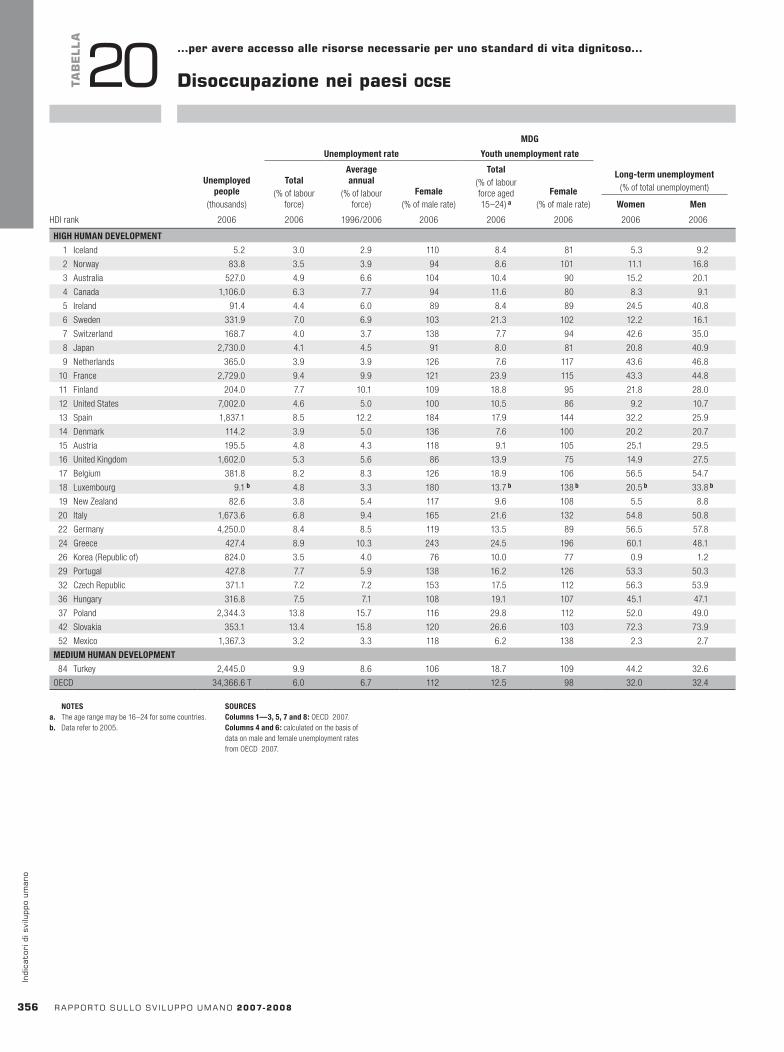
HDI rank
Unemploymentratea Employmentbyeconomicactivityb
Employmentininformalsectorasa%ofnon-agriculturalemploymentcUnemployed
people(thousands)
Total(% of labour
force)Female
(% of male rate)Total
(thousands)Agriculture
(%)Industry
(%)Services
(%) Surveyyear
Bothsexes
(%)Female
(%)Male(%)1996–2005d 1996–2005d 1996–2005d 1996–2005d 1996–2005d 1996–2005d 1996–2005d
Unemploymentrate
MDG
Youthunemploymentrate
HDI rank
Unemployedpeople
(thousands)
Total(% of labour
force)
Averageannual
(% of labour force)
Female(% of male rate)
Total(% of labour force aged 15–24)a
Female(% of male rate)
Long-termunemployment(% of total unemployment)
Women Men
2006 2006 1996/2006 2006 2006 2006 2006 2006
3�� rapportosullosv iluppoumano2007-2008
indi
cato
rid
isvi
lupp
oum
ano
TaB
ELLa
20 …peravereaccessoallerisorsenecessarieperunostandarddivitadignitoso…
Disoccupazioneneipaesiocse
NOTESa. The age range may be 16–24 for some countries.b. Data refer to 2005.
SOURCESColumns1—3,5,7and8: OECD 2007.Columns4and6: calculated on the basis of data on male and female unemployment rates from OECD 2007.
HIGHHUMANDEVELOPMENT
1 Iceland 5.2 3.0 2.9 110 8.4 81 5.3 9.2
2 Norway 83.8 3.5 3.9 94 8.6 101 11.1 16.8
3 Australia 527.0 4.9 6.6 104 10.4 90 15.2 20.1
4 Canada 1,106.0 6.3 7.7 94 11.6 80 8.3 9.1
5 Ireland 91.4 4.4 6.0 89 8.4 89 24.5 40.8
6 Sweden 331.9 7.0 6.9 103 21.3 102 12.2 16.1
7 Switzerland 168.7 4.0 3.7 138 7.7 94 42.6 35.0
8 Japan 2,730.0 4.1 4.5 91 8.0 81 20.8 40.9
9 Netherlands 365.0 3.9 3.9 126 7.6 117 43.6 46.8
10 France 2,729.0 9.4 9.9 121 23.9 115 43.3 44.8
11 Finland 204.0 7.7 10.1 109 18.8 95 21.8 28.0
12 United States 7,002.0 4.6 5.0 100 10.5 86 9.2 10.7
13 Spain 1,837.1 8.5 12.2 184 17.9 144 32.2 25.9
14 Denmark 114.2 3.9 5.0 136 7.6 100 20.2 20.7
15 Austria 195.5 4.8 4.3 118 9.1 105 25.1 29.5
16 United Kingdom 1,602.0 5.3 5.6 86 13.9 75 14.9 27.5
17 Belgium 381.8 8.2 8.3 126 18.9 106 56.5 54.7
18 Luxembourg 9.1b 4.8 3.3 180 13.7b 138b 20.5b 33.8b
19 New Zealand 82.6 3.8 5.4 117 9.6 108 5.5 8.8
20 Italy 1,673.6 6.8 9.4 165 21.6 132 54.8 50.8
22 Germany 4,250.0 8.4 8.5 119 13.5 89 56.5 57.8
24 Greece 427.4 8.9 10.3 243 24.5 196 60.1 48.1
26 Korea (Republic of) 824.0 3.5 4.0 76 10.0 77 0.9 1.2
29 Portugal 427.8 7.7 5.9 138 16.2 126 53.3 50.3
32 Czech Republic 371.1 7.2 7.2 153 17.5 112 56.3 53.9
36 Hungary 316.8 7.5 7.1 108 19.1 107 45.1 47.1
37 Poland 2,344.3 13.8 15.7 116 29.8 112 52.0 49.0
42 Slovakia 353.1 13.4 15.8 120 26.6 103 72.3 73.9
52 Mexico 1,367.3 3.2 3.3 118 6.2 138 2.3 2.7
MEDIUMHUMANDEVELOPMENT
84 Turkey 2,445.0 9.9 8.6 106 18.7 109 44.2 32.6
OECD 34,366.6 T 6.0 6.7 112 12.5 98 32.0 32.4
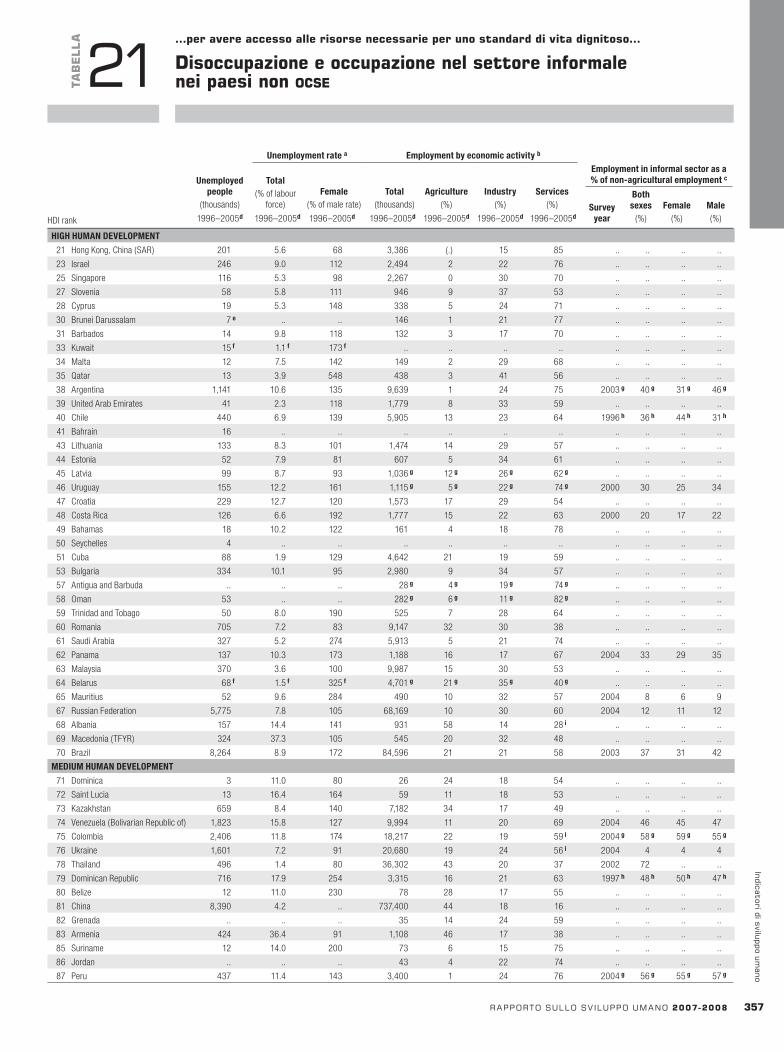
HDI rank
Unemploymentratea Employmentbyeconomicactivityb
Employmentininformalsectorasa%ofnon-agriculturalemploymentcUnemployed
people(thousands)
Total(% of labour
force)Female
(% of male rate)Total
(thousands)Agriculture
(%)Industry
(%)Services
(%) Surveyyear
Bothsexes
(%)Female
(%)Male(%)1996–2005d 1996–2005d 1996–2005d 1996–2005d 1996–2005d 1996–2005d 1996–2005d
rapportosullosv iluppoumano2007-2008 3�7
indicatoridisviluppoumano
TaB
ELLa
21…peravereaccessoallerisorsenecessarieperunostandarddivitadignitoso…
Disoccupazioneeoccupazionenelsettoreinformaleneipaesinonocse
HIGHHUMANDEVELOPMENT
21 Hong Kong, China (SAR) 201 5.6 68 3,386 (.) 15 85 .. .. .. ..
23 Israel 246 9.0 112 2,494 2 22 76 .. .. .. ..
25 Singapore 116 5.3 98 2,267 0 30 70 .. .. .. ..
27 Slovenia 58 5.8 111 946 9 37 53 .. .. .. ..
28 Cyprus 19 5.3 148 338 5 24 71 .. .. .. ..
30 Brunei Darussalam 7e .. .. 146 1 21 77 .. .. .. ..
31 Barbados 14 9.8 118 132 3 17 70 .. .. .. ..
33 Kuwait 15f 1.1f 173f .. .. .. .. .. .. .. ..
34 Malta 12 7.5 142 149 2 29 68 .. .. .. ..
35 Qatar 13 3.9 548 438 3 41 56 .. .. .. ..
38 Argentina 1,141 10.6 135 9,639 1 24 75 2003g 40g 31g 46g
39 United Arab Emirates 41 2.3 118 1,779 8 33 59 .. .. .. ..
40 Chile 440 6.9 139 5,905 13 23 64 1996h 36h 44h 31h
41 Bahrain 16 .. .. .. .. .. .. .. .. .. ..
43 Lithuania 133 8.3 101 1,474 14 29 57 .. .. .. ..
44 Estonia 52 7.9 81 607 5 34 61 .. .. .. ..
45 Latvia 99 8.7 93 1,036g 12g 26g 62g .. .. .. ..
46 Uruguay 155 12.2 161 1,115g 5g 22g 74g 2000 30 25 34
47 Croatia 229 12.7 120 1,573 17 29 54 .. .. .. ..
48 Costa Rica 126 6.6 192 1,777 15 22 63 2000 20 17 22
49 Bahamas 18 10.2 122 161 4 18 78 .. .. .. ..
50 Seychelles 4 .. .. .. .. .. .. .. .. .. ..
51 Cuba 88 1.9 129 4,642 21 19 59 .. .. .. ..
53 Bulgaria 334 10.1 95 2,980 9 34 57 .. .. .. ..
57 Antigua and Barbuda .. .. .. 28g 4g 19g 74g .. .. .. ..
58 Oman 53 .. .. 282g 6g 11g 82g .. .. .. ..
59 Trinidad and Tobago 50 8.0 190 525 7 28 64 .. .. .. ..
60 Romania 705 7.2 83 9,147 32 30 38 .. .. .. ..
61 Saudi Arabia 327 5.2 274 5,913 5 21 74 .. .. .. ..
62 Panama 137 10.3 173 1,188 16 17 67 2004 33 29 35
63 Malaysia 370 3.6 100 9,987 15 30 53 .. .. .. ..
64 Belarus 68f 1.5f 325f 4,701g 21g 35g 40g .. .. .. ..
65 Mauritius 52 9.6 284 490 10 32 57 2004 8 6 9
67 Russian Federation 5,775 7.8 105 68,169 10 30 60 2004 12 11 12
68 Albania 157 14.4 141 931 58 14 28i .. .. .. ..
69 Macedonia (TFYR) 324 37.3 105 545 20 32 48 .. .. .. ..
70 Brazil 8,264 8.9 172 84,596 21 21 58 2003 37 31 42
MEDIUMHUMANDEVELOPMENT
71 Dominica 3 11.0 80 26 24 18 54 .. .. .. ..
72 Saint Lucia 13 16.4 164 59 11 18 53 .. .. .. ..
73 Kazakhstan 659 8.4 140 7,182 34 17 49 .. .. .. ..
74 Venezuela (Bolivarian Republic of) 1,823 15.8 127 9,994 11 20 69 2004 46 45 47
75 Colombia 2,406 11.8 174 18,217 22 19 59i 2004g 58g 59g 55g
76 Ukraine 1,601 7.2 91 20,680 19 24 56i 2004 4 4 4
78 Thailand 496 1.4 80 36,302 43 20 37 2002 72 .. ..
79 Dominican Republic 716 17.9 254 3,315 16 21 63 1997h 48h 50h 47h
80 Belize 12 11.0 230 78 28 17 55 .. .. .. ..
81 China 8,390 4.2 .. 737,400 44 18 16 .. .. .. ..
82 Grenada .. .. .. 35 14 24 59 .. .. .. ..
83 Armenia 424 36.4 91 1,108 46 17 38 .. .. .. ..
85 Suriname 12 14.0 200 73 6 15 75 .. .. .. ..
86 Jordan .. .. .. 43 4 22 74 .. .. .. ..
87 Peru 437 11.4 143 3,400 1 24 76 2004g 56g 55g 57g
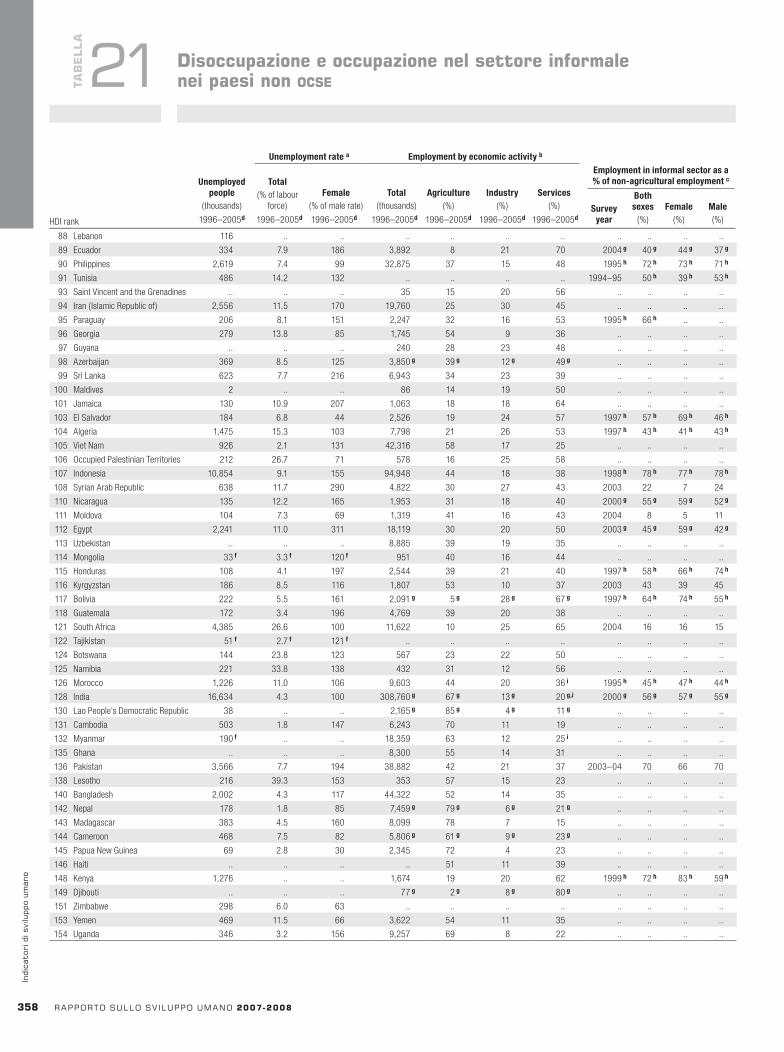
HDI rank
Unemploymentratea Employmentbyeconomicactivityb
Employmentininformalsectorasa%ofnon-agriculturalemploymentcUnemployed
people(thousands)
Total(% of labour
force)Female
(% of male rate)Total
(thousands)Agriculture
(%)Industry
(%)Services
(%) Surveyyear
Bothsexes
(%)Female
(%)Male(%)1996–2005d 1996–2005d 1996–2005d 1996–2005d 1996–2005d 1996–2005d 1996–2005dHDI rank
Unemploymentratea Employmentbyeconomicactivityb
Employmentininformalsectorasa%ofnon-agriculturalemploymentcUnemployed
people(thousands)
Total(% of labour
force)Female
(% of male rate)Total
(thousands)Agriculture
(%)Industry
(%)Services
(%) Surveyyear
Bothsexes
(%)Female
(%)Male(%)1996–2005d 1996–2005d 1996–2005d 1996–2005d 1996–2005d 1996–2005d 1996–2005d
3�8 rapportosullosv iluppoumano2007-2008
indi
cato
rid
isvi
lupp
oum
ano
TaB
ELLa
21 Disoccupazioneeoccupazionenelsettoreinformaleneipaesinonocse
88 Lebanon 116 .. .. .. .. .. .. .. .. .. ..
89 Ecuador 334 7.9 186 3,892 8 21 70 2004g 40g 44g 37g
90 Philippines 2,619 7.4 99 32,875 37 15 48 1995h 72h 73h 71h
91 Tunisia 486 14.2 132 .. .. .. .. 1994–95 50h 39h 53h
93 Saint Vincent and the Grenadines .. .. .. 35 15 20 56 .. .. .. ..
94 Iran ( Islamic Republic of) 2,556 11.5 170 19,760 25 30 45 .. .. .. ..
95 Paraguay 206 8.1 151 2,247 32 16 53 1995h 66h .. ..
96 Georgia 279 13.8 85 1,745 54 9 36 .. .. .. ..
97 Guyana .. .. .. 240 28 23 48 .. .. .. ..
98 Azerbaijan 369 8.5 125 3,850g 39g 12g 49g .. .. .. ..
99 Sri Lanka 623 7.7 216 6,943 34 23 39 .. .. .. ..
100 Maldives 2 .. .. 86 14 19 50 .. .. .. ..
101 Jamaica 130 10.9 207 1,063 18 18 64 .. .. .. ..
103 El Salvador 184 6.8 44 2,526 19 24 57 1997h 57h 69h 46h
104 Algeria 1,475 15.3 103 7,798 21 26 53 1997h 43h 41h 43h
105 Viet Nam 926 2.1 131 42,316 58 17 25 .. .. .. ..
106 Occupied Palestinian Territories 212 26.7 71 578 16 25 58 .. .. .. ..
107 Indonesia 10,854 9.1 155 94,948 44 18 38 1998h 78h 77h 78h
108 Syrian Arab Republic 638 11.7 290 4,822 30 27 43 2003 22 7 24
110 Nicaragua 135 12.2 165 1,953 31 18 40 2000g 55g 59g 52g
111 Moldova 104 7.3 69 1,319 41 16 43 2004 8 5 11
112 Egypt 2,241 11.0 311 18,119 30 20 50 2003g 45g 59g 42g
113 Uzbekistan .. .. .. 8,885 39 19 35 .. .. .. ..
114 Mongolia 33f 3.3f 120f 951 40 16 44 .. .. .. ..
115 Honduras 108 4.1 197 2,544 39 21 40 1997h 58h 66h 74h
116 Kyrgyzstan 186 8.5 116 1,807 53 10 37 2003 43 39 45
117 Bolivia 222 5.5 161 2,091g 5g 28g 67g 1997h 64h 74h 55h
118 Guatemala 172 3.4 196 4,769 39 20 38 .. .. .. ..
121 South Africa 4,385 26.6 100 11,622 10 25 65 2004 16 16 15
122 Tajikistan 51f 2.7f 121f .. .. .. .. .. .. .. ..
124 Botswana 144 23.8 123 567 23 22 50 .. .. .. ..
125 Namibia 221 33.8 138 432 31 12 56 .. .. .. ..
126 Morocco 1,226 11.0 106 9,603 44 20 36i 1995h 45h 47h 44h
128 India 16,634 4.3 100 308,760g 67g 13g 20g,i 2000g 56g 57g 55g
130 Lao People’s Democratic Republic 38 .. .. 2,165g 85g 4g 11g .. .. .. ..
131 Cambodia 503 1.8 147 6,243 70 11 19 .. .. .. ..
132 Myanmar 190f .. .. 18,359 63 12 25i .. .. .. ..
135 Ghana .. .. .. 8,300 55 14 31 .. .. .. ..
136 Pakistan 3,566 7.7 194 38,882 42 21 37 2003–04 70 66 70
138 Lesotho 216 39.3 153 353 57 15 23 .. .. .. ..
140 Bangladesh 2,002 4.3 117 44,322 52 14 35 .. .. .. ..
142 Nepal 178 1.8 85 7,459g 79g 6g 21g .. .. .. ..
143 Madagascar 383 4.5 160 8,099 78 7 15 .. .. .. ..
144 Cameroon 468 7.5 82 5,806g 61g 9g 23g .. .. .. ..
145 Papua New Guinea 69 2.8 30 2,345 72 4 23 .. .. .. ..
146 Haiti .. .. .. .. 51 11 39 .. .. .. ..
148 Kenya 1,276 .. .. 1,674 19 20 62 1999h 72h 83h 59h
149 Djibouti .. .. .. 77g 2g 8g 80g .. .. .. ..
151 Zimbabwe 298 6.0 63 .. .. .. .. .. .. .. ..
153 Yemen 469 11.5 66 3,622 54 11 35 .. .. .. ..
154 Uganda 346 3.2 156 9,257 69 8 22 .. .. .. ..
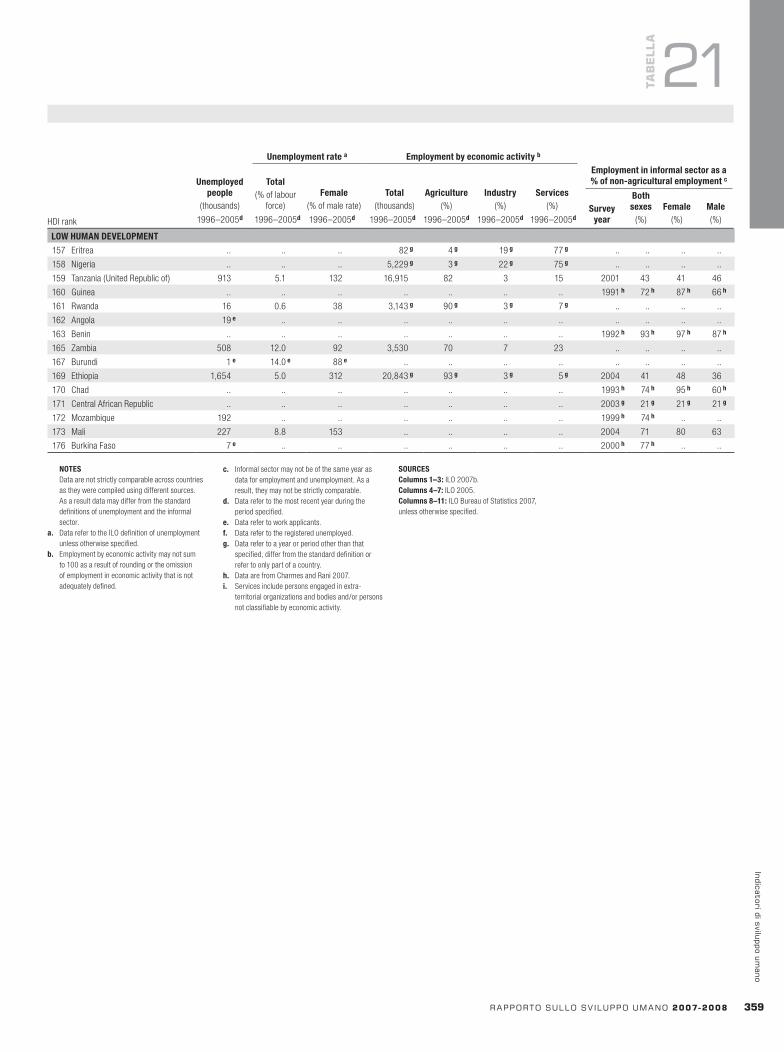
HDI rank
Unemploymentratea Employmentbyeconomicactivityb
Employmentininformalsectorasa%ofnon-agriculturalemploymentcUnemployed
people(thousands)
Total(% of labour
force)Female
(% of male rate)Total
(thousands)Agriculture
(%)Industry
(%)Services
(%) Surveyyear
Bothsexes
(%)Female
(%)Male(%)1996–2005d 1996–2005d 1996–2005d 1996–2005d 1996–2005d 1996–2005d 1996–2005dHDI rank
Unemploymentratea Employmentbyeconomicactivityb
Employmentininformalsectorasa%ofnon-agriculturalemploymentcUnemployed
people(thousands)
Total(% of labour
force)Female
(% of male rate)Total
(thousands)Agriculture
(%)Industry
(%)Services
(%) Surveyyear
Bothsexes
(%)Female
(%)Male(%)1996–2005d 1996–2005d 1996–2005d 1996–2005d 1996–2005d 1996–2005d 1996–2005d
rapportosullosv iluppoumano2007-2008 3��
indicatoridisviluppoumano
NOTES Data are not strictly comparable across countries
as they were compiled using different sources. As a result data may differ from the standard definitions of unemployment and the informal sector.
a. Data refer to the ILO definition of unemployment unless otherwise specified.
b. Employment by economic activity may not sum to 100 as a result of rounding or the omission of employment in economic activity that is not adequately defined.
c. Informal sector may not be of the same year as data for employment and unemployment. As a result, they may not be strictly comparable.
d. Data refer to the most recent year during the period specified.
e. Data refer to work applicants.f. Data refer to the registered unemployed.g. Data refer to a year or period other than that
specified, differ from the standard definition or refer to only part of a country.
h. Data are from Charmes and Rani 2007.i. Services include persons engaged in extra-
territorial organizations and bodies and/or persons not classifiable by economic activity.
SOURCESColumns1–3: ILO 2007b. Columns4–7: ILO 2005.Columns8–11: ILO Bureau of Statistics 2007, unless otherwise specified.
TaB
ELLa
21
LOWHUMANDEVELOPMENT
157 Eritrea .. .. .. 82g 4g 19g 77g .. .. .. ..
158 Nigeria .. .. .. 5,229g 3g 22g 75g .. .. .. ..
159 Tanzania (United Republic of) 913 5.1 132 16,915 82 3 15 2001 43 41 46
160 Guinea .. .. .. .. .. .. .. 1991h 72h 87h 66h
161 Rwanda 16 0.6 38 3,143g 90g 3g 7g .. .. .. ..
162 Angola 19e .. .. .. .. .. .. .. .. .. ..
163 Benin .. .. .. .. .. .. .. 1992h 93h 97h 87h
165 Zambia 508 12.0 92 3,530 70 7 23 .. .. .. ..
167 Burundi 1e 14.0e 88e .. .. .. .. .. .. .. ..
169 Ethiopia 1,654 5.0 312 20,843g 93g 3g 5g 2004 41 48 36
170 Chad .. .. .. .. .. .. .. 1993h 74h 95h 60h
171 Central African Republic .. .. .. .. .. .. .. 2003g 21g 21g 21g
172 Mozambique 192 .. .. .. .. .. .. 1999h 74h .. ..
173 Mali 227 8.8 153 .. .. .. .. 2004 71 80 63
176 Burkina Faso 7e .. .. .. .. .. .. 2000h 77h .. ..

HDI rank
Forestarea
Electricityconsumptionpercapita Electrification
rate(%)
Populationwithout
electricity(millions)
GDPperunitofenergyuse %oftotallandarea
(%)
Total TotalchangeAverageannualchange
(%) (kilowatt-
hours) (% change)(2000 PPP US$ per kg of oil equivalent) (% change)
(thousand sq km)
(thousand sq km)
2004 1990–2004 2000–05 a 2005 2004 1990–2004 2005 2005 1990–2005 1990–2005HDI rank
Forestarea
Electricityconsumptionpercapita Electrification
rate(%)
Populationwithout
electricity(millions)
GDPperunitofenergyuse %oftotallandarea
(%)
Total TotalchangeAverageannualchange
(%) (kilowatt-
hours) (% change)(2000 PPP US$ per kg of oil equivalent) (% change)
(thousand sq km)
(thousand sq km)
2004 1990–2004 2000–05 a 2005 2004 1990–2004 2005 2005 1990–2005 1990–2005
3�0 rapportosullosv iluppoumano2007-2008
indi
cato
rid
isvi
lupp
oum
ano
TaB
ELLa
22 …preservandoleperlegenerazionifuture…
Energiaeambiente
HIGHHUMANDEVELOPMENT
1 Iceland 29,430 66.4 100 .. 2.5 -12.1 0.5 0.5 0.2 5.6
2 Norway 26,657 6.5 100 .. 5.9 15.9 30.7 93.9 2.6 0.2
3 Australia 11,849 30.4 100 .. 4.8 21.3 21.3 1,636.8 -42.3 -0.2
4 Canada 18,408 5.9 100 .. 3.4 12.5 33.6 3,101.3 .. ..
5 Ireland 6,751 62.7 100 .. 9.5 81.9 9.7 6.7 2.3 3.4
6 Sweden 16,670 -1.9 100 .. 4.5 13.0 66.9 275.3 1.6 (.)
7 Switzerland 8,669b 10.3b 100 .. 8.3 0.9 30.9 12.2 0.7 0.4
8 Japan 8,459 21.8 100 .. 6.4 -1.4 68.2 248.7 -0.8 (.)
9 Netherlands 7,196 32.7 100 .. 5.8 11.7 10.8 3.7 0.2 0.4
10 France 8,231c 24.6c 100 .. 5.9 8.0 28.3 155.5 10.2 0.5
11 Finland 17,374 33.2 100 .. 3.8 -1.1 73.9 225.0 3.1 0.1
12 United States 14,240 11.9 100 .. 4.6 25.3 33.1 3,030.9 44.4 0.1
13 Spain 6,412 63.3 100 .. 6.9 -4.9 35.9 179.2 44.4 2.2
14 Denmark 6,967 7.4 100 .. 7.9 14.7 11.8 5.0 0.6 0.8
15 Austria 8,256 27.7 100 .. 7.3 2.9 46.7 38.6 0.9 0.2
16 United Kingdom 6,756 15.9 100 .. 7.3 22.2 11.8 28.5 2.3 0.6
17 Belgium 8,986 33.4 100 .. 5.2 10.3 22.0 6.7 -0.1 -0.1
18 Luxembourg 16,630 21.1 100 .. 6.1 77.5 33.5 0.9 (.) 0.1
19 New Zealand 10,238 6.7 100 .. 5.1 25.0 31.0 83.1 5.9 0.5
20 Italy 6,029d 36.1d 100 .. 8.2 -2.5 33.9 99.8 16.0 1.3
21 Hong Kong, China (SAR) 6,401 34.4 .. .. 11.5 6.4 .. .. .. ..
22 Germany 7,442 10.4 100 .. 6.2 31.6 31.7 110.8 3.4 0.2
23 Israel 6,924 62.8 97 0.2 7.3 4.7 8.3 1.7 0.2 0.7
24 Greece 5,630 60.1 100 .. 7.4 11.1 29.1 37.5 4.5 0.9
25 Singapore 8,685 67.7 100 0.0 4.4 30.6 3.4 (.) 0.0 0.0
26 Korea (Republic of) 7,710 178.3 100 .. 4.2 -6.3 63.5 62.7 -1.1 -0.1
27 Slovenia 7,262 .. .. .. 5.4 10.6 62.8 12.6 0.8 0.4
28 Cyprus 5,718 97.2 .. .. 5.9 8.5 18.9 1.7 0.1 0.5
29 Portugal 4,925 69.9 100 .. 7.1 -9.8 41.3 37.8 6.8 1.5
30 Brunei Darussalam 8,842 80.9 99 0.0 .. .. 52.8 2.8 -0.4 -0.7
31 Barbados 3,304 85.0 .. .. .. .. 4.0 (.) .. ..
32 Czech Republic 6,720 .. .. .. 4.0 30.8 34.3 26.5 0.2 (.)
33 Kuwait 15,423 75.0 100 0.0 1.9 63.1 0.3 0.1 (.) 6.7
34 Malta 5,542 53.4 .. .. 7.5 47.9 1.1 .. .. ..
35 Qatar 19,840 101.8 71 0.2 .. .. (.) .. .. ..
36 Hungary 4,070 6.7 .. .. 5.9 40.6 21.5 19.8 1.8 0.6
37 Poland 3,793 6.9 .. .. 5.1 74.8 30.0 91.9 3.1 0.2
38 Argentina 2,714 70.6 95 1.8 7.4 15.8 12.1 330.2 -22.4 -0.4
39 United Arab Emirates 12,000 41.5 92 0.4 2.2 15.7 3.7 3.1 0.7 1.8
40 Chile 3,347 138.7 99 0.2 6.1 11.9 21.5 161.2 8.6 0.4
41 Bahrain 11,932 52.3 99 0.0 1.8 21.5 0.6 .. .. ..
42 Slovakia 5,335 .. .. .. 3.9 45.3 40.1 19.3 0.1 (.)
43 Lithuania 3,505 .. .. .. 4.5 60.5 33.5 21.0 1.5 0.5
44 Estonia 6,168 .. .. .. 3.5 113.2 53.9 22.8 1.2 0.4
45 Latvia 2,923 .. .. .. 5.6 122.6 47.4 29.4 1.7 0.4
46 Uruguay 2,408 52.4 95 0.2 10.4 5.3 8.6 15.1 6.0 4.4
47 Croatia 3,818 .. .. .. 5.6 12.0 38.2 21.4 0.2 0.1
48 Costa Rica 1,876 54.4 99 0.1 10.0 2.9 46.8 23.9 -1.7 -0.4
49 Bahamas 6,964e 87.0 .. .. .. .. 51.5 5.2 .. ..
50 Seychelles 2,716e 88.2 .. .. .. .. 88.9 0.4 0.0 0.0
51 Cuba 1,380 0.6 96 0.5 .. .. 24.7 27.1 6.6 2.1
52 Mexico 2,130 46.5 .. .. 5.5 8.5 33.7 642.4 -47.8 -0.5
53 Bulgaria 4,582 -10.3 .. .. 3.0 44.7 32.8 36.3 3.0 0.6
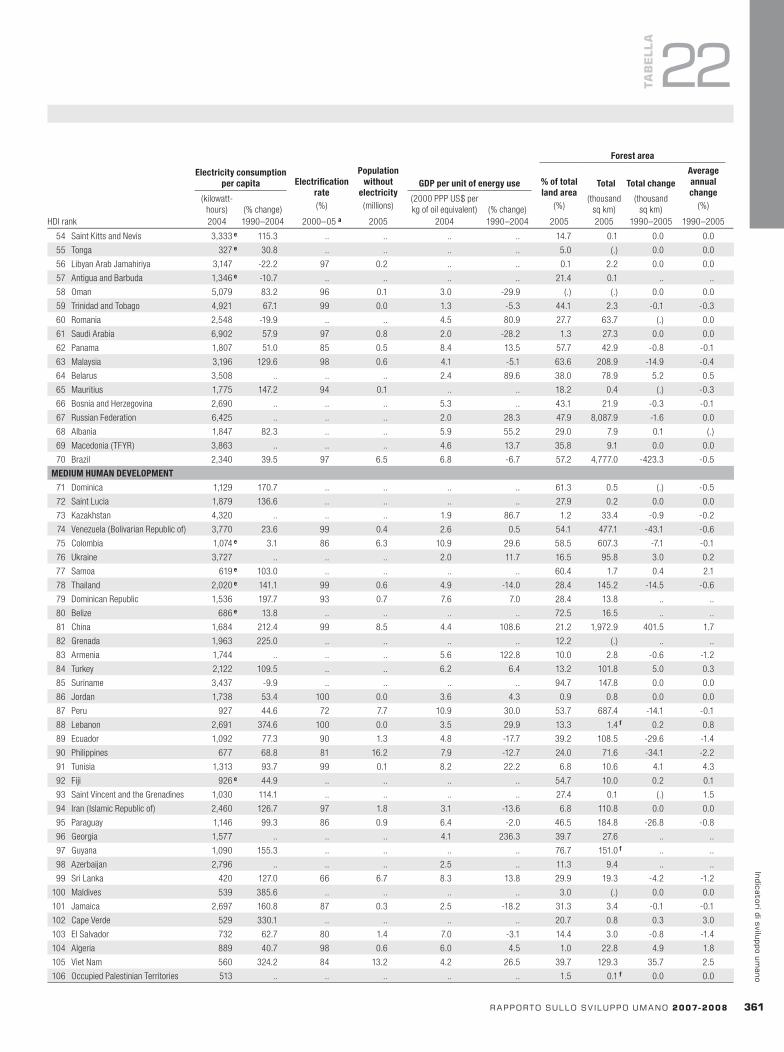
HDI rank
Forestarea
Electricityconsumptionpercapita Electrification
rate(%)
Populationwithout
electricity(millions)
GDPperunitofenergyuse %oftotallandarea
(%)
Total TotalchangeAverageannualchange
(%) (kilowatt-
hours) (% change)(2000 PPP US$ per kg of oil equivalent) (% change)
(thousand sq km)
(thousand sq km)
2004 1990–2004 2000–05 a 2005 2004 1990–2004 2005 2005 1990–2005 1990–2005
rapportosullosv iluppoumano2007-2008 3�1
indicatoridisviluppoumano
TaB
ELLa
22
54 Saint Kitts and Nevis 3,333e 115.3 .. .. .. .. 14.7 0.1 0.0 0.0
55 Tonga 327e 30.8 .. .. .. .. 5.0 (.) 0.0 0.0
56 Libyan Arab Jamahiriya 3,147 -22.2 97 0.2 .. .. 0.1 2.2 0.0 0.0
57 Antigua and Barbuda 1,346e -10.7 .. .. .. .. 21.4 0.1 .. ..
58 Oman 5,079 83.2 96 0.1 3.0 -29.9 (.) (.) 0.0 0.0
59 Trinidad and Tobago 4,921 67.1 99 0.0 1.3 -5.3 44.1 2.3 -0.1 -0.3
60 Romania 2,548 -19.9 .. .. 4.5 80.9 27.7 63.7 (.) 0.0
61 Saudi Arabia 6,902 57.9 97 0.8 2.0 -28.2 1.3 27.3 0.0 0.0
62 Panama 1,807 51.0 85 0.5 8.4 13.5 57.7 42.9 -0.8 -0.1
63 Malaysia 3,196 129.6 98 0.6 4.1 -5.1 63.6 208.9 -14.9 -0.4
64 Belarus 3,508 .. .. .. 2.4 89.6 38.0 78.9 5.2 0.5
65 Mauritius 1,775 147.2 94 0.1 .. .. 18.2 0.4 (.) -0.3
66 Bosnia and Herzegovina 2,690 .. .. .. 5.3 .. 43.1 21.9 -0.3 -0.1
67 Russian Federation 6,425 .. .. .. 2.0 28.3 47.9 8,087.9 -1.6 0.0
68 Albania 1,847 82.3 .. .. 5.9 55.2 29.0 7.9 0.1 (.)
69 Macedonia (TFYR) 3,863 .. .. .. 4.6 13.7 35.8 9.1 0.0 0.0
70 Brazil 2,340 39.5 97 6.5 6.8 -6.7 57.2 4,777.0 -423.3 -0.5
MEDIUMHUMANDEVELOPMENT
71 Dominica 1,129 170.7 .. .. .. .. 61.3 0.5 (.) -0.5
72 Saint Lucia 1,879 136.6 .. .. .. .. 27.9 0.2 0.0 0.0
73 Kazakhstan 4,320 .. .. .. 1.9 86.7 1.2 33.4 -0.9 -0.2
74 Venezuela (Bolivarian Republic of) 3,770 23.6 99 0.4 2.6 0.5 54.1 477.1 -43.1 -0.6
75 Colombia 1,074e 3.1 86 6.3 10.9 29.6 58.5 607.3 -7.1 -0.1
76 Ukraine 3,727 .. .. .. 2.0 11.7 16.5 95.8 3.0 0.2
77 Samoa 619e 103.0 .. .. .. .. 60.4 1.7 0.4 2.1
78 Thailand 2,020e 141.1 99 0.6 4.9 -14.0 28.4 145.2 -14.5 -0.6
79 Dominican Republic 1,536 197.7 93 0.7 7.6 7.0 28.4 13.8 .. ..
80 Belize 686e 13.8 .. .. .. .. 72.5 16.5 .. ..
81 China 1,684 212.4 99 8.5 4.4 108.6 21.2 1,972.9 401.5 1.7
82 Grenada 1,963 225.0 .. .. .. .. 12.2 (.) .. ..
83 Armenia 1,744 .. .. .. 5.6 122.8 10.0 2.8 -0.6 -1.2
84 Turkey 2,122 109.5 .. .. 6.2 6.4 13.2 101.8 5.0 0.3
85 Suriname 3,437 -9.9 .. .. .. .. 94.7 147.8 0.0 0.0
86 Jordan 1,738 53.4 100 0.0 3.6 4.3 0.9 0.8 0.0 0.0
87 Peru 927 44.6 72 7.7 10.9 30.0 53.7 687.4 -14.1 -0.1
88 Lebanon 2,691 374.6 100 0.0 3.5 29.9 13.3 1.4f 0.2 0.8
89 Ecuador 1,092 77.3 90 1.3 4.8 -17.7 39.2 108.5 -29.6 -1.4
90 Philippines 677 68.8 81 16.2 7.9 -12.7 24.0 71.6 -34.1 -2.2
91 Tunisia 1,313 93.7 99 0.1 8.2 22.2 6.8 10.6 4.1 4.3
92 Fiji 926e 44.9 .. .. .. .. 54.7 10.0 0.2 0.1
93 Saint Vincent and the Grenadines 1,030 114.1 .. .. .. .. 27.4 0.1 (.) 1.5
94 Iran ( Islamic Republic of) 2,460 126.7 97 1.8 3.1 -13.6 6.8 110.8 0.0 0.0
95 Paraguay 1,146 99.3 86 0.9 6.4 -2.0 46.5 184.8 -26.8 -0.8
96 Georgia 1,577 .. .. .. 4.1 236.3 39.7 27.6 .. ..
97 Guyana 1,090 155.3 .. .. .. .. 76.7 151.0f .. ..
98 Azerbaijan 2,796 .. .. .. 2.5 .. 11.3 9.4 .. ..
99 Sri Lanka 420 127.0 66 6.7 8.3 13.8 29.9 19.3 -4.2 -1.2
100 Maldives 539 385.6 .. .. .. .. 3.0 (.) 0.0 0.0
101 Jamaica 2,697 160.8 87 0.3 2.5 -18.2 31.3 3.4 -0.1 -0.1
102 Cape Verde 529 330.1 .. .. .. .. 20.7 0.8 0.3 3.0
103 El Salvador 732 62.7 80 1.4 7.0 -3.1 14.4 3.0 -0.8 -1.4
104 Algeria 889 40.7 98 0.6 6.0 4.5 1.0 22.8 4.9 1.8
105 Viet Nam 560 324.2 84 13.2 4.2 26.5 39.7 129.3 35.7 2.5
106 Occupied Palestinian Territories 513 .. .. .. .. .. 1.5 0.1f 0.0 0.0

HDI rank
Forestarea
Electricityconsumptionpercapita Electrification
rate(%)
Populationwithout
electricity(millions)
GDPperunitofenergyuse %oftotallandarea
(%)
Total TotalchangeAverageannualchange
(%) (kilowatt-
hours) (% change)(2000 PPP US$ per kg of oil equivalent) (% change)
(thousand sq km)
(thousand sq km)
2004 1990–2004 2000–05 a 2005 2004 1990–2004 2005 2005 1990–2005 1990–2005HDI rank
Forestarea
Electricityconsumptionpercapita Electrification
rate(%)
Populationwithout
electricity(millions)
GDPperunitofenergyuse %oftotallandarea
(%)
Total TotalchangeAverageannualchange
(%) (kilowatt-
hours) (% change)(2000 PPP US$ per kg of oil equivalent) (% change)
(thousand sq km)
(thousand sq km)
2004 1990–2004 2000–05 a 2005 2004 1990–2004 2005 2005 1990–2005 1990–2005
3�2 rapportosullosv iluppoumano2007-2008
indi
cato
rid
isvi
lupp
oum
ano
TaB
ELLa
22 Energiaeambiente
107 Indonesia 476e 75.0 54 101.2 4.1 -0.1 48.8 885.0 -280.7 -1.6
108 Syrian Arab Republic 1,784 88.4 90 1.9 3.4 19.9 2.5 4.6 0.9 1.6
109 Turkmenistan 2,060 .. .. .. 1.3g -21.3 8.8 41.3 0.0 0.0
110 Nicaragua 525 37.1 69 1.7 5.2 -2.3 42.7 51.9 -13.5 -1.4
111 Moldova 1,554 .. .. .. 2.0 40.8 10.0 3.3 0.1 0.2
112 Egypt 1,465e 93.0 98 1.5 4.9 -2.2 0.1 0.7 0.2 3.5
113 Uzbekistan 1,944 .. .. .. 0.8 11.1 8.0 33.0 2.5 0.5
114 Mongolia 1,260 -25.2 65 1.0 .. .. 6.5 102.5 -12.4 -0.7
115 Honduras 730 79.4 62 2.7 4.8 -3.9 41.5 46.5 -27.4 -2.5
116 Kyrgyzstan 2,320 .. .. .. 3.3 92.3 4.5 8.7 0.3 0.3
117 Bolivia 493 42.1 64 3.3 4.5 -10.6 54.2 587.4 -40.6 -0.4
118 Guatemala 532 100.0 79 2.7 6.4 -3.6 36.3 39.4 -8.1 -1.1
119 Gabon 1,128 5.4 48 0.7 4.9 3.1 84.5 217.8 -1.5 (.)
120 Vanuatu 206e 18.4 .. .. .. .. 36.1 4.4 0.0 0.0
121 South Africa 4,818h 20.8h 70 14.0 3.7 -4.5 7.6 92.0 0.0 0.0
122 Tajikistan 2,638 .. .. .. 2.1 139.6 2.9 4.1 (.) (.)
123 Sao Tome and Principe 99e -23.8 .. .. .. .. 28.4 0.3 0.0 0.0
124 Botswana ..i ..i 39 1.1 8.6 40.0 21.1 119.4 -17.8 -0.9
125 Namibia ..i ..i 34 1.4 10.2 -16.5 9.3 76.6 -11.0 -0.8
126 Morocco 652 84.7 85 4.5 10.3 -13.9 9.8 43.6 0.8 0.1
127 Equatorial Guinea 52e 0 .. .. .. .. 58.2 16.3 -2.3 -0.8
128 India 618 77.6 56 487.2 5.5 37.1 22.8 677.0 37.6 0.4
129 Solomon Islands 107e 13.8 .. .. .. .. 77.6 21.7 -6.0 -1.4
130 Lao People’s Democratic Republic 126e 80.0 .. .. .. .. 69.9 161.4 -11.7 -0.5
131 Cambodia 10e -44.4 20 10.9 .. .. 59.2 104.5 -25.0 -1.3
132 Myanmar 129 111.5 11 45.1 .. .. 49.0 322.2 -70.0 -1.2
133 Bhutan 229e 126.7 .. .. .. .. 68.0 32.0 1.6 0.4
134 Comoros 31e 3.3 .. .. .. .. 2.9 0.1 -0.1 -3.9
135 Ghana 289 -22.3 49 11.3 5.4 18.3 24.2 55.2 -19.3 -1.7
136 Pakistan 564 61.6 54 71.1 4.2 7.7 2.5 19.0 -6.3 -1.6
137 Mauritania 112e 60.0 .. .. .. .. 0.3 2.7 -1.5 -2.4
138 Lesotho ..i ..i 11 1.9 .. .. 0.3 0.1 (.) 4.0
139 Congo 229 -2.1 20 3.2 3.3 45.4 65.8 224.7 -2.6 -0.1
140 Bangladesh 154 111.0 32 96.2 10.5 7.2 6.7 8.7 -0.1 -0.1
141 Swaziland ..i ..i .. .. .. .. 31.5 5.4 0.7 1.0
142 Nepal 86 104.8 33 18.1 4.0 18.4 25.4 36.4 -11.8 -1.6
143 Madagascar 56 5.7 15 15.2 .. .. 22.1 128.4 -8.5 -0.4
144 Cameroon 256 8.9 47 8.7 4.5 -4.4 45.6 212.5 -33.0 -0.9
145 Papua New Guinea 620e 28.1 .. .. .. .. 65.0 294.4 -20.9 -0.4
146 Haiti 61 -17.6 36 5.5 6.2 -39.9 3.8 1.1 -0.1 -0.6
147 Sudan 116 123.1 30 25.4 3.7 33.2 28.4 675.5 -88.4 -0.8
148 Kenya 169 26.1 14 29.4 2.1 -3.8 6.2 35.2 -1.9 -0.3
149 Djibouti 260e -46.8 .. .. .. .. 0.2 0.1 .. ..
150 Timor-Leste 294e .. .. .. .. .. 53.7 8.0 -1.7 -1.2
151 Zimbabwe 924 -10.1 34 8.7 2.6 -13.4 45.3 175.4 -46.9 -1.4
152 Togo 102 1.0 17 5.1 3.1 -26.9 7.1 3.9 -3.0 -2.9
153 Yemen 208 34.2 36 13.2 2.8 -6.0 1.0 5.5 0.0 0.0
154 Uganda 63e 61.5 9 24.6 .. .. 18.4 36.3 -13.0 -1.8
155 Gambia 98e 30.7 .. .. .. .. 41.7 4.7 0.3 0.4
LOWHUMANDEVELOPMENT
156 Senegal 206 70.2 33 7.8 6.5 28.2 45.0 86.7 -6.8 -0.5
157 Eritrea 67 .. 20 3.5 .. .. 15.4 15.5 -0.7 -0.3
158 Nigeria 157 -1.9 46 71.1 1.4 22.7 12.2 110.9 -61.5 -2.4
159 Tanzania (United Republic of) 69 4.5 11 34.2 1.3 -12.5 39.9 352.6 -61.8 -1.0
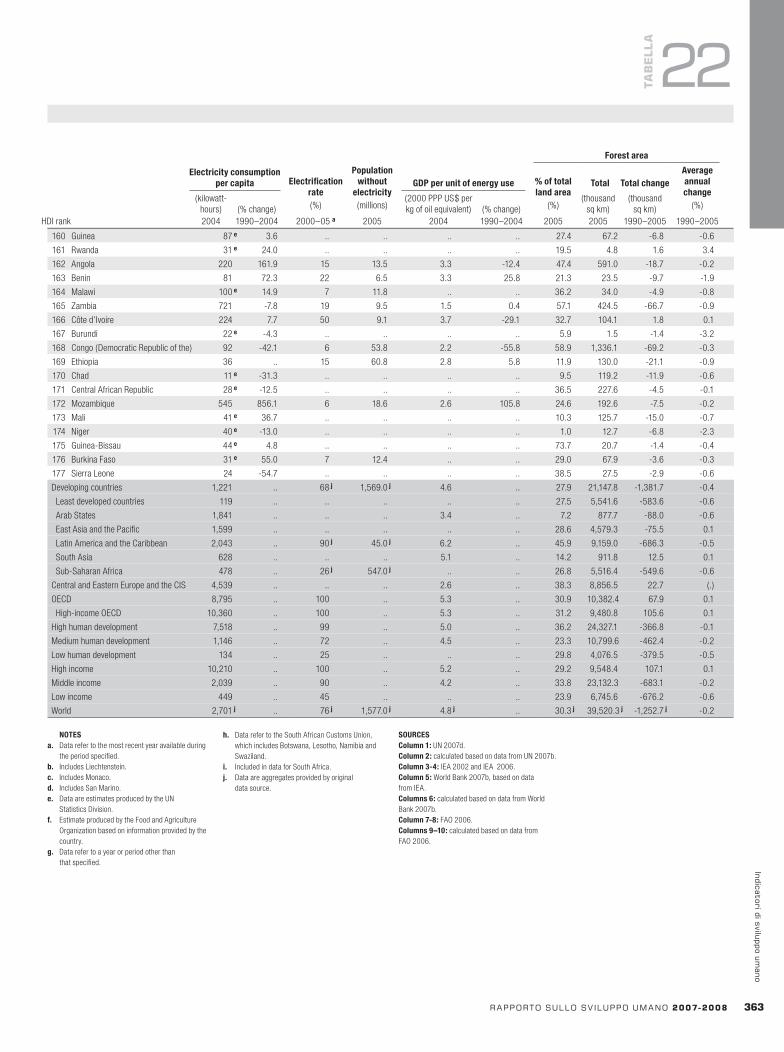
HDI rank
Forestarea
Electricityconsumptionpercapita Electrification
rate(%)
Populationwithout
electricity(millions)
GDPperunitofenergyuse %oftotallandarea
(%)
Total TotalchangeAverageannualchange
(%) (kilowatt-
hours) (% change)(2000 PPP US$ per kg of oil equivalent) (% change)
(thousand sq km)
(thousand sq km)
2004 1990–2004 2000–05 a 2005 2004 1990–2004 2005 2005 1990–2005 1990–2005
rapportosullosv iluppoumano2007-2008 3�3
indicatoridisviluppoumano
TaB
ELLa
22
NOTESa. Data refer to the most recent year available during
the period specified.b. Includes Liechtenstein.c. Includes Monaco.d. Includes San Marino.e. Data are estimates produced by the UN
Statistics Division.f. Estimate produced by the Food and Agriculture
Organization based on information provided by the country.
g. Data refer to a year or period other than that specified.
h. Data refer to the South African Customs Union, which includes Botswana, Lesotho, Namibia and Swaziland.
i. Included in data for South Africa.j. Data are aggregates provided by original
data source.
SOURCESColumn1: UN 2007d.Column2: calculated based on data from UN 2007b.Column3-4: IEA 2002 and IEA 2006.Column5: World Bank 2007b, based on data from IEA. Columns6: calculated based on data from World Bank 2007b.Column7-8: FAO 2006.Columns9–10: calculated based on data from FAO 2006.
160 Guinea 87e 3.6 .. .. .. .. 27.4 67.2 -6.8 -0.6
161 Rwanda 31e 24.0 .. .. .. .. 19.5 4.8 1.6 3.4
162 Angola 220 161.9 15 13.5 3.3 -12.4 47.4 591.0 -18.7 -0.2
163 Benin 81 72.3 22 6.5 3.3 25.8 21.3 23.5 -9.7 -1.9
164 Malawi 100e 14.9 7 11.8 .. .. 36.2 34.0 -4.9 -0.8
165 Zambia 721 -7.8 19 9.5 1.5 0.4 57.1 424.5 -66.7 -0.9
166 Côte d’Ivoire 224 7.7 50 9.1 3.7 -29.1 32.7 104.1 1.8 0.1
167 Burundi 22e -4.3 .. .. .. .. 5.9 1.5 -1.4 -3.2
168 Congo (Democratic Republic of the) 92 -42.1 6 53.8 2.2 -55.8 58.9 1,336.1 -69.2 -0.3
169 Ethiopia 36 .. 15 60.8 2.8 5.8 11.9 130.0 -21.1 -0.9
170 Chad 11e -31.3 .. .. .. .. 9.5 119.2 -11.9 -0.6
171 Central African Republic 28e -12.5 .. .. .. .. 36.5 227.6 -4.5 -0.1
172 Mozambique 545 856.1 6 18.6 2.6 105.8 24.6 192.6 -7.5 -0.2
173 Mali 41e 36.7 .. .. .. .. 10.3 125.7 -15.0 -0.7
174 Niger 40e -13.0 .. .. .. .. 1.0 12.7 -6.8 -2.3
175 Guinea-Bissau 44e 4.8 .. .. .. .. 73.7 20.7 -1.4 -0.4
176 Burkina Faso 31e 55.0 7 12.4 .. .. 29.0 67.9 -3.6 -0.3
177 Sierra Leone 24 -54.7 .. .. .. .. 38.5 27.5 -2.9 -0.6
Developing countries 1,221 .. 68j 1,569.0j 4.6 .. 27.9 21,147.8 -1,381.7 -0.4
Least developed countries 119 .. .. .. .. .. 27.5 5,541.6 -583.6 -0.6
Arab States 1,841 .. .. .. 3.4 .. 7.2 877.7 -88.0 -0.6
East Asia and the Pacific 1,599 .. .. .. .. .. 28.6 4,579.3 -75.5 0.1
Latin America and the Caribbean 2,043 .. 90j 45.0j 6.2 .. 45.9 9,159.0 -686.3 -0.5
South Asia 628 .. .. .. 5.1 .. 14.2 911.8 12.5 0.1
Sub-Saharan Africa 478 .. 26j 547.0j .. .. 26.8 5,516.4 -549.6 -0.6
Central and Eastern Europe and the CIS 4,539 .. .. .. 2.6 .. 38.3 8,856.5 22.7 (.)
OECD 8,795 .. 100 .. 5.3 .. 30.9 10,382.4 67.9 0.1
High-income OECD 10,360 .. 100 .. 5.3 .. 31.2 9,480.8 105.6 0.1
High human development 7,518 .. 99 .. 5.0 .. 36.2 24,327.1 -366.8 -0.1
Medium human development 1,146 .. 72 .. 4.5 .. 23.3 10,799.6 -462.4 -0.2
Low human development 134 .. 25 .. .. .. 29.8 4,076.5 -379.5 -0.5
High income 10,210 .. 100 .. 5.2 .. 29.2 9,548.4 107.1 0.1
Middle income 2,039 .. 90 .. 4.2 .. 33.8 23,132.3 -683.1 -0.2
Low income 449 .. 45 .. .. .. 23.9 6,745.6 -676.2 -0.6
World 2,701j .. 76j 1,577.0j 4.8j .. 30.3j 39,520.3j -1,252.7j -0.2
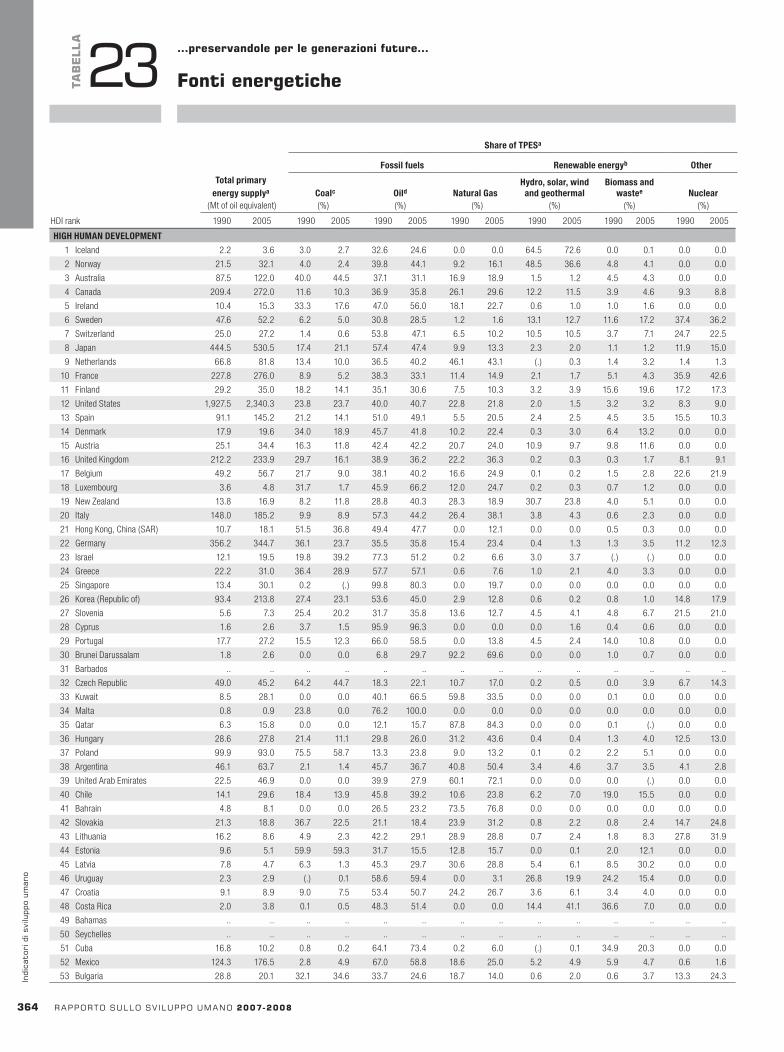
HDI rank
ShareofTPESa
Fossilfuels Renewableenergyb Other
Totalprimaryenergysupplya Coalc Oild NaturalGas
Hydro,solar,windandgeothermal
Biomassandwastee Nuclear
(Mt of oil equivalent) (%) (%) (%) (%) (%) (%)
1990 2005 1990 2005 1990 2005 1990 2005 1990 2005 1990 2005 1990 2005
3�4 rapportosullosv iluppoumano2007-2008
indi
cato
rid
isvi
lupp
oum
ano
HIGHHUMANDEVELOPMENT
1 Iceland 2.2 3.6 3.0 2.7 32.6 24.6 0.0 0.0 64.5 72.6 0.0 0.1 0.0 0.0
2 Norway 21.5 32.1 4.0 2.4 39.8 44.1 9.2 16.1 48.5 36.6 4.8 4.1 0.0 0.0
3 Australia 87.5 122.0 40.0 44.5 37.1 31.1 16.9 18.9 1.5 1.2 4.5 4.3 0.0 0.0
4 Canada 209.4 272.0 11.6 10.3 36.9 35.8 26.1 29.6 12.2 11.5 3.9 4.6 9.3 8.8
5 Ireland 10.4 15.3 33.3 17.6 47.0 56.0 18.1 22.7 0.6 1.0 1.0 1.6 0.0 0.0
6 Sweden 47.6 52.2 6.2 5.0 30.8 28.5 1.2 1.6 13.1 12.7 11.6 17.2 37.4 36.2
7 Switzerland 25.0 27.2 1.4 0.6 53.8 47.1 6.5 10.2 10.5 10.5 3.7 7.1 24.7 22.5
8 Japan 444.5 530.5 17.4 21.1 57.4 47.4 9.9 13.3 2.3 2.0 1.1 1.2 11.9 15.0
9 Netherlands 66.8 81.8 13.4 10.0 36.5 40.2 46.1 43.1 (.) 0.3 1.4 3.2 1.4 1.3
10 France 227.8 276.0 8.9 5.2 38.3 33.1 11.4 14.9 2.1 1.7 5.1 4.3 35.9 42.6
11 Finland 29.2 35.0 18.2 14.1 35.1 30.6 7.5 10.3 3.2 3.9 15.6 19.6 17.2 17.3
12 United States 1,927.5 2,340.3 23.8 23.7 40.0 40.7 22.8 21.8 2.0 1.5 3.2 3.2 8.3 9.0
13 Spain 91.1 145.2 21.2 14.1 51.0 49.1 5.5 20.5 2.4 2.5 4.5 3.5 15.5 10.3
14 Denmark 17.9 19.6 34.0 18.9 45.7 41.8 10.2 22.4 0.3 3.0 6.4 13.2 0.0 0.0
15 Austria 25.1 34.4 16.3 11.8 42.4 42.2 20.7 24.0 10.9 9.7 9.8 11.6 0.0 0.0
16 United Kingdom 212.2 233.9 29.7 16.1 38.9 36.2 22.2 36.3 0.2 0.3 0.3 1.7 8.1 9.1
17 Belgium 49.2 56.7 21.7 9.0 38.1 40.2 16.6 24.9 0.1 0.2 1.5 2.8 22.6 21.9
18 Luxembourg 3.6 4.8 31.7 1.7 45.9 66.2 12.0 24.7 0.2 0.3 0.7 1.2 0.0 0.0
19 New Zealand 13.8 16.9 8.2 11.8 28.8 40.3 28.3 18.9 30.7 23.8 4.0 5.1 0.0 0.0
20 Italy 148.0 185.2 9.9 8.9 57.3 44.2 26.4 38.1 3.8 4.3 0.6 2.3 0.0 0.0
21 Hong Kong, China (SAR) 10.7 18.1 51.5 36.8 49.4 47.7 0.0 12.1 0.0 0.0 0.5 0.3 0.0 0.0
22 Germany 356.2 344.7 36.1 23.7 35.5 35.8 15.4 23.4 0.4 1.3 1.3 3.5 11.2 12.3
23 Israel 12.1 19.5 19.8 39.2 77.3 51.2 0.2 6.6 3.0 3.7 (.) (.) 0.0 0.0
24 Greece 22.2 31.0 36.4 28.9 57.7 57.1 0.6 7.6 1.0 2.1 4.0 3.3 0.0 0.0
25 Singapore 13.4 30.1 0.2 (.) 99.8 80.3 0.0 19.7 0.0 0.0 0.0 0.0 0.0 0.0
26 Korea (Republic of) 93.4 213.8 27.4 23.1 53.6 45.0 2.9 12.8 0.6 0.2 0.8 1.0 14.8 17.9
27 Slovenia 5.6 7.3 25.4 20.2 31.7 35.8 13.6 12.7 4.5 4.1 4.8 6.7 21.5 21.0
28 Cyprus 1.6 2.6 3.7 1.5 95.9 96.3 0.0 0.0 0.0 1.6 0.4 0.6 0.0 0.0
29 Portugal 17.7 27.2 15.5 12.3 66.0 58.5 0.0 13.8 4.5 2.4 14.0 10.8 0.0 0.0
30 Brunei Darussalam 1.8 2.6 0.0 0.0 6.8 29.7 92.2 69.6 0.0 0.0 1.0 0.7 0.0 0.0
31 Barbados .. .. .. .. .. .. .. .. .. .. .. .. .. ..
32 Czech Republic 49.0 45.2 64.2 44.7 18.3 22.1 10.7 17.0 0.2 0.5 0.0 3.9 6.7 14.3
33 Kuwait 8.5 28.1 0.0 0.0 40.1 66.5 59.8 33.5 0.0 0.0 0.1 0.0 0.0 0.0
34 Malta 0.8 0.9 23.8 0.0 76.2 100.0 0.0 0.0 0.0 0.0 0.0 0.0 0.0 0.0
35 Qatar 6.3 15.8 0.0 0.0 12.1 15.7 87.8 84.3 0.0 0.0 0.1 (.) 0.0 0.0
36 Hungary 28.6 27.8 21.4 11.1 29.8 26.0 31.2 43.6 0.4 0.4 1.3 4.0 12.5 13.0
37 Poland 99.9 93.0 75.5 58.7 13.3 23.8 9.0 13.2 0.1 0.2 2.2 5.1 0.0 0.0
38 Argentina 46.1 63.7 2.1 1.4 45.7 36.7 40.8 50.4 3.4 4.6 3.7 3.5 4.1 2.8
39 United Arab Emirates 22.5 46.9 0.0 0.0 39.9 27.9 60.1 72.1 0.0 0.0 0.0 (.) 0.0 0.0
40 Chile 14.1 29.6 18.4 13.9 45.8 39.2 10.6 23.8 6.2 7.0 19.0 15.5 0.0 0.0
41 Bahrain 4.8 8.1 0.0 0.0 26.5 23.2 73.5 76.8 0.0 0.0 0.0 0.0 0.0 0.0
42 Slovakia 21.3 18.8 36.7 22.5 21.1 18.4 23.9 31.2 0.8 2.2 0.8 2.4 14.7 24.8
43 Lithuania 16.2 8.6 4.9 2.3 42.2 29.1 28.9 28.8 0.7 2.4 1.8 8.3 27.8 31.9
44 Estonia 9.6 5.1 59.9 59.3 31.7 15.5 12.8 15.7 0.0 0.1 2.0 12.1 0.0 0.0
45 Latvia 7.8 4.7 6.3 1.3 45.3 29.7 30.6 28.8 5.4 6.1 8.5 30.2 0.0 0.0
46 Uruguay 2.3 2.9 (.) 0.1 58.6 59.4 0.0 3.1 26.8 19.9 24.2 15.4 0.0 0.0
47 Croatia 9.1 8.9 9.0 7.5 53.4 50.7 24.2 26.7 3.6 6.1 3.4 4.0 0.0 0.0
48 Costa Rica 2.0 3.8 0.1 0.5 48.3 51.4 0.0 0.0 14.4 41.1 36.6 7.0 0.0 0.0
49 Bahamas .. .. .. .. .. .. .. .. .. .. .. .. .. ..
50 Seychelles .. .. .. .. .. .. .. .. .. .. .. .. .. ..
51 Cuba 16.8 10.2 0.8 0.2 64.1 73.4 0.2 6.0 (.) 0.1 34.9 20.3 0.0 0.0
52 Mexico 124.3 176.5 2.8 4.9 67.0 58.8 18.6 25.0 5.2 4.9 5.9 4.7 0.6 1.6
53 Bulgaria 28.8 20.1 32.1 34.6 33.7 24.6 18.7 14.0 0.6 2.0 0.6 3.7 13.3 24.3
…preservandoleperlegenerazionifuture…
FontienergeticheTaB
ELLa
23
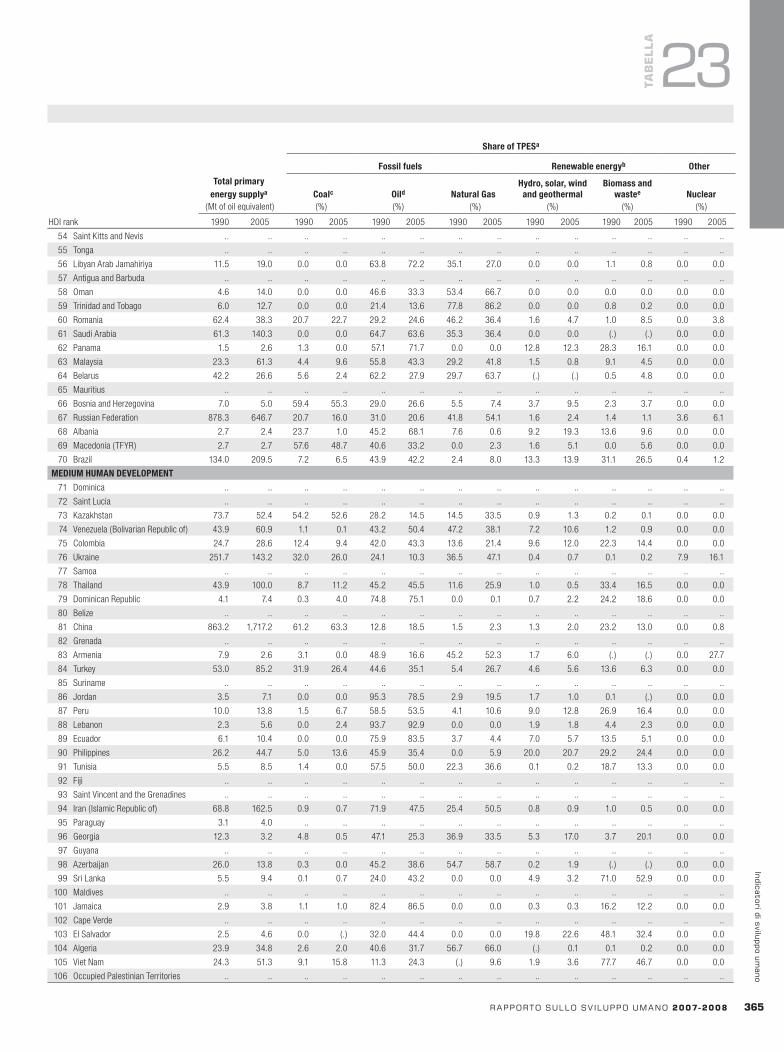
HDI rank
ShareofTPESa
Fossilfuels Renewableenergyb Other
Totalprimaryenergysupplya Coalc Oild NaturalGas
Hydro,solar,windandgeothermal
Biomassandwastee Nuclear
(Mt of oil equivalent) (%) (%) (%) (%) (%) (%)
1990 2005 1990 2005 1990 2005 1990 2005 1990 2005 1990 2005 1990 2005
rapportosullosv iluppoumano2007-2008 3��
indicatoridisviluppoumano
TaB
ELLa
23
54 Saint Kitts and Nevis .. .. .. .. .. .. .. .. .. .. .. .. .. ..
55 Tonga .. .. .. .. .. .. .. .. .. .. .. .. .. ..
56 Libyan Arab Jamahiriya 11.5 19.0 0.0 0.0 63.8 72.2 35.1 27.0 0.0 0.0 1.1 0.8 0.0 0.0
57 Antigua and Barbuda .. .. .. .. .. .. .. .. .. .. .. .. .. ..
58 Oman 4.6 14.0 0.0 0.0 46.6 33.3 53.4 66.7 0.0 0.0 0.0 0.0 0.0 0.0
59 Trinidad and Tobago 6.0 12.7 0.0 0.0 21.4 13.6 77.8 86.2 0.0 0.0 0.8 0.2 0.0 0.0
60 Romania 62.4 38.3 20.7 22.7 29.2 24.6 46.2 36.4 1.6 4.7 1.0 8.5 0.0 3.8
61 Saudi Arabia 61.3 140.3 0.0 0.0 64.7 63.6 35.3 36.4 0.0 0.0 (.) (.) 0.0 0.0
62 Panama 1.5 2.6 1.3 0.0 57.1 71.7 0.0 0.0 12.8 12.3 28.3 16.1 0.0 0.0
63 Malaysia 23.3 61.3 4.4 9.6 55.8 43.3 29.2 41.8 1.5 0.8 9.1 4.5 0.0 0.0
64 Belarus 42.2 26.6 5.6 2.4 62.2 27.9 29.7 63.7 (.) (.) 0.5 4.8 0.0 0.0
65 Mauritius .. .. .. .. .. .. .. .. .. .. .. .. .. ..
66 Bosnia and Herzegovina 7.0 5.0 59.4 55.3 29.0 26.6 5.5 7.4 3.7 9.5 2.3 3.7 0.0 0.0
67 Russian Federation 878.3 646.7 20.7 16.0 31.0 20.6 41.8 54.1 1.6 2.4 1.4 1.1 3.6 6.1
68 Albania 2.7 2.4 23.7 1.0 45.2 68.1 7.6 0.6 9.2 19.3 13.6 9.6 0.0 0.0
69 Macedonia (TFYR) 2.7 2.7 57.6 48.7 40.6 33.2 0.0 2.3 1.6 5.1 0.0 5.6 0.0 0.0
70 Brazil 134.0 209.5 7.2 6.5 43.9 42.2 2.4 8.0 13.3 13.9 31.1 26.5 0.4 1.2
MEDIUMHUMANDEVELOPMENT
71 Dominica .. .. .. .. .. .. .. .. .. .. .. .. .. ..
72 Saint Lucia .. .. .. .. .. .. .. .. .. .. .. .. .. ..
73 Kazakhstan 73.7 52.4 54.2 52.6 28.2 14.5 14.5 33.5 0.9 1.3 0.2 0.1 0.0 0.0
74 Venezuela (Bolivarian Republic of) 43.9 60.9 1.1 0.1 43.2 50.4 47.2 38.1 7.2 10.6 1.2 0.9 0.0 0.0
75 Colombia 24.7 28.6 12.4 9.4 42.0 43.3 13.6 21.4 9.6 12.0 22.3 14.4 0.0 0.0
76 Ukraine 251.7 143.2 32.0 26.0 24.1 10.3 36.5 47.1 0.4 0.7 0.1 0.2 7.9 16.1
77 Samoa .. .. .. .. .. .. .. .. .. .. .. .. .. ..
78 Thailand 43.9 100.0 8.7 11.2 45.2 45.5 11.6 25.9 1.0 0.5 33.4 16.5 0.0 0.0
79 Dominican Republic 4.1 7.4 0.3 4.0 74.8 75.1 0.0 0.1 0.7 2.2 24.2 18.6 0.0 0.0
80 Belize .. .. .. .. .. .. .. .. .. .. .. .. .. ..
81 China 863.2 1,717.2 61.2 63.3 12.8 18.5 1.5 2.3 1.3 2.0 23.2 13.0 0.0 0.8
82 Grenada .. .. .. .. .. .. .. .. .. .. .. .. .. ..
83 Armenia 7.9 2.6 3.1 0.0 48.9 16.6 45.2 52.3 1.7 6.0 (.) (.) 0.0 27.7
84 Turkey 53.0 85.2 31.9 26.4 44.6 35.1 5.4 26.7 4.6 5.6 13.6 6.3 0.0 0.0
85 Suriname .. .. .. .. .. .. .. .. .. .. .. .. .. ..
86 Jordan 3.5 7.1 0.0 0.0 95.3 78.5 2.9 19.5 1.7 1.0 0.1 (.) 0.0 0.0
87 Peru 10.0 13.8 1.5 6.7 58.5 53.5 4.1 10.6 9.0 12.8 26.9 16.4 0.0 0.0
88 Lebanon 2.3 5.6 0.0 2.4 93.7 92.9 0.0 0.0 1.9 1.8 4.4 2.3 0.0 0.0
89 Ecuador 6.1 10.4 0.0 0.0 75.9 83.5 3.7 4.4 7.0 5.7 13.5 5.1 0.0 0.0
90 Philippines 26.2 44.7 5.0 13.6 45.9 35.4 0.0 5.9 20.0 20.7 29.2 24.4 0.0 0.0
91 Tunisia 5.5 8.5 1.4 0.0 57.5 50.0 22.3 36.6 0.1 0.2 18.7 13.3 0.0 0.0
92 Fiji .. .. .. .. .. .. .. .. .. .. .. .. .. ..
93 Saint Vincent and the Grenadines .. .. .. .. .. .. .. .. .. .. .. .. .. ..
94 Iran ( Islamic Republic of) 68.8 162.5 0.9 0.7 71.9 47.5 25.4 50.5 0.8 0.9 1.0 0.5 0.0 0.0
95 Paraguay 3.1 4.0 .. .. .. .. .. .. .. .. .. .. .. ..
96 Georgia 12.3 3.2 4.8 0.5 47.1 25.3 36.9 33.5 5.3 17.0 3.7 20.1 0.0 0.0
97 Guyana .. .. .. .. .. .. .. .. .. .. .. .. .. ..
98 Azerbaijan 26.0 13.8 0.3 0.0 45.2 38.6 54.7 58.7 0.2 1.9 (.) (.) 0.0 0.0
99 Sri Lanka 5.5 9.4 0.1 0.7 24.0 43.2 0.0 0.0 4.9 3.2 71.0 52.9 0.0 0.0
100 Maldives .. .. .. .. .. .. .. .. .. .. .. .. .. ..
101 Jamaica 2.9 3.8 1.1 1.0 82.4 86.5 0.0 0.0 0.3 0.3 16.2 12.2 0.0 0.0
102 Cape Verde .. .. .. .. .. .. .. .. .. .. .. .. .. ..
103 El Salvador 2.5 4.6 0.0 (.) 32.0 44.4 0.0 0.0 19.8 22.6 48.1 32.4 0.0 0.0
104 Algeria 23.9 34.8 2.6 2.0 40.6 31.7 56.7 66.0 (.) 0.1 0.1 0.2 0.0 0.0
105 Viet Nam 24.3 51.3 9.1 15.8 11.3 24.3 (.) 9.6 1.9 3.6 77.7 46.7 0.0 0.0
106 Occupied Palestinian Territories .. .. .. .. .. .. .. .. .. .. .. .. .. ..

HDI rank
ShareofTPESa
Fossilfuels Renewableenergyb Other
Totalprimaryenergysupplya Coalc Oild NaturalGas
Hydro,solar,windandgeothermal
Biomassandwastee Nuclear
(Mt of oil equivalent) (%) (%) (%) (%) (%) (%)
1990 2005 1990 2005 1990 2005 1990 2005 1990 2005 1990 2005 1990 2005
3�� rapportosullosv iluppoumano2007-2008
indi
cato
rid
isvi
lupp
oum
ano
FontienergeticheTaB
ELLa
23
107 Indonesia 103.2 179.5 3.8 14.2 33.2 36.6 17.9 17.1 1.5 3.7 43.6 28.5 0.0 0.0
108 Syrian Arab Republic 11.7 17.9 0.0 (.) 86.3 65.3 11.7 33.0 2.0 1.7 (.) (.) 0.0 0.0
109 Turkmenistan 19.6 16.3 1.5 0.0 38.0 26.5 62.4 75.0 0.3 (.) 0.0 0.0 0.0 0.0
110 Nicaragua 2.1 3.3 0.0 0.0 29.2 41.4 0.0 0.0 17.3 8.1 53.2 50.5 0.0 0.0
111 Moldova 10.0 3.6 20.0 2.1 49.3 19.0 32.8 69.0 0.2 0.2 0.4 2.1 0.0 0.0
112 Egypt 31.9 61.3 2.4 1.5 70.5 49.2 21.1 45.3 2.7 1.9 3.3 2.3 0.0 0.0
113 Uzbekistan 46.4 47.0 7.3 2.2 21.8 12.1 70.0 84.6 1.2 1.1 (.) (.) 0.0 0.0
114 Mongolia 3.4 2.6 73.6 75.0 24.5 22.7 0.0 0.0 0.0 0.0 1.3 1.7 0.0 0.0
115 Honduras 2.4 3.9 (.) 2.9 31.1 51.0 0.0 0.0 8.1 4.0 62.0 42.0 0.0 0.0
116 Kyrgyzstan 7.6 2.8 33.2 19.7 40.5 22.5 19.9 22.1 11.3 43.8 0.1 0.1 0.0 0.0
117 Bolivia 2.8 5.3 0.0 0.0 46.5 56.2 22.6 25.8 3.7 4.0 27.2 14.0 0.0 0.0
118 Guatemala 4.5 8.0 0.0 3.1 28.8 40.5 0.0 0.0 3.4 3.5 67.9 53.2 0.0 0.0
119 Gabon 1.2 1.7 0.0 0.0 28.2 31.0 7.2 6.1 4.9 4.1 59.7 58.8 0.0 0.0
120 Vanuatu .. .. .. .. .. .. .. .. .. .. .. .. .. ..
121 South Africa 91.2 127.6 72.9 72.0 11.6 12.2 1.6 2.8 0.1 0.2 11.4 10.5 2.4 2.3
122 Tajikistan 5.6 3.5 11.2 1.3 36.8 42.6 24.8 14.0 25.4 41.5 0.0 0.0 0.0 0.0
123 Sao Tome and Principe .. .. .. .. .. .. .. .. .. .. .. .. .. ..
124 Botswana 1.3 1.9 39.4 31.5 26.9 36.5 0.0 0.0 (.) (.) 33.1 24.1 0.0 0.0
125 Namibia .. 1.4 .. 0.2 .. 66.8 .. 0.0 .. 10.3 .. 13.5 .. 0.0
126 Morocco 6.7 13.8 16.8 32.3 76.1 60.2 0.6 2.8 1.6 1.0 4.7 3.3 0.0 0.0
127 Equatorial Guinea .. .. .. .. .. .. .. .. .. .. .. .. .. ..
128 India 319.9 537.3 33.2 38.7 19.6 23.9 3.1 5.4 1.9 1.7 41.7 29.4 0.5 0.8
129 Solomon Islands .. .. .. .. .. .. .. .. .. .. .. .. .. ..
130 Lao People’s Democratic Republic .. .. .. .. .. .. .. .. .. .. .. .. .. ..
131 Cambodia .. 4.8 .. 0.0 .. 26.6 .. 0.0 .. 0.1 .. 73.2 .. 0.0
132 Myanmar 10.7 14.7 0.6 0.6 6.9 13.7 7.1 14.4 1.0 1.8 84.4 69.6 0.0 0.0
133 Bhutan .. .. .. .. .. .. .. .. .. .. .. .. .. ..
134 Comoros .. .. .. .. .. .. .. .. .. .. .. .. .. ..
135 Ghana 5.3 8.9 0.0 0.0 18.9 28.7 0.0 0.0 9.2 5.1 73.1 66.0 0.0 0.0
136 Pakistan 43.4 76.3 4.8 5.3 25.2 21.9 23.2 33.0 3.4 3.5 43.2 35.5 0.2 0.8
137 Mauritania .. .. .. .. .. .. .. .. .. .. .. .. .. ..
138 Lesotho .. .. .. .. .. .. .. .. .. .. .. .. .. ..
139 Congo 1.1 1.2 0.0 0.0 26.5 38.2 0.0 0.0 4.0 2.5 69.4 56.3 0.0 0.0
140 Bangladesh 12.8 24.2 2.2 1.4 14.7 19.1 29.0 44.7 0.6 0.5 53.5 34.3 0.0 0.0
141 Swaziland .. .. .. .. .. .. .. .. .. .. .. .. .. ..
142 Nepal 5.8 9.2 0.8 2.0 4.5 9.2 0.0 0.0 1.3 2.3 93.4 86.6 0.0 0.0
143 Madagascar .. .. .. .. .. .. .. .. .. .. .. .. .. ..
144 Cameroon 5.0 7.0 0.0 0.0 19.5 16.6 0.0 0.0 4.5 4.8 75.9 78.6 0.0 0.0
145 Papua New Guinea .. .. .. .. .. .. .. .. .. .. .. .. .. ..
146 Haiti 1.6 2.5 0.5 0.0 20.5 23.2 0.0 0.0 2.5 0.9 76.5 75.8 0.0 0.0
147 Sudan 10.6 18.4 0.0 0.0 17.5 19.9 0.0 0.0 0.8 0.6 81.7 79.5 0.0 0.0
148 Kenya 12.5 17.2 0.7 0.4 16.8 19.1 0.0 0.0 4.0 5.9 78.4 74.6 0.0 0.0
149 Djibouti .. .. .. .. .. .. .. .. .. .. .. .. .. ..
150 Timor-Leste .. .. .. .. .. .. .. .. .. .. .. .. .. ..
151 Zimbabwe 9.4 9.7 36.6 23.1 8.7 7.1 0.0 0.0 4.0 5.2 50.4 61.9 0.0 0.0
152 Togo 1.4 2.0 0.0 0.0 15.6 18.2 0.0 0.0 0.6 0.3 82.6 79.4 0.0 0.0
153 Yemen 2.6 6.7 0.0 0.0 97.0 98.8 0.0 0.0 0.0 0.0 3.0 1.2 0.0 0.0
154 Uganda .. .. .. .. .. .. .. .. .. .. .. .. .. ..
155 Gambia .. .. .. .. .. .. .. .. .. .. .. .. .. ..
LOWHUMANDEVELOPMENT
156 Senegal 2.2 3.0 0.0 3.1 39.2 55.3 0.2 0.4 0.0 2.0 60.6 39.2 0.0 0.0
157 Eritrea .. 0.8 .. 0.0 .. 35.2 .. 0.0 .. (.) .. 64.8 .. 0.0
158 Nigeria 70.9 103.8 0.1 (.) 15.0 13.9 4.6 7.5 0.5 0.7 79.8 78.0 0.0 0.0
159 Tanzania (United Republic of) 9.8 20.4 (.) 0.2 7.6 6.3 0.0 0.6 1.4 0.7 91.0 92.1 0.0 0.0
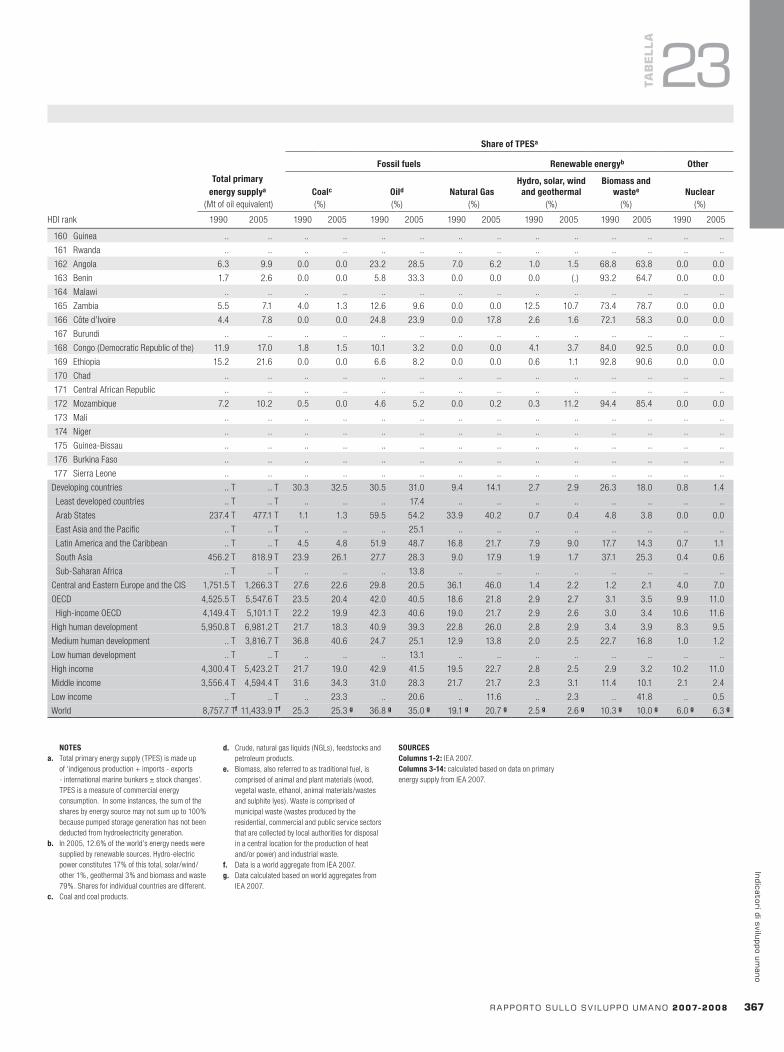
HDI rank
ShareofTPESa
Fossilfuels Renewableenergyb Other
Totalprimaryenergysupplya Coalc Oild NaturalGas
Hydro,solar,windandgeothermal
Biomassandwastee Nuclear
(Mt of oil equivalent) (%) (%) (%) (%) (%) (%)
1990 2005 1990 2005 1990 2005 1990 2005 1990 2005 1990 2005 1990 2005
rapportosullosv iluppoumano2007-2008 3�7
indicatoridisviluppoumano
NOTESa. Total primary energy supply (TPES) is made up
of ‘indigenous production + imports - exports - international marine bunkers ± stock changes’. TPES is a measure of commercial energy consumption. In some instances, the sum of the shares by energy source may not sum up to 100% because pumped storage generation has not been deducted from hydroelectricity generation.
b. In 2005, 12.6% of the world’s energy needs were supplied by renewable sources. Hydro-electric power constitutes 17% of this total, solar/wind/other 1%, geothermal 3% and biomass and waste 79%. Shares for individual countries are different.
c. Coal and coal products.
d. Crude, natural gas liquids (NGLs), feedstocks and petroleum products.
e. Biomass, also referred to as traditional fuel, is comprised of animal and plant materials (wood, vegetal waste, ethanol, animal materials/wastes and sulphite lyes). Waste is comprised of municipal waste (wastes produced by the residential, commercial and public service sectors that are collected by local authorities for disposal in a central location for the production of heat and/or power) and industrial waste.
f. Data is a world aggregate from IEA 2007.g. Data calculated based on world aggregates from
IEA 2007.
SOURCESColumns1-2: IEA 2007.Columns3-14: calculated based on data on primary energy supply from IEA 2007.
TaB
ELLa
23
160 Guinea .. .. .. .. .. .. .. .. .. .. .. .. .. ..
161 Rwanda .. .. .. .. .. .. .. .. .. .. .. .. .. ..
162 Angola 6.3 9.9 0.0 0.0 23.2 28.5 7.0 6.2 1.0 1.5 68.8 63.8 0.0 0.0
163 Benin 1.7 2.6 0.0 0.0 5.8 33.3 0.0 0.0 0.0 (.) 93.2 64.7 0.0 0.0
164 Malawi .. .. .. .. .. .. .. .. .. .. .. .. .. ..
165 Zambia 5.5 7.1 4.0 1.3 12.6 9.6 0.0 0.0 12.5 10.7 73.4 78.7 0.0 0.0
166 Côte d’Ivoire 4.4 7.8 0.0 0.0 24.8 23.9 0.0 17.8 2.6 1.6 72.1 58.3 0.0 0.0
167 Burundi .. .. .. .. .. .. .. .. .. .. .. .. .. ..
168 Congo (Democratic Republic of the) 11.9 17.0 1.8 1.5 10.1 3.2 0.0 0.0 4.1 3.7 84.0 92.5 0.0 0.0
169 Ethiopia 15.2 21.6 0.0 0.0 6.6 8.2 0.0 0.0 0.6 1.1 92.8 90.6 0.0 0.0
170 Chad .. .. .. .. .. .. .. .. .. .. .. .. .. ..
171 Central African Republic .. .. .. .. .. .. .. .. .. .. .. .. .. ..
172 Mozambique 7.2 10.2 0.5 0.0 4.6 5.2 0.0 0.2 0.3 11.2 94.4 85.4 0.0 0.0
173 Mali .. .. .. .. .. .. .. .. .. .. .. .. .. ..
174 Niger .. .. .. .. .. .. .. .. .. .. .. .. .. ..
175 Guinea-Bissau .. .. .. .. .. .. .. .. .. .. .. .. .. ..
176 Burkina Faso .. .. .. .. .. .. .. .. .. .. .. .. .. ..
177 Sierra Leone .. .. .. .. .. .. .. .. .. .. .. .. .. ..
Developing countries .. T .. T 30.3 32.5 30.5 31.0 9.4 14.1 2.7 2.9 26.3 18.0 0.8 1.4
Least developed countries .. T .. T .. .. .. 17.4 .. .. .. .. .. .. .. ..
Arab States 237.4 T 477.1 T 1.1 1.3 59.5 54.2 33.9 40.2 0.7 0.4 4.8 3.8 0.0 0.0
East Asia and the Pacific .. T .. T .. .. .. 25.1 .. .. .. .. .. .. .. ..
Latin America and the Caribbean .. T .. T 4.5 4.8 51.9 48.7 16.8 21.7 7.9 9.0 17.7 14.3 0.7 1.1
South Asia 456.2 T 818.9 T 23.9 26.1 27.7 28.3 9.0 17.9 1.9 1.7 37.1 25.3 0.4 0.6
Sub-Saharan Africa .. T .. T .. .. .. 13.8 .. .. .. .. .. .. .. ..
Central and Eastern Europe and the CIS 1,751.5 T 1,266.3 T 27.6 22.6 29.8 20.5 36.1 46.0 1.4 2.2 1.2 2.1 4.0 7.0
OECD 4,525.5 T 5,547.6 T 23.5 20.4 42.0 40.5 18.6 21.8 2.9 2.7 3.1 3.5 9.9 11.0
High-income OECD 4,149.4 T 5,101.1 T 22.2 19.9 42.3 40.6 19.0 21.7 2.9 2.6 3.0 3.4 10.6 11.6
High human development 5,950.8 T 6,981.2 T 21.7 18.3 40.9 39.3 22.8 26.0 2.8 2.9 3.4 3.9 8.3 9.5
Medium human development .. T 3,816.7 T 36.8 40.6 24.7 25.1 12.9 13.8 2.0 2.5 22.7 16.8 1.0 1.2
Low human development .. T .. T .. .. .. 13.1 .. .. .. .. .. .. .. ..
High income 4,300.4 T 5,423.2 T 21.7 19.0 42.9 41.5 19.5 22.7 2.8 2.5 2.9 3.2 10.2 11.0
Middle income 3,556.4 T 4,594.4 T 31.6 34.3 31.0 28.3 21.7 21.7 2.3 3.1 11.4 10.1 2.1 2.4
Low income .. T .. T .. 23.3 .. 20.6 .. 11.6 .. 2.3 .. 41.8 .. 0.5
World 8,757.7 Tf 11,433.9 Tf 25.3 25.3 g 36.8 g 35.0 g 19.1 g 20.7 g 2.5 g 2.6 g 10.3 g 10.0 g 6.0 g 6.3 g
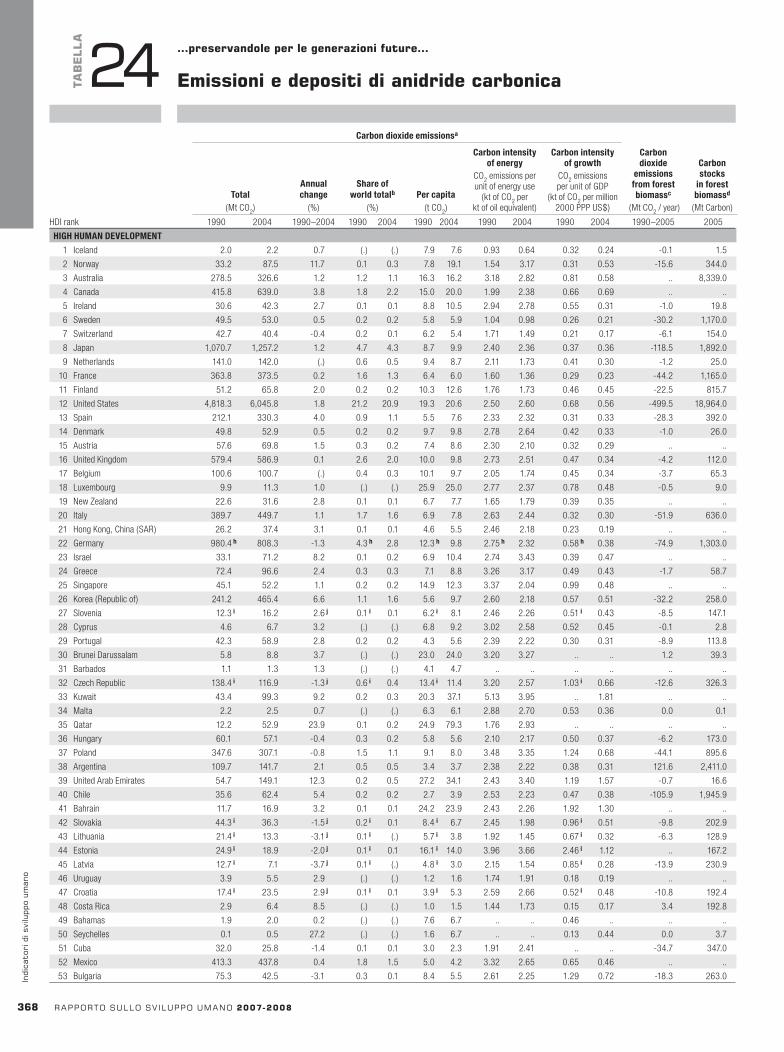
HDI rank
Carbondioxideemissionsa
Total(Mt CO2)
Annualchange
(%)
Shareofworldtotalb
(%)Percapita
(t CO2)
Carbonintensityofenergy
CO2 emissions per unit of energy use
(kt of CO2 per kt of oil equivalent)
Carbonintensityofgrowth
CO2 emissions per unit of GDP
(kt of CO2 per million 2000 PPP US$)
Carbondioxide
emissionsfromforestbiomassc
(Mt CO2 / year)
Carbonstocks
inforestbiomassd
(Mt Carbon)
1990 2004 1990–2004 1990 2004 1990 2004 1990 2004 1990 2004 1990–2005 2005HDI rank
Carbondioxideemissionsa
Total(Mt CO2)
Annualchange
(%)
Shareofworldtotalb
(%)Percapita
(t CO2)
Carbonintensityofenergy
CO2 emissions per unit of energy use
(kt of CO2 per kt of oil equivalent)
Carbonintensityofgrowth
CO2 emissions per unit of GDP
(kt of CO2 per million 2000 PPP US$)
Carbondioxide
emissionsfromforestbiomassc
(Mt CO2 / year)
Carbonstocks
inforestbiomassd
(Mt Carbon)
1990 2004 1990–2004 1990 2004 1990 2004 1990 2004 1990 2004 1990–2005 2005
3�8 rapportosullosv iluppoumano2007-2008
indi
cato
rid
isvi
lupp
oum
ano
EmissioniedepositidianidridecarbonicaTaB
ELLa
24 …preservandoleperlegenerazionifuture…
HIGHHUMANDEVELOPMENT
1 Iceland 2.0 2.2 0.7 (.) (.) 7.9 7.6 0.93 0.64 0.32 0.24 -0.1 1.5
2 Norway 33.2 87.5 11.7 0.1 0.3 7.8 19.1 1.54 3.17 0.31 0.53 -15.6 344.0
3 Australia 278.5 326.6 1.2 1.2 1.1 16.3 16.2 3.18 2.82 0.81 0.58 .. 8,339.0
4 Canada 415.8 639.0 3.8 1.8 2.2 15.0 20.0 1.99 2.38 0.66 0.69 .. ..
5 Ireland 30.6 42.3 2.7 0.1 0.1 8.8 10.5 2.94 2.78 0.55 0.31 -1.0 19.8
6 Sweden 49.5 53.0 0.5 0.2 0.2 5.8 5.9 1.04 0.98 0.26 0.21 -30.2 1,170.0
7 Switzerland 42.7 40.4 -0.4 0.2 0.1 6.2 5.4 1.71 1.49 0.21 0.17 -6.1 154.0
8 Japan 1,070.7 1,257.2 1.2 4.7 4.3 8.7 9.9 2.40 2.36 0.37 0.36 -118.5 1,892.0
9 Netherlands 141.0 142.0 (.) 0.6 0.5 9.4 8.7 2.11 1.73 0.41 0.30 -1.2 25.0
10 France 363.8 373.5 0.2 1.6 1.3 6.4 6.0 1.60 1.36 0.29 0.23 -44.2 1,165.0
11 Finland 51.2 65.8 2.0 0.2 0.2 10.3 12.6 1.76 1.73 0.46 0.45 -22.5 815.7
12 United States 4,818.3 6,045.8 1.8 21.2 20.9 19.3 20.6 2.50 2.60 0.68 0.56 -499.5 18,964.0
13 Spain 212.1 330.3 4.0 0.9 1.1 5.5 7.6 2.33 2.32 0.31 0.33 -28.3 392.0
14 Denmark 49.8 52.9 0.5 0.2 0.2 9.7 9.8 2.78 2.64 0.42 0.33 -1.0 26.0
15 Austria 57.6 69.8 1.5 0.3 0.2 7.4 8.6 2.30 2.10 0.32 0.29 .. ..
16 United Kingdom 579.4 586.9 0.1 2.6 2.0 10.0 9.8 2.73 2.51 0.47 0.34 -4.2 112.0
17 Belgium 100.6 100.7 (.) 0.4 0.3 10.1 9.7 2.05 1.74 0.45 0.34 -3.7 65.3
18 Luxembourg 9.9 11.3 1.0 (.) (.) 25.9 25.0 2.77 2.37 0.78 0.48 -0.5 9.0
19 New Zealand 22.6 31.6 2.8 0.1 0.1 6.7 7.7 1.65 1.79 0.39 0.35 .. ..
20 Italy 389.7 449.7 1.1 1.7 1.6 6.9 7.8 2.63 2.44 0.32 0.30 -51.9 636.0
21 Hong Kong, China (SAR) 26.2 37.4 3.1 0.1 0.1 4.6 5.5 2.46 2.18 0.23 0.19 .. ..
22 Germany 980.4h 808.3 -1.3 4.3h 2.8 12.3h 9.8 2.75h 2.32 0.58h 0.38 -74.9 1,303.0
23 Israel 33.1 71.2 8.2 0.1 0.2 6.9 10.4 2.74 3.43 0.39 0.47 .. ..
24 Greece 72.4 96.6 2.4 0.3 0.3 7.1 8.8 3.26 3.17 0.49 0.43 -1.7 58.7
25 Singapore 45.1 52.2 1.1 0.2 0.2 14.9 12.3 3.37 2.04 0.99 0.48 .. ..
26 Korea (Republic of) 241.2 465.4 6.6 1.1 1.6 5.6 9.7 2.60 2.18 0.57 0.51 -32.2 258.0
27 Slovenia 12.3i 16.2 2.6j 0.1i 0.1 6.2i 8.1 2.46 2.26 0.51i 0.43 -8.5 147.1
28 Cyprus 4.6 6.7 3.2 (.) (.) 6.8 9.2 3.02 2.58 0.52 0.45 -0.1 2.8
29 Portugal 42.3 58.9 2.8 0.2 0.2 4.3 5.6 2.39 2.22 0.30 0.31 -8.9 113.8
30 Brunei Darussalam 5.8 8.8 3.7 (.) (.) 23.0 24.0 3.20 3.27 .. .. 1.2 39.3
31 Barbados 1.1 1.3 1.3 (.) (.) 4.1 4.7 .. .. .. .. .. ..
32 Czech Republic 138.4i 116.9 -1.3j 0.6i 0.4 13.4i 11.4 3.20 2.57 1.03i 0.66 -12.6 326.3
33 Kuwait 43.4 99.3 9.2 0.2 0.3 20.3 37.1 5.13 3.95 .. 1.81 .. ..
34 Malta 2.2 2.5 0.7 (.) (.) 6.3 6.1 2.88 2.70 0.53 0.36 0.0 0.1
35 Qatar 12.2 52.9 23.9 0.1 0.2 24.9 79.3 1.76 2.93 .. .. .. ..
36 Hungary 60.1 57.1 -0.4 0.3 0.2 5.8 5.6 2.10 2.17 0.50 0.37 -6.2 173.0
37 Poland 347.6 307.1 -0.8 1.5 1.1 9.1 8.0 3.48 3.35 1.24 0.68 -44.1 895.6
38 Argentina 109.7 141.7 2.1 0.5 0.5 3.4 3.7 2.38 2.22 0.38 0.31 121.6 2,411.0
39 United Arab Emirates 54.7 149.1 12.3 0.2 0.5 27.2 34.1 2.43 3.40 1.19 1.57 -0.7 16.6
40 Chile 35.6 62.4 5.4 0.2 0.2 2.7 3.9 2.53 2.23 0.47 0.38 -105.9 1,945.9
41 Bahrain 11.7 16.9 3.2 0.1 0.1 24.2 23.9 2.43 2.26 1.92 1.30 .. ..
42 Slovakia 44.3i 36.3 -1.5j 0.2i 0.1 8.4i 6.7 2.45 1.98 0.96i 0.51 -9.8 202.9
43 Lithuania 21.4i 13.3 -3.1j 0.1i (.) 5.7i 3.8 1.92 1.45 0.67i 0.32 -6.3 128.9
44 Estonia 24.9i 18.9 -2.0j 0.1i 0.1 16.1i 14.0 3.96 3.66 2.46i 1.12 .. 167.2
45 Latvia 12.7i 7.1 -3.7j 0.1i (.) 4.8i 3.0 2.15 1.54 0.85i 0.28 -13.9 230.9
46 Uruguay 3.9 5.5 2.9 (.) (.) 1.2 1.6 1.74 1.91 0.18 0.19 .. ..
47 Croatia 17.4i 23.5 2.9j 0.1i 0.1 3.9i 5.3 2.59 2.66 0.52i 0.48 -10.8 192.4
48 Costa Rica 2.9 6.4 8.5 (.) (.) 1.0 1.5 1.44 1.73 0.15 0.17 3.4 192.8
49 Bahamas 1.9 2.0 0.2 (.) (.) 7.6 6.7 .. .. 0.46 .. .. ..
50 Seychelles 0.1 0.5 27.2 (.) (.) 1.6 6.7 .. .. 0.13 0.44 0.0 3.7
51 Cuba 32.0 25.8 -1.4 0.1 0.1 3.0 2.3 1.91 2.41 .. .. -34.7 347.0
52 Mexico 413.3 437.8 0.4 1.8 1.5 5.0 4.2 3.32 2.65 0.65 0.46 .. ..
53 Bulgaria 75.3 42.5 -3.1 0.3 0.1 8.4 5.5 2.61 2.25 1.29 0.72 -18.3 263.0
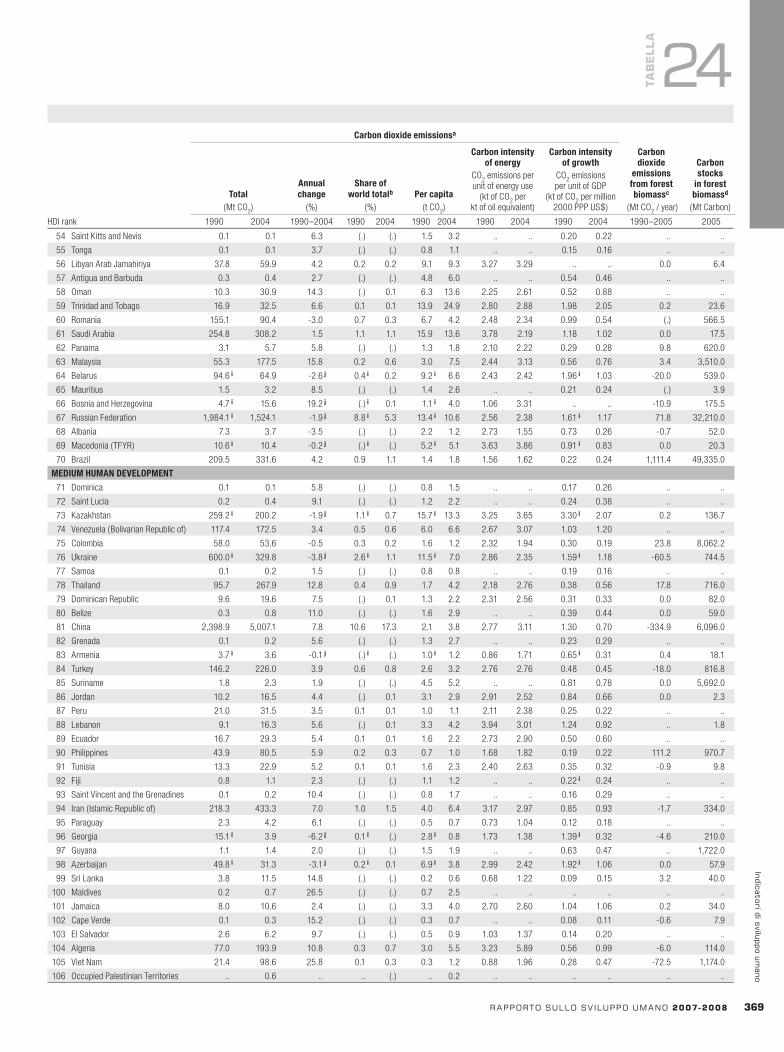
HDI rank
Carbondioxideemissionsa
Total(Mt CO2)
Annualchange
(%)
Shareofworldtotalb
(%)Percapita
(t CO2)
Carbonintensityofenergy
CO2 emissions per unit of energy use
(kt of CO2 per kt of oil equivalent)
Carbonintensityofgrowth
CO2 emissions per unit of GDP
(kt of CO2 per million 2000 PPP US$)
Carbondioxide
emissionsfromforestbiomassc
(Mt CO2 / year)
Carbonstocks
inforestbiomassd
(Mt Carbon)
1990 2004 1990–2004 1990 2004 1990 2004 1990 2004 1990 2004 1990–2005 2005
rapportosullosv iluppoumano2007-2008 3��
indicatoridisviluppoumano
TaB
ELLa
24
54 Saint Kitts and Nevis 0.1 0.1 6.3 (.) (.) 1.5 3.2 .. .. 0.20 0.22 .. ..
55 Tonga 0.1 0.1 3.7 (.) (.) 0.8 1.1 .. .. 0.15 0.16 .. ..
56 Libyan Arab Jamahiriya 37.8 59.9 4.2 0.2 0.2 9.1 9.3 3.27 3.29 .. .. 0.0 6.4
57 Antigua and Barbuda 0.3 0.4 2.7 (.) (.) 4.8 6.0 .. .. 0.54 0.46 .. ..
58 Oman 10.3 30.9 14.3 (.) 0.1 6.3 13.6 2.25 2.61 0.52 0.88 .. ..
59 Trinidad and Tobago 16.9 32.5 6.6 0.1 0.1 13.9 24.9 2.80 2.88 1.98 2.05 0.2 23.6
60 Romania 155.1 90.4 -3.0 0.7 0.3 6.7 4.2 2.48 2.34 0.99 0.54 (.) 566.5
61 Saudi Arabia 254.8 308.2 1.5 1.1 1.1 15.9 13.6 3.78 2.19 1.18 1.02 0.0 17.5
62 Panama 3.1 5.7 5.8 (.) (.) 1.3 1.8 2.10 2.22 0.29 0.28 9.8 620.0
63 Malaysia 55.3 177.5 15.8 0.2 0.6 3.0 7.5 2.44 3.13 0.56 0.76 3.4 3,510.0
64 Belarus 94.6i 64.9 -2.6j 0.4i 0.2 9.2i 6.6 2.43 2.42 1.96i 1.03 -20.0 539.0
65 Mauritius 1.5 3.2 8.5 (.) (.) 1.4 2.6 .. .. 0.21 0.24 (.) 3.9
66 Bosnia and Herzegovina 4.7i 15.6 19.2j (.)i 0.1 1.1i 4.0 1.06 3.31 .. .. -10.9 175.5
67 Russian Federation 1,984.1i 1,524.1 -1.9j 8.8i 5.3 13.4i 10.6 2.56 2.38 1.61i 1.17 71.8 32,210.0
68 Albania 7.3 3.7 -3.5 (.) (.) 2.2 1.2 2.73 1.55 0.73 0.26 -0.7 52.0
69 Macedonia (TFYR) 10.6i 10.4 -0.2j (.)i (.) 5.2i 5.1 3.63 3.86 0.91i 0.83 0.0 20.3
70 Brazil 209.5 331.6 4.2 0.9 1.1 1.4 1.8 1.56 1.62 0.22 0.24 1,111.4 49,335.0
MEDIUMHUMANDEVELOPMENT
71 Dominica 0.1 0.1 5.8 (.) (.) 0.8 1.5 .. .. 0.17 0.26 .. ..
72 Saint Lucia 0.2 0.4 9.1 (.) (.) 1.2 2.2 .. .. 0.24 0.38 .. ..
73 Kazakhstan 259.2i 200.2 -1.9j 1.1i 0.7 15.7i 13.3 3.25 3.65 3.30i 2.07 0.2 136.7
74 Venezuela (Bolivarian Republic of) 117.4 172.5 3.4 0.5 0.6 6.0 6.6 2.67 3.07 1.03 1.20 .. ..
75 Colombia 58.0 53.6 -0.5 0.3 0.2 1.6 1.2 2.32 1.94 0.30 0.19 23.8 8,062.2
76 Ukraine 600.0i 329.8 -3.8j 2.6i 1.1 11.5i 7.0 2.86 2.35 1.59i 1.18 -60.5 744.5
77 Samoa 0.1 0.2 1.5 (.) (.) 0.8 0.8 .. .. 0.19 0.16 .. ..
78 Thailand 95.7 267.9 12.8 0.4 0.9 1.7 4.2 2.18 2.76 0.38 0.56 17.8 716.0
79 Dominican Republic 9.6 19.6 7.5 (.) 0.1 1.3 2.2 2.31 2.56 0.31 0.33 0.0 82.0
80 Belize 0.3 0.8 11.0 (.) (.) 1.6 2.9 .. .. 0.39 0.44 0.0 59.0
81 China 2,398.9 5,007.1 7.8 10.6 17.3 2.1 3.8 2.77 3.11 1.30 0.70 -334.9 6,096.0
82 Grenada 0.1 0.2 5.6 (.) (.) 1.3 2.7 .. .. 0.23 0.29 .. ..
83 Armenia 3.7i 3.6 -0.1j (.)i (.) 1.0i 1.2 0.86 1.71 0.65i 0.31 0.4 18.1
84 Turkey 146.2 226.0 3.9 0.6 0.8 2.6 3.2 2.76 2.76 0.48 0.45 -18.0 816.8
85 Suriname 1.8 2.3 1.9 (.) (.) 4.5 5.2 .. .. 0.81 0.78 0.0 5,692.0
86 Jordan 10.2 16.5 4.4 (.) 0.1 3.1 2.9 2.91 2.52 0.84 0.66 0.0 2.3
87 Peru 21.0 31.5 3.5 0.1 0.1 1.0 1.1 2.11 2.38 0.25 0.22 .. ..
88 Lebanon 9.1 16.3 5.6 (.) 0.1 3.3 4.2 3.94 3.01 1.24 0.92 .. 1.8
89 Ecuador 16.7 29.3 5.4 0.1 0.1 1.6 2.2 2.73 2.90 0.50 0.60 .. ..
90 Philippines 43.9 80.5 5.9 0.2 0.3 0.7 1.0 1.68 1.82 0.19 0.22 111.2 970.7
91 Tunisia 13.3 22.9 5.2 0.1 0.1 1.6 2.3 2.40 2.63 0.35 0.32 -0.9 9.8
92 Fiji 0.8 1.1 2.3 (.) (.) 1.1 1.2 .. .. 0.22i 0.24 .. ..
93 Saint Vincent and the Grenadines 0.1 0.2 10.4 (.) (.) 0.8 1.7 .. .. 0.16 0.29 .. ..
94 Iran ( Islamic Republic of) 218.3 433.3 7.0 1.0 1.5 4.0 6.4 3.17 2.97 0.85 0.93 -1.7 334.0
95 Paraguay 2.3 4.2 6.1 (.) (.) 0.5 0.7 0.73 1.04 0.12 0.18 .. ..
96 Georgia 15.1i 3.9 -6.2j 0.1i (.) 2.8i 0.8 1.73 1.38 1.39i 0.32 -4.6 210.0
97 Guyana 1.1 1.4 2.0 (.) (.) 1.5 1.9 .. .. 0.63 0.47 .. 1,722.0
98 Azerbaijan 49.8i 31.3 -3.1j 0.2i 0.1 6.9i 3.8 2.99 2.42 1.92i 1.06 0.0 57.9
99 Sri Lanka 3.8 11.5 14.8 (.) (.) 0.2 0.6 0.68 1.22 0.09 0.15 3.2 40.0
100 Maldives 0.2 0.7 26.5 (.) (.) 0.7 2.5 .. .. .. .. .. ..
101 Jamaica 8.0 10.6 2.4 (.) (.) 3.3 4.0 2.70 2.60 1.04 1.06 0.2 34.0
102 Cape Verde 0.1 0.3 15.2 (.) (.) 0.3 0.7 .. .. 0.08 0.11 -0.6 7.9
103 El Salvador 2.6 6.2 9.7 (.) (.) 0.5 0.9 1.03 1.37 0.14 0.20 .. ..
104 Algeria 77.0 193.9 10.8 0.3 0.7 3.0 5.5 3.23 5.89 0.56 0.99 -6.0 114.0
105 Viet Nam 21.4 98.6 25.8 0.1 0.3 0.3 1.2 0.88 1.96 0.28 0.47 -72.5 1,174.0
106 Occupied Palestinian Territories .. 0.6 .. .. (.) .. 0.2 .. .. .. .. .. ..
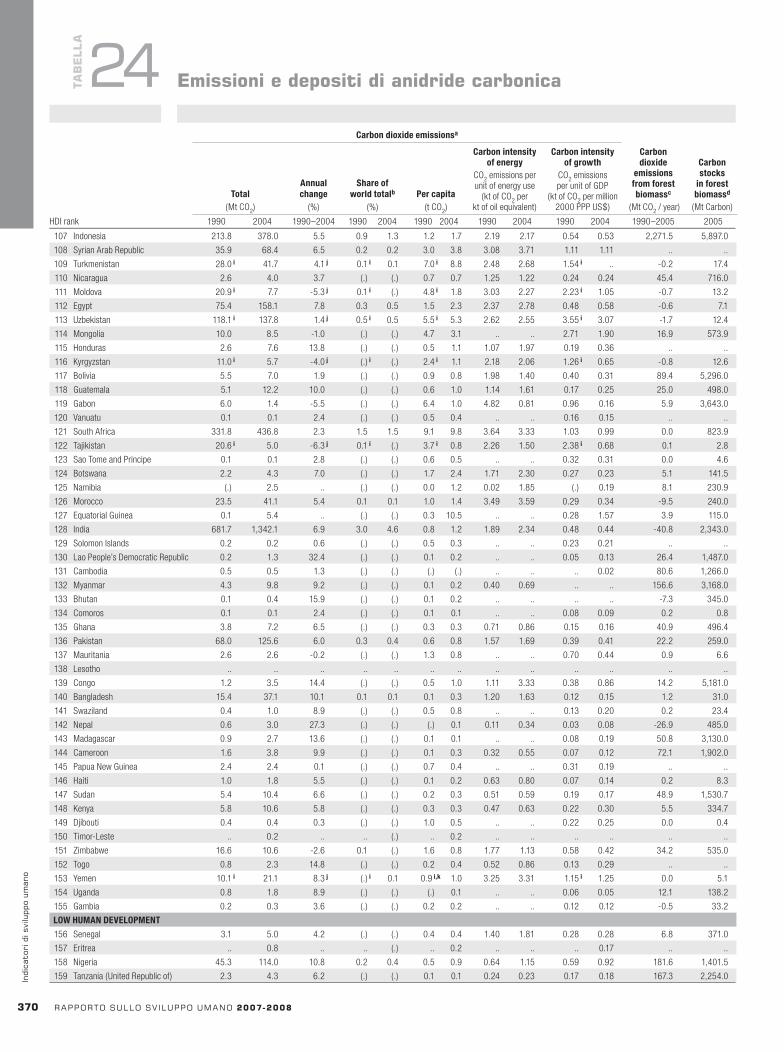
HDI rank
Carbondioxideemissionsa
Total(Mt CO2)
Annualchange
(%)
Shareofworldtotalb
(%)Percapita
(t CO2)
Carbonintensityofenergy
CO2 emissions per unit of energy use
(kt of CO2 per kt of oil equivalent)
Carbonintensityofgrowth
CO2 emissions per unit of GDP
(kt of CO2 per million 2000 PPP US$)
Carbondioxide
emissionsfromforestbiomassc
(Mt CO2 / year)
Carbonstocks
inforestbiomassd
(Mt Carbon)
1990 2004 1990–2004 1990 2004 1990 2004 1990 2004 1990 2004 1990–2005 2005HDI rank
Carbondioxideemissionsa
Total(Mt CO2)
Annualchange
(%)
Shareofworldtotalb
(%)Percapita
(t CO2)
Carbonintensityofenergy
CO2 emissions per unit of energy use
(kt of CO2 per kt of oil equivalent)
Carbonintensityofgrowth
CO2 emissions per unit of GDP
(kt of CO2 per million 2000 PPP US$)
Carbondioxide
emissionsfromforestbiomassc
(Mt CO2 / year)
Carbonstocks
inforestbiomassd
(Mt Carbon)
1990 2004 1990–2004 1990 2004 1990 2004 1990 2004 1990 2004 1990–2005 2005
370 rapportosullosv iluppoumano2007-2008
indi
cato
rid
isvi
lupp
oum
ano
TaB
ELLa
24 Emissioniedepositidianidridecarbonica
107 Indonesia 213.8 378.0 5.5 0.9 1.3 1.2 1.7 2.19 2.17 0.54 0.53 2,271.5 5,897.0
108 Syrian Arab Republic 35.9 68.4 6.5 0.2 0.2 3.0 3.8 3.08 3.71 1.11 1.11 .. ..
109 Turkmenistan 28.0i 41.7 4.1j 0.1i 0.1 7.0i 8.8 2.48 2.68 1.54i .. -0.2 17.4
110 Nicaragua 2.6 4.0 3.7 (.) (.) 0.7 0.7 1.25 1.22 0.24 0.24 45.4 716.0
111 Moldova 20.9i 7.7 -5.3j 0.1i (.) 4.8i 1.8 3.03 2.27 2.23i 1.05 -0.7 13.2
112 Egypt 75.4 158.1 7.8 0.3 0.5 1.5 2.3 2.37 2.78 0.48 0.58 -0.6 7.1
113 Uzbekistan 118.1i 137.8 1.4j 0.5i 0.5 5.5i 5.3 2.62 2.55 3.55i 3.07 -1.7 12.4
114 Mongolia 10.0 8.5 -1.0 (.) (.) 4.7 3.1 .. .. 2.71 1.90 16.9 573.9
115 Honduras 2.6 7.6 13.8 (.) (.) 0.5 1.1 1.07 1.97 0.19 0.36 .. ..
116 Kyrgyzstan 11.0i 5.7 -4.0j (.)i (.) 2.4i 1.1 2.18 2.06 1.26i 0.65 -0.8 12.6
117 Bolivia 5.5 7.0 1.9 (.) (.) 0.9 0.8 1.98 1.40 0.40 0.31 89.4 5,296.0
118 Guatemala 5.1 12.2 10.0 (.) (.) 0.6 1.0 1.14 1.61 0.17 0.25 25.0 498.0
119 Gabon 6.0 1.4 -5.5 (.) (.) 6.4 1.0 4.82 0.81 0.96 0.16 5.9 3,643.0
120 Vanuatu 0.1 0.1 2.4 (.) (.) 0.5 0.4 .. .. 0.16 0.15 .. ..
121 South Africa 331.8 436.8 2.3 1.5 1.5 9.1 9.8 3.64 3.33 1.03 0.99 0.0 823.9
122 Tajikistan 20.6i 5.0 -6.3j 0.1i (.) 3.7i 0.8 2.26 1.50 2.38i 0.68 0.1 2.8
123 Sao Tome and Principe 0.1 0.1 2.8 (.) (.) 0.6 0.5 .. .. 0.32 0.31 0.0 4.6
124 Botswana 2.2 4.3 7.0 (.) (.) 1.7 2.4 1.71 2.30 0.27 0.23 5.1 141.5
125 Namibia (.) 2.5 .. (.) (.) 0.0 1.2 0.02 1.85 (.) 0.19 8.1 230.9
126 Morocco 23.5 41.1 5.4 0.1 0.1 1.0 1.4 3.49 3.59 0.29 0.34 -9.5 240.0
127 Equatorial Guinea 0.1 5.4 .. (.) (.) 0.3 10.5 .. .. 0.28 1.57 3.9 115.0
128 India 681.7 1,342.1 6.9 3.0 4.6 0.8 1.2 1.89 2.34 0.48 0.44 -40.8 2,343.0
129 Solomon Islands 0.2 0.2 0.6 (.) (.) 0.5 0.3 .. .. 0.23 0.21 .. ..
130 Lao People’s Democratic Republic 0.2 1.3 32.4 (.) (.) 0.1 0.2 .. .. 0.05 0.13 26.4 1,487.0
131 Cambodia 0.5 0.5 1.3 (.) (.) (.) (.) .. .. .. 0.02 80.6 1,266.0
132 Myanmar 4.3 9.8 9.2 (.) (.) 0.1 0.2 0.40 0.69 .. .. 156.6 3,168.0
133 Bhutan 0.1 0.4 15.9 (.) (.) 0.1 0.2 .. .. .. .. -7.3 345.0
134 Comoros 0.1 0.1 2.4 (.) (.) 0.1 0.1 .. .. 0.08 0.09 0.2 0.8
135 Ghana 3.8 7.2 6.5 (.) (.) 0.3 0.3 0.71 0.86 0.15 0.16 40.9 496.4
136 Pakistan 68.0 125.6 6.0 0.3 0.4 0.6 0.8 1.57 1.69 0.39 0.41 22.2 259.0
137 Mauritania 2.6 2.6 -0.2 (.) (.) 1.3 0.8 .. .. 0.70 0.44 0.9 6.6
138 Lesotho .. .. .. .. .. .. .. .. .. .. .. .. ..
139 Congo 1.2 3.5 14.4 (.) (.) 0.5 1.0 1.11 3.33 0.38 0.86 14.2 5,181.0
140 Bangladesh 15.4 37.1 10.1 0.1 0.1 0.1 0.3 1.20 1.63 0.12 0.15 1.2 31.0
141 Swaziland 0.4 1.0 8.9 (.) (.) 0.5 0.8 .. .. 0.13 0.20 0.2 23.4
142 Nepal 0.6 3.0 27.3 (.) (.) (.) 0.1 0.11 0.34 0.03 0.08 -26.9 485.0
143 Madagascar 0.9 2.7 13.6 (.) (.) 0.1 0.1 .. .. 0.08 0.19 50.8 3,130.0
144 Cameroon 1.6 3.8 9.9 (.) (.) 0.1 0.3 0.32 0.55 0.07 0.12 72.1 1,902.0
145 Papua New Guinea 2.4 2.4 0.1 (.) (.) 0.7 0.4 .. .. 0.31 0.19 .. ..
146 Haiti 1.0 1.8 5.5 (.) (.) 0.1 0.2 0.63 0.80 0.07 0.14 0.2 8.3
147 Sudan 5.4 10.4 6.6 (.) (.) 0.2 0.3 0.51 0.59 0.19 0.17 48.9 1,530.7
148 Kenya 5.8 10.6 5.8 (.) (.) 0.3 0.3 0.47 0.63 0.22 0.30 5.5 334.7
149 Djibouti 0.4 0.4 0.3 (.) (.) 1.0 0.5 .. .. 0.22 0.25 0.0 0.4
150 Timor-Leste .. 0.2 .. .. (.) .. 0.2 .. .. .. .. .. ..
151 Zimbabwe 16.6 10.6 -2.6 0.1 (.) 1.6 0.8 1.77 1.13 0.58 0.42 34.2 535.0
152 Togo 0.8 2.3 14.8 (.) (.) 0.2 0.4 0.52 0.86 0.13 0.29 .. ..
153 Yemen 10.1i 21.1 8.3j (.)i 0.1 0.9i,k 1.0 3.25 3.31 1.15i 1.25 0.0 5.1
154 Uganda 0.8 1.8 8.9 (.) (.) (.) 0.1 .. .. 0.06 0.05 12.1 138.2
155 Gambia 0.2 0.3 3.6 (.) (.) 0.2 0.2 .. .. 0.12 0.12 -0.5 33.2
LOWHUMANDEVELOPMENT
156 Senegal 3.1 5.0 4.2 (.) (.) 0.4 0.4 1.40 1.81 0.28 0.28 6.8 371.0
157 Eritrea .. 0.8 .. .. (.) .. 0.2 .. .. .. 0.17 .. ..
158 Nigeria 45.3 114.0 10.8 0.2 0.4 0.5 0.9 0.64 1.15 0.59 0.92 181.6 1,401.5
159 Tanzania (United Republic of) 2.3 4.3 6.2 (.) (.) 0.1 0.1 0.24 0.23 0.17 0.18 167.3 2,254.0
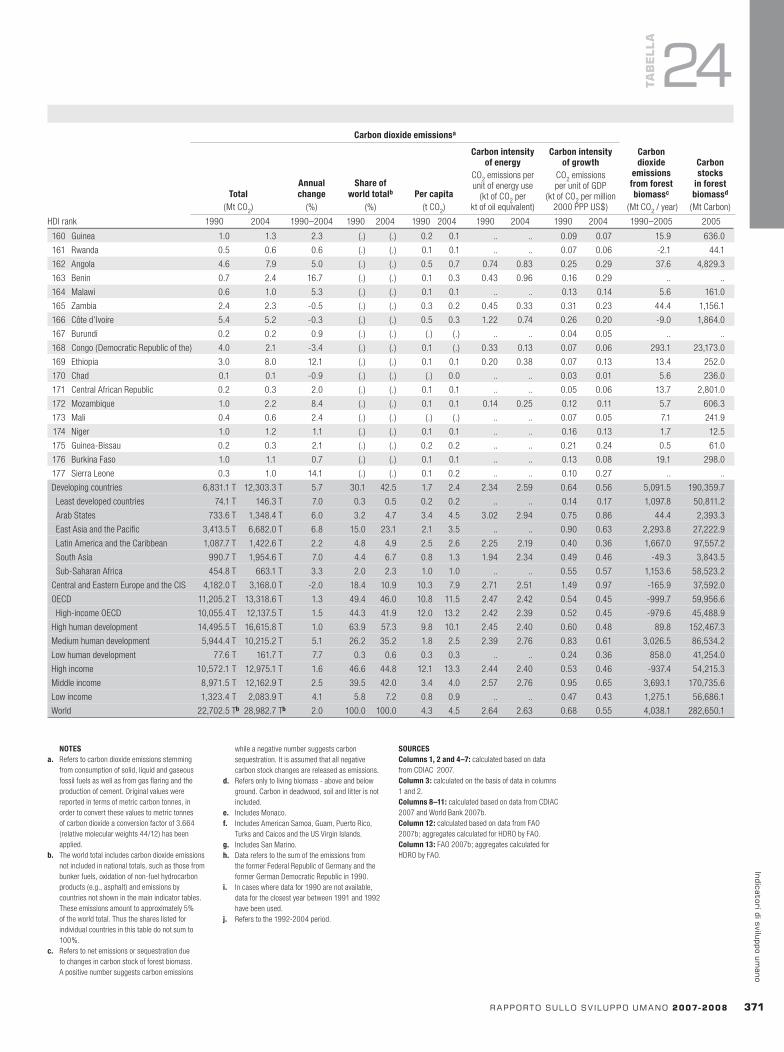
HDI rank
Carbondioxideemissionsa
Total(Mt CO2)
Annualchange
(%)
Shareofworldtotalb
(%)Percapita
(t CO2)
Carbonintensityofenergy
CO2 emissions per unit of energy use
(kt of CO2 per kt of oil equivalent)
Carbonintensityofgrowth
CO2 emissions per unit of GDP
(kt of CO2 per million 2000 PPP US$)
Carbondioxide
emissionsfromforestbiomassc
(Mt CO2 / year)
Carbonstocks
inforestbiomassd
(Mt Carbon)
1990 2004 1990–2004 1990 2004 1990 2004 1990 2004 1990 2004 1990–2005 2005
rapportosullosv iluppoumano2007-2008 371
indicatoridisviluppoumano
NOTESa. Refers to carbon dioxide emissions stemming
from consumption of solid, liquid and gaseous fossil fuels as well as from gas flaring and the production of cement. Original values were reported in terms of metric carbon tonnes, in order to convert these values to metric tonnes of carbon dioxide a conversion factor of 3.664 (relative molecular weights 44/12) has been applied.
b. The world total includes carbon dioxide emissions not included in national totals, such as those from bunker fuels, oxidation of non-fuel hydrocarbon products (e.g., asphalt) and emissions by countries not shown in the main indicator tables. These emissions amount to approximately 5% of the world total. Thus the shares listed for individual countries in this table do not sum to 100%.
c. Refers to net emissions or sequestration due to changes in carbon stock of forest biomass. A positive number suggests carbon emissions
while a negative number suggests carbon sequestration. It is assumed that all negative carbon stock changes are released as emissions.
d. Refers only to living biomass - above and below ground. Carbon in deadwood, soil and litter is not included.
e. Includes Monaco.f. Includes American Samoa, Guam, Puerto Rico,
Turks and Caicos and the US Virgin Islands.g. Includes San Marino.h. Data refers to the sum of the emissions from
the former Federal Republic of Germany and the former German Democratic Republic in 1990.
i. In cases where data for 1990 are not available, data for the closest year between 1991 and 1992 have been used.
j. Refers to the 1992-2004 period.
SOURCESColumns1,2and4–7: calculated based on data from CDIAC 2007. Column3: calculated on the basis of data in columns 1 and 2.Columns8–11: calculated based on data from CDIAC 2007 and World Bank 2007b. Column12: calculated based on data from FAO 2007b; aggregates calculated for HDRO by FAO.Column13: FAO 2007b; aggregates calculated for HDRO by FAO.
TaB
ELLa
24
160 Guinea 1.0 1.3 2.3 (.) (.) 0.2 0.1 .. .. 0.09 0.07 15.9 636.0
161 Rwanda 0.5 0.6 0.6 (.) (.) 0.1 0.1 .. .. 0.07 0.06 -2.1 44.1
162 Angola 4.6 7.9 5.0 (.) (.) 0.5 0.7 0.74 0.83 0.25 0.29 37.6 4,829.3
163 Benin 0.7 2.4 16.7 (.) (.) 0.1 0.3 0.43 0.96 0.16 0.29 .. ..
164 Malawi 0.6 1.0 5.3 (.) (.) 0.1 0.1 .. .. 0.13 0.14 5.6 161.0
165 Zambia 2.4 2.3 -0.5 (.) (.) 0.3 0.2 0.45 0.33 0.31 0.23 44.4 1,156.1
166 Côte d’Ivoire 5.4 5.2 -0.3 (.) (.) 0.5 0.3 1.22 0.74 0.26 0.20 -9.0 1,864.0
167 Burundi 0.2 0.2 0.9 (.) (.) (.) (.) .. .. 0.04 0.05 .. ..
168 Congo (Democratic Republic of the) 4.0 2.1 -3.4 (.) (.) 0.1 (.) 0.33 0.13 0.07 0.06 293.1 23,173.0
169 Ethiopia 3.0 8.0 12.1 (.) (.) 0.1 0.1 0.20 0.38 0.07 0.13 13.4 252.0
170 Chad 0.1 0.1 -0.9 (.) (.) (.) 0.0 .. .. 0.03 0.01 5.6 236.0
171 Central African Republic 0.2 0.3 2.0 (.) (.) 0.1 0.1 .. .. 0.05 0.06 13.7 2,801.0
172 Mozambique 1.0 2.2 8.4 (.) (.) 0.1 0.1 0.14 0.25 0.12 0.11 5.7 606.3
173 Mali 0.4 0.6 2.4 (.) (.) (.) (.) .. .. 0.07 0.05 7.1 241.9
174 Niger 1.0 1.2 1.1 (.) (.) 0.1 0.1 .. .. 0.16 0.13 1.7 12.5
175 Guinea-Bissau 0.2 0.3 2.1 (.) (.) 0.2 0.2 .. .. 0.21 0.24 0.5 61.0
176 Burkina Faso 1.0 1.1 0.7 (.) (.) 0.1 0.1 .. .. 0.13 0.08 19.1 298.0
177 Sierra Leone 0.3 1.0 14.1 (.) (.) 0.1 0.2 .. .. 0.10 0.27 .. ..
Developing countries 6,831.1 T 12,303.3 T 5.7 30.1 42.5 1.7 2.4 2.34 2.59 0.64 0.56 5,091.5 190,359.7
Least developed countries 74.1 T 146.3 T 7.0 0.3 0.5 0.2 0.2 .. .. 0.14 0.17 1,097.8 50,811.2
Arab States 733.6 T 1,348.4 T 6.0 3.2 4.7 3.4 4.5 3.02 2.94 0.75 0.86 44.4 2,393.3
East Asia and the Pacific 3,413.5 T 6,682.0 T 6.8 15.0 23.1 2.1 3.5 .. .. 0.90 0.63 2,293.8 27,222.9
Latin America and the Caribbean 1,087.7 T 1,422.6 T 2.2 4.8 4.9 2.5 2.6 2.25 2.19 0.40 0.36 1,667.0 97,557.2
South Asia 990.7 T 1,954.6 T 7.0 4.4 6.7 0.8 1.3 1.94 2.34 0.49 0.46 -49.3 3,843.5
Sub-Saharan Africa 454.8 T 663.1 T 3.3 2.0 2.3 1.0 1.0 .. .. 0.55 0.57 1,153.6 58,523.2
Central and Eastern Europe and the CIS 4,182.0 T 3,168.0 T -2.0 18.4 10.9 10.3 7.9 2.71 2.51 1.49 0.97 -165.9 37,592.0
OECD 11,205.2 T 13,318.6 T 1.3 49.4 46.0 10.8 11.5 2.47 2.42 0.54 0.45 -999.7 59,956.6
High-income OECD 10,055.4 T 12,137.5 T 1.5 44.3 41.9 12.0 13.2 2.42 2.39 0.52 0.45 -979.6 45,488.9
High human development 14,495.5 T 16,615.8 T 1.0 63.9 57.3 9.8 10.1 2.45 2.40 0.60 0.48 89.8 152,467.3
Medium human development 5,944.4 T 10,215.2 T 5.1 26.2 35.2 1.8 2.5 2.39 2.76 0.83 0.61 3,026.5 86,534.2
Low human development 77.6 T 161.7 T 7.7 0.3 0.6 0.3 0.3 .. .. 0.24 0.36 858.0 41,254.0
High income 10,572.1 T 12,975.1 T 1.6 46.6 44.8 12.1 13.3 2.44 2.40 0.53 0.46 -937.4 54,215.3
Middle income 8,971.5 T 12,162.9 T 2.5 39.5 42.0 3.4 4.0 2.57 2.76 0.95 0.65 3,693.1 170,735.6
Low income 1,323.4 T 2,083.9 T 4.1 5.8 7.2 0.8 0.9 .. .. 0.47 0.43 1,275.1 56,686.1
World 22,702.5 Tb 28,982.7 Tb 2.0 100.0 100.0 4.3 4.5 2.64 2.63 0.68 0.55 4,038.1 282,650.1
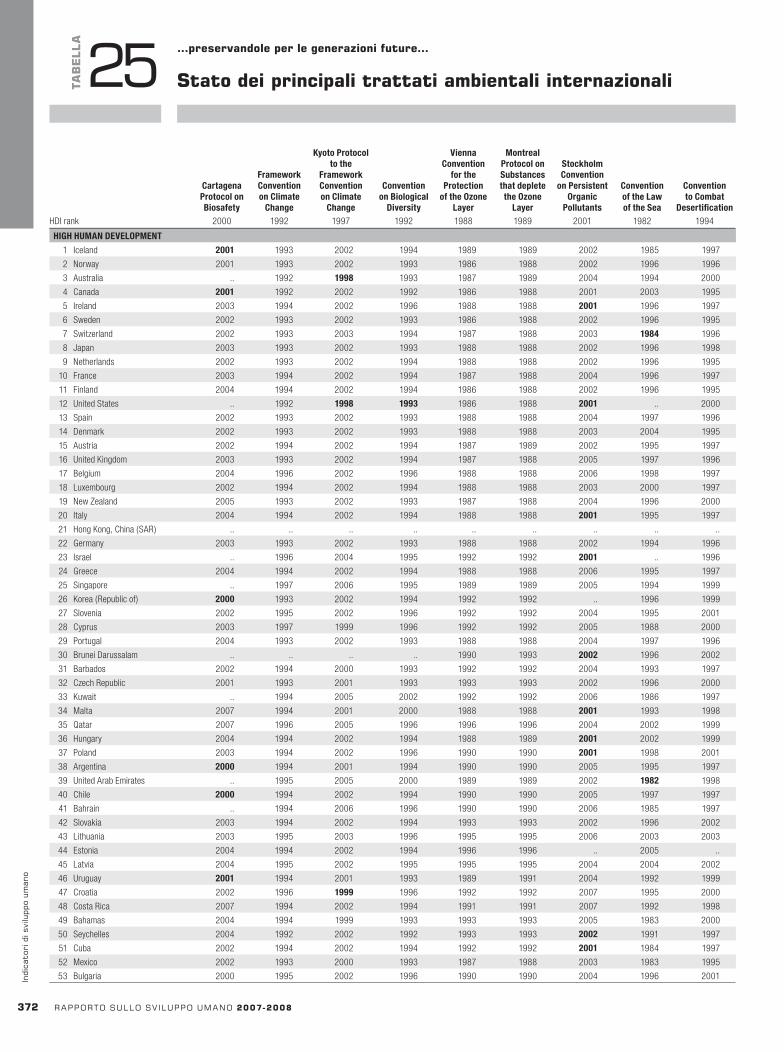
HDI rank
CartagenaProtocolonBiosafety
FrameworkConventiononClimate
Change
KyotoProtocoltothe
FrameworkConventiononClimate
Change
ConventiononBiological
Diversity
ViennaConvention
fortheProtection
oftheOzoneLayer
MontrealProtocolonSubstancesthatdepletetheOzone
Layer
StockholmConvention
onPersistentOrganic
Pollutants
ConventionoftheLawoftheSea
ConventiontoCombat
Desertification2000 1992 1997 1992 1988 1989 2001 1982 1994HDI rank
CartagenaProtocolonBiosafety
FrameworkConventiononClimate
Change
KyotoProtocoltothe
FrameworkConventiononClimate
Change
ConventiononBiological
Diversity
ViennaConvention
fortheProtection
oftheOzoneLayer
MontrealProtocolonSubstancesthatdepletetheOzone
Layer
StockholmConvention
onPersistentOrganic
Pollutants
ConventionoftheLawoftheSea
ConventiontoCombat
Desertification2000 1992 1997 1992 1988 1989 2001 1982 1994
372 rapportosullosv iluppoumano2007-2008
indi
cato
rid
isvi
lupp
oum
ano
TaB
ELLa
25 …preservandoleperlegenerazionifuture…
Statodeiprincipalitrattatiambientaliinternazionali
HIGHHUMANDEVELOPMENT
1 Iceland 2001 1993 2002 1994 1989 1989 2002 1985 1997
2 Norway 2001 1993 2002 1993 1986 1988 2002 1996 1996
3 Australia .. 1992 1998 1993 1987 1989 2004 1994 2000
4 Canada 2001 1992 2002 1992 1986 1988 2001 2003 1995
5 Ireland 2003 1994 2002 1996 1988 1988 2001 1996 1997
6 Sweden 2002 1993 2002 1993 1986 1988 2002 1996 1995
7 Switzerland 2002 1993 2003 1994 1987 1988 2003 1984 1996
8 Japan 2003 1993 2002 1993 1988 1988 2002 1996 1998
9 Netherlands 2002 1993 2002 1994 1988 1988 2002 1996 1995
10 France 2003 1994 2002 1994 1987 1988 2004 1996 1997
11 Finland 2004 1994 2002 1994 1986 1988 2002 1996 1995
12 United States .. 1992 1998 1993 1986 1988 2001 .. 2000
13 Spain 2002 1993 2002 1993 1988 1988 2004 1997 1996
14 Denmark 2002 1993 2002 1993 1988 1988 2003 2004 1995
15 Austria 2002 1994 2002 1994 1987 1989 2002 1995 1997
16 United Kingdom 2003 1993 2002 1994 1987 1988 2005 1997 1996
17 Belgium 2004 1996 2002 1996 1988 1988 2006 1998 1997
18 Luxembourg 2002 1994 2002 1994 1988 1988 2003 2000 1997
19 New Zealand 2005 1993 2002 1993 1987 1988 2004 1996 2000
20 Italy 2004 1994 2002 1994 1988 1988 2001 1995 1997
21 Hong Kong, China (SAR) .. .. .. .. .. .. .. .. ..
22 Germany 2003 1993 2002 1993 1988 1988 2002 1994 1996
23 Israel .. 1996 2004 1995 1992 1992 2001 .. 1996
24 Greece 2004 1994 2002 1994 1988 1988 2006 1995 1997
25 Singapore .. 1997 2006 1995 1989 1989 2005 1994 1999
26 Korea (Republic of) 2000 1993 2002 1994 1992 1992 .. 1996 1999
27 Slovenia 2002 1995 2002 1996 1992 1992 2004 1995 2001
28 Cyprus 2003 1997 1999 1996 1992 1992 2005 1988 2000
29 Portugal 2004 1993 2002 1993 1988 1988 2004 1997 1996
30 Brunei Darussalam .. .. .. .. 1990 1993 2002 1996 2002
31 Barbados 2002 1994 2000 1993 1992 1992 2004 1993 1997
32 Czech Republic 2001 1993 2001 1993 1993 1993 2002 1996 2000
33 Kuwait .. 1994 2005 2002 1992 1992 2006 1986 1997
34 Malta 2007 1994 2001 2000 1988 1988 2001 1993 1998
35 Qatar 2007 1996 2005 1996 1996 1996 2004 2002 1999
36 Hungary 2004 1994 2002 1994 1988 1989 2001 2002 1999
37 Poland 2003 1994 2002 1996 1990 1990 2001 1998 2001
38 Argentina 2000 1994 2001 1994 1990 1990 2005 1995 1997
39 United Arab Emirates .. 1995 2005 2000 1989 1989 2002 1982 1998
40 Chile 2000 1994 2002 1994 1990 1990 2005 1997 1997
41 Bahrain .. 1994 2006 1996 1990 1990 2006 1985 1997
42 Slovakia 2003 1994 2002 1994 1993 1993 2002 1996 2002
43 Lithuania 2003 1995 2003 1996 1995 1995 2006 2003 2003
44 Estonia 2004 1994 2002 1994 1996 1996 .. 2005 ..
45 Latvia 2004 1995 2002 1995 1995 1995 2004 2004 2002
46 Uruguay 2001 1994 2001 1993 1989 1991 2004 1992 1999
47 Croatia 2002 1996 1999 1996 1992 1992 2007 1995 2000
48 Costa Rica 2007 1994 2002 1994 1991 1991 2007 1992 1998
49 Bahamas 2004 1994 1999 1993 1993 1993 2005 1983 2000
50 Seychelles 2004 1992 2002 1992 1993 1993 2002 1991 1997
51 Cuba 2002 1994 2002 1994 1992 1992 2001 1984 1997
52 Mexico 2002 1993 2000 1993 1987 1988 2003 1983 1995
53 Bulgaria 2000 1995 2002 1996 1990 1990 2004 1996 2001
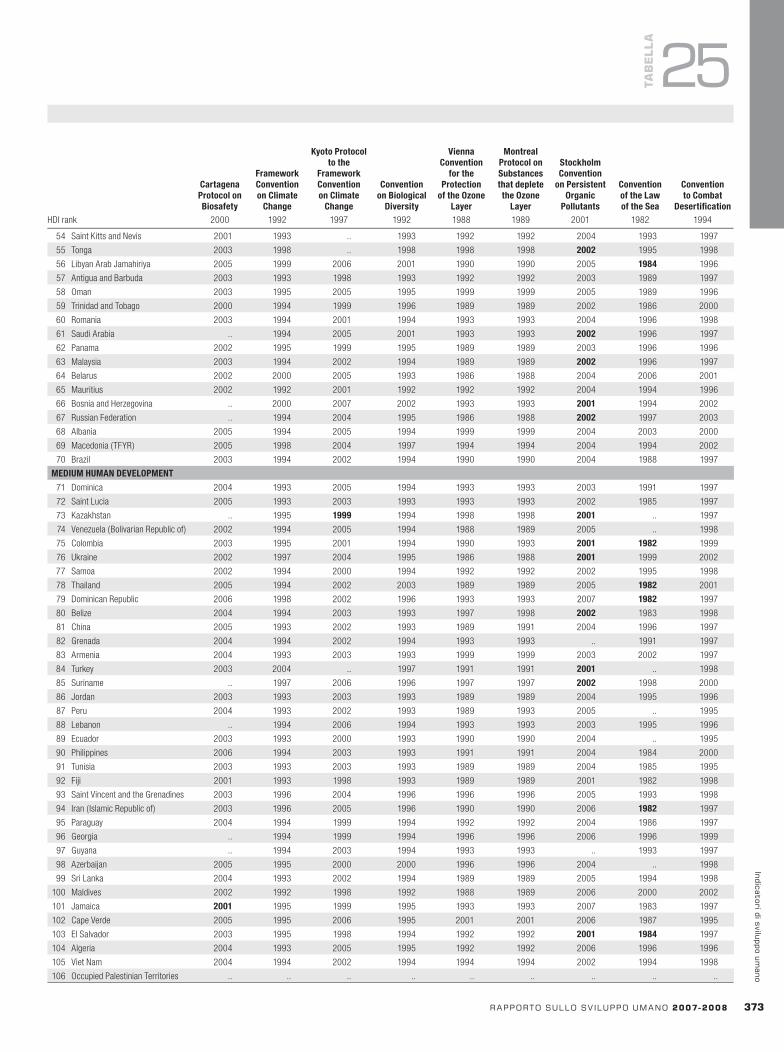
HDI rank
CartagenaProtocolonBiosafety
FrameworkConventiononClimate
Change
KyotoProtocoltothe
FrameworkConventiononClimate
Change
ConventiononBiological
Diversity
ViennaConvention
fortheProtection
oftheOzoneLayer
MontrealProtocolonSubstancesthatdepletetheOzone
Layer
StockholmConvention
onPersistentOrganic
Pollutants
ConventionoftheLawoftheSea
ConventiontoCombat
Desertification2000 1992 1997 1992 1988 1989 2001 1982 1994
rapportosullosv iluppoumano2007-2008 373
indicatoridisviluppoumano
TaB
ELLa
25…preservandoleperlegenerazionifuture…
54 Saint Kitts and Nevis 2001 1993 .. 1993 1992 1992 2004 1993 1997
55 Tonga 2003 1998 .. 1998 1998 1998 2002 1995 1998
56 Libyan Arab Jamahiriya 2005 1999 2006 2001 1990 1990 2005 1984 1996
57 Antigua and Barbuda 2003 1993 1998 1993 1992 1992 2003 1989 1997
58 Oman 2003 1995 2005 1995 1999 1999 2005 1989 1996
59 Trinidad and Tobago 2000 1994 1999 1996 1989 1989 2002 1986 2000
60 Romania 2003 1994 2001 1994 1993 1993 2004 1996 1998
61 Saudi Arabia .. 1994 2005 2001 1993 1993 2002 1996 1997
62 Panama 2002 1995 1999 1995 1989 1989 2003 1996 1996
63 Malaysia 2003 1994 2002 1994 1989 1989 2002 1996 1997
64 Belarus 2002 2000 2005 1993 1986 1988 2004 2006 2001
65 Mauritius 2002 1992 2001 1992 1992 1992 2004 1994 1996
66 Bosnia and Herzegovina .. 2000 2007 2002 1993 1993 2001 1994 2002
67 Russian Federation .. 1994 2004 1995 1986 1988 2002 1997 2003
68 Albania 2005 1994 2005 1994 1999 1999 2004 2003 2000
69 Macedonia (TFYR) 2005 1998 2004 1997 1994 1994 2004 1994 2002
70 Brazil 2003 1994 2002 1994 1990 1990 2004 1988 1997
MEDIUMHUMANDEVELOPMENT
71 Dominica 2004 1993 2005 1994 1993 1993 2003 1991 1997
72 Saint Lucia 2005 1993 2003 1993 1993 1993 2002 1985 1997
73 Kazakhstan .. 1995 1999 1994 1998 1998 2001 .. 1997
74 Venezuela (Bolivarian Republic of) 2002 1994 2005 1994 1988 1989 2005 .. 1998
75 Colombia 2003 1995 2001 1994 1990 1993 2001 1982 1999
76 Ukraine 2002 1997 2004 1995 1986 1988 2001 1999 2002
77 Samoa 2002 1994 2000 1994 1992 1992 2002 1995 1998
78 Thailand 2005 1994 2002 2003 1989 1989 2005 1982 2001
79 Dominican Republic 2006 1998 2002 1996 1993 1993 2007 1982 1997
80 Belize 2004 1994 2003 1993 1997 1998 2002 1983 1998
81 China 2005 1993 2002 1993 1989 1991 2004 1996 1997
82 Grenada 2004 1994 2002 1994 1993 1993 .. 1991 1997
83 Armenia 2004 1993 2003 1993 1999 1999 2003 2002 1997
84 Turkey 2003 2004 .. 1997 1991 1991 2001 .. 1998
85 Suriname .. 1997 2006 1996 1997 1997 2002 1998 2000
86 Jordan 2003 1993 2003 1993 1989 1989 2004 1995 1996
87 Peru 2004 1993 2002 1993 1989 1993 2005 .. 1995
88 Lebanon .. 1994 2006 1994 1993 1993 2003 1995 1996
89 Ecuador 2003 1993 2000 1993 1990 1990 2004 .. 1995
90 Philippines 2006 1994 2003 1993 1991 1991 2004 1984 2000
91 Tunisia 2003 1993 2003 1993 1989 1989 2004 1985 1995
92 Fiji 2001 1993 1998 1993 1989 1989 2001 1982 1998
93 Saint Vincent and the Grenadines 2003 1996 2004 1996 1996 1996 2005 1993 1998
94 Iran ( Islamic Republic of) 2003 1996 2005 1996 1990 1990 2006 1982 1997
95 Paraguay 2004 1994 1999 1994 1992 1992 2004 1986 1997
96 Georgia .. 1994 1999 1994 1996 1996 2006 1996 1999
97 Guyana .. 1994 2003 1994 1993 1993 .. 1993 1997
98 Azerbaijan 2005 1995 2000 2000 1996 1996 2004 .. 1998
99 Sri Lanka 2004 1993 2002 1994 1989 1989 2005 1994 1998
100 Maldives 2002 1992 1998 1992 1988 1989 2006 2000 2002
101 Jamaica 2001 1995 1999 1995 1993 1993 2007 1983 1997
102 Cape Verde 2005 1995 2006 1995 2001 2001 2006 1987 1995
103 El Salvador 2003 1995 1998 1994 1992 1992 2001 1984 1997
104 Algeria 2004 1993 2005 1995 1992 1992 2006 1996 1996
105 Viet Nam 2004 1994 2002 1994 1994 1994 2002 1994 1998
106 Occupied Palestinian Territories .. .. .. .. .. .. .. .. ..
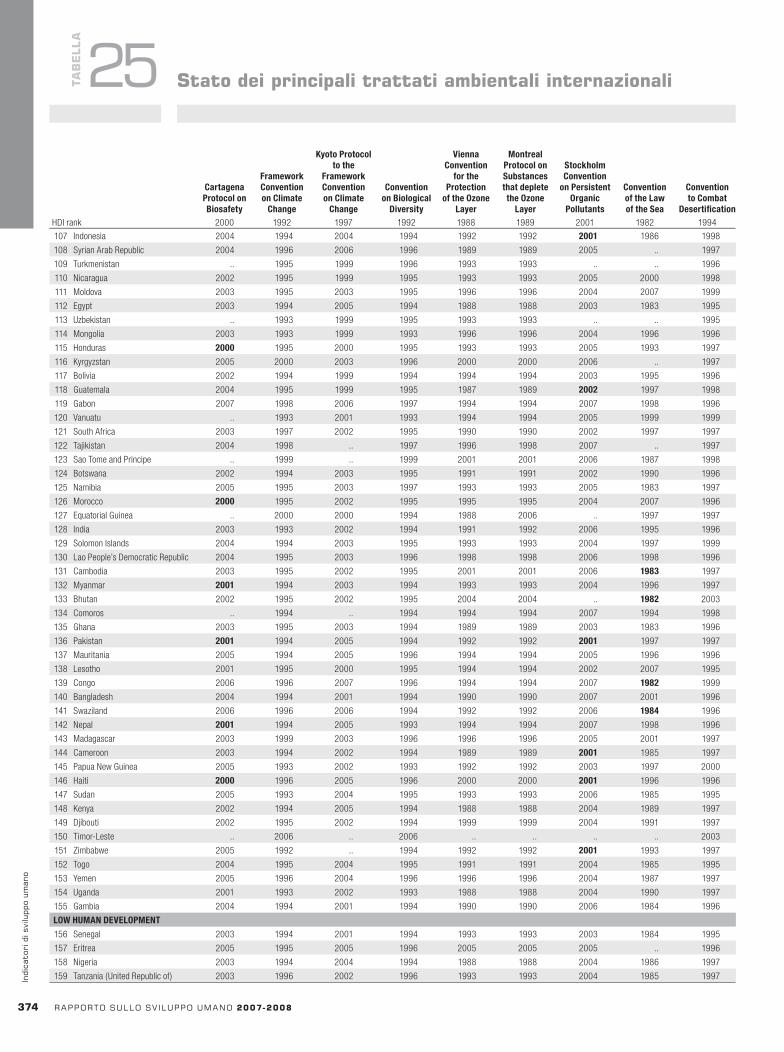
HDI rank
CartagenaProtocolonBiosafety
FrameworkConventiononClimate
Change
KyotoProtocoltothe
FrameworkConventiononClimate
Change
ConventiononBiological
Diversity
ViennaConvention
fortheProtection
oftheOzoneLayer
MontrealProtocolonSubstancesthatdepletetheOzone
Layer
StockholmConvention
onPersistentOrganic
Pollutants
ConventionoftheLawoftheSea
ConventiontoCombat
Desertification2000 1992 1997 1992 1988 1989 2001 1982 1994HDI rank
CartagenaProtocolonBiosafety
FrameworkConventiononClimate
Change
KyotoProtocoltothe
FrameworkConventiononClimate
Change
ConventiononBiological
Diversity
ViennaConvention
fortheProtection
oftheOzoneLayer
MontrealProtocolonSubstancesthatdepletetheOzone
Layer
StockholmConvention
onPersistentOrganic
Pollutants
ConventionoftheLawoftheSea
ConventiontoCombat
Desertification2000 1992 1997 1992 1988 1989 2001 1982 1994
374 rapportosullosv iluppoumano2007-2008
indi
cato
rid
isvi
lupp
oum
ano
TaB
ELLa
25 Statodeiprincipalitrattatiambientaliinternazionali
107 Indonesia 2004 1994 2004 1994 1992 1992 2001 1986 1998
108 Syrian Arab Republic 2004 1996 2006 1996 1989 1989 2005 .. 1997
109 Turkmenistan .. 1995 1999 1996 1993 1993 .. .. 1996
110 Nicaragua 2002 1995 1999 1995 1993 1993 2005 2000 1998
111 Moldova 2003 1995 2003 1995 1996 1996 2004 2007 1999
112 Egypt 2003 1994 2005 1994 1988 1988 2003 1983 1995
113 Uzbekistan .. 1993 1999 1995 1993 1993 .. .. 1995
114 Mongolia 2003 1993 1999 1993 1996 1996 2004 1996 1996
115 Honduras 2000 1995 2000 1995 1993 1993 2005 1993 1997
116 Kyrgyzstan 2005 2000 2003 1996 2000 2000 2006 .. 1997
117 Bolivia 2002 1994 1999 1994 1994 1994 2003 1995 1996
118 Guatemala 2004 1995 1999 1995 1987 1989 2002 1997 1998
119 Gabon 2007 1998 2006 1997 1994 1994 2007 1998 1996
120 Vanuatu .. 1993 2001 1993 1994 1994 2005 1999 1999
121 South Africa 2003 1997 2002 1995 1990 1990 2002 1997 1997
122 Tajikistan 2004 1998 .. 1997 1996 1998 2007 .. 1997
123 Sao Tome and Principe .. 1999 .. 1999 2001 2001 2006 1987 1998
124 Botswana 2002 1994 2003 1995 1991 1991 2002 1990 1996
125 Namibia 2005 1995 2003 1997 1993 1993 2005 1983 1997
126 Morocco 2000 1995 2002 1995 1995 1995 2004 2007 1996
127 Equatorial Guinea .. 2000 2000 1994 1988 2006 .. 1997 1997
128 India 2003 1993 2002 1994 1991 1992 2006 1995 1996
129 Solomon Islands 2004 1994 2003 1995 1993 1993 2004 1997 1999
130 Lao People’s Democratic Republic 2004 1995 2003 1996 1998 1998 2006 1998 1996
131 Cambodia 2003 1995 2002 1995 2001 2001 2006 1983 1997
132 Myanmar 2001 1994 2003 1994 1993 1993 2004 1996 1997
133 Bhutan 2002 1995 2002 1995 2004 2004 .. 1982 2003
134 Comoros .. 1994 .. 1994 1994 1994 2007 1994 1998
135 Ghana 2003 1995 2003 1994 1989 1989 2003 1983 1996
136 Pakistan 2001 1994 2005 1994 1992 1992 2001 1997 1997
137 Mauritania 2005 1994 2005 1996 1994 1994 2005 1996 1996
138 Lesotho 2001 1995 2000 1995 1994 1994 2002 2007 1995
139 Congo 2006 1996 2007 1996 1994 1994 2007 1982 1999
140 Bangladesh 2004 1994 2001 1994 1990 1990 2007 2001 1996
141 Swaziland 2006 1996 2006 1994 1992 1992 2006 1984 1996
142 Nepal 2001 1994 2005 1993 1994 1994 2007 1998 1996
143 Madagascar 2003 1999 2003 1996 1996 1996 2005 2001 1997
144 Cameroon 2003 1994 2002 1994 1989 1989 2001 1985 1997
145 Papua New Guinea 2005 1993 2002 1993 1992 1992 2003 1997 2000
146 Haiti 2000 1996 2005 1996 2000 2000 2001 1996 1996
147 Sudan 2005 1993 2004 1995 1993 1993 2006 1985 1995
148 Kenya 2002 1994 2005 1994 1988 1988 2004 1989 1997
149 Djibouti 2002 1995 2002 1994 1999 1999 2004 1991 1997
150 Timor-Leste .. 2006 .. 2006 .. .. .. .. 2003
151 Zimbabwe 2005 1992 .. 1994 1992 1992 2001 1993 1997
152 Togo 2004 1995 2004 1995 1991 1991 2004 1985 1995
153 Yemen 2005 1996 2004 1996 1996 1996 2004 1987 1997
154 Uganda 2001 1993 2002 1993 1988 1988 2004 1990 1997
155 Gambia 2004 1994 2001 1994 1990 1990 2006 1984 1996
LOWHUMANDEVELOPMENT
156 Senegal 2003 1994 2001 1994 1993 1993 2003 1984 1995
157 Eritrea 2005 1995 2005 1996 2005 2005 2005 .. 1996
158 Nigeria 2003 1994 2004 1994 1988 1988 2004 1986 1997
159 Tanzania (United Republic of) 2003 1996 2002 1996 1993 1993 2004 1985 1997
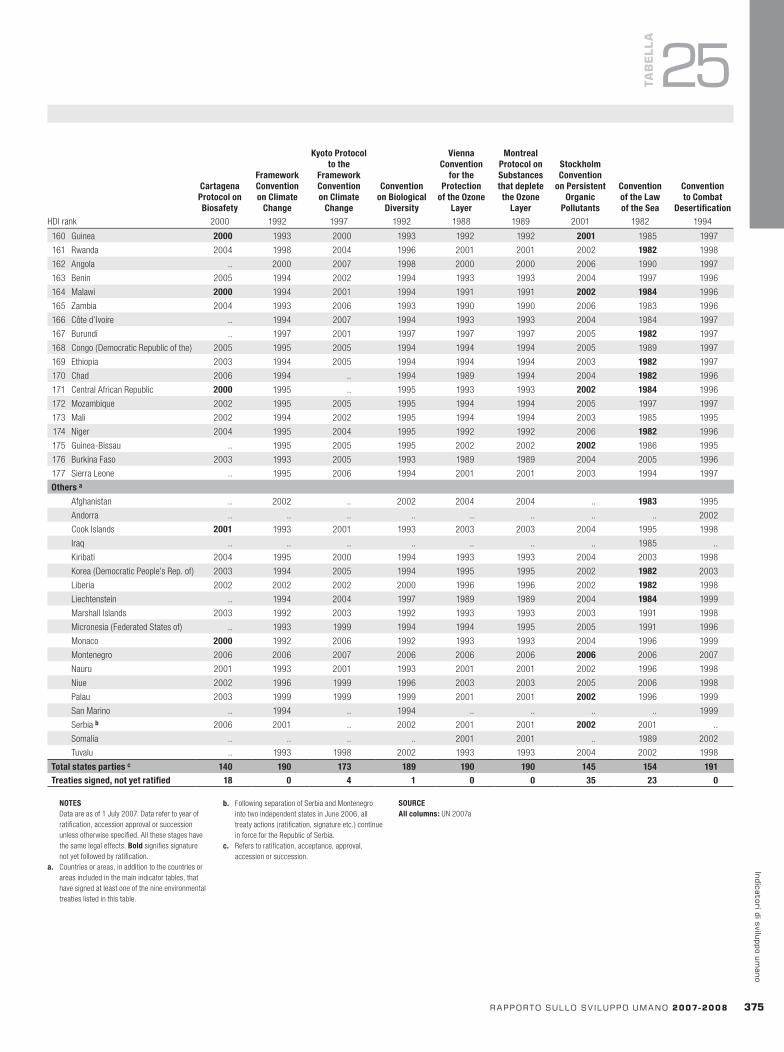
HDI rank
CartagenaProtocolonBiosafety
FrameworkConventiononClimate
Change
KyotoProtocoltothe
FrameworkConventiononClimate
Change
ConventiononBiological
Diversity
ViennaConvention
fortheProtection
oftheOzoneLayer
MontrealProtocolonSubstancesthatdepletetheOzone
Layer
StockholmConvention
onPersistentOrganic
Pollutants
ConventionoftheLawoftheSea
ConventiontoCombat
Desertification2000 1992 1997 1992 1988 1989 2001 1982 1994HDI rank
CartagenaProtocolonBiosafety
FrameworkConventiononClimate
Change
KyotoProtocoltothe
FrameworkConventiononClimate
Change
ConventiononBiological
Diversity
ViennaConvention
fortheProtection
oftheOzoneLayer
MontrealProtocolonSubstancesthatdepletetheOzone
Layer
StockholmConvention
onPersistentOrganic
Pollutants
ConventionoftheLawoftheSea
ConventiontoCombat
Desertification2000 1992 1997 1992 1988 1989 2001 1982 1994
rapportosullosv iluppoumano2007-2008 37�
indicatoridisviluppoumano
NOTES Data are as of 1 July 2007. Data refer to year of
ratification, accession approval or succession unless otherwise specified. All these stages have the same legal effects. Bold signifies signature not yet followed by ratification.
a. Countries or areas, in addition to the countries or areas included in the main indicator tables, that have signed at least one of the nine environmental treaties listed in this table.
b. Following separation of Serbia and Montenegro into two independent states in June 2006, all treaty actions (ratification, signature etc.) continue in force for the Republic of Serbia.
c. Refers to ratification, acceptance, approval, accession or succession.
SOURCEAllcolumns: UN 2007a
TaB
ELLa
25
160 Guinea 2000 1993 2000 1993 1992 1992 2001 1985 1997
161 Rwanda 2004 1998 2004 1996 2001 2001 2002 1982 1998
162 Angola .. 2000 2007 1998 2000 2000 2006 1990 1997
163 Benin 2005 1994 2002 1994 1993 1993 2004 1997 1996
164 Malawi 2000 1994 2001 1994 1991 1991 2002 1984 1996
165 Zambia 2004 1993 2006 1993 1990 1990 2006 1983 1996
166 Côte d’Ivoire .. 1994 2007 1994 1993 1993 2004 1984 1997
167 Burundi .. 1997 2001 1997 1997 1997 2005 1982 1997
168 Congo (Democratic Republic of the) 2005 1995 2005 1994 1994 1994 2005 1989 1997
169 Ethiopia 2003 1994 2005 1994 1994 1994 2003 1982 1997
170 Chad 2006 1994 .. 1994 1989 1994 2004 1982 1996
171 Central African Republic 2000 1995 .. 1995 1993 1993 2002 1984 1996
172 Mozambique 2002 1995 2005 1995 1994 1994 2005 1997 1997
173 Mali 2002 1994 2002 1995 1994 1994 2003 1985 1995
174 Niger 2004 1995 2004 1995 1992 1992 2006 1982 1996
175 Guinea-Bissau .. 1995 2005 1995 2002 2002 2002 1986 1995
176 Burkina Faso 2003 1993 2005 1993 1989 1989 2004 2005 1996
177 Sierra Leone .. 1995 2006 1994 2001 2001 2003 1994 1997
Othersa
Afghanistan .. 2002 .. 2002 2004 2004 .. 1983 1995
Andorra .. .. .. .. .. .. .. .. 2002
Cook Islands 2001 1993 2001 1993 2003 2003 2004 1995 1998
Iraq .. .. .. .. .. .. .. 1985 ..
Kiribati 2004 1995 2000 1994 1993 1993 2004 2003 1998
Korea (Democratic People’s Rep. of) 2003 1994 2005 1994 1995 1995 2002 1982 2003
Liberia 2002 2002 2002 2000 1996 1996 2002 1982 1998
Liechtenstein .. 1994 2004 1997 1989 1989 2004 1984 1999
Marshall Islands 2003 1992 2003 1992 1993 1993 2003 1991 1998
Micronesia (Federated States of) .. 1993 1999 1994 1994 1995 2005 1991 1996
Monaco 2000 1992 2006 1992 1993 1993 2004 1996 1999
Montenegro 2006 2006 2007 2006 2006 2006 2006 2006 2007
Nauru 2001 1993 2001 1993 2001 2001 2002 1996 1998
Niue 2002 1996 1999 1996 2003 2003 2005 2006 1998
Palau 2003 1999 1999 1999 2001 2001 2002 1996 1999
San Marino .. 1994 .. 1994 .. .. .. .. 1999
Serbia b 2006 2001 .. 2002 2001 2001 2002 2001 ..
Somalia .. .. .. .. 2001 2001 .. 1989 2002
Tuvalu .. 1993 1998 2002 1993 1993 2004 2002 1998
Totalstatespartiesc 140 190 173 189 190 190 145 154 191Treatiessigned,notyetratified 18 0 4 1 0 0 35 23 0

HDI rank
Internallydisplacedpeoplea
(thousands)
Conventionalarmstransfersb
(1990 prices)Refugees
Bycountryofasylum(thousands)
Bycountryoforiginc
(thousands)
Exports Totalarmedforces
Imports(US$ millions)
US$millions
Shared
(%) ThousandsIndex
(1985=100)2006e 2006e 2006e 1996 2006 2006 2002–2006 2007 2007HDI rank
Internallydisplacedpeoplea
(thousands)
Conventionalarmstransfersb
(1990 prices)Refugees
Bycountryofasylum(thousands)
Bycountryoforiginc
(thousands)
Exports Totalarmedforces
Imports(US$ millions)
US$millions
Shared
(%) ThousandsIndex
(1985=100)2006e 2006e 2006e 1996 2006 2006 2002–2006 2007 2007
37� rapportosullosv iluppoumano2007-2008
indi
cato
rid
isvi
lupp
oum
ano
TaB
ELLa
26 …garantendolasicurezzapersonale…
Rifugiatiearmamenti
HIGHHUMANDEVELOPMENT
1 Iceland .. (.) (.) .. .. .. .. 0 ..
2 Norway .. 43 .. 183 501 2 (.) 23 62
3 Australia .. 69 (.) 582 768 4 (.) 52 74
4 Canada .. 152 (.) 389 100 227 1 63 76
5 Ireland .. 8 .. 0 11 .. .. 10 73
6 Sweden .. 80 (.) 104 122 472 2 28 43
7 Switzerland .. 49 (.) 187 72 144 1 4 ..
8 Japan .. 2 (.) 813 400 0 (.) 240 99
9 Netherlands .. 101 (.) 181 171 1,481 3 53 50
10 France .. 146 (.) 28 121 1,557 8 255 55
11 Finland .. 12 (.) 605 84 31 (.) 29 79
12 United States .. 844 1 540 417 7,888 30 1,506 70
13 Spain .. 5 2 435 378 803 1 147 46
14 Denmark .. 37 (.) 70 133 3 (.) 22 74
15 Austria .. 25 (.) 10 0 61 (.) 40 73
16 United Kingdom .. 302 0 735 462 1,071 4 191 57
17 Belgium .. 17 (.) 4 4 50 (.) 40 44
18 Luxembourg .. 2 .. 4 0 .. .. 1 129
19 New Zealand .. 5 (.) 7 8 0 (.) 9 73
20 Italy .. 27 (.) 293 697 860 2 191 50
21 Hong Kong, China (SAR) .. 2 (.) .. .. .. .. .. ..
22 Germany .. 605 (.) 213 529 3,850 9 246 51
23 Israel 150–420f 1 1 88 994 224 2 168 118
24 Greece .. 2 (.) 377 1,452 23 (.) 147 73
25 Singapore .. .. (.) 153 54 0 (.) 73 133
26 Korea (Republic of) .. (.) 1 1,759 1,292 89 (.) 687 115
27 Slovenia .. (.) 2 14 2 .. .. 7 ..
28 Cyprus 210g 1 (.) 169 26 0 (.) 10 100
29 Portugal .. (.) (.) 7 431 .. .. 44 60
30 Brunei Darussalam .. .. .. 17 3 .. .. 7 171
31 Barbados .. .. (.) .. .. .. .. 1 61
32 Czech Republic .. 2 2 24 65 56 (.) 25 12
33 Kuwait .. (.) 1 1,161 107 0 (.) 16 133
34 Malta .. 2 (.) 1 0 0 (.) 2 250
35 Qatar .. (.) (.) 201 0 0 (.) 12 200
36 Hungary .. 8 3 138 337 0 (.) 32 30
37 Poland .. 7 14 99 224 169 (.) 142 45
38 Argentina .. 3 1 57 53 0 (.) 72 67
39 United Arab Emirates .. (.) (.) 474 2,439 7 (.) 51 119
40 Chile .. 1 1 180 1,125 0 (.) 76 75
41 Bahrain .. .. (.) 181 60 0 (.) 11 393
42 Slovakia .. (.) 1 30 0 0 (.) 15 ..
43 Lithuania .. 1 1 15 33 0 (.) 12 ..
44 Estonia .. (.) 1 1 8 0 (.) 4 ..
45 Latvia .. (.) 1 0 4 .. .. 5 ..
46 Uruguay .. (.) (.) 4 7 0 (.) 25 78
47 Croatia 4–7 2 94 14 0 0 (.) 21 ..
48 Costa Rica .. 12 (.) .. .. .. .. 0 ..
49 Bahamas .. .. (.) 0 0 .. .. 1 172
50 Seychelles .. .. (.) .. .. .. .. (.) 17
51 Cuba .. 1 34 .. .. .. .. 49 30
52 Mexico 10–12g 3 3 79 68 .. .. 238 184
53 Bulgaria .. 5 3 123 20 0 (.) 51 34
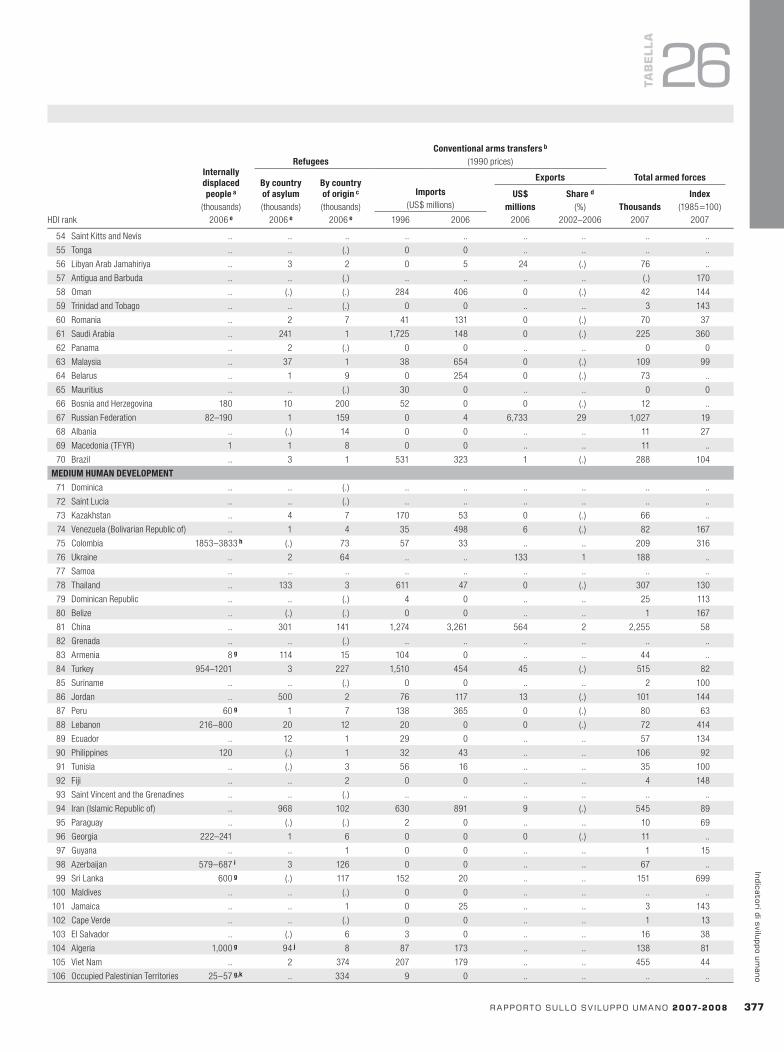
HDI rank
Internallydisplacedpeoplea
(thousands)
Conventionalarmstransfersb
(1990 prices)Refugees
Bycountryofasylum(thousands)
Bycountryoforiginc
(thousands)
Exports Totalarmedforces
Imports(US$ millions)
US$millions
Shared
(%) ThousandsIndex
(1985=100)2006e 2006e 2006e 1996 2006 2006 2002–2006 2007 2007
rapportosullosv iluppoumano2007-2008 377
indicatoridisviluppoumano
TaB
ELLa
26
54 Saint Kitts and Nevis .. .. .. .. .. .. .. .. ..
55 Tonga .. .. (.) 0 0 .. .. .. ..
56 Libyan Arab Jamahiriya .. 3 2 0 5 24 (.) 76 ..
57 Antigua and Barbuda .. .. (.) .. .. .. .. (.) 170
58 Oman .. (.) (.) 284 406 0 (.) 42 144
59 Trinidad and Tobago .. .. (.) 0 0 .. .. 3 143
60 Romania .. 2 7 41 131 0 (.) 70 37
61 Saudi Arabia .. 241 1 1,725 148 0 (.) 225 360
62 Panama .. 2 (.) 0 0 .. .. 0 0
63 Malaysia .. 37 1 38 654 0 (.) 109 99
64 Belarus .. 1 9 0 254 0 (.) 73 ..
65 Mauritius .. .. (.) 30 0 .. .. 0 0
66 Bosnia and Herzegovina 180 10 200 52 0 0 (.) 12 ..
67 Russian Federation 82–190 1 159 0 4 6,733 29 1,027 19
68 Albania .. (.) 14 0 0 .. .. 11 27
69 Macedonia (TFYR) 1 1 8 0 0 .. .. 11 ..
70 Brazil .. 3 1 531 323 1 (.) 288 104
MEDIUMHUMANDEVELOPMENT
71 Dominica .. .. (.) .. .. .. .. .. ..
72 Saint Lucia .. .. (.) .. .. .. .. .. ..
73 Kazakhstan .. 4 7 170 53 0 (.) 66 ..
74 Venezuela (Bolivarian Republic of) .. 1 4 35 498 6 (.) 82 167
75 Colombia 1853–3833h (.) 73 57 33 .. .. 209 316
76 Ukraine .. 2 64 .. .. 133 1 188 ..
77 Samoa .. .. .. .. .. .. .. .. ..
78 Thailand .. 133 3 611 47 0 (.) 307 130
79 Dominican Republic .. .. (.) 4 0 .. .. 25 113
80 Belize .. (.) (.) 0 0 .. .. 1 167
81 China .. 301 141 1,274 3,261 564 2 2,255 58
82 Grenada .. .. (.) .. .. .. .. .. ..
83 Armenia 8g 114 15 104 0 .. .. 44 ..
84 Turkey 954–1201 3 227 1,510 454 45 (.) 515 82
85 Suriname .. .. (.) 0 0 .. .. 2 100
86 Jordan .. 500 2 76 117 13 (.) 101 144
87 Peru 60g 1 7 138 365 0 (.) 80 63
88 Lebanon 216–800 20 12 20 0 0 (.) 72 414
89 Ecuador .. 12 1 29 0 .. .. 57 134
90 Philippines 120 (.) 1 32 43 .. .. 106 92
91 Tunisia .. (.) 3 56 16 .. .. 35 100
92 Fiji .. .. 2 0 0 .. .. 4 148
93 Saint Vincent and the Grenadines .. .. (.) .. .. .. .. .. ..
94 Iran ( Islamic Republic of) .. 968 102 630 891 9 (.) 545 89
95 Paraguay .. (.) (.) 2 0 .. .. 10 69
96 Georgia 222–241 1 6 0 0 0 (.) 11 ..
97 Guyana .. .. 1 0 0 .. .. 1 15
98 Azerbaijan 579–687i 3 126 0 0 .. .. 67 ..
99 Sri Lanka 600g (.) 117 152 20 .. .. 151 699
100 Maldives .. .. (.) 0 0 .. .. .. ..
101 Jamaica .. .. 1 0 25 .. .. 3 143
102 Cape Verde .. .. (.) 0 0 .. .. 1 13
103 El Salvador .. (.) 6 3 0 .. .. 16 38
104 Algeria 1,000g 94j 8 87 173 .. .. 138 81
105 Viet Nam .. 2 374 207 179 .. .. 455 44
106 Occupied Palestinian Territories 25–57g,k .. 334 9 0 .. .. .. ..
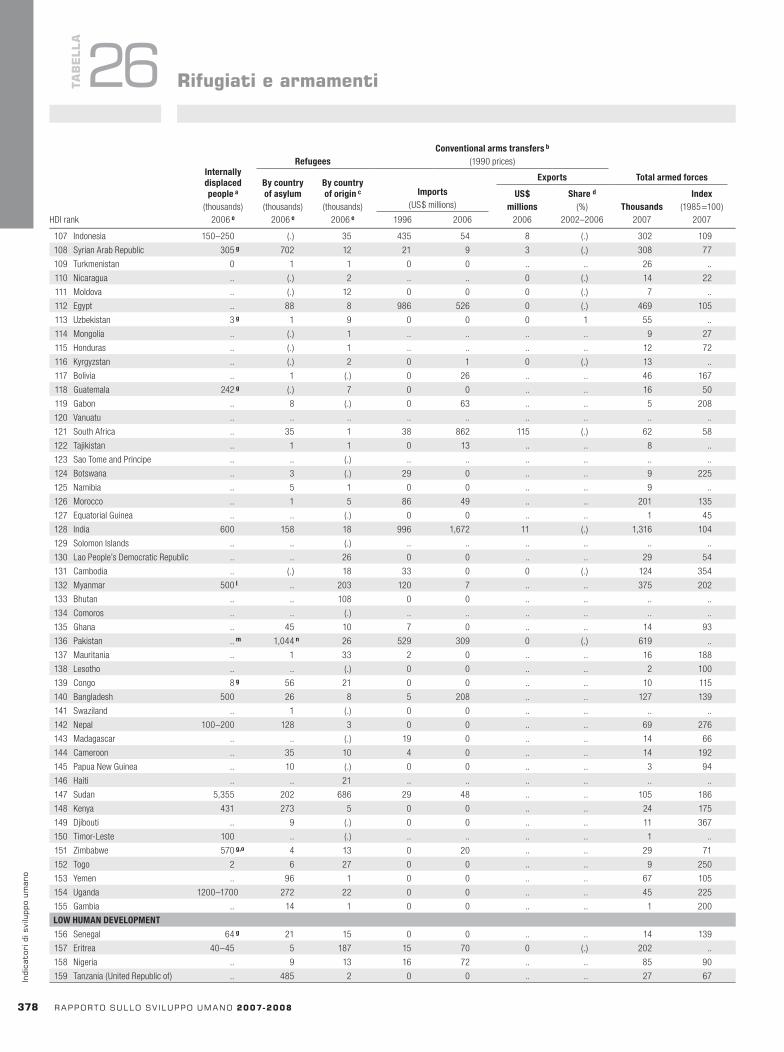
HDI rank
Internallydisplacedpeoplea
(thousands)
Conventionalarmstransfersb
(1990 prices)Refugees
Bycountryofasylum(thousands)
Bycountryoforiginc
(thousands)
Exports Totalarmedforces
Imports(US$ millions)
US$millions
Shared
(%) ThousandsIndex
(1985=100)2006e 2006e 2006e 1996 2006 2006 2002–2006 2007 2007HDI rank
Internallydisplacedpeoplea
(thousands)
Conventionalarmstransfersb
(1990 prices)Refugees
Bycountryofasylum(thousands)
Bycountryoforiginc
(thousands)
Exports Totalarmedforces
Imports(US$ millions)
US$millions
Shared
(%) ThousandsIndex
(1985=100)2006e 2006e 2006e 1996 2006 2006 2002–2006 2007 2007
378 rapportosullosv iluppoumano2007-2008
indi
cato
rid
isvi
lupp
oum
ano
TaB
ELLa
26 Rifugiatiearmamenti
107 Indonesia 150–250 (.) 35 435 54 8 (.) 302 109
108 Syrian Arab Republic 305g 702 12 21 9 3 (.) 308 77
109 Turkmenistan 0 1 1 0 0 .. .. 26 ..
110 Nicaragua .. (.) 2 .. .. 0 (.) 14 22
111 Moldova .. (.) 12 0 0 0 (.) 7 ..
112 Egypt .. 88 8 986 526 0 (.) 469 105
113 Uzbekistan 3g 1 9 0 0 0 1 55 ..
114 Mongolia .. (.) 1 .. .. .. .. 9 27
115 Honduras .. (.) 1 .. .. .. .. 12 72
116 Kyrgyzstan .. (.) 2 0 1 0 (.) 13 ..
117 Bolivia .. 1 (.) 0 26 .. .. 46 167
118 Guatemala 242g (.) 7 0 0 .. .. 16 50
119 Gabon .. 8 (.) 0 63 .. .. 5 208
120 Vanuatu .. .. .. .. .. .. .. .. ..
121 South Africa .. 35 1 38 862 115 (.) 62 58
122 Tajikistan .. 1 1 0 13 .. .. 8 ..
123 Sao Tome and Principe .. .. (.) .. .. .. .. .. ..
124 Botswana .. 3 (.) 29 0 .. .. 9 225
125 Namibia .. 5 1 0 0 .. .. 9 ..
126 Morocco .. 1 5 86 49 .. .. 201 135
127 Equatorial Guinea .. .. (.) 0 0 .. .. 1 45
128 India 600 158 18 996 1,672 11 (.) 1,316 104
129 Solomon Islands .. .. (.) .. .. .. .. .. ..
130 Lao People’s Democratic Republic .. .. 26 0 0 .. .. 29 54
131 Cambodia .. (.) 18 33 0 0 (.) 124 354
132 Myanmar 500l .. 203 120 7 .. .. 375 202
133 Bhutan .. .. 108 0 0 .. .. .. ..
134 Comoros .. .. (.) .. .. .. .. .. ..
135 Ghana .. 45 10 7 0 .. .. 14 93
136 Pakistan ..m 1,044n 26 529 309 0 (.) 619 ..
137 Mauritania .. 1 33 2 0 .. .. 16 188
138 Lesotho .. .. (.) 0 0 .. .. 2 100
139 Congo 8g 56 21 0 0 .. .. 10 115
140 Bangladesh 500 26 8 5 208 .. .. 127 139
141 Swaziland .. 1 (.) 0 0 .. .. .. ..
142 Nepal 100–200 128 3 0 0 .. .. 69 276
143 Madagascar .. .. (.) 19 0 .. .. 14 66
144 Cameroon .. 35 10 4 0 .. .. 14 192
145 Papua New Guinea .. 10 (.) 0 0 .. .. 3 94
146 Haiti .. .. 21 .. .. .. .. .. ..
147 Sudan 5,355 202 686 29 48 .. .. 105 186
148 Kenya 431 273 5 0 0 .. .. 24 175
149 Djibouti .. 9 (.) 0 0 .. .. 11 367
150 Timor-Leste 100 .. (.) .. .. .. .. 1 ..
151 Zimbabwe 570g,o 4 13 0 20 .. .. 29 71
152 Togo 2 6 27 0 0 .. .. 9 250
153 Yemen .. 96 1 0 0 .. .. 67 105
154 Uganda 1200–1700 272 22 0 0 .. .. 45 225
155 Gambia .. 14 1 0 0 .. .. 1 200
LOWHUMANDEVELOPMENT
156 Senegal 64g 21 15 0 0 .. .. 14 139
157 Eritrea 40–45 5 187 15 70 0 (.) 202 ..
158 Nigeria .. 9 13 16 72 .. .. 85 90
159 Tanzania (United Republic of) .. 485 2 0 0 .. .. 27 67
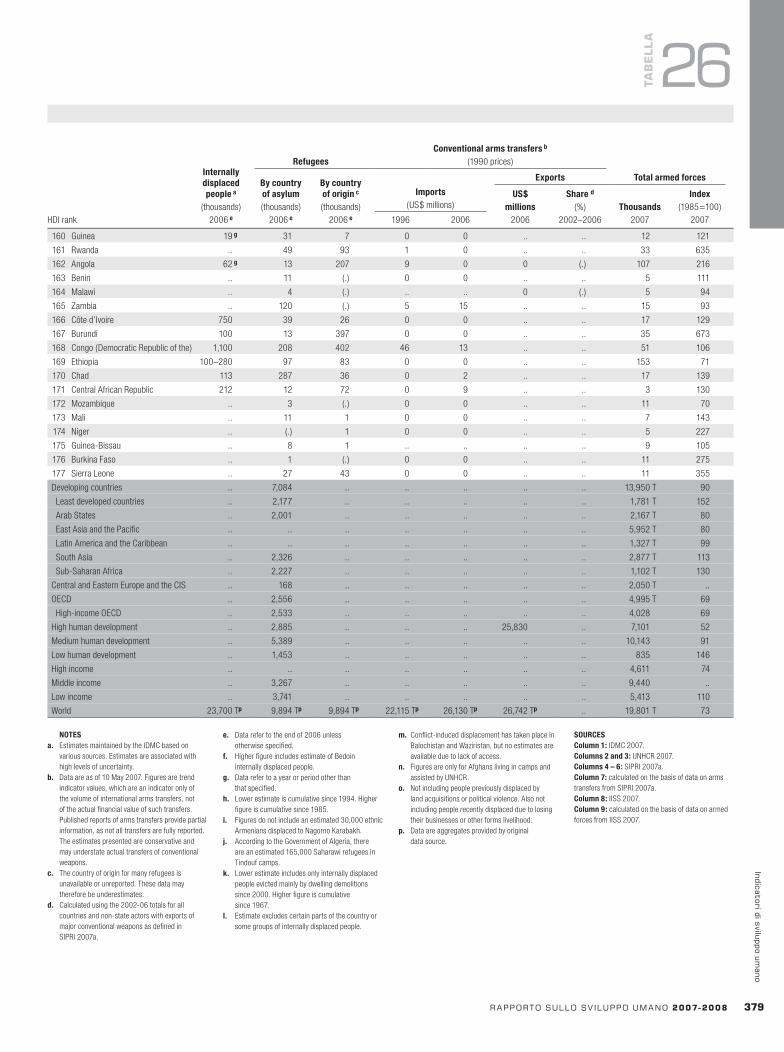
HDI rank
Internallydisplacedpeoplea
(thousands)
Conventionalarmstransfersb
(1990 prices)Refugees
Bycountryofasylum(thousands)
Bycountryoforiginc
(thousands)
Exports Totalarmedforces
Imports(US$ millions)
US$millions
Shared
(%) ThousandsIndex
(1985=100)2006e 2006e 2006e 1996 2006 2006 2002–2006 2007 2007
rapportosullosv iluppoumano2007-2008 37�
indicatoridisviluppoumano
NOTESa. Estimates maintained by the IDMC based on
various sources. Estimates are associated with high levels of uncertainty.
b. Data are as of 10 May 2007. Figures are trend indicator values, which are an indicator only of the volume of international arms transfers, not of the actual financial value of such transfers. Published reports of arms transfers provide partial information, as not all transfers are fully reported. The estimates presented are conservative and may understate actual transfers of conventional weapons.
c. The country of origin for many refugees is unavailable or unreported. These data may therefore be underestimates.
d. Calculated using the 2002-06 totals for all countries and non-state actors with exports of major conventional weapons as defined in SIPRI 2007a.
e. Data refer to the end of 2006 unless otherwise specified.
f. Higher figure includes estimate of Bedoin internally displaced people.
g. Data refer to a year or period other than that specified.
h. Lower estimate is cumulative since 1994. Higher figure is cumulative since 1985.
i. Figures do not include an estimated 30,000 ethnic Armenians displaced to Nagorno Karabakh.
j. According to the Government of Algeria, there are an estimated 165,000 Saharawi refugees in Tindouf camps.
k. Lower estimate includes only internally displaced people evicted mainly by dwelling demolitions since 2000. Higher figure is cumulative since 1967.
l. Estimate excludes certain parts of the country or some groups of internally displaced people.
m. Conflict-induced displacement has taken place in Balochistan and Waziristan, but no estimates are available due to lack of access.
n. Figures are only for Afghans living in camps and assisted by UNHCR.
o. Not including people previously displaced by land acquisitions or political violence. Also not including people recently displaced due to losing their businesses or other forms livelihood.
p. Data are aggregates provided by original data source.
SOURCESColumn1: IDMC 2007.Columns2and3: UNHCR 2007.Columns4–6: SIPRI 2007a.Column7: calculated on the basis of data on arms transfers from SIPRI 2007a.Column8: IISS 2007.Column9: calculated on the basis of data on armed forces from IISS 2007.
TaB
ELLa
26
160 Guinea 19g 31 7 0 0 .. .. 12 121
161 Rwanda .. 49 93 1 0 .. .. 33 635
162 Angola 62g 13 207 9 0 0 (.) 107 216
163 Benin .. 11 (.) 0 0 .. .. 5 111
164 Malawi .. 4 (.) .. .. 0 (.) 5 94
165 Zambia .. 120 (.) 5 15 .. .. 15 93
166 Côte d’Ivoire 750 39 26 0 0 .. .. 17 129
167 Burundi 100 13 397 0 0 .. .. 35 673
168 Congo (Democratic Republic of the) 1,100 208 402 46 13 .. .. 51 106
169 Ethiopia 100–280 97 83 0 0 .. .. 153 71
170 Chad 113 287 36 0 2 .. .. 17 139
171 Central African Republic 212 12 72 0 9 .. .. 3 130
172 Mozambique .. 3 (.) 0 0 .. .. 11 70
173 Mali .. 11 1 0 0 .. .. 7 143
174 Niger .. (.) 1 0 0 .. .. 5 227
175 Guinea-Bissau .. 8 1 .. .. .. .. 9 105
176 Burkina Faso .. 1 (.) 0 0 .. .. 11 275
177 Sierra Leone .. 27 43 0 0 .. .. 11 355
Developing countries .. 7,084 .. .. .. .. .. 13,950 T 90
Least developed countries .. 2,177 .. .. .. .. .. 1,781 T 152
Arab States .. 2,001 .. .. .. .. .. 2,167 T 80
East Asia and the Pacific .. .. .. .. .. .. .. 5,952 T 80
Latin America and the Caribbean .. .. .. .. .. .. .. 1,327 T 99
South Asia .. 2,326 .. .. .. .. .. 2,877 T 113
Sub-Saharan Africa .. 2,227 .. .. .. .. .. 1,102 T 130
Central and Eastern Europe and the CIS .. 168 .. .. .. .. .. 2,050 T ..
OECD .. 2,556 .. .. .. .. .. 4,995 T 69
High-income OECD .. 2,533 .. .. .. .. .. 4,028 69
High human development .. 2,885 .. .. .. 25,830 .. 7,101 52
Medium human development .. 5,389 .. .. .. .. .. 10,143 91
Low human development .. 1,453 .. .. .. .. .. 835 146
High income .. .. .. .. .. .. .. 4,611 74
Middle income .. 3,267 .. .. .. .. .. 9,440 ..
Low income .. 3,741 .. .. .. .. .. 5,413 110
World 23,700 Tp 9,894 Tp 9,894 Tp 22,115 Tp 26,130 Tp 26,742 Tp .. 19,801 T 73
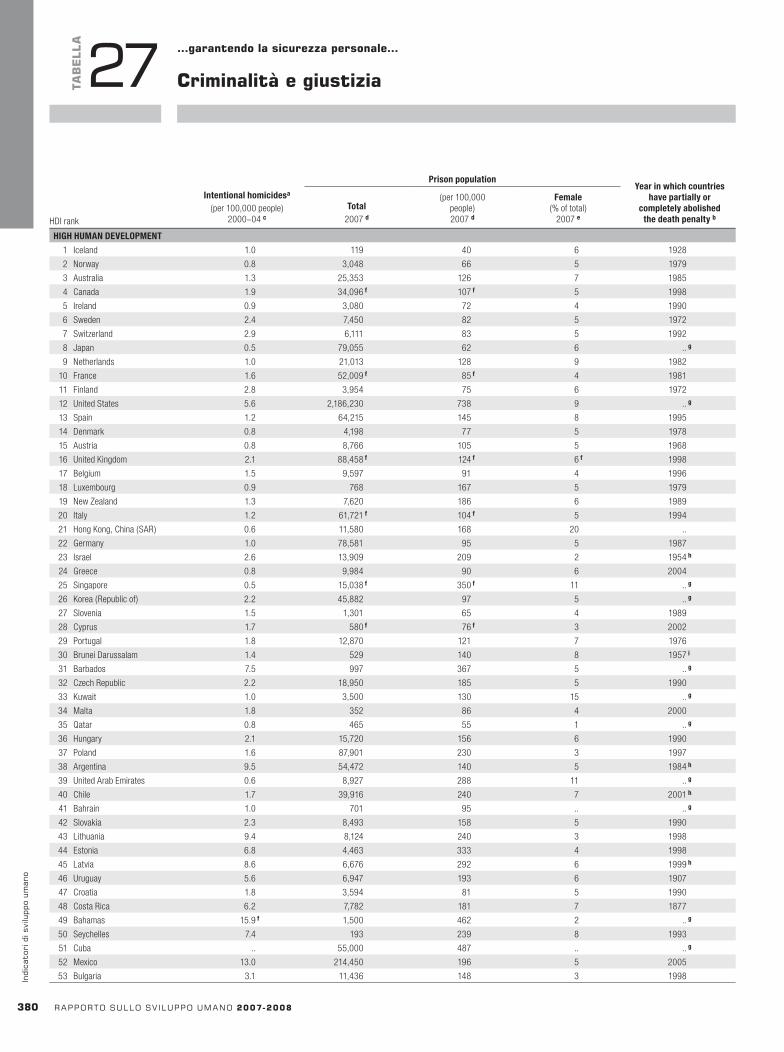
HDI rank
Intentionalhomicidesa
(per 100,000 people)2000–04 c
PrisonpopulationYearinwhichcountries
havepartiallyorcompletelyabolished
thedeathpenaltybTotal
2007 d
(per 100,000 people)2007 d
Female(% of total)
2007 eHDI rank
Intentionalhomicidesa
(per 100,000 people)2000–04 c
PrisonpopulationYearinwhichcountries
havepartiallyorcompletelyabolished
thedeathpenaltybTotal
2007 d
(per 100,000 people)2007 d
Female(% of total)
2007 e
380 rapportosullosv iluppoumano2007-2008
indi
cato
rid
isvi
lupp
oum
ano
TaB
ELLa
27 …garantendolasicurezzapersonale…
Criminalitàegiustizia
HIGHHUMANDEVELOPMENT
1 Iceland 1.0 119 40 6 1928
2 Norway 0.8 3,048 66 5 1979
3 Australia 1.3 25,353 126 7 1985
4 Canada 1.9 34,096f 107f 5 1998
5 Ireland 0.9 3,080 72 4 1990
6 Sweden 2.4 7,450 82 5 1972
7 Switzerland 2.9 6,111 83 5 1992
8 Japan 0.5 79,055 62 6 ..g
9 Netherlands 1.0 21,013 128 9 1982
10 France 1.6 52,009f 85f 4 1981
11 Finland 2.8 3,954 75 6 1972
12 United States 5.6 2,186,230 738 9 ..g
13 Spain 1.2 64,215 145 8 1995
14 Denmark 0.8 4,198 77 5 1978
15 Austria 0.8 8,766 105 5 1968
16 United Kingdom 2.1 88,458f 124f 6f 1998
17 Belgium 1.5 9,597 91 4 1996
18 Luxembourg 0.9 768 167 5 1979
19 New Zealand 1.3 7,620 186 6 1989
20 Italy 1.2 61,721f 104f 5 1994
21 Hong Kong, China (SAR) 0.6 11,580 168 20 ..
22 Germany 1.0 78,581 95 5 1987
23 Israel 2.6 13,909 209 2 1954h
24 Greece 0.8 9,984 90 6 2004
25 Singapore 0.5 15,038f 350f 11 ..g
26 Korea (Republic of) 2.2 45,882 97 5 ..g
27 Slovenia 1.5 1,301 65 4 1989
28 Cyprus 1.7 580f 76f 3 2002
29 Portugal 1.8 12,870 121 7 1976
30 Brunei Darussalam 1.4 529 140 8 1957i
31 Barbados 7.5 997 367 5 ..g
32 Czech Republic 2.2 18,950 185 5 1990
33 Kuwait 1.0 3,500 130 15 ..g
34 Malta 1.8 352 86 4 2000
35 Qatar 0.8 465 55 1 ..g
36 Hungary 2.1 15,720 156 6 1990
37 Poland 1.6 87,901 230 3 1997
38 Argentina 9.5 54,472 140 5 1984h
39 United Arab Emirates 0.6 8,927 288 11 ..g
40 Chile 1.7 39,916 240 7 2001h
41 Bahrain 1.0 701 95 .. ..g
42 Slovakia 2.3 8,493 158 5 1990
43 Lithuania 9.4 8,124 240 3 1998
44 Estonia 6.8 4,463 333 4 1998
45 Latvia 8.6 6,676 292 6 1999h
46 Uruguay 5.6 6,947 193 6 1907
47 Croatia 1.8 3,594 81 5 1990
48 Costa Rica 6.2 7,782 181 7 1877
49 Bahamas 15.9f 1,500 462 2 ..g
50 Seychelles 7.4 193 239 8 1993
51 Cuba .. 55,000 487 .. ..g
52 Mexico 13.0 214,450 196 5 2005
53 Bulgaria 3.1 11,436 148 3 1998
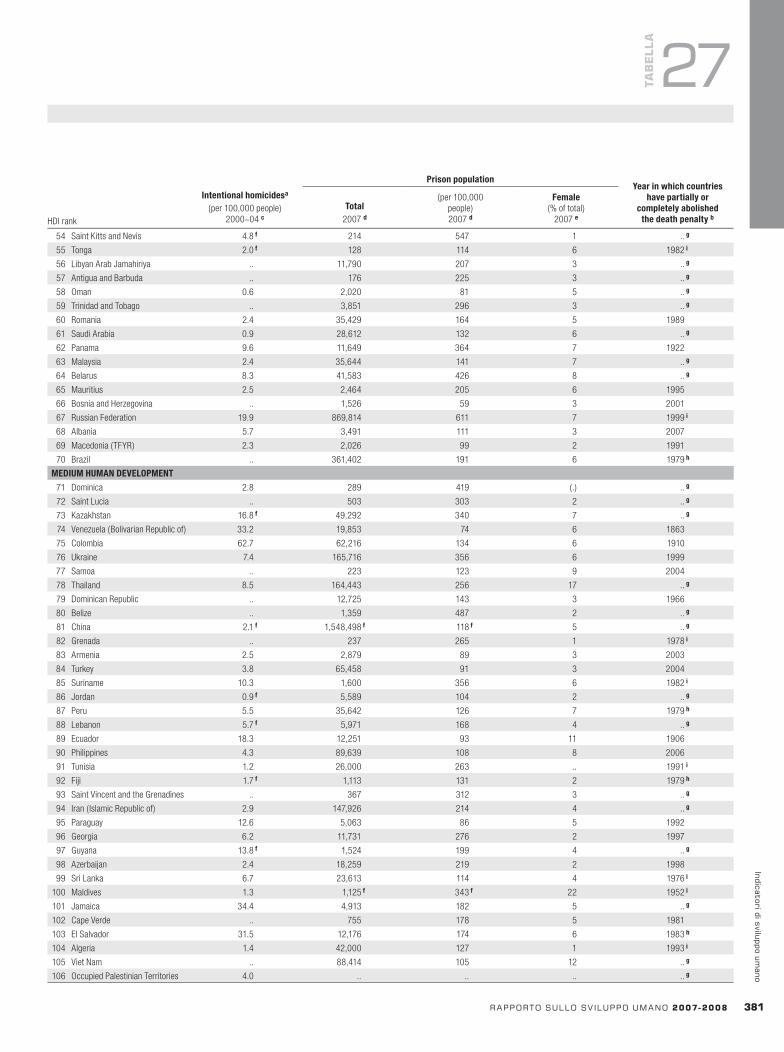
HDI rank
Intentionalhomicidesa
(per 100,000 people)2000–04 c
PrisonpopulationYearinwhichcountries
havepartiallyorcompletelyabolished
thedeathpenaltybTotal
2007 d
(per 100,000 people)2007 d
Female(% of total)
2007 e
rapportosullosv iluppoumano2007-2008 381
indicatoridisviluppoumano
TaB
ELLa
27
54 Saint Kitts and Nevis 4.8f 214 547 1 ..g
55 Tonga 2.0f 128 114 6 1982i
56 Libyan Arab Jamahiriya .. 11,790 207 3 ..g
57 Antigua and Barbuda .. 176 225 3 ..g
58 Oman 0.6 2,020 81 5 ..g
59 Trinidad and Tobago .. 3,851 296 3 ..g
60 Romania 2.4 35,429 164 5 1989
61 Saudi Arabia 0.9 28,612 132 6 ..g
62 Panama 9.6 11,649 364 7 1922
63 Malaysia 2.4 35,644 141 7 ..g
64 Belarus 8.3 41,583 426 8 ..g
65 Mauritius 2.5 2,464 205 6 1995
66 Bosnia and Herzegovina .. 1,526 59 3 2001
67 Russian Federation 19.9 869,814 611 7 1999i
68 Albania 5.7 3,491 111 3 2007
69 Macedonia (TFYR) 2.3 2,026 99 2 1991
70 Brazil .. 361,402 191 6 1979h
MEDIUMHUMANDEVELOPMENT
71 Dominica 2.8 289 419 (.) ..g
72 Saint Lucia .. 503 303 2 ..g
73 Kazakhstan 16.8f 49,292 340 7 ..g
74 Venezuela (Bolivarian Republic of) 33.2 19,853 74 6 1863
75 Colombia 62.7 62,216 134 6 1910
76 Ukraine 7.4 165,716 356 6 1999
77 Samoa .. 223 123 9 2004
78 Thailand 8.5 164,443 256 17 ..g
79 Dominican Republic .. 12,725 143 3 1966
80 Belize .. 1,359 487 2 ..g
81 China 2.1f 1,548,498f 118f 5 ..g
82 Grenada .. 237 265 1 1978i
83 Armenia 2.5 2,879 89 3 2003
84 Turkey 3.8 65,458 91 3 2004
85 Suriname 10.3 1,600 356 6 1982i
86 Jordan 0.9f 5,589 104 2 ..g
87 Peru 5.5 35,642 126 7 1979h
88 Lebanon 5.7f 5,971 168 4 ..g
89 Ecuador 18.3 12,251 93 11 1906
90 Philippines 4.3 89,639 108 8 2006
91 Tunisia 1.2 26,000 263 .. 1991i
92 Fiji 1.7f 1,113 131 2 1979h
93 Saint Vincent and the Grenadines .. 367 312 3 ..g
94 Iran ( Islamic Republic of) 2.9 147,926 214 4 ..g
95 Paraguay 12.6 5,063 86 5 1992
96 Georgia 6.2 11,731 276 2 1997
97 Guyana 13.8f 1,524 199 4 ..g
98 Azerbaijan 2.4 18,259 219 2 1998
99 Sri Lanka 6.7 23,613 114 4 1976i
100 Maldives 1.3 1,125f 343f 22 1952i
101 Jamaica 34.4 4,913 182 5 ..g
102 Cape Verde .. 755 178 5 1981
103 El Salvador 31.5 12,176 174 6 1983h
104 Algeria 1.4 42,000 127 1 1993i
105 Viet Nam .. 88,414 105 12 ..g
106 Occupied Palestinian Territories 4.0 .. .. .. ..g

HDI rank
Intentionalhomicidesa
(per 100,000 people)2000–04 c
PrisonpopulationYearinwhichcountries
havepartiallyorcompletelyabolished
thedeathpenaltybTotal
2007 d
(per 100,000 people)2007 d
Female(% of total)
2007 eHDI rank
Intentionalhomicidesa
(per 100,000 people)2000–04 c
PrisonpopulationYearinwhichcountries
havepartiallyorcompletelyabolished
thedeathpenaltybTotal
2007 d
(per 100,000 people)2007 d
Female(% of total)
2007 e
382 rapportosullosv iluppoumano2007-2008
indi
cato
rid
isvi
lupp
oum
ano
TaB
ELLa
27 Criminalitàegiustizia
107 Indonesia 1.1 99,946 45 5 ..g
108 Syrian Arab Republic 1.1 10,599 58 7 ..g
109 Turkmenistan .. 22,000 489 .. 1999
110 Nicaragua 12.8f 5,610 98 7 1979
111 Moldova 6.7 8,876f 247f 5 1995
112 Egypt 0.4f 61,845 87 4 ..g
113 Uzbekistan .. 48,000 184 .. ..g
114 Mongolia 12.8 6,998 269 4 ..g
115 Honduras .. 11,589 161 3 1956
116 Kyrgyzstan 8.0 15,744 292 5 1998i
117 Bolivia 2.8 7,710 83 7 1997h
118 Guatemala 25.5 7,227 57 5 ..g
119 Gabon .. 2,750j 212j .. ..
120 Vanuatu 0.7f 138 65 4 1980i
121 South Africa 47.5 157,402 335 2 1997
122 Tajikistan 7.6f 10,804 164 4 ..g
123 Sao Tome and Principe 6.2f 155 82 2 1990
124 Botswana 0.5f 6,259 348 5 ..g
125 Namibia 6.3 4,814 267 2 1990
126 Morocco 0.5 54,542 175 2 1993i
127 Equatorial Guinea .. .. .. .. ..g
128 India 3.7f 332,112 30 4 ..g
129 Solomon Islands .. 297 62 1 1966h
130 Lao People’s Democratic Republic .. 4,020 69 11 ..g
131 Cambodia .. 8,160 58 6 1989
132 Myanmar 0.2 60,000 120 18 ..
133 Bhutan .. .. .. .. 2004
134 Comoros .. 200 30 .. ..g
135 Ghana .. 12,736 55 2 1957i
136 Pakistan 0.0 89,370 57 2 ..g
137 Mauritania .. 815 26 3k 1987i
138 Lesotho 50.7f 2,924 156 3 ..g
139 Congo .. 918 38 .. 1982i
140 Bangladesh .. 71,200 50 3 ..g
141 Swaziland 13.6 2,734 249 3 1968i
142 Nepal 3.4 7,135 26 8 1997
143 Madagascar 0.5f 20,294 107 3 1958i
144 Cameroon .. 20,000 125 .. ..g
145 Papua New Guinea 9.1 4,056 69 5 1950i
146 Haiti .. 3,670 43 7 1987
147 Sudan 0.3f 12,000 36 2 ..g
148 Kenya .. 47,036 130 4 1987i
149 Djibouti .. 384 61 .. 1995
150 Timor-Leste .. 320 41 (.) 1999
151 Zimbabwe 8.4 18,033 139 3 ..g
152 Togo .. 3,200 65 2 1960i
153 Yemen 4.0 14,000f 83f ..l ..g
154 Uganda 7.4 26,126 95 3 ..g
155 Gambia .. 450 32 1 1981i
LOWHUMANDEVELOPMENT
156 Senegal .. 5,360 54 4 2004
157 Eritrea .. .. .. .. ..g
158 Nigeria 1.5f 40,444 30 2 ..g
159 Tanzania (United Republic of) 7.5f 43,911 113 3 ..g

HDI rank
Intentionalhomicidesa
(per 100,000 people)2000–04 c
PrisonpopulationYearinwhichcountries
havepartiallyorcompletelyabolished
thedeathpenaltybTotal
2007 d
(per 100,000 people)2007 d
Female(% of total)
2007 e
rapportosullosv iluppoumano2007-2008 383
indicatoridisviluppoumano
NOTESa. Because of differences in the legal definition of
offences, data are not strictly comparable across countries.
b. Data are as of 4 April 2007 and refer to the year of abolition for all crimes (unless otherwise specified).
c. Data were collected during one of the years specified.
d. Data are as of January 2007.e. Data are as of May 2007 unless otherwise
specified.f. Data refer to years or periods other than those
specified in the column heading, differ from the standard definition or refer to only part of a country.
g. Country retaining the death penalty.h. Death penalty abolished for ordinary
crimes only.i. Death penalty abolished in practice if not in law.
No execution since the year reported.j. Data are downloaded directly from http://www.
kcl.ac.uk/depsta/rel/icps/worldbrief/highest_to_lowest_rates.php.
k. In 2005, six of the 435 prisoners in Nouakchott main prison were women.
l. In 2005 Parliamentary Committee on Human Rights reported that 2.7% of prisoners in Sana’a central prisons were women.
SOURCESColumn1: UNODC 2007. Columns2–4: ICPS 2007. Column5: Amnesty International 2007.
TaB
ELLa
27
160 Guinea .. 3,070 37 2 ..g
161 Rwanda 8.0f 67,000f 691f,j 3 ..g
162 Angola .. 6,008 44 3 1992
163 Benin .. 5,834 75 4 1987i
164 Malawi .. 9,656 74 1 1992i
165 Zambia 8.1 14,347 120 3 ..g
166 Côte d’Ivoire 4.1 9,274f 49f 2 2000
167 Burundi .. 7,969 106 3 ..g
168 Congo (Democratic Republic of the) .. 30,000 57 3 ..g
169 Ethiopia .. 65,000 92 .. ..g
170 Chad .. 3,416 35 2 ..g
171 Central African Republic .. 4,168 110 .. 1981i
172 Mozambique .. 10,000 51 6 1990
173 Mali .. 4,407 33 2 1980i
174 Niger .. 5,709 46 3 1976i
175 Guinea-Bissau .. .. .. .. 1993
176 Burkina Faso .. 2,800 23 1 1988i
177 Sierra Leone .. 1,740 32 .. ..g
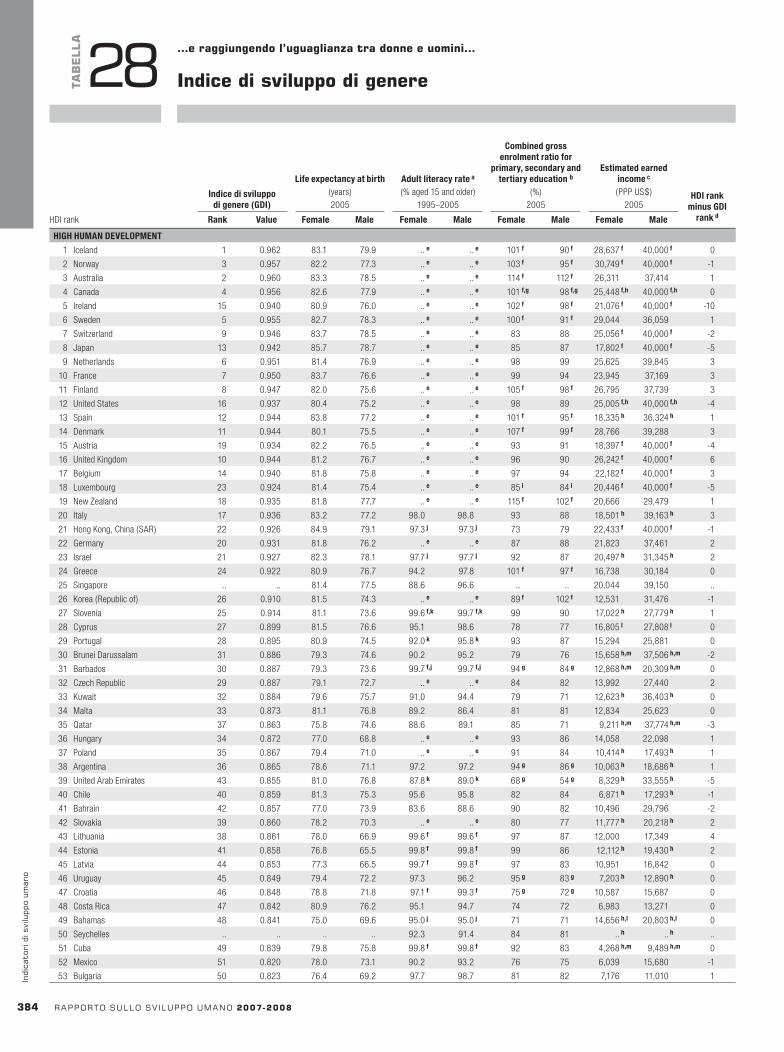
HDI rank
Indicedisviluppodigenere(GDI)
Lifeexpectancyatbirth(years)2005
Adultliteracyratea
(% aged 15 and older)1995–2005
Combinedgrossenrolmentratiofor
primary,secondaryandtertiaryeducationb
(%)2005
Estimatedearnedincomec
(PPP US$)2005
HDIrankminusGDI
rankdRank Value Female Male Female Male Female Male Female MaleHDI rank
Indicedisviluppodigenere(GDI)
Lifeexpectancyatbirth(years)2005
Adultliteracyratea
(% aged 15 and older)1995–2005
Combinedgrossenrolmentratiofor
primary,secondaryandtertiaryeducationb
(%)2005
Estimatedearnedincomec
(PPP US$)2005
HDIrankminusGDI
rankdRank Value Female Male Female Male Female Male Female Male
384 rapportosullosv iluppoumano2007-2008
indi
cato
rid
isvi
lupp
oum
ano
TaB
ELLa
28 …eraggiungendol’uguaglianzatradonneeuomini…
Indicedisviluppodigenere
HIGHHUMANDEVELOPMENT
1 Iceland 1 0.962 83.1 79.9 ..e ..e 101f 90f 28,637f 40,000f 0
2 Norway 3 0.957 82.2 77.3 ..e ..e 103f 95f 30,749f 40,000f -1
3 Australia 2 0.960 83.3 78.5 ..e ..e 114f 112f 26,311 37,414 1
4 Canada 4 0.956 82.6 77.9 ..e ..e 101f,g 98f,g 25,448f,h 40,000f,h 0
5 Ireland 15 0.940 80.9 76.0 ..e ..e 102f 98f 21,076f 40,000f -10
6 Sweden 5 0.955 82.7 78.3 ..e ..e 100f 91f 29,044 36,059 1
7 Switzerland 9 0.946 83.7 78.5 ..e ..e 83 88 25,056f 40,000f -2
8 Japan 13 0.942 85.7 78.7 ..e ..e 85 87 17,802f 40,000f -5
9 Netherlands 6 0.951 81.4 76.9 ..e ..e 98 99 25,625 39,845 3
10 France 7 0.950 83.7 76.6 ..e ..e 99 94 23,945 37,169 3
11 Finland 8 0.947 82.0 75.6 ..e ..e 105f 98f 26,795 37,739 3
12 United States 16 0.937 80.4 75.2 ..e ..e 98 89 25,005f,h 40,000f,h -4
13 Spain 12 0.944 83.8 77.2 ..e ..e 101f 95f 18,335h 36,324h 1
14 Denmark 11 0.944 80.1 75.5 ..e ..e 107f 99f 28,766 39,288 3
15 Austria 19 0.934 82.2 76.5 ..e ..e 93 91 18,397f 40,000f -4
16 United Kingdom 10 0.944 81.2 76.7 ..e ..e 96 90 26,242f 40,000f 6
17 Belgium 14 0.940 81.8 75.8 ..e ..e 97 94 22,182f 40,000f 3
18 Luxembourg 23 0.924 81.4 75.4 ..e ..e 85i 84i 20,446f 40,000f -5
19 New Zealand 18 0.935 81.8 77.7 ..e ..e 115f 102f 20,666 29,479 1
20 Italy 17 0.936 83.2 77.2 98.0 98.8 93 88 18,501h 39,163h 3
21 Hong Kong, China (SAR) 22 0.926 84.9 79.1 97.3j 97.3j 73 79 22,433f 40,000f -1
22 Germany 20 0.931 81.8 76.2 ..e ..e 87 88 21,823 37,461 2
23 Israel 21 0.927 82.3 78.1 97.7j 97.7j 92 87 20,497h 31,345h 2
24 Greece 24 0.922 80.9 76.7 94.2 97.8 101f 97f 16,738 30,184 0
25 Singapore .. .. 81.4 77.5 88.6 96.6 .. .. 20,044 39,150 ..
26 Korea (Republic of) 26 0.910 81.5 74.3 ..e ..e 89f 102f 12,531 31,476 -1
27 Slovenia 25 0.914 81.1 73.6 99.6f,k 99.7f,k 99 90 17,022h 27,779h 1
28 Cyprus 27 0.899 81.5 76.6 95.1 98.6 78 77 16,805l 27,808l 0
29 Portugal 28 0.895 80.9 74.5 92.0k 95.8k 93 87 15,294 25,881 0
30 Brunei Darussalam 31 0.886 79.3 74.6 90.2 95.2 79 76 15,658h,m 37,506h,m -2
31 Barbados 30 0.887 79.3 73.6 99.7f,j 99.7f,j 94g 84g 12,868h,m 20,309h,m 0
32 Czech Republic 29 0.887 79.1 72.7 ..e ..e 84 82 13,992 27,440 2
33 Kuwait 32 0.884 79.6 75.7 91.0 94.4 79 71 12,623h 36,403h 0
34 Malta 33 0.873 81.1 76.8 89.2 86.4 81 81 12,834 25,623 0
35 Qatar 37 0.863 75.8 74.6 88.6 89.1 85 71 9,211h,m 37,774h,m -3
36 Hungary 34 0.872 77.0 68.8 ..e ..e 93 86 14,058 22,098 1
37 Poland 35 0.867 79.4 71.0 ..e ..e 91 84 10,414h 17,493h 1
38 Argentina 36 0.865 78.6 71.1 97.2 97.2 94g 86g 10,063h 18,686h 1
39 United Arab Emirates 43 0.855 81.0 76.8 87.8k 89.0k 68g 54g 8,329h 33,555h -5
40 Chile 40 0.859 81.3 75.3 95.6 95.8 82 84 6,871h 17,293h -1
41 Bahrain 42 0.857 77.0 73.9 83.6 88.6 90 82 10,496 29,796 -2
42 Slovakia 39 0.860 78.2 70.3 ..e ..e 80 77 11,777h 20,218h 2
43 Lithuania 38 0.861 78.0 66.9 99.6f 99.6f 97 87 12,000 17,349 4
44 Estonia 41 0.858 76.8 65.5 99.8f 99.8f 99 86 12,112h 19,430h 2
45 Latvia 44 0.853 77.3 66.5 99.7f 99.8f 97 83 10,951 16,842 0
46 Uruguay 45 0.849 79.4 72.2 97.3 96.2 95g 83g 7,203h 12,890h 0
47 Croatia 46 0.848 78.8 71.8 97.1f 99.3f 75g 72g 10,587 15,687 0
48 Costa Rica 47 0.842 80.9 76.2 95.1 94.7 74 72 6,983 13,271 0
49 Bahamas 48 0.841 75.0 69.6 95.0j 95.0j 71 71 14,656h,l 20,803h,l 0
50 Seychelles .. .. .. .. 92.3 91.4 84 81 ..h ..h ..
51 Cuba 49 0.839 79.8 75.8 99.8f 99.8f 92 83 4,268h,m 9,489h,m 0
52 Mexico 51 0.820 78.0 73.1 90.2 93.2 76 75 6,039 15,680 -1
53 Bulgaria 50 0.823 76.4 69.2 97.7 98.7 81 82 7,176 11,010 1
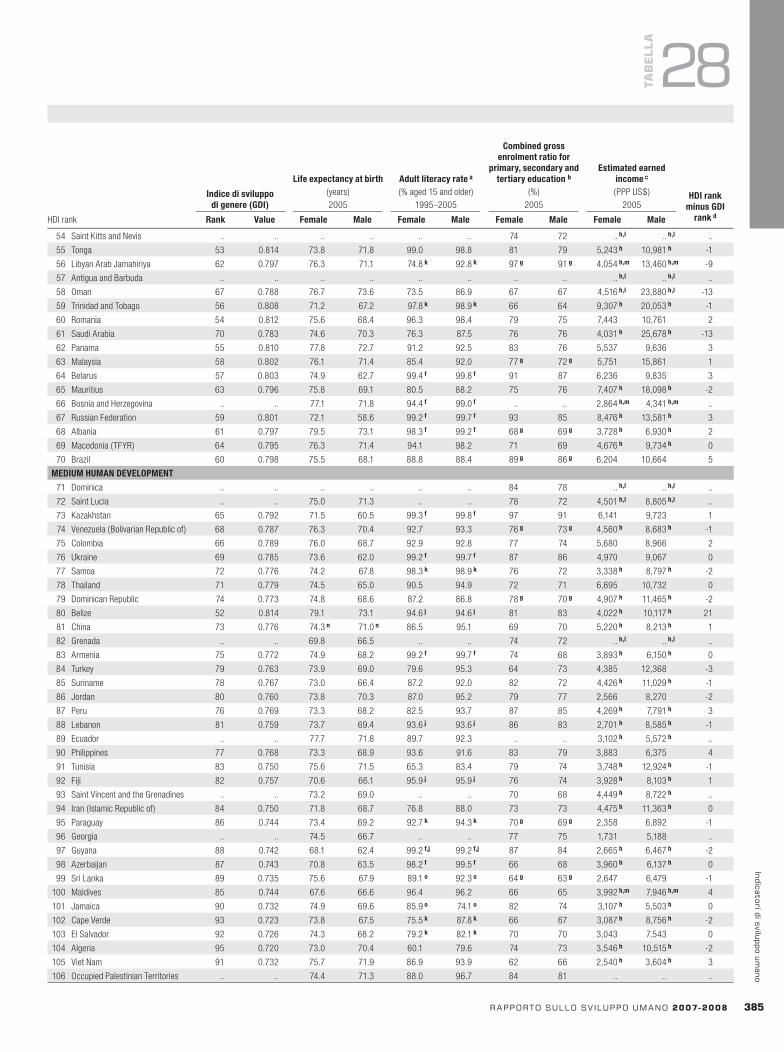
HDI rank
Indicedisviluppodigenere(GDI)
Lifeexpectancyatbirth(years)2005
Adultliteracyratea
(% aged 15 and older)1995–2005
Combinedgrossenrolmentratiofor
primary,secondaryandtertiaryeducationb
(%)2005
Estimatedearnedincomec
(PPP US$)2005
HDIrankminusGDI
rankdRank Value Female Male Female Male Female Male Female Male
rapportosullosv iluppoumano2007-2008 38�
indicatoridisviluppoumano
TaB
ELLa
28
54 Saint Kitts and Nevis .. .. .. .. .. .. 74 72 ..h,l ..h,l ..
55 Tonga 53 0.814 73.8 71.8 99.0 98.8 81 79 5,243h 10,981h -1
56 Libyan Arab Jamahiriya 62 0.797 76.3 71.1 74.8k 92.8k 97g 91g 4,054h,m 13,460h,m -9
57 Antigua and Barbuda .. .. .. .. .. .. .. .. ..h,l ..h,l ..
58 Oman 67 0.788 76.7 73.6 73.5 86.9 67 67 4,516h,l 23,880h,l -13
59 Trinidad and Tobago 56 0.808 71.2 67.2 97.8k 98.9k 66 64 9,307h 20,053h -1
60 Romania 54 0.812 75.6 68.4 96.3 98.4 79 75 7,443 10,761 2
61 Saudi Arabia 70 0.783 74.6 70.3 76.3 87.5 76 76 4,031h 25,678h -13
62 Panama 55 0.810 77.8 72.7 91.2 92.5 83 76 5,537 9,636 3
63 Malaysia 58 0.802 76.1 71.4 85.4 92.0 77g 72g 5,751 15,861 1
64 Belarus 57 0.803 74.9 62.7 99.4f 99.8f 91 87 6,236 9,835 3
65 Mauritius 63 0.796 75.8 69.1 80.5 88.2 75 76 7,407h 18,098h -2
66 Bosnia and Herzegovina .. .. 77.1 71.8 94.4f 99.0f .. .. 2,864h,m 4,341h,m ..
67 Russian Federation 59 0.801 72.1 58.6 99.2f 99.7f 93 85 8,476h 13,581h 3
68 Albania 61 0.797 79.5 73.1 98.3f 99.2f 68g 69g 3,728h 6,930h 2
69 Macedonia (TFYR) 64 0.795 76.3 71.4 94.1 98.2 71 69 4,676h 9,734h 0
70 Brazil 60 0.798 75.5 68.1 88.8 88.4 89g 86g 6,204 10,664 5
MEDIUMHUMANDEVELOPMENT
71 Dominica .. .. .. .. .. .. 84 78 ..h,l ..h,l ..
72 Saint Lucia .. .. 75.0 71.3 .. .. 78 72 4,501h,l 8,805h,l ..
73 Kazakhstan 65 0.792 71.5 60.5 99.3f 99.8f 97 91 6,141 9,723 1
74 Venezuela (Bolivarian Republic of) 68 0.787 76.3 70.4 92.7 93.3 76g 73g 4,560h 8,683h -1
75 Colombia 66 0.789 76.0 68.7 92.9 92.8 77 74 5,680 8,966 2
76 Ukraine 69 0.785 73.6 62.0 99.2f 99.7f 87 86 4,970 9,067 0
77 Samoa 72 0.776 74.2 67.8 98.3k 98.9k 76 72 3,338h 8,797h -2
78 Thailand 71 0.779 74.5 65.0 90.5 94.9 72 71 6,695 10,732 0
79 Dominican Republic 74 0.773 74.8 68.6 87.2 86.8 78g 70g 4,907h 11,465h -2
80 Belize 52 0.814 79.1 73.1 94.6j 94.6j 81 83 4,022h 10,117h 21
81 China 73 0.776 74.3n 71.0n 86.5 95.1 69 70 5,220h 8,213h 1
82 Grenada .. .. 69.8 66.5 .. .. 74 72 ..h,l ..h,l ..
83 Armenia 75 0.772 74.9 68.2 99.2f 99.7f 74 68 3,893h 6,150h 0
84 Turkey 79 0.763 73.9 69.0 79.6 95.3 64 73 4,385 12,368 -3
85 Suriname 78 0.767 73.0 66.4 87.2 92.0 82 72 4,426h 11,029h -1
86 Jordan 80 0.760 73.8 70.3 87.0 95.2 79 77 2,566 8,270 -2
87 Peru 76 0.769 73.3 68.2 82.5 93.7 87 85 4,269h 7,791h 3
88 Lebanon 81 0.759 73.7 69.4 93.6j 93.6j 86 83 2,701h 8,585h -1
89 Ecuador .. .. 77.7 71.8 89.7 92.3 .. .. 3,102h 5,572h ..
90 Philippines 77 0.768 73.3 68.9 93.6 91.6 83 79 3,883 6,375 4
91 Tunisia 83 0.750 75.6 71.5 65.3 83.4 79 74 3,748h 12,924h -1
92 Fiji 82 0.757 70.6 66.1 95.9j 95.9j 76 74 3,928h 8,103h 1
93 Saint Vincent and the Grenadines .. .. 73.2 69.0 .. .. 70 68 4,449h 8,722h ..
94 Iran ( Islamic Republic of) 84 0.750 71.8 68.7 76.8 88.0 73 73 4,475h 11,363h 0
95 Paraguay 86 0.744 73.4 69.2 92.7k 94.3k 70g 69g 2,358 6,892 -1
96 Georgia .. .. 74.5 66.7 .. .. 77 75 1,731 5,188 ..
97 Guyana 88 0.742 68.1 62.4 99.2f,j 99.2f,j 87 84 2,665h 6,467h -2
98 Azerbaijan 87 0.743 70.8 63.5 98.2f 99.5f 66 68 3,960h 6,137h 0
99 Sri Lanka 89 0.735 75.6 67.9 89.1o 92.3o 64g 63g 2,647 6,479 -1
100 Maldives 85 0.744 67.6 66.6 96.4 96.2 66 65 3,992h,m 7,946h,m 4
101 Jamaica 90 0.732 74.9 69.6 85.9o 74.1o 82 74 3,107h 5,503h 0
102 Cape Verde 93 0.723 73.8 67.5 75.5k 87.8k 66 67 3,087h 8,756h -2
103 El Salvador 92 0.726 74.3 68.2 79.2k 82.1k 70 70 3,043 7,543 0
104 Algeria 95 0.720 73.0 70.4 60.1 79.6 74 73 3,546h 10,515h -2
105 Viet Nam 91 0.732 75.7 71.9 86.9 93.9 62 66 2,540h 3,604h 3
106 Occupied Palestinian Territories .. .. 74.4 71.3 88.0 96.7 84 81 .. .. ..

HDI rank
Indicedisviluppodigenere(GDI)
Lifeexpectancyatbirth(years)2005
Adultliteracyratea
(% aged 15 and older)1995–2005
Combinedgrossenrolmentratiofor
primary,secondaryandtertiaryeducationb
(%)2005
Estimatedearnedincomec
(PPP US$)2005
HDIrankminusGDI
rankdRank Value Female Male Female Male Female Male Female MaleHDI rank
Indicedisviluppodigenere(GDI)
Lifeexpectancyatbirth(years)2005
Adultliteracyratea
(% aged 15 and older)1995–2005
Combinedgrossenrolmentratiofor
primary,secondaryandtertiaryeducationb
(%)2005
Estimatedearnedincomec
(PPP US$)2005
HDIrankminusGDI
rankdRank Value Female Male Female Male Female Male Female Male
38� rapportosullosv iluppoumano2007-2008
indi
cato
rid
isvi
lupp
oum
ano
TaB
ELLa
28 Indicedisviluppodigenere
107 Indonesia 94 0.721 71.6 67.8 86.8 94.0 67 70 2,410h 5,280h 1
108 Syrian Arab Republic 96 0.710 75.5 71.8 73.6 87.8 63 67 1,907h 5,684h 0
109 Turkmenistan .. .. 67.0 58.5 98.3f 99.3f .. .. 6,108h,m 9,596h,m ..
110 Nicaragua 99 0.696 75.0 69.0 76.6 76.8 72 70 1,773h 5,577h -2
111 Moldova 97 0.704 72.0 64.7 98.6f,k 99.6f,k 73 67 1,634h 2,608h 1
112 Egypt .. .. 73.0 68.5 59.4 83.0 .. .. 1,635 7,024 ..
113 Uzbekistan 98 0.699 70.0 63.6 99.6f,j 99.6f,j 72g 75g 1,547h 2,585h 1
114 Mongolia 100 0.695 69.2 62.8 97.5 98.0 83 72 1,413h 2,799h 0
115 Honduras 101 0.694 73.1 65.8 80.2 79.8 74 68 2,160h 4,680h 0
116 Kyrgyzstan 102 0.692 69.6 61.7 98.1f 99.3f 80 76 1,414h 2,455h 0
117 Bolivia 103 0.691 66.9 62.6 80.7 93.1 84g 90g 2,059h 3,584h 0
118 Guatemala 104 0.675 73.2 66.2 63.3 75.4 64 70 2,267h 6,990h 0
119 Gabon 105 0.670 56.9 55.6 79.7k 88.5k 68g 72g 5,049h 8,876h 0
120 Vanuatu .. .. 71.3 67.5 .. .. 61 66 2,601h 3,830h ..
121 South Africa 107 0.667 52.0 49.5 80.9 84.1 77g 77g 6,927h 15,446h -1
122 Tajikistan 106 0.669 69.0 63.8 99.2f 99.7f 64 77 992h 1,725h 1
123 Sao Tome and Principe 110 0.637 66.7 63.0 77.9 92.2 65 65 1,022h 3,357h -2
124 Botswana 109 0.639 48.4 47.6 81.8 80.4 70 69 5,913 19,094 0
125 Namibia 108 0.645 52.2 50.9 83.5 86.8 66 63 5,527h 9,679h 2
126 Morocco 112 0.621 72.7 68.3 39.6 65.7 55 62 1,846h 7,297h -1
127 Equatorial Guinea 111 0.631 51.6 49.1 80.5 93.4 52g 64g 4,635h,l 10,814h,l 1
128 India 113 0.600 65.3 62.3 47.8o 73.4o 60 68 1,620h 5,194h 0
129 Solomon Islands .. .. 63.8 62.2 .. .. 46 50 1,345h 2,672h ..
130 Lao People’s Democratic Republic 115 0.593 64.5 61.9 60.9 77.0 56 67 1,385h 2,692h -1
131 Cambodia 114 0.594 60.6 55.2 64.1 84.7 56 64 2,332h 3,149h 1
132 Myanmar .. .. 64.2 57.6 86.4 93.9 51 48 .. .. ..
133 Bhutan .. .. 66.5 63.1 .. .. .. .. 2,141h,m 4,463h,m ..
134 Comoros 116 0.554 66.3 62.0 63.9j 63.9j 42 50 1,337h 2,643h 0
135 Ghana 117 0.549 59.5 58.7 49.8 66.4 48 53 2,056h 2,893h 0
136 Pakistan 125 0.525 64.8 64.3 35.4 64.1 34 45 1,059h 3,607h -7
137 Mauritania 118 0.543 65.0 61.5 43.4 59.5 45 47 1,489h 2,996h 1
138 Lesotho 119 0.541 42.9 42.1 90.3 73.7 67 65 2,340h 4,480h 1
139 Congo 120 0.540 55.2 52.8 79.0k 90.5k 48 54 841h 1,691h 1
140 Bangladesh 121 0.539 64.0 62.3 40.8 53.9 56g 56g 1,282h 2,792h 1
141 Swaziland 123 0.529 41.4 40.4 78.3 80.9 58 62 2,187 7,659 0
142 Nepal 128 0.520 62.9 62.1 34.9 62.7 54 62 1,038h 2,072h -4
143 Madagascar 122 0.530 60.1 56.7 65.3 76.5 58 61 758h 1,090h 3
144 Cameroon 126 0.524 50.2 49.4 59.8 77.0 57 68 1,519h 3,086h 0
145 Papua New Guinea 124 0.529 60.1 54.3 50.9 63.4 38g 43g 2,140h 2,960h 3
146 Haiti .. .. 61.3 57.7 56.5j 56.5j .. .. 1,146h 2,195h ..
147 Sudan 131 0.502 58.9 56.0 51.8o 71.1o 35 39 832h 3,317h -3
148 Kenya 127 0.521 53.1 51.1 70.2 77.7 59 62 1,126 1,354 2
149 Djibouti 129 0.507 55.2 52.6 79.9j 79.9j 22 29 1,422h 2,935h 1
150 Timor-Leste .. .. 60.5 58.9 .. .. 71 73 ..h ..h ..
151 Zimbabwe 130 0.505 40.2 41.4 86.2k 92.7k 51g 54g 1,499h 2,585h 1
152 Togo 134 0.494 59.6 56.0 38.5 68.7 46 64 907h 2,119h -2
153 Yemen 136 0.472 63.1 60.0 34.7k 73.1k 43 67 424h 1,422h -3
154 Uganda 132 0.501 50.2 49.1 57.7 76.8 62 64 1,199h 1,708h 2
155 Gambia 133 0.496 59.9 57.7 49.9j 49.9j 49g 51g 1,327h 2,525h 2
LOWHUMANDEVELOPMENT
156 Senegal 135 0.492 64.4 60.4 29.2 51.1 37 42 1,256h 2,346h 1
157 Eritrea 137 0.469 59.0 54.0 71.5j 71.5j 29 41 689 1,544 0
158 Nigeria 139 0.456 47.1 46.0 60.1k 78.2k 51 61 652h 1,592h -1
159 Tanzania (United Republic of) 138 0.464 52.0 50.0 62.2 77.5 49 52 627h 863h 1

HDI rank
Indicedisviluppodigenere(GDI)
Lifeexpectancyatbirth(years)2005
Adultliteracyratea
(% aged 15 and older)1995–2005
Combinedgrossenrolmentratiofor
primary,secondaryandtertiaryeducationb
(%)2005
Estimatedearnedincomec
(PPP US$)2005
HDIrankminusGDI
rankdRank Value Female Male Female Male Female Male Female Male
rapportosullosv iluppoumano2007-2008 387
indicatoridisviluppoumano
1 Iceland 2 Australia 3 Norway 4 Canada 5 Sweden 6 Netherlands 7 France 8 Finland 9 Switzerland 10 United Kingdom 11 Denmark 12 Spain 13 Japan 14 Belgium 15 Ireland 16 United States 17 Italy 18 New Zealand 19 Austria 20 Germany 21 Israel 22 Hong Kong, China (SAR) 23 Luxembourg 24 Greece 25 Slovenia 26 Korea (Republic of) 27 Cyprus
28 Portugal 29 Czech Republic 30 Barbados 31 Brunei Darussalam 32 Kuwait 33 Malta 34 Hungary 35 Poland 36 Argentina 37 Qatar 38 Lithuania 39 Slovakia 40 Chile 41 Estonia 42 Bahrain 43 United Arab Emirates 44 Latvia 45 Uruguay 46 Croatia 47 Costa Rica 48 Bahamas 49 Cuba 50 Bulgaria 51 Mexico 52 Belize 53 Tonga 54 Romania
55 Panama 56 Trinidad and Tobago 57 Belarus 58 Malaysia 59 Russian Federation 60 Brazil 61 Albania 62 Libyan Arab Jamahiriya 63 Mauritius 64 Macedonia (TFYR) 65 Kazakhstan 66 Colombia 67 Oman 68 Venezuela (Bolivarian
Republic of) 69 Ukraine 70 Saudi Arabia 71 Thailand 72 Samoa 73 China 74 Dominican Republic 75 Armenia 76 Peru 77 Philippines 78 Suriname 79 Turkey 80 Jordan
81 Lebanon 82 Fiji 83 Tunisia 84 Iran (Islamic Republic of) 85 Maldives 86 Paraguay 87 Azerbaijan 88 Guyana 89 Sri Lanka 90 Jamaica 91 Viet Nam 92 El Salvador 93 Cape Verde 94 Indonesia 95 Algeria 96 Syrian Arab Republic 97 Moldova 98 Uzbekistan 99 Nicaragua 100 Mongolia 101 Honduras 102 Kyrgyzstan 103 Bolivia 104 Guatemala 105 Gabon 106 Tajikistan 107 South Africa
108 Namibia 109 Botswana 110 Sao Tome and Principe 111 Equatorial Guinea 112 Morocco 113 India 114 Cambodia 115 Lao People’s Democratic
Republic 116 Comoros 117 Ghana 118 Mauritania 119 Lesotho 120 Congo 121 Bangladesh 122 Madagascar 123 Swaziland 124 Papua New Guinea 125 Pakistan 126 Cameroon 127 Kenya 128 Nepal 129 Djibouti 130 Zimbabwe 131 Sudan 132 Uganda 133 Gambia
134 Togo 135 Senegal 136 Yemen 137 Eritrea 138 Tanzania
(United Republic of) 139 Nigeria 140 Rwanda 141 Guinea 142 Angola 143 Malawi 144 Zambia 145 Benin 146 Côte d’Ivoire 147 Burundi 148 Congo (Democratic
Republic of the) 149 Ethiopia 150 Mozambique 151 Mali 152 Chad 153 Central African Republic 154 Burkina Faso 155 Niger 156 Guinea-Bissau 157 Sierra Leone
GDI ranks for 157 countries and areas
TaB
ELLa
28
NOTESa. Data refer to national literacy estimates from
censuses or surveys conducted between 1995 and 2005, unless otherwise specified. Due to differences in methodology and timeliness of underlying data, comparisons across countries and over time should be made with caution. For more details, see http://www.uis.unesco.org/.
b. Data for some countries may refer to national or UNESCO Institute for Statistics estimates. For details, see http://www.uis.unesco.org/.
c. Because of the lack of gender-disaggregated income data, female and male earned income are crudely estimated on the basis of data on the ratio of the female nonagricultural wage to the male nonagricultural wage, the female and male shares of the economically active population, the total female and male population and GDP per capita in PPP US$ (see Technical note 1). The wage ratios used in this calculation are based on data for the most recent year available between 1996 and 2005.
d. The HDI ranks used in this calculation are recalculated for the 157 countries with a GDI value. A positive figure indicates that the GDI rank is higher than the HDI rank, a negative the opposite.
e. For the purposes of calculating the GDI, a value of 99.0 % was applied.
f. For the purpose of calculating the GDI, the female and male values appearing in this table were scaled downward to reflect the maximum values for adult literacy (99%), gross enrolment ratios (100%), and GDP per capita ($40,000). For more details, see Technical note 1.
g. Data refer to an earlier year than that specified.h. No wage data are available. For the purposes of
calculating the estimated female and male earned income, a value of 0.75 was used for the ratio of the female nonagricultural wage to the male nonagricultural wage.
i. Statec. 2006. j. In the absence of recent data, estimates from
UNESCO Institute for Statistics 2003, based on
outdated census or survey information were used, and should be interpreted with caution.
k. UNESCO Institute for Statistics estimates based on its Global age-specific literacy projections model.
l. Data from earlier years were adjusted to reflect their values in 2005 prices.
m. Heston, Alan, Robert Summers and Bettina Aten. 2006. Data may differ from the standard definition.
n. For statistical purposes, the data for China do not include Hong Kong and Macao, SARs of China.
o. Data refer to years or periods other than those specified in the column heading, differ from the standard definition or refer to only part of a country.
SOURCESColumn1: determined on the basis of the GDI values in column 2.Column2: calculated on the basis of data in columns 3–10; see Technical note 1 for details.Columns3and4: UN 2007e.Columns5and6: UNESCO Institute for Statistics 2007a. Columns7and8: UNESCO Institute for Statistics 2007c. Columns9and10: calculated on the basis of data on GDP per capita (PPP US$) and population data from World Bank 2007b unless otherwise specified; data on wages from ILO 2007b; data on the economically active population from ILO 2005. Column11: calculated on the basis of recalculated HDI ranks and GDI ranks in column 1.
160 Guinea 141 0.446 56.4 53.2 18.1 42.6 38 52 1,876h 2,734h -1
161 Rwanda 140 0.450 46.7 43.6 59.8 71.4 51 51 1,031h 1,392h 1
162 Angola 142 0.439 43.3 40.1 54.2 82.9 24g 28g 1,787h 2,898h 0
163 Benin 145 0.422 56.5 54.1 23.3 47.9 42 59 732h 1,543h -2
164 Malawi 143 0.432 46.7 46.0 54.0 74.9 62 64 565h 771h 1
165 Zambia 144 0.425 40.6 40.3 59.8 76.3 58 63 725h 1,319h 1
166 Côte d’Ivoire 146 0.413 48.3 46.5 38.6 60.8 32g 47g 795h 2,472h 0
167 Burundi 147 0.409 49.8 47.1 52.2 67.3 34 42 611h 791h 0
168 Congo (Democratic Republic of the) 148 0.398 47.1 44.4 54.1 80.9 28g 39g 488h 944h 0
169 Ethiopia 149 0.393 53.1 50.5 22.8 50.0 36 48 796h 1,316h 0
170 Chad 152 0.370 51.8 49.0 12.8 40.8 28 47 1,126h 1,735h -2
171 Central African Republic 153 0.368 45.0 42.3 33.5 64.8 23g 36g 933h 1,530h -2
172 Mozambique 150 0.373 43.6 42.0 25.0 54.8 48 58 1,115h 1,378h 2
173 Mali 151 0.371 55.3 50.8 15.9 32.7 31 42 833h 1,234h 2
174 Niger 155 0.355 54.9 56.7 15.1 42.9 19 26 561h 991h -1
175 Guinea-Bissau 156 0.355 47.5 44.2 60.0 60.0j 29g 45g 558h 1,103h -1
176 Burkina Faso 154 0.364 52.9 49.8 16.6 31.4 25 33 966h 1,458h 2
177 Sierra Leone 157 0.320 43.4 40.2 24.2 46.7 38g 52g 507h 1,114h 0
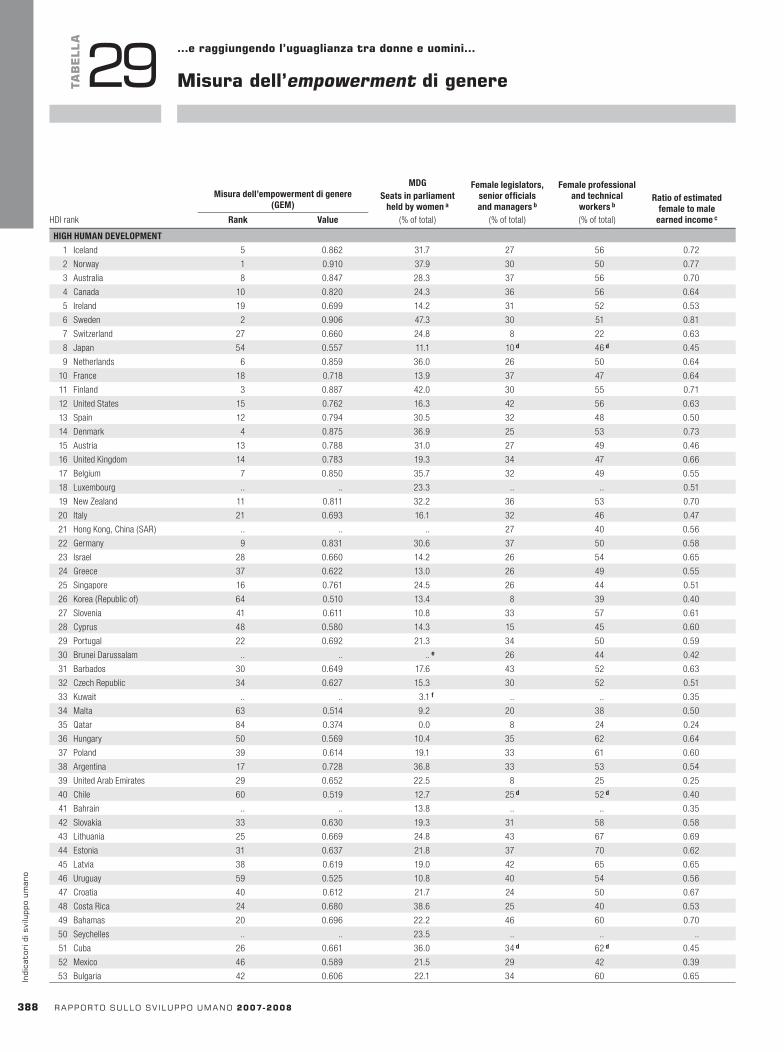
HDI rank
Misuradell’empowermentdigenere(GEM)
MDGSeatsinparliament
heldbywomena
(% of total)
Femalelegislators,seniorofficialsandmanagersb
(% of total)
Femaleprofessionalandtechnical
workersb
(% of total)
Ratioofestimatedfemaletomale
earnedincomecRank ValueHDI rank
Misuradell’empowermentdigenere(GEM)
MDGSeatsinparliament
heldbywomena
(% of total)
Femalelegislators,seniorofficialsandmanagersb
(% of total)
Femaleprofessionalandtechnical
workersb
(% of total)
Ratioofestimatedfemaletomale
earnedincomecRank Value
388 rapportosullosv iluppoumano2007-2008
indi
cato
rid
isvi
lupp
oum
ano
HIGHHUMANDEVELOPMENT
1 Iceland 5 0.862 31.7 27 56 0.72
2 Norway 1 0.910 37.9 30 50 0.77
3 Australia 8 0.847 28.3 37 56 0.70
4 Canada 10 0.820 24.3 36 56 0.64
5 Ireland 19 0.699 14.2 31 52 0.53
6 Sweden 2 0.906 47.3 30 51 0.81
7 Switzerland 27 0.660 24.8 8 22 0.63
8 Japan 54 0.557 11.1 10d 46d 0.45
9 Netherlands 6 0.859 36.0 26 50 0.64
10 France 18 0.718 13.9 37 47 0.64
11 Finland 3 0.887 42.0 30 55 0.71
12 United States 15 0.762 16.3 42 56 0.63
13 Spain 12 0.794 30.5 32 48 0.50
14 Denmark 4 0.875 36.9 25 53 0.73
15 Austria 13 0.788 31.0 27 49 0.46
16 United Kingdom 14 0.783 19.3 34 47 0.66
17 Belgium 7 0.850 35.7 32 49 0.55
18 Luxembourg .. .. 23.3 .. .. 0.51
19 New Zealand 11 0.811 32.2 36 53 0.70
20 Italy 21 0.693 16.1 32 46 0.47
21 Hong Kong, China (SAR) .. .. .. 27 40 0.56
22 Germany 9 0.831 30.6 37 50 0.58
23 Israel 28 0.660 14.2 26 54 0.65
24 Greece 37 0.622 13.0 26 49 0.55
25 Singapore 16 0.761 24.5 26 44 0.51
26 Korea (Republic of) 64 0.510 13.4 8 39 0.40
27 Slovenia 41 0.611 10.8 33 57 0.61
28 Cyprus 48 0.580 14.3 15 45 0.60
29 Portugal 22 0.692 21.3 34 50 0.59
30 Brunei Darussalam .. .. ..e 26 44 0.42
31 Barbados 30 0.649 17.6 43 52 0.63
32 Czech Republic 34 0.627 15.3 30 52 0.51
33 Kuwait .. .. 3.1f .. .. 0.35
34 Malta 63 0.514 9.2 20 38 0.50
35 Qatar 84 0.374 0.0 8 24 0.24
36 Hungary 50 0.569 10.4 35 62 0.64
37 Poland 39 0.614 19.1 33 61 0.60
38 Argentina 17 0.728 36.8 33 53 0.54
39 United Arab Emirates 29 0.652 22.5 8 25 0.25
40 Chile 60 0.519 12.7 25d 52d 0.40
41 Bahrain .. .. 13.8 .. .. 0.35
42 Slovakia 33 0.630 19.3 31 58 0.58
43 Lithuania 25 0.669 24.8 43 67 0.69
44 Estonia 31 0.637 21.8 37 70 0.62
45 Latvia 38 0.619 19.0 42 65 0.65
46 Uruguay 59 0.525 10.8 40 54 0.56
47 Croatia 40 0.612 21.7 24 50 0.67
48 Costa Rica 24 0.680 38.6 25 40 0.53
49 Bahamas 20 0.696 22.2 46 60 0.70
50 Seychelles .. .. 23.5 .. .. ..
51 Cuba 26 0.661 36.0 34d 62d 0.45
52 Mexico 46 0.589 21.5 29 42 0.39
53 Bulgaria 42 0.606 22.1 34 60 0.65
TaB
ELLa
29 …eraggiungendol’uguaglianzatradonneeuomini…
Misuradell’empowermentdigenere
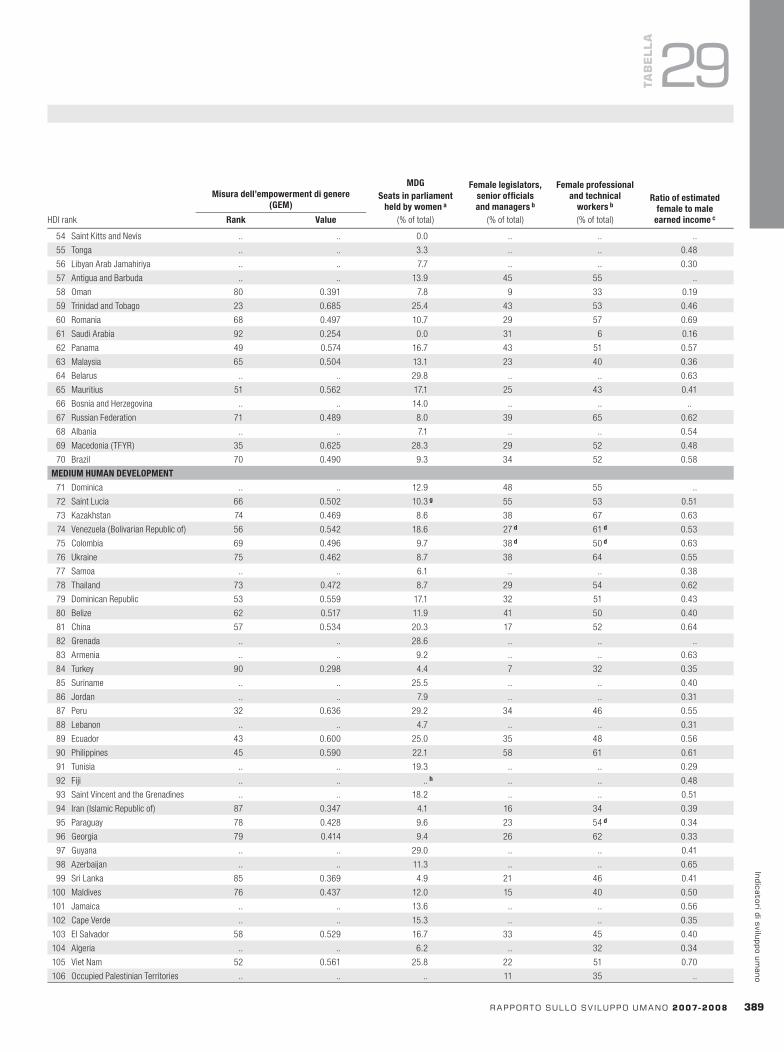
HDI rank
Misuradell’empowermentdigenere(GEM)
MDGSeatsinparliament
heldbywomena
(% of total)
Femalelegislators,seniorofficialsandmanagersb
(% of total)
Femaleprofessionalandtechnical
workersb
(% of total)
Ratioofestimatedfemaletomale
earnedincomecRank Value
rapportosullosv iluppoumano2007-2008 38�
indicatoridisviluppoumano
TaB
ELLa
29
54 Saint Kitts and Nevis .. .. 0.0 .. .. ..
55 Tonga .. .. 3.3 .. .. 0.48
56 Libyan Arab Jamahiriya .. .. 7.7 .. .. 0.30
57 Antigua and Barbuda .. .. 13.9 45 55 ..
58 Oman 80 0.391 7.8 9 33 0.19
59 Trinidad and Tobago 23 0.685 25.4 43 53 0.46
60 Romania 68 0.497 10.7 29 57 0.69
61 Saudi Arabia 92 0.254 0.0 31 6 0.16
62 Panama 49 0.574 16.7 43 51 0.57
63 Malaysia 65 0.504 13.1 23 40 0.36
64 Belarus .. .. 29.8 .. .. 0.63
65 Mauritius 51 0.562 17.1 25 43 0.41
66 Bosnia and Herzegovina .. .. 14.0 .. .. ..
67 Russian Federation 71 0.489 8.0 39 65 0.62
68 Albania .. .. 7.1 .. .. 0.54
69 Macedonia (TFYR) 35 0.625 28.3 29 52 0.48
70 Brazil 70 0.490 9.3 34 52 0.58
MEDIUMHUMANDEVELOPMENT
71 Dominica .. .. 12.9 48 55 ..
72 Saint Lucia 66 0.502 10.3g 55 53 0.51
73 Kazakhstan 74 0.469 8.6 38 67 0.63
74 Venezuela (Bolivarian Republic of) 56 0.542 18.6 27d 61d 0.53
75 Colombia 69 0.496 9.7 38d 50d 0.63
76 Ukraine 75 0.462 8.7 38 64 0.55
77 Samoa .. .. 6.1 .. .. 0.38
78 Thailand 73 0.472 8.7 29 54 0.62
79 Dominican Republic 53 0.559 17.1 32 51 0.43
80 Belize 62 0.517 11.9 41 50 0.40
81 China 57 0.534 20.3 17 52 0.64
82 Grenada .. .. 28.6 .. .. ..
83 Armenia .. .. 9.2 .. .. 0.63
84 Turkey 90 0.298 4.4 7 32 0.35
85 Suriname .. .. 25.5 .. .. 0.40
86 Jordan .. .. 7.9 .. .. 0.31
87 Peru 32 0.636 29.2 34 46 0.55
88 Lebanon .. .. 4.7 .. .. 0.31
89 Ecuador 43 0.600 25.0 35 48 0.56
90 Philippines 45 0.590 22.1 58 61 0.61
91 Tunisia .. .. 19.3 .. .. 0.29
92 Fiji .. .. ..h .. .. 0.48
93 Saint Vincent and the Grenadines .. .. 18.2 .. .. 0.51
94 Iran ( Islamic Republic of) 87 0.347 4.1 16 34 0.39
95 Paraguay 78 0.428 9.6 23 54d 0.34
96 Georgia 79 0.414 9.4 26 62 0.33
97 Guyana .. .. 29.0 .. .. 0.41
98 Azerbaijan .. .. 11.3 .. .. 0.65
99 Sri Lanka 85 0.369 4.9 21 46 0.41
100 Maldives 76 0.437 12.0 15 40 0.50
101 Jamaica .. .. 13.6 .. .. 0.56
102 Cape Verde .. .. 15.3 .. .. 0.35
103 El Salvador 58 0.529 16.7 33 45 0.40
104 Algeria .. .. 6.2 .. 32 0.34
105 Viet Nam 52 0.561 25.8 22 51 0.70
106 Occupied Palestinian Territories .. .. .. 11 35 ..
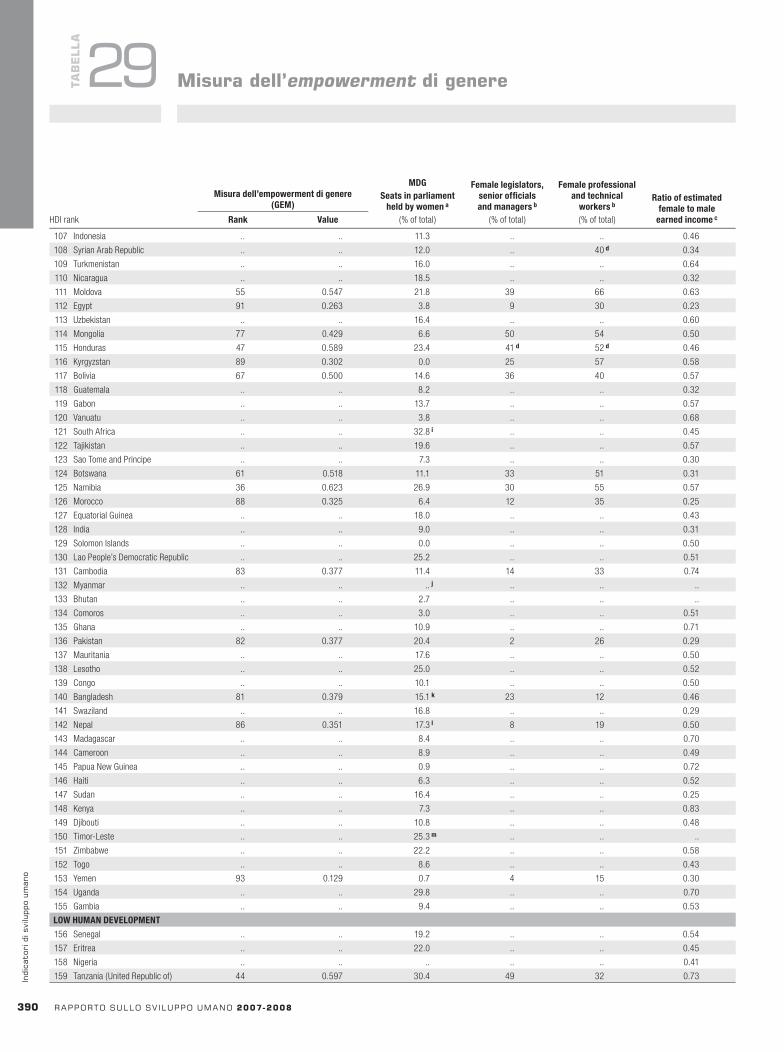
HDI rank
Misuradell’empowermentdigenere(GEM)
MDGSeatsinparliament
heldbywomena
(% of total)
Femalelegislators,seniorofficialsandmanagersb
(% of total)
Femaleprofessionalandtechnical
workersb
(% of total)
Ratioofestimatedfemaletomale
earnedincomecRank ValueHDI rank
Misuradell’empowermentdigenere(GEM)
MDGSeatsinparliament
heldbywomena
(% of total)
Femalelegislators,seniorofficialsandmanagersb
(% of total)
Femaleprofessionalandtechnical
workersb
(% of total)
Ratioofestimatedfemaletomale
earnedincomecRank Value
3�0 rapportosullosv iluppoumano2007-2008
indi
cato
rid
isvi
lupp
oum
ano
TaB
ELLa
29 Misuradell’empowermentdigenere
107 Indonesia .. .. 11.3 .. .. 0.46
108 Syrian Arab Republic .. .. 12.0 .. 40d 0.34
109 Turkmenistan .. .. 16.0 .. .. 0.64
110 Nicaragua .. .. 18.5 .. .. 0.32
111 Moldova 55 0.547 21.8 39 66 0.63
112 Egypt 91 0.263 3.8 9 30 0.23
113 Uzbekistan .. .. 16.4 .. .. 0.60
114 Mongolia 77 0.429 6.6 50 54 0.50
115 Honduras 47 0.589 23.4 41d 52d 0.46
116 Kyrgyzstan 89 0.302 0.0 25 57 0.58
117 Bolivia 67 0.500 14.6 36 40 0.57
118 Guatemala .. .. 8.2 .. .. 0.32
119 Gabon .. .. 13.7 .. .. 0.57
120 Vanuatu .. .. 3.8 .. .. 0.68
121 South Africa .. .. 32.8i .. .. 0.45
122 Tajikistan .. .. 19.6 .. .. 0.57
123 Sao Tome and Principe .. .. 7.3 .. .. 0.30
124 Botswana 61 0.518 11.1 33 51 0.31
125 Namibia 36 0.623 26.9 30 55 0.57
126 Morocco 88 0.325 6.4 12 35 0.25
127 Equatorial Guinea .. .. 18.0 .. .. 0.43
128 India .. .. 9.0 .. .. 0.31
129 Solomon Islands .. .. 0.0 .. .. 0.50
130 Lao People’s Democratic Republic .. .. 25.2 .. .. 0.51
131 Cambodia 83 0.377 11.4 14 33 0.74
132 Myanmar .. .. ..j .. .. ..
133 Bhutan .. .. 2.7 .. .. ..
134 Comoros .. .. 3.0 .. .. 0.51
135 Ghana .. .. 10.9 .. .. 0.71
136 Pakistan 82 0.377 20.4 2 26 0.29
137 Mauritania .. .. 17.6 .. .. 0.50
138 Lesotho .. .. 25.0 .. .. 0.52
139 Congo .. .. 10.1 .. .. 0.50
140 Bangladesh 81 0.379 15.1k 23 12 0.46
141 Swaziland .. .. 16.8 .. .. 0.29
142 Nepal 86 0.351 17.3l 8 19 0.50
143 Madagascar .. .. 8.4 .. .. 0.70
144 Cameroon .. .. 8.9 .. .. 0.49
145 Papua New Guinea .. .. 0.9 .. .. 0.72
146 Haiti .. .. 6.3 .. .. 0.52
147 Sudan .. .. 16.4 .. .. 0.25
148 Kenya .. .. 7.3 .. .. 0.83
149 Djibouti .. .. 10.8 .. .. 0.48
150 Timor-Leste .. .. 25.3m .. .. ..
151 Zimbabwe .. .. 22.2 .. .. 0.58
152 Togo .. .. 8.6 .. .. 0.43
153 Yemen 93 0.129 0.7 4 15 0.30
154 Uganda .. .. 29.8 .. .. 0.70
155 Gambia .. .. 9.4 .. .. 0.53
LOWHUMANDEVELOPMENT
156 Senegal .. .. 19.2 .. .. 0.54
157 Eritrea .. .. 22.0 .. .. 0.45
158 Nigeria .. .. .. .. .. 0.41
159 Tanzania (United Republic of) 44 0.597 30.4 49 32 0.73
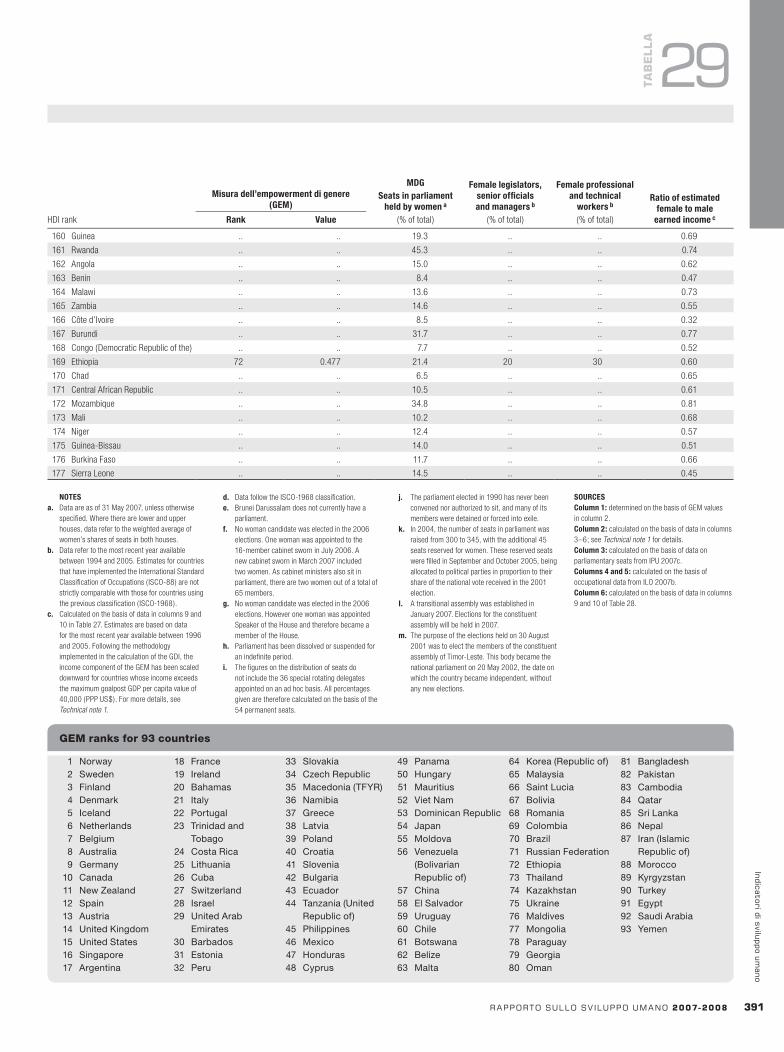
HDI rank
Misuradell’empowermentdigenere(GEM)
MDGSeatsinparliament
heldbywomena
(% of total)
Femalelegislators,seniorofficialsandmanagersb
(% of total)
Femaleprofessionalandtechnical
workersb
(% of total)
Ratioofestimatedfemaletomale
earnedincomecRank Value
rapportosullosv iluppoumano2007-2008 3�1
indicatoridisviluppoumano
NOTESa. Data are as of 31 May 2007, unless otherwise
specified. Where there are lower and upper houses, data refer to the weighted average of women’s shares of seats in both houses.
b. Data refer to the most recent year available between 1994 and 2005. Estimates for countries that have implemented the International Standard Classification of Occupations ( ISCO-88) are not strictly comparable with those for countries using the previous classification ( ISCO-1968).
c. Calculated on the basis of data in columns 9 and 10 in Table 27. Estimates are based on data for the most recent year available between 1996 and 2005. Following the methodology implemented in the calculation of the GDI, the income component of the GEM has been scaled downward for countries whose income exceeds the maximum goalpost GDP per capita value of 40,000 (PPP US$). For more details, see Technical note 1.
d. Data follow the ISCO-1968 classification.e. Brunei Darussalam does not currently have a
parliament.f. No woman candidate was elected in the 2006
elections. One woman was appointed to the 16-member cabinet sworn in July 2006. A new cabinet sworn in March 2007 included two women. As cabinet ministers also sit in parliament, there are two women out of a total of 65 members.
g. No woman candidate was elected in the 2006 elections. However one woman was appointed Speaker of the House and therefore became a member of the House.
h. Parliament has been dissolved or suspended for an indefinite period.
i. The figures on the distribution of seats do not include the 36 special rotating delegates appointed on an ad hoc basis. All percentages given are therefore calculated on the basis of the 54 permanent seats.
j. The parliament elected in 1990 has never been convened nor authorized to sit, and many of its members were detained or forced into exile.
k. In 2004, the number of seats in parliament was raised from 300 to 345, with the additional 45 seats reserved for women. These reserved seats were filled in September and October 2005, being allocated to political parties in proportion to their share of the national vote received in the 2001 election.
I. A transitional assembly was established in January 2007. Elections for the constituent assembly will be held in 2007.
m. The purpose of the elections held on 30 August 2001 was to elect the members of the constituent assembly of Timor-Leste. This body became the national parliament on 20 May 2002, the date on which the country became independent, without any new elections.
SOURCESColumn1: determined on the basis of GEM values in column 2.Column2: calculated on the basis of data in columns 3–6; see Technical note 1 for details.Column3: calculated on the basis of data on parliamentary seats from IPU 2007c.Columns4and5: calculated on the basis of occupational data from ILO 2007b.Column6: calculated on the basis of data in columns 9 and 10 of Table 28.
1 Norway 2 Sweden 3 Finland 4 Denmark 5 Iceland 6 Netherlands 7 Belgium 8 Australia 9 Germany 10 Canada 11 New Zealand 12 Spain 13 Austria 14 United Kingdom 15 United States 16 Singapore 17 Argentina
18 France 19 Ireland 20 Bahamas 21 Italy 22 Portugal 23 Trinidad and
Tobago 24 Costa Rica 25 Lithuania 26 Cuba 27 Switzerland 28 Israel 29 United Arab
Emirates 30 Barbados 31 Estonia 32 Peru
33 Slovakia 34 Czech Republic 35 Macedonia (TFYR) 36 Namibia 37 Greece 38 Latvia 39 Poland 40 Croatia 41 Slovenia 42 Bulgaria 43 Ecuador 44 Tanzania (United
Republic of) 45 Philippines 46 Mexico 47 Honduras 48 Cyprus
49 Panama 50 Hungary 51 Mauritius 52 Viet Nam 53 Dominican Republic 54 Japan 55 Moldova 56 Venezuela
(Bolivarian Republic of)
57 China 58 El Salvador 59 Uruguay 60 Chile 61 Botswana 62 Belize 63 Malta
64 Korea (Republic of) 65 Malaysia 66 Saint Lucia 67 Bolivia 68 Romania 69 Colombia 70 Brazil 71 Russian Federation 72 Ethiopia 73 Thailand 74 Kazakhstan 75 Ukraine 76 Maldives 77 Mongolia 78 Paraguay 79 Georgia 80 Oman
81 Bangladesh 82 Pakistan 83 Cambodia 84 Qatar 85 Sri Lanka 86 Nepal 87 Iran (Islamic
Republic of) 88 Morocco 89 Kyrgyzstan 90 Turkey 91 Egypt 92 Saudi Arabia 93 Yemen
GEM ranks for 93 countries
TaB
ELLa
29
160 Guinea .. .. 19.3 .. .. 0.69
161 Rwanda .. .. 45.3 .. .. 0.74
162 Angola .. .. 15.0 .. .. 0.62
163 Benin .. .. 8.4 .. .. 0.47
164 Malawi .. .. 13.6 .. .. 0.73
165 Zambia .. .. 14.6 .. .. 0.55
166 Côte d’Ivoire .. .. 8.5 .. .. 0.32
167 Burundi .. .. 31.7 .. .. 0.77
168 Congo (Democratic Republic of the) .. .. 7.7 .. .. 0.52
169 Ethiopia 72 0.477 21.4 20 30 0.60
170 Chad .. .. 6.5 .. .. 0.65
171 Central African Republic .. .. 10.5 .. .. 0.61
172 Mozambique .. .. 34.8 .. .. 0.81
173 Mali .. .. 10.2 .. .. 0.68
174 Niger .. .. 12.4 .. .. 0.57
175 Guinea-Bissau .. .. 14.0 .. .. 0.51
176 Burkina Faso .. .. 11.7 .. .. 0.66
177 Sierra Leone .. .. 14.5 .. .. 0.45
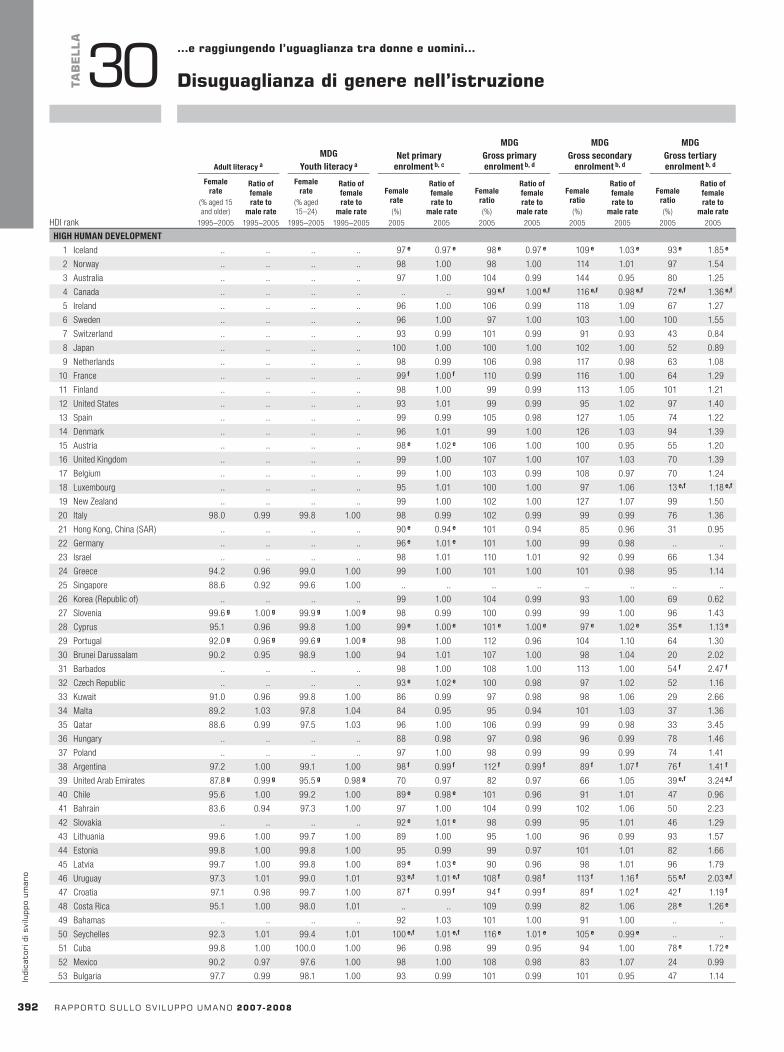
HDI rank
Adultliteracya
MDGYouthliteracya
Netprimaryenrolmentb,c
MDGGrossprimaryenrolmentb,d
MDGGrosssecondary
enrolmentb,d
MDGGrosstertiaryenrolmentb,d
Femalerate
(% aged 15 and older)
1995–2005
Ratiooffemalerateto
malerate1995–2005
Femalerate
(% aged 15–24)
1995–2005
Ratiooffemalerateto
malerate1995–2005
Femalerate(%)
2005
Ratiooffemalerateto
malerate2005
Femaleratio(%)
2005
Ratiooffemalerateto
malerate2005
Femaleratio(%)
2005
Ratiooffemalerateto
malerate2005
Femaleratio(%)
2005
Ratiooffemalerateto
malerate2005HDI rank
Adultliteracya
MDGYouthliteracya
Netprimaryenrolmentb,c
MDGGrossprimaryenrolmentb,d
MDGGrosssecondary
enrolmentb,d
MDGGrosstertiaryenrolmentb,d
Femalerate
(% aged 15 and older)
1995–2005
Ratiooffemalerateto
malerate1995–2005
Femalerate
(% aged 15–24)
1995–2005
Ratiooffemalerateto
malerate1995–2005
Femalerate(%)
2005
Ratiooffemalerateto
malerate2005
Femaleratio(%)
2005
Ratiooffemalerateto
malerate2005
Femaleratio(%)
2005
Ratiooffemalerateto
malerate2005
Femaleratio(%)
2005
Ratiooffemalerateto
malerate2005
3�2 rapportosullosv iluppoumano2007-2008
indi
cato
rid
isvi
lupp
oum
ano
HIGHHUMANDEVELOPMENT
1 Iceland .. .. .. .. 97e 0.97e 98e 0.97e 109e 1.03e 93e 1.85e
2 Norway .. .. .. .. 98 1.00 98 1.00 114 1.01 97 1.54
3 Australia .. .. .. .. 97 1.00 104 0.99 144 0.95 80 1.25
4 Canada .. .. .. .. .. .. 99e,f 1.00e,f 116e,f 0.98e,f 72e,f 1.36e,f
5 Ireland .. .. .. .. 96 1.00 106 0.99 118 1.09 67 1.27
6 Sweden .. .. .. .. 96 1.00 97 1.00 103 1.00 100 1.55
7 Switzerland .. .. .. .. 93 0.99 101 0.99 91 0.93 43 0.84
8 Japan .. .. .. .. 100 1.00 100 1.00 102 1.00 52 0.89
9 Netherlands .. .. .. .. 98 0.99 106 0.98 117 0.98 63 1.08
10 France .. .. .. .. 99f 1.00f 110 0.99 116 1.00 64 1.29
11 Finland .. .. .. .. 98 1.00 99 0.99 113 1.05 101 1.21
12 United States .. .. .. .. 93 1.01 99 0.99 95 1.02 97 1.40
13 Spain .. .. .. .. 99 0.99 105 0.98 127 1.05 74 1.22
14 Denmark .. .. .. .. 96 1.01 99 1.00 126 1.03 94 1.39
15 Austria .. .. .. .. 98e 1.02e 106 1.00 100 0.95 55 1.20
16 United Kingdom .. .. .. .. 99 1.00 107 1.00 107 1.03 70 1.39
17 Belgium .. .. .. .. 99 1.00 103 0.99 108 0.97 70 1.24
18 Luxembourg .. .. .. .. 95 1.01 100 1.00 97 1.06 13e,f 1.18e,f
19 New Zealand .. .. .. .. 99 1.00 102 1.00 127 1.07 99 1.50
20 Italy 98.0 0.99 99.8 1.00 98 0.99 102 0.99 99 0.99 76 1.36
21 Hong Kong, China (SAR) .. .. .. .. 90e 0.94e 101 0.94 85 0.96 31 0.95
22 Germany .. .. .. .. 96e 1.01e 101 1.00 99 0.98 .. ..
23 Israel .. .. .. .. 98 1.01 110 1.01 92 0.99 66 1.34
24 Greece 94.2 0.96 99.0 1.00 99 1.00 101 1.00 101 0.98 95 1.14
25 Singapore 88.6 0.92 99.6 1.00 .. .. .. .. .. .. .. ..
26 Korea (Republic of) .. .. .. .. 99 1.00 104 0.99 93 1.00 69 0.62
27 Slovenia 99.6g 1.00g 99.9g 1.00g 98 0.99 100 0.99 99 1.00 96 1.43
28 Cyprus 95.1 0.96 99.8 1.00 99e 1.00e 101e 1.00e 97e 1.02e 35e 1.13e
29 Portugal 92.0g 0.96g 99.6g 1.00g 98 1.00 112 0.96 104 1.10 64 1.30
30 Brunei Darussalam 90.2 0.95 98.9 1.00 94 1.01 107 1.00 98 1.04 20 2.02
31 Barbados .. .. .. .. 98 1.00 108 1.00 113 1.00 54f 2.47f
32 Czech Republic .. .. .. .. 93e 1.02e 100 0.98 97 1.02 52 1.16
33 Kuwait 91.0 0.96 99.8 1.00 86 0.99 97 0.98 98 1.06 29 2.66
34 Malta 89.2 1.03 97.8 1.04 84 0.95 95 0.94 101 1.03 37 1.36
35 Qatar 88.6 0.99 97.5 1.03 96 1.00 106 0.99 99 0.98 33 3.45
36 Hungary .. .. .. .. 88 0.98 97 0.98 96 0.99 78 1.46
37 Poland .. .. .. .. 97 1.00 98 0.99 99 0.99 74 1.41
38 Argentina 97.2 1.00 99.1 1.00 98f 0.99f 112f 0.99f 89f 1.07f 76f 1.41f
39 United Arab Emirates 87.8g 0.99g 95.5g 0.98g 70 0.97 82 0.97 66 1.05 39e,f 3.24e,f
40 Chile 95.6 1.00 99.2 1.00 89e 0.98e 101 0.96 91 1.01 47 0.96
41 Bahrain 83.6 0.94 97.3 1.00 97 1.00 104 0.99 102 1.06 50 2.23
42 Slovakia .. .. .. .. 92e 1.01e 98 0.99 95 1.01 46 1.29
43 Lithuania 99.6 1.00 99.7 1.00 89 1.00 95 1.00 96 0.99 93 1.57
44 Estonia 99.8 1.00 99.8 1.00 95 0.99 99 0.97 101 1.01 82 1.66
45 Latvia 99.7 1.00 99.8 1.00 89e 1.03e 90 0.96 98 1.01 96 1.79
46 Uruguay 97.3 1.01 99.0 1.01 93e,f 1.01e,f 108f 0.98f 113f 1.16f 55e,f 2.03e,f
47 Croatia 97.1 0.98 99.7 1.00 87f 0.99f 94f 0.99f 89f 1.02f 42f 1.19f
48 Costa Rica 95.1 1.00 98.0 1.01 .. .. 109 0.99 82 1.06 28e 1.26e
49 Bahamas .. .. .. .. 92 1.03 101 1.00 91 1.00 .. ..
50 Seychelles 92.3 1.01 99.4 1.01 100e,f 1.01e,f 116e 1.01e 105e 0.99e .. ..
51 Cuba 99.8 1.00 100.0 1.00 96 0.98 99 0.95 94 1.00 78e 1.72e
52 Mexico 90.2 0.97 97.6 1.00 98 1.00 108 0.98 83 1.07 24 0.99
53 Bulgaria 97.7 0.99 98.1 1.00 93 0.99 101 0.99 101 0.95 47 1.14
TaB
ELLa
30 …eraggiungendol’uguaglianzatradonneeuomini…
Disuguaglianzadigenerenell’istruzione
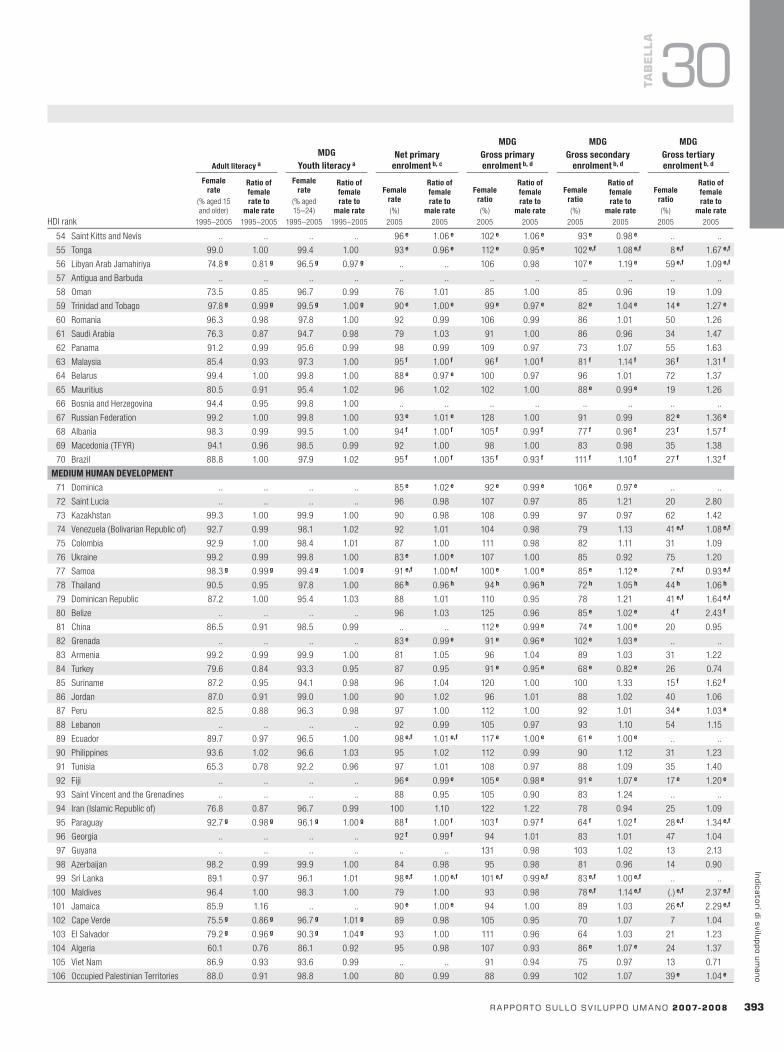
HDI rank
Adultliteracya
MDGYouthliteracya
Netprimaryenrolmentb,c
MDGGrossprimaryenrolmentb,d
MDGGrosssecondary
enrolmentb,d
MDGGrosstertiaryenrolmentb,d
Femalerate
(% aged 15 and older)
1995–2005
Ratiooffemalerateto
malerate1995–2005
Femalerate
(% aged 15–24)
1995–2005
Ratiooffemalerateto
malerate1995–2005
Femalerate(%)
2005
Ratiooffemalerateto
malerate2005
Femaleratio(%)
2005
Ratiooffemalerateto
malerate2005
Femaleratio(%)
2005
Ratiooffemalerateto
malerate2005
Femaleratio(%)
2005
Ratiooffemalerateto
malerate2005
rapportosullosv iluppoumano2007-2008 3�3
indicatoridisviluppoumano
TaB
ELLa
30
54 Saint Kitts and Nevis .. .. .. .. 96e 1.06e 102e 1.06e 93e 0.98e .. ..
55 Tonga 99.0 1.00 99.4 1.00 93e 0.96e 112e 0.95e 102e,f 1.08e,f 8e,f 1.67e,f
56 Libyan Arab Jamahiriya 74.8g 0.81g 96.5g 0.97g .. .. 106 0.98 107e 1.19e 59e,f 1.09e,f
57 Antigua and Barbuda .. .. .. .. .. .. .. .. .. .. .. ..
58 Oman 73.5 0.85 96.7 0.99 76 1.01 85 1.00 85 0.96 19 1.09
59 Trinidad and Tobago 97.8g 0.99g 99.5g 1.00g 90e 1.00e 99e 0.97e 82e 1.04e 14e 1.27e
60 Romania 96.3 0.98 97.8 1.00 92 0.99 106 0.99 86 1.01 50 1.26
61 Saudi Arabia 76.3 0.87 94.7 0.98 79 1.03 91 1.00 86 0.96 34 1.47
62 Panama 91.2 0.99 95.6 0.99 98 0.99 109 0.97 73 1.07 55 1.63
63 Malaysia 85.4 0.93 97.3 1.00 95f 1.00f 96f 1.00f 81f 1.14f 36f 1.31f
64 Belarus 99.4 1.00 99.8 1.00 88e 0.97e 100 0.97 96 1.01 72 1.37
65 Mauritius 80.5 0.91 95.4 1.02 96 1.02 102 1.00 88e 0.99e 19 1.26
66 Bosnia and Herzegovina 94.4 0.95 99.8 1.00 .. .. .. .. .. .. .. ..
67 Russian Federation 99.2 1.00 99.8 1.00 93e 1.01e 128 1.00 91 0.99 82e 1.36e
68 Albania 98.3 0.99 99.5 1.00 94f 1.00f 105f 0.99f 77f 0.96f 23f 1.57f
69 Macedonia (TFYR) 94.1 0.96 98.5 0.99 92 1.00 98 1.00 83 0.98 35 1.38
70 Brazil 88.8 1.00 97.9 1.02 95f 1.00f 135f 0.93f 111f 1.10f 27f 1.32f
MEDIUMHUMANDEVELOPMENT
71 Dominica .. .. .. .. 85e 1.02e 92e 0.99e 106e 0.97e .. ..
72 Saint Lucia .. .. .. .. 96 0.98 107 0.97 85 1.21 20 2.80
73 Kazakhstan 99.3 1.00 99.9 1.00 90 0.98 108 0.99 97 0.97 62 1.42
74 Venezuela (Bolivarian Republic of) 92.7 0.99 98.1 1.02 92 1.01 104 0.98 79 1.13 41e,f 1.08e,f
75 Colombia 92.9 1.00 98.4 1.01 87 1.00 111 0.98 82 1.11 31 1.09
76 Ukraine 99.2 0.99 99.8 1.00 83e 1.00e 107 1.00 85 0.92 75 1.20
77 Samoa 98.3g 0.99g 99.4g 1.00g 91e,f 1.00e,f 100e 1.00e 85e 1.12e 7e,f 0.93e,f
78 Thailand 90.5 0.95 97.8 1.00 86h 0.96h 94h 0.96h 72h 1.05h 44h 1.06h
79 Dominican Republic 87.2 1.00 95.4 1.03 88 1.01 110 0.95 78 1.21 41e,f 1.64e,f
80 Belize .. .. .. .. 96 1.03 125 0.96 85e 1.02e 4f 2.43f
81 China 86.5 0.91 98.5 0.99 .. .. 112e 0.99e 74e 1.00e 20 0.95
82 Grenada .. .. .. .. 83e 0.99e 91e 0.96e 102e 1.03e .. ..
83 Armenia 99.2 0.99 99.9 1.00 81 1.05 96 1.04 89 1.03 31 1.22
84 Turkey 79.6 0.84 93.3 0.95 87 0.95 91e 0.95e 68e 0.82e 26 0.74
85 Suriname 87.2 0.95 94.1 0.98 96 1.04 120 1.00 100 1.33 15f 1.62f
86 Jordan 87.0 0.91 99.0 1.00 90 1.02 96 1.01 88 1.02 40 1.06
87 Peru 82.5 0.88 96.3 0.98 97 1.00 112 1.00 92 1.01 34e 1.03e
88 Lebanon .. .. .. .. 92 0.99 105 0.97 93 1.10 54 1.15
89 Ecuador 89.7 0.97 96.5 1.00 98e,f 1.01e,f 117e 1.00e 61e 1.00e .. ..
90 Philippines 93.6 1.02 96.6 1.03 95 1.02 112 0.99 90 1.12 31 1.23
91 Tunisia 65.3 0.78 92.2 0.96 97 1.01 108 0.97 88 1.09 35 1.40
92 Fiji .. .. .. .. 96e 0.99e 105e 0.98e 91e 1.07e 17e 1.20e
93 Saint Vincent and the Grenadines .. .. .. .. 88 0.95 105 0.90 83 1.24 .. ..
94 Iran ( Islamic Republic of) 76.8 0.87 96.7 0.99 100 1.10 122 1.22 78 0.94 25 1.09
95 Paraguay 92.7g 0.98g 96.1g 1.00g 88f 1.00f 103f 0.97f 64f 1.02f 28e,f 1.34e,f
96 Georgia .. .. .. .. 92f 0.99f 94 1.01 83 1.01 47 1.04
97 Guyana .. .. .. .. .. .. 131 0.98 103 1.02 13 2.13
98 Azerbaijan 98.2 0.99 99.9 1.00 84 0.98 95 0.98 81 0.96 14 0.90
99 Sri Lanka 89.1 0.97 96.1 1.01 98e,f 1.00e,f 101e,f 0.99e,f 83e,f 1.00e,f .. ..
100 Maldives 96.4 1.00 98.3 1.00 79 1.00 93 0.98 78e,f 1.14e,f (.)e,f 2.37e,f
101 Jamaica 85.9 1.16 .. .. 90e 1.00e 94 1.00 89 1.03 26e,f 2.29e,f
102 Cape Verde 75.5g 0.86g 96.7g 1.01g 89 0.98 105 0.95 70 1.07 7 1.04
103 El Salvador 79.2g 0.96g 90.3g 1.04g 93 1.00 111 0.96 64 1.03 21 1.23
104 Algeria 60.1 0.76 86.1 0.92 95 0.98 107 0.93 86e 1.07e 24 1.37
105 Viet Nam 86.9 0.93 93.6 0.99 .. .. 91 0.94 75 0.97 13 0.71
106 Occupied Palestinian Territories 88.0 0.91 98.8 1.00 80 0.99 88 0.99 102 1.07 39e 1.04e
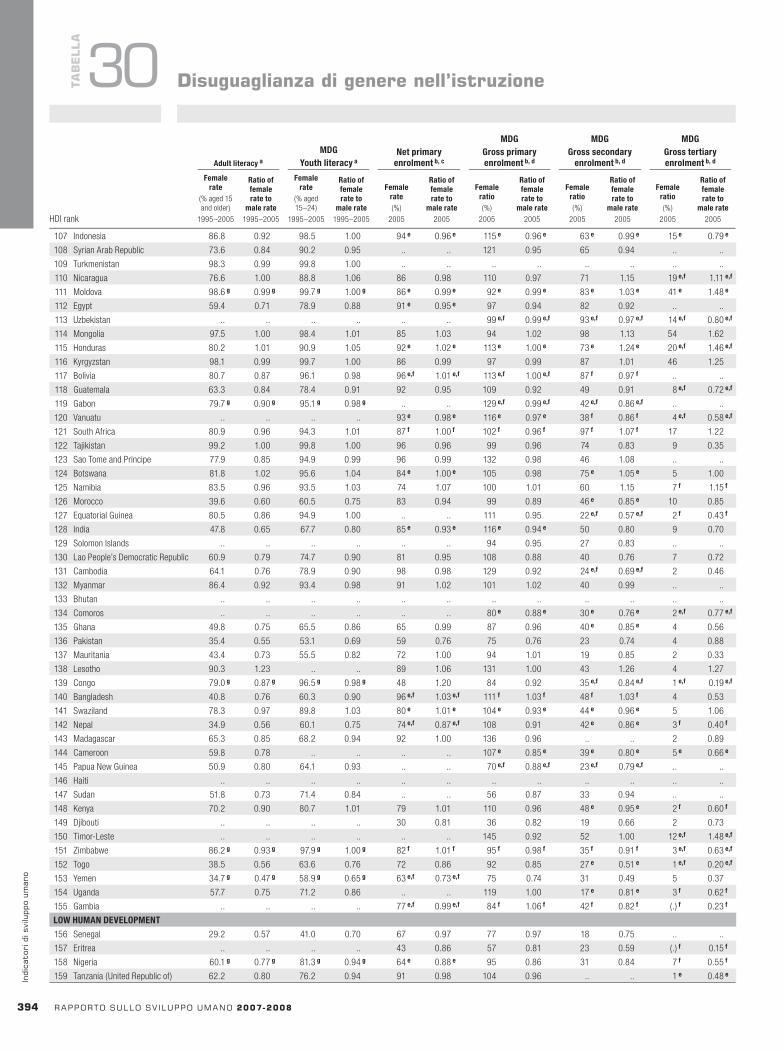
HDI rank
Adultliteracya
MDGYouthliteracya
Netprimaryenrolmentb,c
MDGGrossprimaryenrolmentb,d
MDGGrosssecondary
enrolmentb,d
MDGGrosstertiaryenrolmentb,d
Femalerate
(% aged 15 and older)
1995–2005
Ratiooffemalerateto
malerate1995–2005
Femalerate
(% aged 15–24)
1995–2005
Ratiooffemalerateto
malerate1995–2005
Femalerate(%)
2005
Ratiooffemalerateto
malerate2005
Femaleratio(%)
2005
Ratiooffemalerateto
malerate2005
Femaleratio(%)
2005
Ratiooffemalerateto
malerate2005
Femaleratio(%)
2005
Ratiooffemalerateto
malerate2005HDI rank
Adultliteracya
MDGYouthliteracya
Netprimaryenrolmentb,c
MDGGrossprimaryenrolmentb,d
MDGGrosssecondary
enrolmentb,d
MDGGrosstertiaryenrolmentb,d
Femalerate
(% aged 15 and older)
1995–2005
Ratiooffemalerateto
malerate1995–2005
Femalerate
(% aged 15–24)
1995–2005
Ratiooffemalerateto
malerate1995–2005
Femalerate(%)
2005
Ratiooffemalerateto
malerate2005
Femaleratio(%)
2005
Ratiooffemalerateto
malerate2005
Femaleratio(%)
2005
Ratiooffemalerateto
malerate2005
Femaleratio(%)
2005
Ratiooffemalerateto
malerate2005
3�4 rapportosullosv iluppoumano2007-2008
indi
cato
rid
isvi
lupp
oum
ano
TaB
ELLa
30 Disuguaglianzadigenerenell’istruzione
107 Indonesia 86.8 0.92 98.5 1.00 94e 0.96e 115e 0.96e 63e 0.99e 15e 0.79e
108 Syrian Arab Republic 73.6 0.84 90.2 0.95 .. .. 121 0.95 65 0.94 .. ..
109 Turkmenistan 98.3 0.99 99.8 1.00 .. .. .. .. .. .. .. ..
110 Nicaragua 76.6 1.00 88.8 1.06 86 0.98 110 0.97 71 1.15 19e,f 1.11e,f
111 Moldova 98.6g 0.99g 99.7g 1.00g 86e 0.99e 92e 0.99e 83e 1.03e 41e 1.48e
112 Egypt 59.4 0.71 78.9 0.88 91e 0.95e 97 0.94 82 0.92 .. ..
113 Uzbekistan .. .. .. .. .. .. 99e,f 0.99e,f 93e,f 0.97e,f 14e,f 0.80e,f
114 Mongolia 97.5 1.00 98.4 1.01 85 1.03 94 1.02 98 1.13 54 1.62
115 Honduras 80.2 1.01 90.9 1.05 92e 1.02e 113e 1.00e 73e 1.24e 20e,f 1.46e,f
116 Kyrgyzstan 98.1 0.99 99.7 1.00 86 0.99 97 0.99 87 1.01 46 1.25
117 Bolivia 80.7 0.87 96.1 0.98 96e,f 1.01e,f 113e,f 1.00e,f 87f 0.97f .. ..
118 Guatemala 63.3 0.84 78.4 0.91 92 0.95 109 0.92 49 0.91 8e,f 0.72e,f
119 Gabon 79.7g 0.90g 95.1g 0.98g .. .. 129e,f 0.99e,f 42e,f 0.86e,f .. ..
120 Vanuatu .. .. .. .. 93e 0.98e 116e 0.97e 38f 0.86f 4e,f 0.58e,f
121 South Africa 80.9 0.96 94.3 1.01 87f 1.00f 102f 0.96f 97f 1.07f 17 1.22
122 Tajikistan 99.2 1.00 99.8 1.00 96 0.96 99 0.96 74 0.83 9 0.35
123 Sao Tome and Principe 77.9 0.85 94.9 0.99 96 0.99 132 0.98 46 1.08 .. ..
124 Botswana 81.8 1.02 95.6 1.04 84e 1.00e 105 0.98 75e 1.05e 5 1.00
125 Namibia 83.5 0.96 93.5 1.03 74 1.07 100 1.01 60 1.15 7f 1.15f
126 Morocco 39.6 0.60 60.5 0.75 83 0.94 99 0.89 46e 0.85e 10 0.85
127 Equatorial Guinea 80.5 0.86 94.9 1.00 .. .. 111 0.95 22e,f 0.57e,f 2f 0.43f
128 India 47.8 0.65 67.7 0.80 85e 0.93e 116e 0.94e 50 0.80 9 0.70
129 Solomon Islands .. .. .. .. .. .. 94 0.95 27 0.83 .. ..
130 Lao People’s Democratic Republic 60.9 0.79 74.7 0.90 81 0.95 108 0.88 40 0.76 7 0.72
131 Cambodia 64.1 0.76 78.9 0.90 98 0.98 129 0.92 24e,f 0.69e,f 2 0.46
132 Myanmar 86.4 0.92 93.4 0.98 91 1.02 101 1.02 40 0.99 .. ..
133 Bhutan .. .. .. .. .. .. .. .. .. .. .. ..
134 Comoros .. .. .. .. .. .. 80e 0.88e 30e 0.76e 2e,f 0.77e,f
135 Ghana 49.8 0.75 65.5 0.86 65 0.99 87 0.96 40e 0.85e 4 0.56
136 Pakistan 35.4 0.55 53.1 0.69 59 0.76 75 0.76 23 0.74 4 0.88
137 Mauritania 43.4 0.73 55.5 0.82 72 1.00 94 1.01 19 0.85 2 0.33
138 Lesotho 90.3 1.23 .. .. 89 1.06 131 1.00 43 1.26 4 1.27
139 Congo 79.0g 0.87g 96.5g 0.98g 48 1.20 84 0.92 35e,f 0.84e,f 1e,f 0.19e,f
140 Bangladesh 40.8 0.76 60.3 0.90 96e,f 1.03e,f 111f 1.03f 48f 1.03f 4 0.53
141 Swaziland 78.3 0.97 89.8 1.03 80e 1.01e 104e 0.93e 44e 0.96e 5 1.06
142 Nepal 34.9 0.56 60.1 0.75 74e,f 0.87e,f 108 0.91 42e 0.86e 3f 0.40f
143 Madagascar 65.3 0.85 68.2 0.94 92 1.00 136 0.96 .. .. 2 0.89
144 Cameroon 59.8 0.78 .. .. .. .. 107e 0.85e 39e 0.80e 5e 0.66e
145 Papua New Guinea 50.9 0.80 64.1 0.93 .. .. 70e,f 0.88e,f 23e,f 0.79e,f .. ..
146 Haiti .. .. .. .. .. .. .. .. .. .. .. ..
147 Sudan 51.8 0.73 71.4 0.84 .. .. 56 0.87 33 0.94 .. ..
148 Kenya 70.2 0.90 80.7 1.01 79 1.01 110 0.96 48e 0.95e 2f 0.60f
149 Djibouti .. .. .. .. 30 0.81 36 0.82 19 0.66 2 0.73
150 Timor-Leste .. .. .. .. .. .. 145 0.92 52 1.00 12e,f 1.48e,f
151 Zimbabwe 86.2g 0.93g 97.9g 1.00g 82f 1.01f 95f 0.98f 35f 0.91f 3e,f 0.63e,f
152 Togo 38.5 0.56 63.6 0.76 72 0.86 92 0.85 27e 0.51e 1e,f 0.20e,f
153 Yemen 34.7g 0.47g 58.9g 0.65g 63e,f 0.73e,f 75 0.74 31 0.49 5 0.37
154 Uganda 57.7 0.75 71.2 0.86 .. .. 119 1.00 17e 0.81e 3f 0.62f
155 Gambia .. .. .. .. 77e,f 0.99e,f 84f 1.06f 42f 0.82f (.)f 0.23f
LOWHUMANDEVELOPMENT
156 Senegal 29.2 0.57 41.0 0.70 67 0.97 77 0.97 18 0.75 .. ..
157 Eritrea .. .. .. .. 43 0.86 57 0.81 23 0.59 (.)f 0.15f
158 Nigeria 60.1g 0.77g 81.3g 0.94g 64e 0.88e 95 0.86 31 0.84 7f 0.55f
159 Tanzania (United Republic of) 62.2 0.80 76.2 0.94 91 0.98 104 0.96 .. .. 1e 0.48e
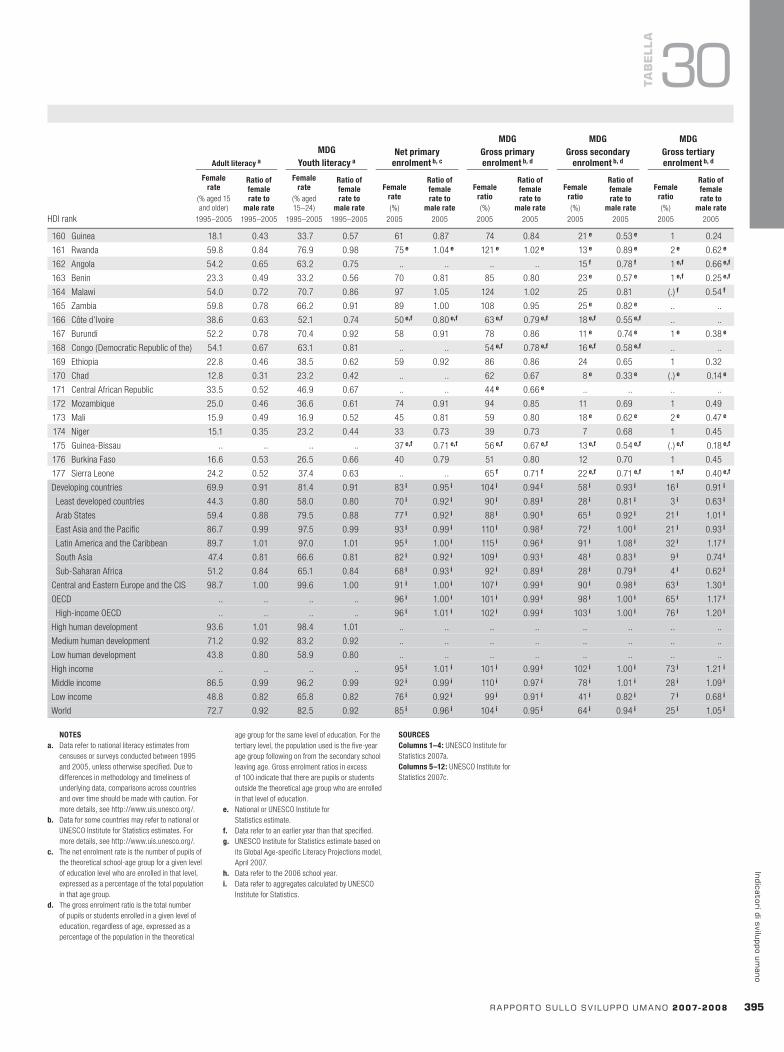
HDI rank
Adultliteracya
MDGYouthliteracya
Netprimaryenrolmentb,c
MDGGrossprimaryenrolmentb,d
MDGGrosssecondary
enrolmentb,d
MDGGrosstertiaryenrolmentb,d
Femalerate
(% aged 15 and older)
1995–2005
Ratiooffemalerateto
malerate1995–2005
Femalerate
(% aged 15–24)
1995–2005
Ratiooffemalerateto
malerate1995–2005
Femalerate(%)
2005
Ratiooffemalerateto
malerate2005
Femaleratio(%)
2005
Ratiooffemalerateto
malerate2005
Femaleratio(%)
2005
Ratiooffemalerateto
malerate2005
Femaleratio(%)
2005
Ratiooffemalerateto
malerate2005
rapportosullosv iluppoumano2007-2008 3��
indicatoridisviluppoumano
TaB
ELLa
30
NOTESa. Data refer to national literacy estimates from
censuses or surveys conducted between 1995 and 2005, unless otherwise specified. Due to differences in methodology and timeliness of underlying data, comparisons across countries and over time should be made with caution. For more details, see http://www.uis.unesco.org/.
b. Data for some countries may refer to national or UNESCO Institute for Statistics estimates. For more details, see http://www.uis.unesco.org/.
c. The net enrolment rate is the number of pupils of the theoretical school-age group for a given level of education level who are enrolled in that level, expressed as a percentage of the total population in that age group.
d. The gross enrolment ratio is the total number of pupils or students enrolled in a given level of education, regardless of age, expressed as a percentage of the population in the theoretical
age group for the same level of education. For the tertiary level, the population used is the five-year age group following on from the secondary school leaving age. Gross enrolment ratios in excess of 100 indicate that there are pupils or students outside the theoretical age group who are enrolled in that level of education.
e. National or UNESCO Institute for Statistics estimate.
f. Data refer to an earlier year than that specified.g. UNESCO Institute for Statistics estimate based on
its Global Age-specific Literacy Projections model, April 2007.
h. Data refer to the 2006 school year.i. Data refer to aggregates calculated by UNESCO
Institute for Statistics.
SOURCESColumns1–4: UNESCO Institute for Statistics 2007a.Columns5–12: UNESCO Institute for Statistics 2007c.
160 Guinea 18.1 0.43 33.7 0.57 61 0.87 74 0.84 21e 0.53e 1 0.24
161 Rwanda 59.8 0.84 76.9 0.98 75e 1.04e 121e 1.02e 13e 0.89e 2e 0.62e
162 Angola 54.2 0.65 63.2 0.75 .. .. .. .. 15f 0.78f 1e,f 0.66e,f
163 Benin 23.3 0.49 33.2 0.56 70 0.81 85 0.80 23e 0.57e 1e,f 0.25e,f
164 Malawi 54.0 0.72 70.7 0.86 97 1.05 124 1.02 25 0.81 (.)f 0.54f
165 Zambia 59.8 0.78 66.2 0.91 89 1.00 108 0.95 25e 0.82e .. ..
166 Côte d’Ivoire 38.6 0.63 52.1 0.74 50e,f 0.80e,f 63e,f 0.79e,f 18e,f 0.55e,f .. ..
167 Burundi 52.2 0.78 70.4 0.92 58 0.91 78 0.86 11e 0.74e 1e 0.38e
168 Congo (Democratic Republic of the) 54.1 0.67 63.1 0.81 .. .. 54e,f 0.78e,f 16e,f 0.58e,f .. ..
169 Ethiopia 22.8 0.46 38.5 0.62 59 0.92 86 0.86 24 0.65 1 0.32
170 Chad 12.8 0.31 23.2 0.42 .. .. 62 0.67 8e 0.33e (.)e 0.14e
171 Central African Republic 33.5 0.52 46.9 0.67 .. .. 44e 0.66e .. .. .. ..
172 Mozambique 25.0 0.46 36.6 0.61 74 0.91 94 0.85 11 0.69 1 0.49
173 Mali 15.9 0.49 16.9 0.52 45 0.81 59 0.80 18e 0.62e 2e 0.47e
174 Niger 15.1 0.35 23.2 0.44 33 0.73 39 0.73 7 0.68 1 0.45
175 Guinea-Bissau .. .. .. .. 37e,f 0.71e,f 56e,f 0.67e,f 13e,f 0.54e,f (.)e,f 0.18e,f
176 Burkina Faso 16.6 0.53 26.5 0.66 40 0.79 51 0.80 12 0.70 1 0.45
177 Sierra Leone 24.2 0.52 37.4 0.63 .. .. 65f 0.71f 22e,f 0.71e,f 1e,f 0.40e,f
Developing countries 69.9 0.91 81.4 0.91 83i 0.95i 104i 0.94i 58i 0.93i 16i 0.91i
Least developed countries 44.3 0.80 58.0 0.80 70i 0.92i 90i 0.89i 28i 0.81i 3i 0.63i
Arab States 59.4 0.88 79.5 0.88 77i 0.92i 88i 0.90i 65i 0.92i 21i 1.01i
East Asia and the Pacific 86.7 0.99 97.5 0.99 93i 0.99i 110i 0.98i 72i 1.00i 21i 0.93i
Latin America and the Caribbean 89.7 1.01 97.0 1.01 95i 1.00i 115i 0.96i 91i 1.08i 32i 1.17i
South Asia 47.4 0.81 66.6 0.81 82i 0.92i 109i 0.93i 48i 0.83i 9i 0.74i
Sub-Saharan Africa 51.2 0.84 65.1 0.84 68i 0.93i 92i 0.89i 28i 0.79i 4i 0.62i
Central and Eastern Europe and the CIS 98.7 1.00 99.6 1.00 91i 1.00i 107i 0.99i 90i 0.98i 63i 1.30i
OECD .. .. .. .. 96i 1.00i 101i 0.99i 98i 1.00i 65i 1.17i
High-income OECD .. .. .. .. 96i 1.01i 102i 0.99i 103i 1.00i 76i 1.20i
High human development 93.6 1.01 98.4 1.01 .. .. .. .. .. .. .. ..
Medium human development 71.2 0.92 83.2 0.92 .. .. .. .. .. .. .. ..
Low human development 43.8 0.80 58.9 0.80 .. .. .. .. .. .. .. ..
High income .. .. .. .. 95i 1.01i 101i 0.99i 102i 1.00i 73i 1.21i
Middle income 86.5 0.99 96.2 0.99 92i 0.99i 110i 0.97i 78i 1.01i 28i 1.09i
Low income 48.8 0.82 65.8 0.82 76i 0.92i 99i 0.91i 41i 0.82i 7i 0.68i
World 72.7 0.92 82.5 0.92 85i 0.96i 104i 0.95i 64i 0.94i 25i 1.05i
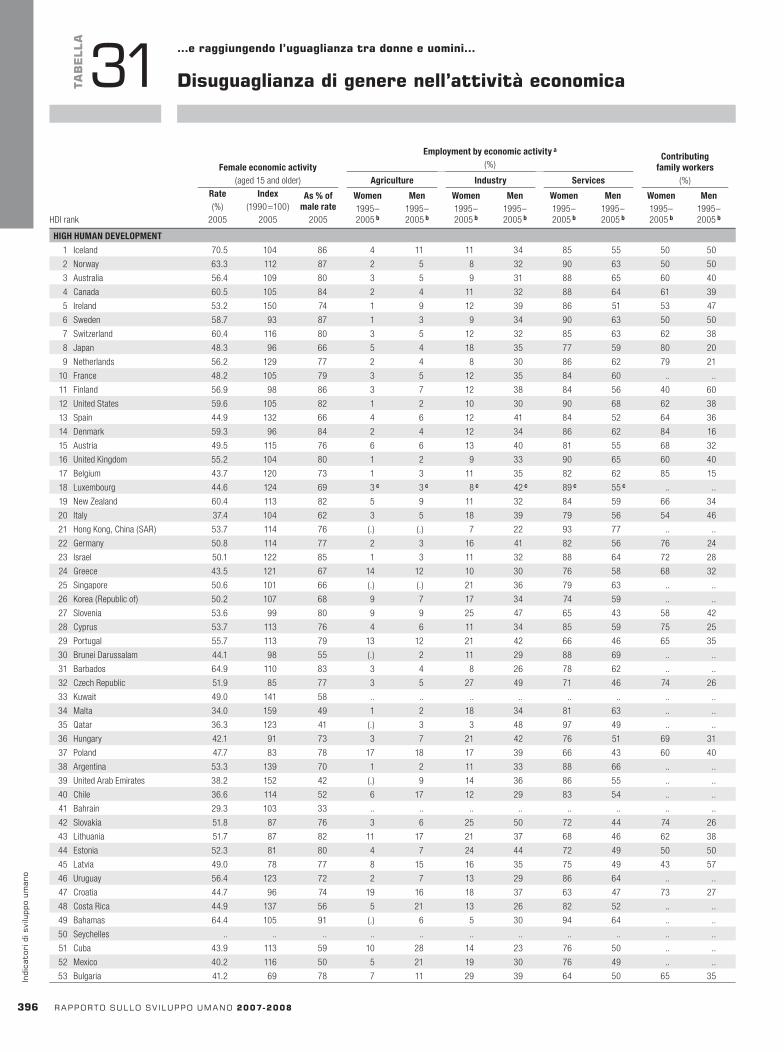
Femaleeconomicactivity(aged 15 and older)
Employmentbyeconomicactivitya
(%)Contributing
familyworkers(%)
HDI rank
Agriculture Industry ServicesRate(%)
2005
Index(1990=100)
2005
As%ofmalerate
2005
Women1995–2005b
Men1995–2005b
Women1995–2005b
Men1995–2005b
Women1995–2005b
Men1995–2005b
Women1995–2005b
Men1995–2005b
3�� rapportosullosv iluppoumano2007-2008
indi
cato
rid
isvi
lupp
oum
ano
TaB
ELLa
31 …eraggiungendol’uguaglianzatradonneeuomini…
Disuguaglianzadigenerenell’attivitàeconomica
HIGHHUMANDEVELOPMENT
1 Iceland 70.5 104 86 4 11 11 34 85 55 50 50
2 Norway 63.3 112 87 2 5 8 32 90 63 50 50
3 Australia 56.4 109 80 3 5 9 31 88 65 60 40
4 Canada 60.5 105 84 2 4 11 32 88 64 61 39
5 Ireland 53.2 150 74 1 9 12 39 86 51 53 47
6 Sweden 58.7 93 87 1 3 9 34 90 63 50 50
7 Switzerland 60.4 116 80 3 5 12 32 85 63 62 38
8 Japan 48.3 96 66 5 4 18 35 77 59 80 20
9 Netherlands 56.2 129 77 2 4 8 30 86 62 79 21
10 France 48.2 105 79 3 5 12 35 84 60 .. ..
11 Finland 56.9 98 86 3 7 12 38 84 56 40 60
12 United States 59.6 105 82 1 2 10 30 90 68 62 38
13 Spain 44.9 132 66 4 6 12 41 84 52 64 36
14 Denmark 59.3 96 84 2 4 12 34 86 62 84 16
15 Austria 49.5 115 76 6 6 13 40 81 55 68 32
16 United Kingdom 55.2 104 80 1 2 9 33 90 65 60 40
17 Belgium 43.7 120 73 1 3 11 35 82 62 85 15
18 Luxembourg 44.6 124 69 3c 3c 8c 42c 89c 55c .. ..
19 New Zealand 60.4 113 82 5 9 11 32 84 59 66 34
20 Italy 37.4 104 62 3 5 18 39 79 56 54 46
21 Hong Kong, China (SAR) 53.7 114 76 (.) (.) 7 22 93 77 .. ..
22 Germany 50.8 114 77 2 3 16 41 82 56 76 24
23 Israel 50.1 122 85 1 3 11 32 88 64 72 28
24 Greece 43.5 121 67 14 12 10 30 76 58 68 32
25 Singapore 50.6 101 66 (.) (.) 21 36 79 63 .. ..
26 Korea (Republic of) 50.2 107 68 9 7 17 34 74 59 .. ..
27 Slovenia 53.6 99 80 9 9 25 47 65 43 58 42
28 Cyprus 53.7 113 76 4 6 11 34 85 59 75 25
29 Portugal 55.7 113 79 13 12 21 42 66 46 65 35
30 Brunei Darussalam 44.1 98 55 (.) 2 11 29 88 69 .. ..
31 Barbados 64.9 110 83 3 4 8 26 78 62 .. ..
32 Czech Republic 51.9 85 77 3 5 27 49 71 46 74 26
33 Kuwait 49.0 141 58 .. .. .. .. .. .. .. ..
34 Malta 34.0 159 49 1 2 18 34 81 63 .. ..
35 Qatar 36.3 123 41 (.) 3 3 48 97 49 .. ..
36 Hungary 42.1 91 73 3 7 21 42 76 51 69 31
37 Poland 47.7 83 78 17 18 17 39 66 43 60 40
38 Argentina 53.3 139 70 1 2 11 33 88 66 .. ..
39 United Arab Emirates 38.2 152 42 (.) 9 14 36 86 55 .. ..
40 Chile 36.6 114 52 6 17 12 29 83 54 .. ..
41 Bahrain 29.3 103 33 .. .. .. .. .. .. .. ..
42 Slovakia 51.8 87 76 3 6 25 50 72 44 74 26
43 Lithuania 51.7 87 82 11 17 21 37 68 46 62 38
44 Estonia 52.3 81 80 4 7 24 44 72 49 50 50
45 Latvia 49.0 78 77 8 15 16 35 75 49 43 57
46 Uruguay 56.4 123 72 2 7 13 29 86 64 .. ..
47 Croatia 44.7 96 74 19 16 18 37 63 47 73 27
48 Costa Rica 44.9 137 56 5 21 13 26 82 52 .. ..
49 Bahamas 64.4 105 91 (.) 6 5 30 94 64 .. ..
50 Seychelles .. .. .. .. .. .. .. .. .. .. ..
51 Cuba 43.9 113 59 10 28 14 23 76 50 .. ..
52 Mexico 40.2 116 50 5 21 19 30 76 49 .. ..
53 Bulgaria 41.2 69 78 7 11 29 39 64 50 65 35

Femaleeconomicactivity(aged 15 and older)
Employmentbyeconomicactivitya
(%)Contributing
familyworkers(%)
HDI rank
Agriculture Industry ServicesRate(%)
2005
Index(1990=100)
2005
As%ofmalerate
2005
Women1995–2005b
Men1995–2005b
Women1995–2005b
Men1995–2005b
Women1995–2005b
Men1995–2005b
Women1995–2005b
Men1995–2005b
rapportosullosv iluppoumano2007-2008 3�7
indicatoridisviluppoumano
TaB
ELLa
31
54 Saint Kitts and Nevis .. .. .. .. .. .. .. .. .. .. ..
55 Tonga 47.5 126 63 .. .. .. .. .. .. .. ..
56 Libyan Arab Jamahiriya 32.1 168 40 .. .. .. .. .. .. .. ..
57 Antigua and Barbuda .. .. .. 3c 5c 7c 29c 87c 63c .. ..
58 Oman 22.7 149 28 5 7 14 11 80 82 .. ..
59 Trinidad and Tobago 46.7 112 61 2 10 14 37 84 53 .. ..
60 Romania 50.1 94 80 33 31 25 35 42 34 70 30
61 Saudi Arabia 17.6 118 22 1 5 1 24 98 71 .. ..
62 Panama 50.8 131 64 4 22 9 22 86 56 .. ..
63 Malaysia 46.5 105 57 11 16 27 35 62 49 .. ..
64 Belarus 52.5 87 82 .. .. .. .. .. .. .. ..
65 Mauritius 42.7 102 54 9 11 29 34 62 55 .. ..
66 Bosnia and Herzegovina 58.3 97 86 .. .. .. .. .. .. .. ..
67 Russian Federation 54.3 90 80 8 12 21 38 71 50 24 76
68 Albania 49.0 84 70 .. .. .. .. .. .. .. ..
69 Macedonia (TFYR) 40.8 85 63 19 20 30 34 51 46 54 46
70 Brazil 56.7 127 71 16 25 13 27 71 48 .. ..
MEDIUMHUMANDEVELOPMENT
71 Dominica .. .. .. 14 31 10 24 72 40 .. ..
72 Saint Lucia 54.0 116 67 9 14 11 23 62 45 .. ..
73 Kazakhstan 65.3 106 87 32 35 10 24 58 41 54 46
74 Venezuela (Bolivarian Republic of) 57.4 152 69 2 16 11 25 86 59 .. ..
75 Colombia 61.3 135 76 8 32 16 21 76 48 .. ..
76 Ukraine 49.6 86 79 17 21 21 38 62 41 50 50
77 Samoa 39.2 97 51 .. .. .. .. .. .. .. ..
78 Thailand 65.6 87 81 41 44 19 22 41 34 .. ..
79 Dominican Republic 46.4 127 57 2 23 15 24 83 53 .. ..
80 Belize 43.3 139 52 6 37 12 19 83 44 .. ..
81 China 68.8 94 83 .. .. .. .. .. .. .. ..
82 Grenada .. .. .. 10 17 12 32 77 46 .. ..
83 Armenia 47.9 67 79 .. .. .. .. .. .. 38 63
84 Turkey 27.7 81 36 52 22 15 28 33 50 67 33
85 Suriname 33.6 92 52 2 8 1 22 97 64 .. ..
86 Jordan 27.5 155 36 2 4 13 23 83 73 .. ..
87 Peru 59.1 126 72 (.) 1 13 31 86 68 .. ..
88 Lebanon 32.4 102 41 .. .. .. .. .. .. .. ..
89 Ecuador 60.0 184 73 4 11 12 27 84 62 .. ..
90 Philippines 54.7 115 66 25 45 12 17 64 39 .. ..
91 Tunisia 28.6 138 38 .. .. .. .. .. .. .. ..
92 Fiji 51.8 106 64 .. .. .. .. .. .. .. ..
93 Saint Vincent and the Grenadines 55.3 124 68 8 20 8 27 72 46 .. ..
94 Iran ( Islamic Republic of) 38.6 180 52 34 23 28 31 37 46 .. ..
95 Paraguay 65.1 126 77 20 39 10 19 70 42 .. ..
96 Georgia 50.1 73 66 57 52 4 14 38 34 65 35
97 Guyana 43.5 120 53 16 34 20 24 61 42 .. ..
98 Azerbaijan 60.2 95 82 37 41 9 15 54 44 .. ..
99 Sri Lanka 34.9 77 45 40 32 35 40 25 29 .. ..
100 Maldives 48.5 233 67 5 18 24 16 39 56 .. ..
101 Jamaica 54.1 83 73 9 25 5 27 86 48 .. ..
102 Cape Verde 34.0 81 45 .. .. .. .. .. .. .. ..
103 El Salvador 47.3 93 62 3 30 22 25 75 45 .. ..
104 Algeria 35.7 158 45 22 20 28 26 49 54 .. ..
105 Viet Nam 72.2 98 92 60 56 14 21 26 23 .. ..
106 Occupied Palestinian Territories 10.3 111 15 34 12 8 28 56 59 .. ..
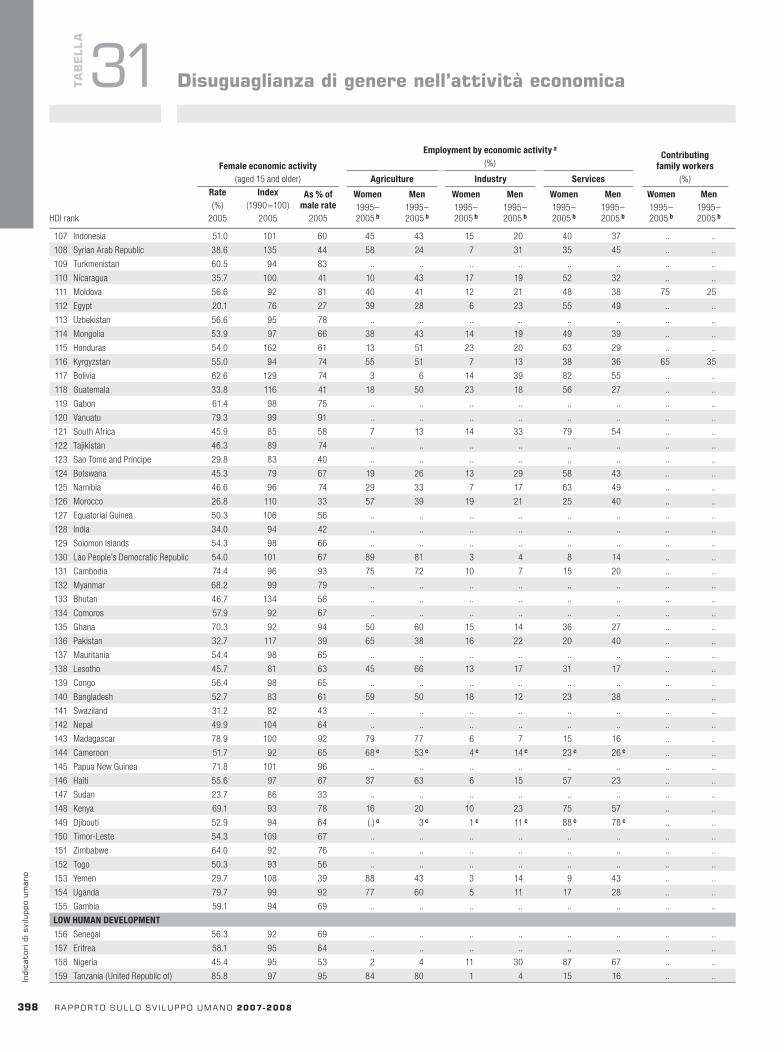
Femaleeconomicactivity(aged 15 and older)
Employmentbyeconomicactivitya
(%)Contributing
familyworkers(%)
HDI rank
Agriculture Industry ServicesRate(%)
2005
Index(1990=100)
2005
As%ofmalerate
2005
Women1995–2005b
Men1995–2005b
Women1995–2005b
Men1995–2005b
Women1995–2005b
Men1995–2005b
Women1995–2005b
Men1995–2005b
3�8 rapportosullosv iluppoumano2007-2008
indi
cato
rid
isvi
lupp
oum
ano
TaB
ELLa
31 Disuguaglianzadigenerenell’attivitàeconomica
107 Indonesia 51.0 101 60 45 43 15 20 40 37 .. ..
108 Syrian Arab Republic 38.6 135 44 58 24 7 31 35 45 .. ..
109 Turkmenistan 60.5 94 83 .. .. .. .. .. .. .. ..
110 Nicaragua 35.7 100 41 10 43 17 19 52 32 .. ..
111 Moldova 56.6 92 81 40 41 12 21 48 38 75 25
112 Egypt 20.1 76 27 39 28 6 23 55 49 .. ..
113 Uzbekistan 56.6 95 78 .. .. .. .. .. .. .. ..
114 Mongolia 53.9 97 66 38 43 14 19 49 39 .. ..
115 Honduras 54.0 162 61 13 51 23 20 63 29 .. ..
116 Kyrgyzstan 55.0 94 74 55 51 7 13 38 36 65 35
117 Bolivia 62.6 129 74 3 6 14 39 82 55 .. ..
118 Guatemala 33.8 116 41 18 50 23 18 56 27 .. ..
119 Gabon 61.4 98 75 .. .. .. .. .. .. .. ..
120 Vanuatu 79.3 99 91 .. .. .. .. .. .. .. ..
121 South Africa 45.9 85 58 7 13 14 33 79 54 .. ..
122 Tajikistan 46.3 89 74 .. .. .. .. .. .. .. ..
123 Sao Tome and Principe 29.8 83 40 .. .. .. .. .. .. .. ..
124 Botswana 45.3 79 67 19 26 13 29 58 43 .. ..
125 Namibia 46.6 96 74 29 33 7 17 63 49 .. ..
126 Morocco 26.8 110 33 57 39 19 21 25 40 .. ..
127 Equatorial Guinea 50.3 106 56 .. .. .. .. .. .. .. ..
128 India 34.0 94 42 .. .. .. .. .. .. .. ..
129 Solomon Islands 54.3 98 66 .. .. .. .. .. .. .. ..
130 Lao People’s Democratic Republic 54.0 101 67 89 81 3 4 8 14 .. ..
131 Cambodia 74.4 96 93 75 72 10 7 15 20 .. ..
132 Myanmar 68.2 99 79 .. .. .. .. .. .. .. ..
133 Bhutan 46.7 134 58 .. .. .. .. .. .. .. ..
134 Comoros 57.9 92 67 .. .. .. .. .. .. .. ..
135 Ghana 70.3 92 94 50 60 15 14 36 27 .. ..
136 Pakistan 32.7 117 39 65 38 16 22 20 40 .. ..
137 Mauritania 54.4 98 65 .. .. .. .. .. .. .. ..
138 Lesotho 45.7 81 63 45 66 13 17 31 17 .. ..
139 Congo 56.4 98 65 .. .. .. .. .. .. .. ..
140 Bangladesh 52.7 83 61 59 50 18 12 23 38 .. ..
141 Swaziland 31.2 82 43 .. .. .. .. .. .. .. ..
142 Nepal 49.9 104 64 .. .. .. .. .. .. .. ..
143 Madagascar 78.9 100 92 79 77 6 7 15 16 .. ..
144 Cameroon 51.7 92 65 68c 53c 4c 14c 23c 26c .. ..
145 Papua New Guinea 71.8 101 96 .. .. .. .. .. .. .. ..
146 Haiti 55.6 97 67 37 63 6 15 57 23 .. ..
147 Sudan 23.7 86 33 .. .. .. .. .. .. .. ..
148 Kenya 69.1 93 78 16 20 10 23 75 57 .. ..
149 Djibouti 52.9 94 64 (.)c 3c 1c 11c 88c 78c .. ..
150 Timor-Leste 54.3 109 67 .. .. .. .. .. .. .. ..
151 Zimbabwe 64.0 92 76 .. .. .. .. .. .. .. ..
152 Togo 50.3 93 56 .. .. .. .. .. .. .. ..
153 Yemen 29.7 108 39 88 43 3 14 9 43 .. ..
154 Uganda 79.7 99 92 77 60 5 11 17 28 .. ..
155 Gambia 59.1 94 69 .. .. .. .. .. .. .. ..
LOWHUMANDEVELOPMENT
156 Senegal 56.3 92 69 .. .. .. .. .. .. .. ..
157 Eritrea 58.1 95 64 .. .. .. .. .. .. .. ..
158 Nigeria 45.4 95 53 2 4 11 30 87 67 .. ..
159 Tanzania (United Republic of) 85.8 97 95 84 80 1 4 15 16 .. ..
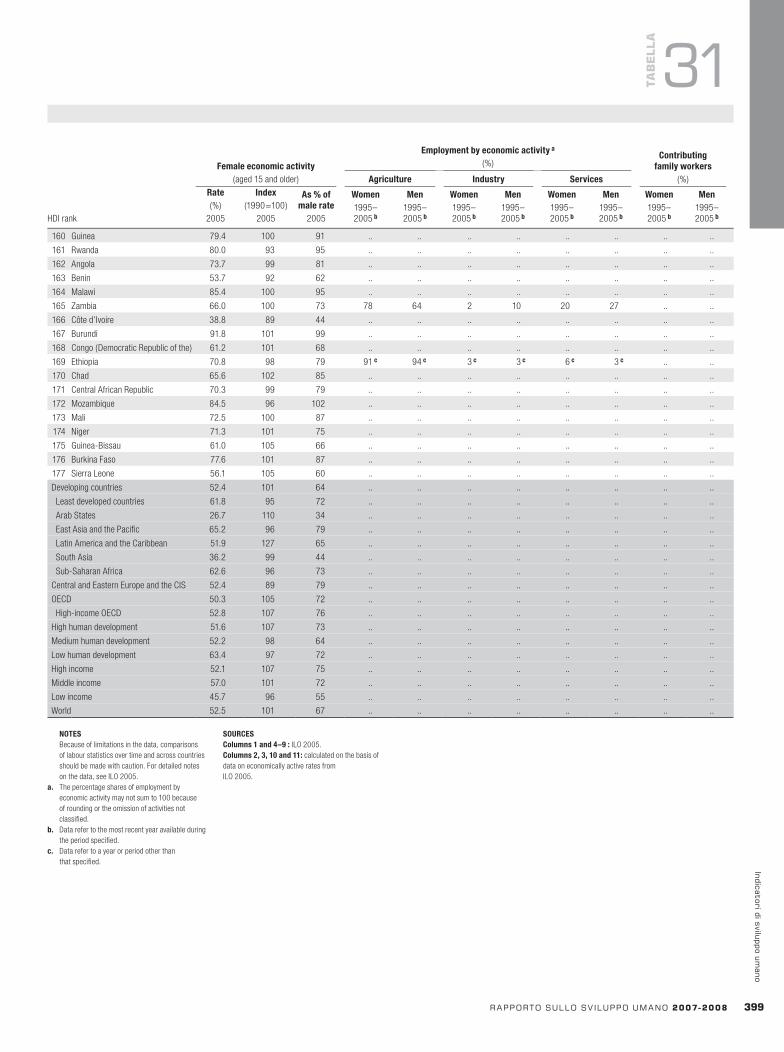
Femaleeconomicactivity(aged 15 and older)
Employmentbyeconomicactivitya
(%)Contributing
familyworkers(%)
HDI rank
Agriculture Industry ServicesRate(%)
2005
Index(1990=100)
2005
As%ofmalerate
2005
Women1995–2005b
Men1995–2005b
Women1995–2005b
Men1995–2005b
Women1995–2005b
Men1995–2005b
Women1995–2005b
Men1995–2005b
rapportosullosv iluppoumano2007-2008 3��
indicatoridisviluppoumano
TaB
ELLa
31
NOTES Because of limitations in the data, comparisons
of labour statistics over time and across countries should be made with caution. For detailed notes on the data, see ILO 2005.
a. The percentage shares of employment by economic activity may not sum to 100 because of rounding or the omission of activities not classified.
b. Data refer to the most recent year available during the period specified.
c. Data refer to a year or period other than that specified.
SOURCESColumns1and4–9: ILO 2005. Columns2,3,10and11: calculated on the basis of data on economically active rates from ILO 2005.
160 Guinea 79.4 100 91 .. .. .. .. .. .. .. ..
161 Rwanda 80.0 93 95 .. .. .. .. .. .. .. ..
162 Angola 73.7 99 81 .. .. .. .. .. .. .. ..
163 Benin 53.7 92 62 .. .. .. .. .. .. .. ..
164 Malawi 85.4 100 95 .. .. .. .. .. .. .. ..
165 Zambia 66.0 100 73 78 64 2 10 20 27 .. ..
166 Côte d’Ivoire 38.8 89 44 .. .. .. .. .. .. .. ..
167 Burundi 91.8 101 99 .. .. .. .. .. .. .. ..
168 Congo (Democratic Republic of the) 61.2 101 68 .. .. .. .. .. .. .. ..
169 Ethiopia 70.8 98 79 91c 94c 3c 3c 6c 3c .. ..
170 Chad 65.6 102 85 .. .. .. .. .. .. .. ..
171 Central African Republic 70.3 99 79 .. .. .. .. .. .. .. ..
172 Mozambique 84.5 96 102 .. .. .. .. .. .. .. ..
173 Mali 72.5 100 87 .. .. .. .. .. .. .. ..
174 Niger 71.3 101 75 .. .. .. .. .. .. .. ..
175 Guinea-Bissau 61.0 105 66 .. .. .. .. .. .. .. ..
176 Burkina Faso 77.6 101 87 .. .. .. .. .. .. .. ..
177 Sierra Leone 56.1 105 60 .. .. .. .. .. .. .. ..
Developing countries 52.4 101 64 .. .. .. .. .. .. .. ..
Least developed countries 61.8 95 72 .. .. .. .. .. .. .. ..
Arab States 26.7 110 34 .. .. .. .. .. .. .. ..
East Asia and the Pacific 65.2 96 79 .. .. .. .. .. .. .. ..
Latin America and the Caribbean 51.9 127 65 .. .. .. .. .. .. .. ..
South Asia 36.2 99 44 .. .. .. .. .. .. .. ..
Sub-Saharan Africa 62.6 96 73 .. .. .. .. .. .. .. ..
Central and Eastern Europe and the CIS 52.4 89 79 .. .. .. .. .. .. .. ..
OECD 50.3 105 72 .. .. .. .. .. .. .. ..
High-income OECD 52.8 107 76 .. .. .. .. .. .. .. ..
High human development 51.6 107 73 .. .. .. .. .. .. .. ..
Medium human development 52.2 98 64 .. .. .. .. .. .. .. ..
Low human development 63.4 97 72 .. .. .. .. .. .. .. ..
High income 52.1 107 75 .. .. .. .. .. .. .. ..
Middle income 57.0 101 72 .. .. .. .. .. .. .. ..
Low income 45.7 96 55 .. .. .. .. .. .. .. ..
World 52.5 101 67 .. .. .. .. .. .. .. ..
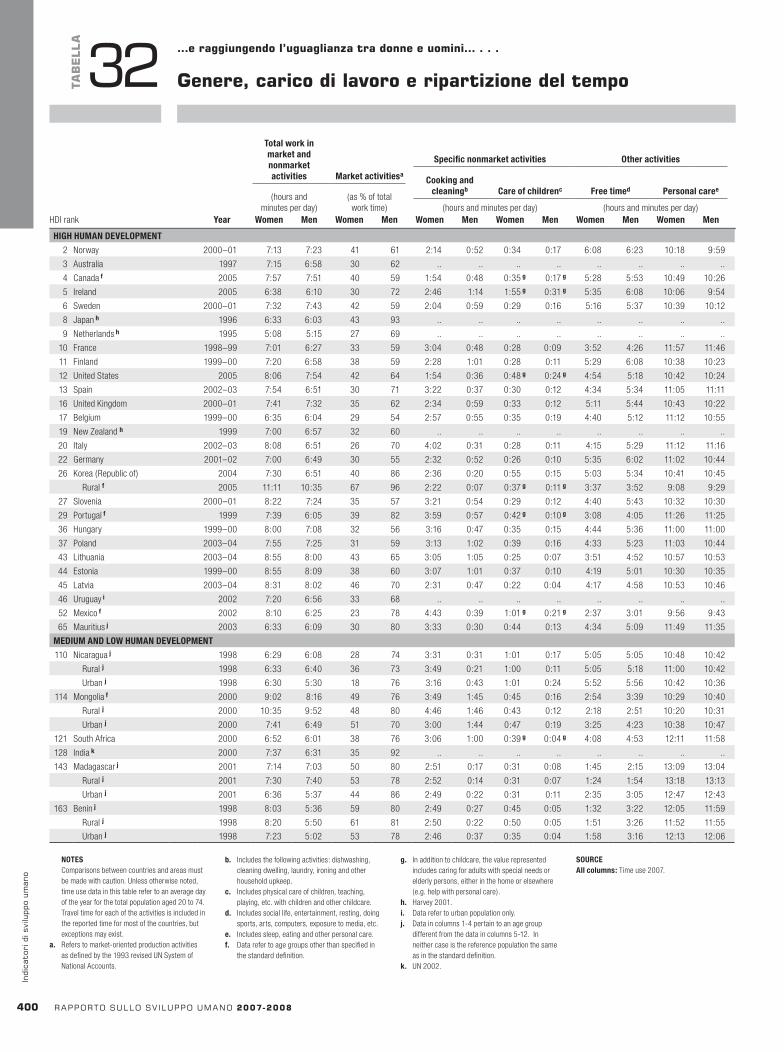
Yearwomenreceivedrighta Yearfirstwomanelected(E)orappointed(A)toparliament
Womeningovernmentat
ministeriallevel(% of total)b
2005
MDGSeatsinparliamentheldbywomen
(% of total)c
LowerorsinglehouseUpperhouse
orsenate2007Tovote
TostandforelectionHDI rank 1990 2007Year
Totalworkinmarketandnonmarketactivities Marketactivitiesa
Specificnonmarketactivities Otheractivities
Cookingandcleaningb Careofchildrenc Freetimed Personalcaree
(hours and minutes per day)
(as % of total work time) (hours and minutes per day) (hours and minutes per day)
HDI rank Women Men Women Men Women Men Women Men Women Men Women Men
400 rapportosullosv iluppoumano2007-2008
indi
cato
rid
isvi
lupp
oum
ano
TaB
ELLa
32 …eraggiungendol’uguaglianzatradonneeuomini…...
Genere,caricodilavoroeripartizionedeltempo
NOTES Comparisons between countries and areas must
be made with caution. Unless otherwise noted, time use data in this table refer to an average day of the year for the total population aged 20 to 74. Travel time for each of the activities is included in the reported time for most of the countries, but exceptions may exist.
a. Refers to market-oriented production activities as defined by the 1993 revised UN System of National Accounts.
b. Includes the following activities: dishwashing, cleaning dwelling, laundry, ironing and other household upkeep.
c. Includes physical care of children, teaching, playing, etc. with children and other childcare.
d. Includes social life, entertainment, resting, doing sports, arts, computers, exposure to media, etc.
e. Includes sleep, eating and other personal care. f. Data refer to age groups other than specified in
the standard definition.
g. In addition to childcare, the value represented includes caring for adults with special needs or elderly persons, either in the home or elsewhere (e.g. help with personal care).
h. Harvey 2001. i. Data refer to urban population only.j. Data in columns 1-4 pertain to an age group
different from the data in columns 5-12. In neither case is the reference population the same as in the standard definition.
k. UN 2002.
SOURCEAllcolumns: Time use 2007.
HIGHHUMANDEVELOPMENT
2 Norway 2000–01 7:13 7:23 41 61 2:14 0:52 0:34 0:17 6:08 6:23 10:18 9:59
3 Australia 1997 7:15 6:58 30 62 .. .. .. .. .. .. .. ..
4 Canadaf 2005 7:57 7:51 40 59 1:54 0:48 0:35g 0:17g 5:28 5:53 10:49 10:26
5 Ireland 2005 6:38 6:10 30 72 2:46 1:14 1:55g 0:31g 5:35 6:08 10:06 9:54
6 Sweden 2000–01 7:32 7:43 42 59 2:04 0:59 0:29 0:16 5:16 5:37 10:39 10:12
8 Japanh 1996 6:33 6:03 43 93 .. .. .. .. .. .. .. ..
9 Netherlandsh 1995 5:08 5:15 27 69 .. .. .. .. .. .. .. ..
10 France 1998–99 7:01 6:27 33 59 3:04 0:48 0:28 0:09 3:52 4:26 11:57 11:46
11 Finland 1999–00 7:20 6:58 38 59 2:28 1:01 0:28 0:11 5:29 6:08 10:38 10:23
12 United States 2005 8:06 7:54 42 64 1:54 0:36 0:48g 0:24g 4:54 5:18 10:42 10:24
13 Spain 2002–03 7:54 6:51 30 71 3:22 0:37 0:30 0:12 4:34 5:34 11:05 11:11
16 United Kingdom 2000–01 7:41 7:32 35 62 2:34 0:59 0:33 0:12 5:11 5:44 10:43 10:22
17 Belgium 1999–00 6:35 6:04 29 54 2:57 0:55 0:35 0:19 4:40 5:12 11:12 10:55
19 New Zealand h 1999 7:00 6:57 32 60 .. .. .. .. .. .. .. ..
20 Italy 2002–03 8:08 6:51 26 70 4:02 0:31 0:28 0:11 4:15 5:29 11:12 11:16
22 Germany 2001–02 7:00 6:49 30 55 2:32 0:52 0:26 0:10 5:35 6:02 11:02 10:44
26 Korea (Republic of) 2004 7:30 6:51 40 86 2:36 0:20 0:55 0:15 5:03 5:34 10:41 10:45
Rural f 2005 11:11 10:35 67 96 2:22 0:07 0:37g 0:11g 3:37 3:52 9:08 9:29
27 Slovenia 2000–01 8:22 7:24 35 57 3:21 0:54 0:29 0:12 4:40 5:43 10:32 10:30
29 Portugalf 1999 7:39 6:05 39 82 3:59 0:57 0:42g 0:10g 3:08 4:05 11:26 11:25
36 Hungary 1999–00 8:00 7:08 32 56 3:16 0:47 0:35 0:15 4:44 5:36 11:00 11:00
37 Poland 2003–04 7:55 7:25 31 59 3:13 1:02 0:39 0:16 4:33 5:23 11:03 10:44
43 Lithuania 2003–04 8:55 8:00 43 65 3:05 1:05 0:25 0:07 3:51 4:52 10:57 10:53
44 Estonia 1999–00 8:55 8:09 38 60 3:07 1:01 0:37 0:10 4:19 5:01 10:30 10:35
45 Latvia 2003–04 8:31 8:02 46 70 2:31 0:47 0:22 0:04 4:17 4:58 10:53 10:46
46 Uruguayi 2002 7:20 6:56 33 68 .. .. .. .. .. .. .. ..
52 Mexicof 2002 8:10 6:25 23 78 4:43 0:39 1:01g 0:21g 2:37 3:01 9:56 9:43
65 Mauritiusj 2003 6:33 6:09 30 80 3:33 0:30 0:44 0:13 4:34 5:09 11:49 11:35
MEDIUMANDLOWHUMANDEVELOPMENT
110 Nicaraguaj 1998 6:29 6:08 28 74 3:31 0:31 1:01 0:17 5:05 5:05 10:48 10:42
Rural j 1998 6:33 6:40 36 73 3:49 0:21 1:00 0:11 5:05 5:18 11:00 10:42
Urban j 1998 6:30 5:30 18 76 3:16 0:43 1:01 0:24 5:52 5:56 10:42 10:36
114 Mongoliaf 2000 9:02 8:16 49 76 3:49 1:45 0:45 0:16 2:54 3:39 10:29 10:40
Rural j 2000 10:35 9:52 48 80 4:46 1:46 0:43 0:12 2:18 2:51 10:20 10:31
Urban j 2000 7:41 6:49 51 70 3:00 1:44 0:47 0:19 3:25 4:23 10:38 10:47
121 South Africa 2000 6:52 6:01 38 76 3:06 1:00 0:39g 0:04g 4:08 4:53 12:11 11:58
128 Indiak 2000 7:37 6:31 35 92 .. .. .. .. .. .. .. ..
143 Madagascarj 2001 7:14 7:03 50 80 2:51 0:17 0:31 0:08 1:45 2:15 13:09 13:04
Rural j 2001 7:30 7:40 53 78 2:52 0:14 0:31 0:07 1:24 1:54 13:18 13:13
Urban j 2001 6:36 5:37 44 86 2:49 0:22 0:31 0:11 2:35 3:05 12:47 12:43
163 Beninj 1998 8:03 5:36 59 80 2:49 0:27 0:45 0:05 1:32 3:22 12:05 11:59
Rural j 1998 8:20 5:50 61 81 2:50 0:22 0:50 0:05 1:51 3:26 11:52 11:55
Urban j 1998 7:23 5:02 53 78 2:46 0:37 0:35 0:04 1:58 3:16 12:13 12:06
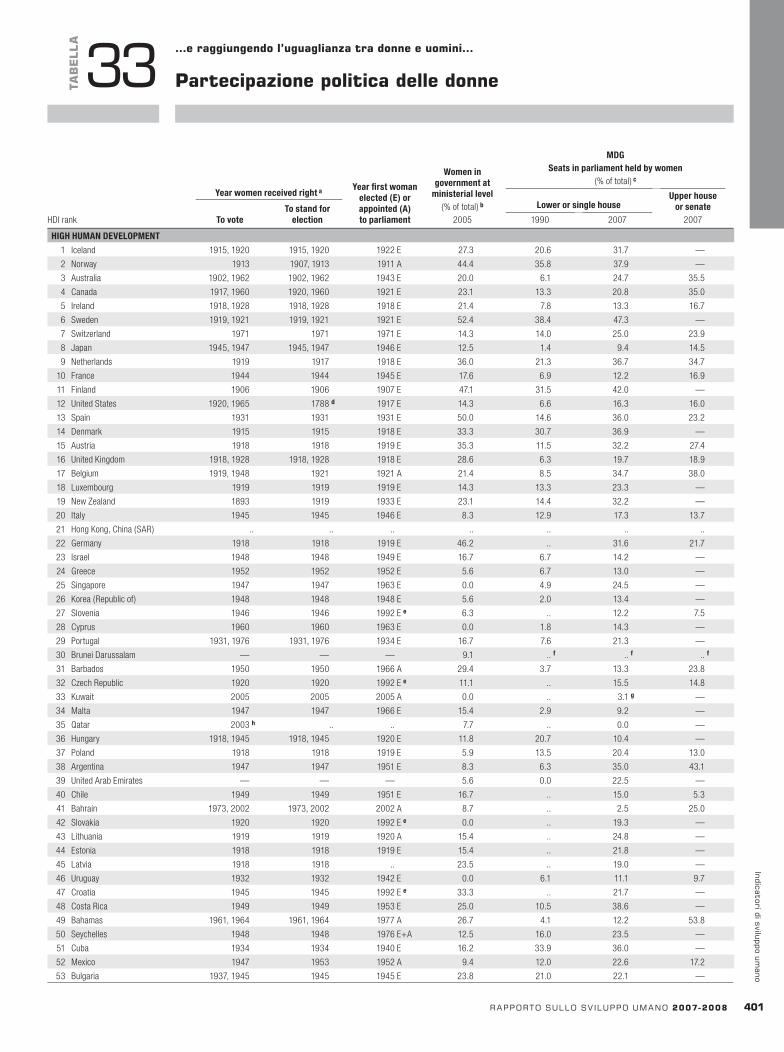
Yearwomenreceivedrighta Yearfirstwomanelected(E)orappointed(A)toparliament
Womeningovernmentat
ministeriallevel(% of total)b
2005
MDGSeatsinparliamentheldbywomen
(% of total)c
LowerorsinglehouseUpperhouse
orsenate2007Tovote
TostandforelectionHDI rank 1990 2007
rapportosullosv iluppoumano2007-2008 401
indicatoridisviluppoumano
TaB
ELLa
33 …eraggiungendol’uguaglianzatradonneeuomini…
partecipazionepoliticadelledonne
HIGHHUMANDEVELOPMENT
1 Iceland 1915, 1920 1915, 1920 1922 E 27.3 20.6 31.7 —
2 Norway 1913 1907, 1913 1911 A 44.4 35.8 37.9 —
3 Australia 1902, 1962 1902, 1962 1943 E 20.0 6.1 24.7 35.5
4 Canada 1917, 1960 1920, 1960 1921 E 23.1 13.3 20.8 35.0
5 Ireland 1918, 1928 1918, 1928 1918 E 21.4 7.8 13.3 16.7
6 Sweden 1919, 1921 1919, 1921 1921 E 52.4 38.4 47.3 —
7 Switzerland 1971 1971 1971 E 14.3 14.0 25.0 23.9
8 Japan 1945, 1947 1945, 1947 1946 E 12.5 1.4 9.4 14.5
9 Netherlands 1919 1917 1918 E 36.0 21.3 36.7 34.7
10 France 1944 1944 1945 E 17.6 6.9 12.2 16.9
11 Finland 1906 1906 1907 E 47.1 31.5 42.0 —
12 United States 1920, 1965 1788 d 1917 E 14.3 6.6 16.3 16.0
13 Spain 1931 1931 1931 E 50.0 14.6 36.0 23.2
14 Denmark 1915 1915 1918 E 33.3 30.7 36.9 —
15 Austria 1918 1918 1919 E 35.3 11.5 32.2 27.4
16 United Kingdom 1918, 1928 1918, 1928 1918 E 28.6 6.3 19.7 18.9
17 Belgium 1919, 1948 1921 1921 A 21.4 8.5 34.7 38.0
18 Luxembourg 1919 1919 1919 E 14.3 13.3 23.3 —
19 New Zealand 1893 1919 1933 E 23.1 14.4 32.2 —
20 Italy 1945 1945 1946 E 8.3 12.9 17.3 13.7
21 Hong Kong, China (SAR) .. .. .. .. .. .. ..
22 Germany 1918 1918 1919 E 46.2 .. 31.6 21.7
23 Israel 1948 1948 1949 E 16.7 6.7 14.2 —
24 Greece 1952 1952 1952 E 5.6 6.7 13.0 —
25 Singapore 1947 1947 1963 E 0.0 4.9 24.5 —
26 Korea (Republic of) 1948 1948 1948 E 5.6 2.0 13.4 —
27 Slovenia 1946 1946 1992 E e 6.3 .. 12.2 7.5
28 Cyprus 1960 1960 1963 E 0.0 1.8 14.3 —
29 Portugal 1931, 1976 1931, 1976 1934 E 16.7 7.6 21.3 —
30 Brunei Darussalam — — — 9.1 .. f .. f .. f
31 Barbados 1950 1950 1966 A 29.4 3.7 13.3 23.8
32 Czech Republic 1920 1920 1992 E e 11.1 .. 15.5 14.8
33 Kuwait 2005 2005 2005 A 0.0 .. 3.1 g —
34 Malta 1947 1947 1966 E 15.4 2.9 9.2 —
35 Qatar 2003 h .. .. 7.7 .. 0.0 —
36 Hungary 1918, 1945 1918, 1945 1920 E 11.8 20.7 10.4 —
37 Poland 1918 1918 1919 E 5.9 13.5 20.4 13.0
38 Argentina 1947 1947 1951 E 8.3 6.3 35.0 43.1
39 United Arab Emirates — — — 5.6 0.0 22.5 —
40 Chile 1949 1949 1951 E 16.7 .. 15.0 5.3
41 Bahrain 1973, 2002 1973, 2002 2002 A 8.7 .. 2.5 25.0
42 Slovakia 1920 1920 1992 E e 0.0 .. 19.3 —
43 Lithuania 1919 1919 1920 A 15.4 .. 24.8 —
44 Estonia 1918 1918 1919 E 15.4 .. 21.8 —
45 Latvia 1918 1918 .. 23.5 .. 19.0 —
46 Uruguay 1932 1932 1942 E 0.0 6.1 11.1 9.7
47 Croatia 1945 1945 1992 E e 33.3 .. 21.7 —
48 Costa Rica 1949 1949 1953 E 25.0 10.5 38.6 —
49 Bahamas 1961, 1964 1961, 1964 1977 A 26.7 4.1 12.2 53.8
50 Seychelles 1948 1948 1976 E+A 12.5 16.0 23.5 —
51 Cuba 1934 1934 1940 E 16.2 33.9 36.0 —
52 Mexico 1947 1953 1952 A 9.4 12.0 22.6 17.2
53 Bulgaria 1937, 1945 1945 1945 E 23.8 21.0 22.1 —
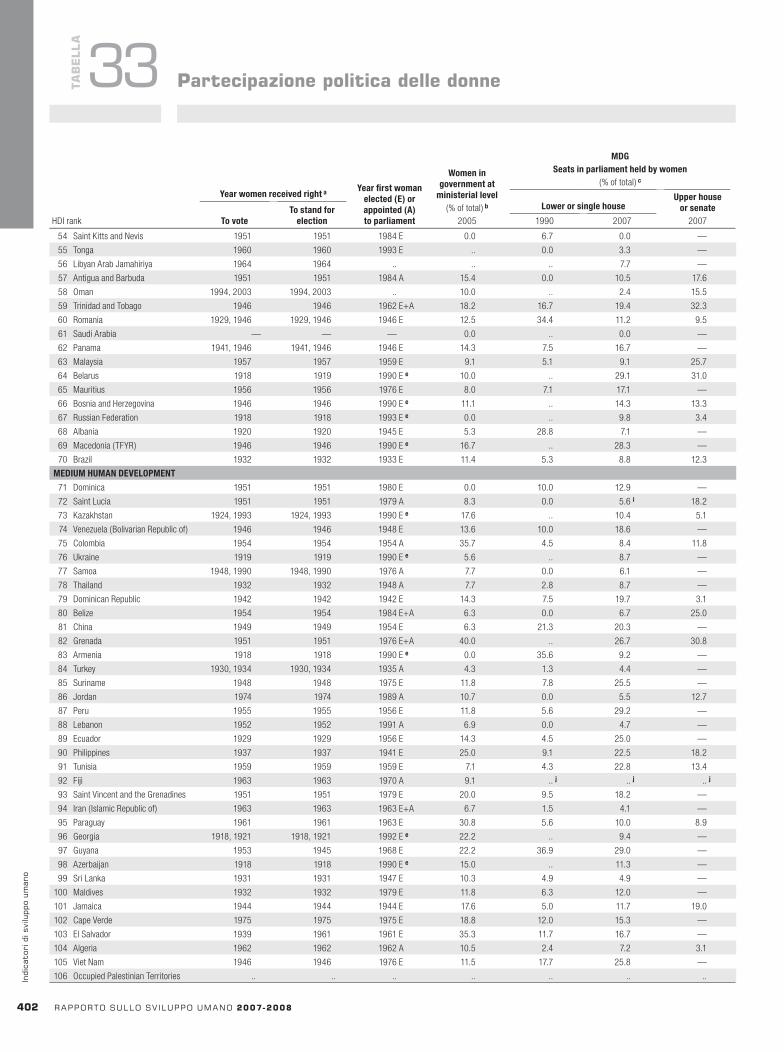
Yearwomenreceivedrighta Yearfirstwomanelected(E)orappointed(A)toparliament
Womeningovernmentat
ministeriallevel(% of total)b
2005
MDGSeatsinparliamentheldbywomen
(% of total)c
LowerorsinglehouseUpperhouse
orsenate2007Tovote
TostandforelectionHDI rank 1990 2007
402 rapportosullosv iluppoumano2007-2008
indi
cato
rid
isvi
lupp
oum
ano
TaB
ELLa
33 partecipazionepoliticadelledonne
54 Saint Kitts and Nevis 1951 1951 1984 E 0.0 6.7 0.0 —
55 Tonga 1960 1960 1993 E .. 0.0 3.3 —
56 Libyan Arab Jamahiriya 1964 1964 .. .. .. 7.7 —
57 Antigua and Barbuda 1951 1951 1984 A 15.4 0.0 10.5 17.6
58 Oman 1994, 2003 1994, 2003 .. 10.0 .. 2.4 15.5
59 Trinidad and Tobago 1946 1946 1962 E+A 18.2 16.7 19.4 32.3
60 Romania 1929, 1946 1929, 1946 1946 E 12.5 34.4 11.2 9.5
61 Saudi Arabia — — — 0.0 .. 0.0 —
62 Panama 1941, 1946 1941, 1946 1946 E 14.3 7.5 16.7 —
63 Malaysia 1957 1957 1959 E 9.1 5.1 9.1 25.7
64 Belarus 1918 1919 1990 E e 10.0 .. 29.1 31.0
65 Mauritius 1956 1956 1976 E 8.0 7.1 17.1 —
66 Bosnia and Herzegovina 1946 1946 1990 E e 11.1 .. 14.3 13.3
67 Russian Federation 1918 1918 1993 E e 0.0 .. 9.8 3.4
68 Albania 1920 1920 1945 E 5.3 28.8 7.1 —
69 Macedonia (TFYR) 1946 1946 1990 E e 16.7 .. 28.3 —
70 Brazil 1932 1932 1933 E 11.4 5.3 8.8 12.3
MEDIUMHUMANDEVELOPMENT
71 Dominica 1951 1951 1980 E 0.0 10.0 12.9 —
72 Saint Lucia 1951 1951 1979 A 8.3 0.0 5.6 i 18.2
73 Kazakhstan 1924, 1993 1924, 1993 1990 E e 17.6 .. 10.4 5.1
74 Venezuela (Bolivarian Republic of) 1946 1946 1948 E 13.6 10.0 18.6 —
75 Colombia 1954 1954 1954 A 35.7 4.5 8.4 11.8
76 Ukraine 1919 1919 1990 E e 5.6 .. 8.7 —
77 Samoa 1948, 1990 1948, 1990 1976 A 7.7 0.0 6.1 —
78 Thailand 1932 1932 1948 A 7.7 2.8 8.7 —
79 Dominican Republic 1942 1942 1942 E 14.3 7.5 19.7 3.1
80 Belize 1954 1954 1984 E+A 6.3 0.0 6.7 25.0
81 China 1949 1949 1954 E 6.3 21.3 20.3 —
82 Grenada 1951 1951 1976 E+A 40.0 .. 26.7 30.8
83 Armenia 1918 1918 1990 E e 0.0 35.6 9.2 —
84 Turkey 1930, 1934 1930, 1934 1935 A 4.3 1.3 4.4 —
85 Suriname 1948 1948 1975 E 11.8 7.8 25.5 —
86 Jordan 1974 1974 1989 A 10.7 0.0 5.5 12.7
87 Peru 1955 1955 1956 E 11.8 5.6 29.2 —
88 Lebanon 1952 1952 1991 A 6.9 0.0 4.7 —
89 Ecuador 1929 1929 1956 E 14.3 4.5 25.0 —
90 Philippines 1937 1937 1941 E 25.0 9.1 22.5 18.2
91 Tunisia 1959 1959 1959 E 7.1 4.3 22.8 13.4
92 Fiji 1963 1963 1970 A 9.1 .. j .. j .. j
93 Saint Vincent and the Grenadines 1951 1951 1979 E 20.0 9.5 18.2 —
94 Iran ( Islamic Republic of) 1963 1963 1963 E+A 6.7 1.5 4.1 —
95 Paraguay 1961 1961 1963 E 30.8 5.6 10.0 8.9
96 Georgia 1918, 1921 1918, 1921 1992 E e 22.2 .. 9.4 —
97 Guyana 1953 1945 1968 E 22.2 36.9 29.0 —
98 Azerbaijan 1918 1918 1990 E e 15.0 .. 11.3 —
99 Sri Lanka 1931 1931 1947 E 10.3 4.9 4.9 —
100 Maldives 1932 1932 1979 E 11.8 6.3 12.0 —
101 Jamaica 1944 1944 1944 E 17.6 5.0 11.7 19.0
102 Cape Verde 1975 1975 1975 E 18.8 12.0 15.3 —
103 El Salvador 1939 1961 1961 E 35.3 11.7 16.7 —
104 Algeria 1962 1962 1962 A 10.5 2.4 7.2 3.1
105 Viet Nam 1946 1946 1976 E 11.5 17.7 25.8 —
106 Occupied Palestinian Territories .. .. .. .. .. .. ..
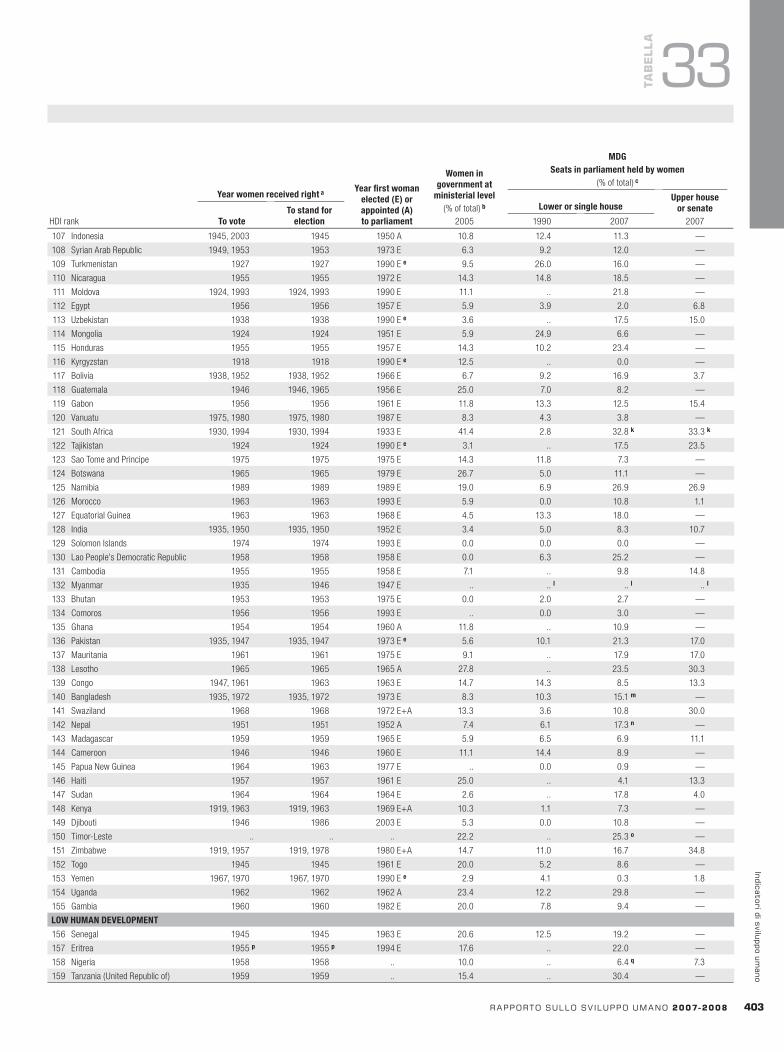
Yearwomenreceivedrighta Yearfirstwomanelected(E)orappointed(A)toparliament
Womeningovernmentat
ministeriallevel(% of total)b
2005
MDGSeatsinparliamentheldbywomen
(% of total)c
LowerorsinglehouseUpperhouse
orsenate2007Tovote
TostandforelectionHDI rank 1990 2007
rapportosullosv iluppoumano2007-2008 403
indicatoridisviluppoumano
TaB
ELLa
33
107 Indonesia 1945, 2003 1945 1950 A 10.8 12.4 11.3 —
108 Syrian Arab Republic 1949, 1953 1953 1973 E 6.3 9.2 12.0 —
109 Turkmenistan 1927 1927 1990 E e 9.5 26.0 16.0 —
110 Nicaragua 1955 1955 1972 E 14.3 14.8 18.5 —
111 Moldova 1924, 1993 1924, 1993 1990 E 11.1 .. 21.8 —
112 Egypt 1956 1956 1957 E 5.9 3.9 2.0 6.8
113 Uzbekistan 1938 1938 1990 E e 3.6 .. 17.5 15.0
114 Mongolia 1924 1924 1951 E 5.9 24.9 6.6 —
115 Honduras 1955 1955 1957 E 14.3 10.2 23.4 —
116 Kyrgyzstan 1918 1918 1990 E e 12.5 .. 0.0 —
117 Bolivia 1938, 1952 1938, 1952 1966 E 6.7 9.2 16.9 3.7
118 Guatemala 1946 1946, 1965 1956 E 25.0 7.0 8.2 —
119 Gabon 1956 1956 1961 E 11.8 13.3 12.5 15.4
120 Vanuatu 1975, 1980 1975, 1980 1987 E 8.3 4.3 3.8 —
121 South Africa 1930, 1994 1930, 1994 1933 E 41.4 2.8 32.8 k 33.3 k
122 Tajikistan 1924 1924 1990 E e 3.1 .. 17.5 23.5
123 Sao Tome and Principe 1975 1975 1975 E 14.3 11.8 7.3 —
124 Botswana 1965 1965 1979 E 26.7 5.0 11.1 —
125 Namibia 1989 1989 1989 E 19.0 6.9 26.9 26.9
126 Morocco 1963 1963 1993 E 5.9 0.0 10.8 1.1
127 Equatorial Guinea 1963 1963 1968 E 4.5 13.3 18.0 —
128 India 1935, 1950 1935, 1950 1952 E 3.4 5.0 8.3 10.7
129 Solomon Islands 1974 1974 1993 E 0.0 0.0 0.0 —
130 Lao People’s Democratic Republic 1958 1958 1958 E 0.0 6.3 25.2 —
131 Cambodia 1955 1955 1958 E 7.1 .. 9.8 14.8
132 Myanmar 1935 1946 1947 E .. .. l .. l .. l
133 Bhutan 1953 1953 1975 E 0.0 2.0 2.7 —
134 Comoros 1956 1956 1993 E .. 0.0 3.0 —
135 Ghana 1954 1954 1960 A 11.8 .. 10.9 —
136 Pakistan 1935, 1947 1935, 1947 1973 E e 5.6 10.1 21.3 17.0
137 Mauritania 1961 1961 1975 E 9.1 .. 17.9 17.0
138 Lesotho 1965 1965 1965 A 27.8 .. 23.5 30.3
139 Congo 1947, 1961 1963 1963 E 14.7 14.3 8.5 13.3
140 Bangladesh 1935, 1972 1935, 1972 1973 E 8.3 10.3 15.1 m —
141 Swaziland 1968 1968 1972 E+A 13.3 3.6 10.8 30.0
142 Nepal 1951 1951 1952 A 7.4 6.1 17.3 n —
143 Madagascar 1959 1959 1965 E 5.9 6.5 6.9 11.1
144 Cameroon 1946 1946 1960 E 11.1 14.4 8.9 —
145 Papua New Guinea 1964 1963 1977 E .. 0.0 0.9 —
146 Haiti 1957 1957 1961 E 25.0 .. 4.1 13.3
147 Sudan 1964 1964 1964 E 2.6 .. 17.8 4.0
148 Kenya 1919, 1963 1919, 1963 1969 E+A 10.3 1.1 7.3 —
149 Djibouti 1946 1986 2003 E 5.3 0.0 10.8 —
150 Timor-Leste .. .. .. 22.2 .. 25.3 o —
151 Zimbabwe 1919, 1957 1919, 1978 1980 E+A 14.7 11.0 16.7 34.8
152 Togo 1945 1945 1961 E 20.0 5.2 8.6 —
153 Yemen 1967, 1970 1967, 1970 1990 E e 2.9 4.1 0.3 1.8
154 Uganda 1962 1962 1962 A 23.4 12.2 29.8 —
155 Gambia 1960 1960 1982 E 20.0 7.8 9.4 —
LOWHUMANDEVELOPMENT
156 Senegal 1945 1945 1963 E 20.6 12.5 19.2 —
157 Eritrea 1955 p 1955 p 1994 E 17.6 .. 22.0 —
158 Nigeria 1958 1958 .. 10.0 .. 6.4 q 7.3
159 Tanzania (United Republic of) 1959 1959 .. 15.4 .. 30.4 —
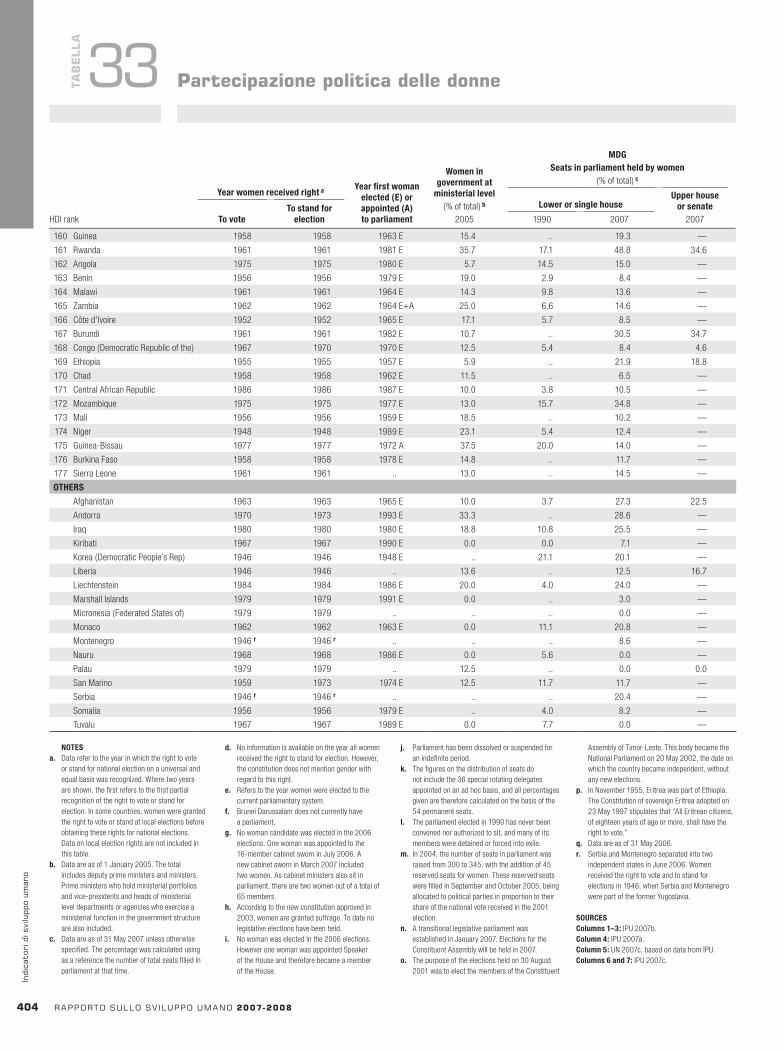
HDI rank
InternationalConventiononthe
PreventionandPunishmentoftheCrimeofGenocide
1948
InternationalConventionontheEliminationofAllFormsofRacialDiscrimination
1965
InternationalCovenant
onCivilandPoliticalRights
1966
InternationalCovenantonEconomic,Socialand
CulturalRights1966
ConventionontheEliminationofAllFormsofDiscriminationagainstWomen
1979
ConventionagainstTorture
andOtherCruel,InhumanorDegradingTreatmentorPunishment
1984
ConventionontheRightsoftheChild
1989
Yearwomenreceivedrighta Yearfirstwomanelected(E)orappointed(A)toparliament
Womeningovernmentat
ministeriallevel(% of total)b
2005
MDGSeatsinparliamentheldbywomen
(% of total)c
LowerorsinglehouseUpperhouse
orsenate2007Tovote
TostandforelectionHDI rank 1990 2007
404 rapportosullosv iluppoumano2007-2008
indi
cato
rid
isvi
lupp
oum
ano
TaB
ELLa
33 partecipazionepoliticadelledonne
NOTESa. Data refer to the year in which the right to vote
or stand for national election on a universal and equal basis was recognized. Where two years are shown, the first refers to the first partial recognition of the right to vote or stand for election. In some countries, women were granted the right to vote or stand at local elections before obtaining these rights for national elections. Data on local election rights are not included in this table.
b. Data are as of 1 January 2005. The total includes deputy prime ministers and ministers. Prime ministers who hold ministerial portfolios and vice-presidents and heads of ministerial level departments or agencies who exercise a ministerial function in the government structure are also included.
c. Data are as of 31 May 2007 unless otherwise specified. The percentage was calculated using as a reference the number of total seats filled in parliament at that time.
d. No information is available on the year all women received the right to stand for election. However, the constitution does not mention gender with regard to this right.
e. Refers to the year women were elected to the current parliamentary system.
f. Brunei Darussalam does not currently have a parliament.
g. No woman candidate was elected in the 2006 elections. One woman was appointed to the 16-member cabinet sworn in July 2006. A new cabinet sworn in March 2007 included two women. As cabinet ministers also sit in parliament, there are two women out of a total of 65 members.
h. According to the new constitution approved in 2003, women are granted suffrage. To date no legislative elections have been held.
i. No woman was elected in the 2006 elections. However one woman was appointed Speaker of the House and therefore became a member of the House.
j. Parliament has been dissolved or suspended for an indefinite period.
k. The figures on the distribution of seats do not include the 36 special rotating delegates appointed on an ad hoc basis, and all percentages given are therefore calculated on the basis of the 54 permanent seats.
l. The parliament elected in 1990 has never been convened nor authorized to sit, and many of its members were detained or forced into exile.
m. In 2004, the number of seats in parliament was raised from 300 to 345, with the addition of 45 reserved seats for women. These reserved seats were filled in September and October 2005, being allocated to political parties in proportion to their share of the national vote received in the 2001 election.
n. A transitional legislative parliament was established in January 2007. Elections for the Constituent Assembly will be held in 2007.
o. The purpose of the elections held on 30 August 2001 was to elect the members of the Constituent
Assembly of Timor-Leste. This body became the National Parliament on 20 May 2002, the date on which the country became independent, without any new elections.
p. In November 1955, Eritrea was part of Ethiopia. The Constitution of sovereign Eritrea adopted on 23 May 1997 stipulates that “All Eritrean citizens, of eighteen years of age or more, shall have the right to vote.”
q. Data are as of 31 May 2006.r. Serbia and Montenegro separated into two
independent states in June 2006. Women received the right to vote and to stand for elections in 1946, when Serbia and Montenegro were part of the former Yugoslavia.
SOURCESColumns1–3: IPU 2007b.Column4: IPU 2007a. Column5: UN 2007c, based on data from IPU.Columns6and7: IPU 2007c.
160 Guinea 1958 1958 1963 E 15.4 .. 19.3 —
161 Rwanda 1961 1961 1981 E 35.7 17.1 48.8 34.6
162 Angola 1975 1975 1980 E 5.7 14.5 15.0 —
163 Benin 1956 1956 1979 E 19.0 2.9 8.4 —
164 Malawi 1961 1961 1964 E 14.3 9.8 13.6 —
165 Zambia 1962 1962 1964 E+A 25.0 6.6 14.6 —
166 Côte d’Ivoire 1952 1952 1965 E 17.1 5.7 8.5 —
167 Burundi 1961 1961 1982 E 10.7 .. 30.5 34.7
168 Congo (Democratic Republic of the) 1967 1970 1970 E 12.5 5.4 8.4 4.6
169 Ethiopia 1955 1955 1957 E 5.9 .. 21.9 18.8
170 Chad 1958 1958 1962 E 11.5 .. 6.5 —
171 Central African Republic 1986 1986 1987 E 10.0 3.8 10.5 —
172 Mozambique 1975 1975 1977 E 13.0 15.7 34.8 —
173 Mali 1956 1956 1959 E 18.5 .. 10.2 —
174 Niger 1948 1948 1989 E 23.1 5.4 12.4 —
175 Guinea-Bissau 1977 1977 1972 A 37.5 20.0 14.0 —
176 Burkina Faso 1958 1958 1978 E 14.8 .. 11.7 —
177 Sierra Leone 1961 1961 .. 13.0 .. 14.5 —
OTHERS
Afghanistan 1963 1963 1965 E 10.0 3.7 27.3 22.5
Andorra 1970 1973 1993 E 33.3 .. 28.6 —
Iraq 1980 1980 1980 E 18.8 10.8 25.5 —
Kiribati 1967 1967 1990 E 0.0 0.0 7.1 —
Korea (Democratic People’s Rep) 1946 1946 1948 E .. 21.1 20.1 —
Liberia 1946 1946 .. 13.6 .. 12.5 16.7
Liechtenstein 1984 1984 1986 E 20.0 4.0 24.0 —
Marshall Islands 1979 1979 1991 E 0.0 .. 3.0 —
Micronesia (Federated States of) 1979 1979 .. .. .. 0.0 —
Monaco 1962 1962 1963 E 0.0 11.1 20.8 —
Montenegro 1946 r 1946 r .. .. .. 8.6 —
Nauru 1968 1968 1986 E 0.0 5.6 0.0 —
Palau 1979 1979 .. 12.5 .. 0.0 0.0
San Marino 1959 1973 1974 E 12.5 11.7 11.7 —
Serbia 1946 r 1946 r .. .. .. 20.4 —
Somalia 1956 1956 1979 E .. 4.0 8.2 —
Tuvalu 1967 1967 1989 E 0.0 7.7 0.0 —

HDI rank
InternationalConventiononthe
PreventionandPunishmentoftheCrimeofGenocide
1948
InternationalConventionontheEliminationofAllFormsofRacialDiscrimination
1965
InternationalCovenant
onCivilandPoliticalRights
1966
InternationalCovenantonEconomic,Socialand
CulturalRights1966
ConventionontheEliminationofAllFormsofDiscriminationagainstWomen
1979
ConventionagainstTorture
andOtherCruel,InhumanorDegradingTreatmentorPunishment
1984
ConventionontheRightsoftheChild
1989
rapportosullosv iluppoumano2007-2008 40�
indicatoridisviluppoumano
TaB
ELLa
34Strumentiperidirittiumaniedeilavoratori
Statodeiprincipalistrumentiinternazionaliperlatuteladeidirittiumani
HIGHHUMANDEVELOPMENT
1 Iceland 1949 1967 1979 1979 1985 1996 1992
2 Norway 1949 1970 1972 1972 1981 1986 1991
3 Australia 1949 1975 1980 1975 1983 1989 1990
4 Canada 1952 1970 1976 1976 1981 1987 1991
5 Ireland 1976 2000 1989 1989 1985 2002 1992
6 Sweden 1952 1971 1971 1971 1980 1986 1990
7 Switzerland 2000 1994 1992 1992 1997 1986 1997
8 Japan .. 1995 1979 1979 1985 1999 1994
9 Netherlands 1966 1971 1978 1978 1991 1988 ..
10 France 1950 1971 1980 1980 1983 1986 1990
11 Finland 1959 1970 1975 1975 1986 1989 1991
12 United States 1988 1994 1992 1977 1980 1994 1995
13 Spain 1968 1968 1977 1977 1984 1987 1990
14 Denmark 1951 1971 1972 1972 1983 1987 1991
15 Austria 1958 1972 1978 1978 1982 |1987 1992
16 United Kingdom 1970 1969 1976 1976 1986 1988 1991
17 Belgium 1951 1975 1983 1983 1985 1999 1991
18 Luxembourg 1981 1978 1983 1983 1989 1987 1994
19 New Zealand 1978 1972 1978 1978 1985 1989 1993
20 Italy 1952 1976 1978 1978 1985 1989 1991
22 Germany 1954 1969 1973 1973 1985 1990 1992
23 Israel 1950 1979 1991 1991 1991 1991 1991
24 Greece 1954 1970 1997 1985 1983 1988 1993
25 Singapore 1995 .. .. .. 1995 .. 1995
26 Korea (Republic of) 1950 1978 1990 1990 1984 1995 1991
27 Slovenia 1992 1992 1992 1992 1992 1993 1992
28 Cyprus 1982 1967 1969 1969 1985 1991 1991
29 Portugal 1999 1982 1978 1978 1980 1989 1990
30 Brunei Darussalam .. .. .. .. 2006 .. 1995
31 Barbados 1980 1972 1973 1973 1980 .. 1990
32 Czech Republic 1993 1993 1993 1993 1993 1993 1993
33 Kuwait 1995 1968 1996 1996 1994 1996 1991
34 Malta .. 1971 1990 1990 1991 1990 1990
35 Qatar .. 1976 .. .. .. 2000 1995
36 Hungary 1952 1967 1974 1974 1980 1987 1991
37 Poland 1950 1968 1977 1977 1980 1989 1991
38 Argentina 1956 1968 1986 1986 1985 1986 1990
39 United Arab Emirates 2005 1974 .. .. 2004 .. 1997
40 Chile 1953 1971 1972 1972 1989 1988 1990
41 Bahrain 1990 1990 2006 .. 2002 1998 1992
42 Slovakia 1993 1993 1993 1993 1993 1993 1993
43 Lithuania 1996 1998 1991 1991 1994 1996 1992
44 Estonia 1991 1991 1991 1991 1991 1991 1991
45 Latvia 1992 1992 1992 1992 1992 1992 1992
46 Uruguay 1967 1968 1970 1970 1981 1986 1990
47 Croatia 1992 1992 1992 1992 1992 1992 1992
48 Costa Rica 1950 1967 1968 1968 1986 1993 1990
49 Bahamas 1975 1975 .. .. 1993 .. 1991
50 Seychelles 1992 1978 1992 1992 1992 1992 1990
51 Cuba 1953 1972 .. .. 1980 1995 1991
52 Mexico 1952 1975 1981 1981 1981 1986 1990
53 Bulgaria 1950 1966 1970 1970 1982 1986 1991
54 Saint Kitts and Nevis .. 2006 .. .. 1985 .. 1990
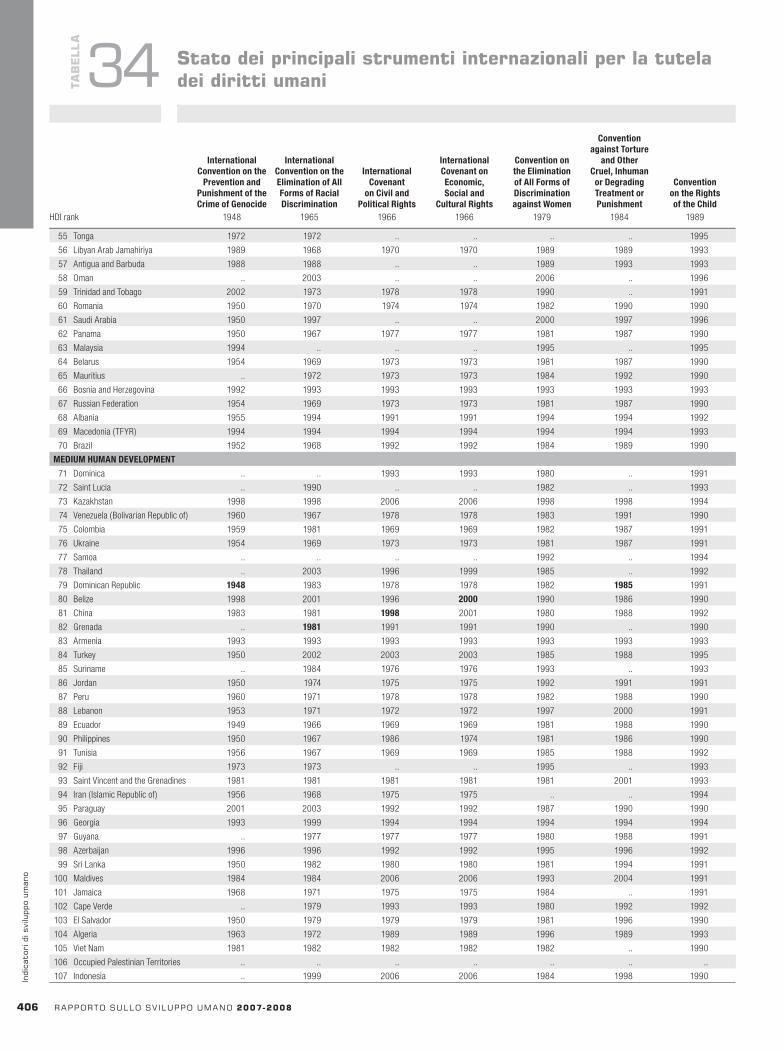
HDI rank
InternationalConventiononthe
PreventionandPunishmentoftheCrimeofGenocide
1948
InternationalConventionontheEliminationofAllFormsofRacialDiscrimination
1965
InternationalCovenant
onCivilandPoliticalRights
1966
InternationalCovenantonEconomic,Socialand
CulturalRights1966
ConventionontheEliminationofAllFormsofDiscriminationagainstWomen
1979
ConventionagainstTorture
andOtherCruel,InhumanorDegradingTreatmentorPunishment
1984
ConventionontheRightsoftheChild
1989HDI rank
InternationalConventiononthe
PreventionandPunishmentoftheCrimeofGenocide
1948
InternationalConventionontheEliminationofAllFormsofRacialDiscrimination
1965
InternationalCovenant
onCivilandPoliticalRights
1966
InternationalCovenantonEconomic,Socialand
CulturalRights1966
ConventionontheEliminationofAllFormsofDiscriminationagainstWomen
1979
ConventionagainstTorture
andOtherCruel,InhumanorDegradingTreatmentorPunishment
1984
ConventionontheRightsoftheChild
1989
40� rapportosullosv iluppoumano2007-2008
indi
cato
rid
isvi
lupp
oum
ano
TaB
ELLa
34 Statodeiprincipalistrumentiinternazionaliperlatuteladeidirittiumani
55 Tonga 1972 1972 .. .. .. .. 1995
56 Libyan Arab Jamahiriya 1989 1968 1970 1970 1989 1989 1993
57 Antigua and Barbuda 1988 1988 .. .. 1989 1993 1993
58 Oman .. 2003 .. .. 2006 .. 1996
59 Trinidad and Tobago 2002 1973 1978 1978 1990 .. 1991
60 Romania 1950 1970 1974 1974 1982 1990 1990
61 Saudi Arabia 1950 1997 .. .. 2000 1997 1996
62 Panama 1950 1967 1977 1977 1981 1987 1990
63 Malaysia 1994 .. .. .. 1995 .. 1995
64 Belarus 1954 1969 1973 1973 1981 1987 1990
65 Mauritius .. 1972 1973 1973 1984 1992 1990
66 Bosnia and Herzegovina 1992 1993 1993 1993 1993 1993 1993
67 Russian Federation 1954 1969 1973 1973 1981 1987 1990
68 Albania 1955 1994 1991 1991 1994 1994 1992
69 Macedonia (TFYR) 1994 1994 1994 1994 1994 1994 1993
70 Brazil 1952 1968 1992 1992 1984 1989 1990
MEDIUMHUMANDEVELOPMENT
71 Dominica .. .. 1993 1993 1980 .. 1991
72 Saint Lucia .. 1990 .. .. 1982 .. 1993
73 Kazakhstan 1998 1998 2006 2006 1998 1998 1994
74 Venezuela (Bolivarian Republic of) 1960 1967 1978 1978 1983 1991 1990
75 Colombia 1959 1981 1969 1969 1982 1987 1991
76 Ukraine 1954 1969 1973 1973 1981 1987 1991
77 Samoa .. .. .. .. 1992 .. 1994
78 Thailand .. 2003 1996 1999 1985 .. 1992
79 Dominican Republic 1948 1983 1978 1978 1982 1985 1991
80 Belize 1998 2001 1996 2000 1990 1986 1990
81 China 1983 1981 1998 2001 1980 1988 1992
82 Grenada .. 1981 1991 1991 1990 .. 1990
83 Armenia 1993 1993 1993 1993 1993 1993 1993
84 Turkey 1950 2002 2003 2003 1985 1988 1995
85 Suriname .. 1984 1976 1976 1993 .. 1993
86 Jordan 1950 1974 1975 1975 1992 1991 1991
87 Peru 1960 1971 1978 1978 1982 1988 1990
88 Lebanon 1953 1971 1972 1972 1997 2000 1991
89 Ecuador 1949 1966 1969 1969 1981 1988 1990
90 Philippines 1950 1967 1986 1974 1981 1986 1990
91 Tunisia 1956 1967 1969 1969 1985 1988 1992
92 Fiji 1973 1973 .. .. 1995 .. 1993
93 Saint Vincent and the Grenadines 1981 1981 1981 1981 1981 2001 1993
94 Iran ( Islamic Republic of) 1956 1968 1975 1975 .. .. 1994
95 Paraguay 2001 2003 1992 1992 1987 1990 1990
96 Georgia 1993 1999 1994 1994 1994 1994 1994
97 Guyana .. 1977 1977 1977 1980 1988 1991
98 Azerbaijan 1996 1996 1992 1992 1995 1996 1992
99 Sri Lanka 1950 1982 1980 1980 1981 1994 1991
100 Maldives 1984 1984 2006 2006 1993 2004 1991
101 Jamaica 1968 1971 1975 1975 1984 .. 1991
102 Cape Verde .. 1979 1993 1993 1980 1992 1992
103 El Salvador 1950 1979 1979 1979 1981 1996 1990
104 Algeria 1963 1972 1989 1989 1996 1989 1993
105 Viet Nam 1981 1982 1982 1982 1982 .. 1990
106 Occupied Palestinian Territories .. .. .. .. .. .. ..
107 Indonesia .. 1999 2006 2006 1984 1998 1990
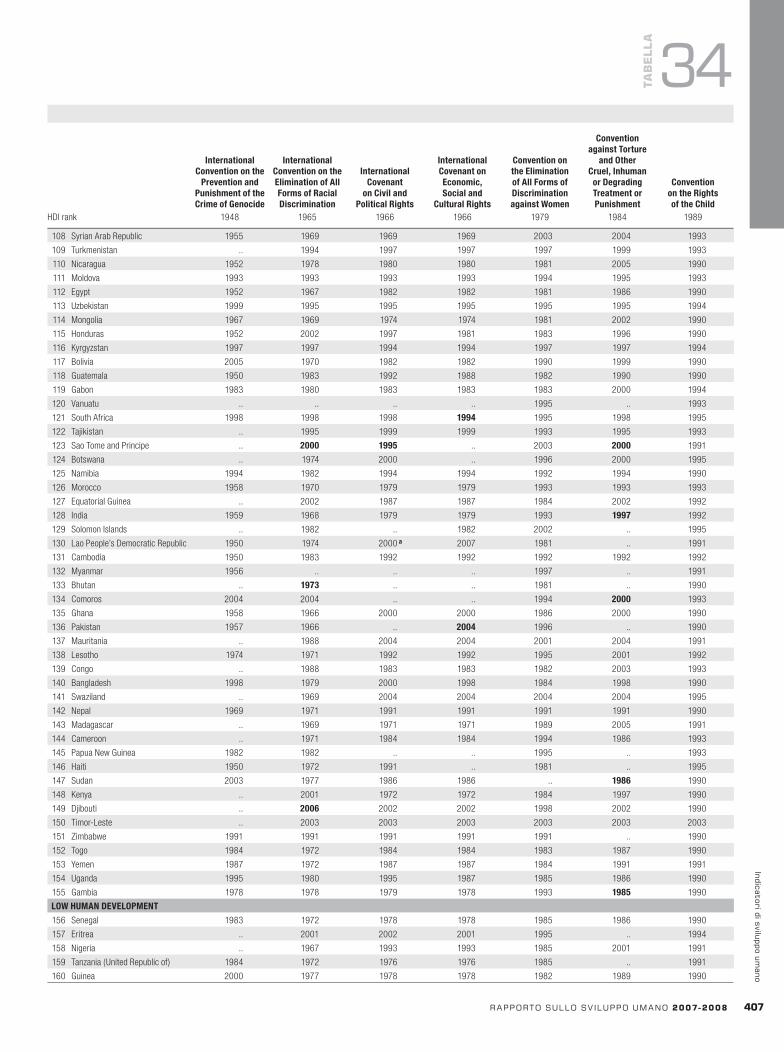
HDI rank
InternationalConventiononthe
PreventionandPunishmentoftheCrimeofGenocide
1948
InternationalConventionontheEliminationofAllFormsofRacialDiscrimination
1965
InternationalCovenant
onCivilandPoliticalRights
1966
InternationalCovenantonEconomic,Socialand
CulturalRights1966
ConventionontheEliminationofAllFormsofDiscriminationagainstWomen
1979
ConventionagainstTorture
andOtherCruel,InhumanorDegradingTreatmentorPunishment
1984
ConventionontheRightsoftheChild
1989
rapportosullosv iluppoumano2007-2008 407
indicatoridisviluppoumano
TaB
ELLa
34
108 Syrian Arab Republic 1955 1969 1969 1969 2003 2004 1993
109 Turkmenistan .. 1994 1997 1997 1997 1999 1993
110 Nicaragua 1952 1978 1980 1980 1981 2005 1990
111 Moldova 1993 1993 1993 1993 1994 1995 1993
112 Egypt 1952 1967 1982 1982 1981 1986 1990
113 Uzbekistan 1999 1995 1995 1995 1995 1995 1994
114 Mongolia 1967 1969 1974 1974 1981 2002 1990
115 Honduras 1952 2002 1997 1981 1983 1996 1990
116 Kyrgyzstan 1997 1997 1994 1994 1997 1997 1994
117 Bolivia 2005 1970 1982 1982 1990 1999 1990
118 Guatemala 1950 1983 1992 1988 1982 1990 1990
119 Gabon 1983 1980 1983 1983 1983 2000 1994
120 Vanuatu .. .. .. .. 1995 .. 1993
121 South Africa 1998 1998 1998 1994 1995 1998 1995
122 Tajikistan .. 1995 1999 1999 1993 1995 1993
123 Sao Tome and Principe .. 2000 1995 .. 2003 2000 1991
124 Botswana .. 1974 2000 .. 1996 2000 1995
125 Namibia 1994 1982 1994 1994 1992 1994 1990
126 Morocco 1958 1970 1979 1979 1993 1993 1993
127 Equatorial Guinea .. 2002 1987 1987 1984 2002 1992
128 India 1959 1968 1979 1979 1993 1997 1992
129 Solomon Islands .. 1982 .. 1982 2002 .. 1995
130 Lao People’s Democratic Republic 1950 1974 2000a 2007 1981 .. 1991
131 Cambodia 1950 1983 1992 1992 1992 1992 1992
132 Myanmar 1956 .. .. .. 1997 .. 1991
133 Bhutan .. 1973 .. .. 1981 .. 1990
134 Comoros 2004 2004 .. .. 1994 2000 1993
135 Ghana 1958 1966 2000 2000 1986 2000 1990
136 Pakistan 1957 1966 .. 2004 1996 .. 1990
137 Mauritania .. 1988 2004 2004 2001 2004 1991
138 Lesotho 1974 1971 1992 1992 1995 2001 1992
139 Congo .. 1988 1983 1983 1982 2003 1993
140 Bangladesh 1998 1979 2000 1998 1984 1998 1990
141 Swaziland .. 1969 2004 2004 2004 2004 1995
142 Nepal 1969 1971 1991 1991 1991 1991 1990
143 Madagascar .. 1969 1971 1971 1989 2005 1991
144 Cameroon .. 1971 1984 1984 1994 1986 1993
145 Papua New Guinea 1982 1982 .. .. 1995 .. 1993
146 Haiti 1950 1972 1991 .. 1981 .. 1995
147 Sudan 2003 1977 1986 1986 .. 1986 1990
148 Kenya .. 2001 1972 1972 1984 1997 1990
149 Djibouti .. 2006 2002 2002 1998 2002 1990
150 Timor-Leste .. 2003 2003 2003 2003 2003 2003
151 Zimbabwe 1991 1991 1991 1991 1991 .. 1990
152 Togo 1984 1972 1984 1984 1983 1987 1990
153 Yemen 1987 1972 1987 1987 1984 1991 1991
154 Uganda 1995 1980 1995 1987 1985 1986 1990
155 Gambia 1978 1978 1979 1978 1993 1985 1990
LOWHUMANDEVELOPMENT
156 Senegal 1983 1972 1978 1978 1985 1986 1990
157 Eritrea .. 2001 2002 2001 1995 .. 1994
158 Nigeria .. 1967 1993 1993 1985 2001 1991
159 Tanzania (United Republic of) 1984 1972 1976 1976 1985 .. 1991
160 Guinea 2000 1977 1978 1978 1982 1989 1990
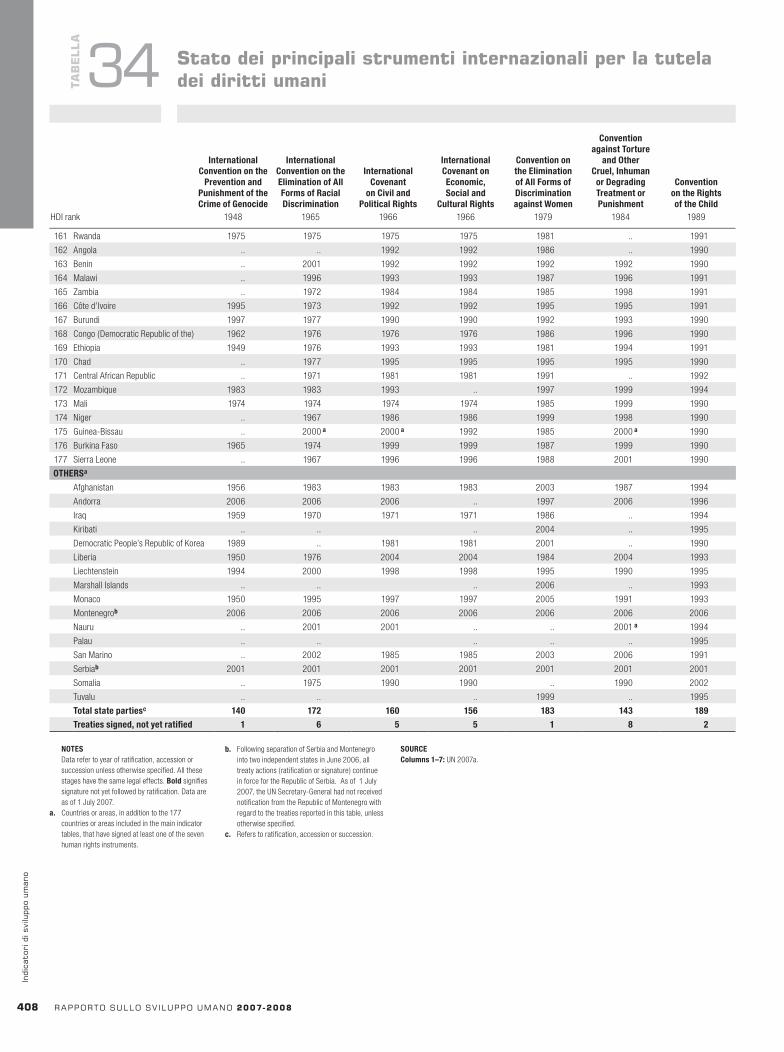
HDI rank
Freedomofassociationandcollectivebargaining
Eliminationofforcedandcompulsorylabour
Eliminationofdiscriminationinrespectofemployment
andoccupation Abolitionofchildlabour
Convention87a
Convention98b
Convention29c
Convention105d
Convention100e
Convention111f
Convention138g
Convention182hHDI rank
InternationalConventiononthe
PreventionandPunishmentoftheCrimeofGenocide
1948
InternationalConventionontheEliminationofAllFormsofRacialDiscrimination
1965
InternationalCovenant
onCivilandPoliticalRights
1966
InternationalCovenantonEconomic,Socialand
CulturalRights1966
ConventionontheEliminationofAllFormsofDiscriminationagainstWomen
1979
ConventionagainstTorture
andOtherCruel,InhumanorDegradingTreatmentorPunishment
1984
ConventionontheRightsoftheChild
1989
408 rapportosullosv iluppoumano2007-2008
indi
cato
rid
isvi
lupp
oum
ano
TaB
ELLa
34 Statodeiprincipalistrumentiinternazionaliperlatuteladeidirittiumani
NOTES Data refer to year of ratification, accession or
succession unless otherwise specified. All these stages have the same legal effects. Bold signifies signature not yet followed by ratification. Data are as of 1 July 2007.
a. Countries or areas, in addition to the 177 countries or areas included in the main indicator tables, that have signed at least one of the seven human rights instruments.
b. Following separation of Serbia and Montenegro into two independent states in June 2006, all treaty actions (ratification or signature) continue in force for the Republic of Serbia. As of 1 July 2007, the UN Secretary-General had not received notification from the Republic of Montenegro with regard to the treaties reported in this table, unless otherwise specified.
c. Refers to ratification, accession or succession.
SOURCEColumns1–7: UN 2007a.
161 Rwanda 1975 1975 1975 1975 1981 .. 1991
162 Angola .. .. 1992 1992 1986 .. 1990
163 Benin .. 2001 1992 1992 1992 1992 1990
164 Malawi .. 1996 1993 1993 1987 1996 1991
165 Zambia .. 1972 1984 1984 1985 1998 1991
166 Côte d’Ivoire 1995 1973 1992 1992 1995 1995 1991
167 Burundi 1997 1977 1990 1990 1992 1993 1990
168 Congo (Democratic Republic of the) 1962 1976 1976 1976 1986 1996 1990
169 Ethiopia 1949 1976 1993 1993 1981 1994 1991
170 Chad .. 1977 1995 1995 1995 1995 1990
171 Central African Republic .. 1971 1981 1981 1991 .. 1992
172 Mozambique 1983 1983 1993 .. 1997 1999 1994
173 Mali 1974 1974 1974 1974 1985 1999 1990
174 Niger .. 1967 1986 1986 1999 1998 1990
175 Guinea-Bissau .. 2000a 2000a 1992 1985 2000a 1990
176 Burkina Faso 1965 1974 1999 1999 1987 1999 1990
177 Sierra Leone .. 1967 1996 1996 1988 2001 1990
OTHERSa
Afghanistan 1956 1983 1983 1983 2003 1987 1994
Andorra 2006 2006 2006 .. 1997 2006 1996
Iraq 1959 1970 1971 1971 1986 .. 1994
Kiribati .. .. .. 2004 .. 1995
Democratic People’s Republic of Korea 1989 .. 1981 1981 2001 .. 1990
Liberia 1950 1976 2004 2004 1984 2004 1993
Liechtenstein 1994 2000 1998 1998 1995 1990 1995
Marshall Islands .. .. .. 2006 .. 1993
Monaco 1950 1995 1997 1997 2005 1991 1993
Montenegrob 2006 2006 2006 2006 2006 2006 2006
Nauru .. 2001 2001 .. .. 2001a 1994
Palau .. .. .. .. .. 1995
San Marino .. 2002 1985 1985 2003 2006 1991
Serbiab 2001 2001 2001 2001 2001 2001 2001
Somalia .. 1975 1990 1990 .. 1990 2002
Tuvalu .. .. .. 1999 .. 1995
Totalstatepartiesc 140 172 160 156 183 143 189
Treatiessigned,notyetratified 1 6 5 5 1 8 2
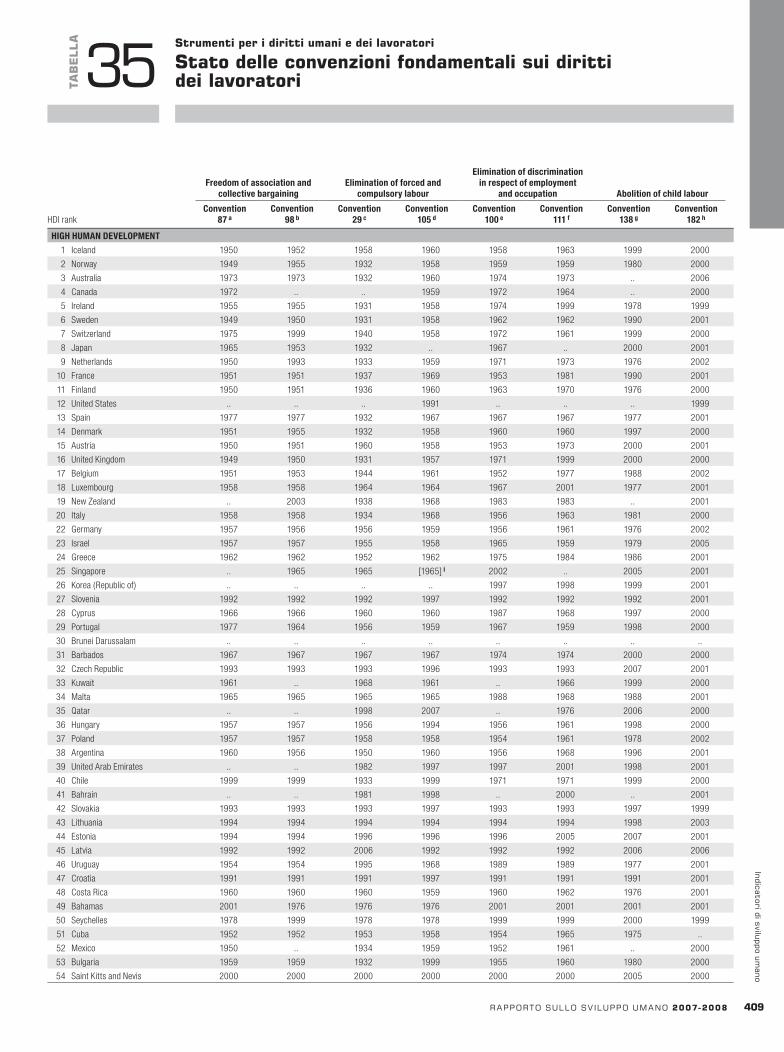
HDI rank
Freedomofassociationandcollectivebargaining
Eliminationofforcedandcompulsorylabour
Eliminationofdiscriminationinrespectofemployment
andoccupation Abolitionofchildlabour
Convention87a
Convention98b
Convention29c
Convention105d
Convention100e
Convention111f
Convention138g
Convention182h
rapportosullosv iluppoumano2007-2008 40�
indicatoridisviluppoumano
HIGHHUMANDEVELOPMENT
1 Iceland 1950 1952 1958 1960 1958 1963 1999 2000
2 Norway 1949 1955 1932 1958 1959 1959 1980 2000
3 Australia 1973 1973 1932 1960 1974 1973 .. 2006
4 Canada 1972 .. .. 1959 1972 1964 .. 2000
5 Ireland 1955 1955 1931 1958 1974 1999 1978 1999
6 Sweden 1949 1950 1931 1958 1962 1962 1990 2001
7 Switzerland 1975 1999 1940 1958 1972 1961 1999 2000
8 Japan 1965 1953 1932 .. 1967 .. 2000 2001
9 Netherlands 1950 1993 1933 1959 1971 1973 1976 2002
10 France 1951 1951 1937 1969 1953 1981 1990 2001
11 Finland 1950 1951 1936 1960 1963 1970 1976 2000
12 United States .. .. .. 1991 .. .. .. 1999
13 Spain 1977 1977 1932 1967 1967 1967 1977 2001
14 Denmark 1951 1955 1932 1958 1960 1960 1997 2000
15 Austria 1950 1951 1960 1958 1953 1973 2000 2001
16 United Kingdom 1949 1950 1931 1957 1971 1999 2000 2000
17 Belgium 1951 1953 1944 1961 1952 1977 1988 2002
18 Luxembourg 1958 1958 1964 1964 1967 2001 1977 2001
19 New Zealand .. 2003 1938 1968 1983 1983 .. 2001
20 Italy 1958 1958 1934 1968 1956 1963 1981 2000
22 Germany 1957 1956 1956 1959 1956 1961 1976 2002
23 Israel 1957 1957 1955 1958 1965 1959 1979 2005
24 Greece 1962 1962 1952 1962 1975 1984 1986 2001
25 Singapore .. 1965 1965 [1965]i 2002 .. 2005 2001
26 Korea (Republic of) .. .. .. .. 1997 1998 1999 2001
27 Slovenia 1992 1992 1992 1997 1992 1992 1992 2001
28 Cyprus 1966 1966 1960 1960 1987 1968 1997 2000
29 Portugal 1977 1964 1956 1959 1967 1959 1998 2000
30 Brunei Darussalam .. .. .. .. .. .. .. ..
31 Barbados 1967 1967 1967 1967 1974 1974 2000 2000
32 Czech Republic 1993 1993 1993 1996 1993 1993 2007 2001
33 Kuwait 1961 .. 1968 1961 .. 1966 1999 2000
34 Malta 1965 1965 1965 1965 1988 1968 1988 2001
35 Qatar .. .. 1998 2007 .. 1976 2006 2000
36 Hungary 1957 1957 1956 1994 1956 1961 1998 2000
37 Poland 1957 1957 1958 1958 1954 1961 1978 2002
38 Argentina 1960 1956 1950 1960 1956 1968 1996 2001
39 United Arab Emirates .. .. 1982 1997 1997 2001 1998 2001
40 Chile 1999 1999 1933 1999 1971 1971 1999 2000
41 Bahrain .. .. 1981 1998 .. 2000 .. 2001
42 Slovakia 1993 1993 1993 1997 1993 1993 1997 1999
43 Lithuania 1994 1994 1994 1994 1994 1994 1998 2003
44 Estonia 1994 1994 1996 1996 1996 2005 2007 2001
45 Latvia 1992 1992 2006 1992 1992 1992 2006 2006
46 Uruguay 1954 1954 1995 1968 1989 1989 1977 2001
47 Croatia 1991 1991 1991 1997 1991 1991 1991 2001
48 Costa Rica 1960 1960 1960 1959 1960 1962 1976 2001
49 Bahamas 2001 1976 1976 1976 2001 2001 2001 2001
50 Seychelles 1978 1999 1978 1978 1999 1999 2000 1999
51 Cuba 1952 1952 1953 1958 1954 1965 1975 ..
52 Mexico 1950 .. 1934 1959 1952 1961 .. 2000
53 Bulgaria 1959 1959 1932 1999 1955 1960 1980 2000
54 Saint Kitts and Nevis 2000 2000 2000 2000 2000 2000 2005 2000
TaB
ELLa
35Strumentiperidirittiumaniedeilavoratori
Statodelleconvenzionifondamentalisuidirittideilavoratori
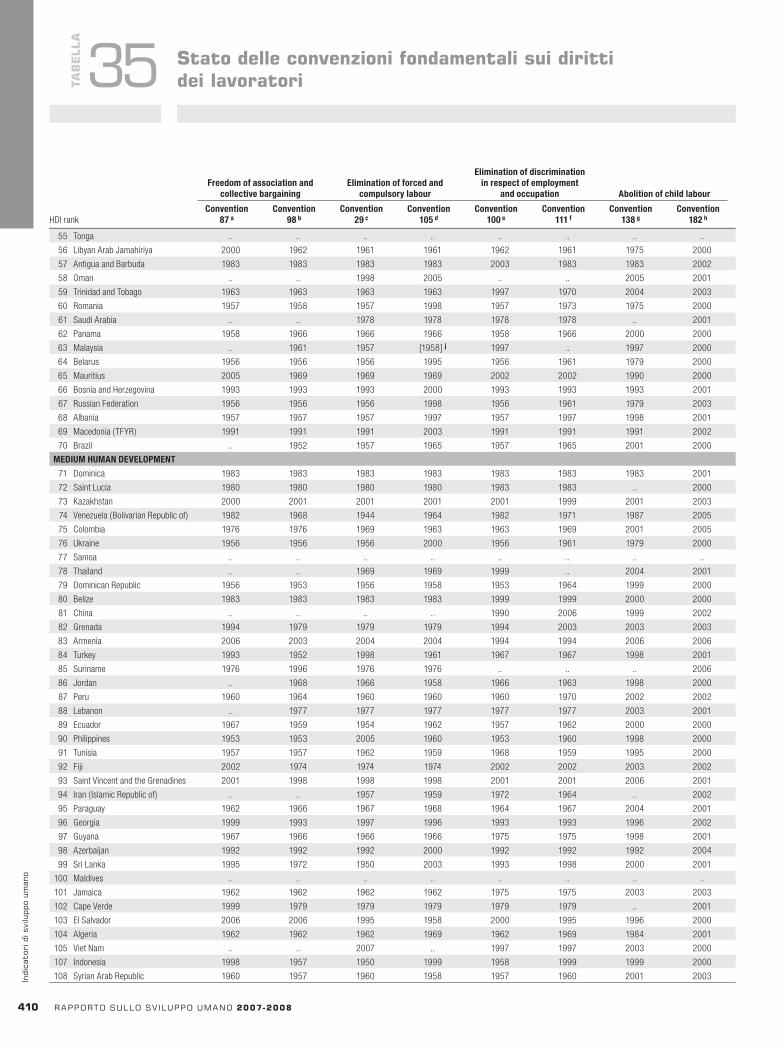
HDI rank
Freedomofassociationandcollectivebargaining
Eliminationofforcedandcompulsorylabour
Eliminationofdiscriminationinrespectofemployment
andoccupation Abolitionofchildlabour
Convention87a
Convention98b
Convention29c
Convention105d
Convention100e
Convention111f
Convention138g
Convention182hHDI rank
Freedomofassociationandcollectivebargaining
Eliminationofforcedandcompulsorylabour
Eliminationofdiscriminationinrespectofemployment
andoccupation Abolitionofchildlabour
Convention87a
Convention98b
Convention29c
Convention105d
Convention100e
Convention111f
Convention138g
Convention182h
410 rapportosullosv iluppoumano2007-2008
indi
cato
rid
isvi
lupp
oum
ano
TaB
ELLa
35 Statodelleconvenzionifondamentalisuidirittideilavoratori
55 Tonga .. .. .. .. .. .. .. ..
56 Libyan Arab Jamahiriya 2000 1962 1961 1961 1962 1961 1975 2000
57 Antigua and Barbuda 1983 1983 1983 1983 2003 1983 1983 2002
58 Oman .. .. 1998 2005 .. .. 2005 2001
59 Trinidad and Tobago 1963 1963 1963 1963 1997 1970 2004 2003
60 Romania 1957 1958 1957 1998 1957 1973 1975 2000
61 Saudi Arabia .. .. 1978 1978 1978 1978 .. 2001
62 Panama 1958 1966 1966 1966 1958 1966 2000 2000
63 Malaysia .. 1961 1957 [1958] j 1997 .. 1997 2000
64 Belarus 1956 1956 1956 1995 1956 1961 1979 2000
65 Mauritius 2005 1969 1969 1969 2002 2002 1990 2000
66 Bosnia and Herzegovina 1993 1993 1993 2000 1993 1993 1993 2001
67 Russian Federation 1956 1956 1956 1998 1956 1961 1979 2003
68 Albania 1957 1957 1957 1997 1957 1997 1998 2001
69 Macedonia (TFYR) 1991 1991 1991 2003 1991 1991 1991 2002
70 Brazil .. 1952 1957 1965 1957 1965 2001 2000
MEDIUMHUMANDEVELOPMENT
71 Dominica 1983 1983 1983 1983 1983 1983 1983 2001
72 Saint Lucia 1980 1980 1980 1980 1983 1983 .. 2000
73 Kazakhstan 2000 2001 2001 2001 2001 1999 2001 2003
74 Venezuela (Bolivarian Republic of) 1982 1968 1944 1964 1982 1971 1987 2005
75 Colombia 1976 1976 1969 1963 1963 1969 2001 2005
76 Ukraine 1956 1956 1956 2000 1956 1961 1979 2000
77 Samoa .. .. .. .. .. .. .. ..
78 Thailand .. .. 1969 1969 1999 .. 2004 2001
79 Dominican Republic 1956 1953 1956 1958 1953 1964 1999 2000
80 Belize 1983 1983 1983 1983 1999 1999 2000 2000
81 China .. .. .. .. 1990 2006 1999 2002
82 Grenada 1994 1979 1979 1979 1994 2003 2003 2003
83 Armenia 2006 2003 2004 2004 1994 1994 2006 2006
84 Turkey 1993 1952 1998 1961 1967 1967 1998 2001
85 Suriname 1976 1996 1976 1976 .. .. .. 2006
86 Jordan .. 1968 1966 1958 1966 1963 1998 2000
87 Peru 1960 1964 1960 1960 1960 1970 2002 2002
88 Lebanon .. 1977 1977 1977 1977 1977 2003 2001
89 Ecuador 1967 1959 1954 1962 1957 1962 2000 2000
90 Philippines 1953 1953 2005 1960 1953 1960 1998 2000
91 Tunisia 1957 1957 1962 1959 1968 1959 1995 2000
92 Fiji 2002 1974 1974 1974 2002 2002 2003 2002
93 Saint Vincent and the Grenadines 2001 1998 1998 1998 2001 2001 2006 2001
94 Iran ( Islamic Republic of) .. .. 1957 1959 1972 1964 .. 2002
95 Paraguay 1962 1966 1967 1968 1964 1967 2004 2001
96 Georgia 1999 1993 1997 1996 1993 1993 1996 2002
97 Guyana 1967 1966 1966 1966 1975 1975 1998 2001
98 Azerbaijan 1992 1992 1992 2000 1992 1992 1992 2004
99 Sri Lanka 1995 1972 1950 2003 1993 1998 2000 2001
100 Maldives .. .. .. .. .. .. .. ..
101 Jamaica 1962 1962 1962 1962 1975 1975 2003 2003
102 Cape Verde 1999 1979 1979 1979 1979 1979 .. 2001
103 El Salvador 2006 2006 1995 1958 2000 1995 1996 2000
104 Algeria 1962 1962 1962 1969 1962 1969 1984 2001
105 Viet Nam .. .. 2007 .. 1997 1997 2003 2000
107 Indonesia 1998 1957 1950 1999 1958 1999 1999 2000
108 Syrian Arab Republic 1960 1957 1960 1958 1957 1960 2001 2003
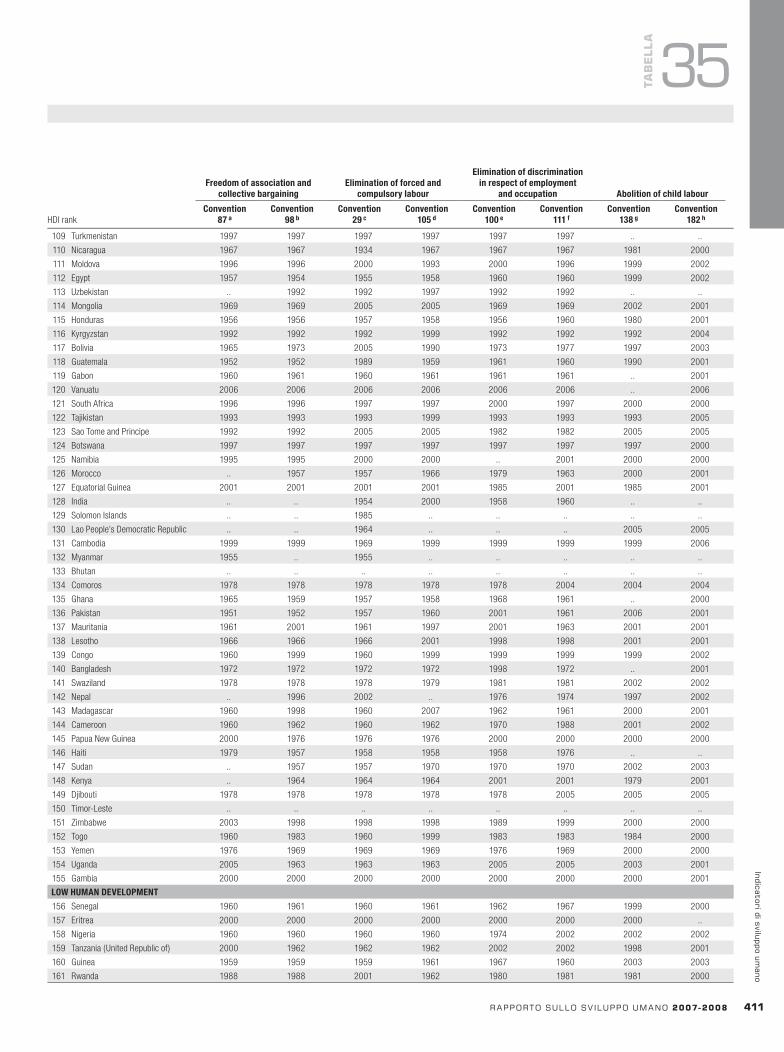
HDI rank
Freedomofassociationandcollectivebargaining
Eliminationofforcedandcompulsorylabour
Eliminationofdiscriminationinrespectofemployment
andoccupation Abolitionofchildlabour
Convention87a
Convention98b
Convention29c
Convention105d
Convention100e
Convention111f
Convention138g
Convention182h
rapportosullosv iluppoumano2007-2008 411
indicatoridisviluppoumano
TaB
ELLa
35
109 Turkmenistan 1997 1997 1997 1997 1997 1997 .. ..
110 Nicaragua 1967 1967 1934 1967 1967 1967 1981 2000
111 Moldova 1996 1996 2000 1993 2000 1996 1999 2002
112 Egypt 1957 1954 1955 1958 1960 1960 1999 2002
113 Uzbekistan .. 1992 1992 1997 1992 1992 .. ..
114 Mongolia 1969 1969 2005 2005 1969 1969 2002 2001
115 Honduras 1956 1956 1957 1958 1956 1960 1980 2001
116 Kyrgyzstan 1992 1992 1992 1999 1992 1992 1992 2004
117 Bolivia 1965 1973 2005 1990 1973 1977 1997 2003
118 Guatemala 1952 1952 1989 1959 1961 1960 1990 2001
119 Gabon 1960 1961 1960 1961 1961 1961 .. 2001
120 Vanuatu 2006 2006 2006 2006 2006 2006 .. 2006
121 South Africa 1996 1996 1997 1997 2000 1997 2000 2000
122 Tajikistan 1993 1993 1993 1999 1993 1993 1993 2005
123 Sao Tome and Principe 1992 1992 2005 2005 1982 1982 2005 2005
124 Botswana 1997 1997 1997 1997 1997 1997 1997 2000
125 Namibia 1995 1995 2000 2000 .. 2001 2000 2000
126 Morocco .. 1957 1957 1966 1979 1963 2000 2001
127 Equatorial Guinea 2001 2001 2001 2001 1985 2001 1985 2001
128 India .. .. 1954 2000 1958 1960 .. ..
129 Solomon Islands .. .. 1985 .. .. .. .. ..
130 Lao People’s Democratic Republic .. .. 1964 .. .. .. 2005 2005
131 Cambodia 1999 1999 1969 1999 1999 1999 1999 2006
132 Myanmar 1955 .. 1955 .. .. .. .. ..
133 Bhutan .. .. .. .. .. .. .. ..
134 Comoros 1978 1978 1978 1978 1978 2004 2004 2004
135 Ghana 1965 1959 1957 1958 1968 1961 .. 2000
136 Pakistan 1951 1952 1957 1960 2001 1961 2006 2001
137 Mauritania 1961 2001 1961 1997 2001 1963 2001 2001
138 Lesotho 1966 1966 1966 2001 1998 1998 2001 2001
139 Congo 1960 1999 1960 1999 1999 1999 1999 2002
140 Bangladesh 1972 1972 1972 1972 1998 1972 .. 2001
141 Swaziland 1978 1978 1978 1979 1981 1981 2002 2002
142 Nepal .. 1996 2002 .. 1976 1974 1997 2002
143 Madagascar 1960 1998 1960 2007 1962 1961 2000 2001
144 Cameroon 1960 1962 1960 1962 1970 1988 2001 2002
145 Papua New Guinea 2000 1976 1976 1976 2000 2000 2000 2000
146 Haiti 1979 1957 1958 1958 1958 1976 .. ..
147 Sudan .. 1957 1957 1970 1970 1970 2002 2003
148 Kenya .. 1964 1964 1964 2001 2001 1979 2001
149 Djibouti 1978 1978 1978 1978 1978 2005 2005 2005
150 Timor-Leste .. .. .. .. .. .. .. ..
151 Zimbabwe 2003 1998 1998 1998 1989 1999 2000 2000
152 Togo 1960 1983 1960 1999 1983 1983 1984 2000
153 Yemen 1976 1969 1969 1969 1976 1969 2000 2000
154 Uganda 2005 1963 1963 1963 2005 2005 2003 2001
155 Gambia 2000 2000 2000 2000 2000 2000 2000 2001
LOWHUMANDEVELOPMENT
156 Senegal 1960 1961 1960 1961 1962 1967 1999 2000
157 Eritrea 2000 2000 2000 2000 2000 2000 2000 ..
158 Nigeria 1960 1960 1960 1960 1974 2002 2002 2002
159 Tanzania (United Republic of) 2000 1962 1962 1962 2002 2002 1998 2001
160 Guinea 1959 1959 1959 1961 1967 1960 2003 2003
161 Rwanda 1988 1988 2001 1962 1980 1981 1981 2000
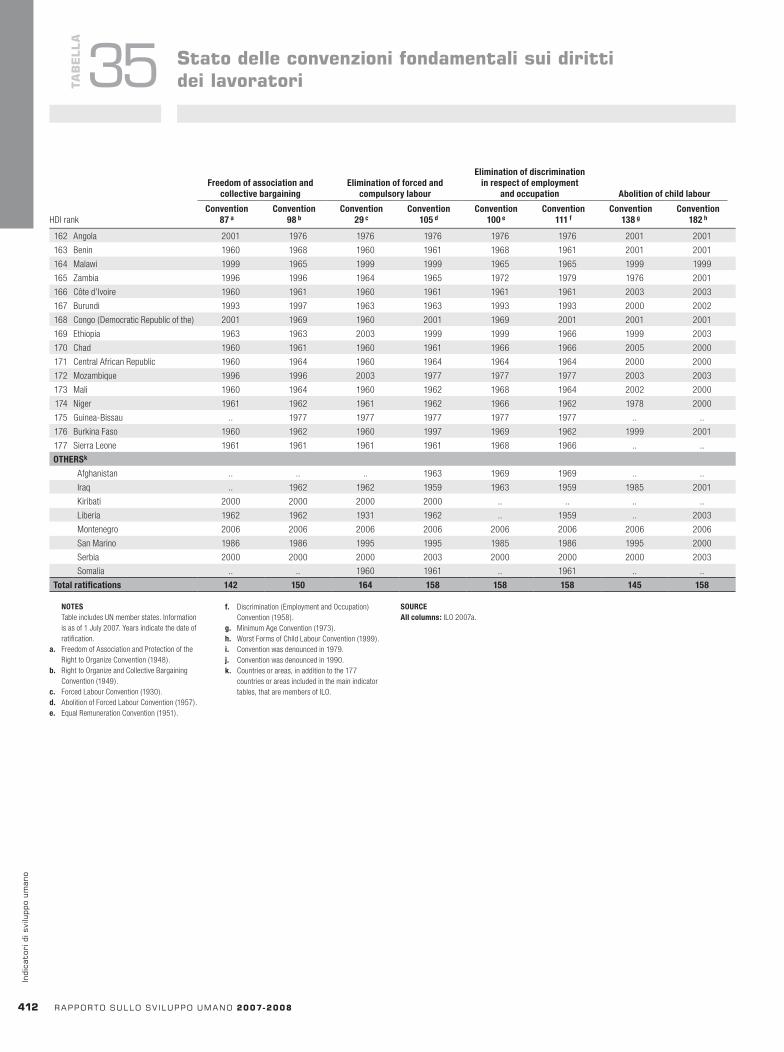
HDI rank
Freedomofassociationandcollectivebargaining
Eliminationofforcedandcompulsorylabour
Eliminationofdiscriminationinrespectofemployment
andoccupation Abolitionofchildlabour
Convention87a
Convention98b
Convention29c
Convention105d
Convention100e
Convention111f
Convention138g
Convention182h
412 rapportosullosv iluppoumano2007-2008
indi
cato
rid
isvi
lupp
oum
ano
NOTES Table includes UN member states. Information
is as of 1 July 2007. Years indicate the date of ratification.
a. Freedom of Association and Protection of the Right to Organize Convention (1948).
b. Right to Organize and Collective Bargaining Convention (1949).
c. Forced Labour Convention (1930).d. Abolition of Forced Labour Convention (1957).e. Equal Remuneration Convention (1951).
f. Discrimination (Employment and Occupation) Convention (1958).
g. Minimum Age Convention (1973).h. Worst Forms of Child Labour Convention (1999).i. Convention was denounced in 1979.j. Convention was denounced in 1990.k. Countries or areas, in addition to the 177
countries or areas included in the main indicator tables, that are members of ILO.
SOURCEAllcolumns: ILO 2007a.
TaB
ELLa
35 Statodelleconvenzionifondamentalisuidirittideilavoratori
162 Angola 2001 1976 1976 1976 1976 1976 2001 2001
163 Benin 1960 1968 1960 1961 1968 1961 2001 2001
164 Malawi 1999 1965 1999 1999 1965 1965 1999 1999
165 Zambia 1996 1996 1964 1965 1972 1979 1976 2001
166 Côte d’Ivoire 1960 1961 1960 1961 1961 1961 2003 2003
167 Burundi 1993 1997 1963 1963 1993 1993 2000 2002
168 Congo (Democratic Republic of the) 2001 1969 1960 2001 1969 2001 2001 2001
169 Ethiopia 1963 1963 2003 1999 1999 1966 1999 2003
170 Chad 1960 1961 1960 1961 1966 1966 2005 2000
171 Central African Republic 1960 1964 1960 1964 1964 1964 2000 2000
172 Mozambique 1996 1996 2003 1977 1977 1977 2003 2003
173 Mali 1960 1964 1960 1962 1968 1964 2002 2000
174 Niger 1961 1962 1961 1962 1966 1962 1978 2000
175 Guinea-Bissau .. 1977 1977 1977 1977 1977 .. ..
176 Burkina Faso 1960 1962 1960 1997 1969 1962 1999 2001
177 Sierra Leone 1961 1961 1961 1961 1968 1966 .. ..
OTHERSk
Afghanistan .. .. .. 1963 1969 1969 .. ..
Iraq .. 1962 1962 1959 1963 1959 1985 2001
Kiribati 2000 2000 2000 2000 .. .. .. ..
Liberia 1962 1962 1931 1962 .. 1959 .. 2003
Montenegro 2006 2006 2006 2006 2006 2006 2006 2006
San Marino 1986 1986 1995 1995 1985 1986 1995 2000
Serbia 2000 2000 2000 2003 2000 2000 2000 2003
Somalia .. .. 1960 1961 .. 1961 .. ..
Totalratifications 142 150 164 158 158 158 145 158