Quali progressi nel controllo dei tumori in italia? · Macro-area representativeness varies because...
12
QUALI PROGRESSI NEL CONTROLLO DEI TUMORI IN ITALIA? WHAT PROGRESS IN CANCER CONTROL IN ITALY? 5
-
Upload
truongtruc -
Category
Documents
-
view
220 -
download
0
Transcript of Quali progressi nel controllo dei tumori in italia? · Macro-area representativeness varies because...
Quali progressi nel controllo dei tumori in italia?
What progress in cancer control in italy?
5192_204_AIRTUM_2017.indd 193 26/04/17 10.34
Epidemiol Prev 2017; 41 (2) suppl1. doi: 10.19191/EP17.2S1.P001.017 194 Ulteriori dati disponibili sul sito: www.registri-tumori.it
I TUMORI IN ITALIA RAPPORTO AIRTUM 2016 SOPRAVVIVENZA
introduZioneMonitorare l’evoluzione nel tempo della sopravvivenza per tumore è universalmente ritenuto importante per valuta-re i progressi compiuti nel controllo del cancro.1,2 Ideal-mente i miglioramenti prognostici, per essere tali, devono tradursi in un minor numero di decessi per tumore. Che questo avvenga però non è scontato, perché la mortalità è influenzata anche dall’andamento dell’incidenza negli anni precedenti. I decessi che osserviamo oggi si verificano, in-fatti, tra i pazienti diagnosticati in passato, quanto indie-tro nel tempo dipende dalla prognosi e dal suo modificarsi nel tempo. Screening e diagnosi precoce possono realmen-te migliorare l’efficacia delle terapie, contribuendo così a ridurre la mortalità. Per contro una aumentata intensità diagnostica può anche incrementare la sopravvivenza arti-ficialmente – senza nessun effetto sulla mortalità – se l’an-ticipazione diagnostica non concorre a posticipare il de-cesso o se si traduce in sovradiagnosi di lesioni indolenti e non aggressive.3 L’incremento di sopravvivenza non pro-voca dunque necessariamente una riduzione di mortalità e valutare l’impatto dei cambiamenti prognostici sulla mor-talità non è immediato.Alla luce di queste considerazioni è evidente che, contraria-mente a quanto argomentano alcuni epidemiologi,4 con-centrare l’attenzione sulla sola mortalità non è di aiuto nell’interpretazione dei progressi in oncologia. Vista l’in-terdipendenza tra mortalità, incidenza e sopravvivenza,5 per valutare gli avanzamenti prodotti da prevenzione pri-maria, screening, diagnosi precoce e terapie, la dinamica di questi tre indicatori deve essere analizzata congiunta-mente.6-8 Questo Rapporto AIRTUM mostra che la sopravviven-za è incrementata per la maggior parte delle neoplasie nel-la prima decade degli anni 2000. Analoghi andamenti posi-tivi sono stati documentati più in generale in Europa dallo studio EUROCARE-5.9 Questi miglioramenti prognostici contribuiscono realmente a ridurre la mortalità per tumore
Quali progressi nel controllo dei tumori in italia? analisi congiunta delle tendenZe di incidenZa, sopravvivenZa e mortalità nel periodo 1999-2010
What progress in cancer control in italy? a joint analysis of incidence, survival, and mortality time trends 1999-2010
5
introductionMonitoring cancer survival time trends is deemed important worldwide to assess progress in cancer control.1,2 Ideally, gen-uine survival improvements should produce fewer deaths due to cancer, but this is not always the case, since mortality is also influenced by preceding incidence trends. The cancer deaths we observe today occur among patients diagnosed earlier in time; how far earlier depends on prognosis and its dynamics over time. Screening programs and early diagnosis can really improve the efficacy of therapies and genuinely contribute to reduce cancer mortality. On the other hand, increased diag-nostic intensity can also artificially inflate survival – with no effect on mortality – if diagnosis is anticipated with no post-ponement of death or if indolent, non-aggressive lesions are overdiagnosed.3 Survival increase is thus not necessarily associ-ated with decreased mortality, and assessing the impact of sur-vival changes on mortality is not straightforward. From these considerations it is clear that, despite the argument of some epidemiologists,4 focusing on mortality alone would not help to interpret progress in cancer care. Given the in-terdependency between mortality, incidence, and survival,5 to measure progress achieved by primary prevention, early detec-tion/screening, and therapy, the dynamics of incidence, surviv-al, and mortality must be assessed jointly.6-8
This AIRTUM report shows that survival increased in Ita-ly over the first decade of the 2000s for the majority of cancer types. Similar positive trends were documented more in gen-eral in Europe by the EUROCARE-5 study.9 Are these can-cer outcome improvements contributing to reduce cancer mor-tality in Italy? Will the cancer burden really decrease or can survival improvements only mitigate the increase in incidence and mortality? If there is progress at the national level, is it equally distributed over the country? To answer these questions we analysed cancer-specific 1999-2010 time trends of incidence, 5-year net survival, and mortality by sex and geographical macro-area (North-West, North-East, Centre, South). We pooled the 23 cancer registries
192_204_AIRTUM_2017.indd 194 26/04/17 10.34
Epidemiol Prev 2017; 41 (2) suppl1. doi: 10.19191/EP17.2S1.P001.017 195 Ulteriori dati disponibili sul sito: www.registri-tumori.it
I TUMORI IN ITALIA RAPPORTO AIRTUM 2016 SOPRAVVIVENZA progressi nel controllo dei tumori
in Italia? Il carico oncologico complessivo si sta riducendo o l’incremento di sopravvivenza può solo mitigare l’aumento di incidenza e mortalità? I progressi osservati su scala nazio-nale si distribuiscono uniformemente sul territorio?Per rispondere a queste domande abbiamo analizzato le tendenze di incidenza, sopravvivenza netta a 5 anni e mor-talità nel periodo 1999-2010, al variare di sesso e riparti-zione geografica (Nord Ovest, Nord Est, Centro e Sud). Abbiamo conglobato i 23 Registri Tumori attivi nel perio-do di diagnosi 1999-2010, in modo tale che i tre indicatori si riferiscano alla stessa popolazione residente e siano effet-tivamente confrontabili tra loro. Dalla dinamica di inci-denza, sopravvivenza e mortalità, ricaviamo differenti pro-fili epidemiologici per una selezione di tumori di interesse.
dati e metodiI 23 Registri selezionati coprono il periodo di diagno-si 1999-2010 e rappresentano la popolazione di quattro macro-aree: Nord Ovest (Biella, Torino, Genova, Manto-va, Milano, Sondrio, Varese), Nord Est (Alto Adige, Tren-to, Friuli Venezia Giulia, Veneto, Ferrara Modena, Parma, Reggio Emilia, Romagna), Centro (Umbria, Latina), e Sud (Napoli, Salerno, Ragusa, Siracusa, Sassari). La rappresen-tatività delle macro-aree è variabile poiché i Registri sono a prevalente copertura provinciale, e in qualche caso comu-nale.10 Il periodo di studio è stato stratificato in quattro trienni (1999-2001, 2002-2004, 2005-2007, 2008-2010).I tassi di incidenza e la sopravvivenza netta sono stati ri-cavati dal database centralizzato AIRTUM. La definizio-ne delle entità tumorali, basata sulla terza revisione della classificazione internazionale delle malattie per l’oncolo-gia (ICD-O-3), è fornita nel capitolo «Materiali e metodi» (pp. 205-26). Dalle statistiche ufficiali ISTAT di mortali-tà per provincia/comune, con cause di morte codificate in ICD-10, si è ricavata la mortalità per tumore nelle aree di pertinenza dei Registri selezionati.I tassi di mortalità e incidenza sono stati standardizzati con il metodo diretto e la popolazione standard europea. Le tendenze del carico sanitario oncologico non risento-no quindi dell’effetto inflattivo dovuto all’invecchiamen-to della popolazione, particolarmente importante in Italia. Con i modelli di regressione Joint Point si è stimato il cam-biamento percentuale annuo (APC) dei tassi standardizzati di incidenza e mortalità, usando il software distribuito dal National Cancer Institute statunitense (NCI) .11
La probabilità netta di sopravvivere a 5 anni dalla diagnosi è stata stimata con il metodo di Pohar-Perme.12 Per i pri-mi tre trienni si è stimata la sopravvivenza netta di coor-te, ossia quella dei pazienti diagnosticati nel 1999-2001, 2002-2004, 2005-2007, rispettivamente. Con il metodo di periodo ibrido13 abbiamo ricavato una proiezione della
covering the period of diagnosis 1999-2010, so that the three epidemiological indicators refer to the same resident popula-tion and are truly comparable. For a selection of major types of cancer, we describe different epidemiological patterns in terms of changes in incidence, survival, and mortality.
data and metHodsWe selected 23 cancer registries covering the period 1999-2010 and representing the population of four Italian macro-areas: North-Western Italy (Biella, Torino, Genova, Mantova, Milano, Sondrio, Varese), North-Eastern Italy (Alto Adige, Trento, Friuli Venezia Giulia, Veneto, Ferrara, Modena, Par-ma, Reggio Emilia, Romagna), Central Italy (Umbria, Lati-na), and Southern Italy (Napoli, Salerno, Ragusa, Siracusa, Sassari). Macro-area representativeness varies because regis-tries mostly cover provinces, sometimes municipalities.10 The study period was stratified in four three-year periods (1999-2001, 2002-2004, 2005-2007, 2008-2010).The AIRTUM centralized database was used to derive inci-dence rates and 5-year net survival probabilities. Cancer en-tity definitions, based on the Third Edition of the Interna-tional Classification of Diseases for Oncology (ICD-O-3), is presented in the chapter «Materials and methods» (pp. 205-26). ISTAT official mortality statistics by province/municipal-ity, with causes of death coded according to the ICD-10 classi-fication, were used to derive cancer mortality rates in the areas covered by the selected registries. Incidence and mortality rates were standardized by age with the direct method using the European population standard. Therefore, cancer burden time trends are not affected by the in-flating effect of population ageing, which is particularly strong in Italy. The annual percent change (APC) during 1999-2010 in age-adjusted incidence and mortality rates was estimated with Joint Point Regression models available in the software distributed by the US National Cancer Institute (NCI).11
Five-year net survival was estimated with the Pohar-Perme method.12 For the first three three-year periods, cohort-based net survival was estimated, i.e., survival was estimated for patients diagnosed in 1999-2001, 2002-2004, 2005-2007, respectively. Using the hybrid period method, we derived a projection of 5-year net survival of patients diagnosed in 2008-2010, which is not yet estimable with the cohort meth-od, as follow-up ended in 2013.13 Survival estimates were ad-justed by age with the direct method using the International Cancer Survival Standard14 and all estimates were comput-ed through the routines available in Stata.15 Survival chang-es were measured in terms of absolute percentage difference (APD) between 5-year age-adjusted net survival estimates in 2008-2010 and in 1999-2001. For all three indicators statistical significance of changes was tested with 95% confidence interval.
192_204_AIRTUM_2017.indd 195 26/04/17 10.34
Epidemiol Prev 2017; 41 (2) suppl1. doi: 10.19191/EP17.2S1.P001.017 196 Ulteriori dati disponibili sul sito: www.registri-tumori.it
I TUMORI IN ITALIA RAPPORTO AIRTUM 2016 SOPRAVVIVENZA progressi nel controllo dei tumori
sopravvivenza netta a 5 anni dei pazienti diagnosticati nel 2008-2010, non ancora stimabile con il metodo di coorte perché il follow-up terminava nel 2013. Il metodo diretto e l’International Cancer Survival Standard14 sono stati usati per standardizzare la sopravvivenza per età e tutte le stime sono state prodotte con le routines disponibili in Stata.15 I cambiamenti della sopravvivenza sono stati valutati in ter-mini di differenze percentuali assolute (APD) tra la soprav-vivenza netta aggiustata per età a 5 anni nel 2008-2010 e quella nel 1999-2001. Per tutti e tre gli indicatori la significatività del cambiamen-to è stata saggiata entro il livello di confidenza del 95%.
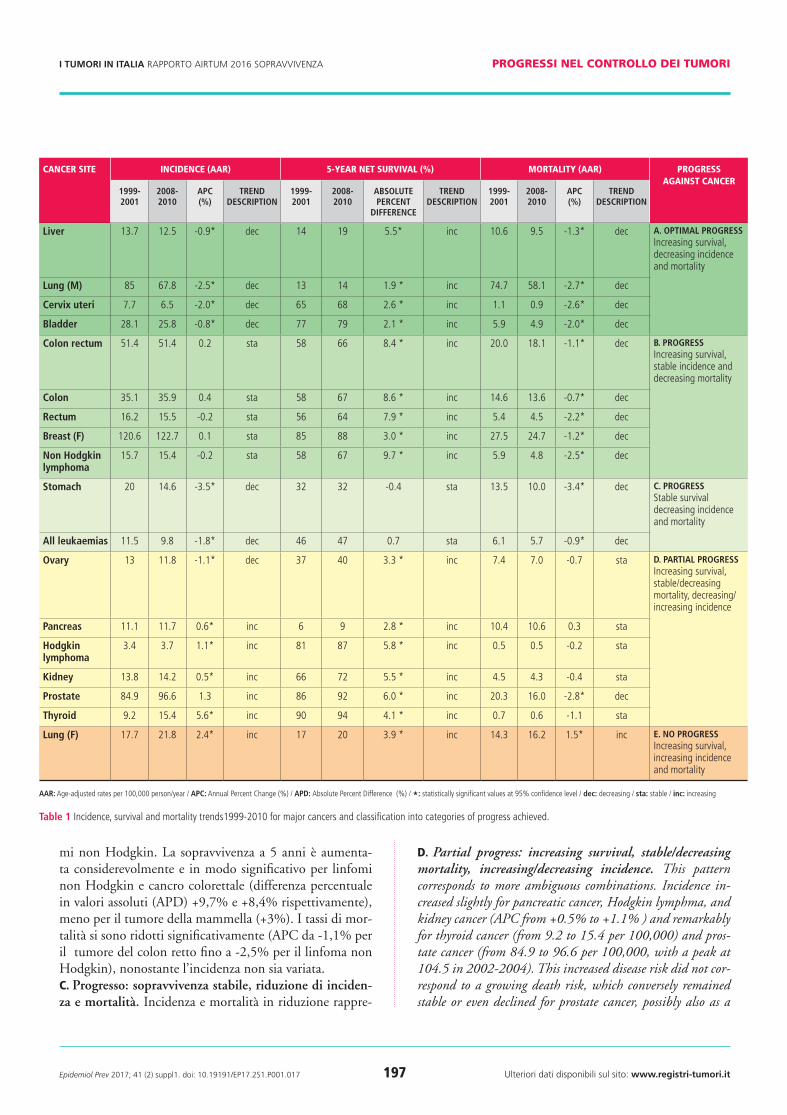
risultatiLa Tabella 1 presenta i cambiamenti nei tassi di incidenza e mortalità e nella sopravvivenza netta a 5 anni avvenuti tra 1999-2001 e 2008-2010 per una selezione dei principali tumori in Italia (insieme dei 23 Registri selezionati). Ab-biamo individuato profili diversificati in funzione dei pro-gressi conseguiti nella lotta ai tumori. Mostriamo risultati specifici per sesso solo quando uomini e donne presentano andamenti differenziati (tumore polmonare).
Progresso Si può parlare sicuramente di progresso quando l’incre-mento di sopravvivenza è accompagnato da una paralle-la riduzione di incidenza e mortalità (pattern A), o da una riduzione di mortalità con incidenza stabile (pattern B). Si è ottenuto un progresso anche quando sia incidenza sia mortalità diminuiscono e la sopravvivenza non cambia in modo apprezzabile (pattern C).a. Progresso ottimale: aumento di sopravvivenza, riduzio-ne di incidenza e mortalità. Questo profilo corrisponde a un progresso ottimale in tutti e tre gli indicatori e si è osser-vato per il tumore polmonare maschile e per i tumori di cer-vice uterina, fegato e vescica. Tra il 1999-2001 e 2008-2010 i tassi di incidenza sono diminuiti in modo statisticamen-te significativo del 2,5% l’anno per il tumore polmonare maschile (da 85 a 68 per 100,000), del 2% per il cervico-carcinoma e di quasi l’1% per i tumori di fegato e vescica. La diminuzione di mortalità è stata altrettanto significati-va e ancora più accentuata: la riduzione percentuale annua (APC) varia da -1,3% per il tumore epatico fino a -2,7% per il tumore polmonare maschile, anche grazie a relativamen-te modesti, ma significativi, miglioramenti di sopravvivenza (la sopravvivenza netta a 5 anni è aumentata da 2,1 – tumo-re della vescica – fino a 5,5 – tumore del fegato – punti per-centuali in valore assoluto).B. Progresso: aumento di sopravvivenza, incidenza sta-bile e mortalità in riduzione. Questo pattern è mostrato dai tumori di colon e retto, mammella femminile e linfo-
resultsTable 1 presents changes in incidence and mortality rates, and in 5-year net survival between 1999-2001 and 2008-2010 for a selection of major cancer types in Italy (pool of the 23 registries). We identified different patterns according to pro-gress achieved against cancer. Sex-specific results are presented only when time trend patterns differ between men and wom-en (lung cancer).
Progress Progress is unambiguously achieved when survival increases are accompanied by decreasing incidence and mortality (pat-tern A), or by decreasing mortality and stable incidence (pat-tern B). Progress is achieved even when both cancer incidence and mortality decrease, even though survival does not change significantly (pattern C). a. Optimal progress: increasing survival, decreasing inci-dence and mortality. This pattern corresponds to optimal progress in all indicators and was observed for lung cancer in men, cervical, liver, and bladder cancer. Between 1999-2001 and 2008-2010 incidence rates declined significantly by 2.5% per year for male lung cancer (from 85 to 68 per 100,000), by 2.0% for cervix uteri and by nearly 1% for liv-er and bladder cancers. Mortality reductions were even high-er: APC ranged from -1.3% for liver cancer to -2.7% for male lung cancer, also thanks to relatively modest but signifi-cant survival improvements (5-year net survival increased by 2.1 – bladder cancer – to 5.5 – liver cancer – absolute per-centage points). B. Progress: increasing survival, stable incidence and de-creasing mortality. This pattern emerged for colon and rec-tum, female breast cancer, and non-Hodgkin lymphoma. Five-year net survival increased remarkably for lymphoma and colorectal cancer (APD +9.7% and 8.4%, respectively), less for breast cancer (+3%). Mortality rates declined signifi-cantly (APC ranging from -1.1% for colon-rectum cancer to -2.5% for non-Hodgkin lymphoma), although incidence did not change significantly during the same period. c. Progress: stable survival, decreasing incidence and mortal-ity. Optimal progress in terms of reduced cancer burden can be combined with no significant prognostic advancements. In this case, mortality reduction is mainly driven by incidence reduc-tion. Stomach cancer and all leukaemia showed this pattern. In both cases, the decline in incidence was significant (APC: 3.5% and 1.8%, respectively) and accompanied by a parallel mortality decline (APC 3.4% and 0.9%, respectively).
Partial Progress Partial progress is associated with a mixture of favourable and unfavourable trends in cancer burden, despite survival im-provements (pattern D).
192_204_AIRTUM_2017.indd 196 26/04/17 10.34
Epidemiol Prev 2017; 41 (2) suppl1. doi: 10.19191/EP17.2S1.P001.017 197 Ulteriori dati disponibili sul sito: www.registri-tumori.it
I TUMORI IN ITALIA RAPPORTO AIRTUM 2016 SOPRAVVIVENZA progressi nel controllo dei tumori
mi non Hodgkin. La sopravvivenza a 5 anni è aumenta-ta considerevolmente e in modo significativo per linfomi non Hodgkin e cancro colorettale (differenza percentuale in valori assoluti (APD) +9,7% e +8,4% rispettivamente), meno per il tumore della mammella (+3%). I tassi di mor-talità si sono ridotti significativamente (APC da -1,1% per il tumore del colon retto fino a -2,5% per il linfoma non Hodgkin), nonostante l’incidenza non sia variata. c. Progresso: sopravvivenza stabile, riduzione di inciden-za e mortalità. Incidenza e mortalità in riduzione rappre-
d. Partial progress: increasing survival, stable/decreasing mortality, increasing/decreasing incidence. This pattern corresponds to more ambiguous combinations. Incidence in-creased slightly for pancreatic cancer, Hodgkin lymphma, and kidney cancer (APC from +0.5% to +1.1% ) and remarkably for thyroid cancer (from 9.2 to 15.4 per 100,000) and pros-tate cancer (from 84.9 to 96.6 per 100,000, with a peak at 104.5 in 2002-2004). This increased disease risk did not cor-respond to a growing death risk, which conversely remained stable or even declined for prostate cancer, possibly also as a
cancer site incidence (aar) 5-year net survival (%) mortality (aar) progress against cancer
1999-2001
2008-2010
aPC (%)
treND DesCriPtioN
1999-2001
2008-2010
aBsolUte PerCeNt
DiFFereNCe
treND DesCriPtioN
1999-2001
2008-2010
aPC (%)
treND DesCriPtioN
liver 13.7 12.5 -0.9* dec 14 19 5.5* inc 10.6 9.5 -1.3* dec a. oPtiMal Progressincreasing survival, decreasing incidence and mortality
lung (M) 85 67.8 -2.5* dec 13 14 1.9 * inc 74.7 58.1 -2.7* dec
Cervix uteri 7.7 6.5 -2.0* dec 65 68 2.6 * inc 1.1 0.9 -2.6* dec
Bladder 28.1 25.8 -0.8* dec 77 79 2.1 * inc 5.9 4.9 -2.0* dec
Colon rectum 51.4 51.4 0.2 sta 58 66 8.4 * inc 20.0 18.1 -1.1* dec B. Progressincreasing survival, stable incidence and decreasing mortality
Colon 35.1 35.9 0.4 sta 58 67 8.6 * inc 14.6 13.6 -0.7* dec
rectum 16.2 15.5 -0.2 sta 56 64 7.9 * inc 5.4 4.5 -2.2* dec
Breast (F) 120.6 122.7 0.1 sta 85 88 3.0 * inc 27.5 24.7 -1.2* dec
Non Hodgkinlymphoma
15.7 15.4 -0.2 sta 58 67 9.7 * inc 5.9 4.8 -2.5* dec
stomach 20 14.6 -3.5* dec 32 32 -0.4 sta 13.5 10.0 -3.4* dec C. Progressstable survival decreasing incidence and mortality
all leukaemias 11.5 9.8 -1.8* dec 46 47 0.7 sta 6.1 5.7 -0.9* dec
ovary 13 11.8 -1.1* dec 37 40 3.3 * inc 7.4 7.0 -0.7 sta D. Partial Progressincreasing survival, stable/decreasing mortality, decreasing/increasing incidence
Pancreas 11.1 11.7 0.6* inc 6 9 2.8 * inc 10.4 10.6 0.3 sta
Hodgkin lymphoma
3.4 3.7 1.1* inc 81 87 5.8 * inc 0.5 0.5 -0.2 sta
Kidney 13.8 14.2 0.5* inc 66 72 5.5 * inc 4.5 4.3 -0.4 sta
Prostate 84.9 96.6 1.3 inc 86 92 6.0 * inc 20.3 16.0 -2.8* dec
thyroid 9.2 15.4 5.6* inc 90 94 4.1 * inc 0.7 0.6 -1.1 sta
lung (F) 17.7 21.8 2.4* inc 17 20 3.9 * inc 14.3 16.2 1.5* inc e. No Progressincreasing survival, increasing incidence and mortality
aar: age-adjusted rates per 100,000 person/year / aPC: annual percent change (%) / aPD: absolute percent difference (%) / *: statistically significant values at 95% confidence level / dec: decreasing / sta: stable / inc: increasing
table 1 incidence, survival and mortality trends1999-2010 for major cancers and classification into categories of progress achieved.
192_204_AIRTUM_2017.indd 197 26/04/17 10.34
Epidemiol Prev 2017; 41 (2) suppl1. doi: 10.19191/EP17.2S1.P001.017 198 Ulteriori dati disponibili sul sito: www.registri-tumori.it
I TUMORI IN ITALIA RAPPORTO AIRTUM 2016 SOPRAVVIVENZA progressi nel controllo dei tumori
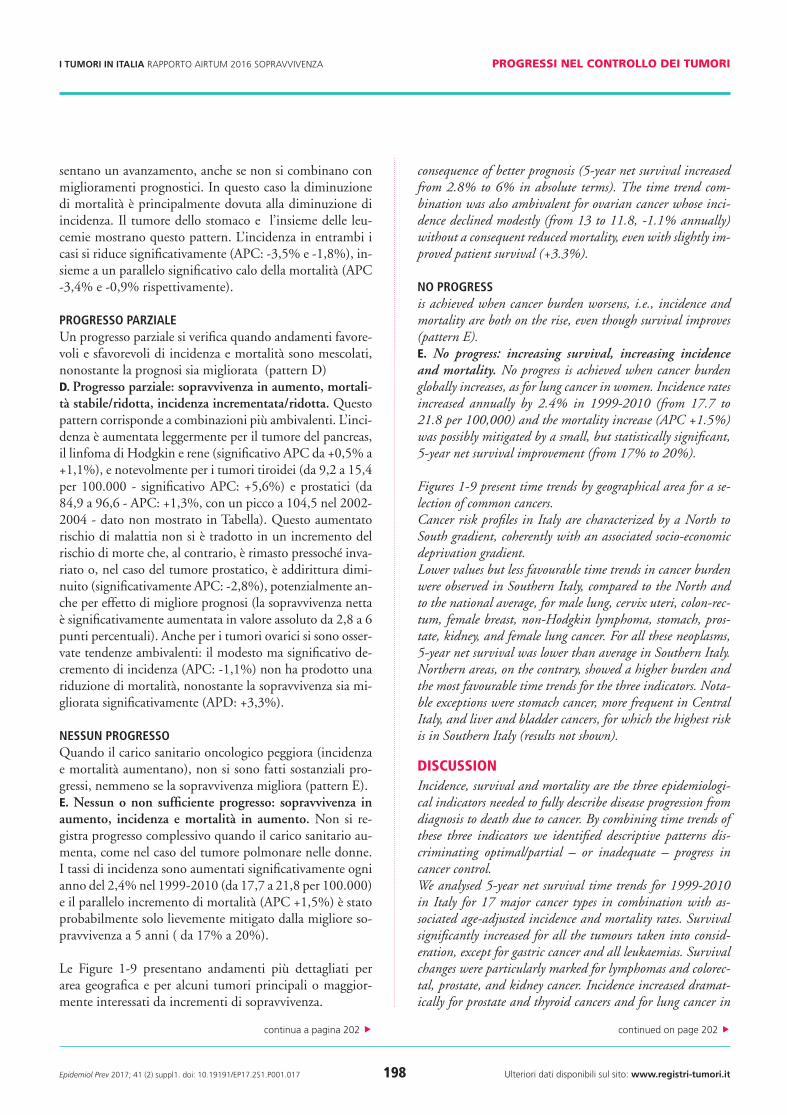
sentano un avanzamento, anche se non si combinano con miglioramenti prognostici. In questo caso la diminuzione di mortalità è principalmente dovuta alla diminuzione di incidenza. Il tumore dello stomaco e l’insieme delle leu-cemie mostrano questo pattern. L’incidenza in entrambi i casi si riduce significativamente (APC: -3,5% e -1,8%), in-sieme a un parallelo significativo calo della mortalità (APC -3,4% e -0,9% rispettivamente).
Progresso ParzialeUn progresso parziale si verifica quando andamenti favore-voli e sfavorevoli di incidenza e mortalità sono mescolati, nonostante la prognosi sia migliorata (pattern D)d. Progresso parziale: sopravvivenza in aumento, mortali-tà stabile/ridotta, incidenza incrementata/ridotta. Questo pattern corrisponde a combinazioni più ambivalenti. L’inci-denza è aumentata leggermente per il tumore del pancreas, il linfoma di Hodgkin e rene (significativo APC da +0,5% a +1,1%), e notevolmente per i tumori tiroidei (da 9,2 a 15,4 per 100.000 - significativo APC: +5,6%) e prostatici (da 84,9 a 96,6 - APC: +1,3%, con un picco a 104,5 nel 2002-2004 - dato non mostrato in Tabella). Questo aumentato rischio di malattia non si è tradotto in un incremento del rischio di morte che, al contrario, è rimasto pressoché inva-riato o, nel caso del tumore prostatico, è addirittura dimi-nuito (significativamente APC: -2,8%), potenzialmente an-che per effetto di migliore prognosi (la sopravvivenza netta è significativamente aumentata in valore assoluto da 2,8 a 6 punti percentuali). Anche per i tumori ovarici si sono osser-vate tendenze ambivalenti: il modesto ma significativo de-cremento di incidenza (APC: -1,1%) non ha prodotto una riduzione di mortalità, nonostante la sopravvivenza sia mi-gliorata significativamente (APD: +3,3%).
NessUN ProgressoQuando il carico sanitario oncologico peggiora (incidenza e mortalità aumentano), non si sono fatti sostanziali pro-gressi, nemmeno se la sopravvivenza migliora (pattern E).e. Nessun o non sufficiente progresso: sopravvivenza in aumento, incidenza e mortalità in aumento. Non si re-gistra progresso complessivo quando il carico sanitario au-menta, come nel caso del tumore polmonare nelle donne. I tassi di incidenza sono aumentati significativamente ogni anno del 2,4% nel 1999-2010 (da 17,7 a 21,8 per 100.000) e il parallelo incremento di mortalità (APC +1,5%) è stato probabilmente solo lievemente mitigato dalla migliore so-pravvivenza a 5 anni ( da 17% a 20%).
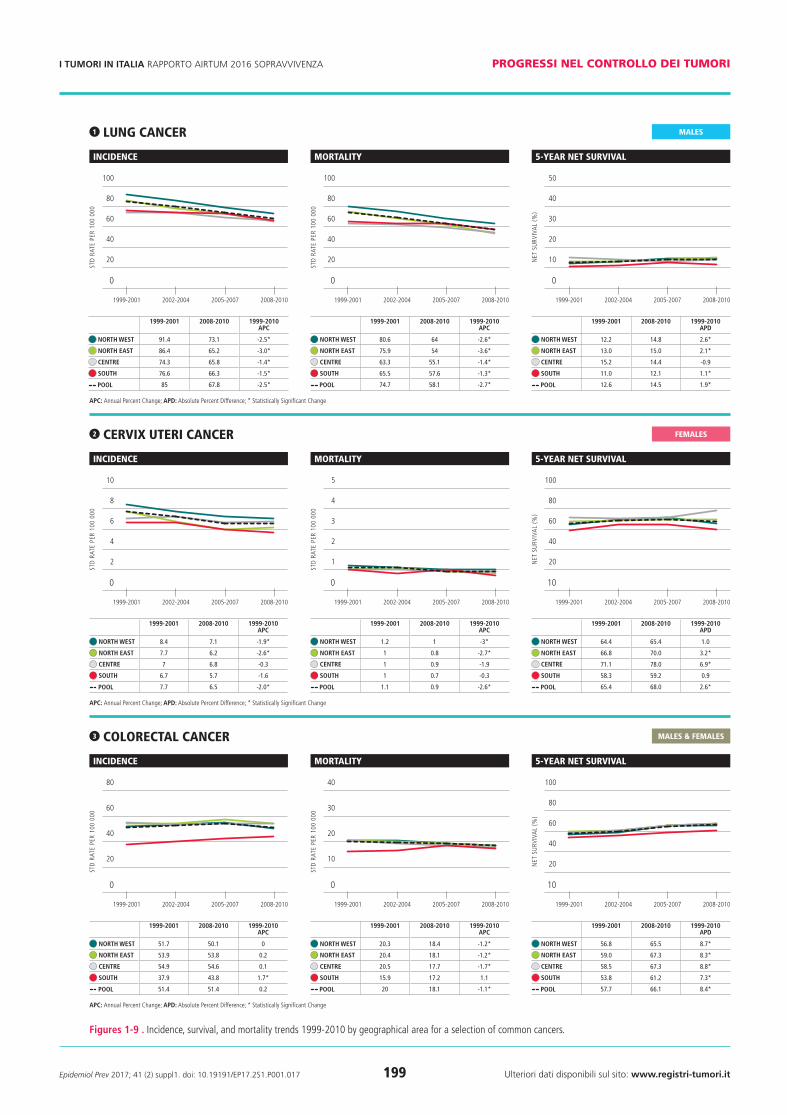
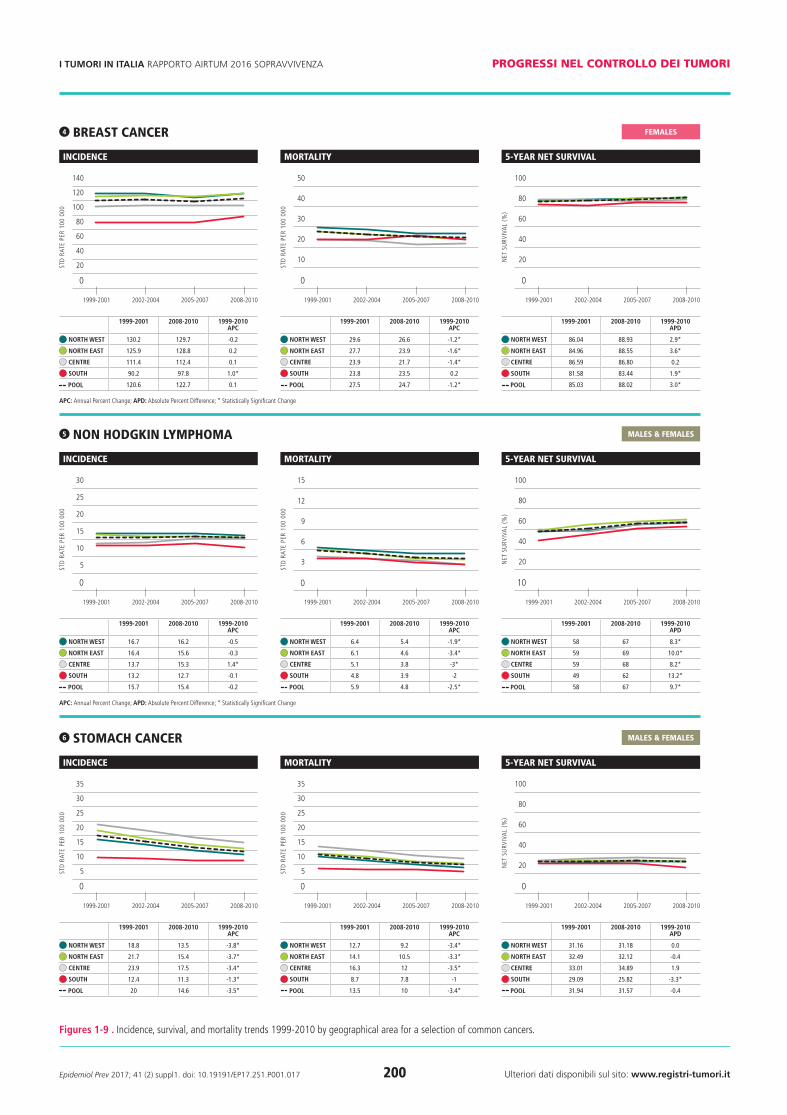
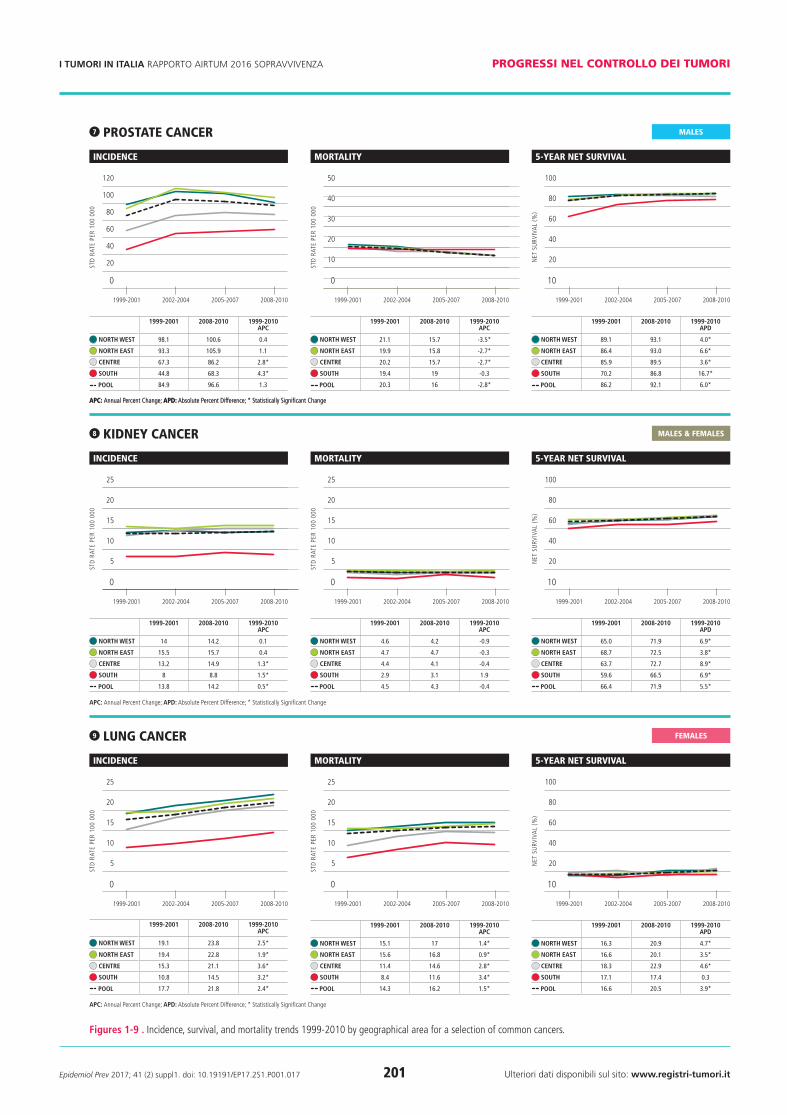
Le Figure 1-9 presentano andamenti più dettagliati per area geografica e per alcuni tumori principali o maggior-mente interessati da incrementi di sopravvivenza.
consequence of better prognosis (5-year net survival increased from 2.8% to 6% in absolute terms). The time trend com-bination was also ambivalent for ovarian cancer whose inci-dence declined modestly (from 13 to 11.8, -1.1% annually) without a consequent reduced mortality, even with slightly im-proved patient survival (+3.3%).
No Progress is achieved when cancer burden worsens, i.e., incidence and mortality are both on the rise, even though survival improves (pattern E).e. No progress: increasing survival, increasing incidence and mortality. No progress is achieved when cancer burden globally increases, as for lung cancer in women. Incidence rates increased annually by 2.4% in 1999-2010 (from 17.7 to 21.8 per 100,000) and the mortality increase (APC +1.5%) was possibly mitigated by a small, but statistically significant, 5-year net survival improvement (from 17% to 20%).
Figures 1-9 present time trends by geographical area for a se-lection of common cancers.Cancer risk profiles in Italy are characterized by a North to South gradient, coherently with an associated socio-economic deprivation gradient.Lower values but less favourable time trends in cancer burden were observed in Southern Italy, compared to the North and to the national average, for male lung, cervix uteri, colon-rec-tum, female breast, non-Hodgkin lymphoma, stomach, pros-tate, kidney, and female lung cancer. For all these neoplasms, 5-year net survival was lower than average in Southern Italy. Northern areas, on the contrary, showed a higher burden and the most favourable time trends for the three indicators. Nota-ble exceptions were stomach cancer, more frequent in Central Italy, and liver and bladder cancers, for which the highest risk is in Southern Italy (results not shown).
discussionIncidence, survival and mortality are the three epidemiologi-cal indicators needed to fully describe disease progression from diagnosis to death due to cancer. By combining time trends of these three indicators we identified descriptive patterns dis-criminating optimal/partial – or inadequate – progress in cancer control. We analysed 5-year net survival time trends for 1999-2010 in Italy for 17 major cancer types in combination with as-sociated age-adjusted incidence and mortality rates. Survival significantly increased for all the tumours taken into consid-eration, except for gastric cancer and all leukaemias. Survival changes were particularly marked for lymphomas and colorec-tal, prostate, and kidney cancer. Incidence increased dramat-ically for prostate and thyroid cancers and for lung cancer in
continua a pagina 202 continued on page 202
192_204_AIRTUM_2017.indd 198 26/04/17 10.34
Epidemiol Prev 2017; 41 (2) suppl1. doi: 10.19191/EP17.2S1.P001.017 199 Ulteriori dati disponibili sul sito: www.registri-tumori.it
I TUMORI IN ITALIA RAPPORTO AIRTUM 2016 SOPRAVVIVENZA progressi nel controllo dei tumori
males & Females
1 lung cancer
incidence
std
rat
e pe
r 10
0 00
0
100
80
60
40
20
0
1999-2001 2002-2004 2005-2007 2008-2010
1999-2001 2008-2010 1999-2010aPC
NortH west 91.4 73.1 -2.5*
NortH east 86.4 65.2 -3.0*
CeNtre 74.3 65.8 -1.4*
soUtH 76.6 66.3 -1.5*
Pool 85 67.8 -2.5*
mortality
std
rat
e pe
r 10
0 00
0
100
80
60
40
20
0
1999-2001 2002-2004 2005-2007 2008-2010
1999-2001 2008-2010 1999-2010aPC
NortH west 80.6 64 -2.6*
NortH east 75.9 54 -3.6*
CeNtre 63.3 55.1 -1.4*
soUtH 65.5 57.6 -1.3*
Pool 74.7 58.1 -2.7*
5-year net survival
net
su
rviv
al
(%)
50
40
30
20
10
0
1999-2001 2002-2004 2005-2007 2008-2010
1999-2001 2008-2010 1999-2010aPD
NortH west 12.2 14.8 2.6*
NortH east 13.0 15.0 2.1*
CeNtre 15.2 14.4 -0.9
soUtH 11.0 12.1 1.1*
Pool 12.6 14.5 1.9*
aPC: annual percent change; aPD: absolute percent difference; * statistically significant change
2 cerviX uteri cancer
incidence
std
rat
e pe
r 10
0 00
0
10
8
6
4
2
0
1999-2001 2002-2004 2005-2007 2008-2010
1999-2001 2008-2010 1999-2010aPC
NortH west 8.4 7.1 -1.9*
NortH east 7.7 6.2 -2.6*
CeNtre 7 6.8 -0.3
soUtH 6.7 5.7 -1.6
Pool 7.7 6.5 -2.0*
mortality
std
rat
e pe
r 10
0 00
0
5
4
3
2
1
0
1999-2001 2002-2004 2005-2007 2008-2010
1999-2001 2008-2010 1999-2010aPC
NortH west 1.2 1 -3*
NortH east 1 0.8 -2.7*
CeNtre 1 0.9 -1.9
soUtH 1 0.7 -0.3
Pool 1.1 0.9 -2.6*
5-year net survival
net
su
rviv
al
(%)
100
80
60
40
20
10
1999-2001 2002-2004 2005-2007 2008-2010
1999-2001 2008-2010 1999-2010aPD
NortH west 64.4 65.4 1.0
NortH east 66.8 70.0 3.2*
CeNtre 71.1 78.0 6.9*
soUtH 58.3 59.2 0.9
Pool 65.4 68.0 2.6*
aPC: annual percent change; aPD: absolute percent difference; * statistically significant change
3 colorectal cancer
incidence
std
rat
e pe
r 10
0 00
0
80
60
40
20
0
1999-2001 2002-2004 2005-2007 2008-2010
1999-2001 2008-2010 1999-2010aPC
NortH west 51.7 50.1 0
NortH east 53.9 53.8 0.2
CeNtre 54.9 54.6 0.1
soUtH 37.9 43.8 1.7*
Pool 51.4 51.4 0.2
mortality
std
rat
e pe
r 10
0 00
0
40
30
20
10
0
1999-2001 2002-2004 2005-2007 2008-2010
1999-2001 2008-2010 1999-2010aPC
NortH west 20.3 18.4 -1.2*
NortH east 20.4 18.1 -1.2*
CeNtre 20.5 17.7 -1.7*
soUtH 15.9 17.2 1.1
Pool 20 18.1 -1.1*
5-year net survival
net
su
rviv
al
(%)
100
80
60
40
20
10
1999-2001 2002-2004 2005-2007 2008-2010
1999-2001 2008-2010 1999-2010aPD
NortH west 56.8 65.5 8.7*
NortH east 59.0 67.3 8.3*
CeNtre 58.5 67.3 8.8*
soUtH 53.8 61.2 7.3*
Pool 57.7 66.1 8.4*
aPC: annual percent change; aPD: absolute percent difference; * statistically significant change
males
Females
Figures 1-9 . incidence, survival, and mortality trends 1999-2010 by geographical area for a selection of common cancers.
192_204_AIRTUM_2017.indd 199 26/04/17 10.34
Epidemiol Prev 2017; 41 (2) suppl1. doi: 10.19191/EP17.2S1.P001.017 200 Ulteriori dati disponibili sul sito: www.registri-tumori.it
I TUMORI IN ITALIA RAPPORTO AIRTUM 2016 SOPRAVVIVENZA progressi nel controllo dei tumori
4 Breast cancer
incidence
std
rat
e pe
r 10
0 00
0
140
120
100
80
60
40
20
0
1999-2001 2002-2004 2005-2007 2008-2010
1999-2001 2008-2010 1999-2010aPC
NortH west 130.2 129.7 -0.2
NortH east 125.9 128.8 0.2
CeNtre 111.4 112.4 0.1
soUtH 90.2 97.8 1.0*
Pool 120.6 122.7 0.1
mortality
std
rat
e pe
r 10
0 00
0
50
40
30
20
10
0
1999-2001 2002-2004 2005-2007 2008-2010
1999-2001 2008-2010 1999-2010aPC
NortH west 29.6 26.6 -1.2*
NortH east 27.7 23.9 -1.6*
CeNtre 23.9 21.7 -1.4*
soUtH 23.8 23.5 0.2
Pool 27.5 24.7 -1.2*
aPC: annual percent change; aPD: absolute percent difference; * statistically significant change
5-year net survival
net
su
rviv
al
(%)
100
80
60
40
20
0
1999-2001 2002-2004 2005-2007 2008-2010
1999-2001 2008-2010 1999-2010aPD
NortH west 86.04 88.93 2.9*
NortH east 84.96 88.55 3.6*
CeNtre 86.59 86.80 0.2
soUtH 81.58 83.44 1.9*
Pool 85.03 88.02 3.0*
5 non HodgKin lympHoma
incidence
std
rat
e pe
r 10
0 00
0
30
25
20
15
10
5
0
1999-2001 2002-2004 2005-2007 2008-2010
1999-2001 2008-2010 1999-2010aPC
NortH west 16.7 16.2 -0.5
NortH east 16.4 15.6 -0.3
CeNtre 13.7 15.3 1.4*
soUtH 13.2 12.7 -0.1
Pool 15.7 15.4 -0.2
mortality
std
rat
e pe
r 10
0 00
0
15
12
6
9
3
0
1999-2001 2002-2004 2005-2007 2008-2010
1999-2001 2008-2010 1999-2010aPC
NortH west 6.4 5.4 -1.9*
NortH east 6.1 4.6 -3.4*
CeNtre 5.1 3.8 -3*
soUtH 4.8 3.9 -2
Pool 5.9 4.8 -2.5*
aPC: annual percent change; aPD: absolute percent difference; * statistically significant change
5-year net survival
net
su
rviv
al
(%)
100
80
60
40
20
10
1999-2001 2002-2004 2005-2007 2008-2010
1999-2001 2008-2010 1999-2010aPD
NortH west 58 67 8.3*
NortH east 59 69 10.0*
CeNtre 59 68 8.2*
soUtH 49 62 13.2*
Pool 58 67 9.7*
males & Females
Females
6 stomacH cancer
incidence
std
rat
e pe
r 10
0 00
0
35
20
25
30
15
10
5
0
35
20
25
30
15
10
5
0
1999-2001 2002-2004 2005-2007 2008-2010
1999-2001 2008-2010 1999-2010aPC
NortH west 18.8 13.5 -3.8*
NortH east 21.7 15.4 -3.7*
CeNtre 23.9 17.5 -3.4*
soUtH 12.4 11.3 -1.3*
Pool 20 14.6 -3.5*
mortality
std
rat
e pe
r 10
0 00
0
1999-2001 2002-2004 2005-2007 2008-2010
1999-2001 2008-2010 1999-2010aPC
NortH west 12.7 9.2 -3.4*
NortH east 14.1 10.5 -3.3*
CeNtre 16.3 12 -3.5*
soUtH 8.7 7.8 -1
Pool 13.5 10 -3.4*
5-year net survival
net
su
rviv
al
(%)
100
80
60
40
20
0
1999-2001 2002-2004 2005-2007 2008-2010
1999-2001 2008-2010 1999-2010aPD
NortH west 31.16 31.18 0.0
NortH east 32.49 32.12 -0.4
CeNtre 33.01 34.89 1.9
soUtH 29.09 25.82 -3.3*
Pool 31.94 31.57 -0.4
males & Females
Figures 1-9 . incidence, survival, and mortality trends 1999-2010 by geographical area for a selection of common cancers.
192_204_AIRTUM_2017.indd 200 26/04/17 10.34
Epidemiol Prev 2017; 41 (2) suppl1. doi: 10.19191/EP17.2S1.P001.017 201 Ulteriori dati disponibili sul sito: www.registri-tumori.it
I TUMORI IN ITALIA RAPPORTO AIRTUM 2016 SOPRAVVIVENZA progressi nel controllo dei tumori
aPC: annual percent change; aPD: absolute percent difference; * statistically significant change
8 Kidney cancer
incidence
std
rat
e pe
r 10
0 00
0
25
20
15
10
5
0
1999-2001 2002-2004 2005-2007 2008-2010
1999-2001 2008-2010 1999-2010aPC
NortH west 14 14.2 0.1
NortH east 15.5 15.7 0.4
CeNtre 13.2 14.9 1.3*
soUtH 8 8.8 1.5*
Pool 13.8 14.2 0.5*
mortality
std
rat
e pe
r 10
0 00
0
25
20
15
10
5
0
1999-2001 2002-2004 2005-2007 2008-2010
1999-2001 2008-2010 1999-2010aPC
NortH west 4.6 4.2 -0.9
NortH east 4.7 4.7 -0.3
CeNtre 4.4 4.1 -0.4
soUtH 2.9 3.1 1.9
Pool 4.5 4.3 -0.4
5-year net survival
net
su
rviv
al
(%)
100
80
60
40
20
10
1999-2001 2002-2004 2005-2007 2008-2010
1999-2001 2008-2010 1999-2010aPD
NortH west 65.0 71.9 6.9*
NortH east 68.7 72.5 3.8*
CeNtre 63.7 72.7 8.9*
soUtH 59.6 66.5 6.9*
Pool 66.4 71.9 5.5*
aPC: annual percent change; aPD: absolute percent difference; * statistically significant change
9 lung cancer
incidence
std
rat
e pe
r 10
0 00
0
25
20
15
10
5 5
0
1999-2001 2002-2004 2005-2007 2008-2010
1999-2001 2008-2010 1999-2010aPC
NortH west 19.1 23.8 2.5*
NortH east 19.4 22.8 1.9*
CeNtre 15.3 21.1 3.6*
soUtH 10.8 14.5 3.2*
Pool 17.7 21.8 2.4*
mortality
std
rat
e pe
r 10
0 00
0
25
20
15
10
0
1999-2001 2002-2004 2005-2007 2008-2010
1999-2001 2008-2010 1999-2010aPC
NortH west 15.1 17 1.4*
NortH east 15.6 16.8 0.9*
CeNtre 11.4 14.6 2.8*
soUtH 8.4 11.6 3.4*
Pool 14.3 16.2 1.5*
5-year net survival
net
su
rviv
al
(%)
100
80
60
40
20
10
1999-2001 2002-2004 2005-2007 2008-2010
1999-2001 2008-2010 1999-2010aPD
NortH west 16.3 20.9 4.7*
NortH east 16.6 20.1 3.5*
CeNtre 18.3 22.9 4.6*
soUtH 17.1 17.4 0.3
Pool 16.6 20.5 3.9*
aPC: annual percent change; aPD: absolute percent difference; * statistically significant change
males & Females
Females
7 prostate cancer
incidence
std
rat
e pe
r 10
0 00
0
120
100
80
60
40
20
0
1999-2001 2002-2004 2005-2007 2008-2010
1999-2001 2008-2010 1999-2010aPC
NortH west 98.1 100.6 0.4
NortH east 93.3 105.9 1.1
CeNtre 67.3 86.2 2.8*
soUtH 44.8 68.3 4.3*
Pool 84.9 96.6 1.3
mortality
std
rat
e pe
r 10
0 00
0
50
40
30
20
10
0
1999-2001 2002-2004 2005-2007 2008-2010
1999-2001 2008-2010 1999-2010aPC
NortH west 21.1 15.7 -3.5*
NortH east 19.9 15.8 -2.7*
CeNtre 20.2 15.7 -2.7*
soUtH 19.4 19 -0.3
Pool 20.3 16 -2.8*
aPC: annual percent change; aPD: absolute percent difference; * statistically significant change
5-year net survival
net
su
rviv
al
(%)
100
80
60
40
20
10
1999-2001 2002-2004 2005-2007 2008-2010
1999-2001 2008-2010 1999-2010aPD
NortH west 89.1 93.1 4.0*
NortH east 86.4 93.0 6.6*
CeNtre 85.9 89.5 3.6*
soUtH 70.2 86.8 16.7*
Pool 86.2 92.1 6.0*
males
Figures 1-9 . incidence, survival, and mortality trends 1999-2010 by geographical area for a selection of common cancers.
192_204_AIRTUM_2017.indd 201 26/04/17 10.34
Epidemiol Prev 2017; 41 (2) suppl1. doi: 10.19191/EP17.2S1.P001.017 202 Ulteriori dati disponibili sul sito: www.registri-tumori.it
I TUMORI IN ITALIA RAPPORTO AIRTUM 2016 SOPRAVVIVENZA progressi nel controllo dei tumori
Il profilo di rischio oncologico in Italia è caratterizzato da un netto gradiente Nord-Sud, coerentemente con l’asso-ciato gradiente di deprivazione socio-economica. Nel Sud Italia si osservano livelli di rischio di malattia più bassi, ma andamenti meno favorevoli rispetto al Nord e alla media nazionale per tumore del polmone maschile, cervice uteri-na, mammella, colon retto, stomaco, prostata, rene, tumo-re polmonare femminile e linfoma non Hodgkin. Per tutte queste neoplasie la sopravvivenza netta a 5 anni dalla dia-gnosi è più bassa della media nel Meridione. Le areea del Nord, al contrario, hanno tassi di rischio più elevati e ten-denze più favorevoli nei tre indicatori. Eccezioni di rilievo sono costituite dal tumore gastrico, più frequente nel Cen-tro Italia, e dai tumori di fegato e vescica, con rischio di malattia più elevato al Sud (risultati non mostrati).
discussioneIncidenza, sopravvivenza e mortalità sono le tre grandezze necessarie per descrivere in modo completo la progressione dalla diagnosi al decesso per tumore. Combinando gli anda-menti temporali di questi tre indicatori abbiamo identifica-to categorie descrittive che discriminano progressi ottimali, parziali o inadeguati raggiunti nel controllo del cancro.Abbiamo analizzato le tendenze 1999-2010 della sopravvi-venza netta a 5 anni in Italia per 17 tipi di tumore compa-randoli con gli associati andamenti dei tassi di mortalità e in-cidenza standardizzati per età. La sopravvivenza è aumentata in modo significativo per tutti i tumori considerati, tranne per il tumore gastrico – e l’insieme delle leucemie. Si sono riscontrati rilevanti incrementi di sopravvivenza per linfomi, tumori colorettali, prostatici, renali e del fe-gato. L’incidenza è aumentata per i tumori della prostata, della tiroide e per il tumore polmonare femminile. Più mo-desti, sebbene significativi, gli incrementi di incidenza per i tumori di pancreas, rene e linfoma di Hodgkin. La morta-lità è risultata in riduzione o stabile per tutti i tumori, tran-ne per il tumore del polmone femminile. Le considerazioni fatte a livello nazionale sono modulate da un gradiente Nord-Sud su scala regionale. E’ vero che il carico sanitario dei tumori è generalmente massimo al Nord e minimo al Sud, ma la situazione è ribaltata se osser-viamo le tendenze, generalmente più favorevoli nelle regio-ni del Nord, per esempio per colon retto e mammella. Di conseguenza il divario di incidenza tra Nord e Sud tende a restringersi e, se questi andamenti proseguiranno in futuro, il Sud Italia diventerà l’area a maggior rischio. La copertura di registrazione in Italia non è uniforme nel tempo e il periodo 1999-2010 rappresenta un compro-messo per massimizzare l’intervallo temporale (12 anni) e contemporaneamente la copertura geografica. Per tumori a buona prognosi, quali i tumori di mammella, prostata,
women, and only slightly for pancreatic cancer, kidney cancer, and Hodgkin lymphoma. Mortality rates decreased or were stable for all examined tumours but lung cancer in women. Progress/regress patterns seen at the national level are modu-lated by a North to South regional gradient. The cancer bur-den was generally highest in Northern Italy and lowest in the South, but the situation is reversed in terms of trends, which were more favourable in Northern regions, for instance for colorectal and breast cancers. These trends led the North-to-South gap to shrink over time. If these tendencies are con-firmed in the future, the Southern areas of the country will be-come those at highest risk. Registration coverage in Italy is not uniform over time and the period 1999-2010 represents a compromise to obtain the long-est period (twelve years) with the highest coverage of all coun-try areas. For high prognosis cancers, like breast, prostate, or thyroid cancer, or Hodgkin lymphoma, mortality 1999-2010 time trends reflect a non-negligible (and varying over time) proportion of deaths among patients diagnosed before 1999, and this limits the correlation between incidence and mortal-ity trends.3 A longer time series would be needed for a more accurate assessment. Survival changes may also be due to shifts in the case-mix by stage (due to improved diagnostics or screening), subsite, or morphology (due to changes in the prevalence of risk factors in the population). Analyses of incidence-based mortality and mortality by stage at diagnosis, which were not possible in this study, would help to make a more proper assessment.7,8
Progress and failure in primary prevention emerged clearly for lung cancer: optimal progress was achieved for men, while no progress emerged for women. The dramatic reduction in male smoker prevalence represents a big success of prevention cam-paigns, and mitigated the parallel rise in the number of female smokers. The small prognostic improvements also likely con-tributed to reduce mortality. All cancer types targeted by mass screening campaigns in It-aly – cervical, breast, and colorectal cancer – showed posi-tive trends (patterns A or B). The drop in incidence of cervi-cal cancer reflects early detection through Pap test and removal of pre-cancerous lesions. A similar preventive effect is also giv-en by colonoscopy. Survival increased remarkably for colorectal cancers, as a consequence of earlier diagnosis, surgical and ad-juvant therapy advancements,16 and this contributed to mor-tality decline. Non-Hodgkin lymphoma benefited from relevant therapeutic advances introduced in clinical practice in the early 2000s.17
Increased survival, the highest absolute increase among the ex-amined cancer types, had an impact on mortality, which de-clined remarkably even in a context of stable incidence. Diagnostic changes and increased surveillance may imply overdiagnosis, i.e., detection of tumours that would not have
continua da pagina 198 continued from page 198
192_204_AIRTUM_2017.indd 202 26/04/17 10.34
Epidemiol Prev 2017; 41 (2) suppl1. doi: 10.19191/EP17.2S1.P001.017 203 Ulteriori dati disponibili sul sito: www.registri-tumori.it
I TUMORI IN ITALIA RAPPORTO AIRTUM 2016 SOPRAVVIVENZA progressi nel controllo dei tumori
tiroide o linfoma di Hodgkin, le tendenze della mortalità 1999-2010 riflettono una quota non trascurabile (oltretut-to variabile nel tempo) di decessi tra casi diagnosticati pri-ma del 1999, e questo limita la correlazione tra le tendenze di incidenza e mortalità.3 Per una valutazione più accurata sarebbero necessarie serie temporali più lunghe.La sopravvivenza può cambiare anche a seguito di variazio-ni nella composizione dei casi per stadio, sottosede o mor-fologia, a fronte di migliori tecniche diagnostiche, scree-ning o cambiamenti nella prevalenza dei fattori di rischio nella popolazione. L’analisi della mortalità dei casi inciden-ti aiuterebbe questo tipo di valutazioni, ma non è stata pos-sibile in questo studio.7,8
I progressi e le criticità nella prevenzione primaria emer-gono chiaramente nel caso del tumore polmonare: si sono raggiunti ottimi progressi per gli uomini, mentre per le donne la situazione è ancora critica e plausibilmente in peggioramento. La minor prevalenza di fumatori nel sesso maschile rappresenta un grande successo delle campagne antifumo. Queste misure hanno limitato verosimilmen-te anche l’aumento di fumatrici. Anche i piccoli migliora-menti prognostici possono aver avuto un ruolo nel ridurre la mortalità (o nel contenerne l’aumento).Tutti i tumori obiettivo dei programmi di screening Italia-ni – cervice uterina, mammella e colon retto – hanno mo-strato tendenze positive (pattern A e B). Il calo di incidenza del cervicocarcinoma riflette l’individuazione precoce della malattia attraverso il pap-test e la rimozione di forme pre-cancerose. Un simile effetto preventivo si ha anche con la colonscopia. Il notevole incremento di sopravvivenza per i tumori colorettali, conseguente sia a diagnosi più precoce sia ad avanzamenti in chirurgia e terapia adiuvante,16 ha contribuito verosimilmente a ridurne la mortalità.I linfomi non-Hodgkin hanno beneficiato di importanti progressi terapeutici entrati nella pratica clinica nei primi anni Duemila.17 L’incremento di sopravvivenza, il più alto in termini assoluti tra tutti i tumori esaminati, ha avuto un impatto sugli andamenti di mortalità che si è ridotta perfi-no in un contesto di incidenza stabile.Cambiamenti diagnostici e aumentata sorveglianza posso-no implicare sovradiagnosi, ossia l’individuazione di tumo-ri che non sarebbero mai stati letali. Un tipico esempio è rappresentato dai tumori tiroidei la cui incidenza è aumen-tata enormemente, a fronte di lievi incrementi di sopravvi-venza e nessun cambiamento per la mortalità. Queste ten-denze riflettono in larga misura infatti la crescente diagnosi di piccole lesioni papillari non fatali che inflazionano l’in-cidenza, provocano leggeri aumenti di sopravvivenza sen-za nessun riflesso sulla mortalità, un fenomeno osservato in molti paesi.18 Andamenti simili si osservano per il tumo-re prostatico: l’incidenza è cresciuta in modo marcato, con
caused death. An example is represented by thyroid cancer. In-cidence increased dramatically in the study period, survival increased only slightly, while mortality did not change. This pattern largely reflects increased diagnosis of non-fatal small papillary lesions, inflating incidence and increasing survival, with no impact on mortality, a phenomenon observed in many countries.18 A similar pattern is observable for prostate cancer: incidence rose sharply, with a peak in the middle of the study period and a stabilization thereafter, but this had no conse-quences on mortality, which, conversely, declined significant-ly. This pattern reflects the widespread diffusion of PSA test-ing ,with overdiagnosis of non-fatal prostate cancers, mixed with possible benefits from earlier diagnosis and improved pa-tient care.19 A documented lower population coverage and a delayed im-plementation of organized screening in Southern regions20 are factors to be considered to explain the lower performance, in terms of outcome and cancer burden reduction, observed in Southern Italy. Socio-economic disparities also contribute to explain the less favourable tendencies observed in the South, since most cancer risk factors – e.g., smoking, alcohol con-sumption, obesity/overweight, high consumption of saturated fats – are associated with socio-economic deprivation. Time trends of official statistics show, for instance, a systematically higher prevalence in Southern Italy compared to the North, of smoking (among men) and obesity (both sexes).21 Patterns of cancer burden and outcome observed in Italy for cervical cancer, lung cancer in men, colorectal cancer, non-Hodgkin lymphoma, kidney, thyroid, prostate, and lung can-cer in women are similar to those observed over the same peri-od in international studies in the US6 and the Netherlands.7
Although far from exhaustive, this first joint epidemiologi-cal evaluation of cancer burden and outcome trends in Ita-ly has highlighted relevant progress resulting from successful prevention, screening implementation, and more effective pa-tient management. Reducing smoking prevalence, particular-ly among women, and ensuring equal access to early diagnosis and best care, particularly in more deprived areas, are priori-ties for further improvement.
192_204_AIRTUM_2017.indd 203 26/04/17 10.34
Epidemiol Prev 2017; 41 (2) suppl1. doi: 10.19191/EP17.2S1.P001.017 204 Ulteriori dati disponibili sul sito: www.registri-tumori.it
I TUMORI IN ITALIA RAPPORTO AIRTUM 2016 SOPRAVVIVENZA progressi nel controllo dei tumori
un picco a metà del periodo di studio e una stabilizzazione successiva (Figura 7), ma questo non ha avuto effetti sulla mortalità che, al contrario, è diminuita significativamente. Questo pattern riflette l’effetto combinato di sovradiagno-si di tumori non fatali conseguente alla diffusione del test PSA, e di reali benefici derivanti da anticipazione diagno-stica e migliorata gestione dei pazienti.19
Una documentata minor copertura di popolazione e una ritardata implementazione degli screening organizzati nel-le regioni meridionali sono fattori da considerare per spie-gare la bassa performance osservata nel Sud Italia.20 Anche le disparità socio-economiche contribuiscono a spiega-re le tendenze meno favorevoli registrate al Sud rispetto al Nord. La maggior parte dei fattori di rischio del can-cro – quali fumo, consumo di alcol, obesità e sovrappeso, alto consumo di grassi saturi, sono infatti associati a depri-vazione socioeconomica. Per esempio le tendenze recen-ti osservate nelle statistiche ufficiali mostrano una preva-lenza sistematicamente più elevata nel meridione rispetto al Nord per quanto riguarda fumo (uomini) e obesità (en-trambi i sessi).21
I profili di rischio e di esito osservati in Italia per i tumori di cervice uterina, polmone, colon-retto, rene, tiroide, pro-stata e linfomi non Hodgkin sono simili a quelli osserva-ti nello stesso arco temporale in studi internazionali negli Stati Uniti6 o in Olanda.7Pur non essendo esaustiva, questa prima valutazione epi-demiologica dei profili di rischio ed esito in Italia ha evi-denziato importanti passi avanti nel controllo dei tumori grazie ad azioni preventive di successo, implementazione dello screening oncologico, e più efficace cura dei pazienti. Ridurre la prevalenza di fumatori, in modo particolare nel sesso femminile, e garantire equo accesso a diagnosi pre-coce e a protocolli terapeutici ottimali, in particolare nelle aree più deprivate, rimangono linee strategiche prioritarie per progredire ulteriormente.
BiBliograFia/ reFerences1. de angelis r, sant m, coleman mp, et al. cancer survival in europe 1999-2007 by
country and age: results of eurocare-5-a population-based study. lancet oncol 2014;15(1):23-34.
2. allemani c, Weir aK, carreira h et al global surveillance of cancer survival 1995-2009: analysis of individual data for 25676887 patients from 279 population-based registries in 67 countries (concord-2). lancet 2014;385:977-1010.
3. dickman pW, adami ho. interpreting trends in cancer patient survival. j internal med 2006;260:103-17.
4. autier p, Boniol m. caution needed for country-specific cancer survival. lancet 2011; 377:99-101.
5. ellis l, Woods lm, estève j, eloranta s, coleman mp, rachet B, cancer incidence, sur-vival and mortality: explaining the concepts. int j cancer 2014;135:1774-82.
6. sant m, francisci s, capocaccia r, verdecchia a, allemani c, Berrino f. time trends of breast cancer survival in europe in relation to incidence and mortality. int j cancer 2006;119(10):2417-22.
7. cho h, mariotto a, schwartz lm, luo j, Woloshin s. When do changes in cancer sur-vival mean progress ? the insight form population incidence and mortality. j nat can inst monographs 2014; 49: 187-97.
8. Karim Kos h, Kiemeney l, louwman m, coebergh jW, de vries e. progress against cancer in the netherlands since the late 1980s: an epidemiological evaluation. int j cancer 2012;130:2981-89.
9. minicozzi p, otter r, primic-Žakelj m, francisci s (eds) survival of cancer patients in europe, 1999–2007: the eurocare-5 study. eur j cancer 2015;1(15): 2099-2268.
10. airtum Working group. report 2016. la sopravvivenza dei pazienti oncologici in italia. epidemiol prev 2017;41(2) suppl1:205-26
11. https://surveillance.cancer.gov/joinpoint/download12. pohar perme m, stare j, estève j. on estimation in relative survival. Biometrics
2012;68(1):113-20.13. Brenner h and rachet B. hybrid analysis for up-to-date long-term survival rates in
cancer registries with delayed recording of incident cases. eur j cancer 2004; 40(16): 2494-501.
14. corazziari i, Quinn m, capocaccia r. standard cancer patient population for age standardising survival ratios. eur j cancer. 2004;40(15):2307-16.
15. dickman pW, coviello e. estimating and modelling relative survival. the stata journal 2015; 15:186-215.
16. Wolpin Bm, meyerhardt ja, mamon hj, et al. adjuvant treatment of colorectal can-cer. ca cancer j clin 2007;57(3):168-85.
17. shankland Kr, armitage jo, hancock BW. non-hodgkin lymphoma. lan-cet 2012;380(9844):848-57.
18. vaccarella s, franceschi s, Bray f, et al. Worldwide thyroid-cancer epidemic? the in-creasing impact of overdiagnosis. new engl j med 2016; 2016;375(7):614-17.
19. schröder fh, hugosson j, roobol mj, tammela tl, Zappa m, et al. screening and prostate cancer mortality: results of the european randomised study of screen-ing for prostate cancer (erspc) at 13 years of follow-up. lancet 2014;384 (9959):2027-35.
20. osservatorio nazionale screening. undicesimo rapporto 2015. epidemiol prev 2015;39(3) suppl 1:1-125.
21. heath for all italy database. https://www.istat.it/it/archivio/14562
192_204_AIRTUM_2017.indd 204 26/04/17 10.34