PPoorrttuuggaall abbe effoorree oaanndd iafftterr tthhee...
26
“Portugal before and after the European Union: Facts on Nontradables” Fernando Alexandre Pedro Bação NIPE WP 15/ 2012
Transcript of PPoorrttuuggaall abbe effoorree oaanndd iafftterr tthhee...

““PPoorrttuuggaall bbeeffoorree aanndd aafftteerr tthhee EEuurrooppeeaann UUnniioonn:: FFaaccttss
oonn NNoonnttrraaddaabblleess””
FFeerrnnaannddoo AAlleexxaannddrree
PPeeddrroo BBaaççããoo
NIPE WP 15/ 2012

““PPoorrttuuggaall bbeeffoorree aanndd aafftteerr tthhee EEuurrooppeeaann UUnniioonn:: FFaaccttss
oonn NNoonnttrraaddaabblleess””
FFeerrnnaannddoo AAlleexxaannddrree
PPeeddrroo BBaaççããoo
NNIIPPEE** WWPP 1155// 22001122
URL: http://www.eeg.uminho.pt/economia/nipe
1
Portugal before and after the European Union:
Facts on Nontradables*
Fernando Alexandre†
Pedro Bação‡
Abstract
The rise of nontradable sectors has been mentioned as one of the causes of low
economic growth and external imbalances in the Portuguese economy. In this paper we
describe the main trends and jumps in the evolution of nontradable sectors, since the
mid-1950s, using four different databases to shed light on different dimensions of this
issue. We show that, despite the pattern of the growth of the share of services being
similar to that observed in other developed countries, since the early 1990s it has been
significantly larger than in most countries. We find that the shift to nontradables in
Portugal has been fast and that it occurred essentially at the expense of agriculture in the
period 1953-95, and essentially at the expense of industry in the period 1995-2009. In
2009, the share of nontradables in total GVA reached 61%, if we exclude open service
sectors, and 74.4%, if we treat all service sectors as nontradable. We also find that more
than half of the change towards nontradables since joining the European Union took
place in the period 1988-1993. Finally, we show that construction and services facing a
strong Government demand were the main drivers of the increasing weight of
nontradables in the Portuguese economy since 1986.
1. Introduction
The role of nontradable sectors in the evolution of the Portuguese economy in recent
years has been controversial. Several commentators, among which João Ferreira do
Amaral and Vítor Bento, have argued that nontradable sectors in Portugal have
† Universidade do Minho and NIPE: [email protected].
‡ Universidade de Coimbra and GEMF: [email protected].
* This paper was prepared for a book in honour of João Ferreira do Amaral.

2
benefited from a misallocation of resources. According to Amaral (2006a), membership
of the European Union – and later Eurozone – has imposed a straightjacket on the
Portuguese economy, forcing the opening to international competition and to
international financial markets of an ill-prepared economy, and the surrender of the
exchange-rate instrument, and this has benefitted the rise of nontradable sectors relative
to tradables. Bento (2009) views the rise of nontradables question from a different
angle. According to Bento, the growth of nontradable sectors has essentially been
spurred by their ability (enhanced by Government action) to extract rents, and has
damaged the competitiveness of the Portuguese economy. Either way, both Amaral and
Bento view the shift of resources to nontradable sectors as having contributed to poor
economic growth and to the external imbalances at the root of Portugal's current
predicament.
The European Central Bank, European Commission and International Monetary Fund,
members of the troika that is conducting Portugal’s bailout, seem to share the same
view. The original memorandum of understanding mentions the need to "improve
effectiveness of existing instruments dealing with export promotion and access to
finance and support the reallocation of resources towards the tradable sector" (p. 32).
The last, at the date of writing, review of the adjustment programme (October 2012)
states on page 23 that the troika "urged the authorities to continue exploring options to
reduce production costs and compress mark-ups in the non-tradable sector and boost
productivity." Likewise, both the 2012 OECD Economic Survey of Portugal and the
OECD Economic Outlook stress at several points the need for eliminating the
distortions that tilted the Portuguese economy towards low-productivity domestically-
oriented sectors. This view receives support from work by Amador and Soares (2012),
who concluded that there is substantial room to improve competition in nontradable
sectors.
The rise of nontradables has therefore played an important role both in stories about
how Portugal arrived at its current situation and in the construction of roadmaps for
exiting from the crisis. Assessment of the alternative proposals requires an
understanding of the behaviour of nontradables in Portugal in the last decades.
In this paper we use databases from four different sources – namely, Banco de Portugal,
European Commision, Instituto Nacional de Estatística and the EU Klems Growth and

3
Productivity Accounts Database – to characterize several dimensions of the evolution of
nontradable sectors in the Portuguese economy. We begin by discussing the difficulties
of measuring nontradables in section 2. We then describe the structural change in the
Portuguese economy by placing them in the international context and examining the
long run trends (sections 3 and 4). Finally, in section 5 we identify the periods, after
joining the European Union, in which jumps in the weight of nontradables took place,
and also the sectors which contributed the most for the rising weight of nontradables in
the Portuguese economy.
2. Tradables and Nontradables
In economic theory, nontradable goods are those which are not exposed to international
competition. This may happen as a result of the characteristics of those goods, which
make it difficult to trade them across locations, in particular, across national borders;
barber shops and convenience stores are traditional examples. The immediate
implication of this distinction between tradable and nontradable sectors in economic
theory is that there will be a difference in the behaviour of prices in tradable and
nontradable sectors. In particular, the price of tradable goods will be subject to the law
of one price, while the price of nontradables will depend on domestic demand and
supply.
Balassa (1964) and Samuelson (1964) noted that a consequence of this difference of
behaviour between prices of tradable and nontradable goods ("traded" and "non-traded"
goods for Balassa, "mobile" and "domestic" goods for Samuelson) is that purchasing
power parity will not hold for aggregate price indexes. In effect, the celebrated
"Balassa-Samuelson effect" implies that, as a result of larger productivity differences
across countries in tradable sectors than in nontradable sectors, rich countries' exchange
rates will appear to be overvalued when compared with purchasing power parities
computed with aggregate price indexes. The hypothesis that, as in the Balassa-
Samuelson effect, productivity tends to grow faster in tradable sectors than in
nontradable sectors has become common in economic analyses. This has to do, not with
the fact that some goods are immune to outside competitive pressures – the original
distinctive feature of nontradables –, but with the fact that, in general, tradable goods
are associated with agricultural and manufactured goods – where technological progress

4
is notorious – whereas nontradable goods were thought to be mainly services – where
technological progress is assumed to play a lesser role. Balassa explicitly made this
association, while Samuelson suggested, as examples of nontradables, "cheap Italian
haircuts" and "Niagara-Falls honeymoons", both of which refer to services.
Similarly, in Baumol's view (Baumol, 1967, pp. 415-416), manufacturing sectors are
“technologically progressive activities”, where innovation, capital accumulation and
economies of scale contribute to increases in productivity. On the other hand, services –
such as education and arts – are activities of a nature which allows only “sporadic
increases in productivity.”1 On the basis of this difference in productivity growth,
Baumol (1967) predicted that an increasing weight of services in the economy would
imply a slowdown in economic growth rates. However, innovation in information and
communications technologies (ICT) has changed the way certain services are produced
and delivered,2 and this has enhanced productivity growth. For example, Triplett and
Bosworth (2003) show that labour productivity growth in services in the US, after 1995,
accelerated and was almost identical to the economy-wide average, that is, an annual
growth rate of approximately 2.5%. According to these authors, multifactor
productivity, capital deepening and increased use of intermediate goods were the main
causes of that acceleration – see also Timmer et al. (2010). These findings therefore
suggest that the increasing weight of services is not incompatible with high growth rates
– Ghani (2010), for example, presents evidence on the importance of some service
industries for India’s high growth rates.
Developments in ICT have also contributed to blur the association between services and
nontradables. In fact, although the inclusion of manufacturing in tradable sectors is
consensual, the classification of agriculture, mining and services such as transportation
and communications as tradables has been controversial. Some authors exclude
agriculture and mining from tradable sectors because these sectors, both in Europe and
in the USA, are highly regulated and subsidized by Governments – see, for example,
Camarero (2009). However, the traditional view of services as nontradables is highly
1 According to Baumol, the essential difference between these sectors is in the role of labour: in
technologically progressive activities labour is primarily an instrument used in the production of certain
goods, whereas in the other activities the quality of labour is the fundamental element of the good
being produced, as in a live performance by a music quintet. 2 In fact, this has led to a distinction between modern impersonal services (communication, banking,
insurance and business related services) and traditional personal services (trade, hotel, restaurant,
transport, public administration, among others) – see Ghani (2010).

5
controversial given the development of ICT, which has facilitated transnational trade in
services. For example, Amazon provides stiff competition to local bookshops, while
foreign students have flocked to US and UK universities, suggesting that retail shops
and education institutions are not as immune to international competition as the
traditional view would have it. On the other hand, business services, such as the
software industry, have had an important impact, both on productivity growth and in
exports – see, for example, Timmer et al. (2010). This trend has motivated a different
approach to the classification of services as tradables and nontradables, which takes into
account the weight of international transactions in the sector. Gregorio et al. (1994)
follow this approach and set a 10% threshold for the export to production ratio.
However, this approach results in a classification of tradable and nontradable sectors
very close to the traditional partition. Amador and Soares (2012), using data for the
Portuguese economy, classify as tradable all manufacturing industries plus all sectors
with an export to sales ratio above 15%. Using this restriction, Amador and Soares
classify around 23% of non-manufacturing sectors as tradable, mainly transportation
and business services. In related work, Amador and Cabral (2009) show that services
now represent over 28% of total Portuguese exports, travel and tourism being the largest
contributor, followed by transportation and business services.3
In Table 2.1 we report a measure of openness of each services sector, given by the ratio
of exports plus imports to total resources in each sector, and the weight of each services
sector in total gross value added (GVA) of services sectors, using data from INE for
2009. If we use 20% as the threshold for the openness measure separating tradable from
nontradable sectors, then only "Transportation and storage" and "Publishing,
audiovisual and broadcasting activities" will qualify as tradable sectors. These two
sectors account for only 7.5% of GVA in services. Using this threshold, agriculture and
all manufactures will be classified as tradable sectors. Borderline sectors, such as
"Electricity, gas, steam and air-conditioning supply", "Water, sewerage, waste
management and remediation activities" and "Construction" will fall to the nontradables
side. If we lower the threshold to 15%, then "Wholesale and retail trade, repair of motor
vehicles and motorcycles", "Computer programming, consultancy and related activities;
information service activities" and "Legal and accounting activities; activities of head
3 On the evolution of tradable services and its openness degree see also Catarino and Claro (2009).
These authors also stress the high growth rate of those sectors relative to the average growth rate of
the economy.

6
offices; management consultancy activities; architecture and engineering activities;
technical testing and analysis" will also be considered tradable sectors. In this case, the
tradable services sectors will represent 31.8% of total GVA in services. If we consider
as nontradables only those service sectors that do not reach the 15% openness threshold,
then the share in total GVA of nontradables in the Portuguese economy, in 2009, is
61%. This is significantly lower than the share of services in total GVA, which is
74.4%. These numbers, together with Amador and Cabral's (2009), show that there are a
number of services sectors with a significant participation in international trade. In this
context, it should be stressed the positive contribution of trade in services to the
Portuguese current account balance. Nevertheless, the higher exposure of manufacturing
sectors to international trade is still clear, which makes the traditional view appear as a
reasonable first approximation. Therefore, we follow this approach in our analysis.
Table 2.1 - Openness of services in the Portuguese economy, 2009
Sectors Openness (1) % GVA
Wholesale and retail trade, repair of motor vehicles and motorcycles
16.20 18.69
Transportation and storage 37.21 6.59 Accommodation and food service activities
6.85 6.68
Publishing, audiovisual and broadcasting activities
22.34 0.91
Telecommunications 10.38 2.94 Computer programming, consultancy and related activities; information service activities
16.73 1.32
Financial and insurance activities 6.78 9.40 Real estate activities 0.12 10.95 Legal and accounting activities; activities of head offices; management consultancy activities; architecture and engineering activities; technical testing and analysis
18.81 4.33
Scientific research and development 8.64 0.52 Advertising and market research; other professional, scientific and technical activities; veterinary activities
11.36 0.78
Administrative and support service activities
8.27 3.42
Public administration and defence; compulsory social security
0.00 12.17
Education 0.03 9.12 Human health services 0.04 6.50 Social work activities 0.06 1.84 Arts, entertainment and recreation 7.07 1.06 Other services activities 0.10 1.45 Activities of households as employers of domestic personnel and undifferentiated goods and services production of households for own use
0.06 1.32
100
Source: Portuguese National Accounts, Instituto Nacional de Estatística.
(1) ratio of exports plus imports to total resources in each sector (%)

7
In the next section we describe the evolution of nontradable sectors in Portugal, since
1970, placing it in the international context.
3. Trends in nontradables in the international context
Since the Second World War services have been the most dynamic sectors in most
OECD countries, currently accounting for around 70% of total Value Added (VA) and
employment (OECD, 2005). In order to understand the evolution of services' share in
Portugal, we should, therefore, begin by placing it in the international context. We use
data aggregated at a broad sector level from the European Commission’s AMECO
database, which considers four sectors: (i) agriculture, forestry and fishery products; (ii)
industry excluding building and construction; (iii) building and construction; (iv)
services. In this section, given the available data, we follow the traditional view and
define nontradables as the sum of services plus building and construction.
Figure 3.1 shows the evolution of nontradables' share of total gross value added in
Portugal, Germany, the USA and Korea.
Figure 3.1 – Evolution of nontradables' share of GVA
Source: AMECO, European Commission.
It is clear from Figure 3.1 that Portugal has followed the long-run trend present in other
countries. In fact, in the sample of countries that we used,4 the USA (and France)
4 Portugal, Germany, Greece, France, Italy, Austria, Finland, United States, Japan, Canada, Australia, Denmark, Netherlands, Belgium, Norway, Mexico, Korea, Sweden, United Kingdom, New Zealand, Turkey, Iceland, Switzerland, Spain and Luxembourg.
40%
45%
50%
55%
60%
65%
70%
75%
80%
85%
19
70
19
73
19
76
19
79
19
82
19
85
19
88
19
91
19
94
19
97
20
00
20
03
20
06
United States
Portugal
Germany
Korea
8
provided an approximate upper bound and Korea provided an approximate lower bound
for nontradables' share.5
In order to analyse the timing of changes in the share of nontradables in different
countries, we depict in Figure 3.2, for each year, the evolution of the difference between
the average share in the half-decade beginning in that year and the average share in the
preceding half-decade, i.e., we filter the share time-series (���) for each country � to
obtain a smoothed series:
��� =
��� + ���
� + ���� + ����
� + �����
5−���� + ���
� + ����� + ����
� + �����
5
The sample was divided into three groups of countries, reflecting the similarity of the
timing of changes in nontradables' share within those groups (except for group 3, which
collects countries with very dissimilar patterns).6
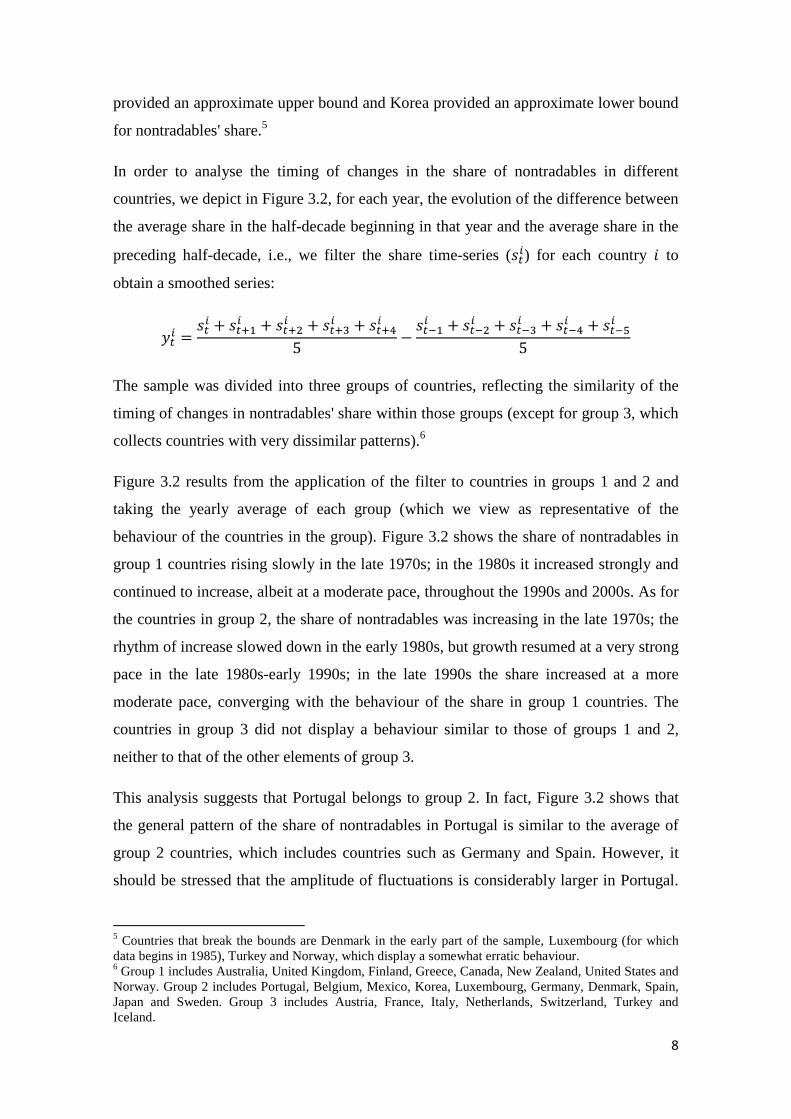
Figure 3.2 results from the application of the filter to countries in groups 1 and 2 and
taking the yearly average of each group (which we view as representative of the
behaviour of the countries in the group). Figure 3.2 shows the share of nontradables in
group 1 countries rising slowly in the late 1970s; in the 1980s it increased strongly and
continued to increase, albeit at a moderate pace, throughout the 1990s and 2000s. As for
the countries in group 2, the share of nontradables was increasing in the late 1970s; the
rhythm of increase slowed down in the early 1980s, but growth resumed at a very strong
pace in the late 1980s-early 1990s; in the late 1990s the share increased at a more
moderate pace, converging with the behaviour of the share in group 1 countries. The
countries in group 3 did not display a behaviour similar to those of groups 1 and 2,
neither to that of the other elements of group 3.
This analysis suggests that Portugal belongs to group 2. In fact, Figure 3.2 shows that
the general pattern of the share of nontradables in Portugal is similar to the average of
group 2 countries, which includes countries such as Germany and Spain. However, it
should be stressed that the amplitude of fluctuations is considerably larger in Portugal.
5 Countries that break the bounds are Denmark in the early part of the sample, Luxembourg (for which data begins in 1985), Turkey and Norway, which display a somewhat erratic behaviour. 6 Group 1 includes Australia, United Kingdom, Finland, Greece, Canada, New Zealand, United States and Norway. Group 2 includes Portugal, Belgium, Mexico, Korea, Luxembourg, Germany, Denmark, Spain, Japan and Sweden. Group 3 includes Austria, France, Italy, Netherlands, Switzerland, Turkey and Iceland.

9
In particular, the growth of the share of nontradables since the early 1990s in Portugal
has been significantly larger than the average of group 2 countries.
Figure 3.2 – Change in the share of nontradables in GVA (smoothed)
Source: AMECO, European Commission, and authors’ computations.
This analysis shows that the shift to nontradables in Portugal happened at a time when
other advanced economies recorded similar increases in the share of nontradables. The
structural change in Portugal therefore mirrors the global trend towards nontradables,
observed in all groups: in an erratic fashion in group 3, since the early 1980s in group 1
and since the late 1980s in group 2. The increasing weight of nontradables, viewed in
the international context, may therefore suggest that the evolution of nontradables in
Portugal does not appear problematic: it is probably due to the same global factors that
led others countries to report similar increases in the share of nontradables. Another
view, shared by Ferreira do Amaral and others, is that the Portuguese economy was not
prepared for such a change and that this change had detrimental effects on the
performance of the Portuguese economy. Further enquiry into this matter requires a
more disaggregated analysis, to which we give a contribution in the next two sections.
We begin by looking in more detail at the long run trends in agriculture, industry,
construction and services in the Portuguese economy in the next section.
-0,04
-0,02
0
0,02
0,04
0,06
0,08
0,1
Group 1
Group 2
Portugal

10
4. Structural change in Portugal, 1953-2009
This section describes the structural change of the Portuguese economy in the last
decades. It uses data for GVA and employment from Banco de Portugal, for the period
1953-1995, and from Instituto Nacional de Estatística, for the period 1995-2009. The
disaggregated analysis of long run trends in nontradables in the Portuguese economy
requires consideration of those two databases. Unfortunately, the caveat that the two
databases are not fully compatible in terms of the classification of sectors must be
acknowledged.
Data on GVA and employment presented below show that structural changes in the
Portuguese economy presented patterns similar to those of other developing and
developed economies, with a drastic reduction in the weight of agriculture and a similar
increase in the weight of services – see, for example, Eichengreen and Gupta (2009) on
the service sector growth. The weight of industry in total GVA and in total employment
was fairly stable throughout most of the period, displaying a declining trend since the
mid-1980s.
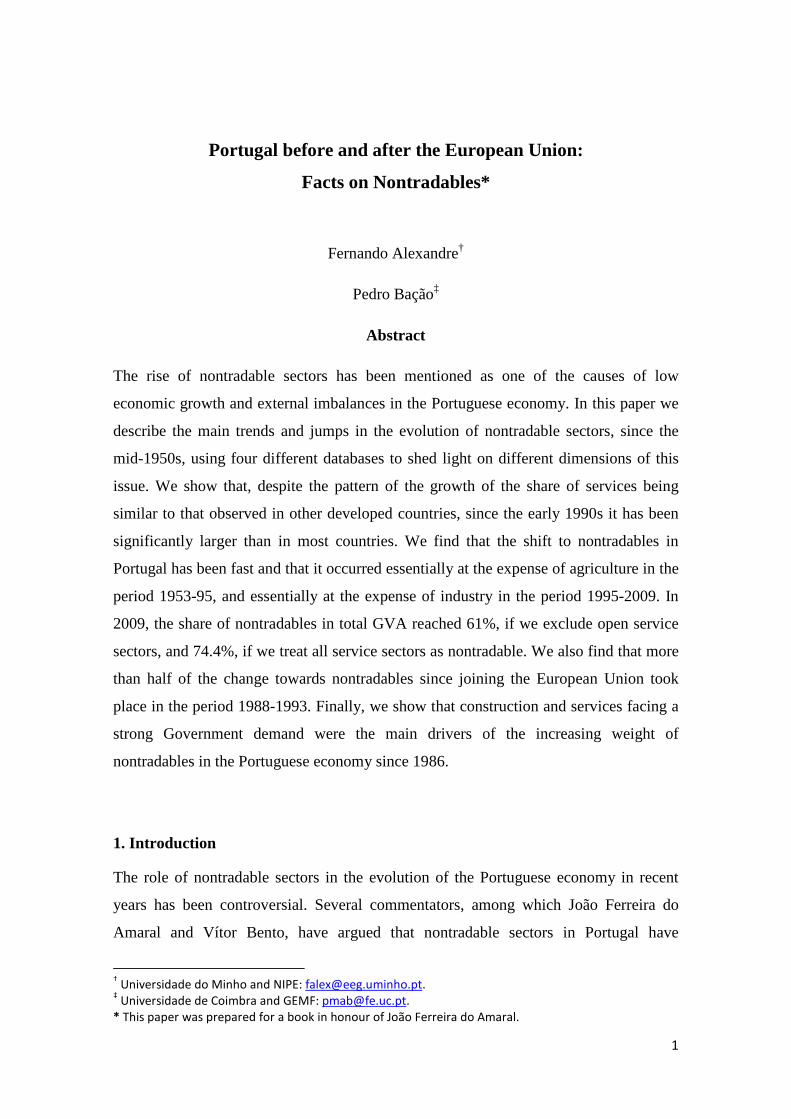
Table 4.1 shows the share of each sector in total GVA in 1953, 1974, 1986 and in 1995
and the difference in percentage points (pp) between 1953 and 1995. Figure 4.1 plots
the evolution of these shares. Table 4.1 reports a very large decline in the weight of
agriculture in GVA, from 28.7% to 6.2%. On the other hand, between 1953 and 1995,
the share of services as a whole jumped 23.1 pp, from 38.4% to 61.5%. Community
services provided by the public sector, which include education and human health
services, increased 9.7 pp, from 5.6% to 15.3% of total GVA. Manufactures' share
declined slightly between 1953 and 1995, while construction's weight rose only 0.5 pp,
from 5.8% to 6.3%. However, this masks the fact that construction's weight was around
or above 10% between 1971 and 1983.
Table 4.1 – Share in total GVA
Sectors 1953 1974 1986 1995 change Agriculture, forestry and fishing
28.7% 11.6% 9.5% 6.2% -22.5 pp
Industry, energy, water supply and sewerage
27.1% 31% 31.3% 26.0% -1.2 pp
Construction 5.8% 11.2% 6.1% 6.3% 0.6 pp Services exc.community 27.3% 32.3% 36.3% 38.0% 10.8 pp Community services (public) 5.6% 7.8% 11.8% 15.3% 9.7 pp Community services (private) 5.5% 6.2% 4.8% 8.2% 2.7 pp Services (total) 38.4% 46.3% 53% 61.5% 23.1 pp
Source: Séries Longas, Banco de Portugal.
11
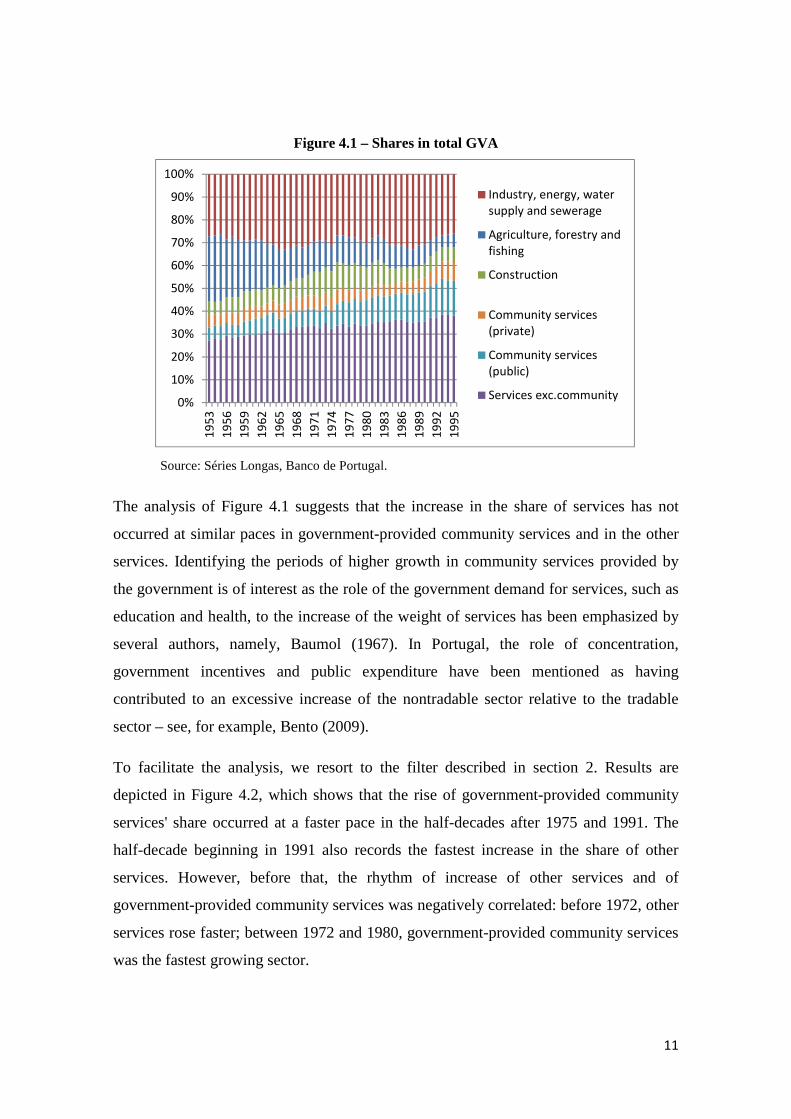
Figure 4.1 – Shares in total GVA
Source: Séries Longas, Banco de Portugal.
The analysis of Figure 4.1 suggests that the increase in the share of services has not
occurred at similar paces in government-provided community services and in the other
services. Identifying the periods of higher growth in community services provided by
the government is of interest as the role of the government demand for services, such as
education and health, to the increase of the weight of services has been emphasized by
several authors, namely, Baumol (1967). In Portugal, the role of concentration,
government incentives and public expenditure have been mentioned as having
contributed to an excessive increase of the nontradable sector relative to the tradable
sector – see, for example, Bento (2009).
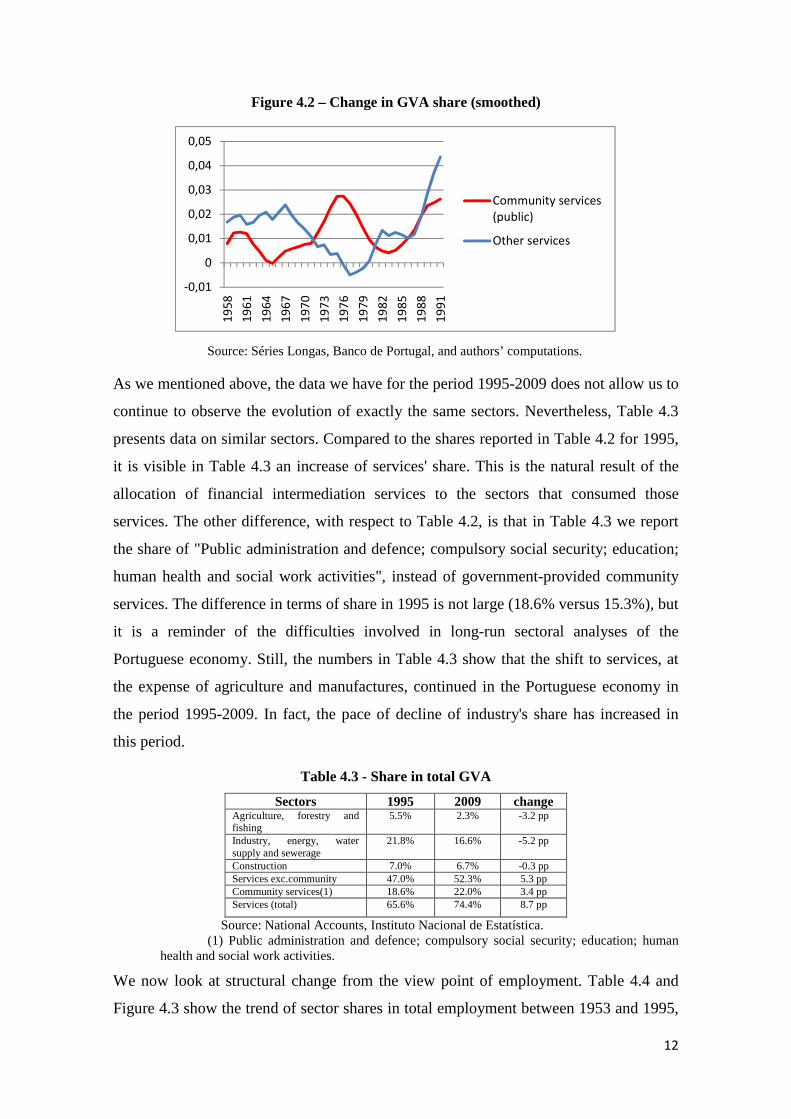
To facilitate the analysis, we resort to the filter described in section 2. Results are
depicted in Figure 4.2, which shows that the rise of government-provided community
services' share occurred at a faster pace in the half-decades after 1975 and 1991. The
half-decade beginning in 1991 also records the fastest increase in the share of other
services. However, before that, the rhythm of increase of other services and of
government-provided community services was negatively correlated: before 1972, other
services rose faster; between 1972 and 1980, government-provided community services
was the fastest growing sector.
0%
10%
20%
30%
40%
50%
60%
70%
80%
90%
100%
19
53
19
56
19
59
19
62
19
65
19
68
19
71
19
74
19
77
19
80
19
83
19
86
19
89
19
92
19
95
Industry, energy, water
supply and sewerage
Agriculture, forestry and
fishing
Construction
Community services
(private)
Community services
(public)
Services exc.community
12
Figure 4.2 – Change in GVA share (smoothed)
Source: Séries Longas, Banco de Portugal, and authors’ computations.
As we mentioned above, the data we have for the period 1995-2009 does not allow us to
continue to observe the evolution of exactly the same sectors. Nevertheless, Table 4.3
presents data on similar sectors. Compared to the shares reported in Table 4.2 for 1995,
it is visible in Table 4.3 an increase of services' share. This is the natural result of the
allocation of financial intermediation services to the sectors that consumed those
services. The other difference, with respect to Table 4.2, is that in Table 4.3 we report
the share of "Public administration and defence; compulsory social security; education;
human health and social work activities", instead of government-provided community
services. The difference in terms of share in 1995 is not large (18.6% versus 15.3%), but
it is a reminder of the difficulties involved in long-run sectoral analyses of the
Portuguese economy. Still, the numbers in Table 4.3 show that the shift to services, at
the expense of agriculture and manufactures, continued in the Portuguese economy in
the period 1995-2009. In fact, the pace of decline of industry's share has increased in
this period.
Table 4.3 - Share in total GVA
Sectors 1995 2009 change Agriculture, forestry and fishing
5.5% 2.3% -3.2 pp
Industry, energy, water supply and sewerage
21.8% 16.6% -5.2 pp
Construction 7.0% 6.7% -0.3 pp Services exc.community 47.0% 52.3% 5.3 pp Community services(1) 18.6% 22.0% 3.4 pp Services (total) 65.6% 74.4% 8.7 pp
Source: National Accounts, Instituto Nacional de Estatística. (1) Public administration and defence; compulsory social security; education; human
health and social work activities.
We now look at structural change from the view point of employment. Table 4.4 and
Figure 4.3 show the trend of sector shares in total employment between 1953 and 1995,
-0,01
0
0,01
0,02
0,03
0,04
0,05
19
58
19
61
19
64
19
67
19
70
19
73
19
76
19
79
19
82
19
85
19
88
19
91
Community services
(public)
Other services

13
while Table 4.5 shows the change between 1995 and 2009. The change in the weight of
primary sectors is enormous: over a third of Portugal's labour force was reallocated
from the primary sectors to other sectors, especially services. Another noticeable aspect
of the numbers presented is that the change in the share of employment in primary and
secondary sectors between 1953 and 1995 is larger, in absolute value, than the change in
the share of total GVA. This means that there were larger productivity (per person)
gains in these sectors than in services. Between 1995 and 2009, the changes in
employment shares are similar to the changes in GVA shares.
Table 4.4 - Share in total employment
Sectors 1953 1974 1986 1995 change Agriculture, forestry and fishing
48.8% 23.2% 15.9% 12.5% -36.3 pp
Industry, energy, water supply and sewerage
19.6% 26.9% 27.3% 23.5% 3.9 pp
Construction 4.2% 8.8% 10.1% 10.2% 5.9 pp Services exc.community 10.9% 21.1% 23% 28.5% 17.7 pp Public Administration and Defence
4.5% 7.8% 8.1% 8.2% 3.7 pp
Other community services 11.9% 12.2% 15.7% 17.2% 5.2 pp Services (total) 27.3% 41.1% 46.8% 53.9% 26.5 pp
Source: Séries Longas, Banco de Portugal.
Figure 4.3 – Share in total employment
Source: National Accounts, Instituto Nacional de Estatística.
0%
10%
20%
30%
40%
50%
60%
70%
80%
90%
100%
19
53
19
57
19
61
19
65
19
69
19
73
19
77
19
81
19
85
19
89
19
93
Industry, energy, water
supply and sewerage
Agriculture, forestry and
fishing
Construction
Other community services
Public Administration and
Defence
Services exc.community

14
Table 4.5 - Share in total employment
Sectors 1995 2009 change Agriculture, forestry and fishing
14.0% 11.1% -2.8 pp
Industry, energy, water supply and sewerage
22.7% 16.7% -6 pp
Construction 9.7% 9.8% 0.1 pp Services exc.community 36.1% 42.5% 6.3 pp Community services(1) 17.5% 19.9% 2.4 pp Services (total) 53.7% 62.4% 8.7 pp
Source: National Accounts, Instituto Nacional de Estatística. (1) Public administration and defence; compulsory social security; education; human
health and social work activities.
Our analysis of long run trends suggests four conclusions. First, the shift to services in
Portugal occurred essentially at the expense of agriculture in the period 1953-1995, and
essentially at the expense of industry in the period 1995-2009. Second, the shift to
services has been fast (almost 0.6 pp per year), especially around 1975 and 1991. Third,
the rise of services was the result of both public and private increased production of
services, with the public sector accounting for roughly 40% of the increase of services'
share in total GVA. This leads us to our final conclusion, which is that the largest share
increase occurred in areas of traditional public sector intervention: community services
(public component) recorded the largest share gain in 1953-1995, while "Public
administration and defence; compulsory social security; education; human health and
social work activities" did the same in 1995-2009.
In the next section we focus on structural change in the period of the participation of
Portugal in the European Union.
5. Structural change and the integration in the European Union
The adhesion, in 1986, to the then European Economic Community, is usually described
as a change in the economic regime of the Portuguese economy. The swift economic
and financial integration with other European economies and the increase in its
openness degree, among other factors, resulted in a significant real convergence in
terms of per capita income until the year 2000 and important changes in the structure of
the economy – see, for example, Banco de Portugal (2009). As we saw in the previous
section, the increase in the weight of nontradable sectors and the decline of
manufacturing sectors are two important traits of that period and have been associated
to the poor performance of the Portuguese economy in the last decade and to its current

15
predicament. Therefore, in this section, we look in more detail at the behavior of
nontradable sectors. In our analysis we use the EU Klems Growth and Productivity
Accounts database (O'Mahony and Timmer, 2009), which provides an alternative and
continuous source of information on value added and employment by sector in Portugal
from 1970 to 2006.
According to the EU Klems database, the share of nontradables, measured as the
combined weight of services and construction, in total GVA in Portugal jumped from
62.9% in 1986 to 79.5% in 2006 – see Table 5.1. The same growth is visible in both
total employment (from 55.2% to 69.7% – see Table 5.2) and in total employees (from
64.5% to 76.5% – see Table 5.3).
Table 5.1 – Share in total GVA in Portugal
1974 1986 1995 2006 Agriculture, hunting, forestry
and fishing 13% 10.1% 5.7% 2.8%
Manufacturing and (1) 20.2% 27% 22.1% 17.7% Construction 7.1% 5.7% 6.4% 6.6%
Services 59.7% 57.2% 65.9% 72.9% 100% 100% 100% 100%
Source: EU Klems (1) Mining and quarrying, electricity, gas and water supply.
Table 5.2 – Share in total GVA in Portugal
1974 1986 1995 2006 Agriculture, hunting, forestry
and fishing 28.8% 19.7% 14.5% 11.8%
Manufacturing and (1) 24.5% 24.9% 23.3% 18.5% Construction 9.6% 8.7% 9.3% 10.2%
Services 37.1% 46.5% 53% 59.5% 100% 100% 100% 100%
Source: EU Klems (1) Mining and quarrying, electricity, gas and water supply.
Table 5.3 – Share in total GVA in Portugal
1974 1986 1995 2006 Agriculture, hunting, forestry
and fishing 8.7% 4.2% 2.9% 2.3%
Manufacturing and (1) 33.3% 31.3% 27.6% 21.2% Construction 11.2% 9.1% 9.2% 10.2%
Services 46.8% 55.4% 60.3% 66.3% 100% 100% 100% 100%
Source: EU Klems (1) Mining and quarrying, electricity, gas and water supply.
A noteworthy aspect of this evolution is that, according to the EU Klems dataset, a large
part of this structural change in the Portuguese economy is concentrated in one period.
In terms of value added, over 55% of this change occurred in just 6 years, from 1988 to
1993: in 1987, the weight was 63% and in 1993 it was 72%. If we look at employment,
16
the change between 1988 and 1993 corresponds to 53% of the change between 1986 and
2006 (42% if we look at the number of employees). Besides this period of high growth
of the weight of services and construction, it should also be mentioned that the change
from 1996 to 2000 also corresponds to a sizeable 26% of the total change between 1986
and 2006, regardless of whether we look at value added, employment or employees.
Thus, the increases that occurred in 10 of the 20 years under analysis represent almost
80% of the total increase of the weight of services and construction in the Portuguese
economy. Using the databases of previous sections – Banco de Portugal, Instituto
Nacional de Estatística and the European Commission’s AMECO database – we find
very similar results, that is, the bulk of the change in the weight of
tradables/nontrabables took place at the end of the 1980s and in the first half of the
1990s.
In previous sections our analysis focused essentially on the behavior of aggregate
sectors. The EU Klems dataset allows us to analyse the evolution of individual sectors
and see which are responsible for the observed aggregate changes in the period 1986-
2006. In the case of value added, the relevant numbers are in Table A1 in the Appendix.
Among the manufactures, the losses occurred essentially in "textiles, textile, leather and
footwear" (2.8 pp), "chemical, rubber, plastics and fuel" (3.4 pp) and "basic metals and
fabricated metal" (1.1 pp). The gains in share of total GVA, in the period 1986-2006,
were the largest in "real estate, renting and business activities" (5.6 pp), "public admin
and defence; compulsory social security" (3.5 pp), "health and social work" (3.3 pp) and
"education" (2.7 pp), with "hotels and restaurants" (1.9 pp), "financial intermediation"
(1.7 pp) and "other community, social and personal services" (1.4 pp) not very far
behind.
Focusing our analysis in the first period of extensive structural change (1988-1993), we
conclude that the sectors with the largest declines in percentage points were "chemical,
rubber, plastics and fuel" (2.2 pp), "pulp, paper, paper, printing and publishing" (1 pp),
"basic metals and fabricated metal" (0.7 pp), "wholesale and retail trade" (2 pp) and
"transport and storage and communication" (0.8 pp). On the side of increasing shares
were "real estate, renting and business activities" (4.7 pp), "public admin and defence;
compulsory social security" (2.2 pp), "education" (1.7 pp), "health and social work" (1.3
pp) and "hotels and restaurants" (1 pp). During the second period of significant
structural change (1997-2000), the largest decline was observed in "textiles, textile,

17
leather and footwear" (1 pp), while the largest increases were in "construction" (1.1 pp),
"real estate, renting and business activities" (1 pp) and "public admin and defence;
compulsory social security" (0.7 pp).
In terms of employment – see Table A2 in the Appendix – the two periods of extensive
structural change in value added identified before did not fully correspond to a transfer
of employment from manufacturing to services, except in the case of "textiles, textile,
leather and footwear" (-1.2 pp). Instead, the gains of services were obtained mainly at
the expense of primary sectors – but note that if we look at the number of employees
(see Table A3 in the Appendix) we observe a more significant decline in manufacturing
employment. In the first period (1988-1993), there was also a reallocation of workers
from "hotels and restaurants" to other sectors. The main recipients were "real estate,
renting and business activities" (2.4 pp), "public admin and defence; compulsory social
security" (1.5 pp), "education" (1.2 pp) and "health and social work" (1 pp). In the
second period (1997-2000), the sectors that recorded the largest gains were
"construction" (2.2 pp) and "real estate, renting and business activities" (0.7 pp). The
significant labour flows that have resulted from the structural change of the Portuguese
economy in the last decades deserve a deeper analysis, which could be done using the
Ministry of Employment’s Quadros de Pessoal database.
In summary, the EU Klems database suggests three main observations. First, the process
of structural change in Portugal since joining the EU was concentrated in the period
1988-1993 (and, to a smaller extent, in 1997-2000). Second, the shift in importance
seems to have occurred mainly from "textiles, textile, leather and footwear", "chemical,
rubber, plastics and fuel" and "wholesale and retail trade" towards "real estate, renting
and business activities", "public admin and defence; compulsory social security",
"education" and "health and social work" – i.e., apart from the first sector mentioned,
growth benefited what we may call "community services", which includes government
activities. Third, the second period of strong structural change appears to have been
strongly connected to “construction” – again, the role of government spending appears
to deserve further research.
6. Final Remarks
The rise of nontradable sectors in the Portuguese economy in the last decades has been a
key issue in the debate about the Portuguese crisis. Scholars, policymakers and several

18
commentators have been citing the weight of nontradables as one of the main causes of
low economic growth and external imbalances. Despite trends in nontradables in
Portugal being similar to patterns observed in other developed countries, since the early
1990s the increase in the weight of nontradable sectors in Portugal has been larger than
in most countries. These important changes in the structure of the economy coincided
with the integration in the European Union. Most of the increase in nontradables was
concentrated in a period of 10 years, and especially between the end of the 1980s and
the early 1990s. The data also shows that construction and services usually associated to
government spending were the main drivers of the increasing weight of nontradables in
the Portuguese economy since 1986. Ferreira do Amaral and others argue that the
Portuguese economy was not prepared for such a change, which resulted in low
economic growth and in a long period of significant current account deficits. However,
the validation of this hypothesis requires a deep analysis of the causes of the structural
change in the Portuguese economy in the last decades, such as the real exchange rate
appreciation, changes in preferences, differences in productivity growth and
government action.

19
References
Amador, João; Cabral, Sónia. 2009. “Portuguese international trade in services.” Banco
de Portugal, Economic Bulletin, Autumn 2009, pp. 213-230.
Amador, João; Soares, Ana Cristina. 2012. “Competition in the Portuguese economy: A
view on tradables and non-tradables.” Banco de Portugal, Economic Bulletin, Spring
2012, pp. 41-57.
Amaral, João Ferreira do. 2006a. “O Impacto Económico da Integração de Portugal na
Europa.” Nação e Defesa, Outono-Inverno 2006, n.115 - 3a Série, pp. 113-128.
Amaral, João Ferreira do. 2006b. “Evolução do Comércio Externo Português de
Exportação (1995-2004).” GEE Papers Lisbon 1.
Balassa, Bela. 1964. “The Purchasing Power Parity Doctrine: A Reappraisal.” Journal
of Political Economy 72: 584-96.
Banco de Portugal. 2009. The Portuguese Economy in the Context of Economic,
Financial and Monetary Integration. Economics and Research Department. Banco de
Portugal.
Baumol, William J. 1967 “Macroeconomics of Unbalanced Growth: The anatomy of
urban crisis." The American Economic Review, Vol. 57, No. 3 (Jun., 1967), pp. 415-
426.
Bento, Vítor. 2009. Perceber a crise para encontrar o caminho. Bnomics.
Camarero, Mariam. 2008. “The Real Exchange Rate of the Dollar for a Panel of OECD
Countries: Balassa-Samuelson or Distribution Sector Effect?” Journal of Comparative
Economics, 38, pp. 620-632.
Catarino, Jorge; Maria Arménia Claro. 2009. Os Serviços Transaccionáveis na
Economia Portuguesa. Documento de Trabalho 10/2009. Departamento de Prospectiva
e Planeamento e Relações Internacionais, Ministério do Ambiente e do Ordenamento do
Território.
Eichengreen, B. and Poonam Gupta. 2009. The Two Waves of Service Sector Growth.
NBER Working Paper No. 14968. NBER, Boston.

20
Ghani, E. (Ed.). 2010. The Service Revolution in South Asia. Oxford: Oxford
University Press.
Gregorio, J. D., Giovannini, A. and Wolf, H. 1994. “International evidence on tradables
and nontradables inflation”. European Economic Review 38(6), pp. 1225–1244.
Iscan, Talan. 2010. “How Much Can Engel’s Law and Baumol’s Disease Explain the
Rise of Service Employment in the US?” The B.E. Journal of Macroeconomics.
Contributions. Vol. 10, Issue 1, Article 26.
Matsuyama, Kiminori. 2009. “Structural Change in an Interdependent World: A Global
View of Manufacturing Decline.” Journal of the European Economic Association, 7(2-
3), pp. 478-486.
OCDE. 2005. Enhancing the performance of the services sector. Paris: OECD.
OCDE. 2012. OCDE Economic Surveys – Portugal. July 2012 Overview. Paris: OCDE.
O'Mahony, M. and M. Timmer. 2009. "Output, Input and Productivity Measures at the
Industry Level: The EU KLEMS Database. Economic Journal, 119 (538), F374-F403.
Samuelson, Paul. 1964. “Theoretical Notes on Trade Problems.” Review of Economics
and Statistics 46: 145-54.
Timmer, Marcel P.; Robert Inklaar; Mary O’Mahony; Bart Van Ark. 2010. Economic
Growth in Europe – A Comparative Industry Perspective. Cambridge University Press.
Triplett, Jack T.; Barry P. Bosworth. 2003. “Productivity Measurement Issues in
Services Industries: ‘Baumol’s Disease’ Has Been Cured”. FRBNY Economic Policy
Review, September, pp. 23-33.

21
APPENDIX
Table A1: Share in total GVA in Portugal (disaggregated sectors)
1974 1986 1995 2006 06 – 74 06 – 86 93 - 87 00 – 96
food , beverages and tobacco 0,03 0,03 0,02 0,02 -0.3 pp -0.4 pp 0.1 pp -0.2 pp
textiles, textile , leather and footwear 0,03 0,05 0,04 0,02 -0.4 pp -2.8 pp -0.6 pp -1 pp
wood and of wood and cork 0,01 0,01 0,01 0,01 0 pp 0.1 pp 0.1 pp 0 pp
pulp, paper, paper , printing and publishing 0,02 0,02 0,02 0,01 -0.1 pp -0.8 pp -1 pp 0.1 pp
chemical, rubber, plastics and fuel 0,04 0,05 0,02 0,02 -2.1 pp -3.4 pp -2.2 pp -0.5 pp
other non-metallic mineral 0,02 0,02 0,02 0,01 -0.8 pp -0.7 pp -0.2 pp -0.2 pp
basic metals and fabricated metal 0,03 0,03 0,02 0,02 -1.1 pp -1.1 pp -0.7 pp -0.1 pp
machinery, nec 0,01 0,01 0,01 0,01 0 pp -0.3 pp -0.3 pp 0.1 pp
electrical and optical equipment 0,01 0,01 0,01 0,01 -0.1 pp -0.3 pp -0.1 pp -0.2 pp
transport equipment 0,00 0,00 0,01 0,01 0.4 pp 0.4 pp 0 pp -0.1 pp
manufacturing nec; recycling 0,00 0,00 0,01 0,01 0.3 pp 0.2 pp 0.4 pp -0.1 pp
total manufacturing 0,19 0,24 0,19 0,14 -4.2 pp -9.1 pp -4.6 pp -2.1 pp
electricity, gas and water supply 0,01 0,03 0,03 0,03 1.9 pp 0.3 pp 0.4 pp -0.5 pp
construction 0,07 0,06 0,06 0,07 -0.5 pp 1 pp 0.1 pp 1.1 pp
wholesale and retail trade 0,13 0,17 0,14 0,13 -0.3 pp -4 pp -2 pp -0.3 pp
hotels and restaurants 0,01 0,03 0,04 0,04 3.2 pp 1.9 pp 1 pp 0.5 pp
transport and storage and communication 0,05 0,08 0,07 0,07 2.4 pp -0.6 pp -0.8 pp 0 pp
financial intermediation 0,04 0,06 0,06 0,07 3.6 pp 1.7 pp 0.2 pp 0.3 pp
real estate, renting and business activities 0,28 0,09 0,14 0,15 -13.2 pp 5.6 pp 4.7 pp 1 pp
public admin and defence; comp. s. security 0,03 0,06 0,08 0,09 6 pp 3.5 pp 2.2 pp 0.7 pp
education 0,02 0,04 0,06 0,07 4.6 pp 2.7 pp 1.7 pp 0.2 pp
health and social work 0,02 0,03 0,05 0,07 4.9 pp 3.3 pp 1.3 pp 0.4 pp
other community, social and personal services 0,01 0,01 0,02 0,03 1.6 pp 1.4 pp 0.5 pp 0.3 pp
private households with employed persons 0,00 0,01 0,01 0,01 0.4 pp 0.3 pp 0.2 pp 0 pp
total services 0,60 0,57 0,66 0,73 13.2 pp 15.7 pp 9.1 pp 3.1 pp
Source: EU Klems

22
Table A2: Share in total employment in Portugal (disaggregated sectors)
1974 1986 1995 2006 06 – 74 06 – 86 93 - 87 00 – 96
food , beverages and tobacco 0,03 0,03 0,03 0,02 -0.9 pp -0.5 pp -0.2 pp -0.2 pp
textiles, textile , leather and footwear 0,08 0,09 0,08 0,05 -2.8 pp -3.4 pp -0.1 pp -1.1 pp
wood and of wood and cork 0,02 0,01 0,01 0,01 -0.5 pp -0.3 pp 0.1 pp -0.1 pp
pulp, paper, paper , printing and publishing 0,01 0,01 0,01 0,01 -0.1 pp -0.1 pp 0.1 pp -0.1 pp
chemical, rubber, plastics and fuel 0,01 0,01 0,01 0,01 -0.4 pp -0.4 pp -0.1 pp -0.1 pp
other non-metallic mineral 0,02 0,01 0,02 0,01 -0.4 pp -0.2 pp 0.1 pp -0.1 pp
basic metals and fabricated metal 0,02 0,02 0,02 0,02 0 pp 0 pp 0.1 pp 0 pp
machinery, nec 0,01 0,01 0,01 0,01 -0.1 pp -0.3 pp -0.1 pp -0.1 pp
electrical and optical equipment 0,01 0,01 0,01 0,01 -0.2 pp -0.3 pp 0 pp 0 pp
transport equipment 0,01 0,01 0,01 0,01 -0.2 pp 0 pp -0.1 pp 0 pp
manufacturing nec; recycling 0,01 0,02 0,01 0,01 -0.1 pp -0.5 pp -0.4 pp -0.1 pp
total manufacturing 0,24 0,24 0,22 0,18 -5.8 pp -5.9 pp -0.8 pp -1.8 pp
electricity, gas and water supply 0,01 0,01 0,01 0,00 -0.2 pp -0.5 pp -0.1 pp -0.1 pp
construction 0,10 0,09 0,09 0,10 0.6 pp 1.6 pp 0.5 pp 2.2 pp
wholesale and retail trade 0,14 0,15 0,16 0,17 3.3 pp 2 pp -0.2 pp 0 pp
hotels and restaurants 0,04 0,06 0,05 0,06 1.6 pp 0 pp -1.4 pp 0.5 pp
transport and storage and communication 0,04 0,04 0,04 0,04 0 pp -0.1 pp -0.2 pp 0.1 pp
financial intermediation 0,01 0,02 0,02 0,02 0.3 pp -0.2 pp 0.2 pp -0.3 pp
real estate, renting and business activities 0,01 0,02 0,05 0,06 4.9 pp 4.1 pp 2.4 pp 0.7 pp
public admin and defence; comp. S. security 0,04 0,05 0,07 0,07 3.4 pp 1.8 pp 1.5 pp 0 pp
education 0,03 0,04 0,05 0,06 2.9 pp 1.6 pp 1.2 pp 0.2 pp
health and social work 0,03 0,04 0,05 0,05 2.9 pp 1.9 pp 1 pp 0.2 pp
other community, social and personal services 0,01 0,02 0,03 0,03 1.8 pp 1.3 pp 0.5 pp 0.2 pp
private households with employed persons 0,02 0,02 0,03 0,03 1.3 pp 0.6 pp 0.6 pp -0.1 pp
total services 0,37 0,46 0,53 0,59 22.4 pp 13 pp 5.7 pp 1.5 pp
Source: EU Klems

23
Table A3: Share in total employees in Portugal (disaggregated sectors)
1974 1986 1995 2006 06 – 74 06 – 86 93 - 87 00 – 96
food , beverages and tobacco 0,04 0,04 0,03 0,03 -1.8 pp -1 pp -0.4 pp -0.4 pp
textiles, textile , leather and footwear 0,11 0,11 0,10 0,06 -4.9 pp -4.8 pp -0.7 pp -1.4 pp
wood and of wood and cork 0,02 0,02 0,01 0,01 -0.8 pp -0.4 pp 0 pp -0.1 pp
pulp, paper, paper , printing and publishing 0,02 0,01 0,01 0,01 -0.4 pp -0.3 pp 0 pp -0.2 pp
chemical, rubber, plastics and fuel 0,02 0,02 0,01 0,01 -0.7 pp -0.6 pp -0.3 pp -0.1 pp
other non-metallic mineral 0,02 0,02 0,02 0,01 -0.8 pp -0.4 pp 0 pp -0.1 pp
basic metals and fabricated metal 0,03 0,02 0,02 0,02 -0.4 pp -0.2 pp -0.1 pp 0 pp
machinery, nec 0,01 0,02 0,01 0,01 -0.3 pp -0.5 pp -0.2 pp -0.1 pp
electrical and optical equipment 0,02 0,01 0,01 0,01 -0.5 pp -0.5 pp -0.1 pp 0 pp
transport equipment 0,01 0,01 0,01 0,01 -0.5 pp -0.1 pp -0.1 pp 0 pp
manufacturing nec; recycling 0,02 0,02 0,02 0,01 -0.4 pp -0.8 pp -0.6 pp -0.1 pp
total manufacturing 0,32 0,30 0,26 0,20 -11.6 pp -9.4 pp -2.5 pp -2.5 pp
electricity, gas and water supply 0,01 0,01 0,01 0,01 -0.3 pp -0.7 pp -0.2 pp -0.1 pp
Construction 0,11 0,09 0,09 0,10 -1 pp 1.1 pp 0 pp 2.2 pp
wholesale and retail trade 0,17 0,17 0,16 0,18 1.1 pp 1 pp -1.2 pp -0.1 pp
hotels and restaurants 0,05 0,06 0,05 0,06 1.2 pp -0.1 pp -1.8 pp 0.6 pp
transport and storage and communication 0,05 0,05 0,04 0,05 -0.9 pp -0.6 pp -0.5 pp 0 pp
financial intermediation 0,01 0,02 0,02 0,02 0.4 pp -0.4 pp 0.1 pp -0.3 pp
real estate, renting and business activities 0,01 0,03 0,05 0,07 5.4 pp 4.3 pp 2.6 pp 0.6 pp
public admin and defence; comp. s. security 0,05 0,07 0,08 0,09 3.6 pp 1.9 pp 1.5 pp -0.1 pp
Education 0,04 0,05 0,07 0,07 2.8 pp 1.4 pp 1.2 pp 0.1 pp
health and social work 0,04 0,05 0,06 0,07 3.1 pp 1.9 pp 1 pp 0.3 pp
other community, social and personal services 0,02 0,02 0,03 0,03 1.4 pp 0.8 pp 0.5 pp 0.1 pp
private households with employed persons 0,02 0,03 0,04 0,03 1.3 pp 0.6 pp 0.6 pp -0.2 pp
total services 0,47 0,55 0,60 0,66 19.5 pp 10.9 pp 4 pp 0.9 pp Source: EU Klems

Most Recent Working Paper
NIPE WP
15/2012 AAlleexxaannddrree,, FFeerrnnaannddoo ee PPeeddrroo BBaaççããoo,, ““Portugal before and after the European Union: Facts on
Nontradables”, 2012
NIPE WP
14/2012 EEsstteevveess,, RRoossaa BBrraannccaa ee CCaarrlloo RReeggggiiaannii,, ““BBeehhaavviioouurr--BBaasseedd PPrriiccee DDiissccrriimmiinnaattiioonn wwiitthh EEllaassttiicc
DDeemmaanndd””,, 22001122
NIPE WP
13/2012 AAffoonnssoo,, OOssccaarr,, SSaarraa MMoonntteeiirroo,, MMaarriiaa TThhoommppssoonn ““ IInnnnoovvaattiioonn EEccoonnoommyy,, PPrroodduuccttiivvee PPuubblliicc
EExxppeennddiittuurreess aanndd EEccoonnoommiicc GGrroowwtthh ””,, 22001122
NIPE WP
12/2012 EEsstteevveess,, RRoossaa BBrraannccaa ““ PPrriiccee DDiissccrriimmiinnaattiioonn wwiitthh PPrriivvaattee aanndd IImmppeerrffeecctt IInnffoorrmmaattiioonn””,, 22001122
NIPE WP
11/2012 CCaassttrroo,, VVííttoorr ““MMaaccrrooeeccoonnoommiicc ddeetteerrmmiinnaannttss ooff tthhee ccrreeddiitt rriisskk iinn tthhee bbaannkkiinngg ssyysstteemm:: TThhee ccaassee ooff
tthhee GGIIPPSSII””,, 22001122
NIPE WP
10/2012 BBaassttooss,, PPaauulloo, NNaattáálliiaa PPiimmeennttaa MMoonntteeiirroo ee OOdddd RRuunnee SSttrraauummee ““PPrriivvaattiizzaattiioonn aanndd ccoorrppoorraattee
rreessttrruuccttuurriinngg””,, 22001122
NIPE WP
09/2012 CCaassttrroo,, VVííttoorr ee RRooddrriiggoo MMaarrttiinnss ““IIss tthheerree dduurraattiioonn ddeeppeennddeennccee iinn PPoorrttuugguueessee llooccaall
ggoovveerrnnmmeennttss’’ tteennuurree??””,, 22001122
NIPE WP
08/2012 MMoonntteeiirroo,, NNaattáálliiaa PPiimmeennttaa ee GGeeooffff SStteewwaarrtt ““ Scale, Scope and Survival: A Comparison of
Labour-Managed, and Capitalist Modes of Production””,, 22001122
NIPE WP
07/2012 AAgguuiiaarr -- CCoonnrraarriiaa,, LLuuííss,, TTeerreessaa MMaarriiaa RRooddrriigguueess ee MMaarriiaa JJooaannaa SSooaarreess ““ Oil Shocks and the
Euro as an Optimum Currency Area””,, 22001122
NIPE WP
06/2012 BBaassttooss,, PPaauulloo,OOdddd RRuunnee SSttrraauummee ee JJaaiimmee AA.. UUrrrreeggoo ““Rain, Food and Tariffs ””,, 22001122
NIPE WP
05/2012 BBrreekkkkee,, KKuurrtt RR..,, LLuuiiggii SSiicciilliiaannii ee OOdddd RRuunnee SSttrraauummee,, ““Can competition reduce quality?””,, 22001122
NIPE WP
04/2012 BBrreekkkkee,, KKuurrtt RR..,, LLuuiiggii SSiicciilliiaannii ee OOdddd RRuunnee SSttrraauummee,, ““Hospital competition with soft
budgets””,, 22001122
NIPE WP
03/2012 LLoommmmeerruudd,, KKjjeellll EErriikk,, OOdddd RRuunnee SSttrraauummee ee SStteeiinnaarr VVaaggssttaadd,, ““ EEmmppllooyymmeenntt pprrootteeccttiioonn aanndd
uunneemmppllooyymmeenntt bbeenneeffiittss:: OOnn tteecchhnnoollooggyy aaddooppttiioonn aanndd jjoobb ccrreeaattiioonn iinn aa mmaattcchhiinngg mmooddeell””,, 22001122
NIPE WP
02/2012
Amado, Cristina e Timo Teräsvirta,, ““MMooddeelllliinngg CChhaannggeess iinn tthhee UUnnccoonnddiittiioonnaall VVaarriiaannccee ooff
LLoonngg SSttoocckk RReettuurrnn SSeerriieess””,, 22001122
NIPE WP
01/2012
Martins, Rodrigo e Francisco José Veiga,, ““ TTuurrnnoouutt aanndd tthhee mmooddeelliinngg ooff eeccoonnoommiicc ccoonnddiittiioonnss::
EEvviiddeennccee ffrroomm PPoorrttuugguueessee eelleeccttiioonnss””,, 22001122
NIPE WP
34/2011
Agnello, L ee RRiiccaarrddoo MM.. SSoouussaa,, ““ Fiscal Consolidation and Income Inequality ””,, 22001111
NIPE WP
33/2011
Maria Caporale, G ee RRiiccaarrddoo MM.. SSoouussaa,, ““Are Stock and Housing Returns Complements or
Substitutes? Evidence from OECD Countries”, 22001111
NIPE WP
32/2011
Maria Caporale, G ee RRiiccaarrddoo MM.. SSoouussaa,, ““Consumption, Wealth, Stock and Housing Returns:
Evidence from Emerging Markets ””,, 22001111
NIPE WP
31/2011
Luca Agnello, Davide Furceri ee RRiiccaarrddoo MM.. SSoouussaa,, ““Fiscal Policy Discretion, Private Spending,
and Crisis Episodes ? ””,, 22001111
NIPE WP
30/2011
Agnello, L ee RRiiccaarrddoo MM.. SSoouussaa,, ““How do Banking Crises Impact on Income Inequality? ””,, 22001111
NIPE WP
29/2011
Alexandre, Fernando, Luís Aguiar-Conraria, Pedro Bação e Miguel Portela, “A Poupança em
Portugal”, 2011
NIPE WP
28/2011
Alexandre, Fernando e Carmen Mendes, “Growth, Consumption and Political Stability in
China”, 2011
NIPE WP
27/2011 BBaalleeiirraass,, RRuuii NNuunnoo,, ““CCoolllleeccttiivvee EEffffiicciieennccyy SSttrraatteeggiieess:: AA RReeggiioonnaall DDeevveellooppmmeenntt PPoolliiccyy
CCoonnttrriibbuuttiioonn ffoorr CCoommppeettiittiivveenneessss EEnnhhaanncceemmeenntt””,, 22001111
NIPE WP
26/2011 BBrreekkkkee,, KKuurrtt RR..,, RRoosseellllaa LLeevvaaggggii,, LLuuiiggii SSiicciilliiaannii ee OOdddd RRuunnee SSttrraauummee,, ““PPaattiieenntt MMoobbiilliittyy,,
HHeeaalltthh CCaarree QQuuaalliittyy aanndd WWeellffaarree””,, 22001111
NIPE WP
25/2011 AAgguuiiaarr -- CCoonnrraarriiaa,, LLuuííss,, PPeeddrroo CC.. MMaaggaallhhããeess ee MMaarriiaa JJooaannaa SSooaarreess ““CCyycclleess iinn PPoolliittiiccss::
WWaavveelleett AAnnaallyyssiiss ooff PPoolliittiiccaall TTiimmee--SSeerriieess””,, 22001111
NIPE WP
24/2011 AAggnneelllloo,,LLuuccaa,, VViittoorr CCaassttrroo ee RRiiccaarrddoo MM.. SSoouussaa ““HHooww DDooeess FFiissccaall PPoolliiccyy RReeaacctt ttoo WWeeaalltthh
CCoommppoossiittiioonn aanndd AAsssseett PPrriicceess?? ””,, 22001111