Nessun titolo diapositiva - Aristea · Measured z-score FVC (L) 3.14 -0.19 FEV 1 (L) 2.06 -1.06 FEV...
34
Dipartimento di Medicina Interna e Specialità Mediche Scuola di Scienze Mediche e Farmaceutiche Università di Genova Test di funzione respiratoria tra presente e futuro Vito Brusasco
Transcript of Nessun titolo diapositiva - Aristea · Measured z-score FVC (L) 3.14 -0.19 FEV 1 (L) 2.06 -1.06 FEV...
Dipartimento di Medicina Interna e Specialità Mediche Scuola di Scienze Mediche e Farmaceutiche
Università di Genova
Test di funzione respiratoria tra presente e futuro
Vito Brusasco
L’indagine funzionale respiratoria nella pratica clinica
• Standard ATS/ERS e sviluppi nell’ultimo
decennio
• Metodi emergenti
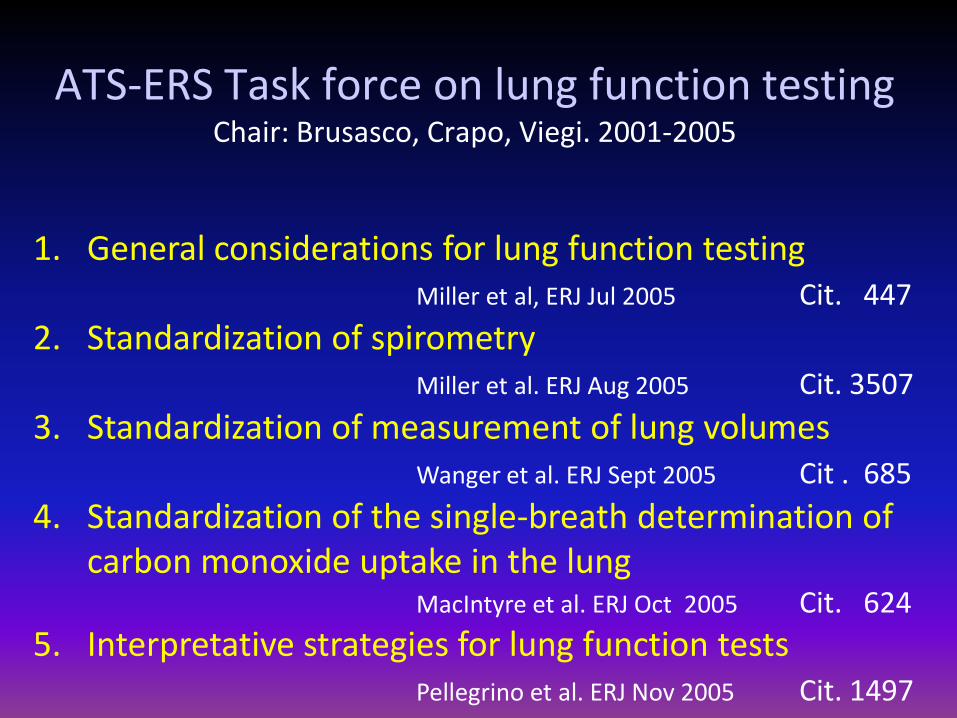
ATS-ERS Task force on lung function testing Chair: Brusasco, Crapo, Viegi. 2001-2005
1. General considerations for lung function testing Miller et al, ERJ Jul 2005 Cit. 447
2. Standardization of spirometry Miller et al. ERJ Aug 2005 Cit. 3507
3. Standardization of measurement of lung volumes Wanger et al. ERJ Sept 2005 Cit . 685
4. Standardization of the single-breath determination of carbon monoxide uptake in the lung
MacIntyre et al. ERJ Oct 2005 Cit. 624
5. Interpretative strategies for lung function tests Pellegrino et al. ERJ Nov 2005 Cit. 1497
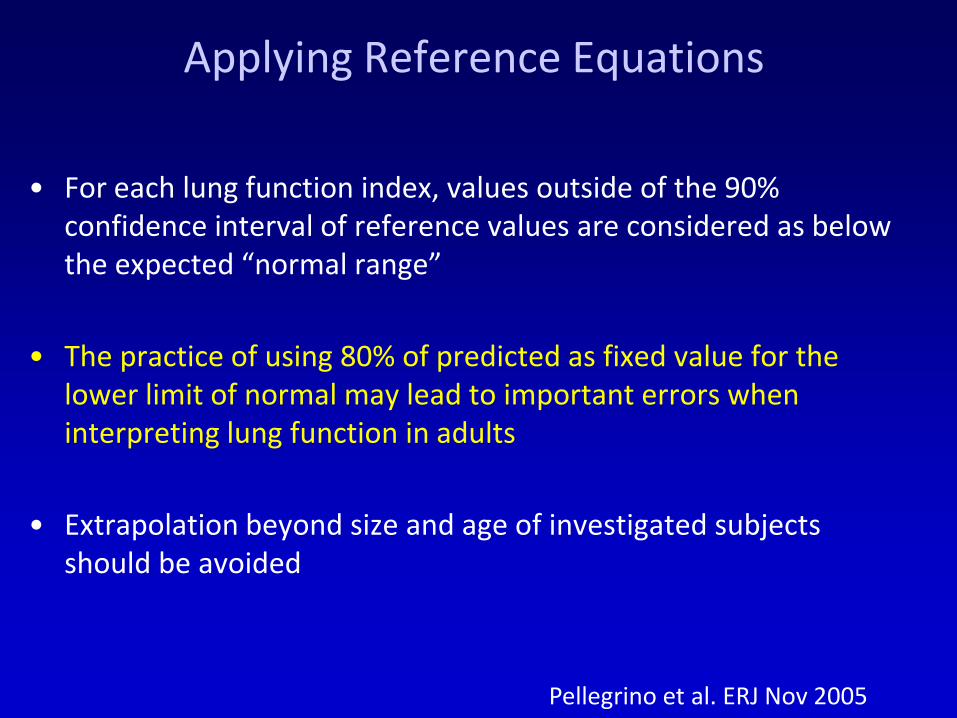
Applying Reference Equations
• For each lung function index, values outside of the 90% confidence interval of reference values are considered as below the expected “normal range”
• The practice of using 80% of predicted as fixed value for the lower limit of normal may lead to important errors when interpreting lung function in adults
• Extrapolation beyond size and age of investigated subjects should be avoided
Pellegrino et al. ERJ Nov 2005
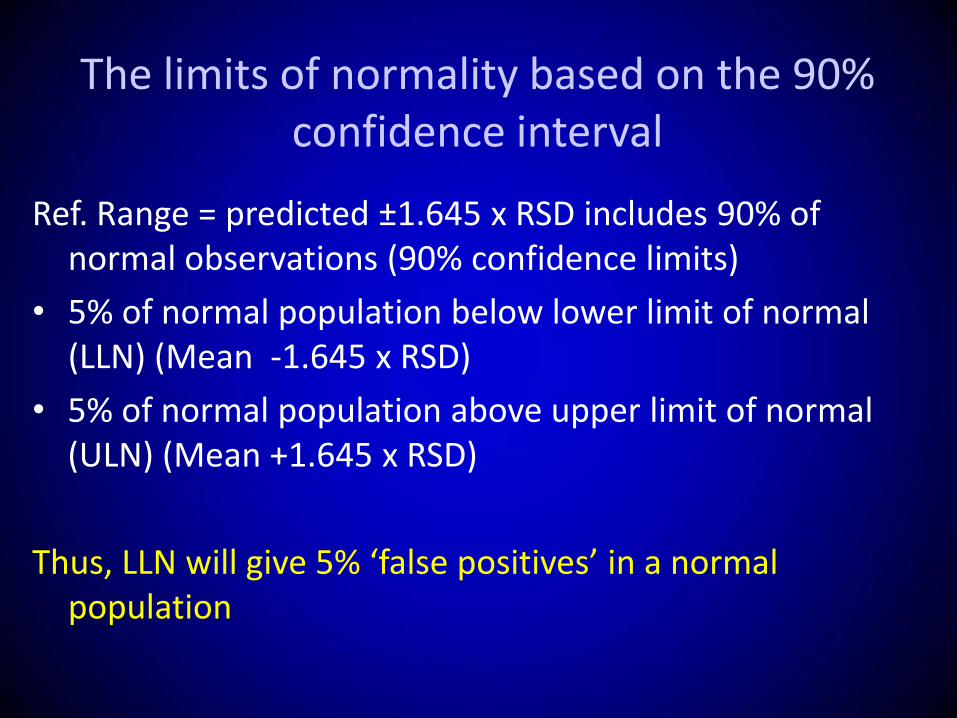
Ref. Range = predicted ±1.645 x RSD includes 90% of normal observations (90% confidence limits)
• 5% of normal population below lower limit of normal (LLN) (Mean -1.645 x RSD)
• 5% of normal population above upper limit of normal (ULN) (Mean +1.645 x RSD)
Thus, LLN will give 5% ‘false positives’ in a normal population
The limits of normality based on the 90% confidence interval
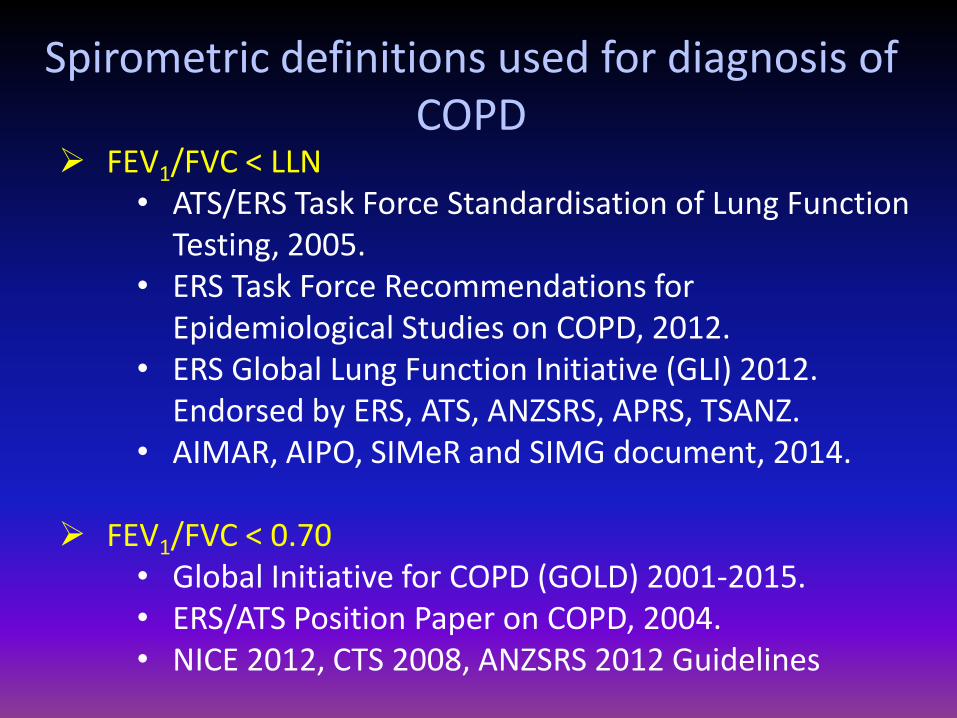
Spirometric definitions used for diagnosis of COPD
FEV1/FVC < LLN • ATS/ERS Task Force Standardisation of Lung Function
Testing, 2005. • ERS Task Force Recommendations for
Epidemiological Studies on COPD, 2012. • ERS Global Lung Function Initiative (GLI) 2012.
Endorsed by ERS, ATS, ANZSRS, APRS, TSANZ. • AIMAR, AIPO, SIMeR and SIMG document, 2014.
FEV1/FVC < 0.70
• Global Initiative for COPD (GOLD) 2001-2015. • ERS/ATS Position Paper on COPD, 2004. • NICE 2012, CTS 2008, ANZSRS 2012 Guidelines

Percentage of subjects with FEV1/FVC<0.70
Quanjer et al, ERJ 2011
Global Lung Initiative (n=78433)
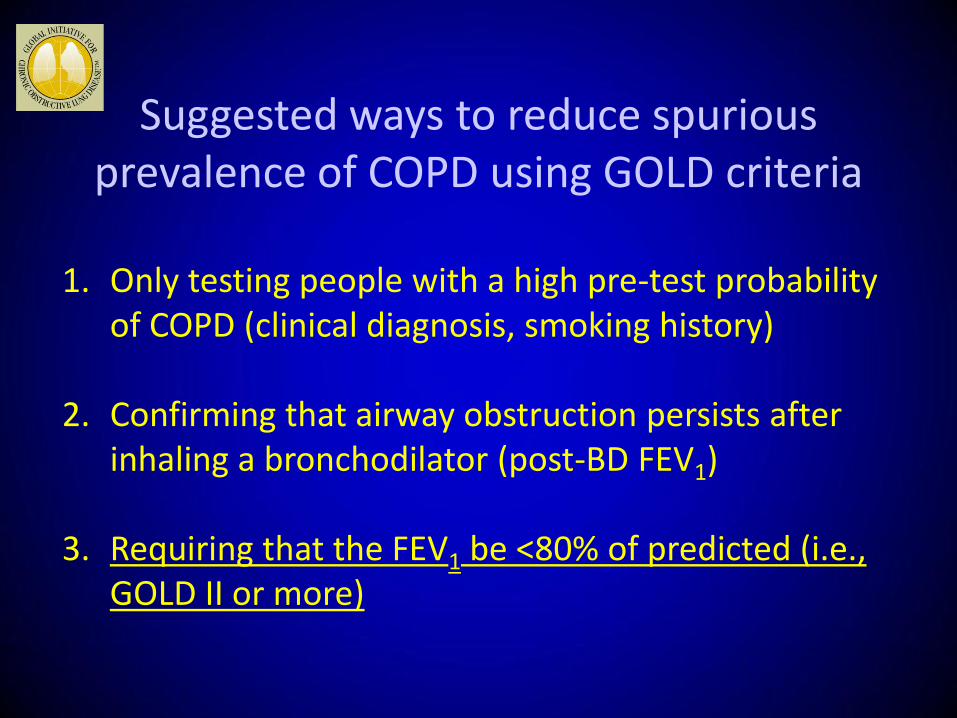
Suggested ways to reduce spurious prevalence of COPD using GOLD criteria
1. Only testing people with a high pre-test probability
of COPD (clinical diagnosis, smoking history)
2. Confirming that airway obstruction persists after inhaling a bronchodilator (post-BD FEV1)
3. Requiring that the FEV1 be <80% of predicted (i.e., GOLD II or more)
Applying Reference Equations
• For each lung function index, values outside of the 90% confidence interval of reference values are considered as below the expected “normal range”
• The practice of using 80% of predicted as fixed value for the lower limit of normal may lead to important errors when interpreting lung function in adults
• Extrapolation beyond size and age of investigated subjects should be avoided
Pellegrino et al. ERJ Nov 2005
20 30 40 50 60 70 0
1
2
3
4
5
6
FEV
1 ,
L
Age, yr
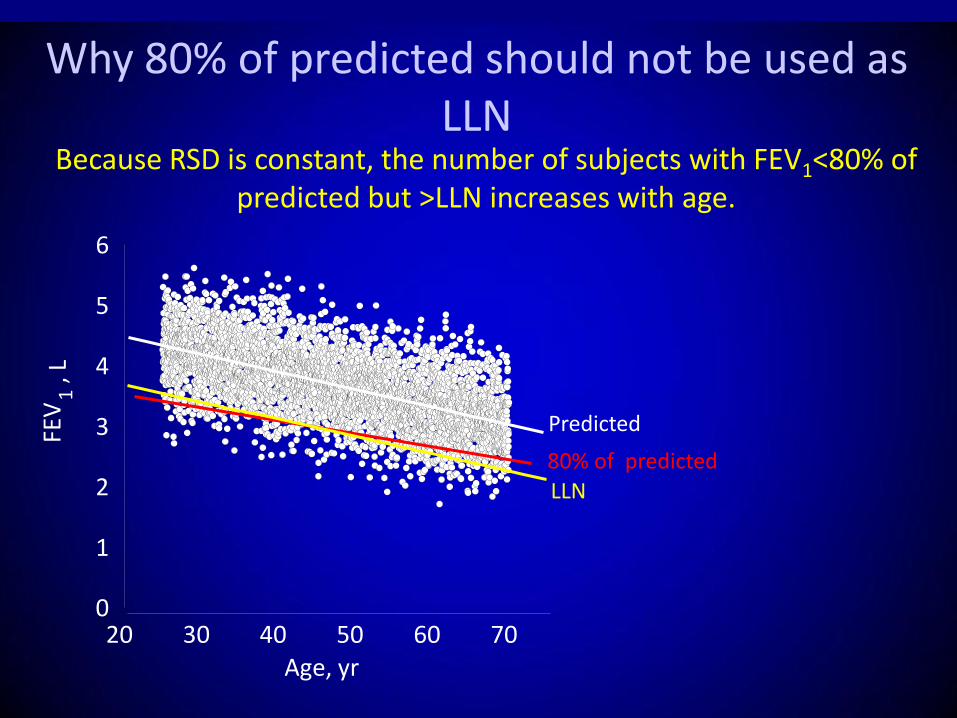
Why 80% of predicted should not be used as LLN
Predicted
Because RSD is constant, the number of subjects with FEV1<80% of predicted but >LLN increases with age.
LLN 80% of predicted
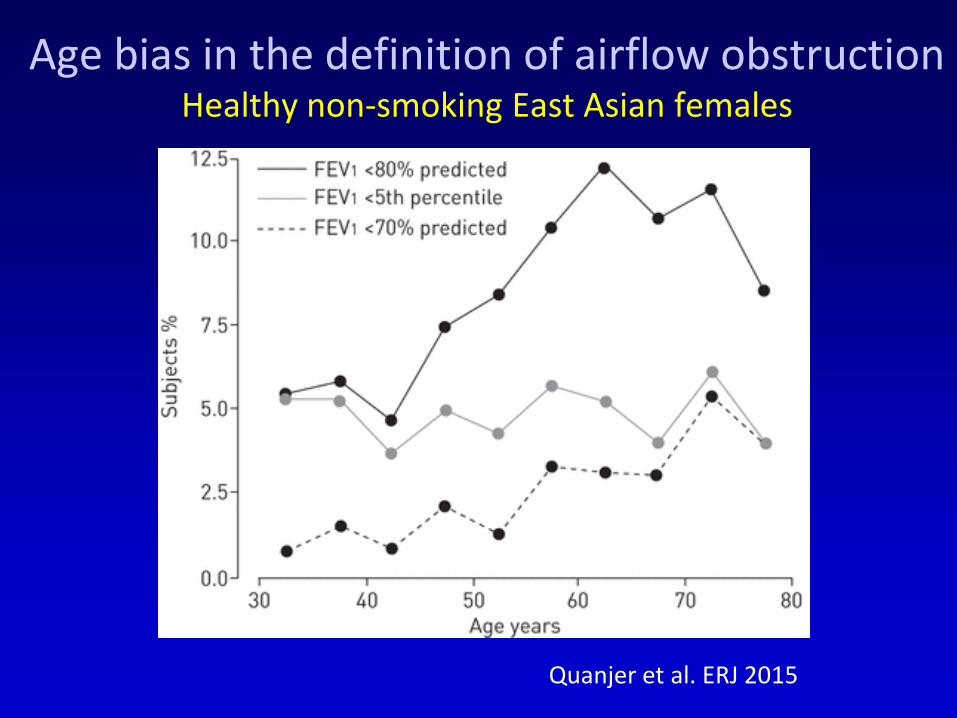
Quanjer et al. ERJ 2015
Age bias in the definition of airflow obstruction Healthy non-smoking East Asian females

Lower limits of normality for the so-called indices of “small airway caliber”
Quanjer et al. ERJ 2014
Applying Reference Equations
• For each lung function index, values outside of the 90% confidence interval of reference values are considered as below the expected “normal range”
• The practice of using 80% of predicted as fixed value for the lower limit of normal may lead to important errors when interpreting lung function in adults
• Extrapolation beyond size and age of investigated subjects should be avoided
Pellegrino et al. ERJ Nov 2005
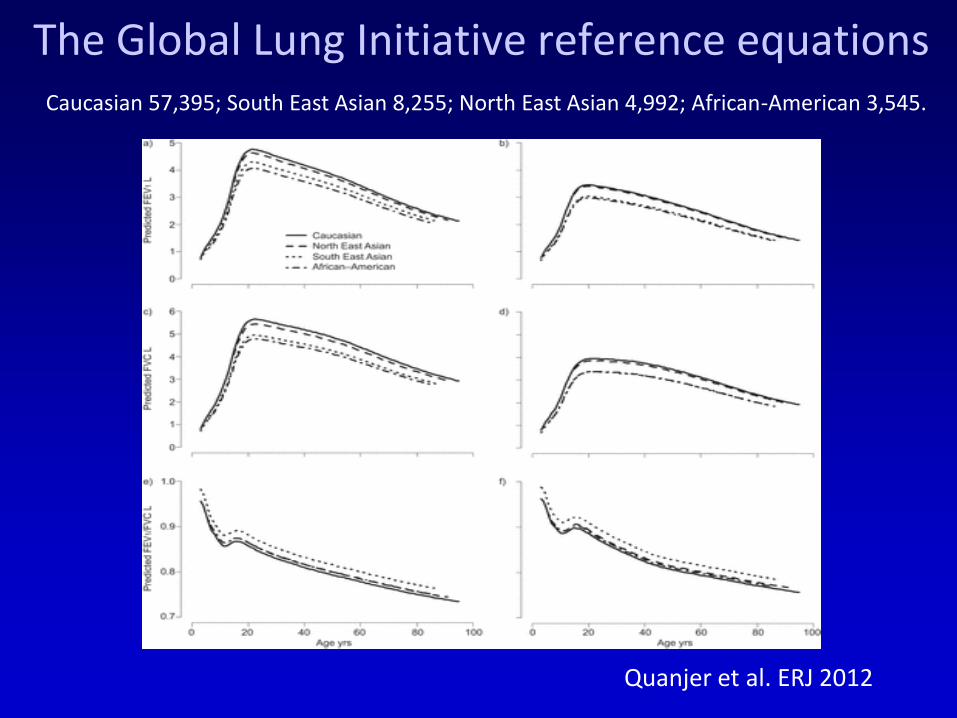
The Global Lung Initiative reference equations
Quanjer et al. ERJ 2012
Caucasian 57,395; South East Asian 8,255; North East Asian 4,992; African-American 3,545.
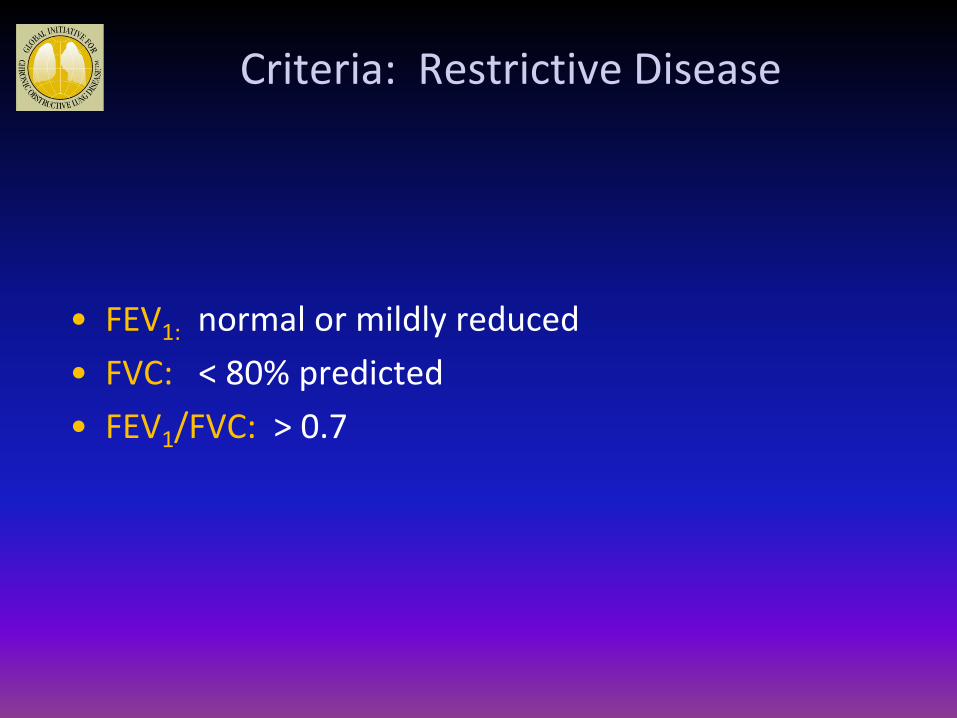
Criteria: Restrictive Disease
• FEV1: normal or mildly reduced
• FVC: < 80% predicted
• FEV1/FVC: > 0.7
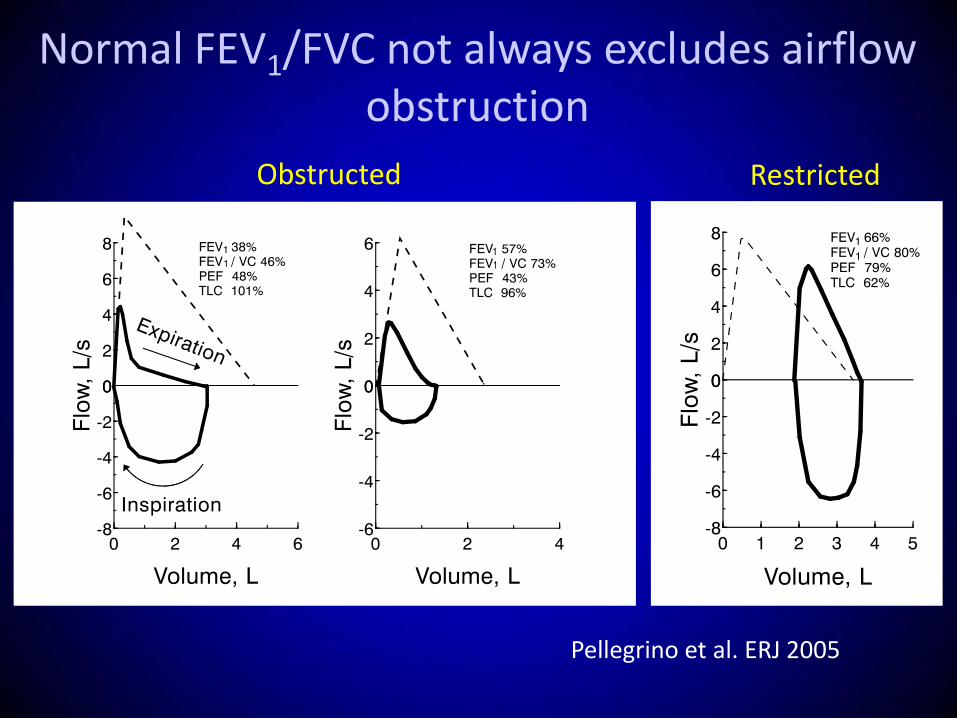
Normal FEV1/FVC not always excludes airflow obstruction
Pellegrino et al. ERJ 2005
Obstructed Restricted
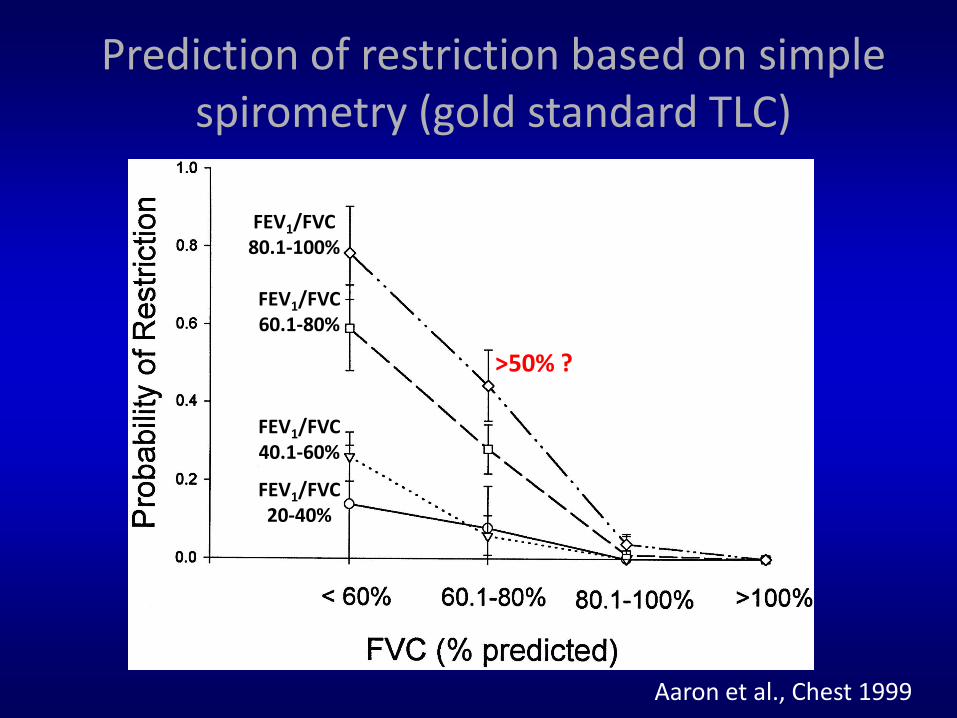
Prediction of restriction based on simple spirometry (gold standard TLC)
FEV1/FVC 80.1-100%
FEV1/FVC 60.1-80%
FEV1/FVC 40.1-60%
FEV1/FVC 20-40%
Aaron et al., Chest 1999
>50% ?
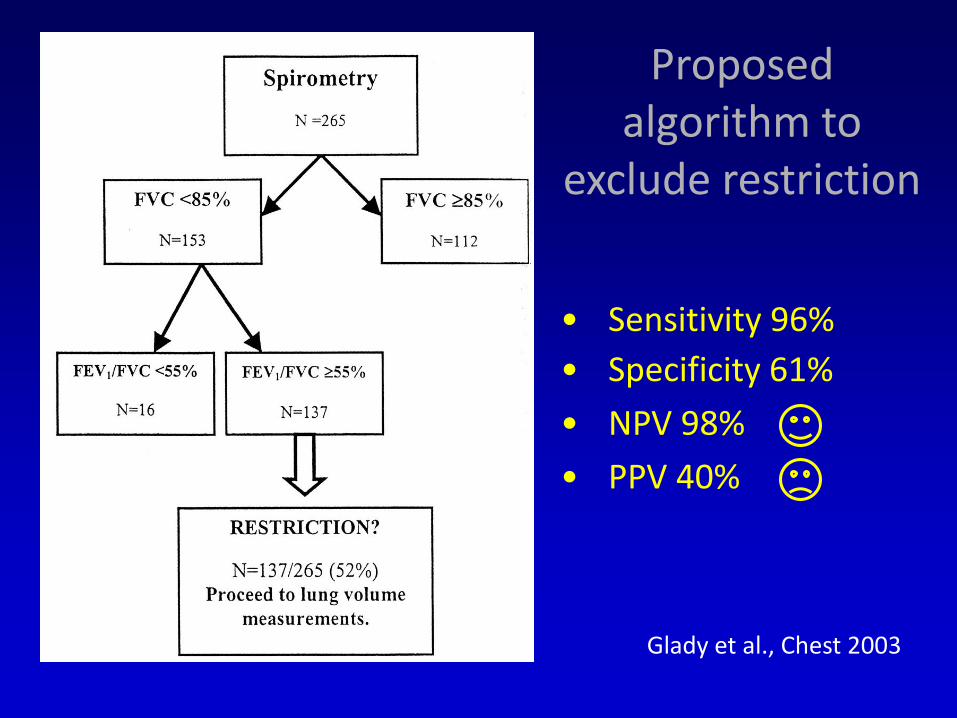
Proposed algorithm to
exclude restriction
• Sensitivity 96%
• Specificity 61%
• NPV 98%
• PPV 40%
Glady et al., Chest 2003
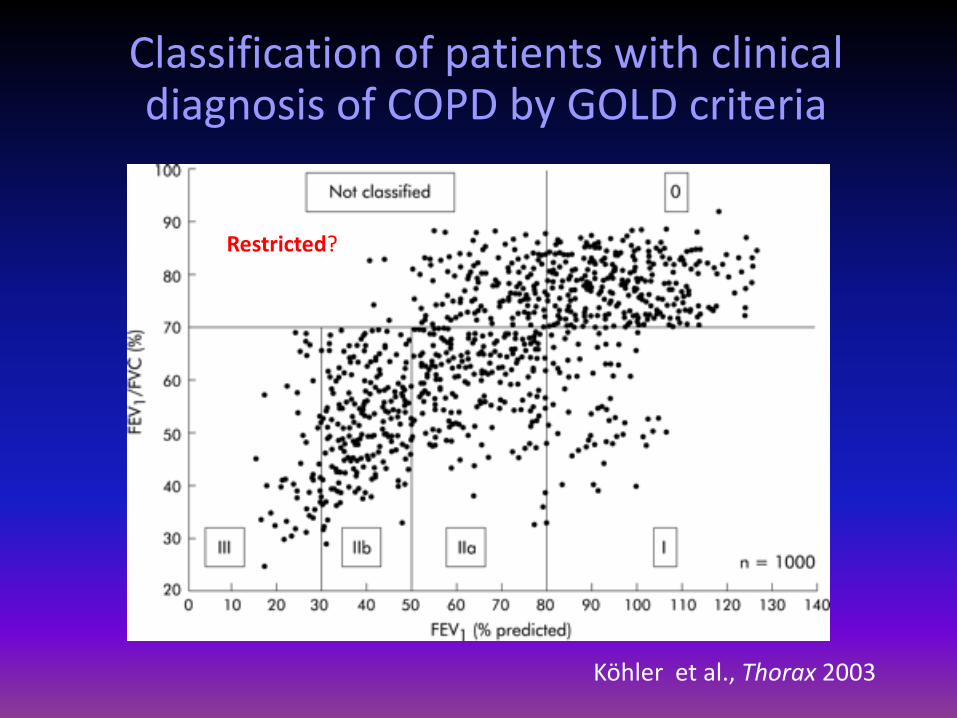
Classification of patients with clinical diagnosis of COPD by GOLD criteria
Köhler et al., Thorax 2003
Restricted?
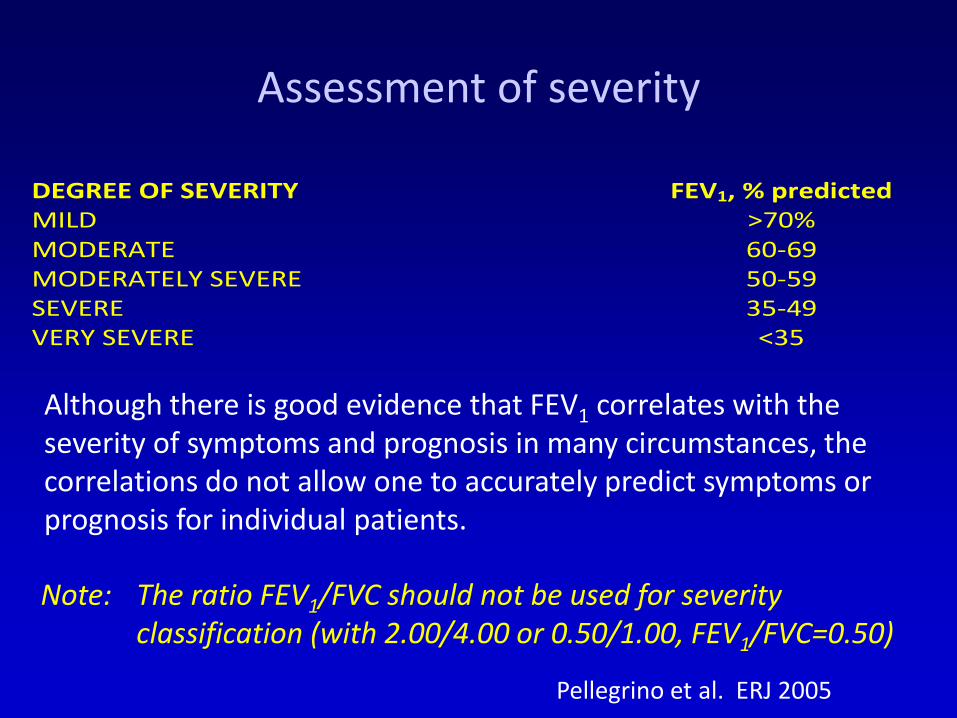
DEGREE OF SEVERITY FEV1, % predicted MILD >70% MODERATE 60-69 MODERATELY SEVERE 50-59 SEVERE 35-49 VERY SEVERE <35
Assessment of severity
Note: The ratio FEV1/FVC should not be used for severity classification (with 2.00/4.00 or 0.50/1.00, FEV1/FVC=0.50)
Although there is good evidence that FEV1 correlates with the severity of symptoms and prognosis in many circumstances, the correlations do not allow one to accurately predict symptoms or prognosis for individual patients.
Pellegrino et al. ERJ 2005
20 30 40 50 60 70 0
1
2
3
4
5
6
FEV
1 ,
L
Age, yr
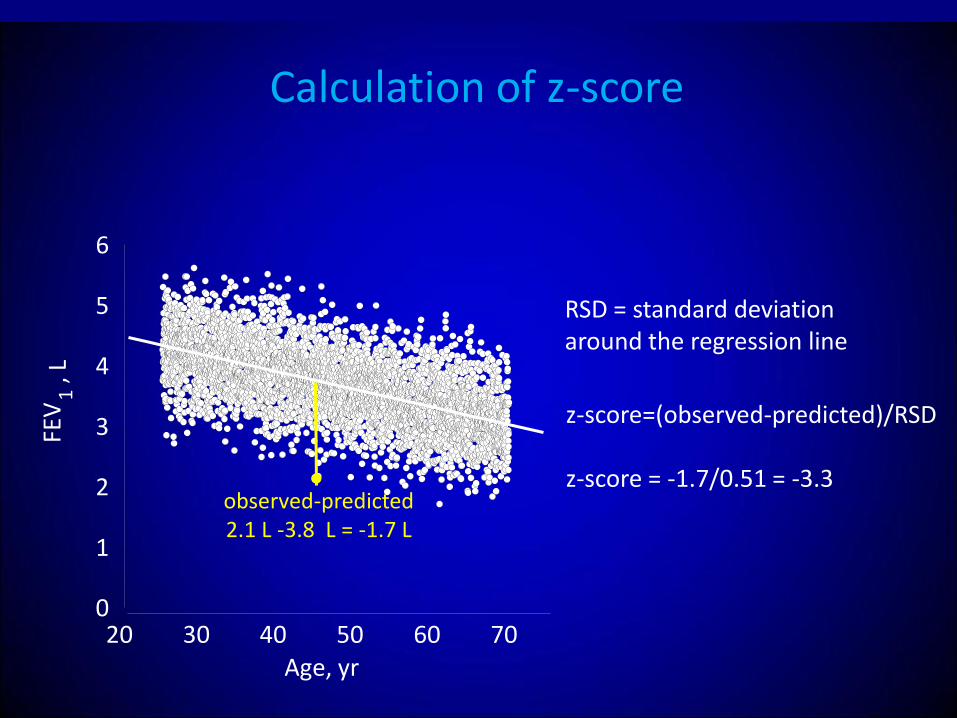
Calculation of z-score
z-score=(observed-predicted)/RSD z-score = -1.7/0.51 = -3.3
RSD = standard deviation around the regression line
● observed-predicted 2.1 L -3.8 L = -1.7 L
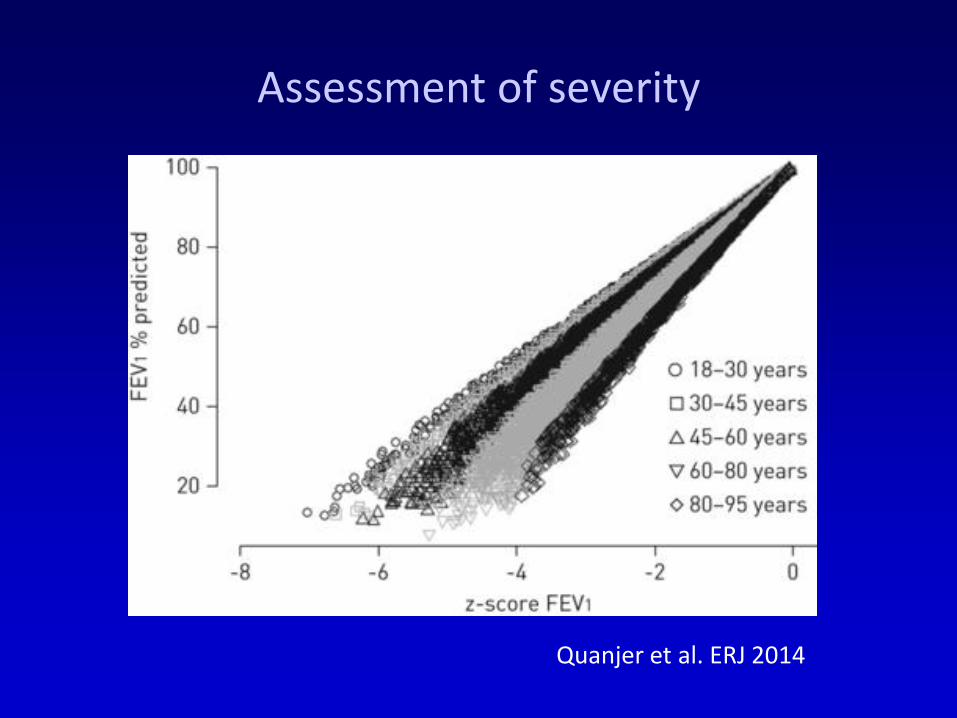
Assessment of severity
Quanjer et al. ERJ 2014
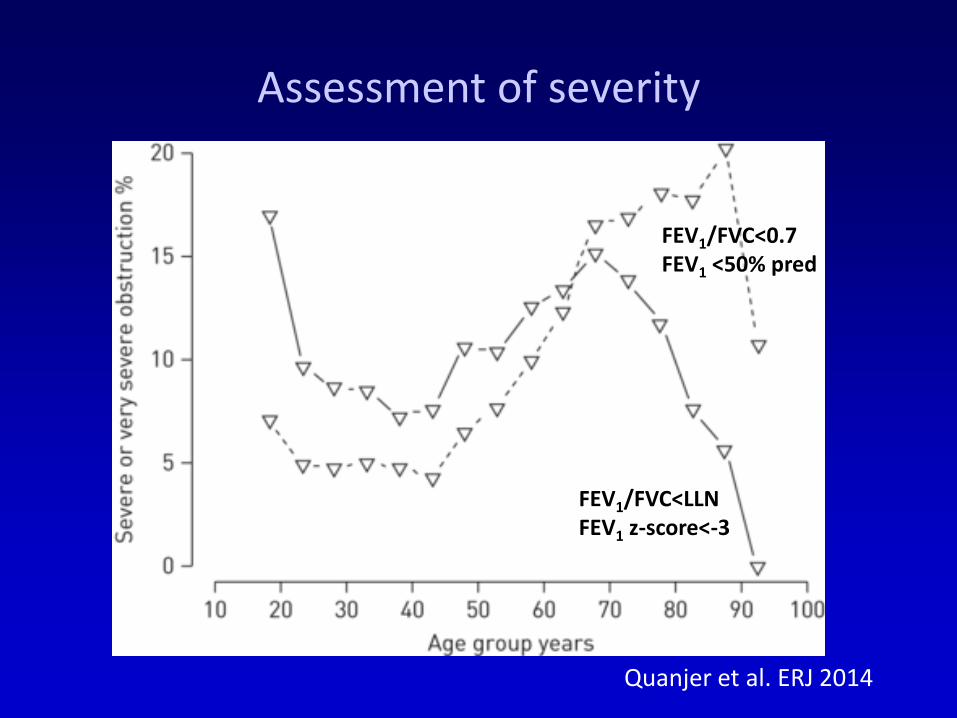
Assessment of severity
Quanjer et al. ERJ 2014
FEV1/FVC<LLN FEV1 z-score<-3
FEV1/FVC<0.7 FEV1 <50% pred
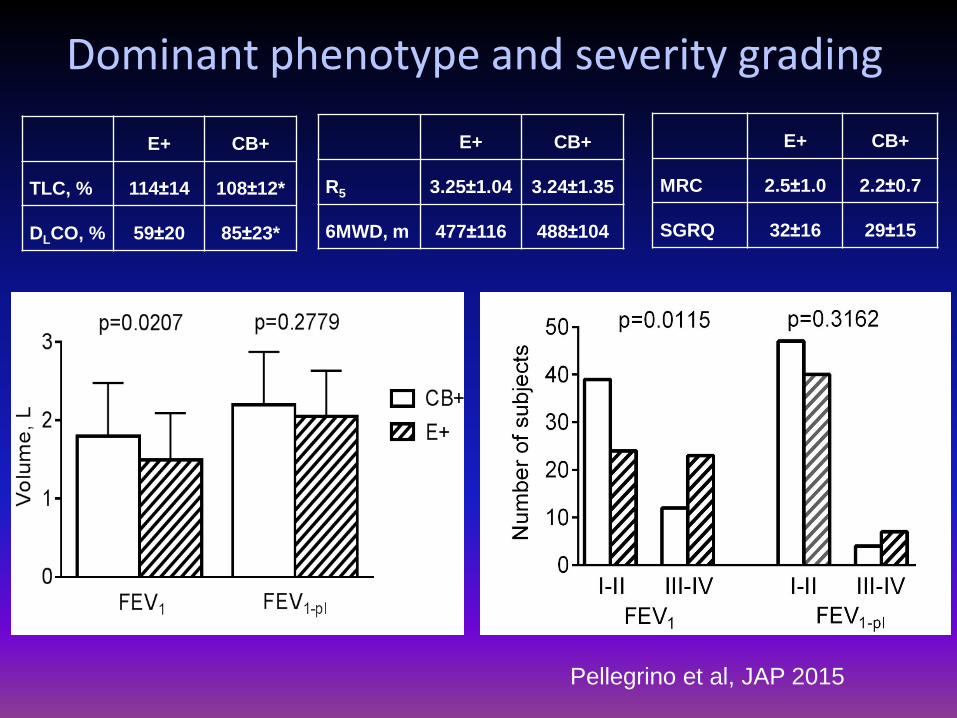
Dominant phenotype and severity grading
Pellegrino et al, JAP 2015
E+ CB+
TLC, % 114±14 108±12*
DLCO, % 59±20 85±23*
E+ CB+
R5 3.25±1.04 3.24±1.35
6MWD, m 477±116 488±104
E+ CB+
MRC 2.5±1.0 2.2±0.7
SGRQ 32±16 29±15
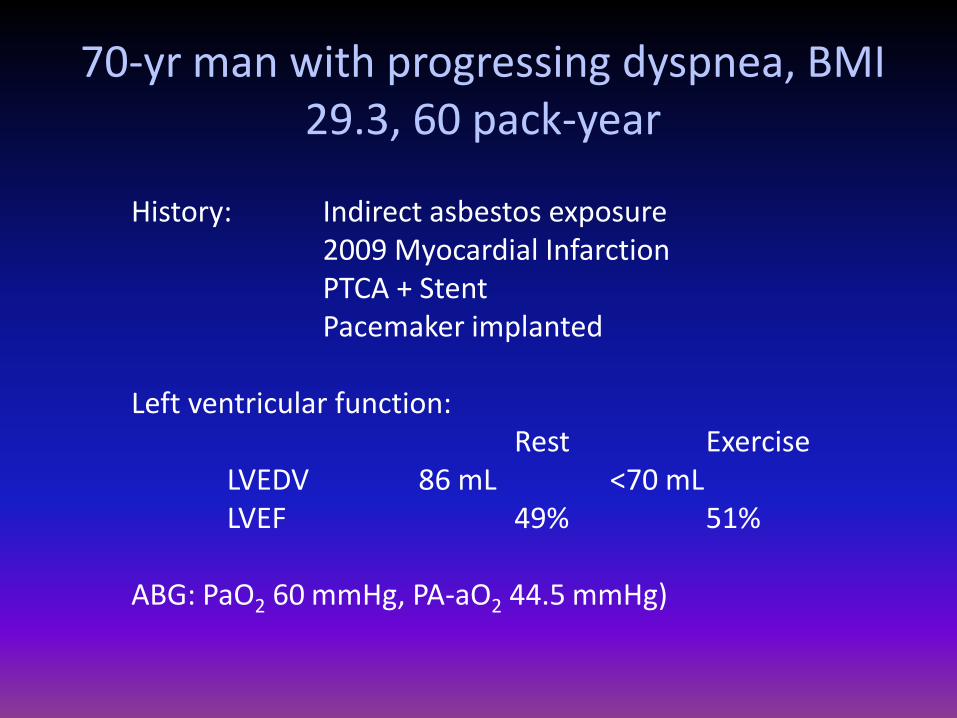
History: Indirect asbestos exposure 2009 Myocardial Infarction PTCA + Stent Pacemaker implanted Left ventricular function: Rest Exercise LVEDV 86 mL <70 mL LVEF 49% 51% ABG: PaO2 60 mmHg, PA-aO2 44.5 mmHg)
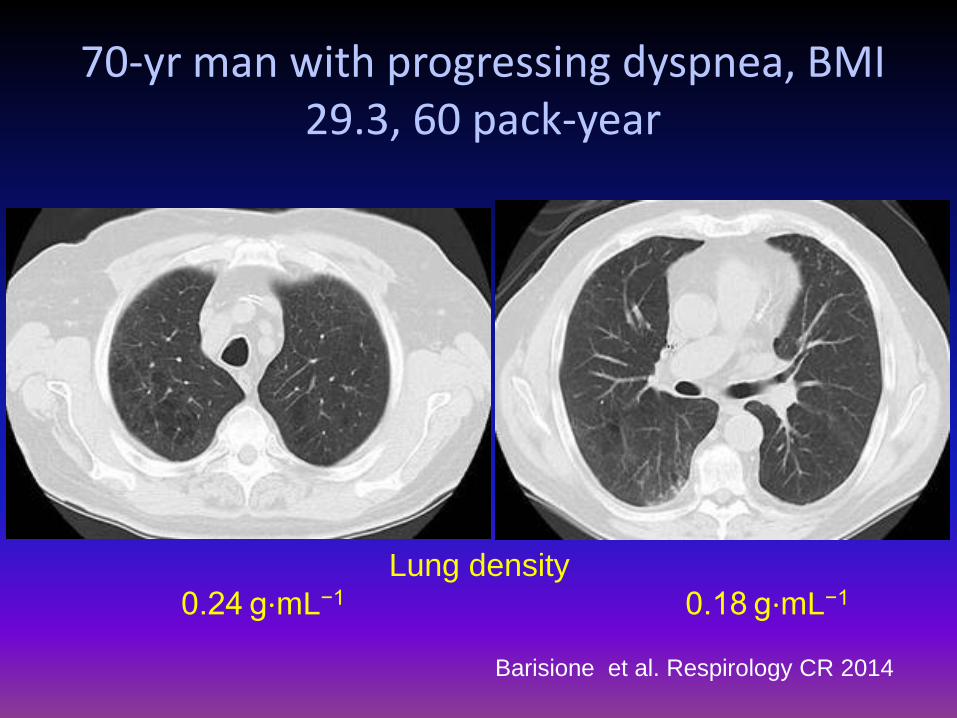
70-yr man with progressing dyspnea, BMI 29.3, 60 pack-year
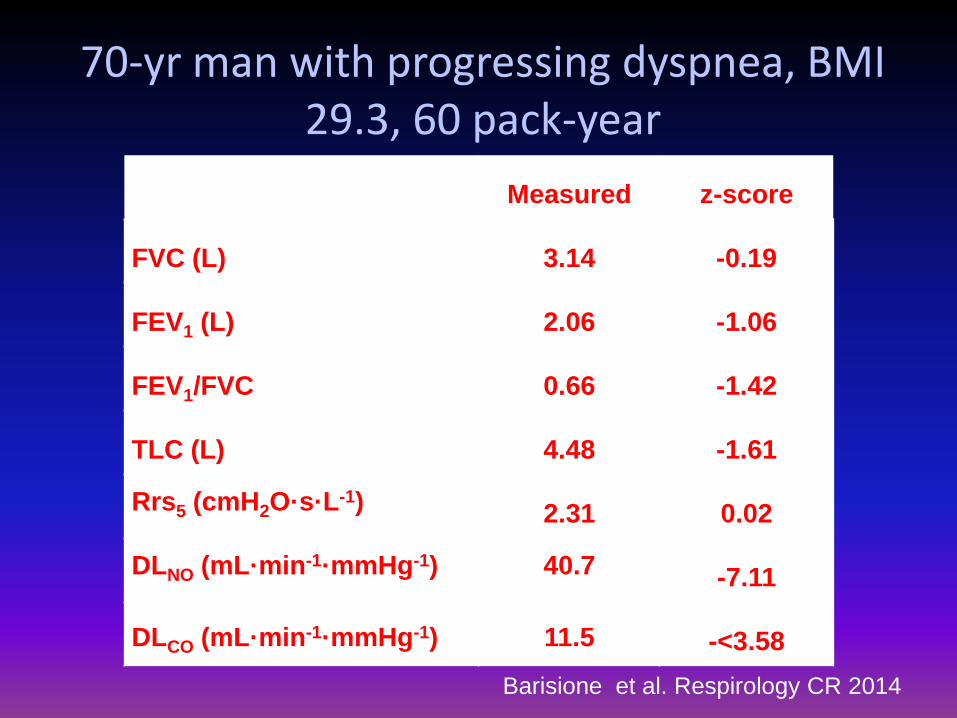
Measured z-score
FVC (L) 3.14 -0.19
FEV1 (L) 2.06 -1.06
FEV1/FVC 0.66 -1.42
TLC (L) 4.48 -1.61
Rrs5 (cmH2O·s·L-1) 2.31 0.02
DLNO (mL·min-1·mmHg-1) 40.7 -7.11
DLCO (mL·min-1·mmHg-1) 11.5 -<3.58
70-yr man with progressing dyspnea, BMI 29.3, 60 pack-year
Barisione et al. Respirology CR 2014
70-yr man with progressing dyspnea, BMI 29.3, 60 pack-year
Barisione et al. Respirology CR 2014
Lung density
0.24 g⋅mL−1 0.18 g⋅mL−1
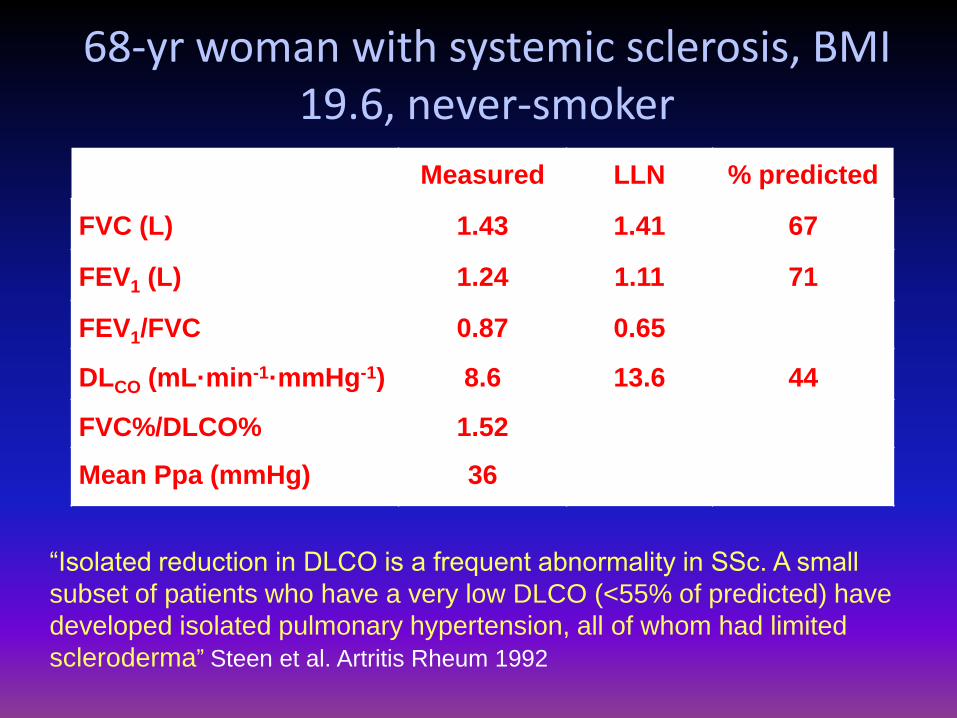
68-yr woman with systemic sclerosis, BMI 19.6, never-smoker
Measured LLN % predicted
FVC (L) 1.43 1.41 67
FEV1 (L) 1.24 1.11 71
FEV1/FVC 0.87 0.65
DLCO (mL·min-1·mmHg-1) 8.6 13.6 44
FVC%/DLCO% 1.52
Mean Ppa (mmHg) 36
“Isolated reduction in DLCO is a frequent abnormality in SSc. A small
subset of patients who have a very low DLCO (<55% of predicted) have
developed isolated pulmonary hypertension, all of whom had limited
scleroderma” Steen et al. Artritis Rheum 1992
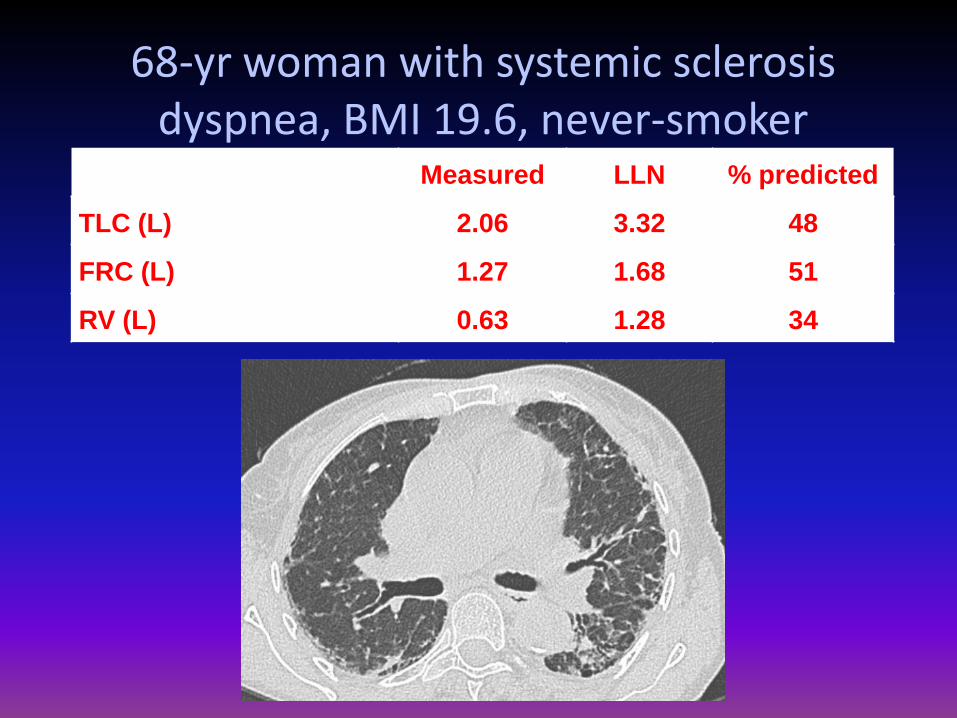
68-yr woman with systemic sclerosis dyspnea, BMI 19.6, never-smoker
Measured LLN % predicted
TLC (L) 2.06 3.32 48
FRC (L) 1.27 1.68 51
RV (L) 0.63 1.28 34
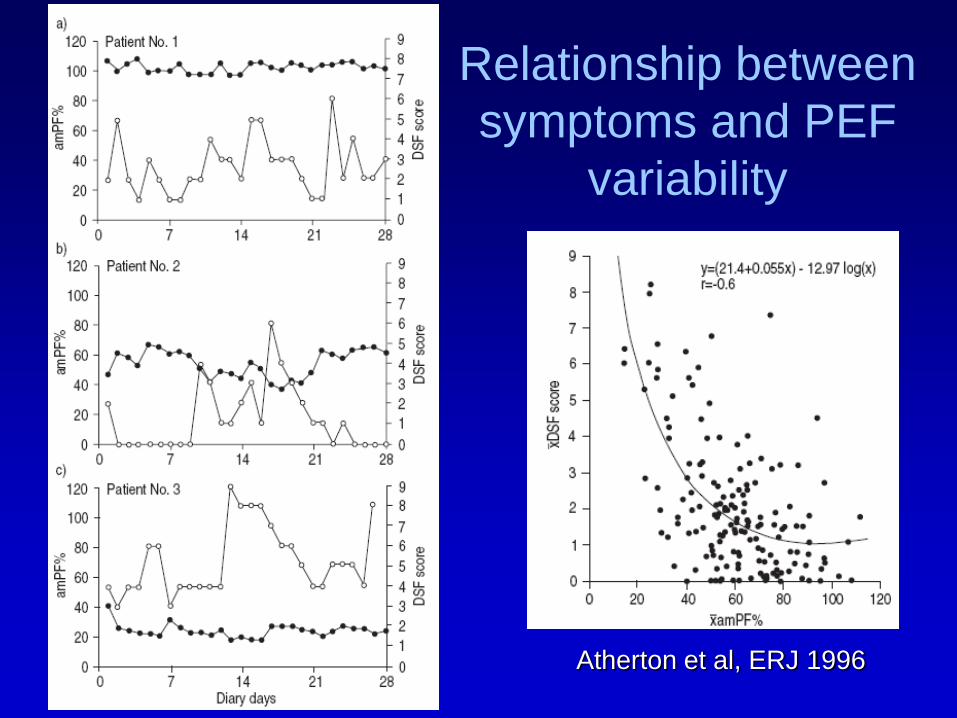
Atherton et al, ERJ 1996
Relationship between
symptoms and PEF
variability
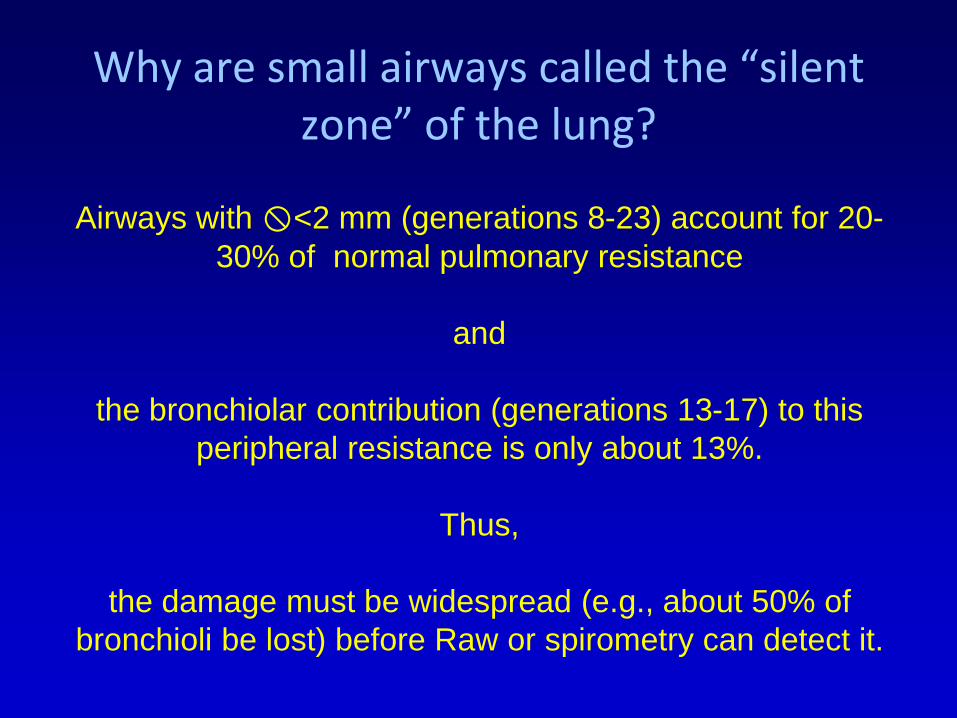
Airways with <2 mm (generations 8-23) account for 20-
30% of normal pulmonary resistance
and
the bronchiolar contribution (generations 13-17) to this
peripheral resistance is only about 13%.
Thus,
the damage must be widespread (e.g., about 50% of
bronchioli be lost) before Raw or spirometry can detect it.
Why are small airways called the “silent zone” of the lung?
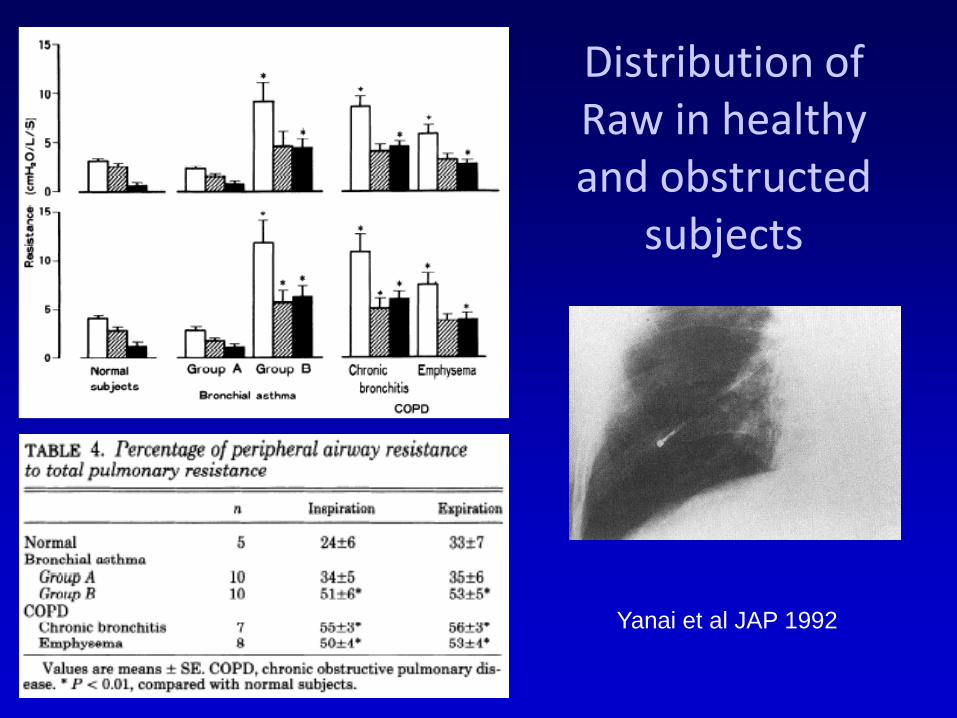
Distribution of Raw in healthy and obstructed
subjects
Yanai et al JAP 1992
RL
Ra
w, >
3 m
m
Ra
w, <
3 m
m
Inspiration
Expiration
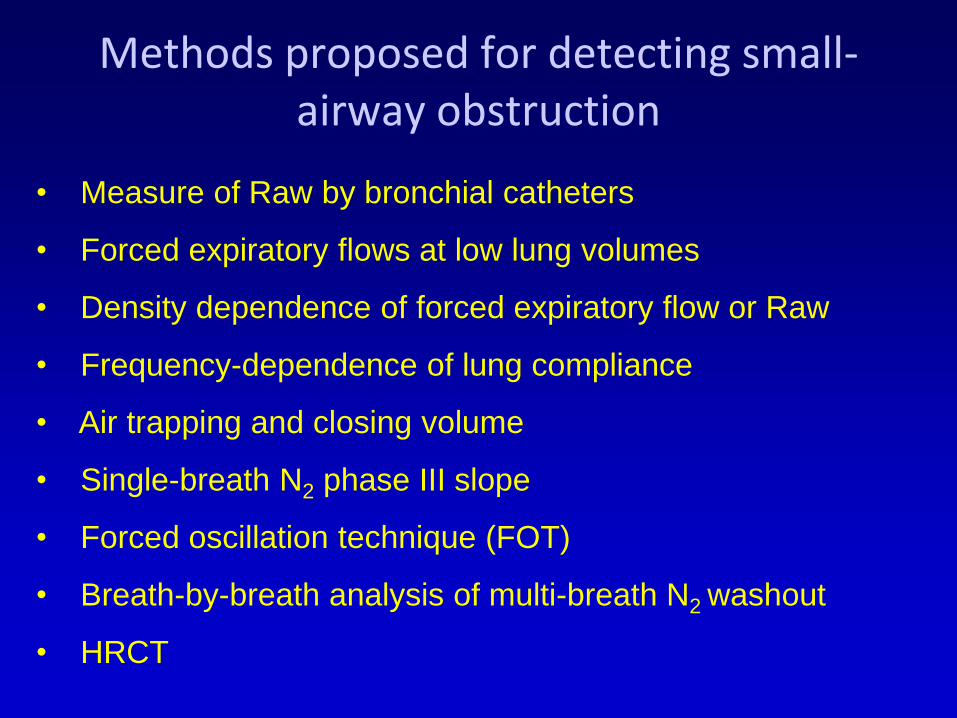
Methods proposed for detecting small-airway obstruction
• Measure of Raw by bronchial catheters
• Forced expiratory flows at low lung volumes
• Density dependence of forced expiratory flow or Raw
• Frequency-dependence of lung compliance
• Air trapping and closing volume
• Single-breath N2 phase III slope
• Forced oscillation technique (FOT)
• Breath-by-breath analysis of multi-breath N2 washout
• HRCT
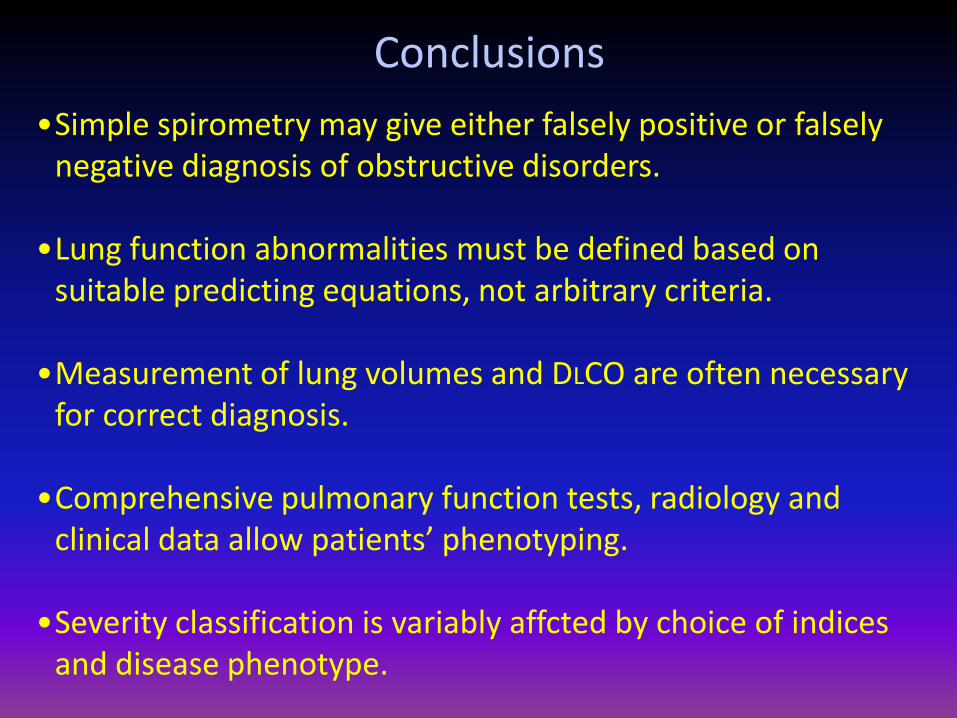
Conclusions
•Simple spirometry may give either falsely positive or falsely negative diagnosis of obstructive disorders.
•Lung function abnormalities must be defined based on suitable predicting equations, not arbitrary criteria.
•Measurement of lung volumes and DLCO are often necessary for correct diagnosis.
•Comprehensive pulmonary function tests, radiology and clinical data allow patients’ phenotyping.
•Severity classification is variably affcted by choice of indices and disease phenotype.