
La Capitale Automobile CARS 2014 - Slides del convegno
133
9° summit degli operatori della distribuzione automobilistica Venerdì 24 ottobre2014 Roma – Auditorium del Massimo
-
Upload
fleetmobility -
Category
Automotive
-
view
898 -
download
0
Transcript of La Capitale Automobile CARS 2014 - Slides del convegno
9° summit degli operatori della distribuzione automobilistica
Venerdì 24 ottobre2014Roma – Auditorium del Massimo


Associazioni
Corrado Piazzalunga,
Assilea
Fabrizio Ruggiero,
Aniasa
Gianfranco Soranna
Federauto
Romano Valente,
Unrae
Mobilità
Pierluigi Bonora
Missione Mobilità
Pier Luigi Del Viscovo
Fleet&Mobility

InsuranceGianpiero
Mosca,
Aon Re Trust Broker

Dealer
Luciano Belluzzo,
Audi Zentrum
Adolfo De Stefani
Cosentino,
De Stefani
Piero Mocarelli,
Mocauto
Plinio Vanini,
Autotorino
Case
Michele Crisci,
Volvo
Daniele Maver,
Jaguar Land Rover
Nicola Pumilia,
FCA
Outlook globale su car industry
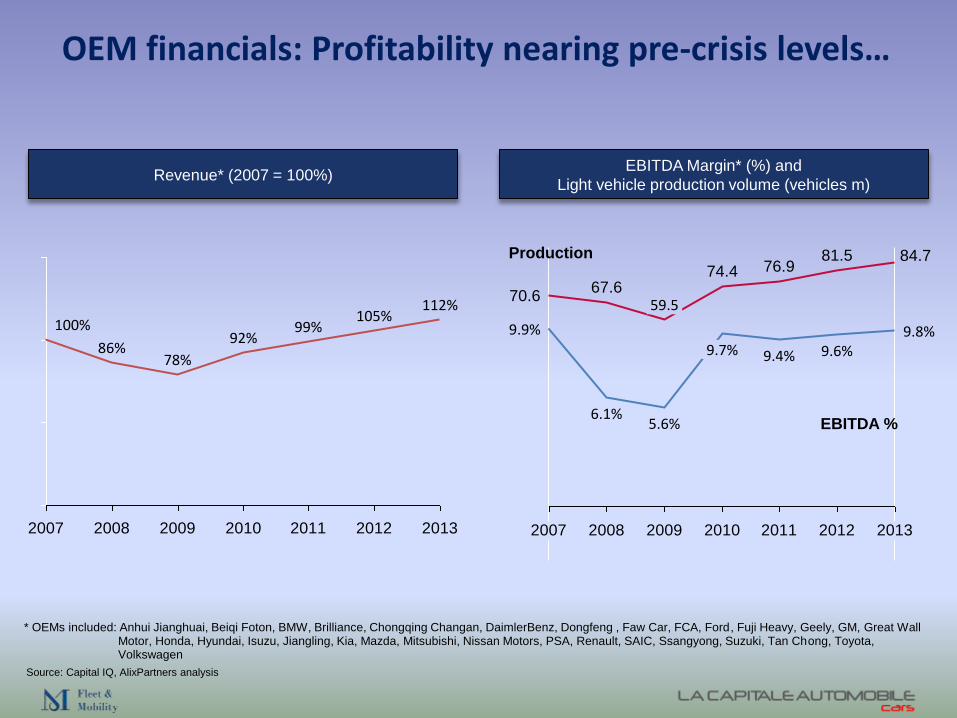
OEM financials: Profitability nearing pre-crisis levels…
2007 2008 2009 2010 2011 2012 2013
105%112%
92%99%
86%78%
100%
2007 2008 2009 2010 2011 2012 2013
84.781.5
9.8%
76.9
9.6%
74.4
9.4%
59.5
9.7%
67.6
5.6%
70.6
6.1%
9.9%
Production
EBITDA %
Source: Capital IQ, AlixPartners analysis
Revenue* (2007 = 100%)EBITDA Margin* (%) and
Light vehicle production volume (vehicles m)
* OEMs included: Anhui Jianghuai, Beiqi Foton, BMW, Brilliance, Chongqing Changan, DaimlerBenz, Dongfeng , Faw Car, FCA, Ford, Fuji Heavy, Geely, GM, Great Wall Motor, Honda, Hyundai, Isuzu, Jiangling, Kia, Mazda, Mitsubishi, Nissan Motors, PSA, Renault, SAIC, Ssangyong, Suzuki, Tan Chong, Toyota, Volkswagen

Global industry up 20% vs. pre-crisis, but Europe down 19%
Light vehicles sales volume 2007-2013 [units m]
World Europe
2012
79.4
2011
75.6
2010
72.4
+20%
2013
83.2
2009
63.8
2008
66.0
2007
69.5
16.9
5.4
15.4
5.8
15.0
3.4
14.5
19.3
2010
18.4
2009
18.4
2008
14.4
4.9
13.2
5.1
12.9
5.0
21.2
2007
22.3
2013
-19%
18.0
2012
18.3
2011
3.9
Sources: IHS Global Insight Q1 2014, AlixPartners analysis
W EuropeCE Europe
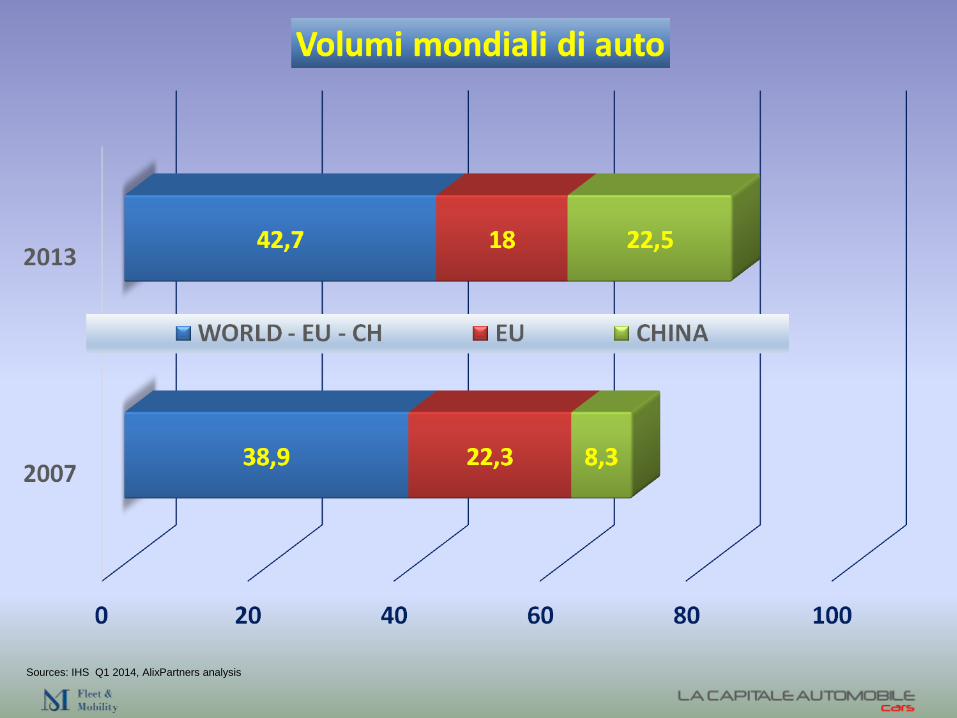
Sources: IHS Q1 2014, AlixPartners analysis

The growth continues to be unevenly spread across the globe; mature
markets saturated and mainly driven by replacement demand
Global LV volumes sold 2007-2019 [vehicles m]
Central / Eastern Europe
North America
C/S America
Vehicles sales [units m]
16.9
x.x
69.5
Greater China*
Japan / South Korea
Western Europe
Other**
Worldwide
Sources: IHS Q1 2014, AlixPartners analysis * China, Hong Kong, Taiwan ** India, ASEAN, Middle East, Africa, Oceania
103%
20192014
102%
2013
100%
2012
97%
2009
67%
2007
100%
2019
90%
2014
81%
2014
79%
2013
77%
2009
89%
2007
100%
2019
122%100%
2014
91%
2013
87%
2012
93%
2009
62%
2007
363%
20192014
305%
2013
285%
2012
262%
2009
159%
2007
100%
2019
164%
2012
139%
2009
101%
2007
100%
2014
138%
2013
135%
180%
20192014
146%
2013
137%
2012
135%
2009
124%
2007
100%
96%
20192014
99%
2013
100%
2012
104%
2009
93%
2007
100%
2009
95%
2007 2015
128%
2014
123%
2013
120%
2019
146%
100%
66.0 83.2 85.4 89.2 101.4
15.0 12.9 13.3 13.7 15.2 5.4 3.4 5.0 4.7 5.9 6.6
4.3 4.3 5.9 5.7 5.9 7.0
18.9 12.7 18.4 18.9 19.3 19.6
9.2 11.4 12.4 12.6 13.5 16.6
6.4 6.0 6.7 6.5 6.4 6.2
8.3 13.3 21.8 23.7 25.4 30.3

Ten-year outlook globally: Sales to grow 31%, to 109M units –an increase of more than 26M units
LV volumes sold 2007-2023 [vehicles m]
109107106
10310199
9793
8985
8379
7672
646669
201920182017201620152014 20212020
+31%
+20%
20232022201320122011201020082007 2009
Sources: IHS Global Insight Q1 2014, AlixPartners analysis
Total industry volume growth
2013-23: +26.1m vehicles
China
Russia
India
Brazil
USA
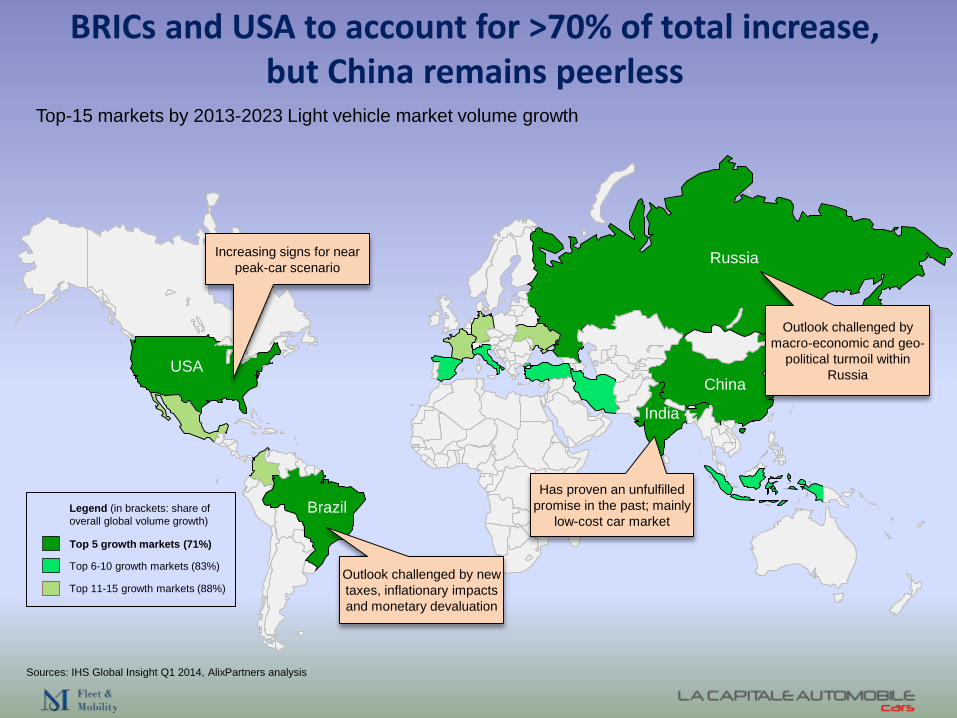
BRICs and USA to account for >70% of total increase, but China remains peerless
Sources: IHS Global Insight Q1 2014, AlixPartners analysis
Top-15 markets by 2013-2023 Light vehicle market volume growth
Top 5 growth markets (71%)
Legend (in brackets: share of
overall global volume growth)
Top 11-15 growth markets (88%)
Top 6-10 growth markets (83%)Outlook challenged by new
taxes, inflationary impacts
and monetary devaluation
Outlook challenged by
macro-economic and geo-
political turmoil within
Russia
Has proven an unfulfilled
promise in the past; mainly
low-cost car market
Increasing signs for near
peak-car scenario

Europe industry challenges
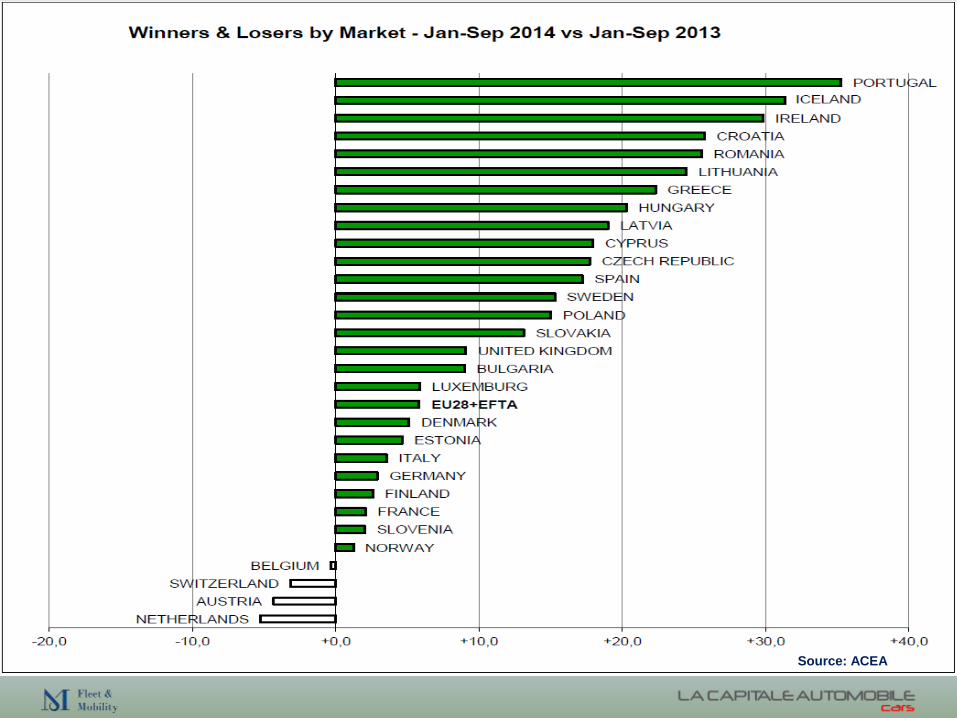
Source: ACEA

But many markets still below pre-crisis levels in 2013
Sources: IHS Global Insight Q1 2014, AlixPartners analysis
Light vehicle sales volume comparison 2013 vs 2007
>25%
% change
15-25%
5-15%
5% - -5%
-5% - -15%
-15% - -25%
-25% - -35%
>-35%
Germany
Russia
UK
France
Italy Turkey
Spain
Belgium
Netherlands
Austria
The top-10 markets
called out in writing
account for 83% of
the total European
sales volume in
2013
WESTERN EUROPE
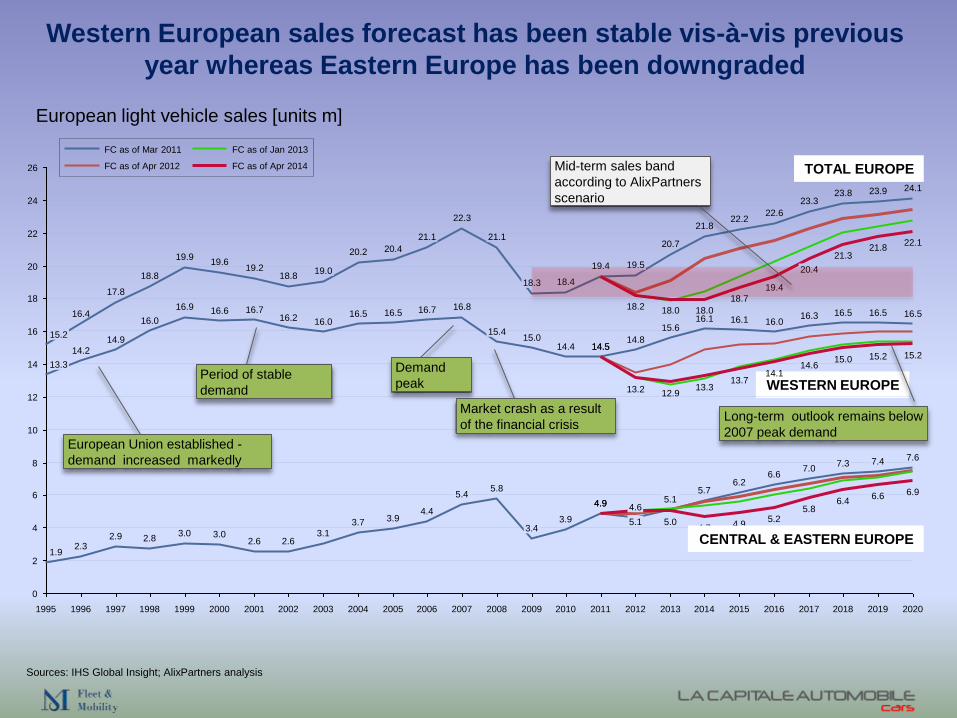
Western European sales forecast has been stable vis-à-vis previous
year whereas Eastern Europe has been downgraded
16
14
12
2007200620052004200320022001200019991998199719961995
10
8
6
26
24
22
4
20
18
2
0
2020201920182017201620152014201320122011201020092008
18.7
4.9
13.7
22.2
6.2
16.118.0
4.7
13.3
21.8
5.7
16.118.0
22.1
6.9
15.2
24.1
7.6
16.5
6.6
15.2
23.9
7.4
16.5
21.3
6.4
15.0
21.8
23.8
7.3
16.5
20.4
5.8
14.6
23.3
7.0
16.3
19.4
5.2
14.1
22.6
6.6
16.0
5.0
12.9
20.7
5.1
15.6
18.2
5.1
13.2
19.5
4.6
14.8
19.4
4.9
14.5
19.4
4.9
14.5
18.4
3.9
14.4
18.3
3.4
15.0
21.1
5.8
15.4
22.3
5.4
16.8
21.1
4.4
16.7
20.4
3.9
16.5
20.2
3.7
16.5
19.0
3.1
16.0
18.8
2.6
16.2
19.2
2.6
16.7
19.6
3.0
16.6
19.9
3.0
16.9
18.8
2.8
16.0
17.8
2.9
14.9
16.4
2.3
14.2
15.2
1.9
13.3
TOTAL EUROPE
CENTRAL & EASTERN EUROPE
Period of stable
demand
Demand
peak
European Union established -
demand increased markedly
Market crash as a result
of the financial crisisLong-term outlook remains below
2007 peak demand
Mid-term sales band
according to AlixPartners
scenario
FC as of Apr 2014
FC as of Mar 2011 FC as of Jan 2013
FC as of Apr 2012
European light vehicle sales [units m]
Sources: IHS Global Insight; AlixPartners analysis

Perché è tanto difficile azzeccare le previsioni di mercato?
E perché, comunque, si sbaglia sempre per eccesso?
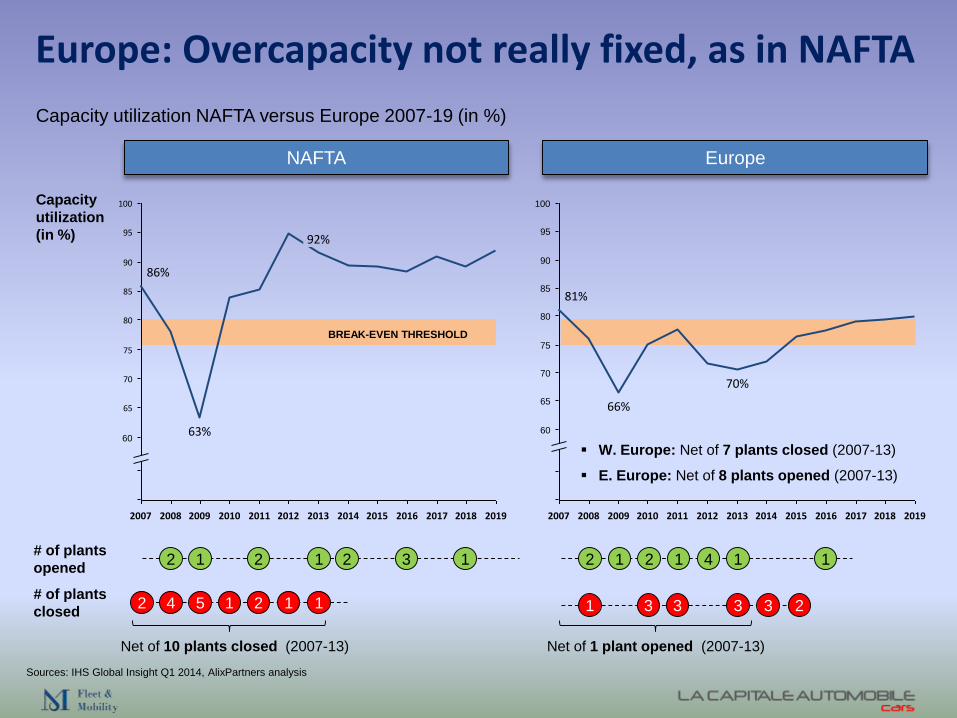
Europe: Overcapacity not really fixed, as in NAFTA
Capacity utilization NAFTA versus Europe 2007-19 (in %)
NAFTA Europe
Sources: IHS Global Insight Q1 2014, AlixPartners analysis
95
90
85
80
75
70
65
60
2019201820172016201520142013201220112010200920082007
100
70%
66%
81%
100
95
90
85
80
75
70
65
60
2010200920082007 2012 2013 2014 2015 2016 2017 2018 20192011
92%
63%
86%
Capacity
utilization
(in %)
BREAK-EVEN THRESHOLD
# of plants
opened2 1 2 1
# of plants
closed2 4 1 15 2 1
2 1 2 1
1 3 3 3
1 4
Net of 10 plants closed (2007-13)
W. Europe: Net of 7 plants closed (2007-13)
E. Europe: Net of 8 plants opened (2007-13)
2 3 1
3 2
1
Net of 1 plant opened (2007-13)
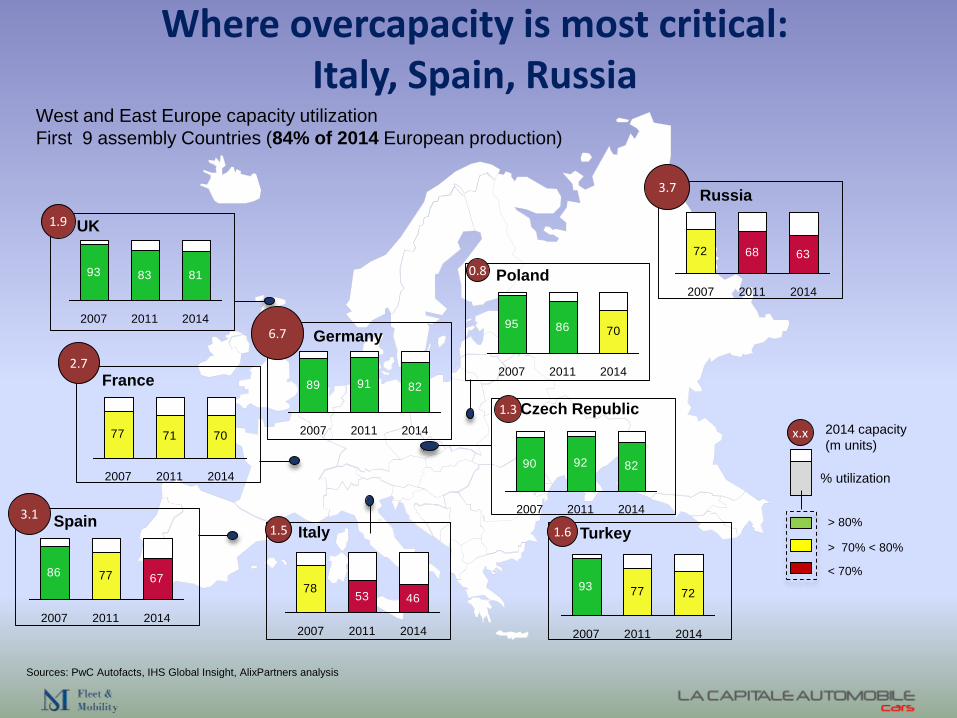
Where overcapacity is most critical: Italy, Spain, Russia
Germany
Spain
France
Russia
UK
Turkey
Poland
Sources: PwC Autofacts, IHS Global Insight, AlixPartners analysis
West and East Europe capacity utilization
First 9 assembly Countries (84% of 2014 European production)
Italy
Czech Republic
% utilization
2014 capacity
(m units)
6.7
2.7
3.1
3.7
1.9
1.61.5
0.8
1.3
x.x
> 80%
> 70% < 80%
< 70%
93 83 81
201420112007
89 91 82
201420112007
95 86 70
201420112007
68 6372
201420112007
77 7293
201420112007
53 4678
2007 20142011
677786
201420112007
77 71 70
2011 2014200790 92 82
201420112007

Il WTO ha rivisto al ribasso le previsioni di crescita del commercio.
Che impatto si prevede sulle fabbriche europee di automobili?
Che pressione sul mercato Italia?
Source: WTO

Tensioni. Incertezze. Imprevedibilità dei mercati. Crescita meno stabile.
• USA (disoccupazione <6%) e UK (PIL +3,2%) fuori dal tunnel.
• Europa in recessione
• Giappone: fine della crescita (più IVA ha frenato i consumi)
• Russia e Brasile, stagnazione se va bene.
• China (+7,5% PIL) ma rischio credit bubble e calo produttività
Source: The Economist

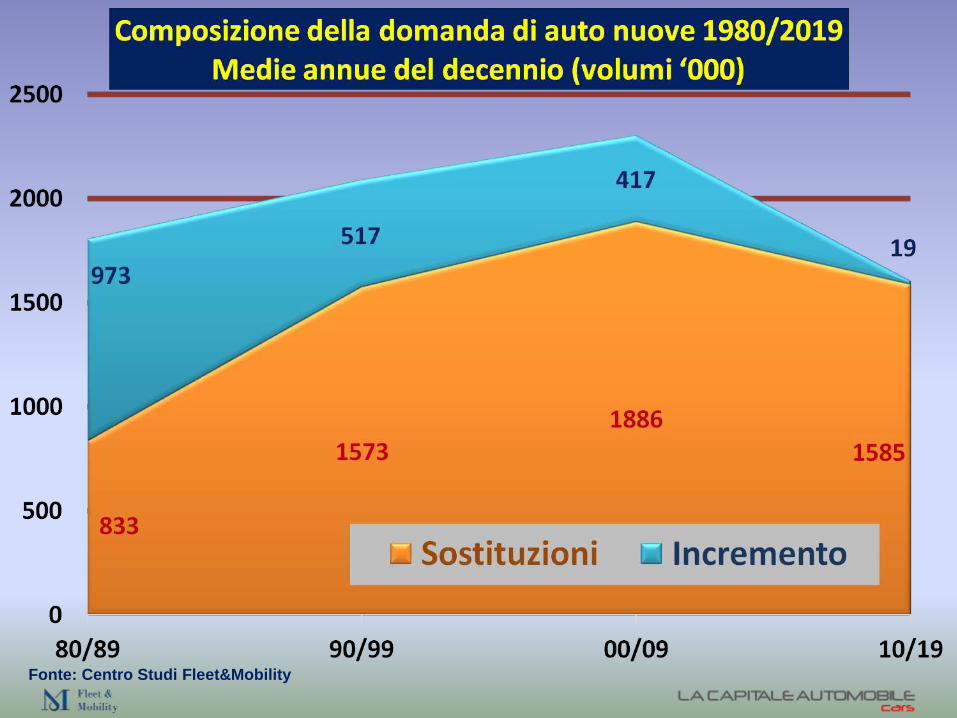
Parco circolante e domanda di auto nuove
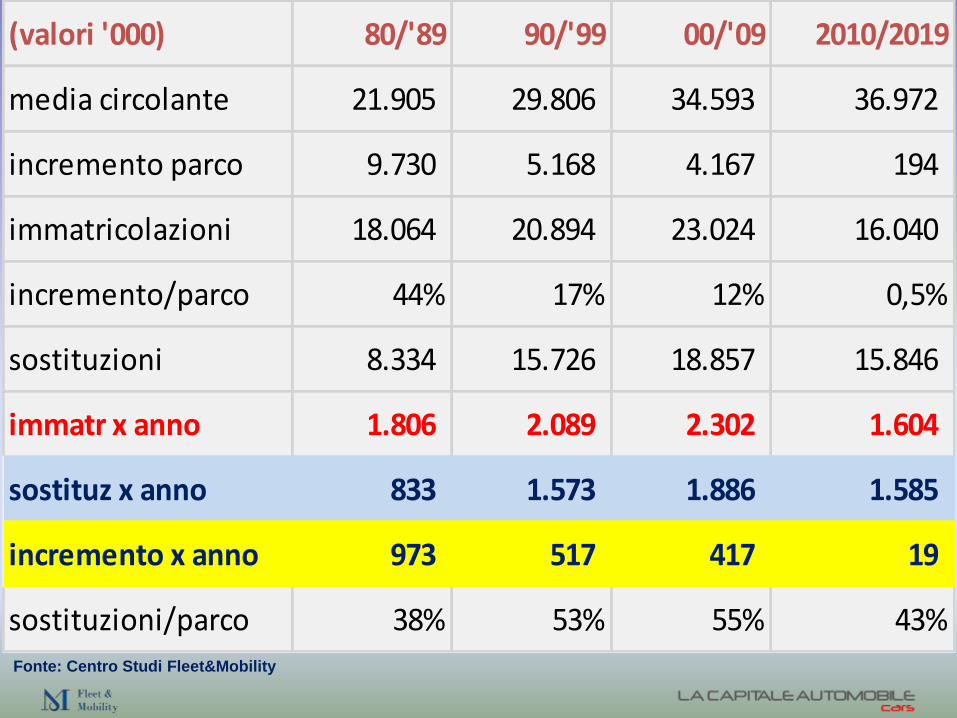
(valori '000) 80/'89 90/'99 00/'09 2010/2019
media circolante 21.905 29.806 34.593 36.972
incremento parco 9.730 5.168 4.167 194
immatricolazioni 18.064 20.894 23.024 16.040
incremento/parco 44% 17% 12% 0,5%
sostituzioni 8.334 15.726 18.857 15.846
immatr x anno 1.806 2.089 2.302 1.604
sostituz x anno 833 1.573 1.886 1.585
incremento x anno 973 517 417 19
sostituzioni/parco 38% 53% 55% 43%Fonte: Centro Studi Fleet&Mobility
Fonte: Centro Studi Fleet&Mobility

Nordio.Parco circolante. 1
In questi anni, abbiamo attribuito il crollo delle vendite solo alla crisi.
Ma lo stop di crescita del parco circolante ha tolto almeno 4/500.000 targhe all’anno.
Questo non si poteva/doveva prevedere? Visto che:
Negli anni ‘90 l’incremento si è dimezzato.
Negli anni ‘00 è stato sostenuto con forzature

Ficili. Parco circolante. 18

28 milioni su 37 immatricolate dal 2000.Relazioni sociali e mobilità nuove.Leasing e NLT durano più a lungo.
Caro-benzina, RC, traffico, parcheggi, ZTL.Disoccupazione, incertezza, lost generation.
Con tutto ciò, 1.350.000 immatricolazioni!
Sicuro che l’auto sia in crisi? Il bicchiere non è «mezzo pieno»?
Tutto sommato, la voglia di auto sembra esserci.

Mercato Italia.
Fonte: Centro Studi Fleet&Mobility

Fonte: Centro Studi Fleet&Mobility – UNRAE
Fo
nte
: C
en
tro
Stu
di
Fle
et&
Mo
bilit
y
Fo
nte
: C
en
tro
Stu
di
Fle
et&
Mo
bilit
y
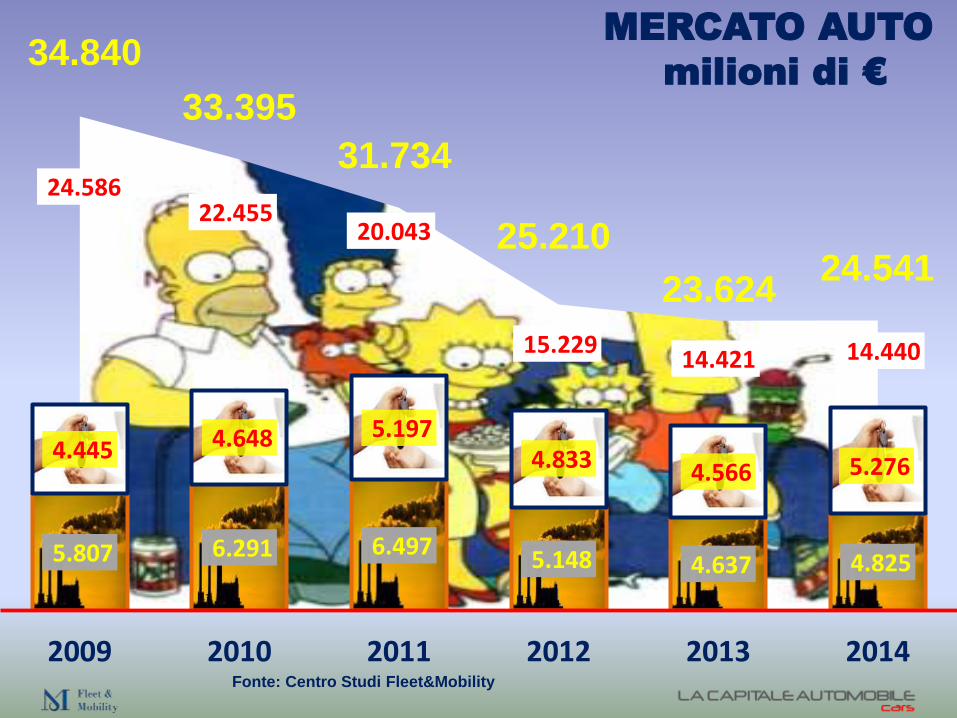
24.586 22.455
20.043
15.229 14.421 14.440
5.807 6.291 6.497 5.148 4.637 4.825
4.445 4.648 5.197 4.833 4.566 5.276
2009 2010 2011 2012 2013 2014
24.541
34.840
33.395
31.734
MERCATO AUTO
milioni di €
23.624
25.210
Fonte: Centro Studi Fleet&Mobility
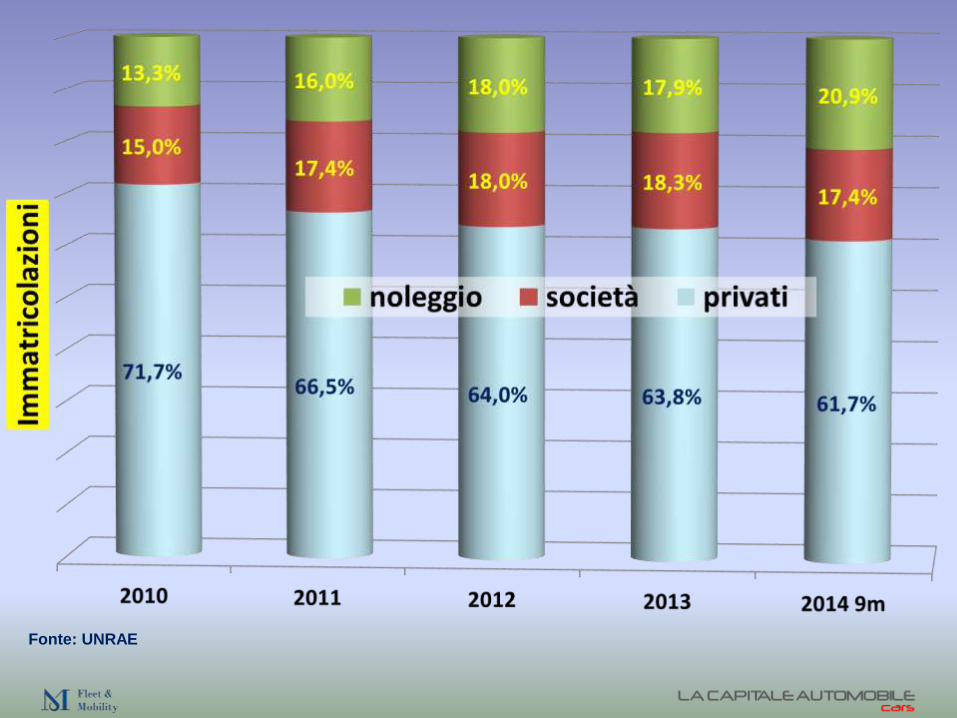
Fonte: UNRAE
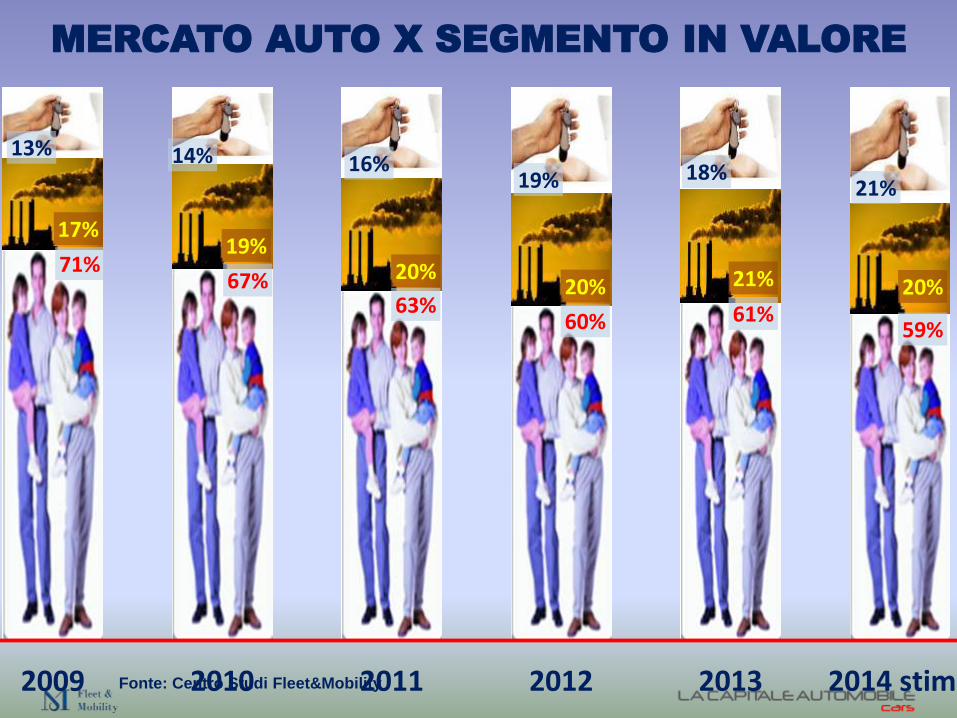
71%67%
63%60% 61%
59%
17%19%
20%20% 21% 20%
13% 14% 16%19% 18%
21%
2009 2010 2011 2012 2013 2014 stima
MERCATO AUTO X SEGMENTO IN VALORE
Fonte: Centro Studi Fleet&Mobility

Invece di abbassare le tasse sulle company car hanno
alzato quelle sulle famiglie. Il risultato è lo stesso, no?
Fonte: Centro Studi Fleet&Mobility

Atanasio. Flotte di prossimità. 19

Fonte: Centro Studi Fleet&Mobility
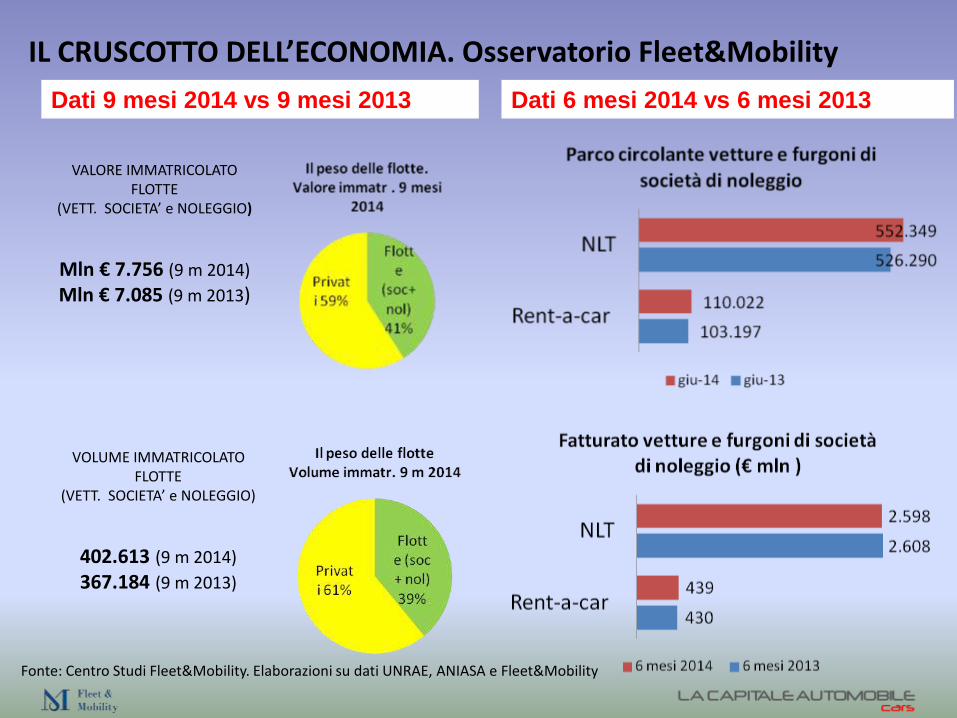
VALORE IMMATRICOLATO FLOTTE
(VETT. SOCIETA’ e NOLEGGIO)
Mln € 7.756 (9 m 2014)
Mln € 7.085 (9 m 2013)
Fonte: Centro Studi Fleet&Mobility. Elaborazioni su dati UNRAE, ANIASA e Fleet&Mobility
IL CRUSCOTTO DELL’ECONOMIA. Osservatorio Fleet&Mobility
VOLUME IMMATRICOLATO FLOTTE
(VETT. SOCIETA’ e NOLEGGIO)
402.613 (9 m 2014)
367.184 (9 m 2013)
Dati 9 mesi 2014 vs 9 mesi 2013 Dati 6 mesi 2014 vs 6 mesi 2013
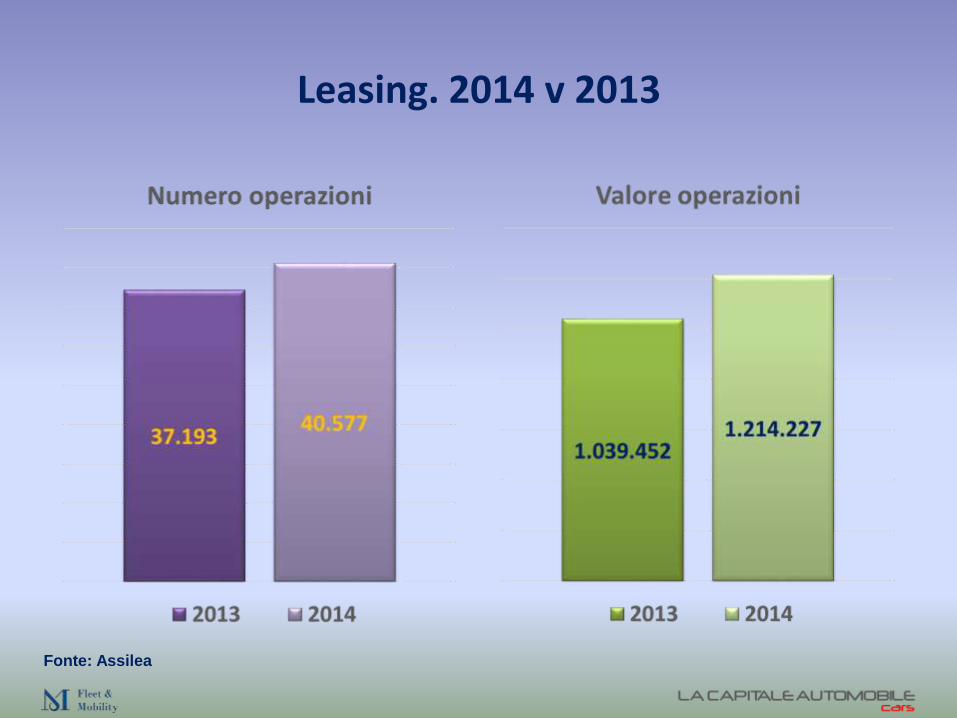
Leasing. 2014 v 2013
Fonte: Assilea
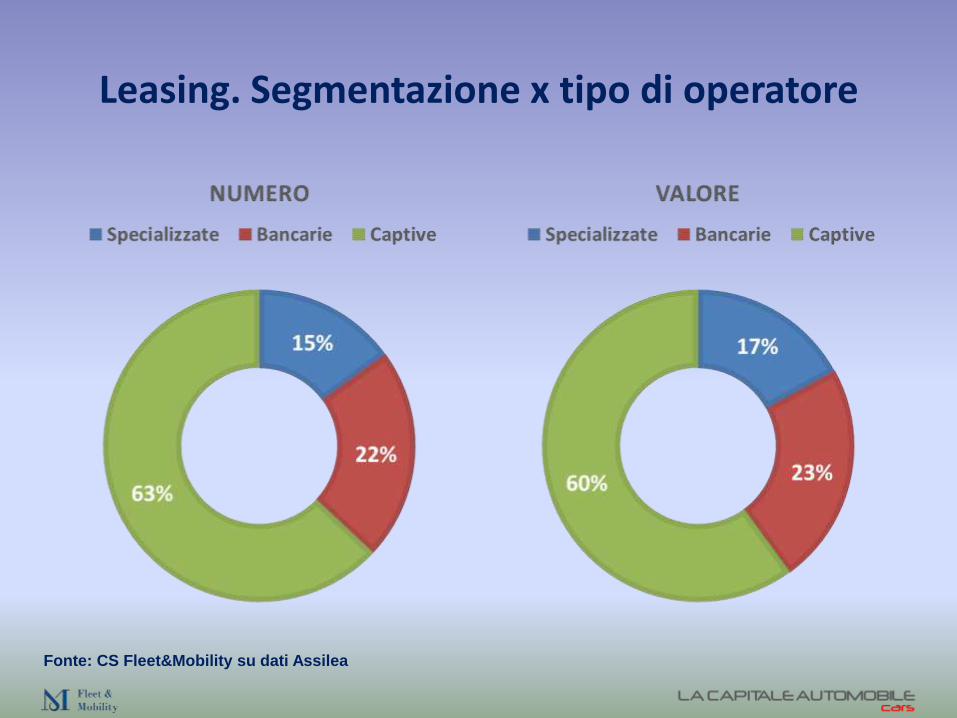
Leasing. Segmentazione x tipo di operatore
Fonte: CS Fleet&Mobility su dati Assilea

Leasing. Composizione del business
Fonte: CS Fleet&Mobility su dati Assilea

2015 = ? ______
9 mesi G-set ‘14 Var % G-set ‘13
Privati 641 = 640
Noleggio 217 +15% 189
Società 186 +4% 179
Mercato 1.044 +4% 1.007
Ipotesi STD 2014 Var % 2013
9 mesi 1.044 +3,7 1.007
Ott-dic 319 +4,9 304
Tot anno 1.363 +4,0 1.311
Ipotesi FCA 2014 Var % 2013
9 mesi 1.044 +3,7 1.007
Ott-dic 293 -3,6 304
Tot anno 1.337 +2,0 1.311
Fonte: Centro Studi Fleet&Mobility – UNRAE

Sistema Italia

Sta funzionando. Perchè?

Nordio.Mobilità privata. 7


Nordio.Missione Italia. 8


Bilanci dei dealer.
Courtesy of Italia Bilanci
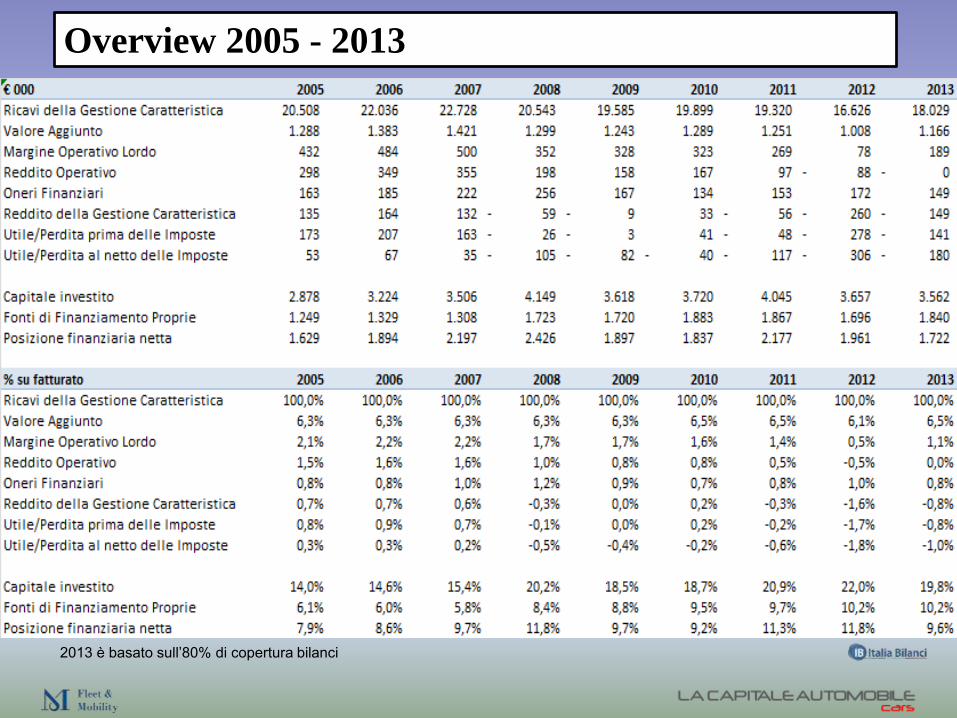
Overview 2005 - 2013
2013 è basato sull’80% di copertura bilanci

Evoluzione parametri economico finanziari
Dealer in perdita
Perdita cumulata : (830.000)
26% 25% 28% 47% 38% 38% 48% 60% 52%
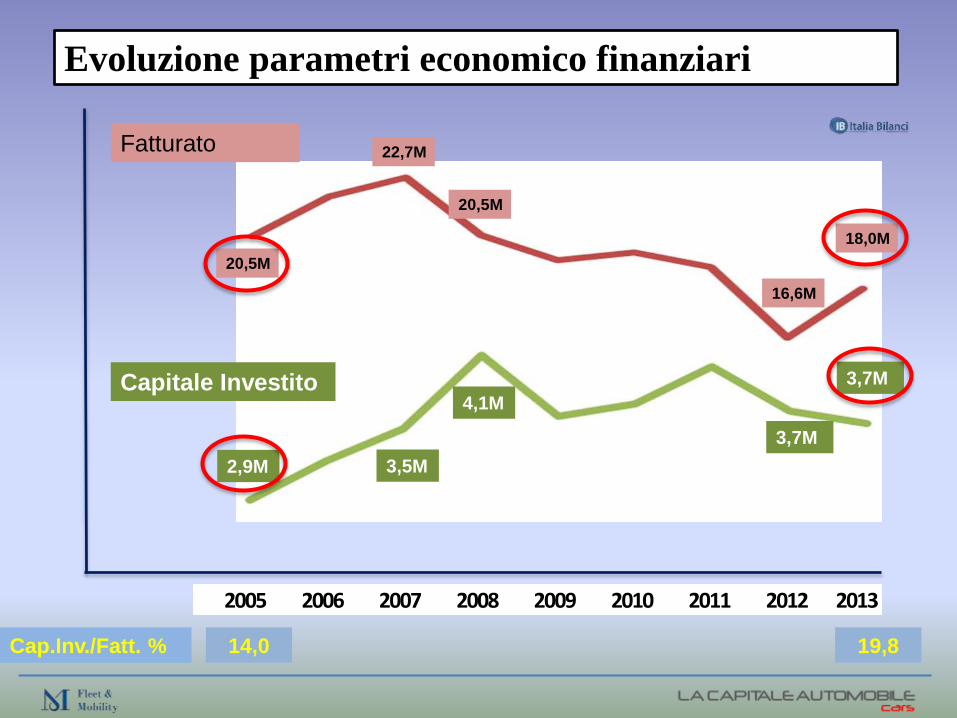
3,5M
3,7M
2005 2006 2007 2008 2009 2010 2011 2012 2013
22,7M
16,6M
20,5M
Fatturato
Capitale Investito
Cap.Inv./Fatt. % 19,8
Evoluzione parametri economico finanziari
4,1M
2,9M
20,5M
18,0M
3,7M
14,0
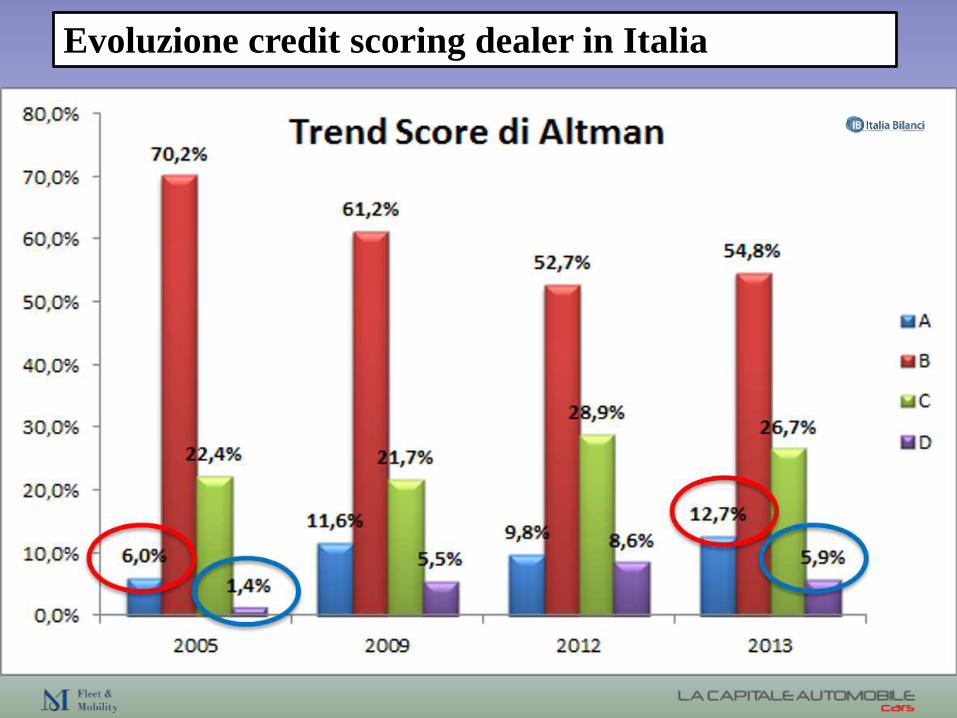
Evoluzione credit scoring dealer in Italia

Assicurazione.Gioie e dolori.
Courtesy of AON

438.48
718.79
241.98
2,250.55
453.36
715.59
246.55
2,226.73
C
L
M
B
2013 2012
Italy – portfolio avg premium by type of vehicle
AB analysis on Market data representing 91% of Mkt share
Total Average Premium
511.33
500.63
-2.1%
Y 2012
Y 2013

Italian Market –Number of vehicles
“not insured” and frauds
Source: ANIA – ASSICURAZIONE ITALIANA 2013/14
AreaInsured
vehicles
Not insured
vehicles
Tot.
circulating
vehicles
% of not
insured
vehicles
North 20,9 1,2 22,1 5,3%
Center 9,4 0,8 10,2 8,1%
South 10,1 1,5 11,6 13,1%
Total 40,4 3,5 43,9 8,0%
Not insured vehicles - 2013 estimated values (in million)
Country
% of frauds
on N° of
losses
% of
undetected
frauds
Italy -2% 7%-10%
France -1% 3%-5%
Germany n.d. 3%-5%
Spain -2% 3%-5%
UK -1,2% 3%-5%
MTPL frauds – European comparison
In Italy, according tothe Decree of January24th 2012«Disposizioni urgentiper la concorrenza, losviluppo delleinfrastrutture e lacompetitività», eachyear Italian insurancecompanies will have tosend to IVASS astandard report onfrauds (in case of non-submission of theannual report therewill be a penalty ofEuro 10.000-50.000)
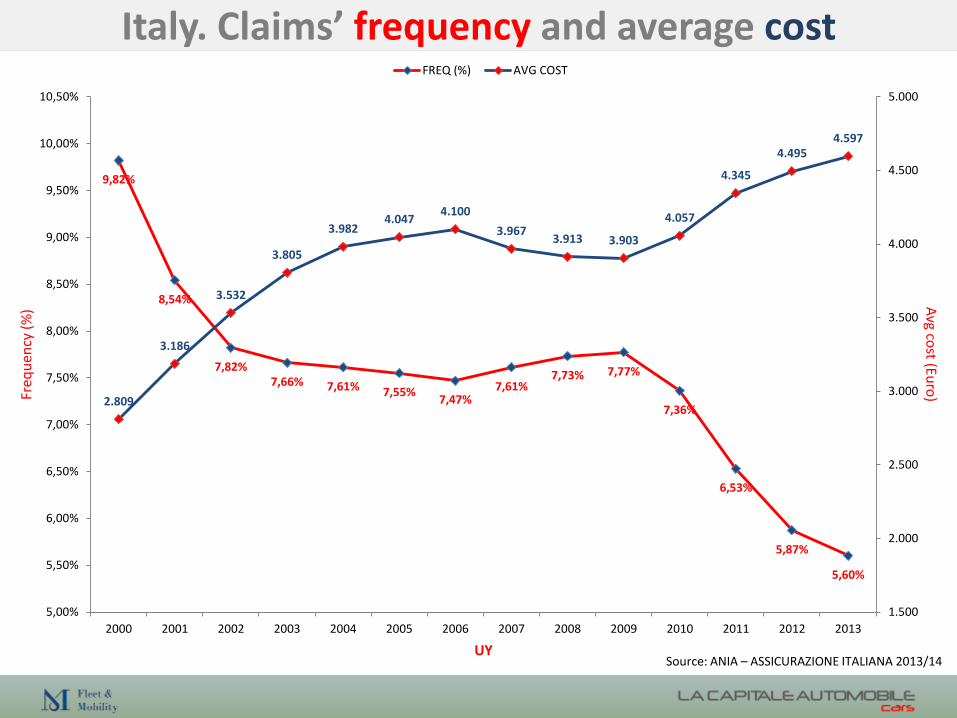
Italy. Claims’ frequency and average cost
9,82%
8,54%
7,82%7,66% 7,61% 7,55%
7,47%7,61%
7,73% 7,77%
7,36%
6,53%
5,87%
5,60%
2.809
3.186
3.532
3.805
3.9824.047
4.100
3.9673.913 3.903
4.057
4.345
4.4954.597
1.500
2.000
2.500
3.000
3.500
4.000
4.500
5.000
5,00%
5,50%
6,00%
6,50%
7,00%
7,50%
8,00%
8,50%
9,00%
9,50%
10,00%
10,50%
2000 2001 2002 2003 2004 2005 2006 2007 2008 2009 2010 2011 2012 2013
Avg co
st (Euro
)Freq
uen
cy (
%)
UY
FREQ (%) AVG COST
Source: ANIA – ASSICURAZIONE ITALIANA 2013/14
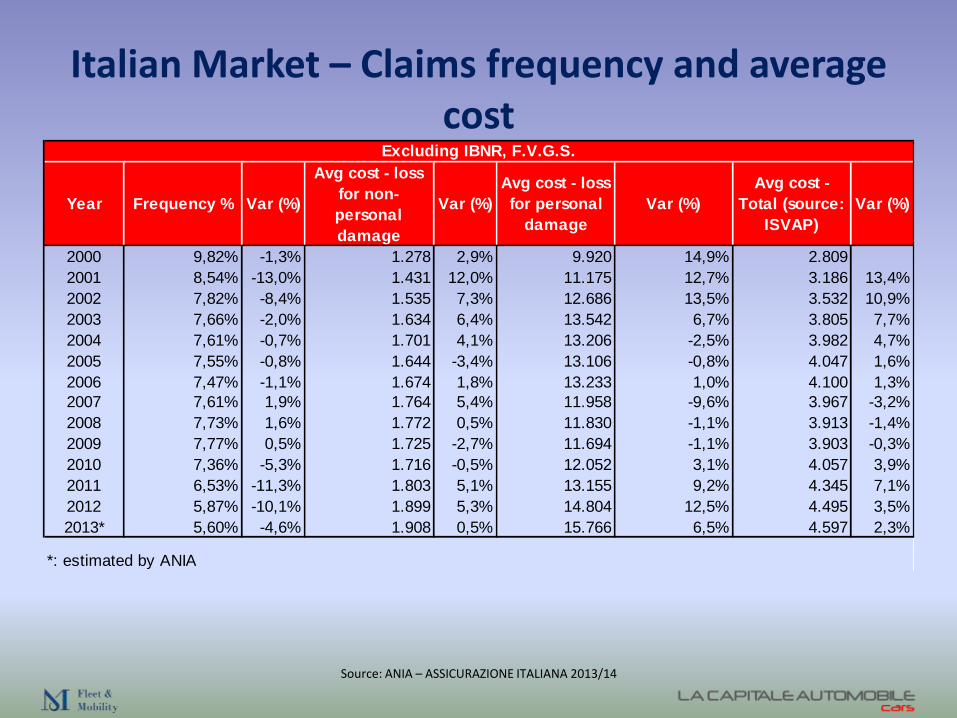
Italian Market – Claims frequency and average cost
Source: ANIA – ASSICURAZIONE ITALIANA 2013/14
Year Frequency % Var (%)
Avg cost - loss
for non-
personal
damage
Var (%)
Avg cost - loss
for personal
damage
Var (%)
Avg cost -
Total (source:
ISVAP)
Var (%)
2000 9,82% -1,3% 1.278 2,9% 9.920 14,9% 2.809
2001 8,54% -13,0% 1.431 12,0% 11.175 12,7% 3.186 13,4%
2002 7,82% -8,4% 1.535 7,3% 12.686 13,5% 3.532 10,9%
2003 7,66% -2,0% 1.634 6,4% 13.542 6,7% 3.805 7,7%
2004 7,61% -0,7% 1.701 4,1% 13.206 -2,5% 3.982 4,7%
2005 7,55% -0,8% 1.644 -3,4% 13.106 -0,8% 4.047 1,6%
2006 7,47% -1,1% 1.674 1,8% 13.233 1,0% 4.100 1,3%
2007 7,61% 1,9% 1.764 5,4% 11.958 -9,6% 3.967 -3,2%
2008 7,73% 1,6% 1.772 0,5% 11.830 -1,1% 3.913 -1,4%
2009 7,77% 0,5% 1.725 -2,7% 11.694 -1,1% 3.903 -0,3%
2010 7,36% -5,3% 1.716 -0,5% 12.052 3,1% 4.057 3,9%
2011 6,53% -11,3% 1.803 5,1% 13.155 9,2% 4.345 7,1%
2012 5,87% -10,1% 1.899 5,3% 14.804 12,5% 4.495 3,5%
2013* 5,60% -4,6% 1.908 0,5% 15.766 6,5% 4.597 2,3%
*: estimated by ANIA
Excluding IBNR, F.V.G.S.
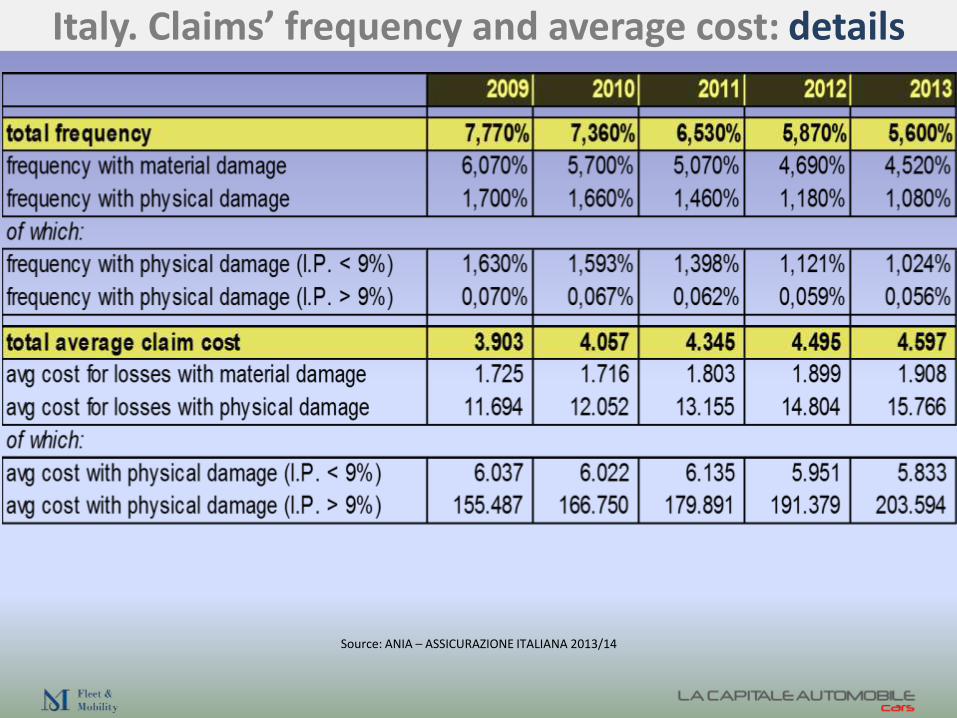
Source: ANIA – ASSICURAZIONE ITALIANA 2013/14
Italy. Claims’ frequency and average cost: details
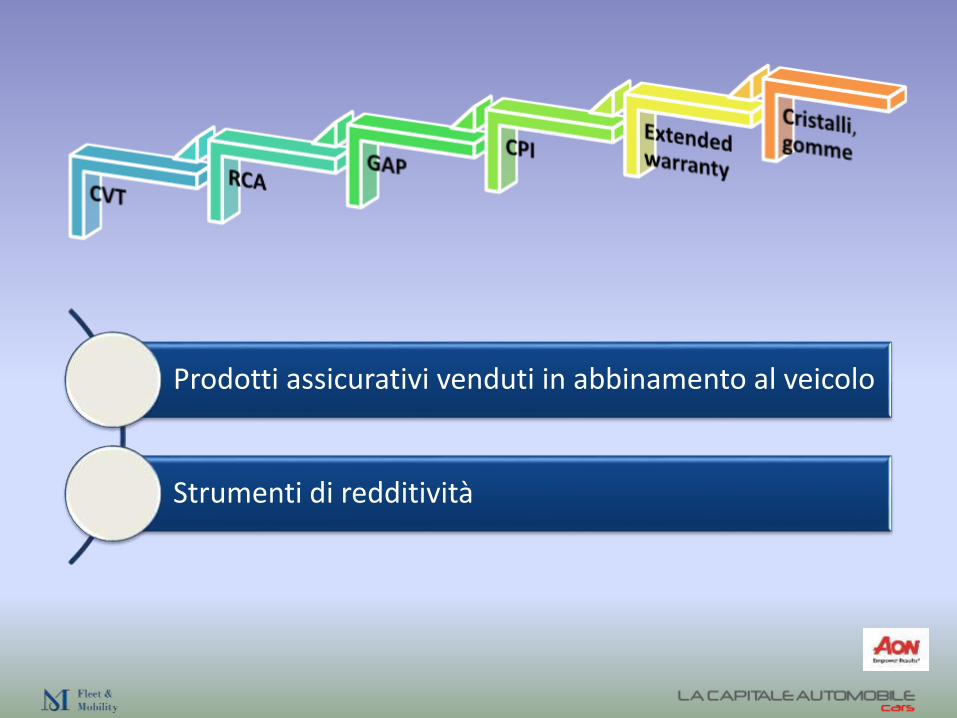
Prodotti assicurativi venduti in abbinamento al veicolo
Strumenti di redditività

Credit Protection Insurance
• Venduti insieme al veicolo
• Commissioni elevatissime
• Indagine IVASS ottobre 2013
• Netto calo delle vendite
1. Trasparenza verso il cliente. 2. Contenuti assicurativi adeguati.3. Redditività dealers.

Dealer, reti e saloni.

Ficili. Reti.
14
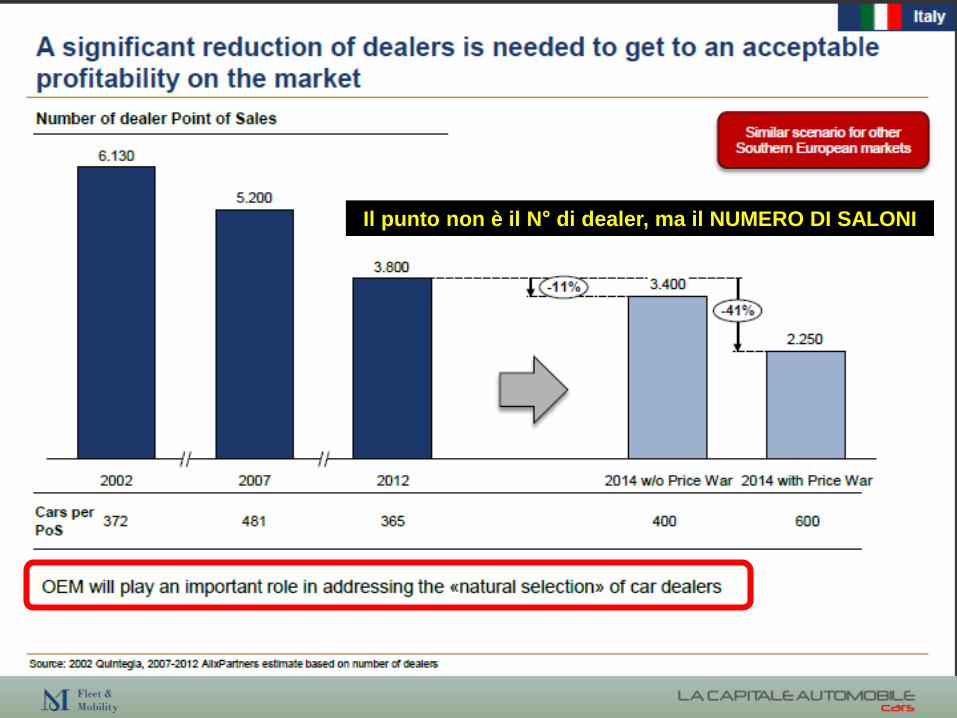
Il punto non è il N° di dealer, ma il NUMERO DI SALONI
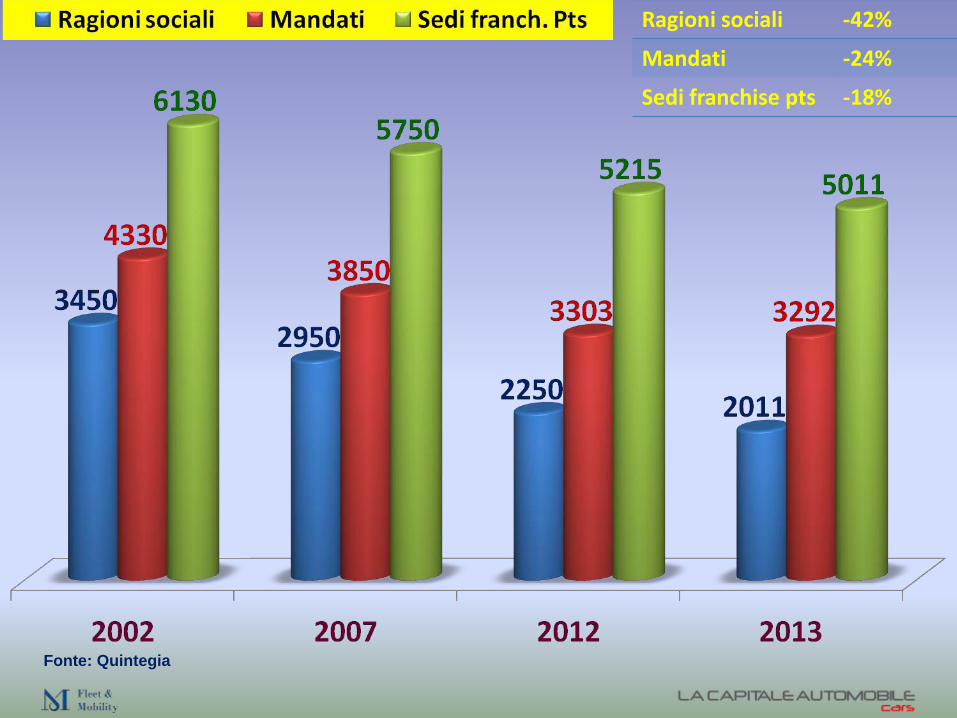
Ragioni sociali -42%
Mandati -24%
Sedi franchise pts -18%
Fonte: Quintegia

Targhe x rag.soc. +2%
Targhe x salone -30%
Fonte: Centro Studi Fleet&Mobility – Quintegia

Meno vendite. Meno punti vendita.Sulla carta, non fa una piega.
Ma sulla strada?
Come si fa a garantire la copertura (reach) del brand su un territorio che non è rimpicciolito?
Oltre una certa distanza il cliente rinuncia.

Fiaschetti.Brand del dealer. 12
Ficili. Fuori salone.
16

Atanasio. Supporto ai dealer. 20

Atanasio. Marginare sul cliente. 21

Atanasio. La venditaè l’inizio. 22

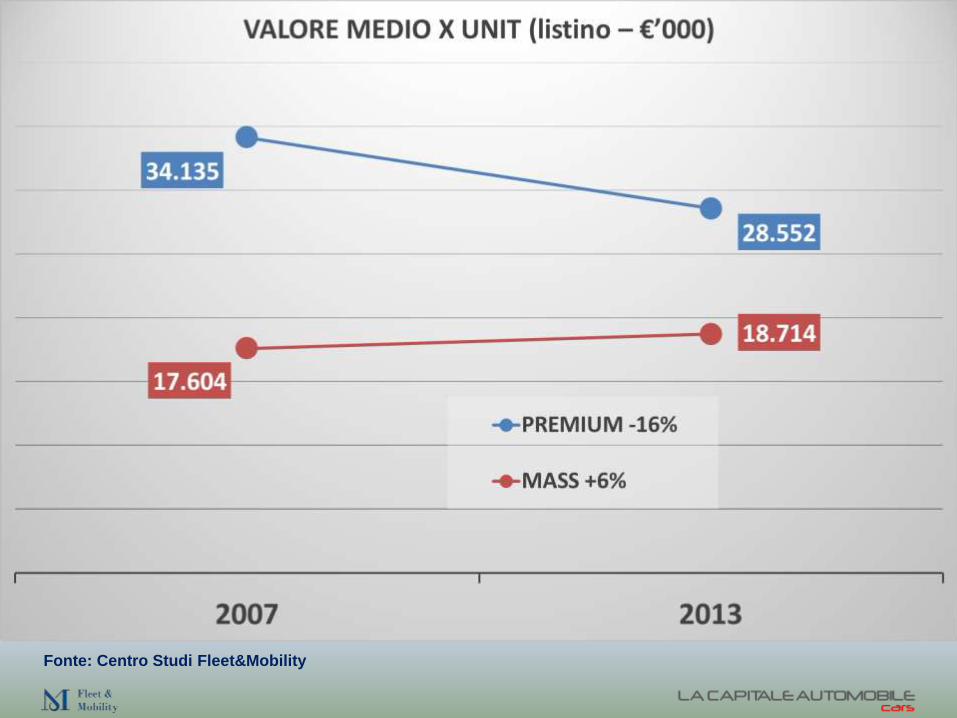
Premium e mass market
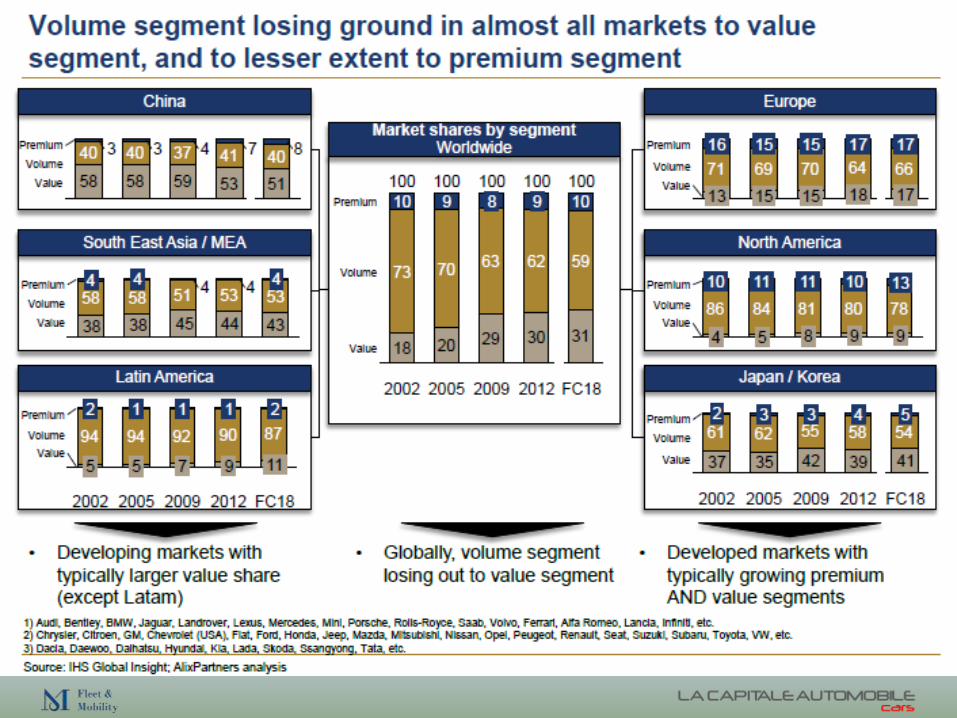
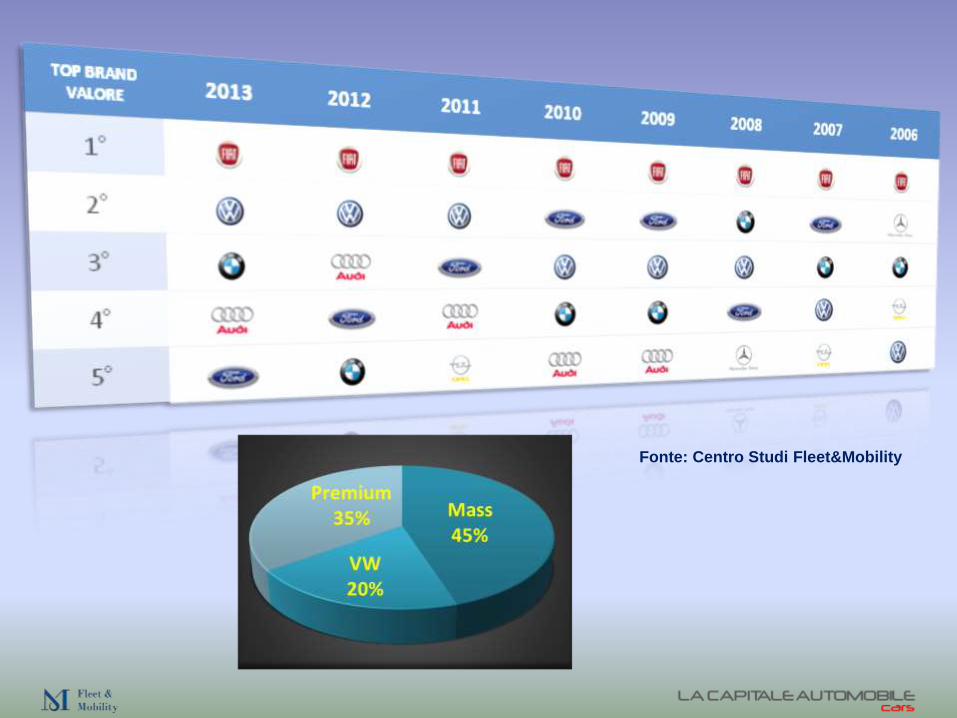
Fonte: Centro Studi Fleet&Mobility


AUTO PREMIUM: Audi, BMW, Mini, Mercedes, Smart, Lexus, Jeep, Jaguar, Land
Rover, Abarth, Aston Martin, Bentley, Cadillac, Hummer, Lamborghini, Infiniti, Lotus, Maserati, Porsche, Rolls Royce, Saab, Tesla, Volvo, Martin Motors, McLaren e Ferrari
+ Fiat 500, Opel Adam, Nissan Juke e Lancia Y.
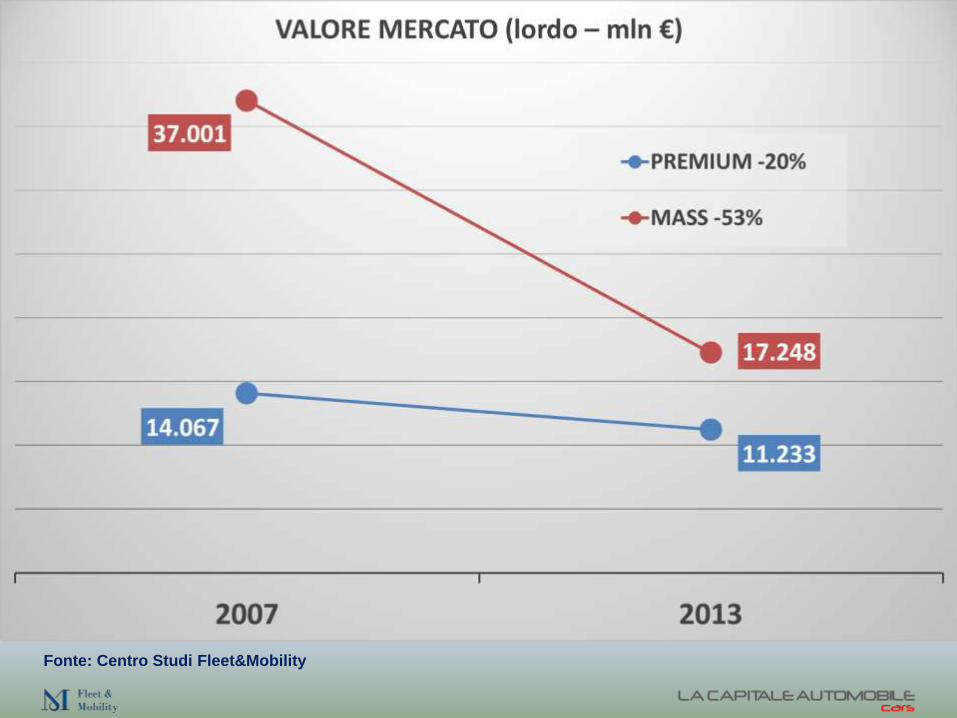
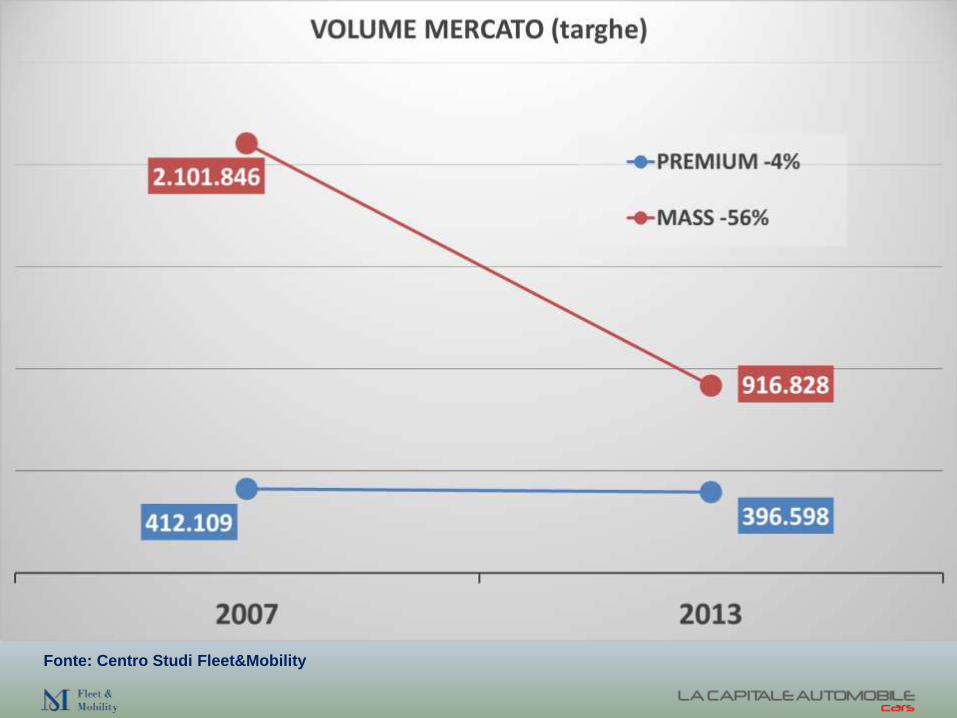
2007 2013
Fonte: Centro Studi Fleet&Mobility
Fonte: Centro Studi Fleet&Mobility
Fonte: Centro Studi Fleet&Mobility
Fonte: Centro Studi Fleet&Mobility

Nordio.Brand premium. 3

Negli anni la strategia delle Case è stata: se hai un brand premium, puoi prenderne un altro di massa, e viceversa. Così completi
l’offerta e non li metti in concorrenza.
Ma se sono due segmenti tanto diversi, non sarebbe meglio gestire insieme premium con
premium e generalista con generalista?
Fiaschetti.Multi-brand orizzontali. 11
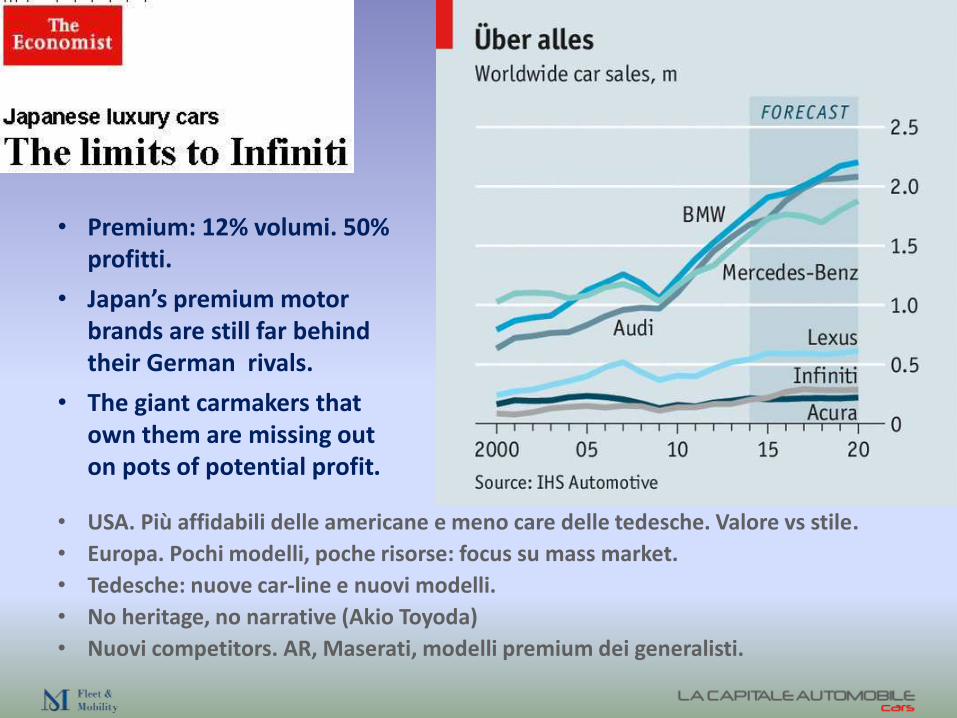
• USA. Più affidabili delle americane e meno care delle tedesche. Valore vs stile.
• Europa. Pochi modelli, poche risorse: focus su mass market.
• Tedesche: nuove car-line e nuovi modelli.
• No heritage, no narrative (Akio Toyoda)
• Nuovi competitors. AR, Maserati, modelli premium dei generalisti.
• Premium: 12% volumi. 50% profitti.
• Japan’s premium motor brands are still far behind their German rivals.
• The giant carmakers that own them are missing out on pots of potential profit.

Cheap cars are not selling, so their makers are betting on expensive ones
• Growing, if misguided, optimism. Belief that the worst is over.
• Even after six years of falling sales, carmakers have not done enough to
cut their excess capacity in western Europe.
• Instead of making more cuts, the mass-market carmakers are aspiring to
boost their volumes and margins with new, premium-priced models.
• They are pushing into a market that is already crowded.
It’s shiny, but who will buy it?

Dealer e usato
Io vorrei … non vorrei … ma se vuoi …
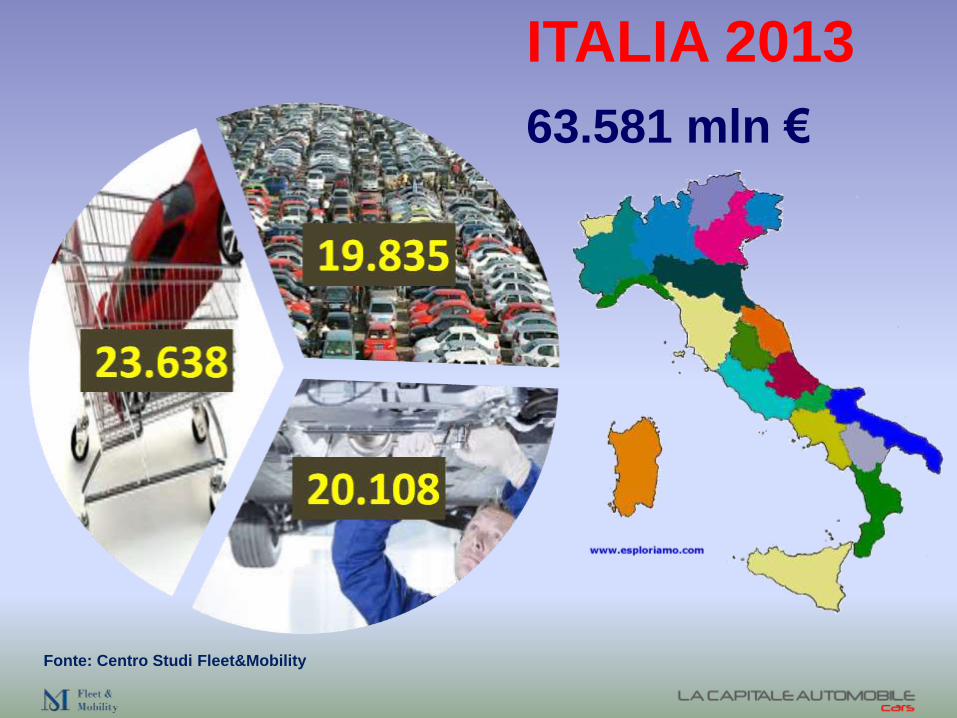
63.581 mln €
ITALIA 2013
Fonte: Centro Studi Fleet&Mobility
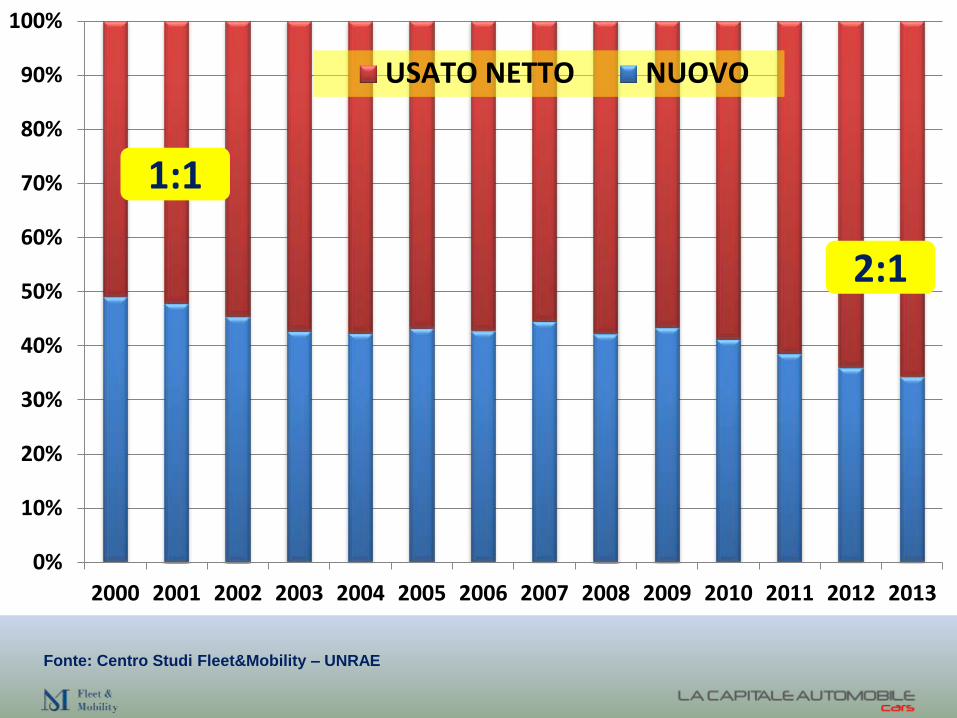
0%
10%
20%
30%
40%
50%
60%
70%
80%
90%
100%
2000 2001 2002 2003 2004 2005 2006 2007 2008 2009 2010 2011 2012 2013
USATO NETTO NUOVO
2:1
1:1
Fonte: Centro Studi Fleet&Mobility – UNRAE

Fonte: Fleet&Mobility su dati ACI

Ficili.Usato.
13
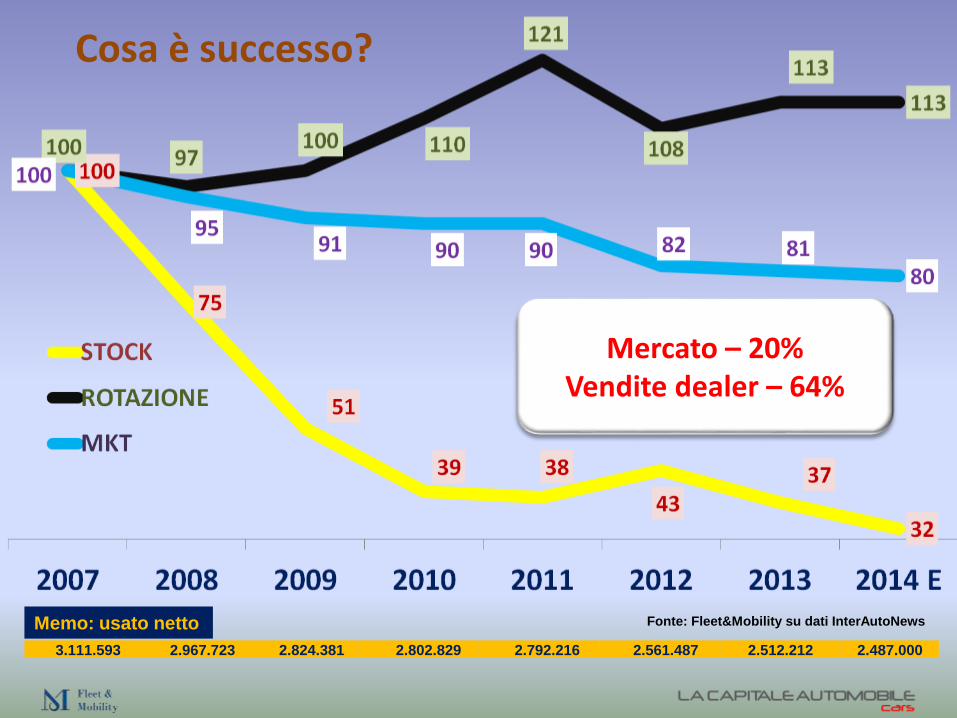
Cosa è successo?
3.111.593 2.967.723 2.824.381 2.802.829 2.792.216 2.561.487 2.512.212 2.487.000
Memo: usato netto Fonte: Fleet&Mobility su dati InterAutoNews
Mercato – 20%Vendite dealer – 64%
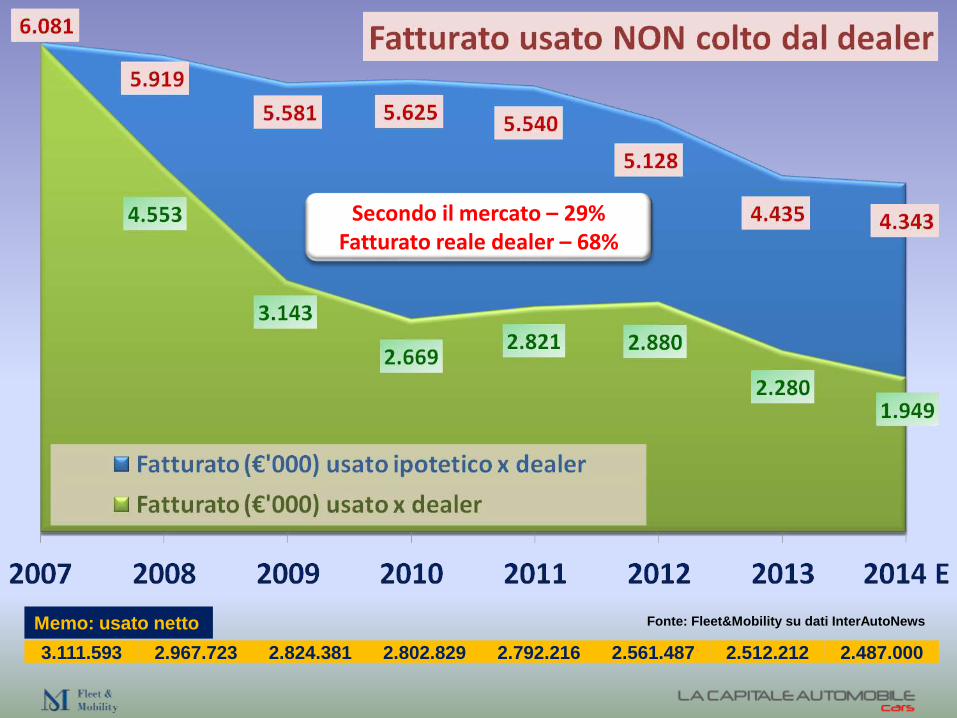
3.111.593 2.967.723 2.824.381 2.802.829 2.792.216 2.561.487 2.512.212 2.487.000
Memo: usato netto Fonte: Fleet&Mobility su dati InterAutoNews
Secondo il mercato – 29%Fatturato reale dealer – 68%

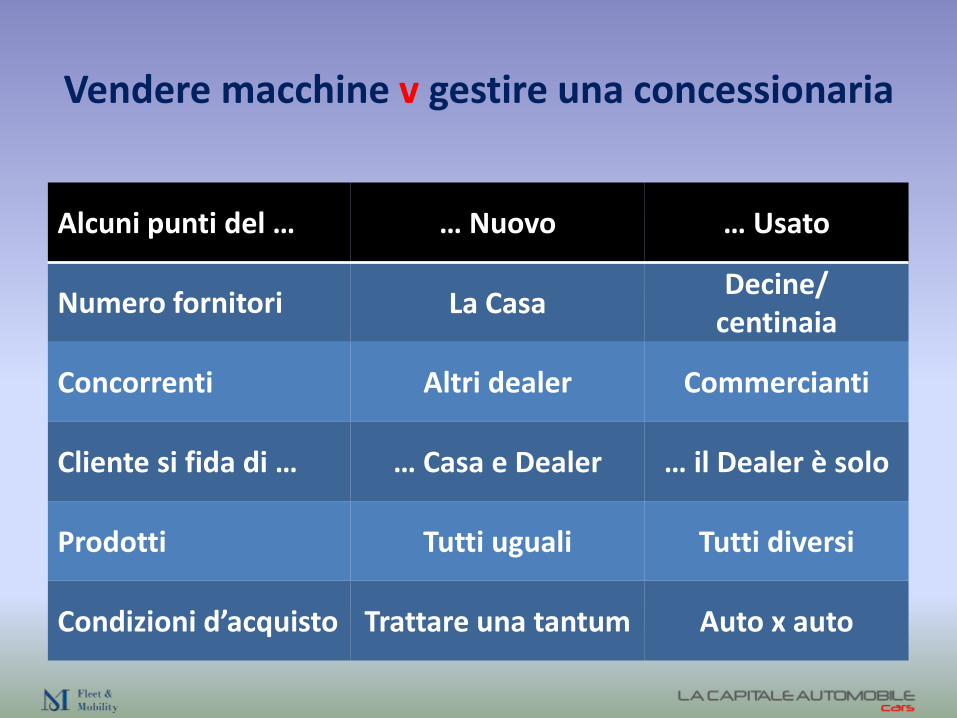
Alcuni punti del … … Nuovo … Usato
Numero fornitori La CasaDecine/
centinaia
Concorrenti Altri dealer Commercianti
Cliente si fida di … … Casa e Dealer … il Dealer è solo
Prodotti Tutti uguali Tutti diversi
Condizioni d’acquisto Trattare una tantum Auto x auto
Vendere macchine v gestire una concessionaria

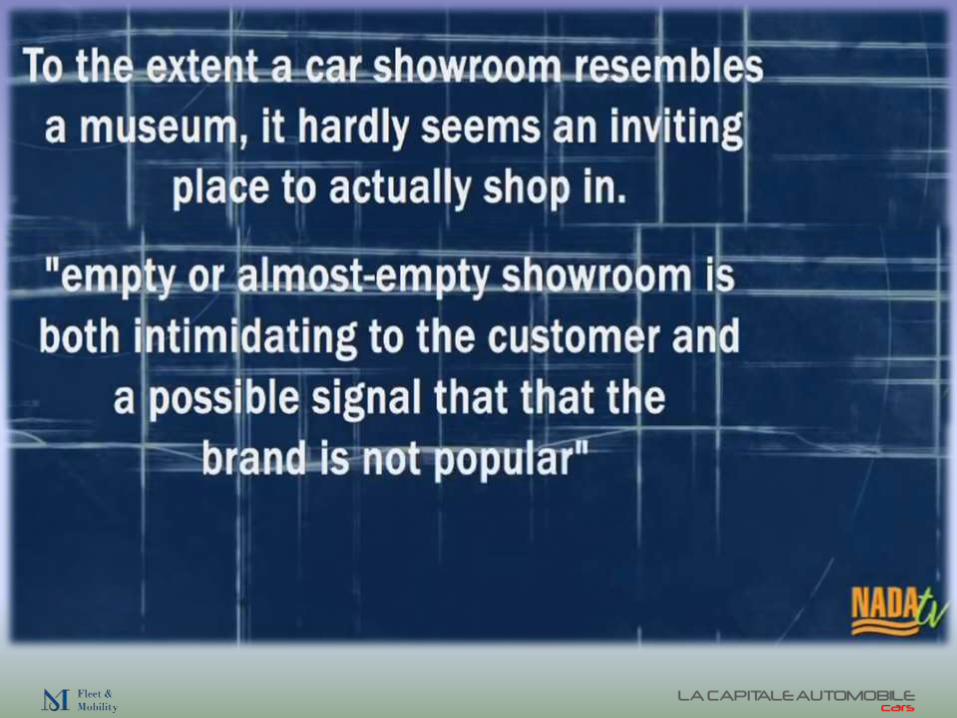
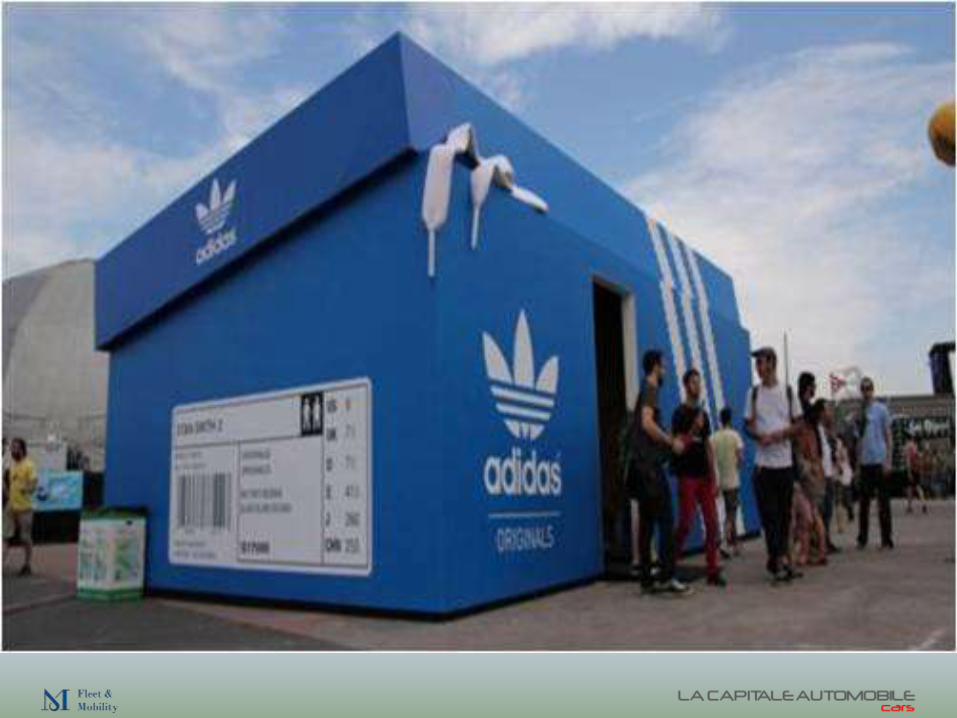
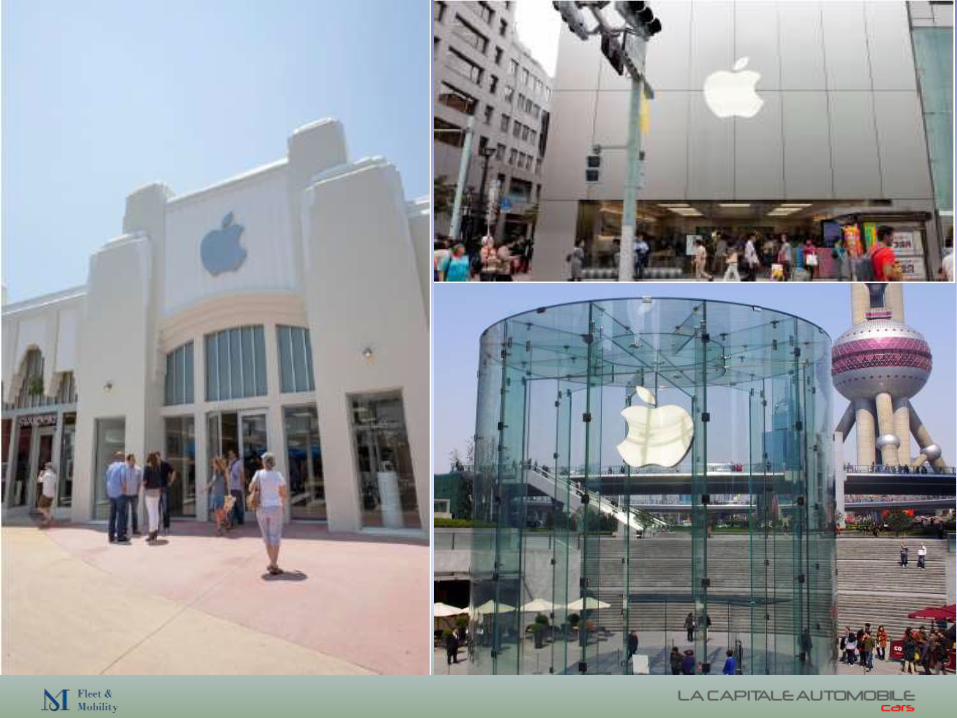
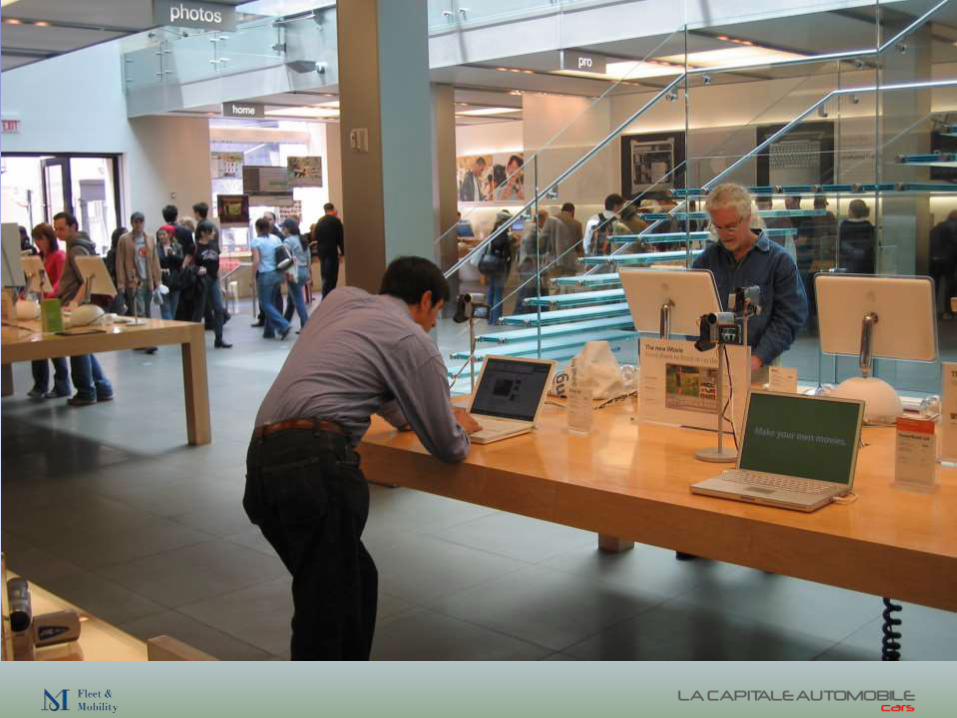
Shopping experience. Standard hard vs soft.

Ficili. Brand experience. 15


Nordio.Saloni.
6

Fiaschetti.Saloni multimediali. 10

Nordio.Italiani informati. 4

Shopping experience.On/off-line.
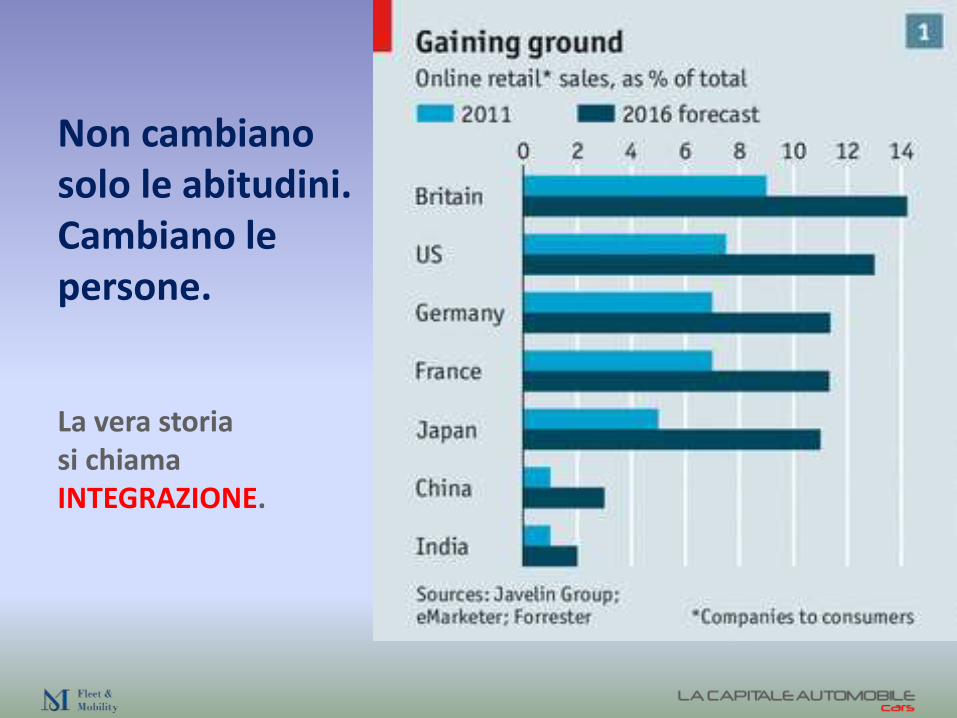
Non cambiano solo le abitudini. Cambiano le persone.
La vera storia si chiama INTEGRAZIONE.
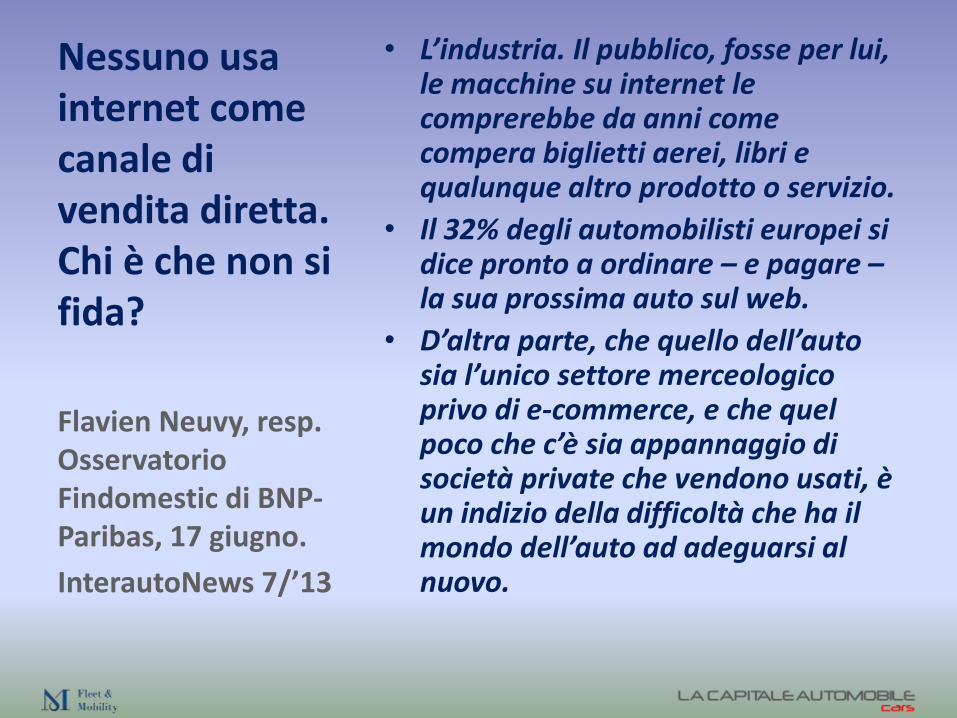
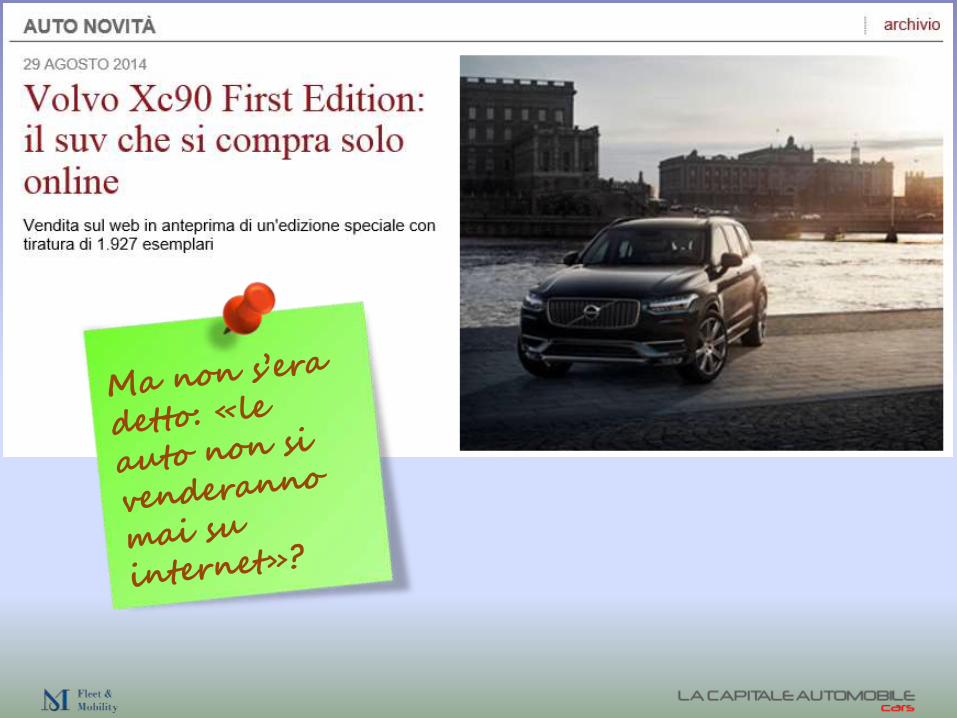
Nessuno usa internet come canale di vendita diretta. Chi è che non si fida?
• L’industria. Il pubblico, fosse per lui, le macchine su internet le comprerebbe da anni come compera biglietti aerei, libri e qualunque altro prodotto o servizio.
• Il 32% degli automobilisti europei si dice pronto a ordinare – e pagare –la sua prossima auto sul web.
• D’altra parte, che quello dell’auto sia l’unico settore merceologico privo di e-commerce, e che quel poco che c’è sia appannaggio di società private che vendono usati, è un indizio della difficoltà che ha il mondo dell’auto ad adeguarsi al nuovo.
Flavien Neuvy, resp. Osservatorio Findomestic di BNP-Paribas, 17 giugno.
InterautoNews 7/’13

Nordio.Web.
5

Ficili. Web.
17

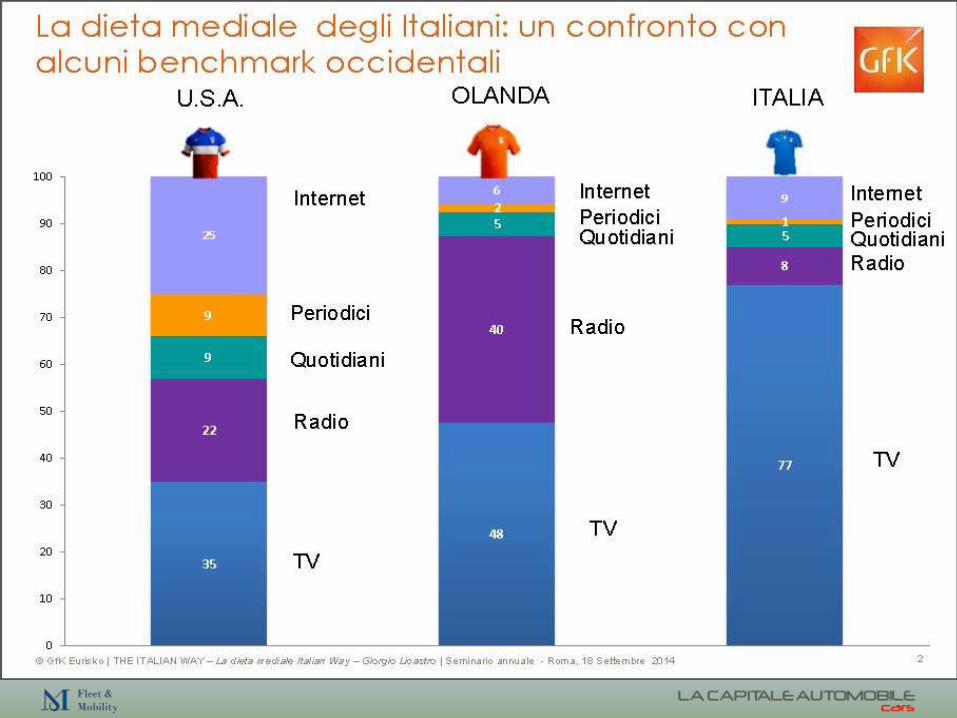
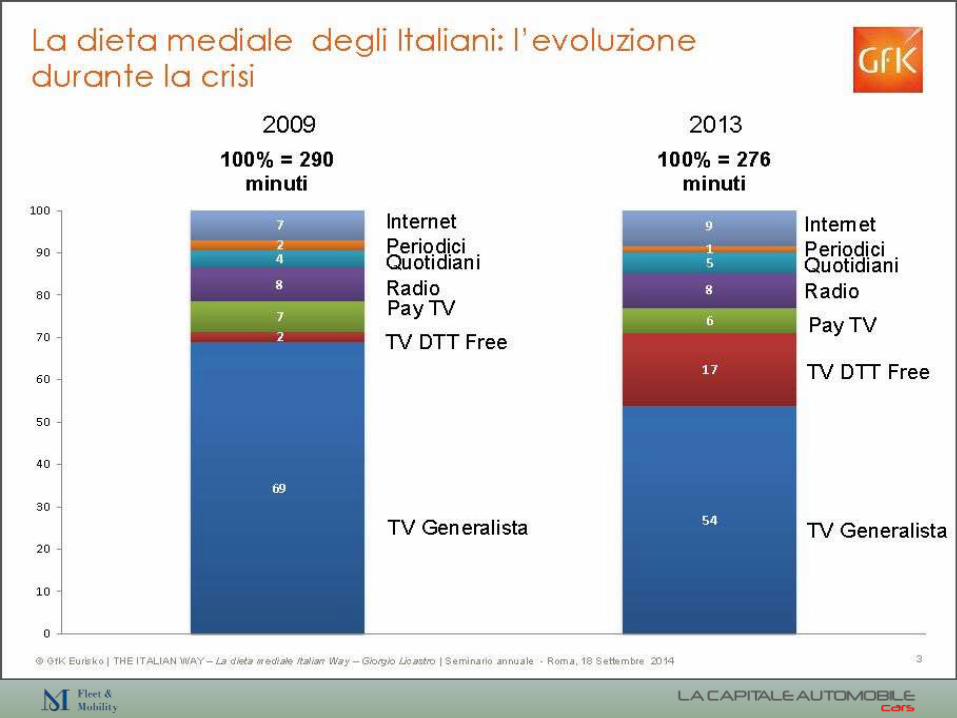

Nordio.Pubblicità.
9

Car sharing
Fonte: Centro Studi Fleet&Mobility
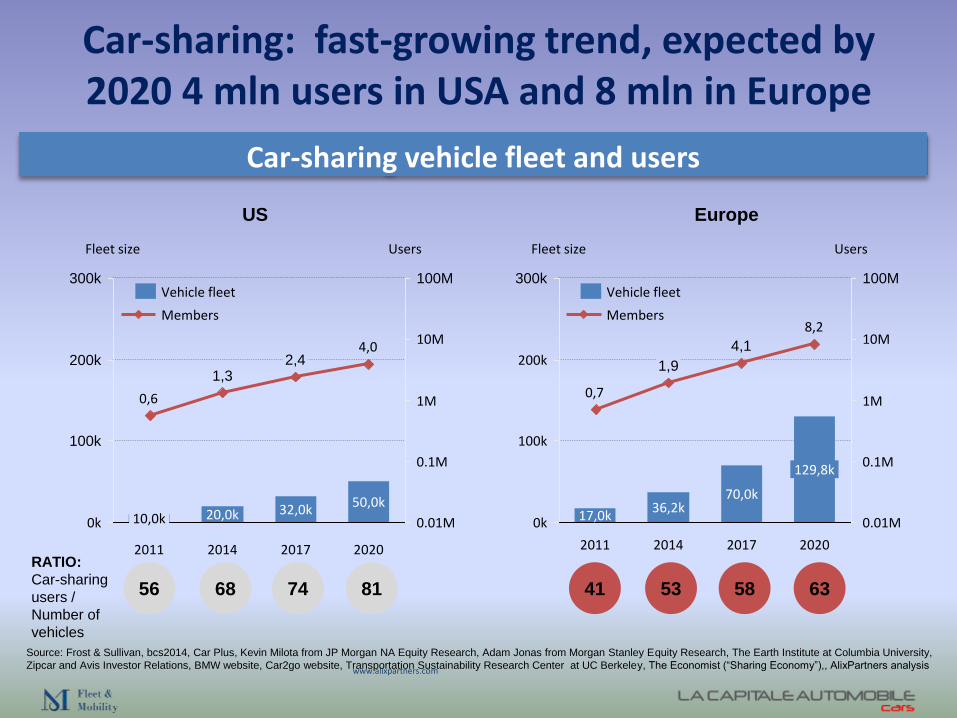
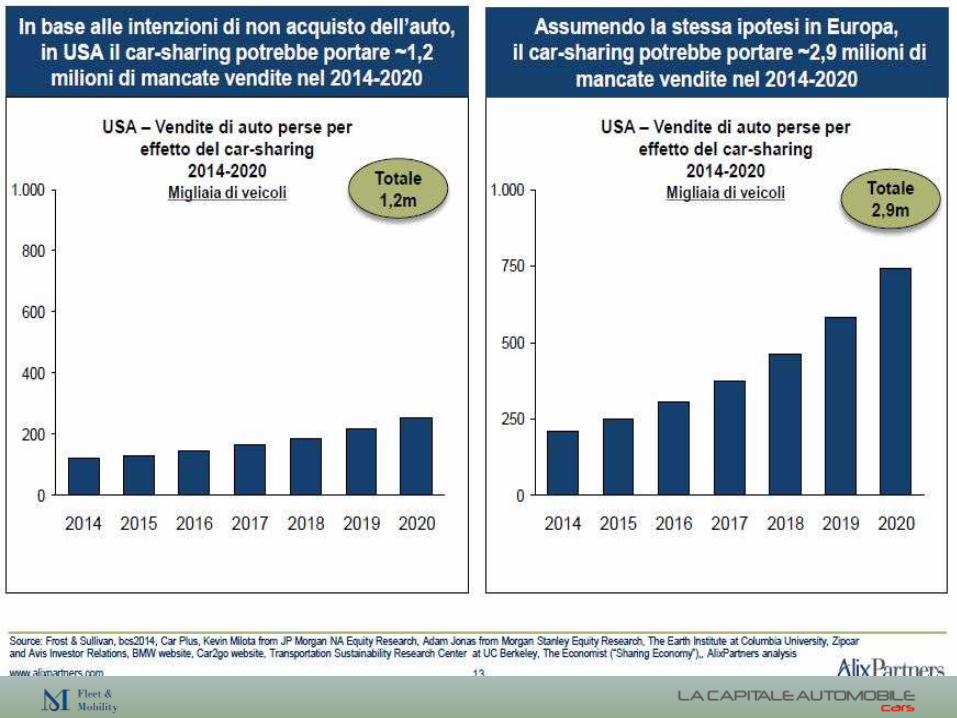
Car-sharing: fast-growing trend, expected by 2020 4 mln users in USA and 8 mln in Europe
www.alixpartners.com
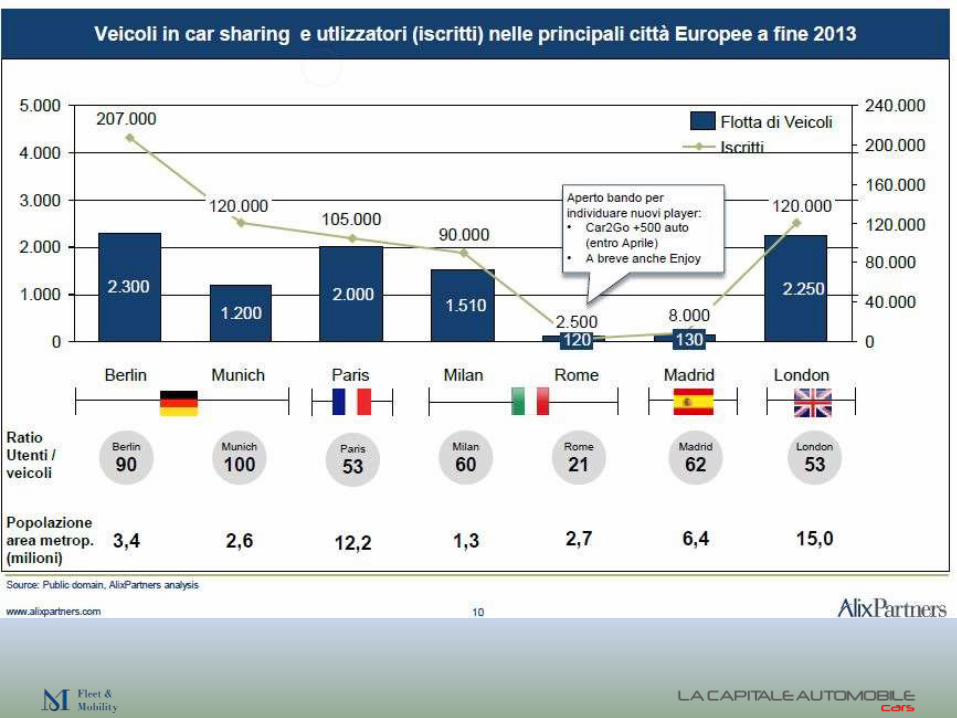
Car-sharing vehicle fleet and users
56 68 74 81 53 58 6341
RATIO:
Car-sharing
users /
Number of
vehicles
0k
10M
100k
300k
200k
1M
100M
0.1M
0.01M10,0k
4,0
32,0k
2014
1,3
20,0k
2011
50,0k
20202017
2,4
0,6
UsersFleet size
Vehicle fleet
Members
0.1M
0.01M
300k 100M
1M
10M
200k
100k
0k
Fleet size Users
20202017
129,8k
70,0k
8,2
1,9
4,1
20142011
17,0k36,2k
0,7
Vehicle fleet
Members
US Europe
Source: Frost & Sullivan, bcs2014, Car Plus, Kevin Milota from JP Morgan NA Equity Research, Adam Jonas from Morgan Stanley Equity Research, The Earth Institute at Columbia University,
Zipcar and Avis Investor Relations, BMW website, Car2go website, Transportation Sustainability Research Center at UC Berkeley, The Economist (“Sharing Economy”),, AlixPartners analysis

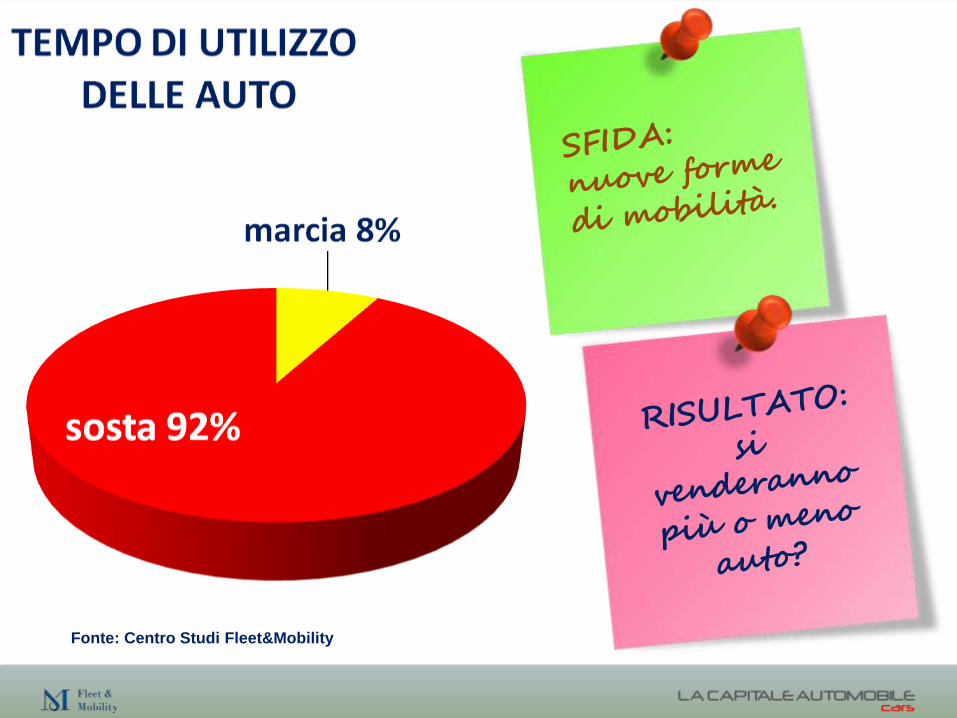
Nordio.Car sharing.
2

23 ottobre 2014
6 febbraio 2015
5 giugno 2015