Ambiente e Sviluppo Marina Baldi Istituto di Biometeorologia Ibimet – CNR, Roma.
ISTITUTO PERLA GEOLOGIAMARINA - CNRBOLOGNA
TECHNICAL REPORT N. 53
TECTONIC AND PRESSURECONTROLSON THEGROWTH OFGIANT VOLCANIC RIDGES
IN THE AZORESREGION(ATLANTIC OCEAN).REPORT ON TOBI SIDE-SCANSONAR,
SWATH BATHYMETRY, SBPPROFILING, ANDMAGNETIC
INVESTIGATIONSDURING CRUISEAZ99.
THE IGM-CNR, OXFORD,TOBI-SOCAND PORTUGUESETEAMS
Bologna- October1999
Many of thedesignationsusedby themanufacturersandsellersto distinguishtheir prod-uctsareclaimedastrademarks.Wherethosedesignationappearin this writing andIGM-CNR wasawareof a trademarkclaim thedesignationshave beenprintedin all caps.Inaddition,wehave reportedsomeof themin theProductionNotesbelow in thispage.
IGM-CNR Cataloging-In-Publicationdata
TECHNICAL REPORT IGM-CNR N.: 53AZ99CruiseTechnicalReport/ byG.Bortoluzzi,G.Carrara,F.Gamberi,M.Marani,M.Ligi,D.Penitenti,R.Portaro,G.Centorami,M.Rovere,N.Mitchell, C.Jacobs,I.Rouse,C.Flewellen,S.Whittle,J.FreyreLuis, N.Lourenco,P.Terrinha
Includesbibliographicalreferenceandindex.1. Azores2. TOBI 3. Geophysics
Abstract
A summaryof theship-boardactivities of a sidescansonarandswathbathymetry(TOBI) andmag-neticssurvey aroundtheAzoresI. (AZ99, july 1999)is presented.Thesurvey usedR/V Uraniaof CNRfor 35 days,inclusive of transitsfrom andto Civitavecchia.Along with a descriptionof technicaldetailsof theequipmentemployed,wediscussproblemsregardingdataacquisitionandquality.
Reproducedby IGM-CNR from camera-readycopy suppliedby theauthors.Publishedin theWWW athttp://www.igm.bo.cnr.itAvailablealsoin Postscriptâ andPDFâ formats.Availablealsoin MS’sRTF andLATEX text andimages,within thefull productionsuite.
Copyright c�
1999by IGM-CNR.
ProductionNotes- The documentwaseditedwith standardtext editors,typesetwith Leslie Lamport’s LATEX, trans-lated to Postscriptâ via dvips and printed camerareadywith a A4 laserprinter. The full productionwasdoneon a Linux computer(www.linux.org) with GNU-General Public License software.Convertedto HTM-L by Nikos Drakos’s latex2html andto PDFâ by Alladin Ghostscripts’s ps2pdf. Most of the mapsincludedwereproducedby WesselandSmith’s GMT package(imina.soest.hawaii.edu/gmt).Someof themapswereproducedby queryingthe TCX’s mysql DBMS (www.tcx.se).Somedrawings wereproducedby xfig (www.xfig.org). ThePostScriptâ imageswereimportedwith theLATEXepsfig package.ImageswereconvertedtoPostScriptâ byJohnBradley’sxv or otherpublic-domainUNIX packages,amongthemconvert.
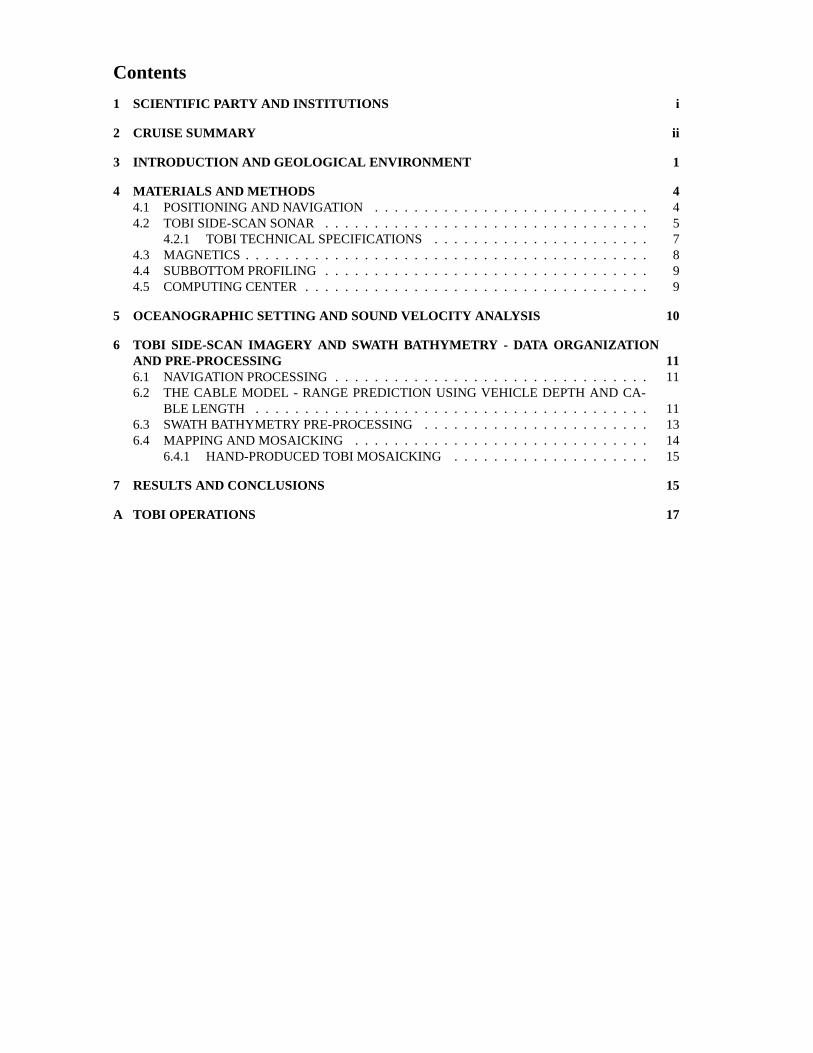
Contents
1 SCIENTIFIC PARTY AND INSTITUTIONS i
2 CRUISE SUMMARY ii
3 INTRODUCTION AND GEOLOGICAL ENVIRONMENT 1
4 MATERIALS AND METHODS 44.1 POSITIONINGAND NAVIGATION . . . . . . . . . . . . . . . . . . . . . . . . . . . . 44.2 TOBI SIDE-SCANSONAR . . . . . . . . . . . . . . . . . . . . . . . . . . . . . . . . . 5
4.2.1 TOBI TECHNICAL SPECIFICATIONS . . . . . . . . . . . . . . . . . . . . . . 74.3 MAGNETICS . . . . . . . . . . . . . . . . . . . . . . . . . . . . . . . . . . . . . . . . . 84.4 SUBBOTTOM PROFILING . . . . . . . . . . . . . . . . . . . . . . . . . . . . . . . . . 94.5 COMPUTINGCENTER . . . . . . . . . . . . . . . . . . . . . . . . . . . . . . . . . . . 9
5 OCEANOGRAPHIC SETTING AND SOUND VELOCITY ANALYSIS 10
6 TOBI SIDE-SCAN IMAGERY AND SWATH BATHYMETRY - DATA ORGANIZATIONAND PRE-PROCESSING 116.1 NAVIGATION PROCESSING . . . . . . . . . . . . . . . . . . . . . . . . . . . . . . . . 116.2 THE CABLE MODEL - RANGE PREDICTIONUSING VEHICLE DEPTH AND CA-
BLE LENGTH . . . . . . . . . . . . . . . . . . . . . . . . . . . . . . . . . . . . . . . . 116.3 SWATH BATHYMETRY PRE-PROCESSING . . . . . . . . . . . . . . . . . . . . . . . 136.4 MAPPINGAND MOSAICKING . . . . . . . . . . . . . . . . . . . . . . . . . . . . . . 14
6.4.1 HAND-PRODUCEDTOBI MOSAICKING . . . . . . . . . . . . . . . . . . . . 15
7 RESULTS AND CONCLUSIONS 15
A TOBI OPERATIONS 17
List of Figures
1 Locationof theAzoresIslands.Also shown theplateboundaries(heavy lines)andthemainfracturezones(datatakenfrom http://www.gsj.go.jp/dMG/free/plates/Intro.html, compiledby NOAA GlobalRelief Dataon CD-ROM (93-MGG-01,original digitizing performedbyPLATESprojectat theUniversityof Texas,editedfor plotting with GMT [14] by KensakuTamaki,OceanResearchInstitute,Universityof Tokyo). . . . . . . . . . . . . . . . . . . 1
2 R/V Urania,CNR,operatedby SO.PRO.MAR Spa. . . . . . . . . . . . . . . . . . . . . . 23 Navigationdata.. . . . . . . . . . . . . . . . . . . . . . . . . . . . . . . . . . . . . . . . 24 Locationof thestationsof theCANIGO sampling. . . . . . . . . . . . . . . . . . . . . . 35 TOBI Plannedareas,actualnavigationlinesandCTD/XBT stations(blackcircles). . . . . 36 HPR . . . . . . . . . . . . . . . . . . . . . . . . . . . . . . . . . . . . . . . . . . . . . . 47 Offsetsfrom primarynavigationsensor(POS1) . . . . . . . . . . . . . . . . . . . . . . . 58 Deploymentof theTOBI tow fish . . . . . . . . . . . . . . . . . . . . . . . . . . . . . . 69 Exampleof unfilteredmagnetic(thick) andbathymetricdata . . . . . . . . . . . . . . . . 810 ComputingCenteranddataflow paths . . . . . . . . . . . . . . . . . . . . . . . . . . . . 911 CTD andXBT data.Temperaturered,Salinityblue,SoundVelocity gray . . . . . . . . . 1012 Analytical sketchof thetow-fish positionproblem.Notethat thethecatenaryis schematic
only andnot to scale.Notealsothatacousticvariability andrefractionof ray pathsleadstoerrorsin range(Sr) anddepthderivedby theSimradHPRsystem. . . . . . . . . . . . . . 12
13 Phasemeasurementsketch. . . . . . . . . . . . . . . . . . . . . . . . . . . . . . . . . . . 1414 Areasinvestigatedandmosaicked . . . . . . . . . . . . . . . . . . . . . . . . . . . . . . 14
List of Tables
1 ScientificParty . . . . . . . . . . . . . . . . . . . . . . . . . . . . . . . . . . . . . . . . i2 Offsetsfrom primarynavigationsensor(POS1) . . . . . . . . . . . . . . . . . . . . . . . 53 DateandPositioninformationof CTD andXBT stations. . . . . . . . . . . . . . . . . . . 104 TOBI runs. . . . . . . . . . . . . . . . . . . . . . . . . . . . . . . . . . . . . . . . . . . 175 TOBI MO logs. . . . . . . . . . . . . . . . . . . . . . . . . . . . . . . . . . . . . . . . . 18
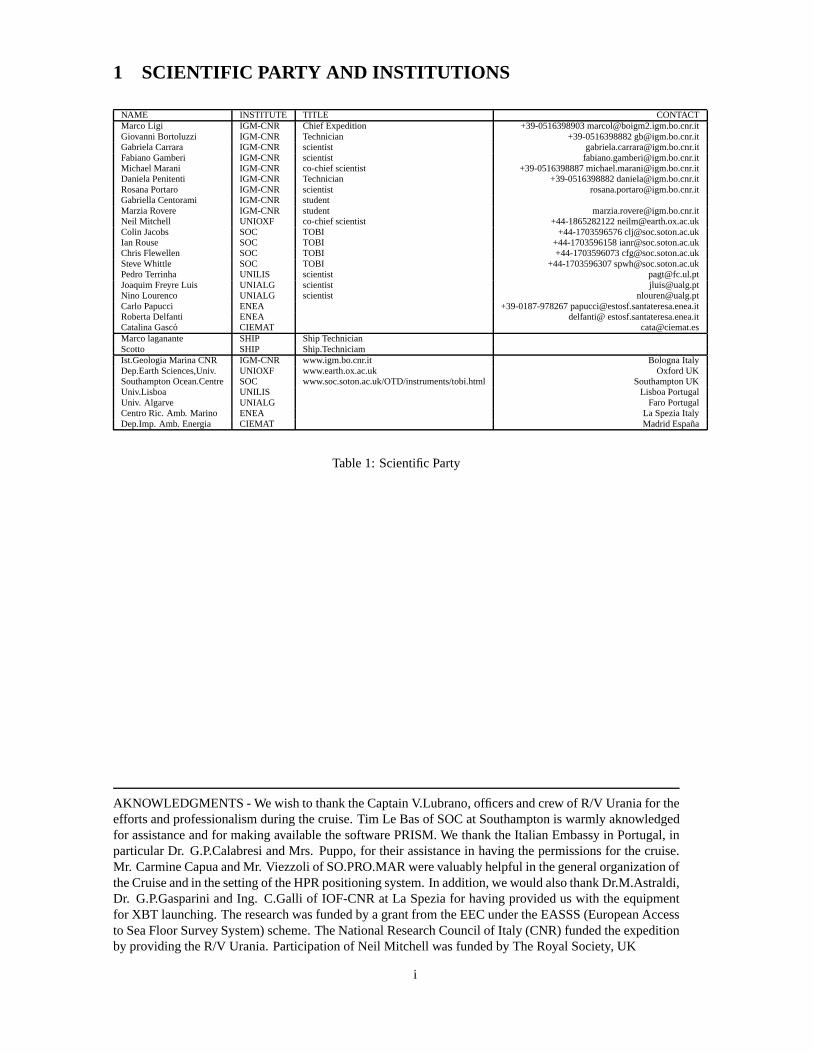
1 SCIENTIFIC PARTY AND INSTITUTIONS
NAME INSTITUTE TITLE CONTACTMarcoLigi IGM-CNR Chief Expedition [email protected] IGM-CNR Technician [email protected] IGM-CNR scientist [email protected] IGM-CNR scientist [email protected] IGM-CNR co-chiefscientist [email protected] IGM-CNR Technician [email protected] IGM-CNR scientist [email protected] IGM-CNR studentMarziaRovere IGM-CNR student [email protected] Mitchell UNIOXF co-chiefscientist [email protected] Jacobs SOC TOBI [email protected] Rouse SOC TOBI [email protected] SOC TOBI [email protected] Whittle SOC TOBI [email protected] UNILIS scientist [email protected] Luis UNIALG scientist [email protected] Lourenco UNIALG scientist [email protected] ENEA [email protected] ENEA [email protected] CIEMAT [email protected] SHIP ShipTechnicianScotto SHIP Ship.TechniciamIst.GeologiaMarinaCNR IGM-CNR www.igm.bo.cnr.it BolognaItalyDep.EarthSciences,Univ. UNIOXF www.earth.ox.ac.uk OxfordUKSouthamptonOcean.Centre SOC www.soc.soton.ac.uk/OTD/instruments/tobi.html SouthamptonUKUniv.Lisboa UNILIS LisboaPortugalUniv. Algarve UNIALG FaroPortugalCentroRic. Amb. Marino ENEA La SpeziaItalyDep.Imp.Amb. Energia CIEMAT MadridEspana
Table1: ScientificParty
AKNOWLEDGMENTS- Wewishto thanktheCaptainV.Lubrano,officersandcrew of R/V Uraniafor theeffortsandprofessionalismduringthecruise.Tim Le Basof SOCat Southamptonis warmly aknowledgedfor assistanceandfor makingavailablethesoftwarePRISM.We thanktheItalian Embassyin Portugal,inparticularDr. G.P.CalabresiandMrs. Puppo,for their assistancein having thepermissionsfor thecruise.Mr. CarmineCapuaandMr. Viezzoliof SO.PRO.MAR werevaluablyhelpful in thegeneralorganizationoftheCruiseandin thesettingof theHPRpositioningsystem.In addition,wewouldalsothankDr.M.Astraldi,Dr. G.P.GaspariniandIng. C.Galli of IOF-CNRat La Speziafor having provideduswith the equipmentfor XBT launching.Theresearchwasfundedby agrantfrom theEECundertheEASSS(EuropeanAccessto SeaFloorSurvey System)scheme.TheNationalResearchCouncilof Italy (CNR) fundedtheexpeditionby providing theR/V Urania.Participationof Neil Mitchell wasfundedby TheRoyal Society, UK
i
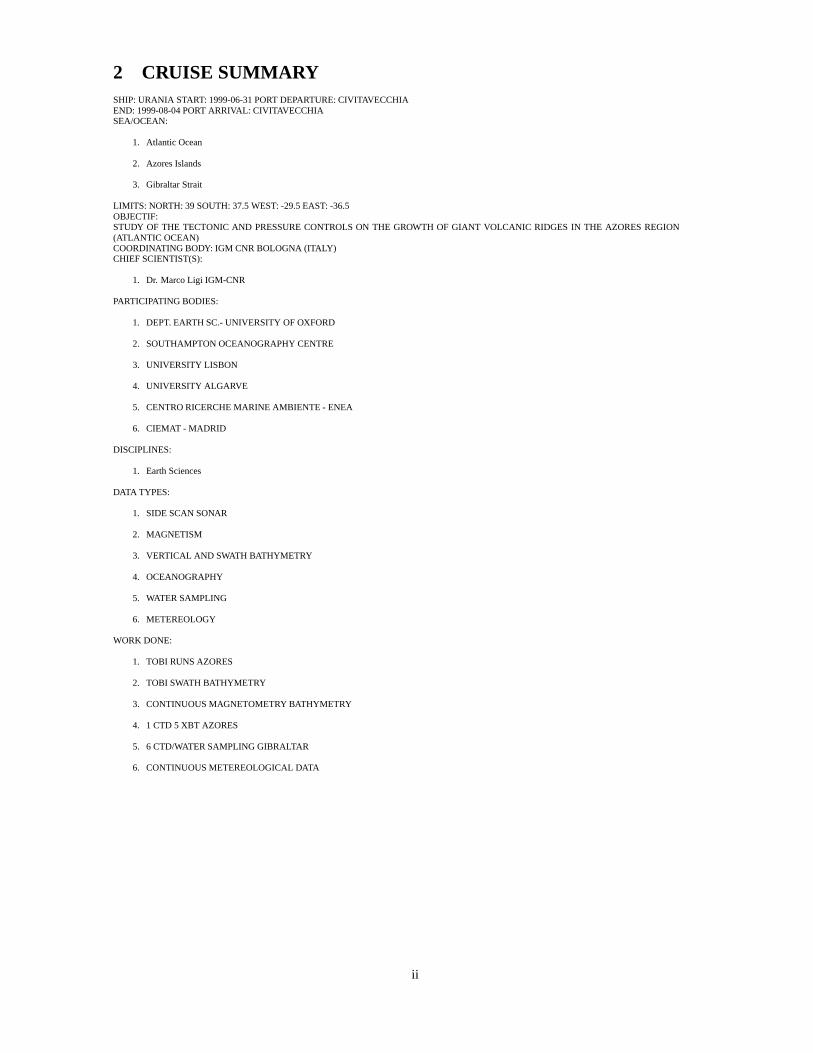
2 CRUISE SUMMARYSHIP:URANIA START: 1999-06-31PORT DEPARTURE:CIVITAVECCHIAEND: 1999-08-04PORT ARRIVAL: CIVITAVECCHIASEA/OCEAN:
1. Atlantic Ocean
2. AzoresIslands
3. GibraltarStrait
LIMITS: NORTH: 39 SOUTH:37.5WEST: -29.5EAST: -36.5OBJECTIF:STUDY OF THE TECTONIC AND PRESSURECONTROLS ON THE GROWTH OF GIANT VOLCANIC RIDGESIN THE AZORESREGION(ATLANTIC OCEAN)COORDINATING BODY: IGM CNR BOLOGNA (ITALY)CHIEFSCIENTIST(S):
1. Dr. MarcoLigi IGM-CNR
PARTICIPATING BODIES:
1. DEPT. EARTH SC.-UNIVERSITY OFOXFORD
2. SOUTHAMPTON OCEANOGRAPHYCENTRE
3. UNIVERSITY LISBON
4. UNIVERSITY ALGARVE
5. CENTRO RICERCHEMARINE AMBIENTE - ENEA
6. CIEMAT - MADRID
DISCIPLINES:
1. EarthSciences
DATA TYPES:
1. SIDE SCANSONAR
2. MAGNETISM
3. VERTICAL AND SWATH BATHYMETRY
4. OCEANOGRAPHY
5. WATERSAMPLING
6. METEREOLOGY
WORK DONE:
1. TOBI RUNSAZORES
2. TOBI SWATH BATHYMETRY
3. CONTINUOUSMAGNETOMETRY BATHYMETRY
4. 1 CTD 5 XBT AZORES
5. 6 CTD/WATERSAMPLING GIBRALTAR
6. CONTINUOUSMETEREOLOGICALDATA
ii
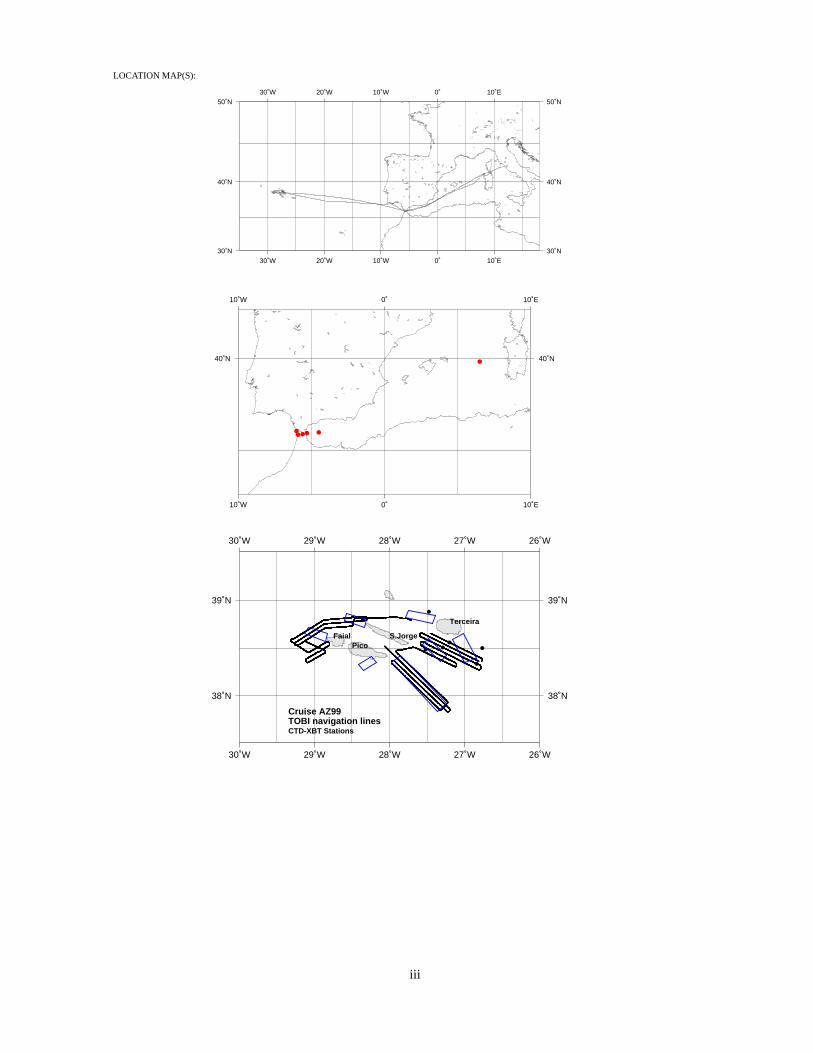
LOCATION MAP(S):
30˚W
30˚W
20˚W
20˚W
10˚W
10˚W
0˚
0˚
10˚E
10˚E
30˚N 30˚N
40˚N 40˚N
50˚N 50˚N
10˚W
10˚W
0˚
0˚
10˚E
10˚E
40˚N 40˚N
30˚W
30˚W
29˚W
29˚W
28˚W
28˚W
27˚W
27˚W
26˚W
26˚W
38˚N 38˚N
39˚N 39˚N
Cruise AZ99TOBI navigation linesCTD-XBT Stations
PicoS.Jorge
Terceira
Faial
iii
3 INTRODUCTION AND GEOLOGICAL ENVIRONMENT
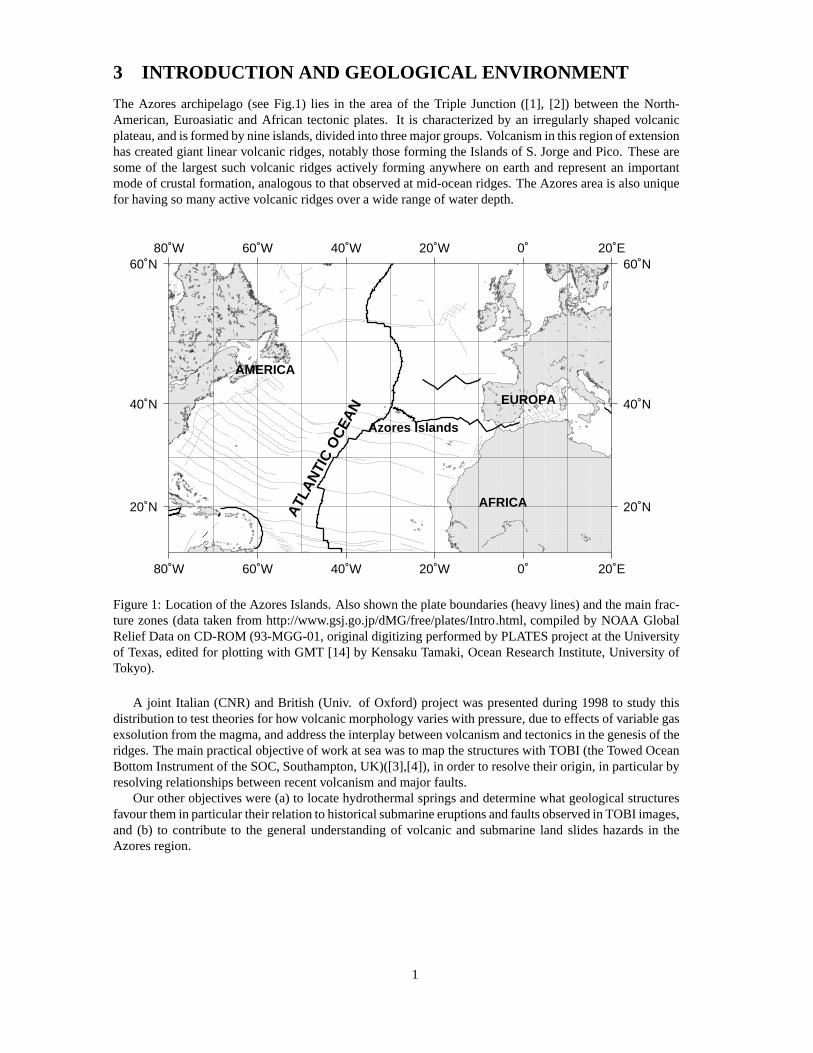
The Azoresarchipelago(seeFig.1) lies in the areaof the Triple Junction([1], [2]) betweenthe North-American,EuroasiaticandAfrican tectonicplates. It is characterizedby an irregularly shapedvolcanicplateau,andis formedbynineislands,dividedinto threemajorgroups.Volcanismin thisregionof extensionhascreatedgiant linearvolcanicridges,notablythoseforming theIslandsof S. JorgeandPico. Thesearesomeof the largestsuchvolcanicridgesactively forming anywhereon earthandrepresentan importantmodeof crustalformation,analogousto thatobservedat mid-oceanridges.TheAzoresareais alsouniquefor having somany activevolcanicridgesovera wide rangeof waterdepth.
80˚W
80˚W
60˚W
60˚W
40˚W
40˚W
20˚W
20˚W
0˚
0˚
20˚E
20˚E
20˚N 20˚N
40˚N 40˚N
60˚N 60˚N
Azores Islands
AFRICA
EUROPA
AMERICA
ATL
AN
TIC
OC
EAN
Figure1: Locationof theAzoresIslands.Also shown theplateboundaries(heavy lines)andthemainfrac-ture zones(datataken from http://www.gsj.go.jp/dMG/free/plates/Intro.html, compiledby NOAA GlobalRelief Dataon CD-ROM (93-MGG-01,originaldigitizing performedby PLATESprojectat theUniversityof Texas,editedfor plotting with GMT [14] by KensakuTamaki,OceanResearchInstitute,UniversityofTokyo).
A joint Italian (CNR) andBritish (Univ. of Oxford) projectwaspresentedduring 1998to studythisdistributionto testtheoriesfor how volcanicmorphologyvarieswith pressure,dueto effectsof variablegasexsolutionfrom themagma,andaddresstheinterplaybetweenvolcanismandtectonicsin thegenesisof theridges.Themainpracticalobjectiveof work at seawasto mapthestructureswith TOBI (theTowedOceanBottomInstrumentof theSOC,Southampton,UK)([3],[4]), in orderto resolve theirorigin, in particularbyresolvingrelationshipsbetweenrecentvolcanismandmajorfaults.
Our otherobjectiveswere(a) to locatehydrothermalspringsanddeterminewhatgeologicalstructuresfavourthemin particulartheirrelationto historicalsubmarineeruptionsandfaultsobservedin TOBI images,and (b) to contribute to the generalunderstandingof volcanic andsubmarineland slideshazardsin theAzoresregion.
1
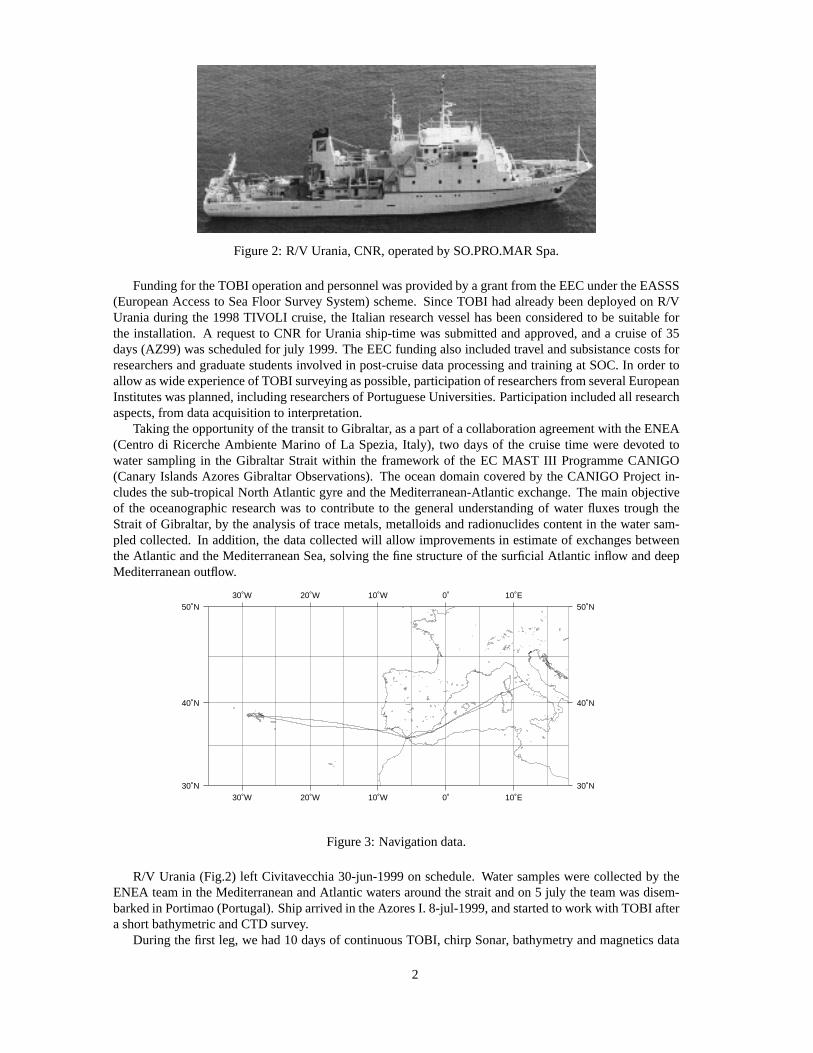
Figure2: R/V Urania,CNR,operatedby SO.PRO.MAR Spa.
Fundingfor theTOBI operationandpersonnelwasprovidedby agrantfrom theEECundertheEASSS(EuropeanAccessto SeaFloor Survey System)scheme.SinceTOBI hadalreadybeendeployedon R/VUraniaduring the 1998TIVOLI cruise,the Italian researchvesselhasbeenconsideredto be suitableforthe installation. A requestto CNR for Uraniaship-timewassubmittedandapproved,anda cruiseof 35days(AZ99) wasscheduledfor july 1999.TheEECfundingalsoincludedtravel andsubsistancecostsforresearchersandgraduatestudentsinvolvedin post-cruisedataprocessingandtrainingat SOC.In ordertoallow aswideexperienceof TOBI surveying aspossible,participationof researchersfrom severalEuropeanInstituteswasplanned,includingresearchersof PortugueseUniversities.Participationincludedall researchaspects,from dataacquisitionto interpretation.
Takingtheopportunityof thetransitto Gibraltar, asapartof acollaborationagreementwith theENEA(Centrodi RicercheAmbienteMarino of La Spezia,Italy), two daysof the cruisetime weredevotedtowatersamplingin the GibraltarStrait within the framework of the EC MAST III ProgrammeCANIGO(CanaryIslandsAzoresGibraltarObservations). The oceandomaincoveredby the CANIGO Projectin-cludesthesub-tropicalNorth Atlantic gyreandtheMediterranean-Atlanticexchange.Themainobjectiveof the oceanographicresearchwas to contribute to the generalunderstandingof waterfluxes trough theStraitof Gibraltar, by theanalysisof tracemetals,metalloidsandradionuclidescontentin thewatersam-pledcollected.In addition,the datacollectedwill allow improvementsin estimateof exchangesbetweentheAtlantic andtheMediterraneanSea,solvingthefine structureof thesurficialAtlantic inflow anddeepMediterraneanoutflow.
30˚W
30˚W
20˚W
20˚W
10˚W
10˚W
0˚
0˚
10˚E
10˚E
30˚N 30˚N
40˚N 40˚N
50˚N 50˚N
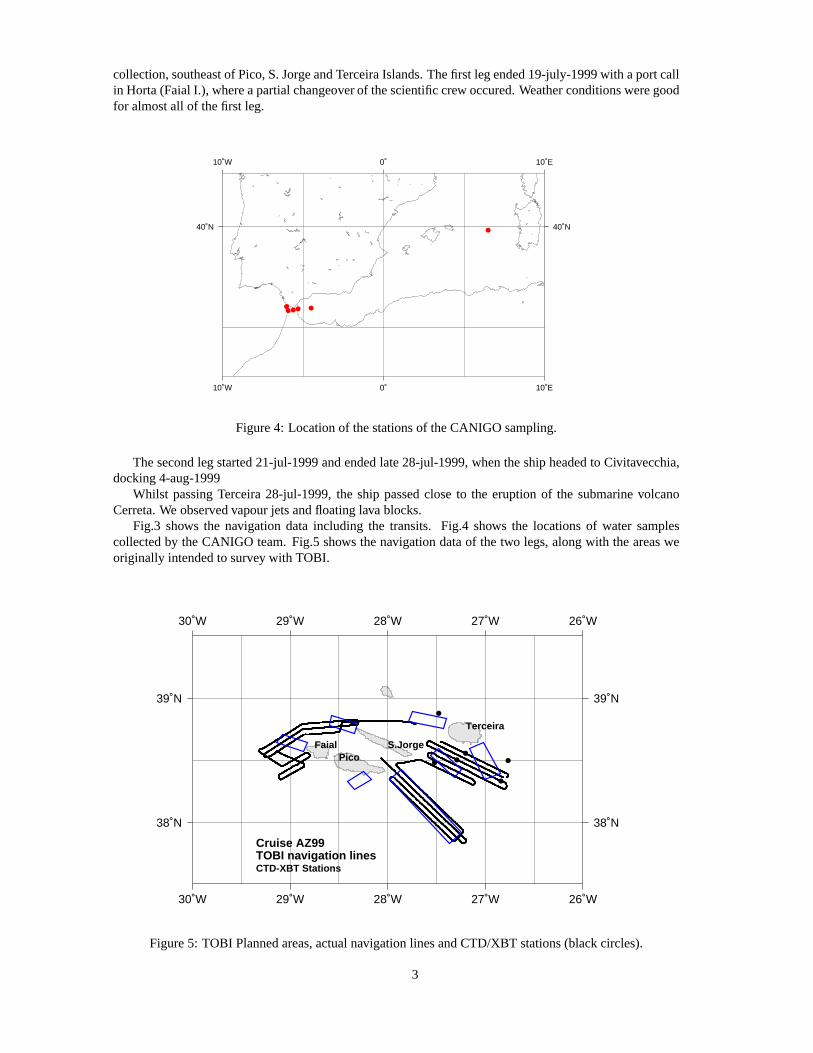
Figure3: Navigationdata.
R/V Urania(Fig.2) left Civitavecchia30-jun-1999on schedule.Watersampleswerecollectedby theENEA teamin theMediterraneanandAtlantic watersaroundthestraitandon 5 july theteamwasdisem-barkedin Portimao(Portugal).Shiparrivedin theAzoresI. 8-jul-1999,andstartedto work with TOBI afterashortbathymetricandCTD survey.
During thefirst leg, we had10 daysof continuousTOBI, chirp Sonar, bathymetryandmagneticsdata
2
collection,southeastof Pico,S.JorgeandTerceiraIslands.Thefirst leg ended19-july-1999with aportcallin Horta(Faial I.), whereapartialchangeoverof thescientificcrew occured.Weatherconditionsweregoodfor almostall of thefirst leg.
10˚W
10˚W
0˚
0˚
10˚E
10˚E
40˚N 40˚N
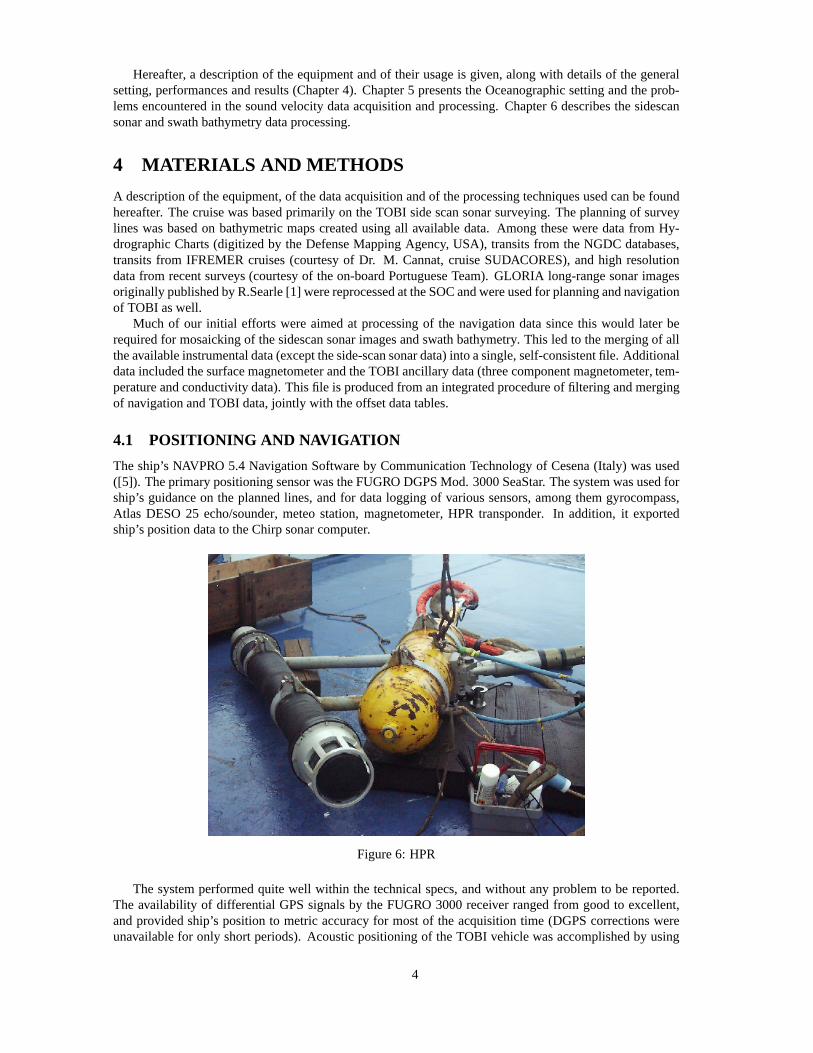
Figure4: Locationof thestationsof theCANIGO sampling.
Thesecondleg started21-jul-1999andendedlate28-jul-1999,whentheshipheadedto Civitavecchia,docking4-aug-1999
Whilst passingTerceira28-jul-1999,the ship passedcloseto the eruptionof the submarinevolcanoCerreta.We observedvapourjetsandfloatinglava blocks.
Fig.3 shows the navigation data including the transits. Fig.4 shows the locationsof water samplescollectedby theCANIGO team.Fig.5 shows thenavigationdataof the two legs,alongwith theareasweoriginally intendedto survey with TOBI.
30˚W
30˚W
29˚W
29˚W
28˚W
28˚W
27˚W
27˚W
26˚W
26˚W
38˚N 38˚N
39˚N 39˚N
Cruise AZ99TOBI navigation linesCTD-XBT Stations
PicoS.Jorge
Terceira
Faial
Figure5: TOBI Plannedareas,actualnavigationlinesandCTD/XBT stations(blackcircles).
3
Hereafter, a descriptionof theequipmentandof their usageis given,alongwith detailsof thegeneralsetting,performancesandresults(Chapter4). Chapter5 presentstheOceanographicsettingandtheprob-lemsencounteredin the soundvelocity dataacquisitionandprocessing.Chapter6 describesthesidescansonarandswathbathymetrydataprocessing.
4 MATERIALS AND METHODS
A descriptionof theequipment,of thedataacquisitionandof theprocessingtechniquesusedcanbefoundhereafter. Thecruisewasbasedprimarily on theTOBI sidescansonarsurveying. Theplanningof surveylines wasbasedon bathymetricmapscreatedusingall availabledata. Among theseweredatafrom Hy-drographicCharts(digitized by the DefenseMappingAgency, USA), transitsfrom the NGDC databases,transitsfrom IFREMER cruises(courtesyof Dr. M. Cannat,cruiseSUDACORES),andhigh resolutiondatafrom recentsurveys (courtesyof theon-boardPortugueseTeam).GLORIA long-rangesonarimagesoriginally publishedby R.Searle[1] werereprocessedattheSOCandwereusedfor planningandnavigationof TOBI aswell.
Much of our initial efforts wereaimedat processingof the navigation datasincethis would later berequiredfor mosaickingof thesidescansonarimagesandswathbathymetry. This led to themergingof alltheavailableinstrumentaldata(excepttheside-scansonardata)into asingle,self-consistentfile. AdditionaldataincludedthesurfacemagnetometerandtheTOBI ancillarydata(threecomponentmagnetometer, tem-peratureandconductivity data).Thisfile is producedfrom anintegratedprocedureof filtering andmergingof navigationandTOBI data,jointly with theoffsetdatatables.
4.1 POSITIONING AND NAVIGATION
Theship’s NAVPRO 5.4 NavigationSoftwareby CommunicationTechnologyof Cesena(Italy) wasused([5]). TheprimarypositioningsensorwastheFUGRO DGPSMod. 3000SeaStar. Thesystemwasusedforship’s guidanceon the plannedlines,andfor datalogging of varioussensors,amongthemgyrocompass,Atlas DESO 25 echo/sounder, meteostation,magnetometer, HPR transponder. In addition, it exportedship’spositiondatato theChirp sonarcomputer.
Figure6: HPR
The systemperformedquitewell within the technicalspecs,andwithout any problemto be reported.The availability of differentialGPSsignalsby the FUGRO 3000receiver rangedfrom goodto excellent,andprovidedship’s positionto metric accuracy for mostof the acquisitiontime (DGPScorrectionswereunavailablefor only shortperiods).Acousticpositioningof theTOBI vehiclewasaccomplishedby using
4
theships’Simrad-Konsgberg HPR-1507systemanda long-range(6km) transponder, which wasmounted45deg. below TOBI’sdepressor(Fig. 6).
TheNavigationandDataAcquisitionSystemhadthefollowing majorsettings:
1. UTC
2. DatumWGS84
3. ProjectionDirectMercatoron38 N (for ship’sguidance)
4. OutputpositionPOS1
5. AcquisitionCycle10 seconds.
6. Speedof Soundfor DEPTH1 and2 1500m/sec
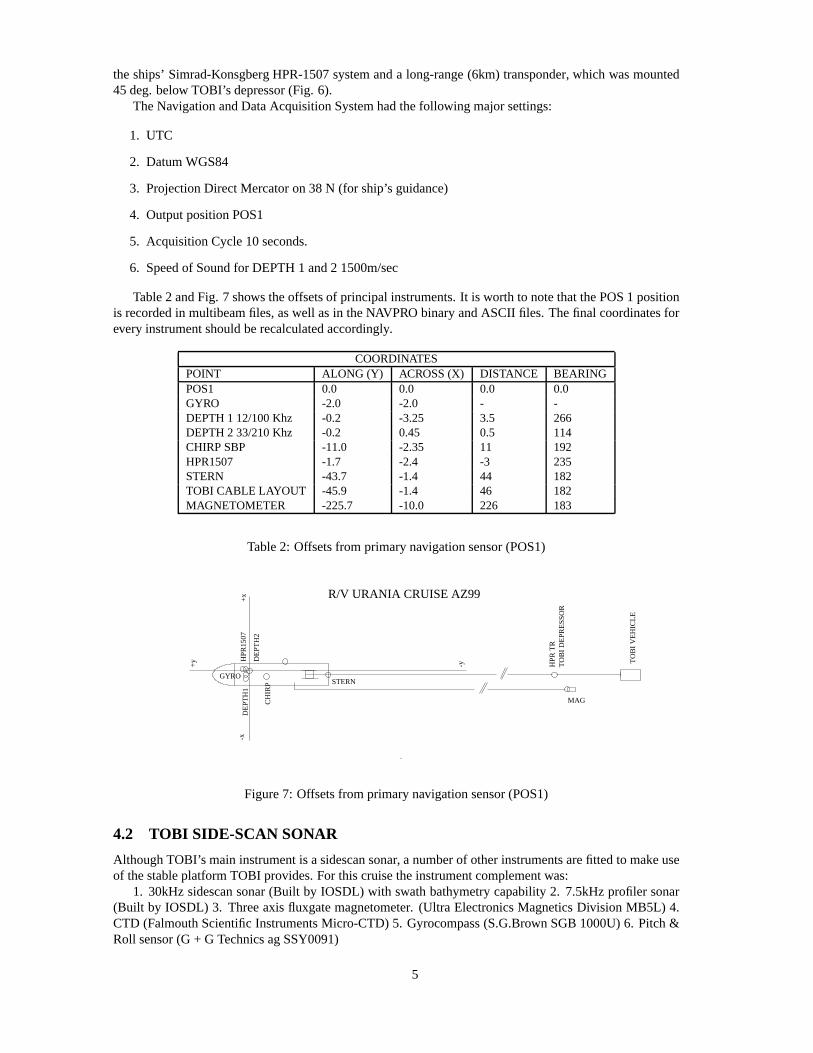
Table2 andFig. 7 shows theoffsetsof principalinstruments.It is worth to notethatthePOS1 positionis recordedin multibeamfiles,aswell asin theNAVPRO binaryandASCII files. Thefinal coordinatesforevery instrumentshouldberecalculatedaccordingly.
COORDINATESPOINT ALONG (Y) ACROSS(X) DISTANCE BEARINGPOS1 0.0 0.0 0.0 0.0GYRO -2.0 -2.0 - -DEPTH1 12/100Khz -0.2 -3.25 3.5 266DEPTH2 33/210Khz -0.2 0.45 0.5 114CHIRPSBP -11.0 -2.35 11 192HPR1507 -1.7 -2.4 -3 235STERN -43.7 -1.4 44 182TOBI CABLE LAYOUT -45.9 -1.4 46 182MAGNETOMETER -225.7 -10.0 226 183
Table2: Offsetsfrom primarynavigationsensor(POS1)
MAG
-x+
x
+y
-y
STERN
DE
PT
H1
GYRO
CH
IRP
DE
PT
H2
HP
R15
07
HP
R T
RT
OB
I DE
PR
ES
SO
R
R/V URANIA CRUISE AZ99
TO
BI V
EH
ICLE
Figure7: Offsetsfrom primarynavigationsensor(POS1)
4.2 TOBI SIDE-SCAN SONAR
AlthoughTOBI’smaininstrumentis asidescansonar, a numberof otherinstrumentsarefitted to makeuseof thestableplatformTOBI provides.For this cruisetheinstrumentcomplementwas:
1. 30kHzsidescansonar(Built by IOSDL) with swathbathymetrycapability2. 7.5kHzprofiler sonar(Built by IOSDL) 3. Threeaxisfluxgatemagnetometer. (Ultra ElectronicsMagneticsDivision MB5L) 4.CTD (FalmouthScientificInstrumentsMicro-CTD) 5. Gyrocompass(S.G.Brown SGB1000U)6. Pitch&Roll sensor(G + G TechnicsagSSY0091)
5
An AutoHelmST50GPSreceiver providestheTOBI loggingsystemwith navigationalandtime data.An MPD 16049 tonneinstrumentedsheave provideswire out, load andrateinformationboth to its owninstrumentboxandwire out countsignalsto theloggingsystem.
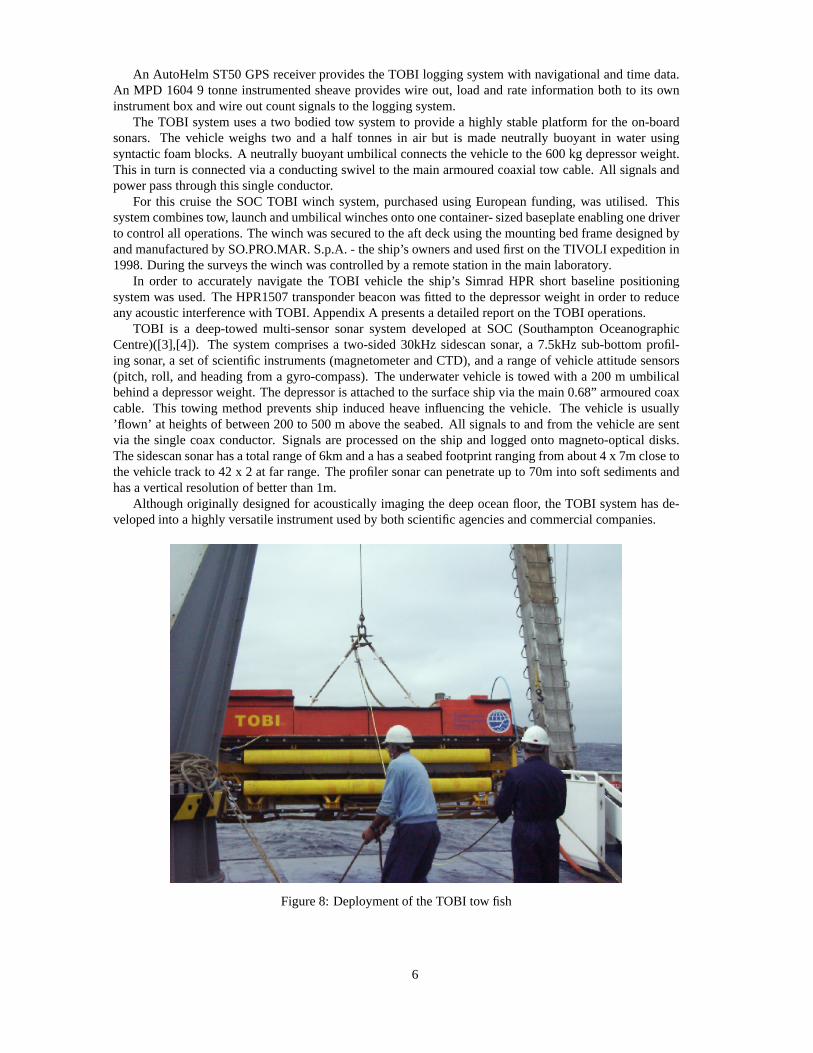
The TOBI systemusesa two bodiedtow systemto provide a highly stableplatform for the on-boardsonars. The vehicle weighstwo and a half tonnesin air but is madeneutrally buoyant in water usingsyntacticfoamblocks.A neutrallybuoyantumbilical connectsthevehicleto the600kg depressorweight.This in turn is connectedvia a conductingswivel to themainarmouredcoaxialtow cable.All signalsandpowerpassthroughthissingleconductor.
For this cruisethe SOCTOBI winch system,purchasedusingEuropeanfunding, wasutilised. Thissystemcombinestow, launchandumbilicalwinchesontoonecontainer- sizedbaseplateenablingonedriverto controlall operations.Thewinch wassecuredto theaft deckusingthemountingbedframedesignedbyandmanufacturedby SO.PRO.MAR. S.p.A.- theship’sownersandusedfirst on theTIVOLI expeditionin1998.During thesurveys thewinch wascontrolledby a remotestationin themainlaboratory.
In order to accuratelynavigate the TOBI vehicle the ship’s SimradHPR short baselinepositioningsystemwasused.TheHPR1507transponderbeaconwasfitted to thedepressorweight in orderto reduceany acousticinterferencewith TOBI. AppendixA presentsadetailedreporton theTOBI operations.
TOBI is a deep-towed multi-sensorsonarsystemdevelopedat SOC (SouthamptonOceanographicCentre)([3],[4]). The systemcomprisesa two-sided30kHz sidescansonar, a 7.5kHz sub-bottomprofil-ing sonar, a setof scientificinstruments(magnetometerandCTD), anda rangeof vehicleattitudesensors(pitch, roll, andheadingfrom a gyro-compass).Theunderwatervehicleis towedwith a 200m umbilicalbehinda depressorweight. Thedepressoris attachedto thesurfaceshipvia themain0.68” armouredcoaxcable. This towing methodpreventsship inducedheave influencingthe vehicle. The vehicle is usually’flown’ at heightsof between200to 500m above theseabed.All signalsto andfrom thevehiclearesentvia the singlecoaxconductor. Signalsareprocessedon the ship andloggedonto magneto-opticaldisks.Thesidescansonarhasatotal rangeof 6kmandahasaseabedfootprint rangingfrom about4 x 7mclosetothevehicletrackto 42 x 2 at far range.Theprofiler sonarcanpenetrateup to 70minto soft sedimentsandhasa verticalresolutionof betterthan1m.
Althoughoriginally designedfor acousticallyimagingthe deepoceanfloor, the TOBI systemhasde-velopedinto a highly versatileinstrumentusedby bothscientificagenciesandcommercialcompanies.
Figure8: Deploymentof theTOBI tow fish
6
4.2.1 TOBI TECHNICAL SPECIFICATIONS
SYSTEMHIGHLIGHTS
1. 6000mdepthcapability
2. 30kHzsidescansonarwith 6km swathrange
3. Swathbathymetrysystemusessidescantransmitsignalfor a fully co-registereddataset.
4. 7.5kHzsub-bottomprofiler sonargiving up to 70mpenetrationinto soft sediments
5. Tri-axial fluxgatemagnetometerandgyrocompasscombineto givelocalmagneticfield measurementandorientation.
BRIEFTECHNICAL SPECIFICATIONS
1. Mechanical
(a) Towing methodTwo bodiedtow systemusingneutrallybuoyantvehicleand600kgdepressorweight.
(b) Size4.5mx 1.5mx 1.1m(lengthx heightx width).
(c) Weight2200kgin air.
(d) Tow cableup to 10kmarmouredcoax.
(e) Umbilical 200mlongx 50mmdiameter, slightly buoyant.
(f) Tow speed1.5to 3 knots(dependenton tow length).
2. SonarSystems
(a) SidescanSonar
i. Frequency 30.37kHz(starboard)32.15kHz(port).
ii. PulseLength2.8ms.iii. Array Length3m.iv. OuputPower600Weachside.
v. Range3000meachside.vi. BeamPattern0.8x 45 degreefan.
(b) BathymetrySonar
i. Transmitterusessidescansonar.ii. Receiver6 hydrophonearraysin 2 housingsfor eachside.
iii. Array Length3m.iv. DetectionSingleandmulti-phase.
v. RangeUp to 3000meachside.
(c) ProfilerSonar
i. Frequency 7.5kHz.
ii. PulseLength0.26ms.iii. OutputPower500W.
iv. RangeUp to 70mpenetrationoversoft sediment.v. Resolutionlessthan1m.
vi. BeamPattern25 degreecone.
3. StandardInstrumentation
(a) MagnetometerUltra ElectronicsMagneticsDivision MB5L.
i. Range+/- 100,000nTon eachaxis.
7
ii. Resolution0.2nT.
iii. Noise+/- 0.4nT.
(b) CTD FalmouthScientificInstruments,Micro CTD.
i. Conductivity
A. Range0 to 65 mmho/cm.
B. Resolution0.0002mmho/cm.
C. Accuracy +/- 0.005mmho/cm.
ii. Temperature
A. Range-2 to 32 Celsius.
B. Resolution0.0001C.
C. Accuracy +/- 0.005C.
iii. Depth
A. Range0 to 7000dbar.
B. Resolution0.02dbar.
C. Accuracy +/-0.12
iv. HeadingS.G.Brown SGB1000UGyrocompass.
A. Resolution0.1degrees.
B. Accuracy Betterthan1, latitudelessthan70 degs.
v. Pitch/RollDualAxis ElectrolyticInclinometer.
A. Range+/- 20 degrees.
B. Resolution0.2degrees.
vi. Altitude Takenfrom profiler sonar.
A. Range1000m.
B. Resolution1m.
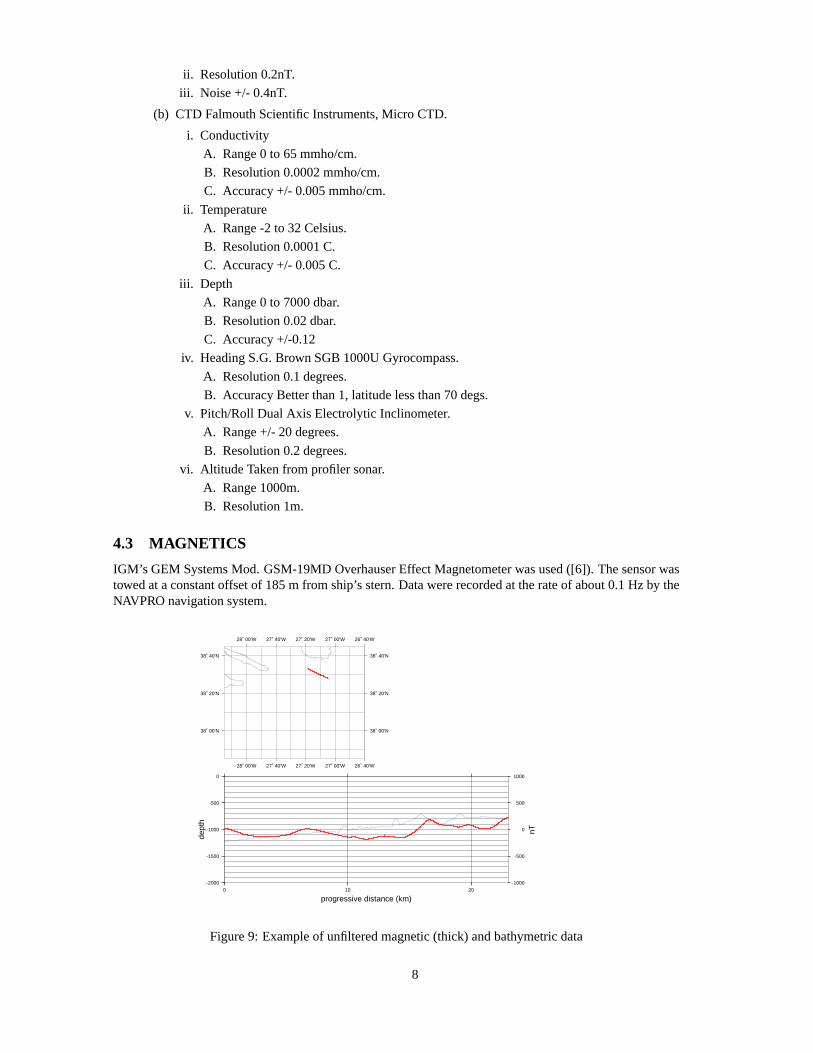
4.3 MAGNETICS
IGM’sGEM SystemsMod. GSM-19MDOverhauserEffectMagnetometerwasused([6]). Thesensorwastowedat aconstantoffsetof 185m from ship’sstern.Datawererecordedat therateof about0.1Hz by theNAVPRO navigationsystem.
-2000
-1500
-1000
-500
0
dept
h
0 10 20
progressive distance (km)
-1000
-500
0
500
1000
nT
28˚ 00'W
28˚ 00'W
27˚ 40'W
27˚ 40'W
27˚ 20'W
27˚ 20'W
27˚ 00'W
27˚ 00'W
26˚ 40'W
26˚ 40'W
38˚ 00'N 38˚ 00'N
38˚ 20'N 38˚ 20'N
38˚ 40'N 38˚ 40'N
Figure9: Exampleof unfilteredmagnetic(thick) andbathymetricdata
8
Theinstrumentperformedwell for thetotality of thecruise.Themagneticdataof thesurvey werecollectedby theNAVPRO navigationcomputer, alongwith date,
time(UTC), DGPScoordinates,gyrocompass,bathymetry(DESO25). A procedurewassetto makeafirstdisplayof thedataby meansof:
1. positioningof thesensoraccordingto theoffsetandgyro;
2. computingof theIGRF-95[7] anomaly
3. displayof magneticsandbathymetryalongtheline;
This servedprimarily for datainspection.An examplecanbeseenin Fig. 9. TheTOBI vehiclecarrieda3 componentmagnetometer, thatacquireddataat1/8thof TOBI data(4 seconds).For aninitial checkweusedthedataextractedfrom theheaderof TOBI data.
4.4 SUBBOTTOM PROFILING
On almostall thesurvey lines,sedimentprofiling wascarriedout usingtheship’s DATASONIC DSP-661Chirp 2 Profiler. Trigger ratesvariedfrom 2 to 4 seconds,while chirp pulselengthwasmaintainedat 120ms.Dataweredisplayedon anEPC9600andrecordedon Magneto-opticaldisksin SEG-Yformat,whichwill beusedoff-line for post-processing.
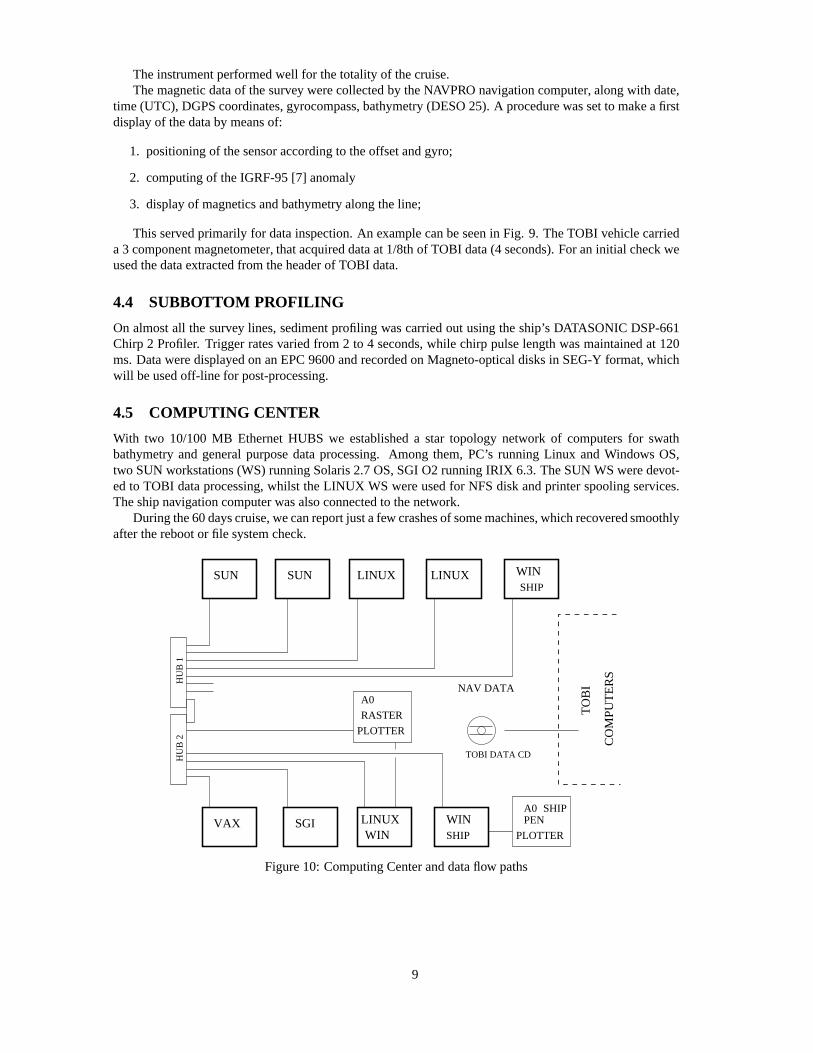
4.5 COMPUTING CENTER
With two 10/100MB EthernetHUBS we establisheda star topology network of computersfor swathbathymetryandgeneralpurposedataprocessing.Among them, PC’s runningLinux andWindows OS,two SUN workstations(WS) runningSolaris2.7OS,SGI O2runningIRIX 6.3.TheSUN WSweredevot-edto TOBI dataprocessing,whilst theLINUX WS wereusedfor NFSdisk andprinterspoolingservices.Theshipnavigationcomputerwasalsoconnectedto thenetwork.
Duringthe60dayscruise,wecanreportjustafew crashesof somemachines,whichrecoveredsmoothlyaftertherebootor file systemcheck.
SUN SUN LINUX LINUX
VAX SGI LINUXWIN
PEN
A0
PLOTTER
RASTER
A0
PLOTTER
NAV DATA
WIN
WINSHIP
SHIP
SHIP
TOBI DATA CD
CO
MP
UT
ER
S
TO
BIH
UB
1H
UB
2
Figure10: ComputingCenteranddataflow paths
9
5 OCEANOGRAPHIC SETTING AND SOUND VELOCITY ANAL-YSIS
At the startof the cruisea CTD stationwasdoneSW of TerceiraI.. SomeSippicanXBT probeswerelaunchedSouthof TerceiraandPicoI. andNW of TerceiraI. andN of PicoI.
Fig.5showsthepositionof thesamplingstations.Thedataareplottedin Fig.11whereasTable3 showntime,dateandpositioninformation.
35 36 37Sal(PSU)
1450 1500Sound V(m/s)
-1500
-1000
-500
0
Dep
th(m
)
10 20T(Deg)
1450 1500Sound V(m/s)
-1500
-1000
-500
0
Dep
th(m
)
10 20T(Deg)
1450 1500Sound V(m/s)
-1500
-1000
-500
0
Dep
th(m
)
10 20T(Deg)
1450 1500Sound V(m/s)
-1500
-1000
-500
0
Dep
th(m
)
10 20T(Deg)
1450 1500Sound V(m/s)
-1500
-1000
-500
0
Dep
th(m
)
10 20T(Deg)
1450 1500Sound V(m/s)
-1500
-1000
-500
0
Dep
th(m
)
10 20T(Deg)
Cruise Urania Azzorre 1999
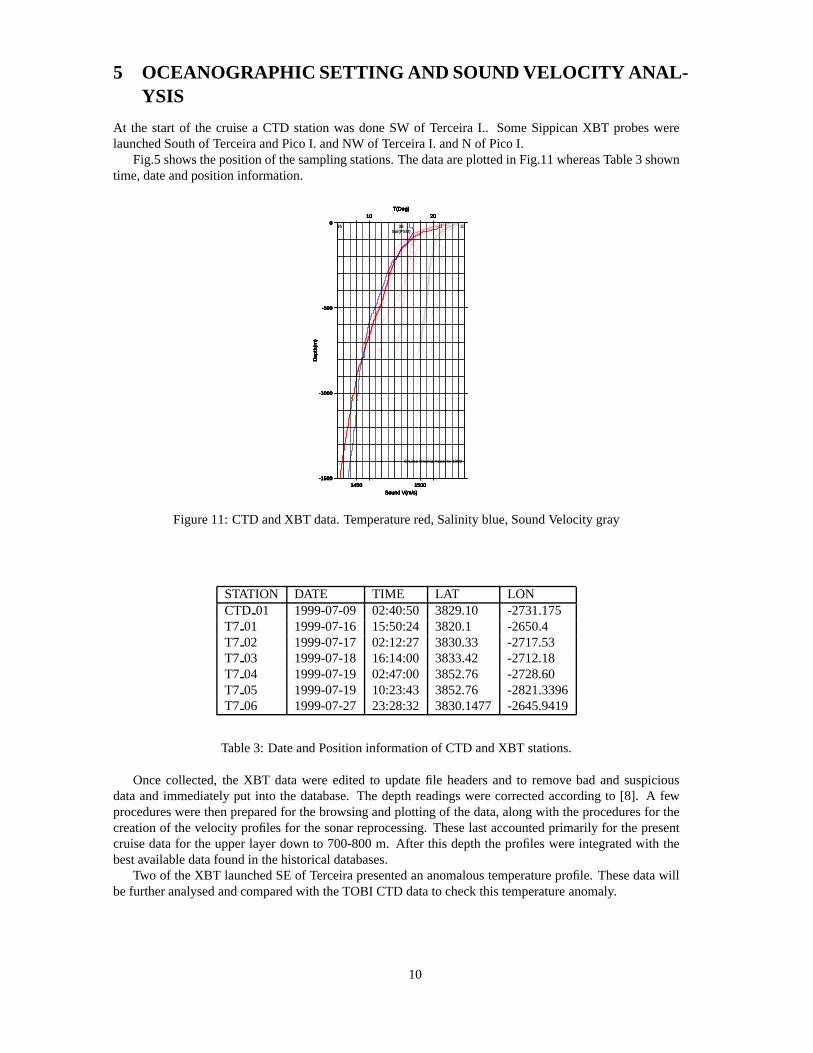
Figure11: CTD andXBT data.Temperaturered,Salinityblue,SoundVelocity gray
STATION DATE TIME LAT LONCTD 01 1999-07-09 02:40:50 3829.10 -2731.175T7 01 1999-07-16 15:50:24 3820.1 -2650.4T7 02 1999-07-17 02:12:27 3830.33 -2717.53T7 03 1999-07-18 16:14:00 3833.42 -2712.18T7 04 1999-07-19 02:47:00 3852.76 -2728.60T7 05 1999-07-19 10:23:43 3852.76 -2821.3396T7 06 1999-07-27 23:28:32 3830.1477 -2645.9419
Table3: DateandPositioninformationof CTD andXBT stations.
Oncecollected,the XBT datawere editedto updatefile headersand to remove bad andsuspiciousdataandimmediatelyput into the database.The depthreadingswerecorrectedaccordingto [8]. A fewprocedureswerethenpreparedfor thebrowsingandplotting of thedata,alongwith theproceduresfor thecreationof thevelocity profilesfor thesonarreprocessing.Theselastaccountedprimarily for thepresentcruisedatafor the upperlayer down to 700-800m. After this depththe profileswereintegratedwith thebestavailabledatafoundin thehistoricaldatabases.
Two of theXBT launchedSEof Terceirapresentedananomaloustemperatureprofile. Thesedatawillbefurtheranalysedandcomparedwith theTOBI CTD datato checkthis temperatureanomaly.
10
6 TOBI SIDE-SCAN IMAGERY AND SWATH BATHYMETRY -DATA ORGANIZATION AND PRE-PROCESSING
The processingon boardwasmainly aimedat (a) verifying the positioningdataof the tow-fish, and(b)picking the phasewraps(swath bathymetry)from the TOBI data. Oncemagneto-oticalcartridgeswerefilled, they wereimmediatelycopiedontoCD-ROM, whichcouldthenbeportedto theSUNWSfor mergingwith navigationdata.Themergedfiles werethenusedfor pre-processingof TOBI images.Thenavigationdatawereusedto producenavigationmapswhichwerethenusedasbase-mapsfor mosaickingprintoutsofthesidescansonarimagesby hand(for preliminaryinterpretationaboardship).
6.1 NAVIGATION PROCESSING
The tow fish waspositionedby the merging andfiltering of a) ship’s POS1data, b) HPR Acousticpo-sitioning dataon the tow-fish depressor(range,depthfrom POS1,bearingfrom ship’s heading),andc)cablelength,tow-fishdepthandazimuthasmeasuredandrecordedby theTOBI dataloggers.To do sowedevelopeda modelof thecable.Theattitudedatadatawereusedappliedin thefollowing sequence:
1. analyzethecatenaryproblemanddevelopthecablemodel(2ndorderaproximationof thecatenaryequation)
2. mergethenav data(shipandtow-fish) into a singlefile
3. smooththetow-fishnav data(5 min moving average)(wire out,depthandheading)
4. smooththeship’sheading(5 min moving average)
5. medianfilter theHPRdata(bearinganddepth)basedon thediscrepency betweenobservedvalueandthemodel’spredictedvalue
6. resampleat1 min rate
7. smooththeHPR’s range,bearing(11min window)
8. calculatethe besttow-fish positionusingship position,filtered HPR rangeandbearing(in caseoflackof HPRdatathemodelpredictionis used)
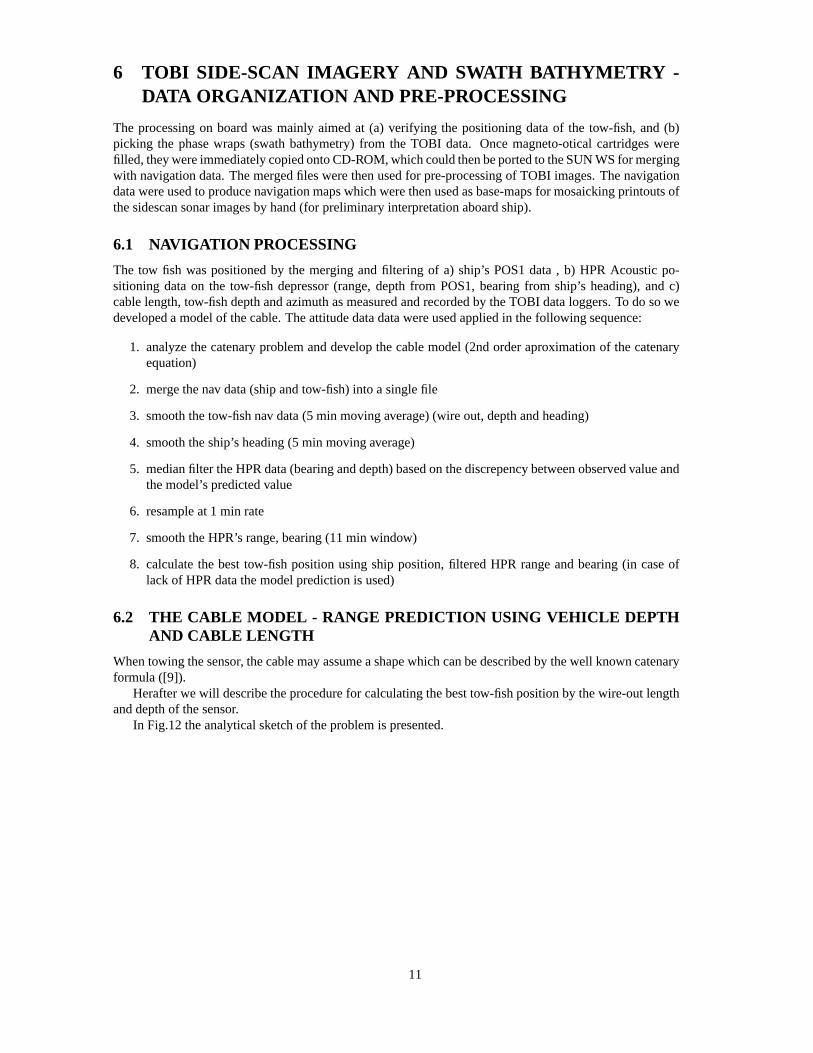
6.2 THE CABLE MODEL - RANGE PREDICTION USING VEHICLE DEPTHAND CABLE LENGTH
Whentowing thesensor, thecablemayassumeashapewhichcanbedescribedby thewell known catenaryformula([9]).
Herafterwewill describetheprocedurefor calculatingthebesttow-fishpositionby thewire-outlengthanddepthof thesensor.
In Fig.12theanalyticalsketchof theproblemis presented.
11
x
E
S
W
N
γ
α
x
δTO
BIH
PR
N
TOBI DEPRESSOR
HPR
-h
γ = ship azimuthα = bearing HPRβ =
δ = vehicle azimuth
l = wire out
h = depthSr = Slant range HPR
l
Sr
Os
r
z
Ot
γ + α = HPR azimuth
r = range - Os
Ot = constant offsetOs = constant offset
r + O
s
Figure12: Analytical sketchof thetow-fishpositionproblem.Notethatthethecatenaryis schematiconlyandnot to scale.Notealsothatacousticvariability andrefractionof ray pathsleadsto errorsin range(Sr)anddepthderivedby theSimradHPRsystem.
Thecatenaryequationcanbewrittenas:��������� ������������������������ �!�#" � $��%'&)(+*-, � �/. �#" (1)
whereh is thevehicledepth,a andb areparametersto bedeterminedaccordingto theboundarycondi-tions.We assumethat: 0 ���1���2�43 � with �5�76���1���2�86 with �5�89 (2)
Thecablelengthis : : �19 ��<;>=?A@ B �DC �FE������HG1I�J�� (3)
In orderto obtainananalitycalexpressionof Eq.3,we approximatethefunction ���1��� of Eq.1by a��K�L
orderTaylorexpansion:���1���2M�ON���1���2�8����6F� � B�QP R I �R � ISSSSS �UT ? � I �V� $� �#" � � B� � I� (4)
Giventheboundaryconditionsin (2) weobtain:W � I ��X= X" �Y3 � � B � I ��X= X �[Z N�������2� �9 I �1� I 3\9 I � (5)
GiventheEq.3thelengthof thecableis
12
: �19 �2�D;�=?^] B �_� � � �9 I � I J��`� � �9 I ;>=? ] , 9 I� � . I � � I J�� (6)
Let � = XI � , thereforeEq.6becomes:: �19 �2� B ; =?Aa I � � I J��`� B� W a 9 I �cb � I � 9 I� �edgfch � � �ji 9 I �cb � I9 k!l (7)
UsingEq. 7 weareableto calculatethecablelengthgiventherangedistancem andthevehicledepthn .Giventhecablelength oqp andvehicledepthn , in orderto solvetheinverseproblem,weusetheNewton-
Rapsoniterativemethod,thatis: rts m u2v7o s m utwxo p v7y (8)
Thevalueof m canbeobtainedby: mUz|{~}!v8mUzw rts m z ur��|s m z u (9)
where� indicatesthe ����� iteration,andr � s m u2v m �!� �� m��/�>�Fn�� � �ne�g�c� � n[� � m����c� n��m k ��� n s � n�� � m��/�c� n���u � m �� m��/�c� n�� w � new�� m � �c� n � k!l (10)
startingwith thetrial solution mF� p�� v�n . Theconvergenceof suchaproximationto thedesiredsolutionm canbeevaluatedby theBanach’scontractionmappingtheorem:
theiterationis terminatedwhen � �+���F�����+���� ��� � is sufficiently small.
6.3 SWATH BATHYMETRY PRE-PROCESSING
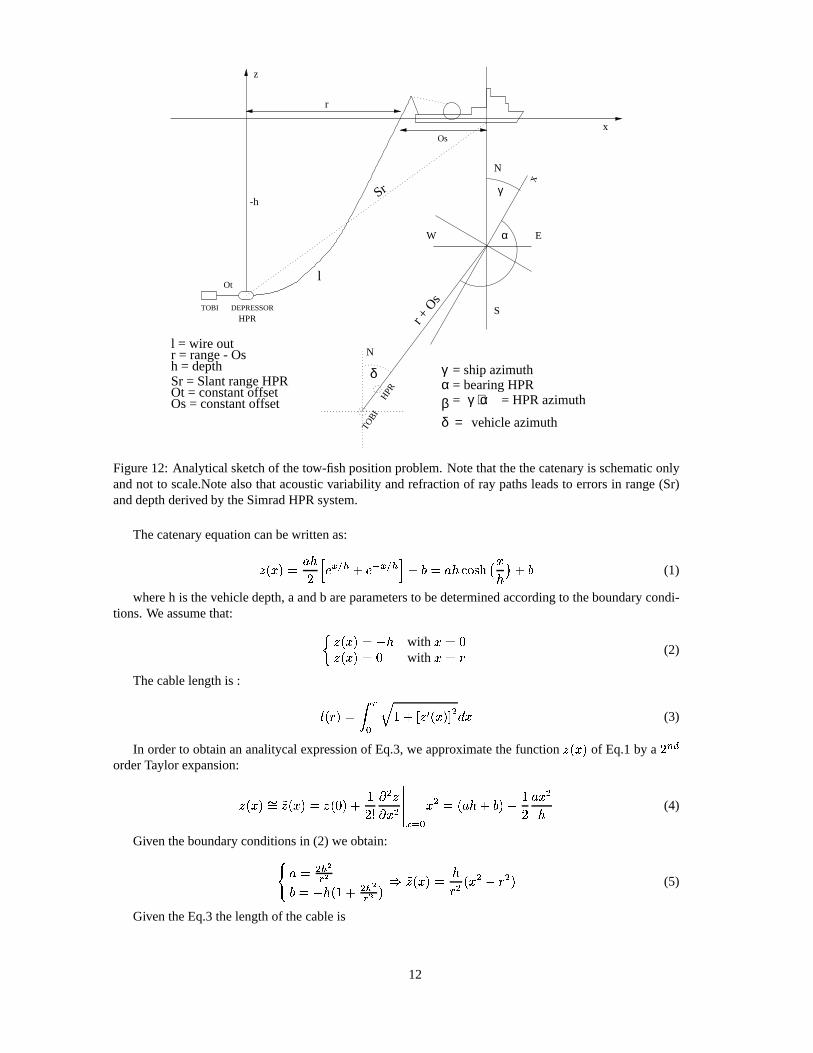
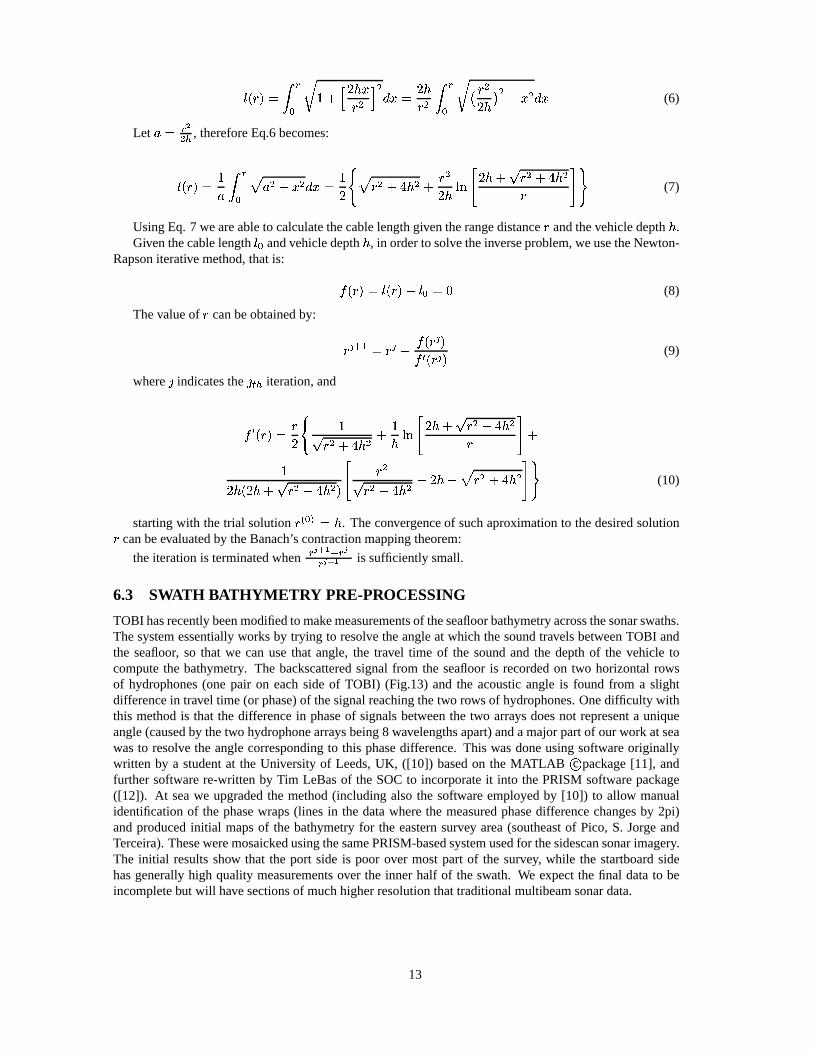
TOBI hasrecentlybeenmodifiedto makemeasurementsof theseafloorbathymetryacrossthesonarswaths.Thesystemessentiallyworksby trying to resolve theangleat which thesoundtravelsbetweenTOBI andthe seafloor, so that we can usethat angle,the travel time of the soundand the depthof the vehicle tocomputethe bathymetry. The backscatteredsignal from the seaflooris recordedon two horizontalrowsof hydrophones(one pair on eachsideof TOBI) (Fig.13) and the acousticangleis found from a slightdifferencein travel time (or phase)of thesignalreachingthetwo rowsof hydrophones.Onedifficulty withthis methodis that the differencein phaseof signalsbetweenthe two arraysdoesnot representa uniqueangle(causedby thetwo hydrophonearraysbeing8 wavelengthsapart)andamajorpartof ourwork atseawasto resolve the anglecorrespondingto this phasedifference.This wasdoneusingsoftwareoriginallywritten by a studentat the University of Leeds,UK, ([10]) basedon the MATLAB c
�package[11], and
further softwarere-writtenby Tim LeBasof the SOCto incorporateit into the PRISM softwarepackage([12]). At seawe upgradedthe method(including also the softwareemployed by [10]) to allow manualidentificationof the phasewraps(lines in the datawherethe measuredphasedifferencechangesby 2pi)andproducedinitial mapsof the bathymetryfor the easternsurvey area(southeastof Pico, S. Jorge andTerceira).TheseweremosaickedusingthesamePRISM-basedsystemusedfor thesidescansonarimagery.The initial resultsshow that the port side is poor over mostpart of the survey, while the startboardsidehasgenerallyhigh quality measurementsover the inner half of the swath. We expectthe final datato beincompletebut will havesectionsof muchhigherresolutionthattraditionalmultibeamsonardata.
13
Θ= arctan(H/X)
Φ = 2 π d
λ sin Θ
Φλ =
=
=
Wavelength
Phase Difference
Array Separationd
λ
λ
λ
/2
/2
8
CeramicElements
ArrayHousing
Element HousingBacking Plate
Θ
Θ
d
SWATH SYSTEM GEOMETRY
H
X
t1
t0
Figure13: Phasemeasurementsketch.
6.4 MAPPING AND MOSAICKING
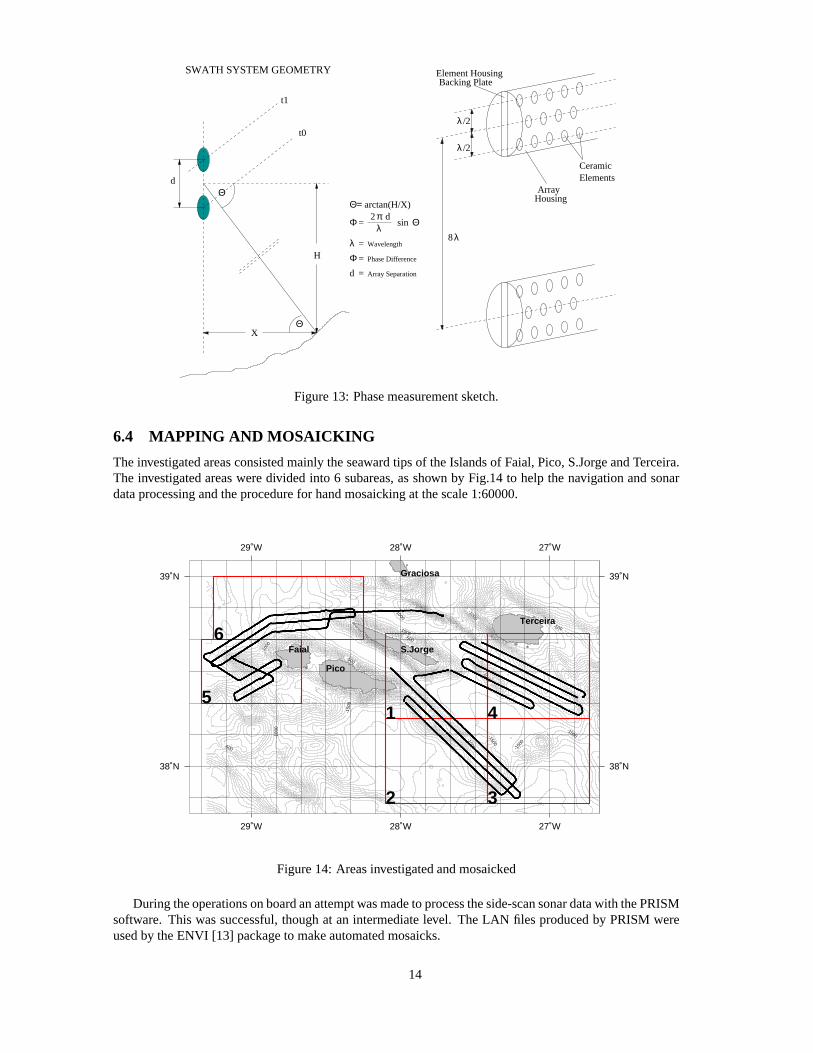
Theinvestigatedareasconsistedmainly theseawardtips of theIslandsof Faial,Pico,S.JorgeandTerceira.The investigatedareasweredivided into 6 subareas,asshown by Fig.14to help the navigationandsonardataprocessingandtheprocedurefor handmosaickingat thescale1:60000.
-150
0
-1500
-1500
-150
0
-100
0
-1000
-100
0
-1000
-1000
-1000
-1000
-500
-500
-500
-500
29˚W
29˚W
28˚W
28˚W
27˚W
27˚W
38˚N 38˚N
39˚N 39˚N
1
2 3
45
6
Pico
S.Jorge
Terceira
Faial
Graciosa
Figure14: Areasinvestigatedandmosaicked
Duringtheoperationsonboardanattemptwasmadeto processtheside-scansonardatawith thePRISMsoftware. This wassuccessful,thoughat an intermediatelevel. TheLAN files producedby PRISMwereusedby theENVI [13] packageto makeautomatedmosaicks.
14
6.4.1 HAND-PRODUCED TOBI MOSAICKING
Thereasoningfor theproductionof unprocessedTOBI mosaicsis twofold: 1) to usethemosaicasaqualitycontroldevice,2) to begin familiarizationwith thedataand,if appropriatebegin initial interpretation.
Theproductionof thescaledprints for mosaickingfollows a sequentialorderasdetailedbelow. Priorto productiontheworking scaleof thefinal mosaicshouldbedeterminedandthewidth of the6.0kmTOBIswathdeterminedfor thatscale(in thiscase,aworkingscaleof 1:60,000meantthattheswathwidth wouldbe100.0mm).
1. TheMO diskheaderinformation,andstartandstoptimesarecheckedusingtheprogram”REPTEST”.
2. Thedistancebetweensuccessive1/2 hourperiodsalongtheTOBI trackline at therequiredscalearedeterminedeitherby theuseof softwareor directmeasurementfrom thetrackplots. TheprocessingPChassoftwarethatrequirestheinput timesfor eachfile to bebetweenfull 1/2 hoursmarks,e.g. ifa datafile beginsat 23:16,thefirst input valuewould bethedistancebetweenthe1/2 marksat 23:00and23:30hours.This is alsothecasefor theendof file. An asciidatafile is createdfor eachof theTOBI MO disks(usually16.25hoursin length),labeledto matchtheMO disknumber. i.e. MO diskNo.197wouldhaveanasciifile createdcalled”197.ana”
3. The raw sidescandataaredownloadedfrom MO disk to the processingPC andscaledat the sametime usingtheprogramme”ERASDISK” andthe”.ana” files for subsequentreplaying.A numberofparametersareenteredsuchasfile namemodifierandtheoffset into thefile in minutes,thegammaandgain values(affecting the brightnessandcontrastof the final print, for this cruisegamma=0.6,gain=1.0),andfinally the desiredswath width in mm. Scalingis achievedsimply by the repetitionof lines of sonardatauntil each1/2 hour time stampis the sameas in the ”.ana” input file. Theoutputfrom ERASDISKis writtento thePCharddiskasspecial”.scl” files. As theprogrammereadsthe datafrom theMO disk andscalesit appropriately, the final sonarimageis displayedon the PCmonitorasawaterfall display.
4. Thefinal scaledsonardataarethenreplayedthroughaRaytheonthermalline scanrecorderusingtheprogramme”DISCCRAY”.
5. TheTOBI 7.5kHzprofiler datais replayedusingtheprogramme”PROFRAY”. This softwarereadsdirectlyfrom theMO disk,andusestheencodeddepthandaltitudedatato correctfor variationin tow-cablelength. Requiredinputsincludethe lengthof time requiredto bereplayedanda ”decimationfactor” (roughnessof theseafloortopography).
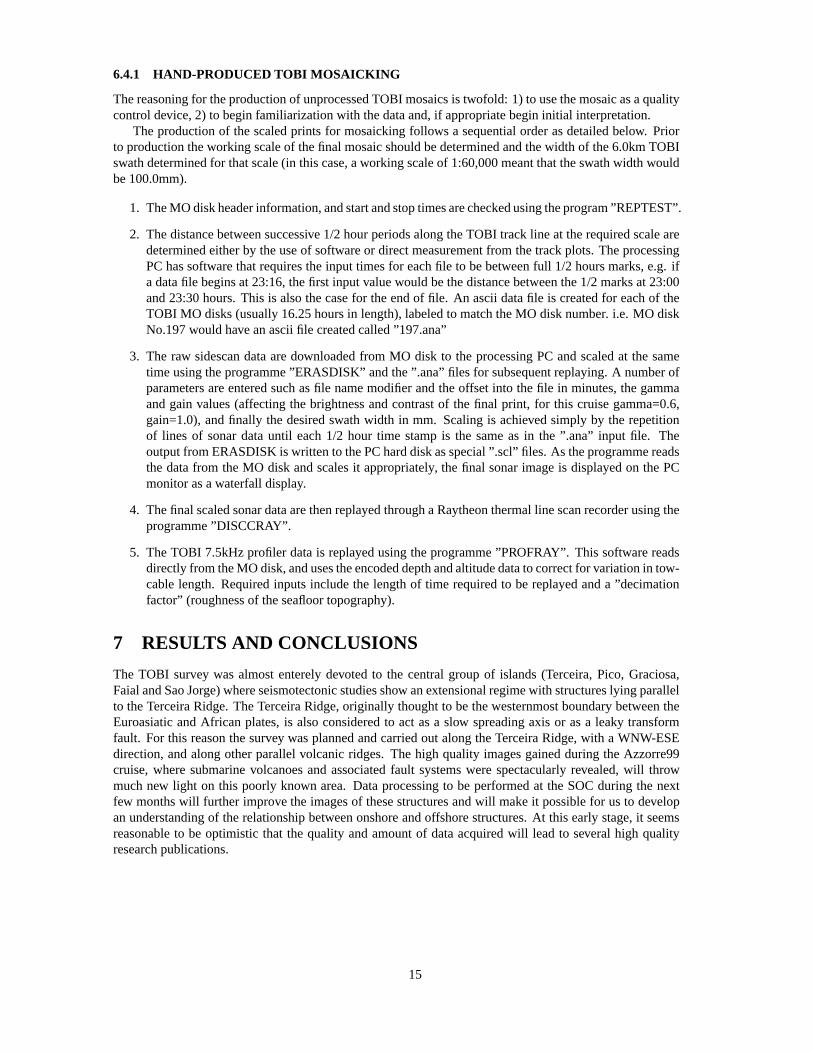
7 RESULTS AND CONCLUSIONS
The TOBI survey wasalmostenterelydevotedto the centralgroupof islands(Terceira,Pico, Graciosa,FaialandSaoJorge)whereseismotectonicstudiesshow anextensionalregimewith structureslying parallelto theTerceiraRidge.TheTerceiraRidge,originally thoughtto bethewesternmostboundarybetweentheEuroasiaticandAfrican plates,is alsoconsideredto act asa slow spreadingaxis or asa leaky transformfault. For this reasonthesurvey wasplannedandcarriedout alongtheTerceiraRidge,with a WNW-ESEdirection,andalongotherparallelvolcanicridges. The high quality imagesgainedduring the Azzorre99cruise,wheresubmarinevolcanoesandassociatedfault systemswerespectacularlyrevealed,will throwmuchnew light on this poorly known area. Dataprocessingto be performedat the SOCduring the nextfew monthswill further improve the imagesof thesestructuresandwill make it possiblefor usto developanunderstandingof therelationshipbetweenonshoreandoffshorestructures.At this earlystage,it seemsreasonableto be optimistic that the quality andamountof dataacquiredwill leadto several high qualityresearchpublications.
15
References
[1] SearleR.C.,Tectonicpatternof theAzoresspreadingcenterandtriple junction, EarthandPlanetarySc.Lett., 51,415-434,1980.
[2] FreireLuis J., MirandaJ.M., GaldeanoA., Patriat P., RossignolJ.C.andVictor A.M., The AzoresTriple Junctionevolutionsince10MA from anaeromagneticsurvey of theMid Atlantic Ridge, EarthandPlanetarySc.Lett., 125,439-459,1994.
[3] Murton, B.J., Rouse,I.P., Millard, N.W., Flewellen, C.G., Multi-sensordeep-towed instrumentex-ploresthe oceanfloor, EOS,Transactionsof the AmericanGeophysicalUnion, 73, No.20,May 191992,P225,288,1992.
[4] Flewellen, C.G., Millard, N.W., Rouse,I.P., TOBI, a vehicle for deepoceansurvey, Electronic&CommunicationEngineeringJournalVol. 5, No.2,April 1993,P85-93.TOBI BrochureavailablefromIOSDL, 1993.
[5] NAVPRO User’sManual,http://www.comm-tec.com.
[6] GSM-19DUser’sManual.www.gemsys.com.
[7] Int. Geomag.ReferenceField,http://web.ngdc.noaa.gov/IAGA/wg8/igrfnew.html.
[8] UNESCO-CEC/DGXII, MAST andIOC/CODE,Manualof QualityControlProceduresfor validationof OceanographicData, UNESCOManualandGuides,26,436pp.,1993.
[9] Korn G.A andKorn T.M., MathematicalHandbookfor scientistsandengineeers, McGraw andHill,NY, 1130pp,1968.
[10] AvgerinosF., High ResolutionStudiesOf VolcanismAnd Faulting During CrustalConstructionAtTheMid-Atlantic Ridge, PhD.Thesis,Universityof Leeds,thesisin preparation, 1999.
[11] MATLAB User’sManual, MATHWORKSInc, MA, USA, 1999.
[12] Le BasT. andHuhnerbachV., PRISMDocumentationVersion3.0, SouthamptonOceanographyCen-tre,UK.
[13] ENVI User’sManual, RESEARCHSYSTEMInc.,USA, 1999.
[14] WesselP. andSmithW.H.F., New versionof theGenericMappingTool released, EOSTrans.AGU,p.329,1995,(http://imina.soest.hawaii/edu/gmt)
16
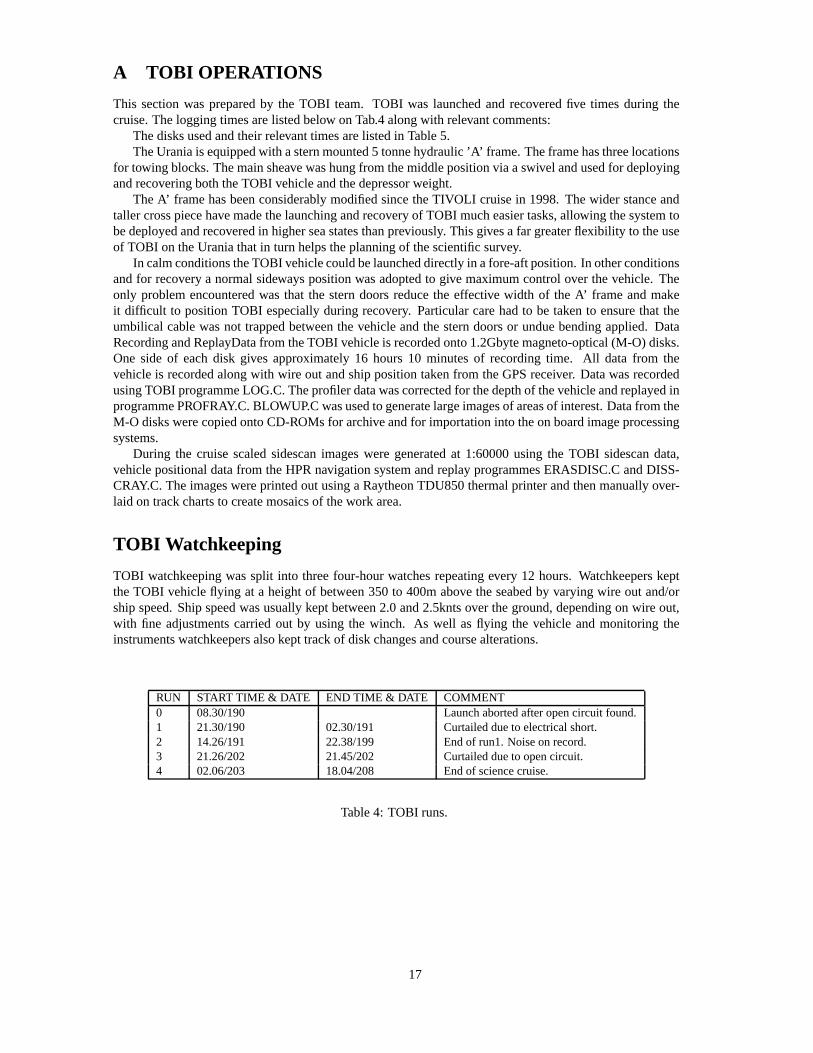
A TOBI OPERATIONS
This sectionwaspreparedby the TOBI team. TOBI was launchedand recoveredfive times during thecruise.Theloggingtimesarelistedbelow on Tab.4 alongwith relevantcomments:
Thedisksusedandtheir relevanttimesarelistedin Table5.TheUraniais equippedwith asternmounted5 tonnehydraulic’A’ frame.Theframehasthreelocations
for towing blocks.Themainsheavewashungfrom themiddlepositionvia aswivel andusedfor deployingandrecoveringboththeTOBI vehicleandthedepressorweight.
TheA’ framehasbeenconsiderablymodifiedsincetheTIVOLI cruisein 1998. Thewider stanceandtaller crosspiecehavemadethelaunchingandrecoveryof TOBI mucheasiertasks,allowing thesystemtobedeployedandrecoveredin higherseastatesthanpreviously. Thisgivesa fargreaterflexibility to theuseof TOBI on theUraniathatin turnhelpstheplanningof thescientificsurvey.
In calmconditionstheTOBI vehiclecouldbelauncheddirectlyin afore-aftposition.In otherconditionsandfor recovery a normalsidewayspositionwasadoptedto give maximumcontrolover thevehicle. Theonly problemencounteredwas that the sterndoorsreducethe effective width of the A’ frameandmakeit difficult to positionTOBI especiallyduring recovery. Particularcarehadto be taken to ensurethat theumbilical cablewasnot trappedbetweenthe vehicleandthe sterndoorsor unduebendingapplied. DataRecordingandReplayDatafrom theTOBI vehicleis recordedonto1.2Gbytemagneto-optical(M-O) disks.One side of eachdisk gives approximately16 hours10 minutesof recordingtime. All data from thevehicleis recordedalongwith wire out andshippositiontakenfrom theGPSreceiver. DatawasrecordedusingTOBI programmeLOG.C.Theprofilerdatawascorrectedfor thedepthof thevehicleandreplayedinprogrammePROFRAY.C.BLOWUP.C wasusedto generatelargeimagesof areasof interest.Datafrom theM-O diskswerecopiedontoCD-ROMsfor archiveandfor importationinto theonboardimageprocessingsystems.
During the cruisescaledsidescanimageswere generatedat 1:60000using the TOBI sidescandata,vehiclepositionaldatafrom theHPRnavigationsystemandreplayprogrammesERASDISC.CandDISS-CRAY.C. Theimageswereprintedout usinga RaytheonTDU850thermalprinterandthenmanuallyover-laid on trackchartsto createmosaicsof thework area.
TOBI Watchkeeping
TOBI watchkeepingwassplit into threefour-hourwatchesrepeatingevery 12 hours. WatchkeeperskepttheTOBI vehicleflying at a heightof between350 to 400mabove theseabedby varyingwire out and/orshipspeed.Shipspeedwasusuallykeptbetween2.0 and2.5kntsover theground,dependingon wire out,with fine adjustmentscarriedout by using the winch. As well asflying the vehicleandmonitoring theinstrumentswatchkeepersalsokepttrackof diskchangesandcoursealterations.
RUN START TIME & DATE END TIME & DATE COMMENT0 08.30/190 Launchabortedafteropencircuit found.1 21.30/190 02.30/191 Curtaileddueto electricalshort.2 14.26/191 22.38/199 Endof run1.Noiseon record.3 21.26/202 21.45/202 Curtaileddueto opencircuit.4 02.06/203 18.04/208 Endof sciencecruise.
Table4: TOBI runs.
17
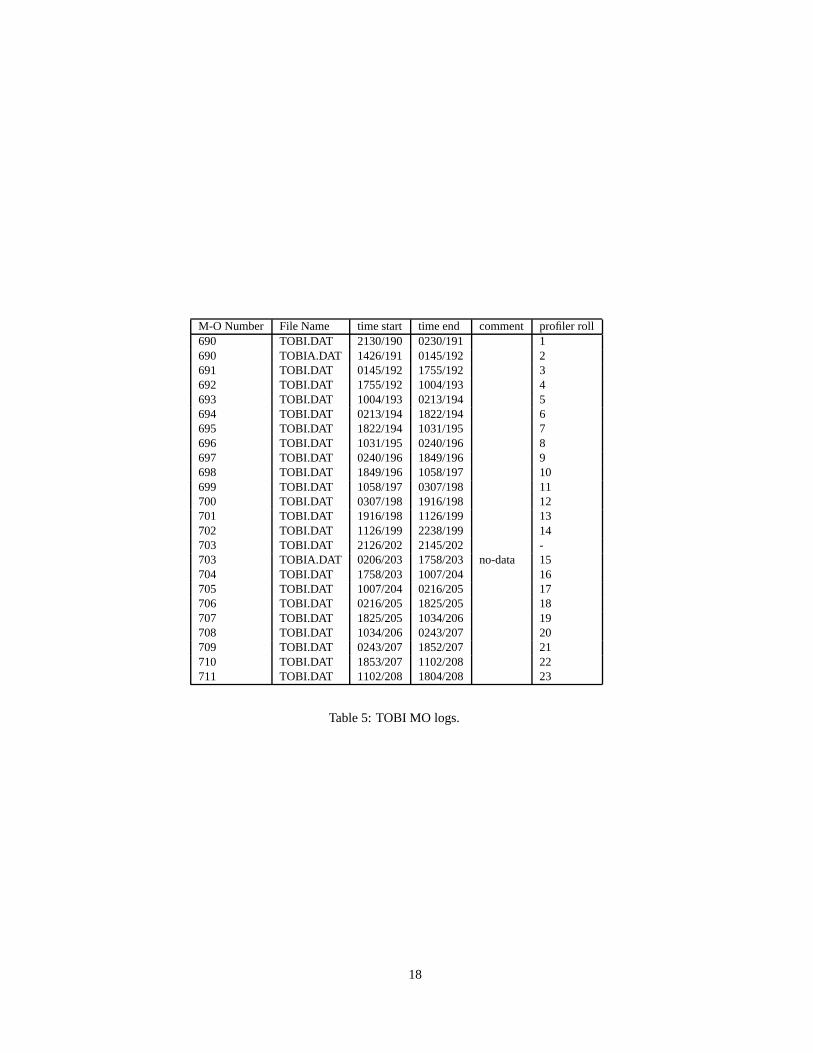
M-O Number File Name timestart timeend comment profiler roll690 TOBI.DAT 2130/190 0230/191 1690 TOBIA.DAT 1426/191 0145/192 2691 TOBI.DAT 0145/192 1755/192 3692 TOBI.DAT 1755/192 1004/193 4693 TOBI.DAT 1004/193 0213/194 5694 TOBI.DAT 0213/194 1822/194 6695 TOBI.DAT 1822/194 1031/195 7696 TOBI.DAT 1031/195 0240/196 8697 TOBI.DAT 0240/196 1849/196 9698 TOBI.DAT 1849/196 1058/197 10699 TOBI.DAT 1058/197 0307/198 11700 TOBI.DAT 0307/198 1916/198 12701 TOBI.DAT 1916/198 1126/199 13702 TOBI.DAT 1126/199 2238/199 14703 TOBI.DAT 2126/202 2145/202 -703 TOBIA.DAT 0206/203 1758/203 no-data 15704 TOBI.DAT 1758/203 1007/204 16705 TOBI.DAT 1007/204 0216/205 17706 TOBI.DAT 0216/205 1825/205 18707 TOBI.DAT 1825/205 1034/206 19708 TOBI.DAT 1034/206 0243/207 20709 TOBI.DAT 0243/207 1852/207 21710 TOBI.DAT 1853/207 1102/208 22711 TOBI.DAT 1102/208 1804/208 23
Table5: TOBI MO logs.
18