Istituto Alti Studi della Difesa Roma 28 gennaio 2015
39
Istituto Alti Studi della Difesa Roma 28 gennaio 2015 Un mare di crisi? Il Mediterraneo nel nuovo scenario politico internazionale Prof. Luciano Bozzo, Università degli Studi di Firenze
Transcript of Istituto Alti Studi della Difesa Roma 28 gennaio 2015
Istituto Alti Studi della Difesa Roma
28 gennaio 2015
Un mare di crisi? Il Mediterraneo nel nuovo scenario politico internazionale
Prof. Luciano Bozzo, Università degli Studi di Firenze
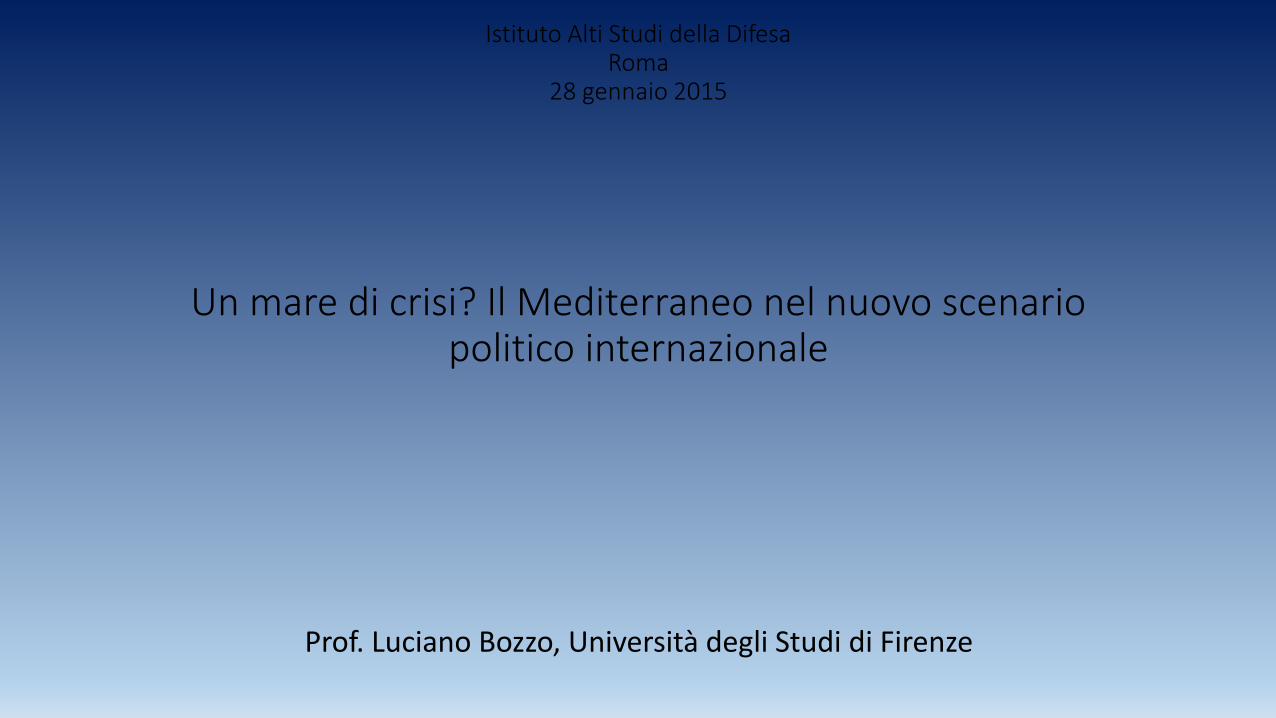
Estensione dell’Impero Romano nel II sec d.C.
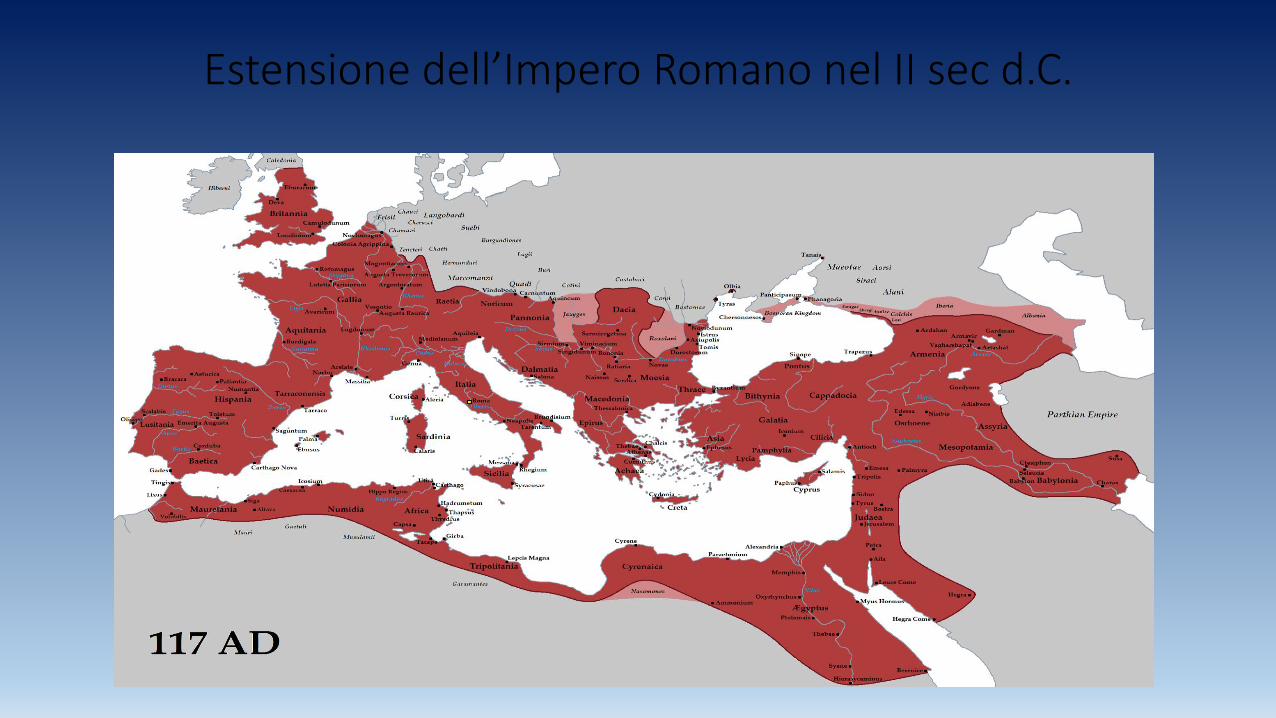
Impero Romano d’Occidente e d’Oriente

<< La terra al di là della frontiera nord-occidentale […] era una giungla remota e inesplorata, abitata da tribù pittoresche ed esotiche, dalle abitudini sporche e malvagie, con un livello culturale infimo e una religione superata, e ben pochi beni di un qualche interesse da offrire, oltre alle genti che potevano essere portate a un sia pur minimo livello di civiltà attraverso l’istituzione dettata da Dio della schiavitù.>>
(Bernard Lewis, Cultures in Conflict ,1995)
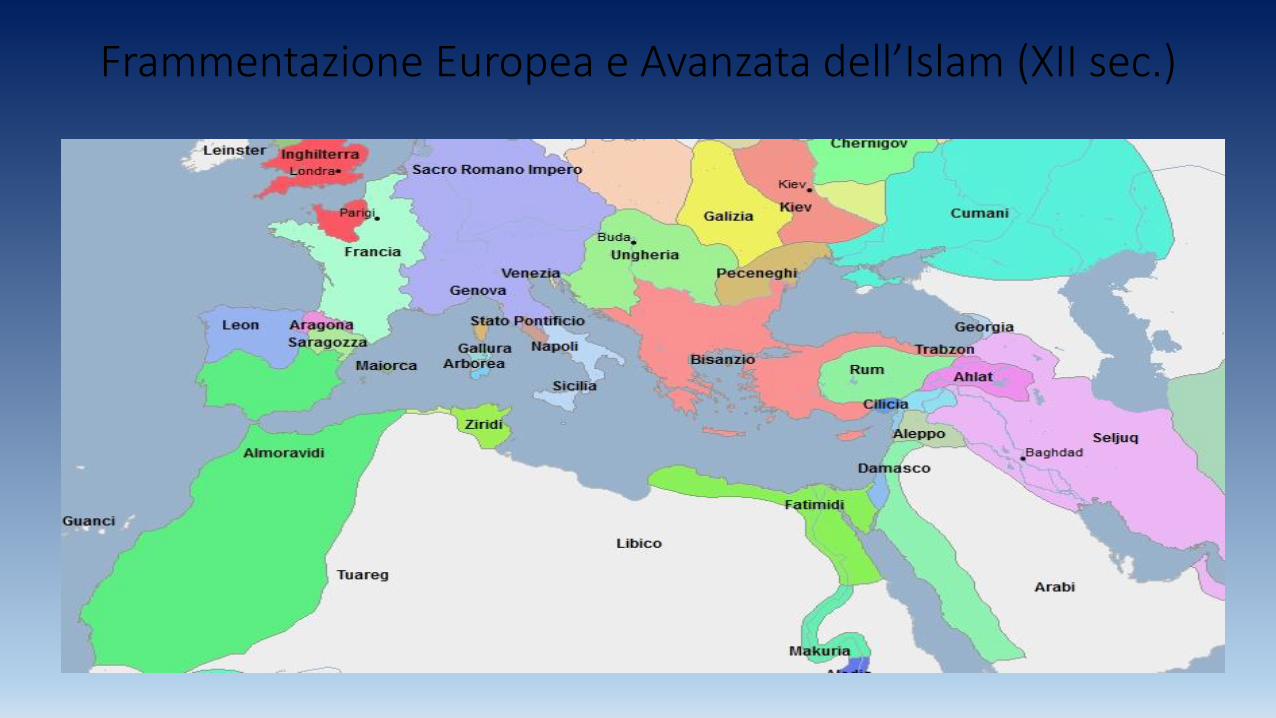
Frammentazione Europea e Avanzata dell’Islam (XII sec.)
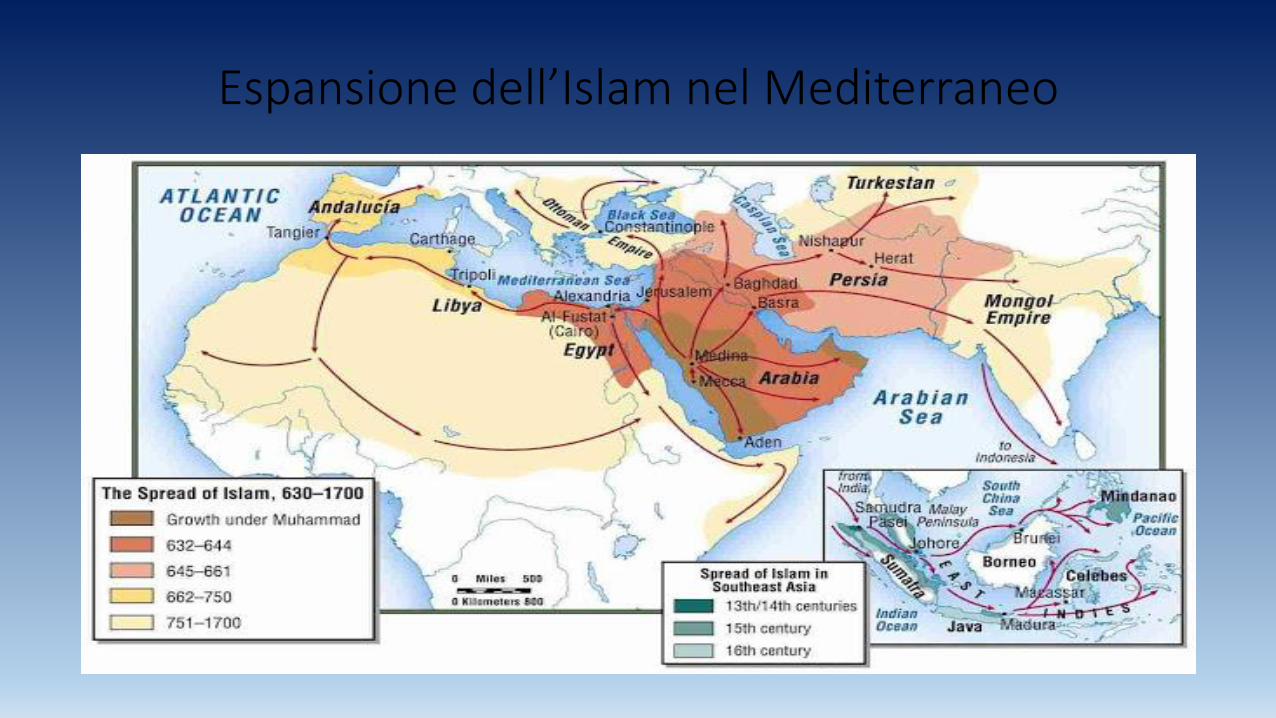
Espansione dell’Islam nel Mediterraneo
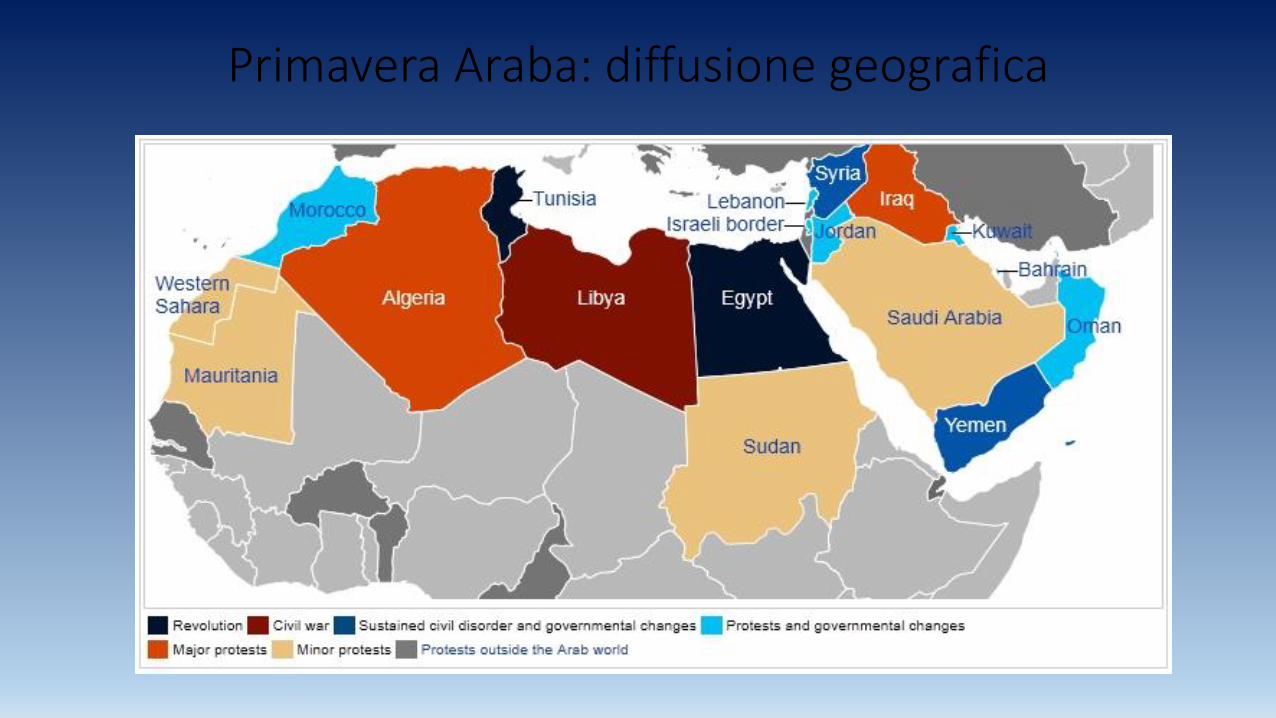
Primavera Araba: diffusione geografica
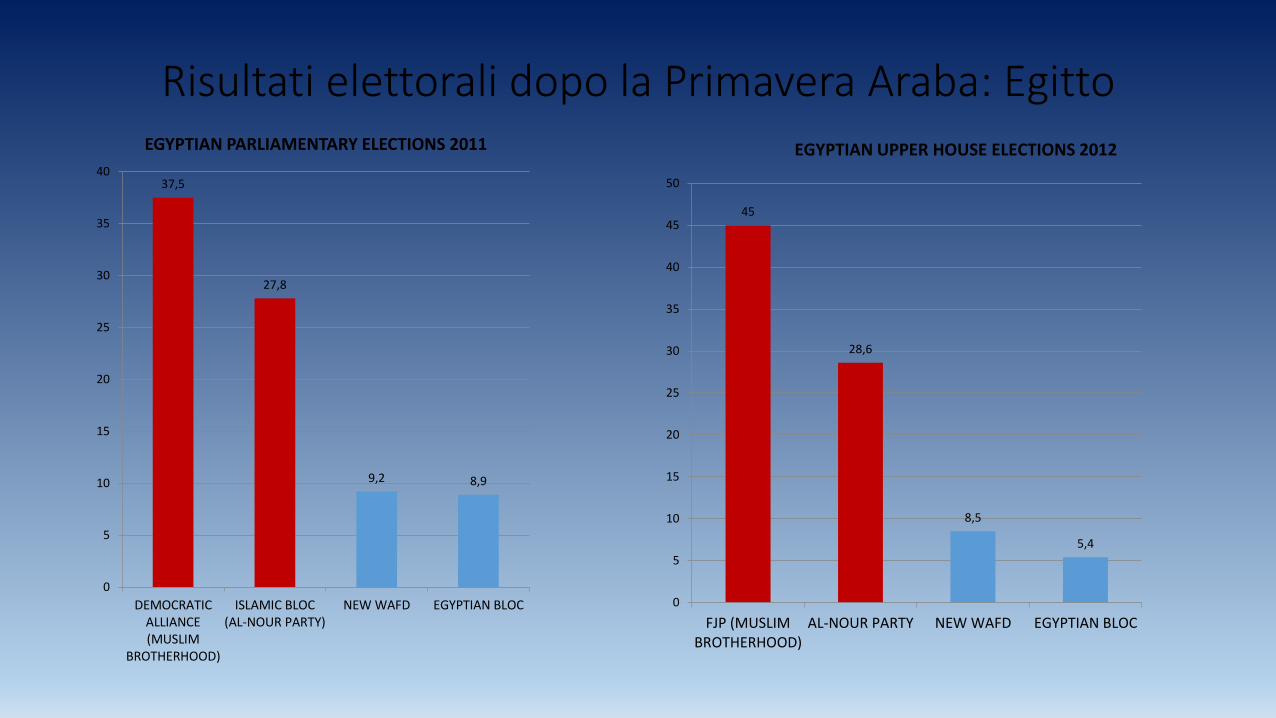
Risultati elettorali dopo la Primavera Araba: Egitto
37,5
27,8
9,2 8,9
0
5
10
15
20
25
30
35
40
DEMOCRATICALLIANCE(MUSLIM
BROTHERHOOD)
ISLAMIC BLOC(AL-NOUR PARTY)
NEW WAFD EGYPTIAN BLOC
EGYPTIAN PARLIAMENTARY ELECTIONS 2011
45
28,6
8,5
5,4
0
5
10
15
20
25
30
35
40
45
50
FJP (MUSLIMBROTHERHOOD)
AL-NOUR PARTY NEW WAFD EGYPTIAN BLOC
EGYPTIAN UPPER HOUSE ELECTIONS 2012
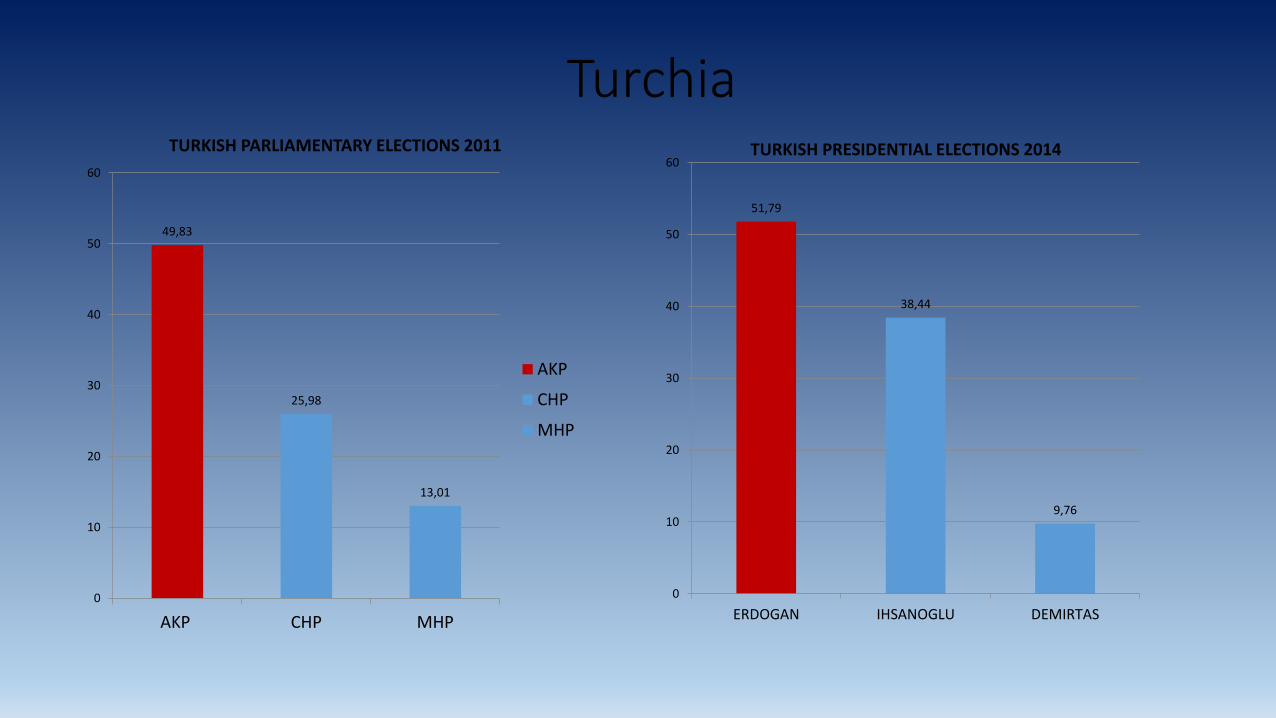
Turchia
49,83
25,98
13,01
0
10
20
30
40
50
60
AKP CHP MHP
TURKISH PARLIAMENTARY ELECTIONS 2011
AKP
CHP
MHP
51,79
38,44
9,76
0
10
20
30
40
50
60
ERDOGAN IHSANOGLU DEMIRTAS
TURKISH PRESIDENTIAL ELECTIONS 2014
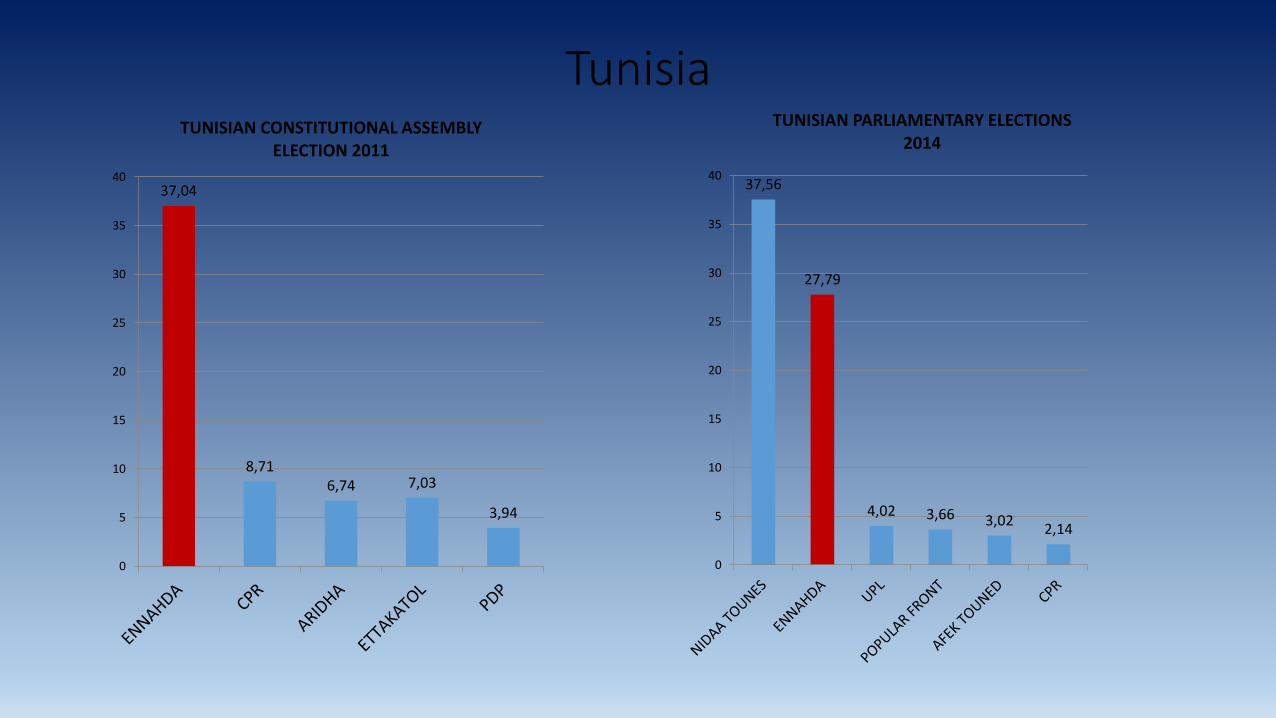
Tunisia
37,04
8,71 6,74 7,03
3,94
0
5
10
15
20
25
30
35
40
TUNISIAN CONSTITUTIONAL ASSEMBLY ELECTION 2011
37,56
27,79
4,02 3,66 3,02 2,14
0
5
10
15
20
25
30
35
40
TUNISIAN PARLIAMENTARY ELECTIONS 2014
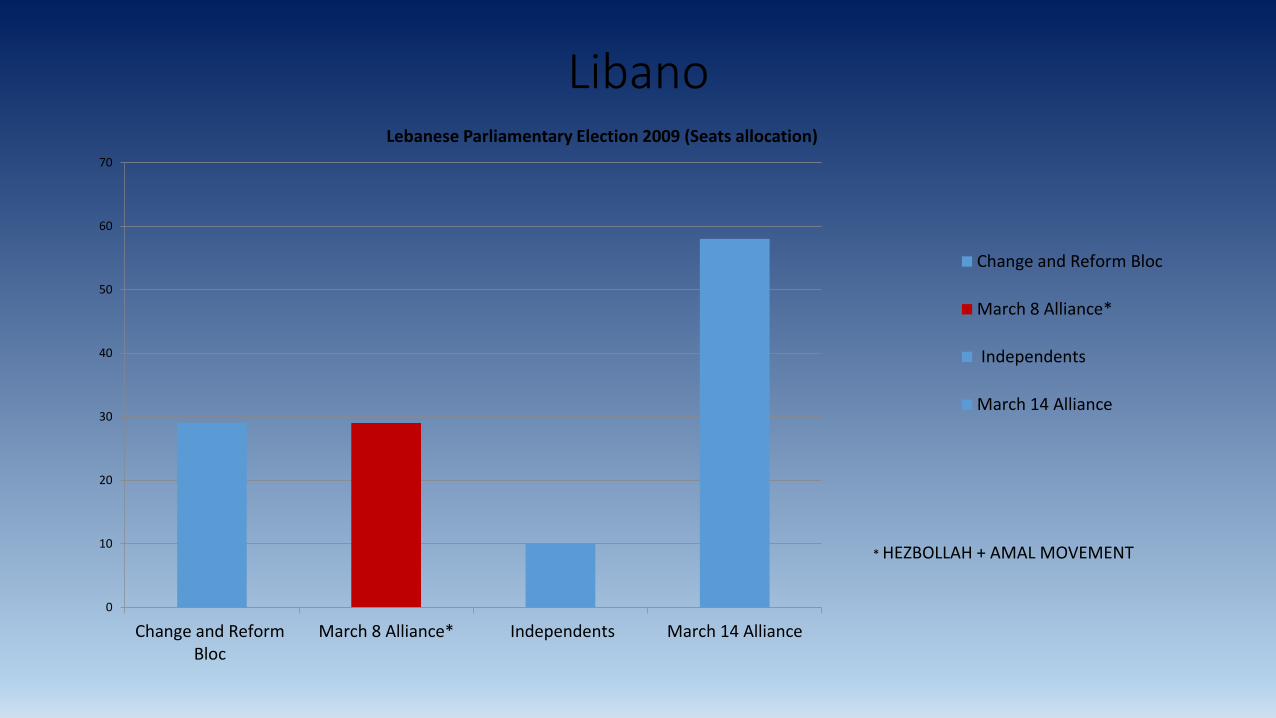
Libano
0
10
20
30
40
50
60
70
Change and ReformBloc
March 8 Alliance* Independents March 14 Alliance
Lebanese Parliamentary Election 2009 (Seats allocation)
Change and Reform Bloc
March 8 Alliance*
Independents
March 14 Alliance
* HEZBOLLAH + AMAL MOVEMENT
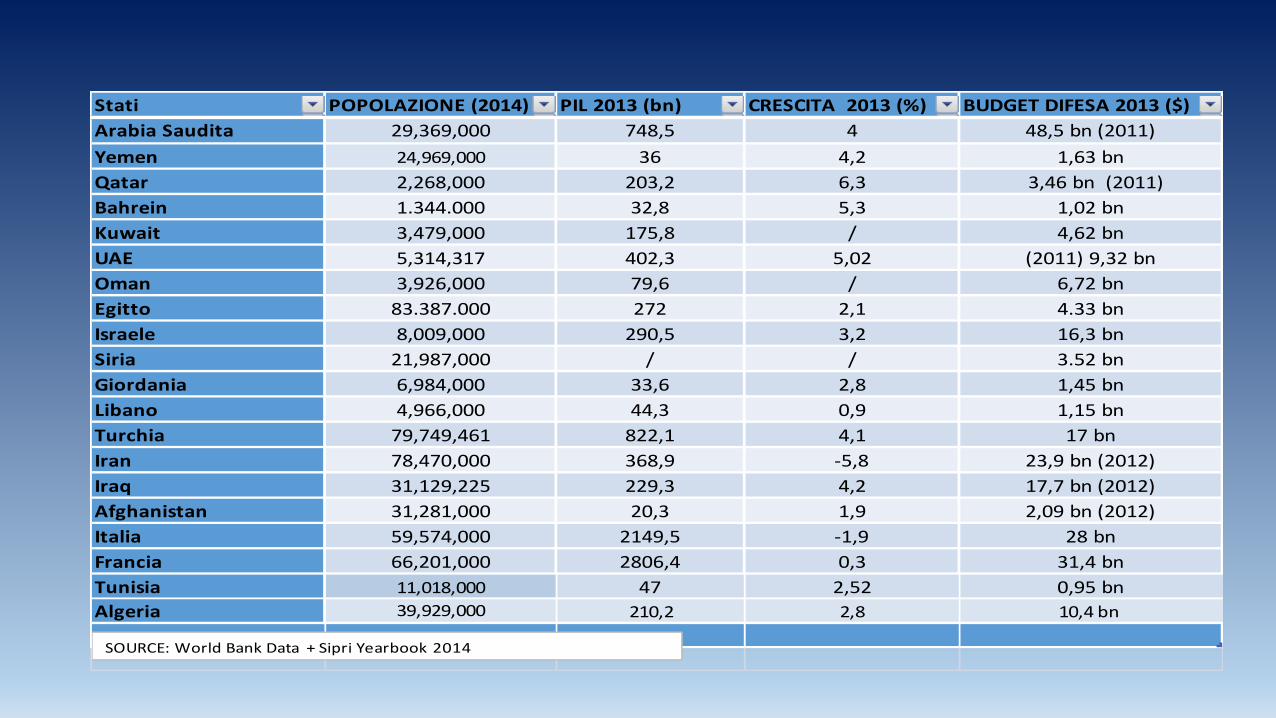
Stati POPOLAZIONE (2014) PIL 2013 (bn) CRESCITA 2013 (%) BUDGET DIFESA 2013 ($)
Arabia Saudita 29,369,000 748,5 4 48,5 bn (2011)
Yemen 24,969,000 36 4,2 1,63 bn
Qatar 2,268,000 203,2 6,3 3,46 bn (2011)
Bahrein 1.344.000 32,8 5,3 1,02 bn
Kuwait 3,479,000 175,8 / 4,62 bn
UAE 5,314,317 402,3 5,02 (2011) 9,32 bn
Oman 3,926,000 79,6 / 6,72 bn
Egitto 83.387.000 272 2,1 4.33 bn
Israele 8,009,000 290,5 3,2 16,3 bn
Siria 21,987,000 / / 3.52 bn
Giordania 6,984,000 33,6 2,8 1,45 bn
Libano 4,966,000 44,3 0,9 1,15 bn
Turchia 79,749,461 822,1 4,1 17 bn
Iran 78,470,000 368,9 -5,8 23,9 bn (2012)
Iraq 31,129,225 229,3 4,2 17,7 bn (2012)
Afghanistan 31,281,000 20,3 1,9 2,09 bn (2012)
Italia 59,574,000 2149,5 -1,9 28 bn
Francia 66,201,000 2806,4 0,3 31,4 bn
Tunisia 11,018,000 47 2,52 0,95 bn
Algeria 39,929,000 210,2 2,8 10,4 bn
SOURCE: World Bank Data + Sipri Yearbook 2014
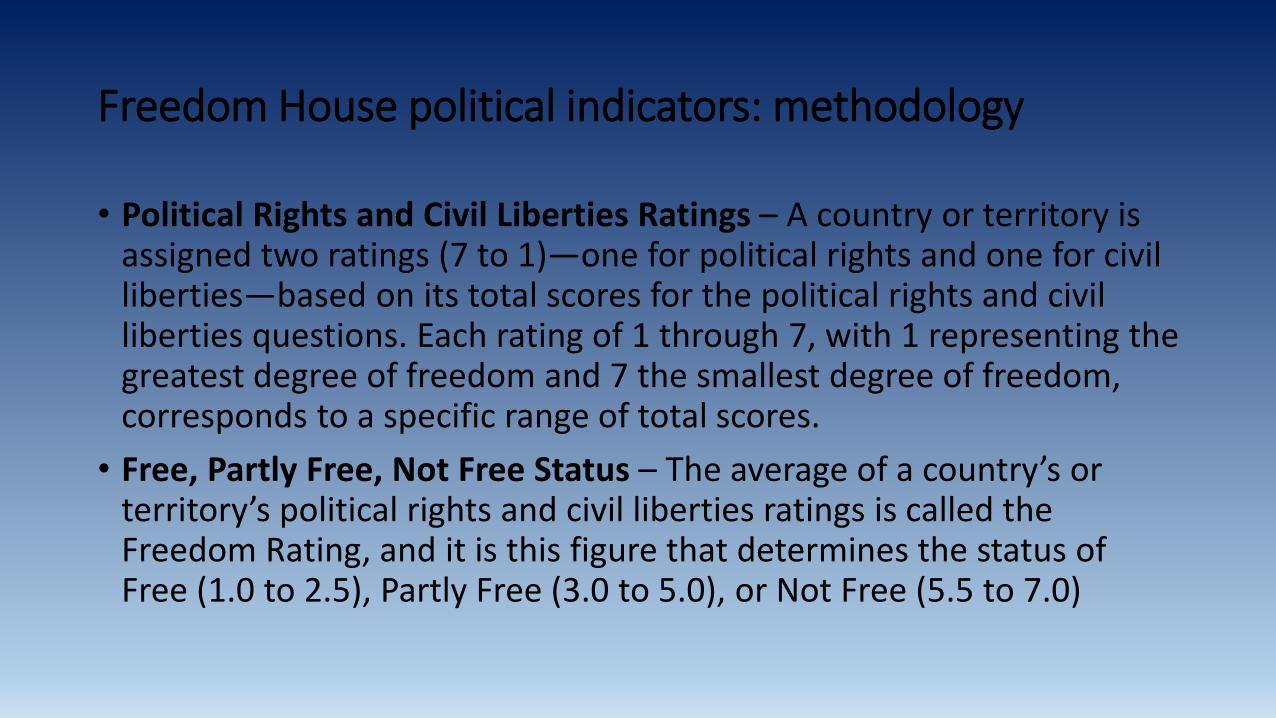
Freedom House political indicators: methodology
• Political Rights and Civil Liberties Ratings – A country or territory is assigned two ratings (7 to 1)—one for political rights and one for civil liberties—based on its total scores for the political rights and civil liberties questions. Each rating of 1 through 7, with 1 representing the greatest degree of freedom and 7 the smallest degree of freedom, corresponds to a specific range of total scores.
• Free, Partly Free, Not Free Status – The average of a country’s or territory’s political rights and civil liberties ratings is called the Freedom Rating, and it is this figure that determines the status of Free (1.0 to 2.5), Partly Free (3.0 to 5.0), or Not Free (5.5 to 7.0)
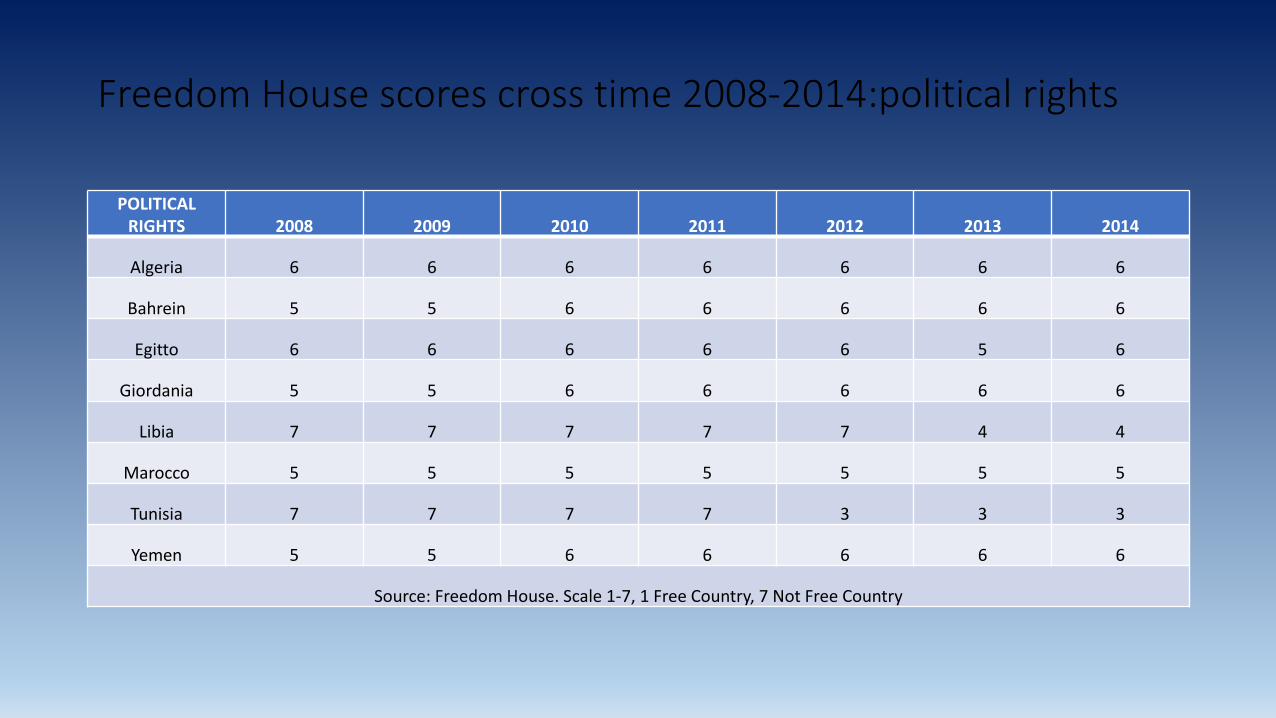
Freedom House scores cross time 2008-2014:political rights
POLITICAL RIGHTS 2008 2009 2010 2011 2012 2013 2014
Algeria 6 6 6 6 6 6 6
Bahrein 5 5 6 6 6 6 6
Egitto 6 6 6 6 6 5 6
Giordania 5 5 6 6 6 6 6
Libia 7 7 7 7 7 4 4
Marocco 5 5 5 5 5 5 5
Tunisia 7 7 7 7 3 3 3
Yemen 5 5 6 6 6 6 6
Source: Freedom House. Scale 1-7, 1 Free Country, 7 Not Free Country
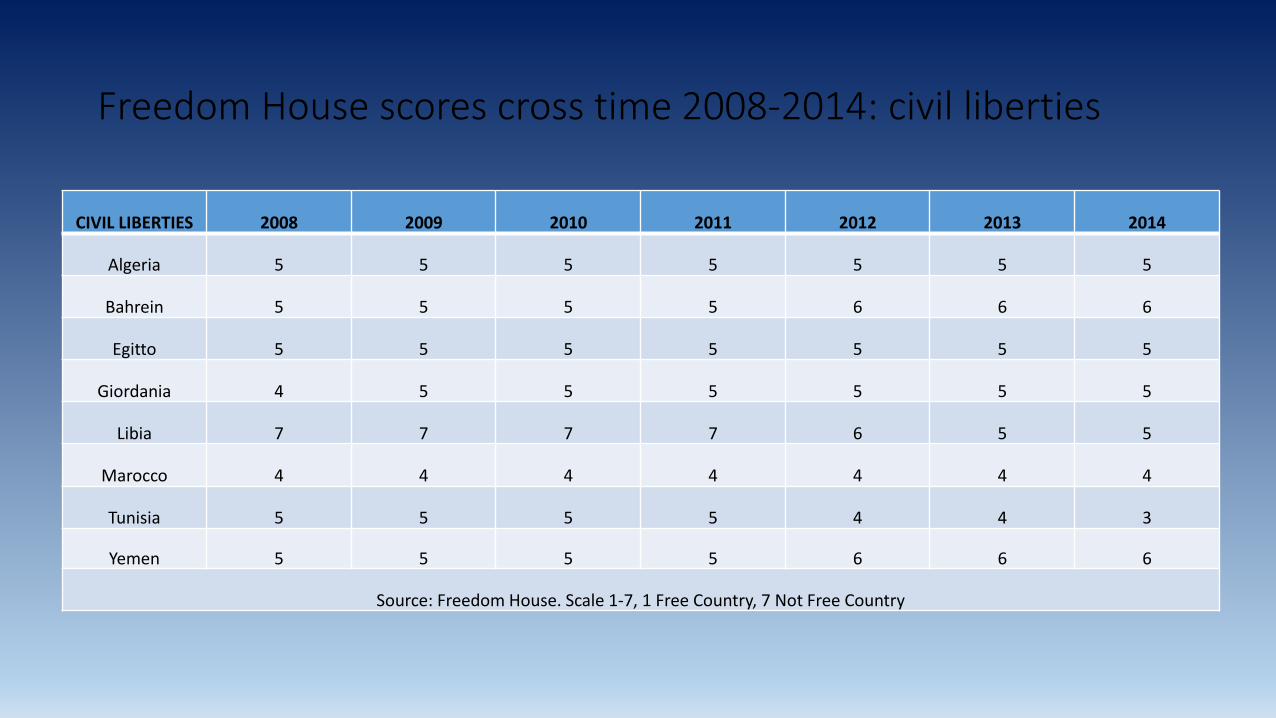
Freedom House scores cross time 2008-2014: civil liberties
CIVIL LIBERTIES 2008 2009 2010 2011 2012 2013 2014
Algeria 5 5 5 5 5 5 5
Bahrein 5 5 5 5 6 6 6
Egitto 5 5 5 5 5 5 5
Giordania 4 5 5 5 5 5 5
Libia 7 7 7 7 6 5 5
Marocco 4 4 4 4 4 4 4
Tunisia 5 5 5 5 4 4 3
Yemen 5 5 5 5 6 6 6
Source: Freedom House. Scale 1-7, 1 Free Country, 7 Not Free Country
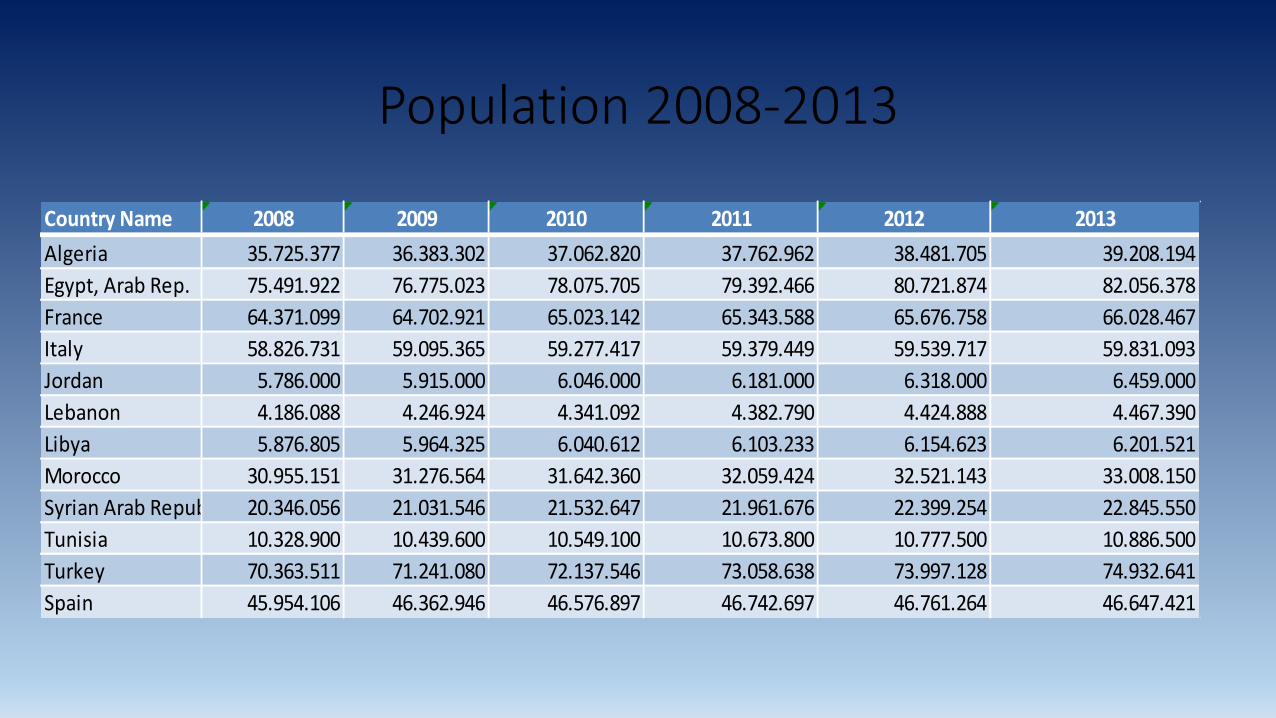
Population 2008-2013
Country Name 2008 2009 2010 2011 2012 2013
Algeria 35.725.377 36.383.302 37.062.820 37.762.962 38.481.705 39.208.194
Egypt, Arab Rep. 75.491.922 76.775.023 78.075.705 79.392.466 80.721.874 82.056.378
France 64.371.099 64.702.921 65.023.142 65.343.588 65.676.758 66.028.467
Italy 58.826.731 59.095.365 59.277.417 59.379.449 59.539.717 59.831.093
Jordan 5.786.000 5.915.000 6.046.000 6.181.000 6.318.000 6.459.000
Lebanon 4.186.088 4.246.924 4.341.092 4.382.790 4.424.888 4.467.390
Libya 5.876.805 5.964.325 6.040.612 6.103.233 6.154.623 6.201.521
Morocco 30.955.151 31.276.564 31.642.360 32.059.424 32.521.143 33.008.150
Syrian Arab Republic 20.346.056 21.031.546 21.532.647 21.961.676 22.399.254 22.845.550
Tunisia 10.328.900 10.439.600 10.549.100 10.673.800 10.777.500 10.886.500
Turkey 70.363.511 71.241.080 72.137.546 73.058.638 73.997.128 74.932.641
Spain 45.954.106 46.362.946 46.576.897 46.742.697 46.761.264 46.647.421
Source: Harold and Margaret Sprout, The Foundations of International Politics, 1962
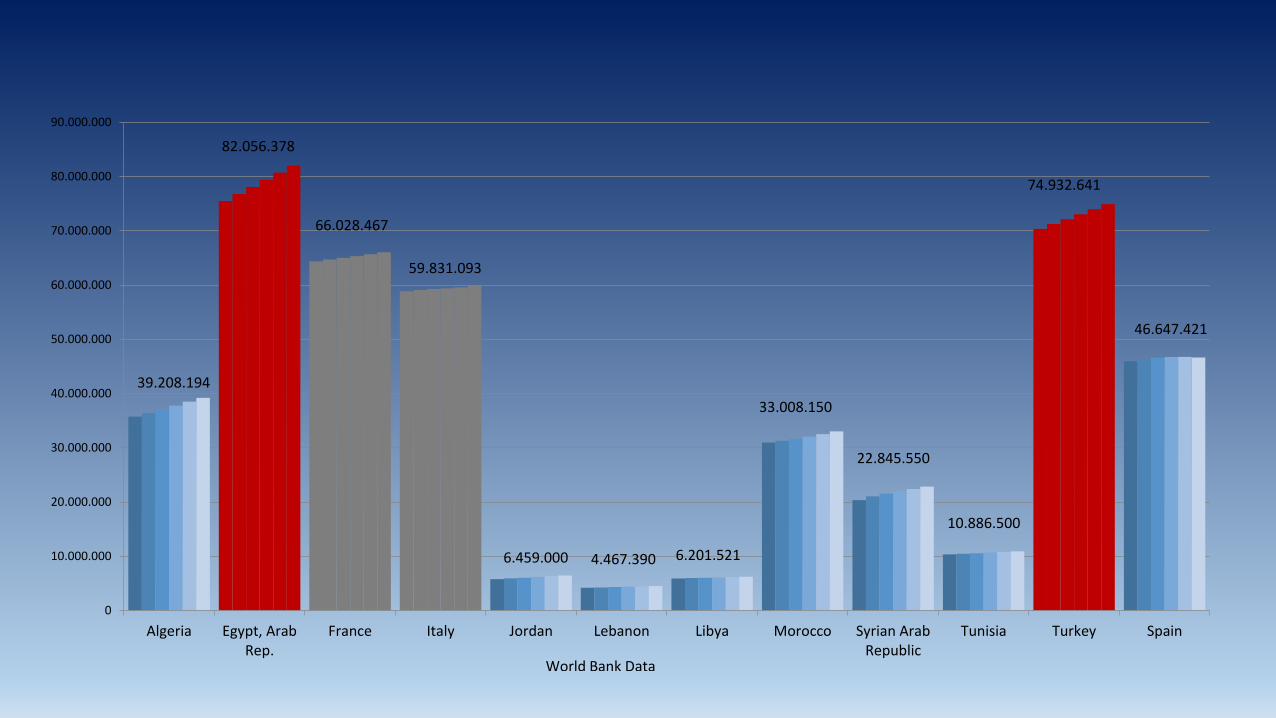
39.208.194
82.056.378
66.028.467
59.831.093
6.459.000 4.467.390 6.201.521
33.008.150
22.845.550
10.886.500
74.932.641
46.647.421
0
10.000.000
20.000.000
30.000.000
40.000.000
50.000.000
60.000.000
70.000.000
80.000.000
90.000.000
Algeria Egypt, ArabRep.
France Italy Jordan Lebanon Libya Morocco Syrian ArabRepublic
Tunisia Turkey Spain
World Bank Data
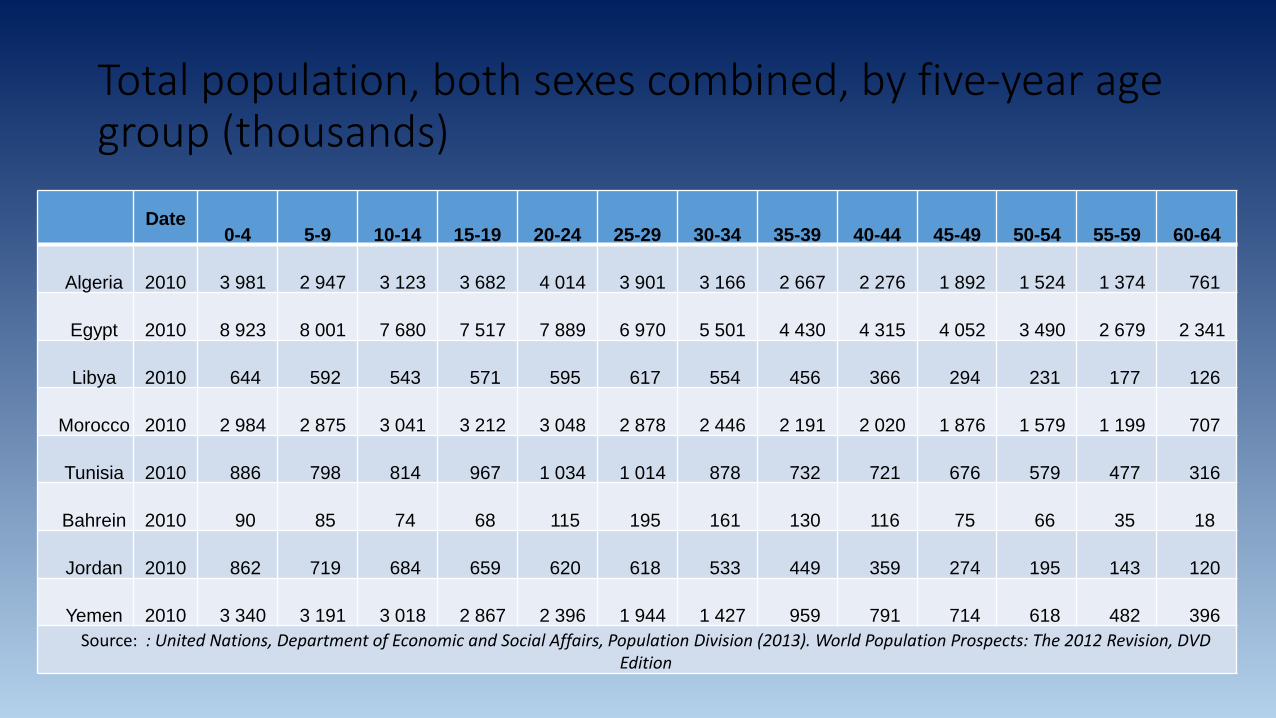
Total population, both sexes combined, by five-year age group (thousands)
Date 0-4 5-9 10-14 15-19 20-24 25-29 30-34 35-39 40-44 45-49 50-54 55-59 60-64
Algeria 2010 3 981 2 947 3 123 3 682 4 014 3 901 3 166 2 667 2 276 1 892 1 524 1 374 761
Egypt 2010 8 923 8 001 7 680 7 517 7 889 6 970 5 501 4 430 4 315 4 052 3 490 2 679 2 341
Libya 2010 644 592 543 571 595 617 554 456 366 294 231 177 126
Morocco 2010 2 984 2 875 3 041 3 212 3 048 2 878 2 446 2 191 2 020 1 876 1 579 1 199 707
Tunisia 2010 886 798 814 967 1 034 1 014 878 732 721 676 579 477 316
Bahrein 2010 90 85 74 68 115 195 161 130 116 75 66 35 18
Jordan 2010 862 719 684 659 620 618 533 449 359 274 195 143 120
Yemen 2010 3 340 3 191 3 018 2 867 2 396 1 944 1 427 959 791 714 618 482 396
Source: : United Nations, Department of Economic and Social Affairs, Population Division (2013). World Population Prospects: The 2012 Revision, DVD Edition
0 2 000 4 000 6 000 8 000 10 000 12 000 14 000 16 000
0-4
5-9
10-14
15-19
20-24
25-29
30-34
35-39
40-44
45-49
50-54
55-59
60-64
65-69
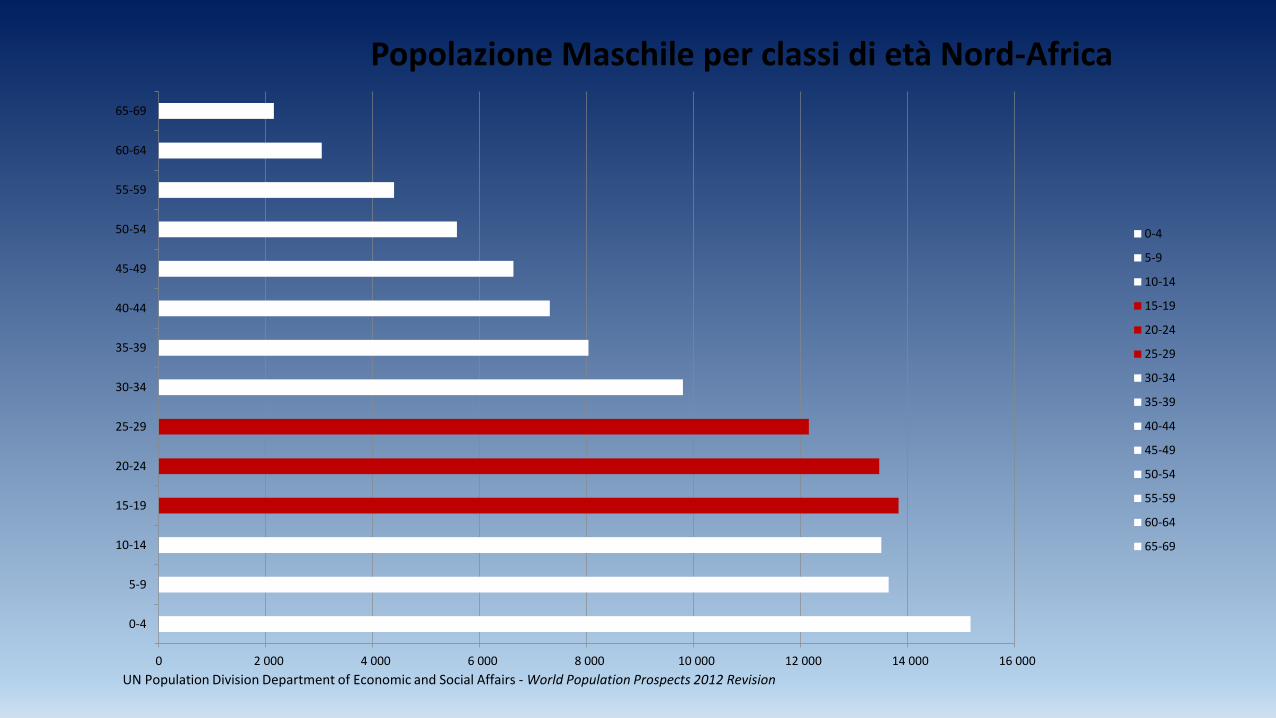
Popolazione Maschile per classi di età Nord-Africa
0-4
5-9
10-14
15-19
20-24
25-29
30-34
35-39
40-44
45-49
50-54
55-59
60-64
65-69
UN Population Division Department of Economic and Social Affairs - World Population Prospects 2012 Revision
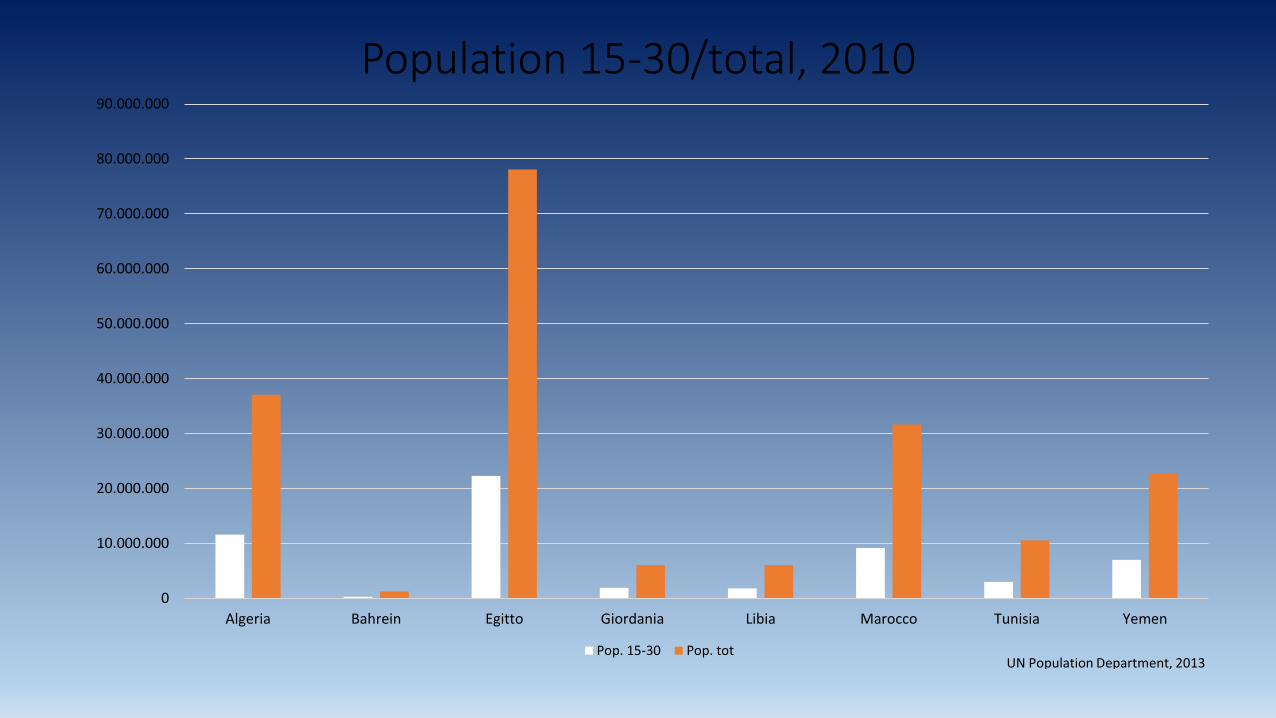
Population 15-30/total, 2010
0
10.000.000
20.000.000
30.000.000
40.000.000
50.000.000
60.000.000
70.000.000
80.000.000
90.000.000
Algeria Bahrein Egitto Giordania Libia Marocco Tunisia Yemen
Pop. 15-30 Pop. tot UN Population Department, 2013
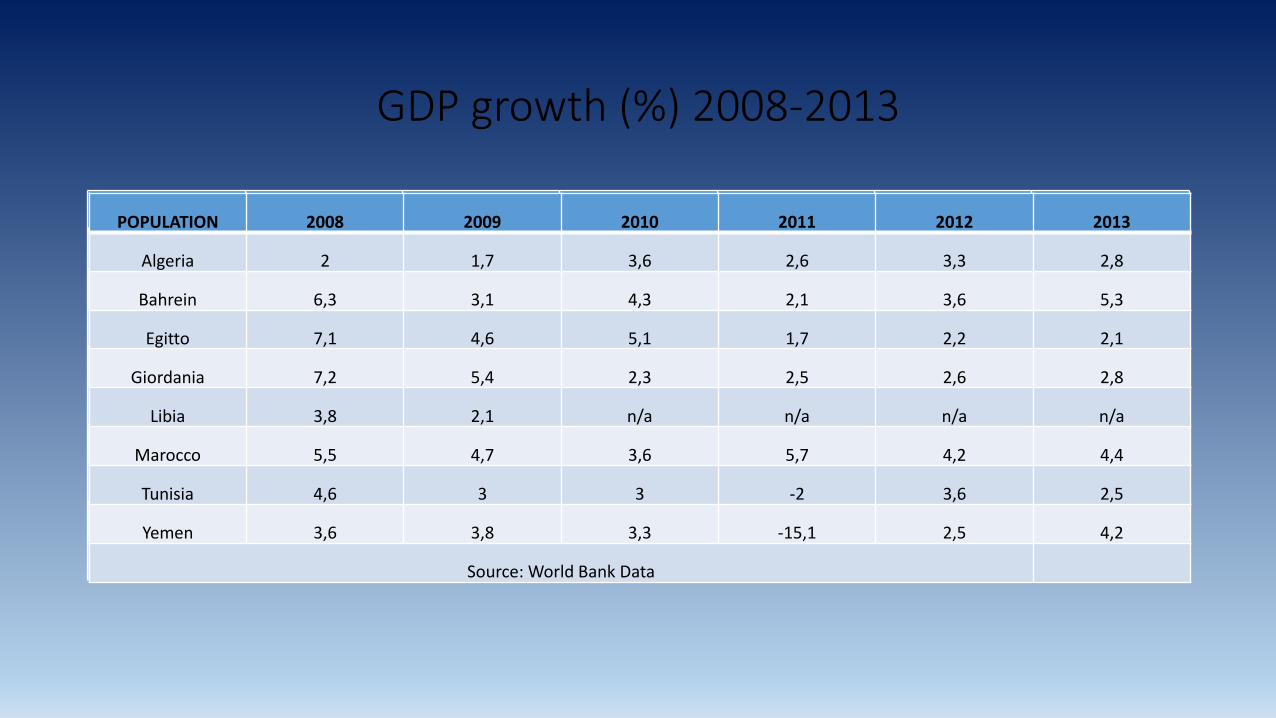
GDP growth (%) 2008-2013
POPULATION 2008 2009 2010 2011 2012 2013
Algeria 2 1,7 3,6 2,6 3,3 2,8
Bahrein 6,3 3,1 4,3 2,1 3,6 5,3
Egitto 7,1 4,6 5,1 1,7 2,2 2,1
Giordania 7,2 5,4 2,3 2,5 2,6 2,8
Libia 3,8 2,1 n/a n/a n/a n/a
Marocco 5,5 4,7 3,6 5,7 4,2 4,4
Tunisia 4,6 3 3 -2 3,6 2,5
Yemen 3,6 3,8 3,3 -15,1 2,5 4,2
Source: world bank data
POPULATION 2008 2009 2010 2011 2012 2013
Algeria 2 1,7 3,6 2,6 3,3 2,8
Bahrein 6,3 3,1 4,3 2,1 3,6 5,3
Egitto 7,1 4,6 5,1 1,7 2,2 2,1
Giordania 7,2 5,4 2,3 2,5 2,6 2,8
Libia 3,8 2,1 n/a n/a n/a n/a
Marocco 5,5 4,7 3,6 5,7 4,2 4,4
Tunisia 4,6 3 3 -2 3,6 2,5
Yemen 3,6 3,8 3,3 -15,1 2,5 4,2
Source: World Bank Data
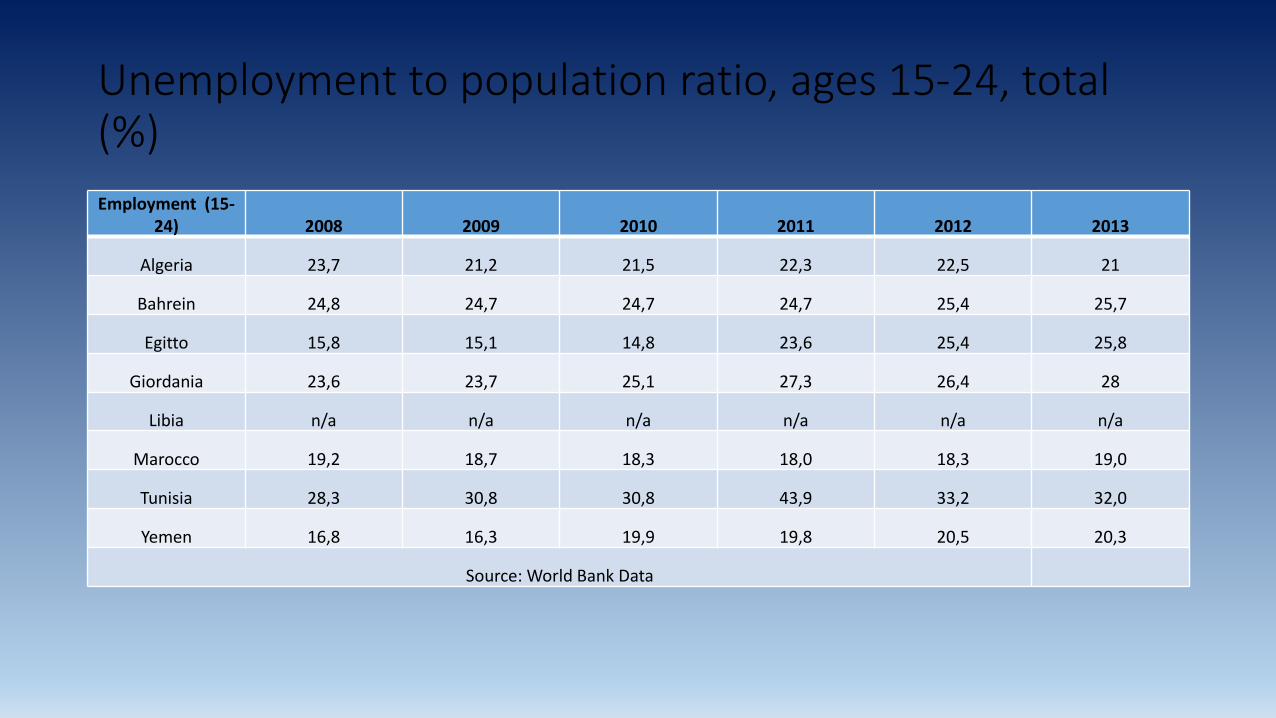
Unemployment to population ratio, ages 15-24, total (%)
Employment (15-24) 2008 2009 2010 2011 2012 2013
Algeria 23,7 21,2 21,5 22,3 22,5 21
Bahrein 24,8 24,7 24,7 24,7 25,4 25,7
Egitto 15,8 15,1 14,8 23,6 25,4 25,8
Giordania 23,6 23,7 25,1 27,3 26,4 28
Libia n/a n/a n/a n/a n/a n/a
Marocco 19,2 18,7 18,3 18,0 18,3 19,0
Tunisia 28,3 30,8 30,8 43,9 33,2 32,0
Yemen 16,8 16,3 19,9 19,8 20,5 20,3
Source: World Bank Data
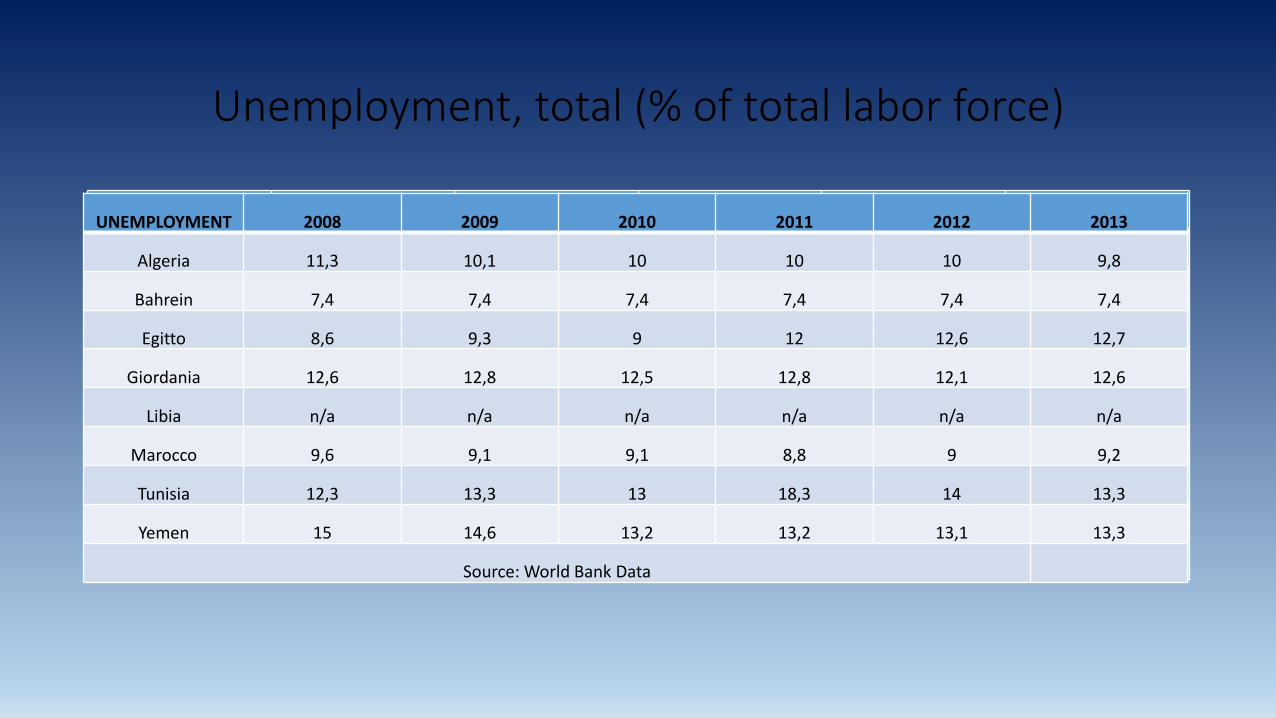
Unemployment, total (% of total labor force)
UNEMPLOYMENT 2008 2009 2010 2011 2012
Algeria 11,3 10,1 10 10 10
Bahrein 1,1 1,1 1,1 1,1 1,1
Egitto 8,6 9,3 9 12 12,6
Giordania 12,6 12,8 12,5 12,8 12,1
Libia n/a n/a n/a n/a n/a
Marocco 9,6 9,1 9,1 8,8 9
Tunisia 12,3 13,3 13 18,2 20,5
Yemen 15 14,6 17,7 n/a n/a
Source: World Bank Data
UNEMPLOYMENT 2008 2009 2010 2011 2012 2013
Algeria 11,3 10,1 10 10 10 9,8
Bahrein 7,4 7,4 7,4 7,4 7,4 7,4
Egitto 8,6 9,3 9 12 12,6 12,7
Giordania 12,6 12,8 12,5 12,8 12,1 12,6
Libia n/a n/a n/a n/a n/a n/a
Marocco 9,6 9,1 9,1 8,8 9 9,2
Tunisia 12,3 13,3 13 18,3 14 13,3
Yemen 15 14,6 13,2 13,2 13,1 13,3
Source: World Bank Data
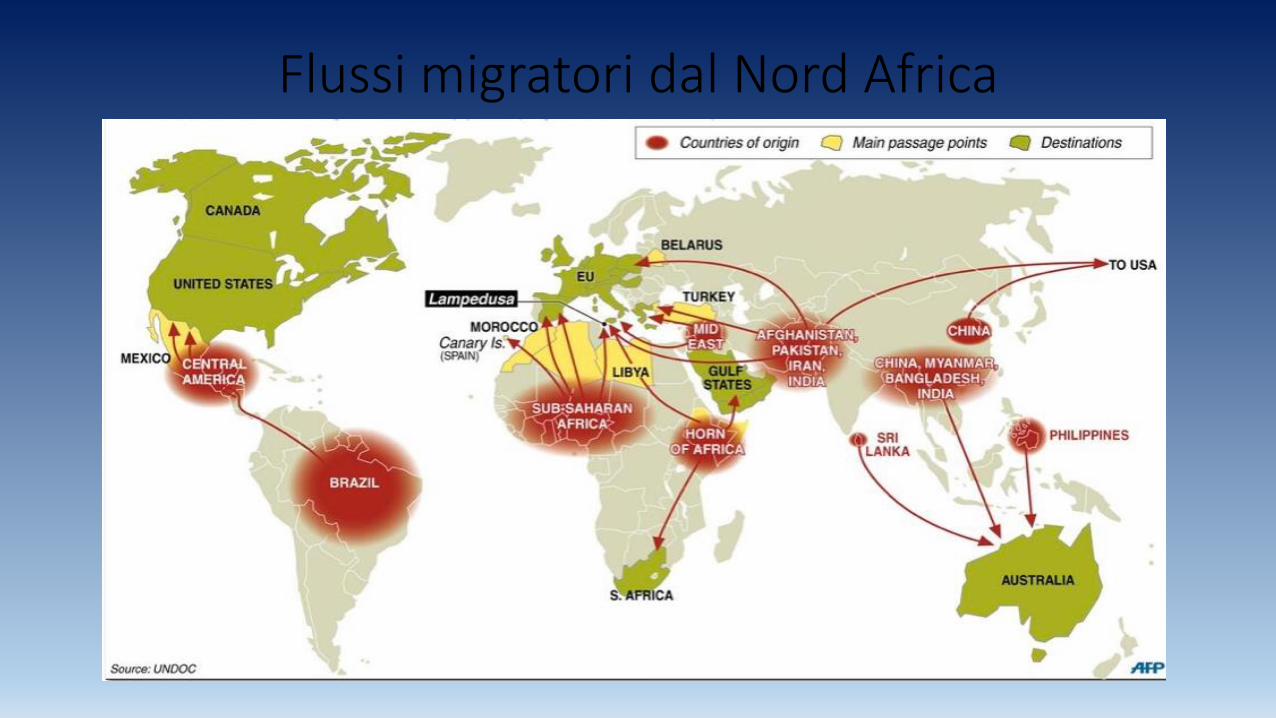
Flussi migratori dal Nord Africa
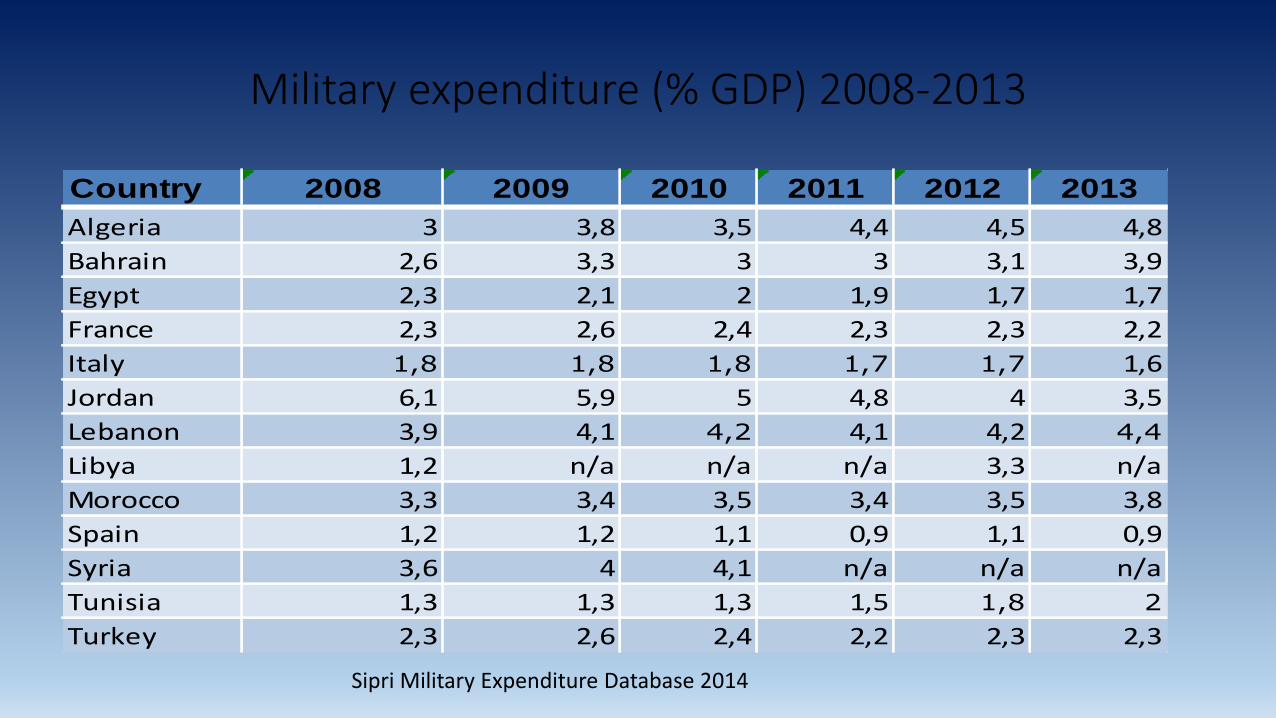
Military expenditure (% GDP) 2008-2013
Country 2008 2009 2010 2011 2012 2013
Algeria 3 3,8 3,5 4,4 4,5 4,8
Bahrain 2,6 3,3 3 3 3,1 3,9
Egypt 2,3 2,1 2 1,9 1,7 1,7
France 2,3 2,6 2,4 2,3 2,3 2,2
Italy 1,8 1,8 1,8 1,7 1,7 1,6
Jordan 6,1 5,9 5 4,8 4 3,5
Lebanon 3,9 4,1 4,2 4,1 4,2 4,4
Libya 1,2 n/a n/a n/a 3,3 n/a
Morocco 3,3 3,4 3,5 3,4 3,5 3,8
Spain 1,2 1,2 1,1 0,9 1,1 0,9
Syria 3,6 4 4,1 n/a n/a n/a
Tunisia 1,3 1,3 1,3 1,5 1,8 2
Turkey 2,3 2,6 2,4 2,2 2,3 2,3
Sipri Military Expenditure Database 2014
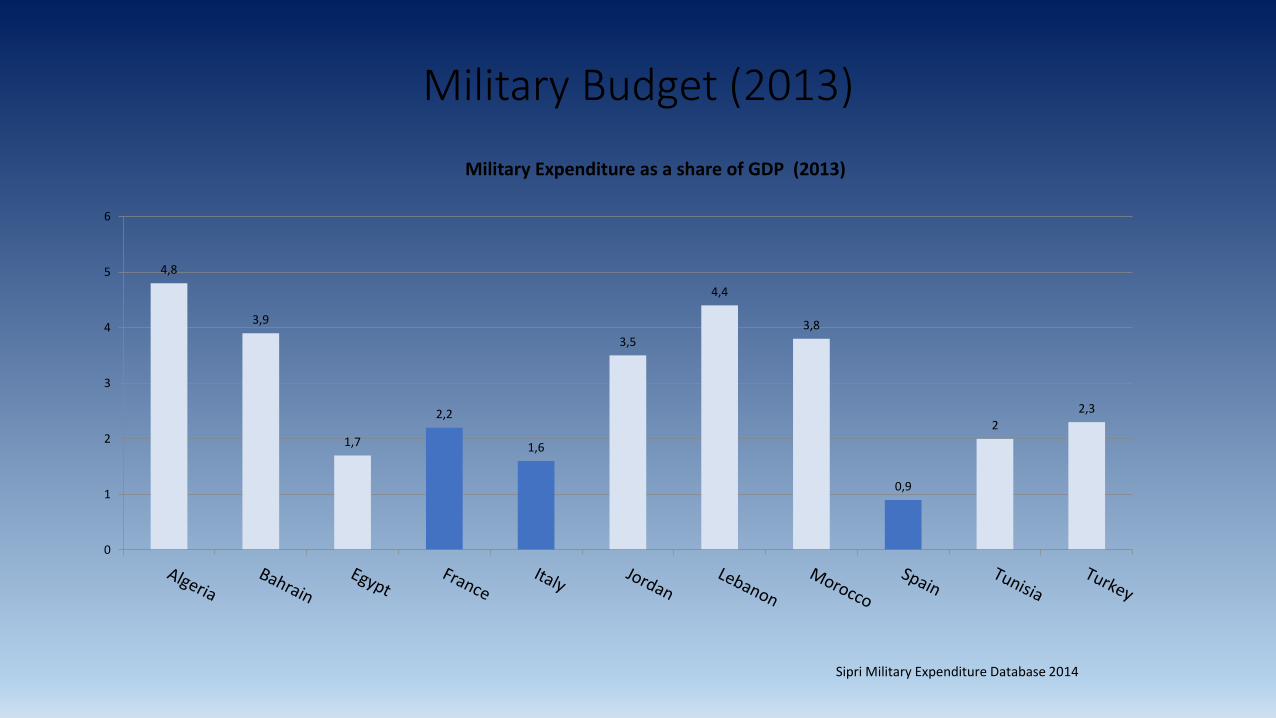
Military Budget (2013)
4,8
3,9
1,7
2,2
1,6
3,5
4,4
3,8
0,9
2
2,3
0
1
2
3
4
5
6
Military Expenditure as a share of GDP (2013)
Sipri Military Expenditure Database 2014
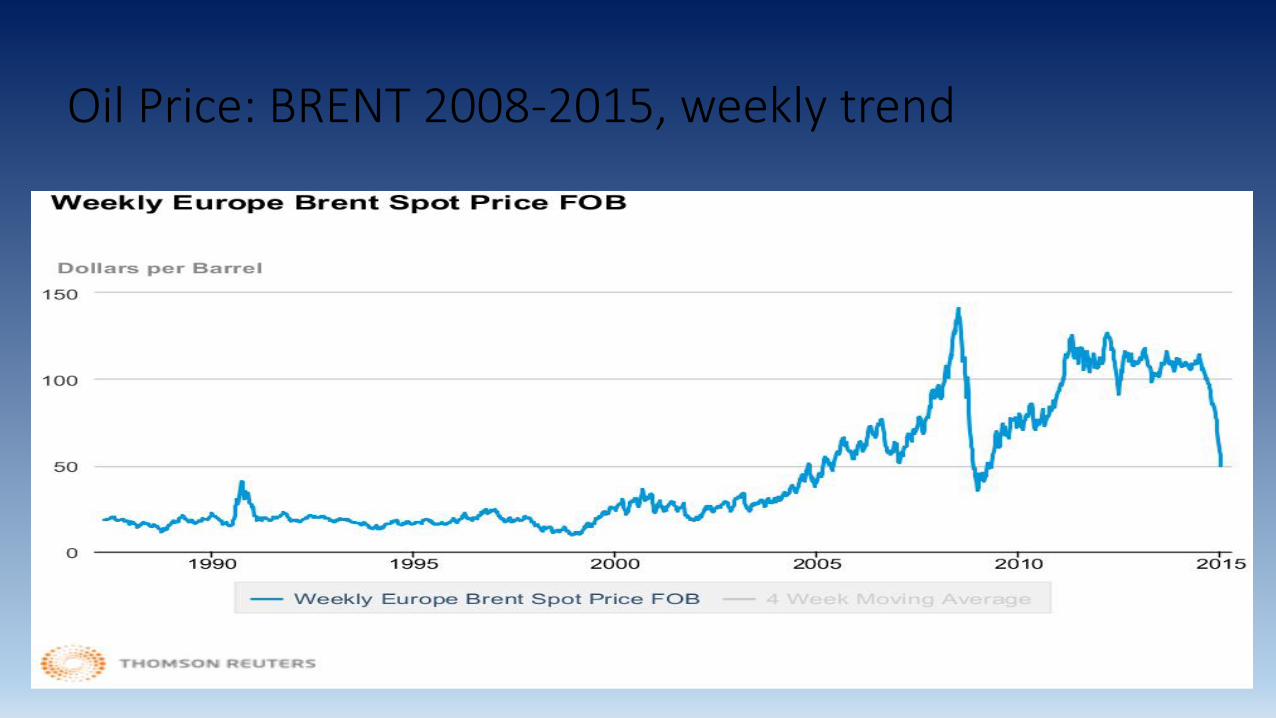
Oil Price: BRENT 2008-2015, weekly trend
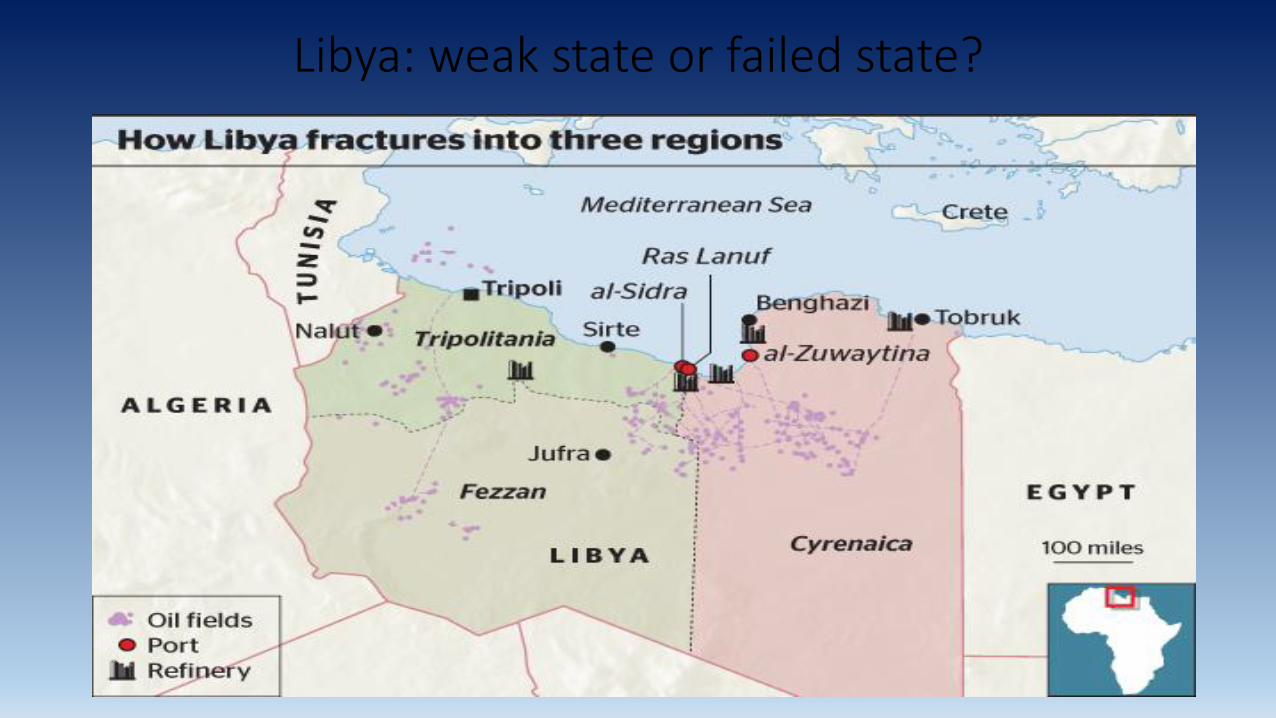
Libya: weak state or failed state?