
Instituto Interuniversitario de Investigación del Sistema ...
172
Instituto Interuniversitario de Investigación del Sistema Tierra en Andalucía (IISTA) Programa de Doctorado de Dinámica de Flujos Biogeoquímicos y sus Aplicaciones Universidad de Granada Incorporating a risk assessment procedure into submarine outfall projects and application to Portuguese case studies Doctoral Thesis Ana Cristina Santos Mendonça Advisors: Miguel Ángel Losada Maria da Graça Neves May 2014
Transcript of Instituto Interuniversitario de Investigación del Sistema ...

Instituto Interuniversitario de Investigación del Sistema Tierra en Andalucía (IISTA)
Programa de Doctorado de Dinámica de Flujos Biogeoquímicos y sus Aplicaciones
Universidad de Granada
Incorporating a risk assessment procedure into submarine outfall projects and application to Portuguese case studies
Doctoral Thesis
Ana Cristina Santos Mendonça Advisors: Miguel Ángel Losada
Maria da Graça Neves May 2014

Editor: Editorial de la Universidad de GranadaAutor: Ana Cristina Santos Mendonça D.L.: GR 1951-2014ISBN: 978-84-9083-116-8

III
El doctorando Ana Cristina Santos Mendonça y los directores de la tesis Miguel Ángel
Losada y Maria da Graça Neves , garantizamos, al firmar esta tesis doctoral, que el trabajo
ha sido realizado por el doctorando bajo la dirección de los directores de la tesis y hasta
donde nuestro conocimiento alcanza, en la realización del trabajo, se han respetado los
derechos de otros autores a ser citados, cuando se han utilizado sus resultados o
publicaciones.
Granada, a 11 de abril de 2014.
Director/es de la tesis: Doctorando:
Fdo.: Fdo.:


V


VII
Acknowledgments
First and foremost I offer my sincerest gratitude to my supervisors, Dr. Miguel Ángel Losada and Dr.
Maria Graça Neves, who have supported me throughout my thesis with their patience and knowledge
whilst allowing me the room to work in my own way. I attribute the level of my PhD degree to their
encouragement and effort and without them this thesis, too, would not have been completed or
written.
I would like to thank Dr. Sebastian Solari, from the Universidad de la República, who was involved in
this project from the start and was a great help in the development of the thesis.
I would like to thank the Department of Hydraulics, Harbours and Maritime Structures Division that has
provided the support and equipment needed to produce and complete my thesis and Foundation for
Science and Technology that has funded my PhD.
I would like to thank my family, especially my mother and my life partner for always believing in me, for
their continuous love and their supports in my decisions. Without whom I could not have made it here.


IX
Abstract
Coastal waters are an integral part of the natural environment. Careful planning and
management is needed to protect and conserve them, and to ensure that the water supply is
useful for a variety of uses. The project of submarine outfalls is a complex problem for
solving because equal significance should be given to the environment, economy and social
aspect of the problem.
Moreover, according to the new paradigm of water pollution, water quality is closely
connected to aquatic ecological and biological characteristics. This is reflected in the new
European Union Water Framework Directive (EU WFD 2000/60), where the ecological health
of aquatic ecosystems is described not only in terms of the concentration of specific physico-
chemical substances but also by biological indices indicating the status of the aquatic
ecosystems.
The above means that, when designing a submarine outfall, solutions must be
economically acceptable, both for population and stakeholders, and should contribute to the
improvement of environmental protection and sustainability. The solutions should also be
flexible enough to be constantly upgraded and improved in order to fulfill expected
environment protection requirements.
The aim of this work is the development of an application of probabilistic and optimization
methods in the context of a risk management approach to the project of submarine outfalls
concerning outfall exploitation (discharge, dispersion and pollutant transport). The risk
assessment method developed aims to specify the probability that the outfall fails or stops
operating, stating the possible consequences of such a failure or stoppage to populations
and environment.
The first step of the study was the development of an engineering procedure, adapted
from the Spanish Recommendations for maritime structures, ROM 0.0, for the specifications
of requirements and target design levels of submarine outfall projects focusing on their
influence on the environment, economy and served populations. The procedure for
calculating target design levels determines if a project satisfies the safety, serviceability, and
exploitation requirements for the recommended levels of reliability, functionality, and
operationality during all of the project phase. The identification of these design levels makes
it possible to estimate the useful life of the structure, the maximum admissible joint
probability of failure against the principal failure modes, the minimum operationality, the
X
admissible average number of technical breakdowns and the maximum admissible duration
of an operational stoppage.
The engineering procedure developed for the specification of requirements and target
design levels of submarine outfall projects is supported and bound to next step of the study:
the development of a risk assessment procedure for operational failure estimation and
application to project design alternatives. The procedure aims to verify if the proposed design
alternatives for a submarine outfall satisfies the design target levels dependent of the
operational intrinsic nature of the structure.
The methodology provides information about the conditions of the receiving medium,
predicting a long-term behaviour of the plume near the coastline, through the application of
Monte Carlo simulations, which allows a multicriteria and an adaptative design of these
structures assuring that they will remain operational during their useful life.
The risk assessment procedure is proposed for operational limit states focusing on three
main topics: environmental legislative framework, climate agents on the coastline and
effluent fate and distribution. The probability of occurrence of failure in the useful life is
calculated by applying Level III Verification Methods (Monte Carlo simulations) using the
methodology developed by Solari and Losada (2013).The results obtained help identifying
the structure’s probability of failure or stoppage and the definition of operational target design
levels enabling decision on project design alternatives.
Moreover, an operational short-term forecast methodology is here proposed for the
management of submarine outfalls providing information to deal with the marine environment
problems and to satisfy needs at different levels for coastal communities. From a
management perspective the forecast methodology will support decision making by
predicting where a discharged plume is likely to be transported over a few days from its last
known location.
The methodology can be also applied in the development of a tool for the operational
management of submarine outfalls with real time information on the receiving medium and
using this information to predict the plume behaviour near the coastline. This contributes to
an adaptive management in the operationality of these structures and, when fully developed
assist the local and regional planning and management for outfall projects with the necessary
flexibility to adapt to the favorable conditions of the marine environment, maximizing dilution
and minimizing effluent impact.

XI
The last step of the overall methodology aims to establish procedures enabling the
evaluation of the environmental risks associated with stressors/contaminants impacting on
areas around submarine outfalls and assessment of both bathing waters and the pelagic and
benthic environment, together with marine biodiversity. The above is accomplished with the
development of an encounter-probabilistic methodology to evaluate residence times of
marine species in effluent plumes. The calculation of residence times for species allows
identifying when concentration would become dangerously high or remain high for an
extended period of time.
The final objective is to incorporate marine biodiversity life cycles in the design of
submarine outfalls offering an understanding of stressor levels that can cause significant
impact on marine benthic communities and a more rigorous basis on which to establish
critical thresholds to preserve marine resources and to effectively conserve coastal
biodiversity.
The overall methodology aims to provide a rational and systematic procedure for
automatic and optimal design of submarine outfalls granting a cost optimization of this type of
projects, reducing submarine outfall accidents and their environmental dramatic
consequences.
XII
Sumario
Las aguas costeras son una parte integral del medio ambiente natural. Es necesaria una
planificación y un manejo cuidadoso de esas águas para proteger y conservar el medio
ambiente y para asegurar el suministro de aguapara una variedad de usos. El proyecto de
emisarios submarinos es un problema complejo de resolver, porque la misma importancia se
debe dar al medio ambiente, a la economía y al aspecto social del problema.
Por otra parte, de acuerdo con el nuevo paradigma de la contaminación del agua, la
calidad del agua está estrechamente relacionada con las características ecológicas y
biológicas acuáticas. Esto se refleja en la nueva Directiva de la Unión Europea, la Directiva
Marco del Agua (DMA UE 2000/60), donde la salud ecológica de los ecosistemas acuáticos
se describe no sólo en términos de la concentración de determinadas sustancias físico-
químicas, sino también por los índices biológicos que indican el estado de los ecosistemas
acuáticos. Así, en el diseño de un emisario submarino, las soluciones deben ser
económicamente aceptables, tanto para la población como para las partes interesadas, y
deben contribuir a la mejora de la protección del medio ambiente y a su sostenibilidad. Las
soluciones también deben ser lo suficientemente flexibles como para ser constantemente
actualizadas y mejoradas con el fin de cumplir con los requisitos previstos de protección del
medio ambiente.
El objetivo de este trabajo es el desarrollo de una metodología que incluye una
aplicación de métodos probabilísticos y de optimización en el contexto de la la gestión de
riesgos en el proyecto de emisarios submarinos enfocada a la explotación del emisario
(descarga, dispersión y transporte de contaminantes). El método de evaluación de riesgos
desarrollado tiene como objetivo especificar la probabilidad de que el emisario falle o deje de
funcionar, indicando las posibles consecuencias de un fallo o interrupción de funcionamento
del emisário para la población y para el medio ambiente.
El primer paso del estudio fue el desarrollo de un procedimiento de ingeniería, una
adaptación de las Recomendaciones para Obras Marítimas españolas, ROM 0.0, para las
especificaciones de los requisitos y niveles de diseño de los proyectos de emisarios
submarinos centrados en su influencia sobre el medio ambiente, la economía y en el servicio
a las poblaciones. El procedimiento para el cálculo de los niveles de diseño determina si un
proyecto cumple con los requisitos de seguridad, servicio y explotación para los niveles
recomendados de fiabilidad, funcionalidad y operatividad durante toda la fase del proyecto.

XIII
La identificación de estos niveles de diseño hace posible estimar la vida útil de la
estructura, la probabilidad conjunta máxima admisible de fallar contra los principales modos
de fallo, la operatividad mínima, el número medio admisible de fallos técnicos y la duración
máxima admisible de una parada operativa.
El procedimiento desarrollado para la especificación de requisitos y niveles de diseño de
los proyectos de emisarios submarinos es compatible y está vinculado a la siguiente etapa
del estudio: el desarrollo de un procedimiento de evaluación de riesgos para la estimación
de fallo operativo y su aplicación en el proyecto de alternativas de diseño. El procedimiento
tiene por objeto verificar si las alternativas de diseño propuestos para un emisario submarino
cumplen con los niveles de diseño fijados, que a su vez dependen de la naturaleza operativa
intrínseca de la estructura.
La metodología proporciona información acerca de las condiciones del medio receptor,
prediciendo el comportamiento a largo plazo de la pluma cerca de la costa, a través de la
aplicación de simulaciones de Monte Carlo, que permiten un diseño multi-criterio y
adaptativo de estas estructuras asegurando que van a seguir funcionando durante su vida
útil.
Se propone un procedimiento de evaluación de riesgo de los estados límites
operacionales centrado en tres temas principales: el marco legislativo ambiental, los agentes
climáticos sobre la costa y el destino y la distribución de efluentes. La probabilidad de
ocurrencia de fallos en la vida útil de la estructura se calcula mediante la aplicación de
Métodos de verificación de Nivel III (simulaciones de Monte Carlo) utilizando la metodología
desarrollada por Solari y Losada (2013). Los resultados obtenidos son una ayuda a la
identificación de la probabilidad de fallo o parada de la estructura y en la detención y la
definición de los niveles de diseño operacional permitiendo una tomada de decisión sobre
las alternativas de diseño del proyecto.
Por otra parte, se propone una metodología de pronóstico operativo a corto plazo para la
gestión de los emisarios submarinos que proporciona información para hacer frente a los
problemas del medio ambiente marino y para satisfacer las necesidades existentes en los
diferentes niveles en las comunidades costeras. Desde una perspectiva de gestión, la
metodología de previsión apoyará la toma de decisiones mediante la predicción del
movimiento de la pluma descargada por el emisario en un dado punto durante algunos días.
La metodología puede ser aplicada en el desarrollo de una herramienta para la gestión
operativa de los emisarios submarinos con información en tiempo real sobre el medio
receptor y utilizando esta información para predecir el comportamiento de la pluma cerca de

XIV
la costa. Esta información contribuye a una gestión adaptativa de la operatividad de estas
estructuras y, una vez totalmente desarrollada, permitirá apoyar a la planificación y gestión
local y regional de proyectos de emisarios con la flexibilidad necesaria para adaptarse a las
condiciones favorables del medio marino, lo que maximiza la dilución y minimiza el impacto
de los efluentes.
El último paso de la metodología general tiene por objeto establecer procedimientos que
permitan la evaluación de los riesgos ambientales asociados a factores
estresantes/contaminantes que afectan a las áreas alrededor de los emisarios submarinos y
a la evaluación tanto de las aguas de baño como el medio ambiente pelágico y bentónico,
junto con la diversidad biológica marina.
Lo anterior se logra con el desarrollo de una metodología probabilista de encuentro para
evaluar los tiempos de permanencia de las especies marinas en la presencia de plumas de
efluentes. El cálculo de los tiempos de residencia para las especies permite la identificación
de cuando la concentración se convertiría en peligrosamente alta o cuando permanecerá
alta durante un período prolongado de tiempo.
El objetivo final es incorporar ciclos de vida de la biodiversidad marina en el diseño de
emisarios submarinos que ofrecen una comprensión de los niveles de factores de estrés que
pueden causar un impacto significativo en las comunidades bentónicas marinas y sean una
base más rigurosa que permita establecer umbrales críticos para preservar los recursos
marinos y para conservar eficazmente la biodiversidad costera.
La metodología general tiene como objetivo proporcionar un procedimiento racional y
sistemático para el diseño automático y óptimo de los emisarios submarinos que otorga la
optimización de los costes de este tipo de proyectos, reduciendo los accidentes del emisario
submarino y sus dramáticas consecuencias ambientales.
XV
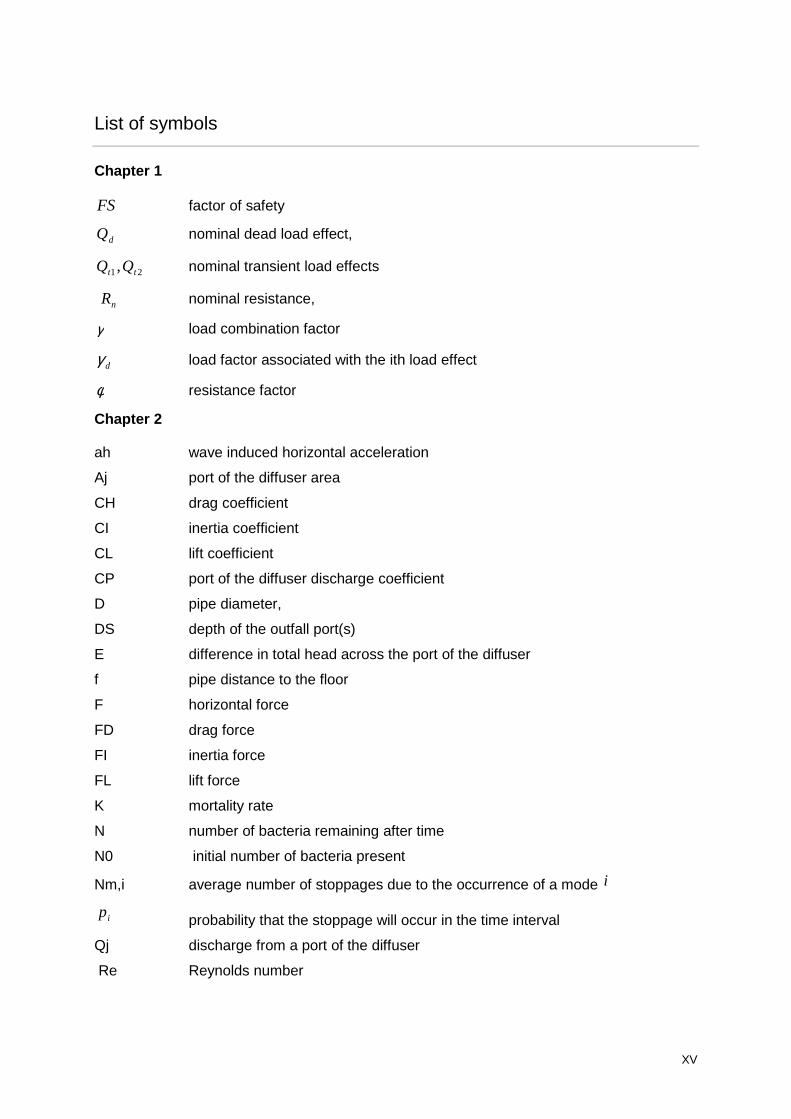
List of symbols
Chapter 1
FS factor of safety
dQ nominal dead load effect,
21 , tt QQ nominal transient load effects
nR nominal resistance,
γ load combination factor
dγ load factor associated with the ith load effect
φ resistance factor
Chapter 2
ah wave induced horizontal acceleration
Aj port of the diffuser area
CH drag coefficient
CI inertia coefficient
CL lift coefficient
CP port of the diffuser discharge coefficient
D pipe diameter,
DS depth of the outfall port(s)
E difference in total head across the port of the diffuser
f pipe distance to the floor
F horizontal force
FD drag force
FI inertia force
FL lift force
K mortality rate
N number of bacteria remaining after time
N0 initial number of bacteria present
Nm,i average number of stoppages due to the occurrence of a mode i
ip probability that the stoppage will occur in the time interval
Qj discharge from a port of the diffuser
Re Reynolds number

XVI
T90 time needed for reduction of enteric bacterial populations in seawater to 90
percent of their original concentrations
U horizontal wave-induced velocity
V time intervals
im,τ average duration of the stoppage
v kinematic viscosity of sea water
∆h head differential
γS specific weight of seawater
γE specific weight of effluent
Chapter 4
CM pollutant concentration at the station M
Cp percentile of the allowed pollutant concentration
N number of observations
P probability; fixed level of confidence
pF probability that the maximum annual value X exceeds xo
r number of times of certain observation
T return period
Chapter 6
c concentration
Di, i=x, y or z dispersion coefficients in the “i” direction
F water quality process
n Manning law coefficient
Ui, i=x, y or z velocity in the “I” direction

XVII
Contents
1 | Introduction ....................................................................................................................................25
1.1 Motivation and framework ...................................................................................................25
1.2 Objectives and outline .........................................................................................................29
1.3 Structure of the document ...................................................................................................31
2 | Submarine outfalls general considerations ...................................................................................33
2.1 Introduction .........................................................................................................................33
2.2 Functional design of submarine outfalls .............................................................................34
Water quality objectives .........................................................................................35 2.2.1
Mechanisms and prediction of effluent fate and transport .....................................37 2.2.2
2.2.2.1 Manifold processes ................................................................................39
2.2.2.2 Near-field processes ..............................................................................39
2.2.2.3 Intermediate-field processes .................................................................40
2.2.2.4 Far-field processes ................................................................................40
Potential microbial stressors and potential receptors ............................................41 2.2.3
2.3 Structural design of submarine outfalls ...............................................................................42
Structural integrity and stability of the pipe ............................................................43 2.3.1
2.3.1.1 Horizontal forces ....................................................................................44
2.3.1.2 Vertical forces ........................................................................................45
2.3.1.3 Internal and external horizontal forces ..................................................45
2.3.1.4 Stability of submarine pipelines lying on the seabed .............................46
2.3.1.5 Diffuser ..................................................................................................46
2.4 From the deterministic to risk design approach of submarine outfalls................................49
Failure modes and limit states for submarine outfalls ...........................................52 2.4.1
2.5 Conclusions.........................................................................................................................57
3 | Intrinsic Nature of a Submarine Outfall .........................................................................................59
3.1 Introduction .........................................................................................................................59
3.2 Calculation procedure: specification of target design levels ..............................................60
3.3 General and operational intrinsic nature .............................................................................61
Economic Repercussion Index ..............................................................................62 3.3.1
Social and Environmental Repercussion Index .....................................................64 3.3.2
Minimum Useful Life ..............................................................................................65 3.3.3
Operational Index of Economic Repercussion.......................................................65 3.3.4
Operational Index of Social and Environmental Repercussion .............................66 3.3.5
Use and Exploitation of a Structure during its Useful Life .....................................67 3.3.6
3.3.6.1 Average Number of Stoppages .............................................................67
3.3.6.2 Maximum Duration of Stoppage ............................................................68
3.4 Limit States and Failure Modes for Submarine Outfalls .....................................................69
Maximum safety and serviceability. Probability of failure ......................................69 3.4.1
3.4.1.1 Failure Modes ascribed to Ultimate Limit States: Safety requirements ..........................................................................................70
3.4.1.2 Failure Modes ascribed to Serviceability Limit States: Serviceability requirements ...................................................................70
Minimum operationality. Requirements for Operational Stoppage Modes ............71 3.4.2

XVIII
3.5 Case Studies .......................................................................................................................72
3.6 Conclusions.........................................................................................................................79
4 | Incorporating a risk assessment procedure into submarine outfall projects .................................81
4.1 Introduction .........................................................................................................................81
4.2 Limit states and failure modes ............................................................................................83
4.3 Verification method and intrinsic nature of the subset ........................................................84
4.4 Operational long-term forecast methodology ......................................................................85
Effluent impact on aquatic environment and associated uses...............................87 4.4.1
4.4.1.1 Compliance with the Legislative Framework .........................................87
4.4.1.2 Identification of Coastal and Maritime Values .......................................90
Coastal forcing agents simulation ..........................................................................91 4.4.2
Numerical modelling ..............................................................................................94 4.4.3
Empirical orthogonal function ................................................................................95 4.4.4
Effluent fate and distribution from the discharge ...................................................96 4.4.5
4.4.5.1 Multi-criteria assessment for design ......................................................96
4.5 Case study ..........................................................................................................................98
4.6 Conclusions.......................................................................................................................105
5 | Operational short-term forecast methodology for submarine outfall management .....................107
5.1 Introduction .......................................................................................................................107
5.2 Operational Failure Modes ................................................................................................108
5.3 Methodology......................................................................................................................109
Forecast data .......................................................................................................111 5.3.1
Numerical modeling: hydrodynamic model and particle tracking model .............112 5.3.2
Operational management ....................................................................................113 5.3.3
5.4 Case study ........................................................................................................................115
Generation of the grid and boundary conditions ..................................................115 5.4.1
Input data .............................................................................................................116 5.4.2
Hydrodynamic results ..........................................................................................118 5.4.3
5.5 Conclusions.......................................................................................................................122
6 | Risk assessment of aquatic systems induced by submarine outfalls: probabilistic approach ...............................................................................................................................................125
6.1 Introduction .......................................................................................................................125
6.2 Objectives .........................................................................................................................127
6.3 Methodology......................................................................................................................127
6.4 Water quality standards and marine biodiversity ..............................................................129
6.5 Encounter probability model: contaminant emissions and marine biodiversity ................132
General ................................................................................................................132 6.5.1
Mathematical-probabilistic framework .................................................................134 6.5.2
6.5.2.1 Plume-species encounter model .........................................................134
6.5.2.2 Residence-time model .........................................................................137
Case study: the coastal area of Algarve ..............................................................137 6.5.3
6.6 Conclusions and future developments ..............................................................................139
7 | Conclusions and future research lines ........................................................................................141
Attachments ..........................................................................................................................................149
I Hydrodynamic and water quality modelling.................................................................................151
I.1 Numerical models .............................................................................................................151

XIX
I.1.1 TELEMAC-2D ......................................................................................................152
Mesh generation and boundary conditions ..........................................................152
Model calibration ..................................................................................................152
I.1.2 D-Water Quality tests ...........................................................................................156
Water quality scenarios ........................................................................................157
Water quality model results..................................................................................158
BIBLIOGRAPHY ...................................................................................................................................163

XX
List of figures
Figure 1-1. Thesis framewok. .................................................................................................................30
Figure 2-1 Schematic layout of an outfall system...................................................................................34
Figure 2-2 Pollutant sources and environmental objectives (underlined) in coastal waters (source: [Bleninger, 2006]). .................................................................................................38
Figure 2-3 a) Physical processes that the effluent of a submerged outfall is subjected, b) Typical temporal and spatial scales for transport and mixing processes related to coastal wastewater discharges [Jirka et al., 1976, Fischer et al., 1979]. ...........................38
Figure 2-4 Schematic view of an operating multiport diffuser outfall merged with a laboratory picture of a trapped waste plume in a stratified ambient (modified from Domenichini et al., 2002). ...................................................................................................39
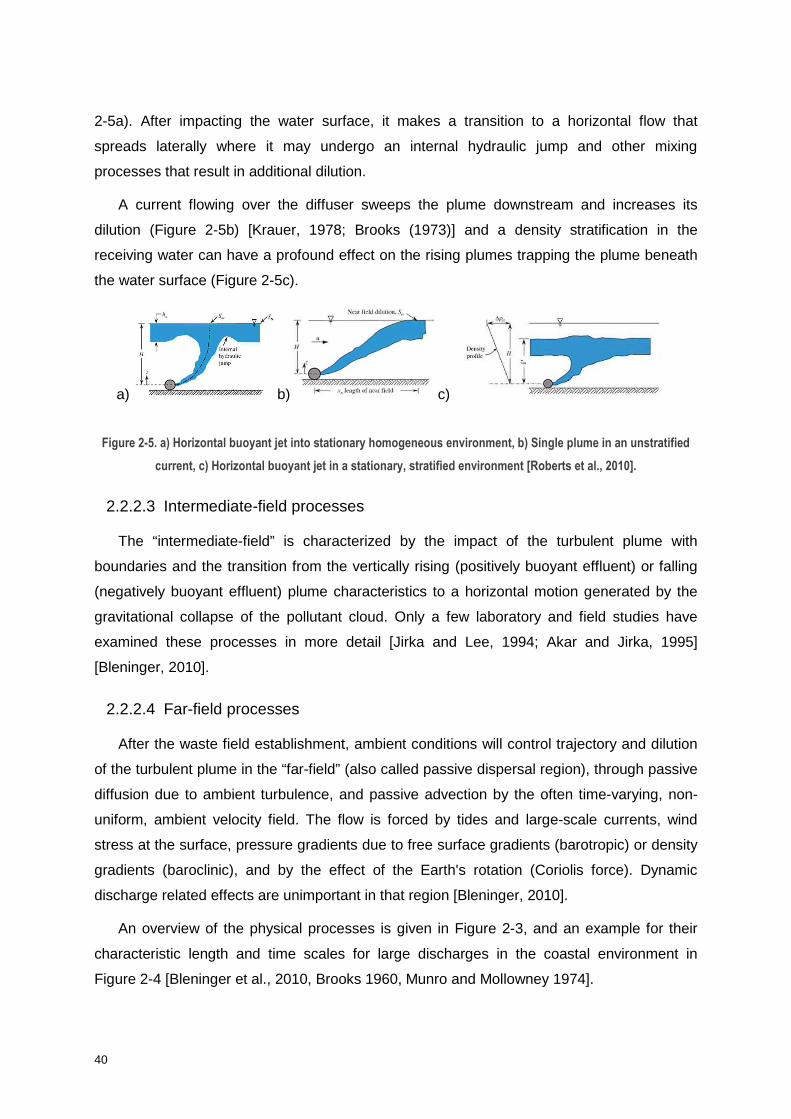
Figure 2-5. a) Horizontal buoyant jet into stationary homogeneous environment, b) Single plume in an unstratified current, c) Horizontal buoyant jet in a stationary, stratified environment [Roberts et al., 2010]. ......................................................................40
Figure 2-6 Forces acting on a pipeline: lift, drag, inertia and resulting forces. .......................................43
Figure 2-7 Straight, Y, and T-diffusers showing plumes for a current parallel to shore. ........................47
Figure 2-8. Pipeline design formats. .......................................................................................................49
Figure 2-9 Design approach evolution (adapted from: [Nessim et al., 2002]). .......................................51
Figure 2-10 Submarine outfall constituents, processes, sensitive receptors and potential ecological effects (adapted from: National Academy of Sciences, 1984). .........................54
Figure 2-11 Schematic layout of an outfall limit states and corresponding failure modes. ....................56
Figure 3-1 Intrinsic nature of a submarine outfall [revised and adapted from the ROM 0.0 (2002)].. ...............................................................................................................................61
Figure 3-2 Evaluation of the economic repercussion index [revised and adapted from the ROM 0.0 (2002) and Losada and Benedicto (2005)]. .........................................................63
Figure 3-3 Evaluation of the OISER [revised and adapted from the ROM 0.0 (2002) and Losada and Benedicto (2005)]. ...........................................................................................67
Figure 3-4 (a) Submarine outfall location for the case studies; (b) Treatment plant of Guia, Cascais; (c) Submarine outfall of Guia. ..............................................................................73
Figure 4-1 Developed methodology scheme..........................................................................................87
Figure 4-2 Coastal usages example for Algarve coastline, Portugal (source: www.snirh.pt). ...............90
Figure 4-3 Empirical (filled color contours) and modeled (black lines) mean annual non-stationary probability density function for wind velocity (left) and wind direction (right). ..................................................................................................................................93
Figure 4-4 Autocorrelation and crosscorrelation of wind speed and direction estimated from the original data series (grey dots) and from the simulated series (green lines). ...............93
Figure 4-5 Original (top) and simulated (bottom) wind speed time series. ............................................94
Figure 4-6 (a) Case study area; (b) Vale de Faro submarine outfall location; (c) Puertos del Estado: Point 1047048 (source: www.puertos.es)..............................................................99
Figure 4-7. Average daily flow for the submarine outfall of Vale de Faro, Albufeira. Period from 1st January – 31th December 2011 (source: WW- Consultores de Hidráulica e Ambiente) ......................................................................................................100
Figure 4-8. Characteristics of the effluent flow entering the WWTP for the period of 31th January 2010 to 17th September 2010 (source:XXX). .....................................................100
Figure 4-9 a) Computational mesh used in TELEMAC-2D, b) Coliform concentration and plume behavior around Vale de Faro submarine outfall (28th February 2023). ...............101
Figure 4-10 Coliform concentration at control points a) P1 and b) P3. ................................................103
Figure 4-11 Spatial patterns of the first three EOF modes, presented as homogeneous correlation maps: a) E1(CF), b) E2(CF), c) E3(CF). .........................................................104

XXI
Figure 5-1. Operational forecast methodology scheme for submarine outfalls. ...................................111
Figure 5-2 CMS-Flow domain and locations of Faro buoy, WANA point and ADCP. ..........................116
Figure 5-3. Wind data used to force the model between 1 – 9 July 2008 (source: www.wunderground.com). ................................................................................................116
Figure 5-4. Wind data used to force the model between 1 – 9 July 2008 (source: www.wunderground.com). ................................................................................................117
Figure 5-5. Wind data used to force the model between 10 – 19 October 2008 (source: www.wunderground.com). ................................................................................................117
Figure 5-6. Wind data used to force the model between 10 – 19 October 2008 (source: www.wunderground.com). ................................................................................................117
Figure 5-7 Calculated and measured water level at Faro buoy. ..........................................................119
Figure 5-8. Snapshot of particle distribution two days after the particle release at the submarine outfall of Vale de Faro. Date: 5th July 2008, 03:00 a.m..................................120
Figure 5-9. Snapshot of particle distribution two days after the particle release at the submarine outfall of Vale de Faro. Date: 19th October 2008, 01:40 a.m. ........................120
Figure 6-1. Risk assessment methodology based on the encounter probability method. ...................128
Figure 6-2. Effects on water quality and species populations from sewage disposal (adapted from: Ganoulis, 2009) .......................................................................................................129
Figure 6-3.A massive kill of estuarine fish at Bayou Chaland, Plaquemines Parish, Louisiana, in September 2010 attributed to dissolved oxygen depletion in areas oiled by the Deepwater Horizon spill (photo by P. J. Hahn). ................................................................131
Figure 6-4. Relative velocity effects between a system and a control volume when both move and deform. The system boundaries move at velocity V, and the control surface moves at velocity Vs (adapted form: White, 2003) ...........................................................134
Figure 6-5. Gamma function and parameters tested. ..........................................................................138
Figure 6-6. Histogram of individuals with a Gamma distribution (A=2 and b=0.05): a) entering the plume, b) exiting the plume. ........................................................................................139
Figure 6-7. Histogram of individuals with a Gamma distribution (A=2 and b=0.5): a) entering the plume, b) exiting the plume. ........................................................................................139
Figure 0-1. Mesh 2: localization of Faro buoy and ADCP. ...................................................................153
Figure 0-2.Space discretization tests: mesh 1 with lower resolution and mesh 2 with higher resolution, in the coastal area. ..........................................................................................153
Figure 0-3. Analysis of tide and wind influence. ...................................................................................154
Figure 0-4. Sensitivity tests with Manning coefficient and calibration with ADCP data........................155
Figure 0-5. Sensitivity tests with turbulence models and calibration with ADCP data. ........................155
Figure 0-6. Sensitivity tests with velocity diffusivity and calibration with ADCP data. ..........................156
Figure 0-7. Sensitivity tests with the coefficient of wind influence and calibration with ADCP data (n=0.02). ....................................................................................................................156
Figure 0-8. Identification of points P13788, P22189, P13788, P26646 and observation area 1. .......................................................................................................................................158
Figure 0-9. Contours of impact probabilities from wastewater discharged at a flow rate 10 m3/s: a) E.coli mean concentration during exceedance time, b) Probability of time exceeding the E. coli MAV. .......................................................................................159
Figure 0-10. Contours of impact probabilities from wastewater discharged at a flow rate 10 m3/s: a) CBO5 mean concentration during exceedance time, b) Probability of time exceeding the CBO5 MAV (5 O2 mg/l) ......................................................................160
Figure 0-11. Variation of a) Ammonium concentration and b) BOD5 concentration, from wastewater discharged at a flow rate of 10 m3/s at observation area 1. ..........................161
Figure 0-12. Variation of a) Dissolved oxygen concentration and b) E. coli concentration, from wastewater discharged at a flow rate of 10 m3/s, at observation area 1. .................161

XXII
Figure 0-13. Variation of E. coli concentration, from wastewater discharged at a flow rate of 10 m3/s, at point P22189; b) dissolved oxygen from wastewater discharged at a flow rate of 10 m3/s, at P13788 .........................................................................................162

XXIII
List of tables
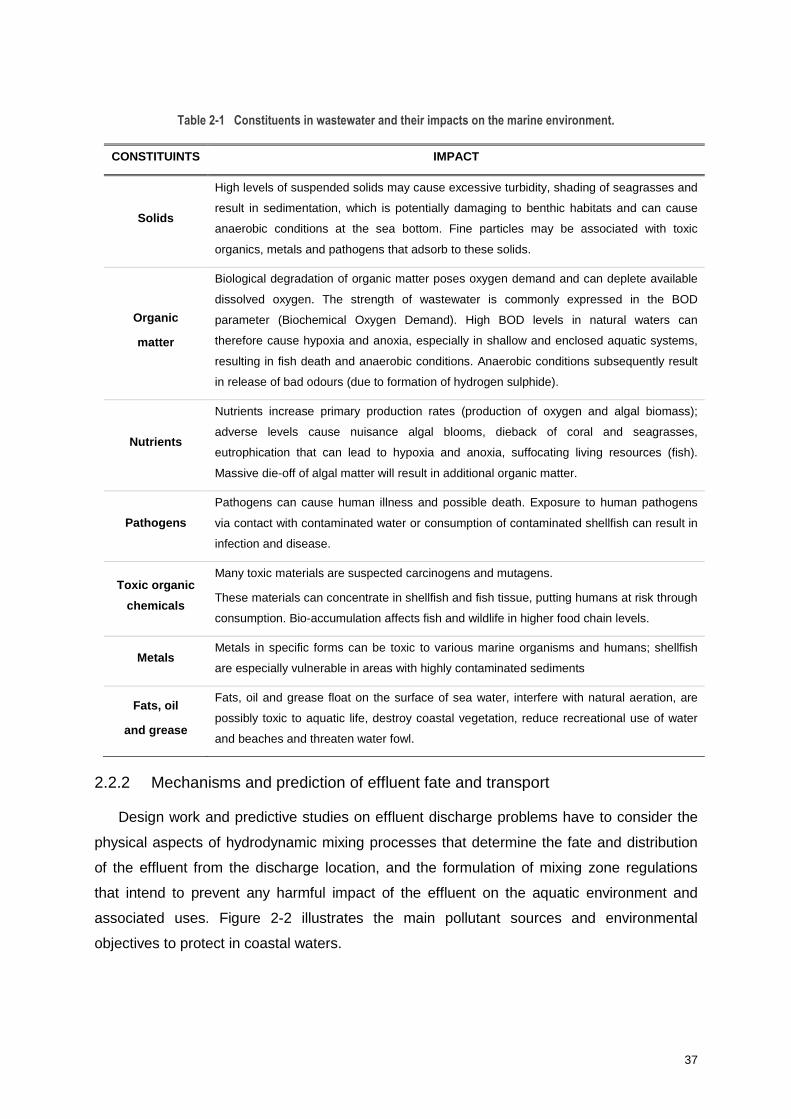
Table 2-1 Constituents in wastewater and their impacts on the marine environment. ........................37
Table 2-2. Orders of magnitude of the decrease of concentration in each phase of the mixing process. ...............................................................................................................................42
Table 2-3 Stability verification of a submarine outfall. ...........................................................................48
Table 2-4 Operational failure modes for submarine outfalls. .................................................................55
Table 3-1 Minimum useful life. ..............................................................................................................65
Table 3-2 Evaluation parameters for the operational index of economic repercussion. ........................66
Table 3-3 Parameters defining the average number of stoppages in the time interval. ........................68
Table 3-4 Probable maximum duration of a stoppage mode (hours). ....................................................69
Table 3-5 Maximum overall probability of failure in the structure’s useful life for ultimate limit states. ..................................................................................................................................70
Table 3-6 Maximum overall probability of failure during the structure’s useful life for serviceability limit states. ....................................................................................................71
Table 3-7. Minimum operationality in the useful life of the structure. .....................................................72
Table 3-8. Submarine outfall characteristics Source: [Seth, 2010; Santos et al., 2011; Reis et al., 2004]. ............................................................................................................................74
Table 3-9 Parameter values of the economic repercussion index (ERI) for the case studies [source: Reis et al., 2004; Seth, 2010]. ...............................................................................76
Table 3-10 Parameter values of the social and environmental repercussion index (SERI) for the case studies. .................................................................................................................77
Table 3-11 Parameter values of the operational index of economic repercussion (OIER) for the case studies. .................................................................................................................78
Table 3-12 Parameter values of operational index of social and environmental repercussion (OISER) for the case studies. .............................................................................................79
Table 4-1. Verification method recommended in accordance with the intrinsic nature of the subset of the structure [adapted from ROM0.0]..................................................................84
Table 4-2 Water and Wastewater Management Legislation for Portugal. .............................................89
Table 5-1. Residence time computations for Albufeira beach and Armação de Pêra beach. .............120
Table 5-2. Residence time computations for Albufeira beach and Armação de Pêra beach for the 8th simulation day .......................................................................................................121
Table 6-1. Overview of common pollution problems (Deltares, 2014). ................................................130
Table 0-1. DELWAQ setup. ..................................................................................................................157
Table 0-2. Residence times and failure probability at 4 observation points and 1 observation area. ..................................................................................................................................162


25
1 | Introduction
1.1 Motivation and framework
Coastal waters are an integral part of the natural environment. Careful planning and
management is needed to protect and conserve them, and to ensure that the water supply is
useful for a variety of uses. The project of submarine outfalls is a complex problem for
solving because equal significance should be given to the environment, economy and social
aspect of the problem.
The project of submarine outfalls requires: i) investment costs and permanent operating
costs; ii) sensitive management: since solutions are directly related to the environment and
population; iii) long-term resolutions: since implementation of problem solution and expected
improvement of environment conditions are slow, while monitoring measures shall be carried
out constantly.
Moreover, according to the new paradigm of water pollution, water quality is closely
connected to aquatic ecological and biological characteristics. This is reflected in the new
European Union Water Framework Directive (EU WFD 2000/60), where the ecological health
of aquatic ecosystems is described not only in terms of the concentration of specific physico-
chemical substances but also by biological indices indicating the status of the aquatic
ecosystems.
The above means that, when designing a submarine outfall, solutions must be
economically acceptable, both for population and stakeholders, and should contribute to the
improvement of environmental protection and sustainability. The solutions should also be
flexible enough to be constantly upgraded and improved in order to fulfill expected
environment protection requirements.
In the domains of coastal and maritime engineering, the scientific progress in the last
three decades made it possible to start shifting from a holly empirical knowledge (traditional
approach) towards a more sophisticated and complete approach to reality (a very complex
physical environment). As a result, many scientific tools that had been applied successfully in
other engineering domains (such as offshore and structural engineering) have started being
applied to coastal and maritime engineering as well.
Applied design methods, usually site- and material-specific, require often different design
parameters, and vary considerably in reliability. As a result, engineers experience particular

26
difficulties when comparing alternative options for new structures and are very restricted in
calculations of failure risk and residual life. Bringing more worldwide uniformity in design
approaches is a very important factor for overall improvement of reliability of coastal
structures. However, proper functioning of hydraulic and coastal structures as an instrument
in solving water management and coastal problems is even a more important aspect. Both of
these components include risks. Managing these risks, equally when there is a strong man-
made (e.g. structure) or nature-made component (e.g. climate agents), basically means
assessing alternative options under uncertainty [Pilarzark, 2000].
Risk management in coastal and maritime engineering has been developed for structures
as breakwaters and coastal protection works although it has not yet been fully implemented
in current practice: recommendations for projects of maritime structures (e.g. [Puertos2002],
[USACE2003], [CIRIA2007]) include the application of probabilistic and optimization
techniques. However, their application has been restricted essentially to harbour and coastal
protection structures (e.g. [Burcharth2000], [Oumeraci2001]) and conventional design
practice for outfalls is still essentially deterministic.
The methodology presented in the Spanish Recommendations for Maritime Structures,
(ROM Program) [Puertos2002], comprises the leading state of the art knowledge, drawing up
Recommendations that guide both national agencies and private companies in the design,
construction, maintenance, and exploitation of Marine Constructions, particularly Maritime
Structures. The general procedure described in these recommendations includes different
methods to be applied in sequence, which help to determine if a project design alternative
satisfies the safety, serviceability, and exploitation requirements in consonance with the
recommended levels of reliability, functionality, and operationality during all of the project
phases and including the application of probabilistic and optimization techniques.
Concerning the structural safety, the ROM proposes different levels of reliability analysis,
for each of the mutually exclusive and collectively exhaustive modes of failure, depending on
the general and the operational nature of the maritime structure.
Concerning to the environmental water quality and from the engineering point of view, it
is subject to several types of uncertainty. These are related to the high variability in space
and time of the hydrodynamic, chemical and biological processes involved. Quantification of
such uncertainties is essential for the performance and safety of engineering projects.
Risk and reliability analysis provides a general framework to identify uncertainties and
quantify risks. A certain risk of failure in the lifetime of submarine outfalls always exists, due
to the stochastic character of loads and resistance and ideally the probability of failure should
27
be fully quantified in the design process. These methods and criteria should introduce a
sufficient safety margin between load and resistance to prevent severe damage or collapse
of the submarine outfall.
In probabilistic approach, the reliability of the structure is defined as the probability that
the resistance of the structure exceeds the imposed loads. Extensive environmental
(statistical) data is necessary if realistic answers are to be expected from a probabilistic
analysis, and it is one of the reasons why the procedures have not been frequently used in
the past. However, the more uncertainty one has on environmental data and on structure
response calculations, the more important it is to use a probabilistic approach. By using this
approach one can estimate the uncertainties and their influence on the final result.
The project of these structures is both very complex and costly and it involves many
uncertainties related, for example, to loading randomness (e.g. waves, currents), to the
models used to represent reality (e.g. physical/numerical models), etc. This calls for the
application of a risk management approach, based on methodologies which account for
randomness and uncertainty, that incorporate all the existing information and data, that
account for the probability of failure of the structures and its consequences and, finally, that
will grant a cost optimization of the project.
The use of advanced engineering tools, in submarine outfall projects, such as risk
analysis and computerized mathematical modelling techniques, may reduce uncertainties in
the design related with environmental water quality. In fact, various local constraints usually
impose limiting factors on the design of effluent disposal. These are related to the regional
development of the area, the land uses and the economic capabilities of the responsible
sewerage board.
The fate of pollutants, for example, in a water-receiving body, is influenced by the
combination of three mechanisms: (a) advection by currents, (b) turbulent diffusion, and (c)
chemical, biological or other interactions. As a result, data relating to physical and chemical
parameters can show high variability in time, for typical time series of, for example, water
temperature and nitrate concentration. Accordingly, coastal engineering must deal with
environmental events and their random nature, thus, the response to the problem has to
include the associated uncertainty, among others, to the occurrence of the atmospheric and
maritime agents and the impact of forces around the submarine outfall.
Consequently, risk analysis of environmental water quality for the design of submarine
outfalls may proceed with the: i) identification of different types of uncertainties and different
scenarios, depending on the combination of various kinds of uncertainties (risk identification);

28
ii) identification of conditions involving incidents or failures; and iii) risk quantification under
different scenarios, and comparison to water quality standards and evaluation of the system
reliability.
Nowadays, the procedure for the assessment and management of submarine outfalls
relies mainly on the legislative framework, with the need to control and minimise adverse
health effects being the principal concern of regulation, with an increase of public awareness,
and contributing to informed personal choice and contributing to a public health benefit.
These successes are difficult to quantify since the influence on species from locals’ marine
ecosystems is disregarded.
The present form of regulation tends to focus upon sewage treatment and outfall
management as the principal or only effective interventions. A number of constraints are
evident in the current standards and guidelines:
Because of the high costs of these measures, local authorities may be effectively
incapable and few options for effective local intervention in securing bathing water and
marine ecosystems from sewage pollution may be available.
The limited evidence available from cost-benefit studies of pollution control alone rarely
justifies the proposed investments. The costs may be prohibitive or may detract resourcing
from greater public health priorities and marine ecosystems, especially in developing
countries. If pollution abatement on a large scale is the only option available to local
management, then many will be unable to undertake the required action.
An improved approach to the project design of submarine outfalls that better reflects
health and marine ecosystems risks is necessary and feasible. The project design of
submarine outfalls should be reformulated in the sense of quantifying the impact of these
structures, on a long-term basis, in population health and marine ecosystems evolution,
considering plume characteristics, behavior and associated impacts.
The above problem is approached in the methodology developed in this thesis
introducing the importance of a research-worthy problem that will be further refined as
experience with implementation accumulates and amended to take account of specific local
circumstances.
The proposed approach assess failure by calculating its probability of occurrence, on a
long-term basis, leading to a risk quantification of impacts on health and marine ecosystems,
together with the possibility of incorporating species life cycles in the design project of

29
submarine outfalls and enabling local management to respond to sporadic or limited areas of
pollution.
The advantage of a risk assessment procedure, as opposed to the traditional approach,
lies in its flexibility. A large number of factors can influence the condition of a given area or
marine ecosystem. A risk assessment system reflects this, and allows engineers, ecologists
and biologists to work together in the development of the most satisfactory submarine outfall
design.
1.2 Objectives and outline
The aim of this work is the development of a probabilistic-based procedure in the context
of a risk management approach to the project of submarine outfalls concerning outfall
exploitation (discharge, dispersion and pollutant transport), and focusing on their influence on
the environment, economy and served populations.
The methodology proposes a rational and systematic procedure for optimal design of
submarine outfalls granting a cost optimization of this type of projects, reducing submarine
outfall accidents and their environmental dramatic consequences. A sensitive analysis of
failure probabilities allows the definition of project factors in which investment and research
should focus with the objective of reducing costs.
With the overall interest in efficiently exploring sustainable development of coastal waters
related to submarine outfalls, in terms of protection and improvement of the aquatic
environment, with direct impact both on the design and management of these structures, the
conceptual framework of the methodology is illustrated in Figure 1-1 and resumed above
together with the main objectives:
1- The identification of risks and failure modes associated with the project of submarine
outfalls, the first step, for both deterministic or risk design approaches and described in
chapter ;
2- Development of an engineering procedure, adapted from ROM 0.0, for the
specification of requirements and target design levels to determine if a project satisfies
the safety, serviceability, and exploitation requirements for the recommended levels of
reliability, functionality, and operationality (described in chapter 3). This procedure aims
to estimate the useful life of the structure, the joint probability of failure against the
principal failure modes, minimum operationality, the average number of admissible
technical breakdowns, and the maximum admissible duration of an operational stoppage;

30
3- Development of a risk assessment procedure for operational failure estimation in
submarine outfall projects focusing on three main topics: environmental legislative
framework, climate agents on the coastline and effluent fate and distribution. The
probability of occurrence of failure in the useful life is calculated by applying Monte Carlo
simulations (chapter 4). The results obtained aim at identifying the structure’s probability
of failure or stoppage and the definition of operational target design levels enabling
decision on project design alternatives;
4- The methodology developed in chapter 4 is adapted to a risk assessment procedure
for short-term management of submarine outfalls. An hydrodynamic model and a particle
tracking model are applied to investigate the models capabilities in respect to the ones
applied in chapter 4;
5- With the final aim to incorporate marine biodiversity life cycles in the design of
submarine outfalls, a risk assessment of aquatic systems induced by these structures is
proposed through the development of an encounter probabilistic-based model. The
model considers a plume-specie encounter approach, based on Reynolds transport
theorem and a probabilistic residence time estimation of species inside the plume.
Figure 1-1. Thesis framewok.

31
1.3 Structure of the document
The document is structured in seven chapters, as illustrated in Figure 1-1. The present
chapter, Chapter 1, corresponds to the first of them and includes a general introduction of
objectives and general context.
Chapter 2 describes the main characteristics of submarine outfalls, their failure modes
and operationality, the hydrodynamic processes around these structures and the
deterministic project design used nowadays.
Chapter 3 describes an engineering procedure for the specification of the requirements
and target design levels of a submarine outfall in the project phase (defining the general and
operational intrinsic natures of the structure). The methodology is applied to four submarine
outfalls located in the Portuguese coast.
In Chapter 4 a risk assessment procedure is proposed for operational limit states
(environmental failure modes) focusing on three main topics: environmental legislative
framework, coastal forcing climate agents and effluent fate and distribution. Empirical
orthogonal functions are applied to long-term time series of contaminants results.
In Chapter 5 an operational short-term forecast methodology, based on the procedure
developed in chapter 4, is proposed for the management of submarine outfalls to be used as
a decision support tool.
Chapter 6 focuses on the risk assessment of aquatic systems induced by submarine
outfalls. A mathematical probabilistic-based model is developed and described.
Chapter 7 states the conclusions drawn from the study and suggests possible directions
for future research lines.

32
33
2 | Submarine outfalls general considerations
2.1 Introduction
Many cities around the world suffer major deficiencies in water and sanitation
infrastructure, especially in wastewater management. Realistic standards for effluent quality
should be adopted which are flexible in terms of quality and timing, and take into account the
assimilation capacity of the receiving water bodies.
Submarine outfalls, encountered in the final step of the effluent treatment, are one of the
most important sanitation infra-structures used nowadays, being almost inevitable that the
chosen places for the final effluent disposal will be the sea and the estuaries. Those
structures are especially important for the sea water quality since about fifty percent of the
world’s population, more than 3 billion people, presently live within sixty kilometers of the
coast.
The aim of wastewater treatment and outfall/disposal design is to ensure that the
wastewater is discharged in the best practicable environmental manner. Effluent
management requires wastewater treatment to a level which will prevent further
deterioration, secure protection and enhance the status of aquatic ecosystems, minimize risk
of human disease, and protect environmental uses/values of the waters.
Sufficient dilution of discharged sewage to reduce contaminant concentrations well below
established water quality standards under most circumstances can be achieved with a
properly designed submarine outfall system. To understand the problem and to find a proper
control measure one must understand the hydrodynamics and climate processes involved.
Submarine outfall projects generally include specifications pertaining to the conception,
design, construction, exploitation, maintenance, and repair of the outfall. Nevertheless, they
rarely include a systematic assessment of risks. This signifies that the design methods used
are essentially deterministic.
This chapter describes submarine outfall characteristics and its functional design,
including water quality aspects related to these structures together with the mechanisms
associated to the prediction of waste field fate and transport and bacterial contaminants
calculation. Stability verification for these structures is resumed combined with a historical
review of pipeline design evolution formats and the importance for a systematic risk
management is outlined.

34
Finally, the principal failure modes and corresponding limit states for these structures are
identified, with particular focus in operational limit states.
2.2 Functional design of submarine outfalls
An outfall can be defined as the set of hydraulic structures between dry land and the
receiving water body (Figure 2-1) through which waste effluent is discharged and consists of
three components:
(i) Onshore headwork (e.g. gravity or pumping basin);
(ii) Feeder pipeline which conveys the effluent to the disposal area;
(iii) Diffuser section where a set of ports releases and disperses the effluent into the
environment so as to minimize any impairment to the quality of the receiving
waters. Diffusers discharge the effluent either through port orifices on the wall of
the diffuser (simple-port configuration) or through attached pipes (riser/port
configuration) [Bleninger et al., 2002].
Figure 2-1 Schematic layout of an outfall system.
The sewage effluent is discharged from the diffusers in the form of round turbulent jets
and since is less dense than ocean water, it rises to the surface. In the receiving water body,
the column effluent is diluted because of entrainment and grows in size as it rises [Bleninger
et al., 2002].
The total functional design of a submarine disposal system includes determination of the
length of the outfall, the corresponding depth of discharge, the length and orientation of the
diffuser section and the specific hydraulic design of the pipeline and diffuser including shape,
number, size and orifices spacing [Ludwing, 1988].

35
Water quality objectives 2.2.1
Water quality objectives for the protection of beneficial uses of the marine environment
have been seen as necessary by most European countries. Criteria and standards for
bathing and shellfish-growing waters are in force in practically all European countries, with
minimum common measures for bathing waters and shellfish waters. Plans for the protection
of other beneficial uses such as fishing or wildlife, or for the maintenance of proper
aesthetics, have not generally resulted in the development of similar criteria or standards
[UNEP, 1996].
The European Water Framework Directive [WFD, 2000] has the objective of an
integrated catchment oriented water quality protection for all European waters with the
purpose of attaining a good quality status by the year 2015. The water quality evaluation for
surface waters should furthermore rely predominantly on biological (such as flora and fauna)
and hydromorphological (such as flow and substrate conditions) parameters - however,
aided by the traditional physico- chemical quality components (such as temperature, oxygen,
or nutrient conditions) and specific pollutants (such as metals or synthetic organic
compounds). A good chemical quality status is provided when the environmental quality
standards are met for all pollutants.
The Environmental quality standards (EQS), also called ambient standards or emission
limit values, set as concentration values for pollutions or pollutant groups, that may not be
exceeded in the water body itself [WFD, 2000] They have the advantage that they consider
directly the physical, chemical and biological response characteristics due to the discharge
and therefore they put a direct responsibility on the discharger.
In addition to the general protection of surface waters, regulations regarding especially
bathing waters have also been decided [Directive C., 2006]. EC member states shall ensure
that, by the end of 2015, all European bathing waters are at least in a sufficient status.
Furthermore, the Directive on shellfish growing areas sets physical, chemical and
microbiological requirements that designated shellfish waters must either comply with or
endeavour to improve.
It is evident that schemes for wastewater disposal into the marine environment should be
designed primarily taking into account the beneficial uses to be protected in the area affected
by the discharge. Therefore, water quality criteria derived from these uses are the principal
parameters in the computations concerning the efficiency of a submarine outfall.
36
In order to be used in the design and calculation of a submarine outfall, water quality
criteria need to fulfil the following basic characteristics:
(a) The criteria have to be expressed in terms of parameters and values which can be
directly incorporated into the design procedure.
(b) Criteria and parameters should be relevant to the beneficial use that the submarine
outfall has to protect. They have to be associated with sanitary and ecological
consequences, either through a direct cause-effect relationship or through a clearly-
stated statistical relationship.
(c) Criteria should be attainable by normal technical procedures and should take into
account the natural base-line concentrations in European waters.
(d) Although, for purposes of the computation of submarine outfalls, only average
values are traditionally used, in order to take into account the natural variability and
changes of environmental parameters, water quality criteria should be defined in a
statistical form.
(e) The uses to which the water systems are subjected are pressure factors which,
eventually, generate impacts on the marine habitats. This circumstance highlights
the real incidence that human activity has on the quality of water systems and thus
also underlines the need to adjust the environmental objectives for these systems to
the external conditions to which they are subjected.
Inappropriate treatment of wastewater can cause significant and irreparable damage to
receiving waters and land environments. Potential ecological and human stressors include,
among others, nitrogen and phosphorus, BOD/COD, suspended solids, heavy metals and
toxic substances and pathogens. They can cause environmental damage and threat to
human health, directly or indirectly, by food chain processes. Table 2-1 resumes the principal
constituents in wastewater and their impacts on the marine environment.
37
Table 2-1 Constituents in wastewater and their impacts on the marine environment.
CONSTITUINTS IMPACT
Solids
High levels of suspended solids may cause excessive turbidity, shading of seagrasses and
result in sedimentation, which is potentially damaging to benthic habitats and can cause
anaerobic conditions at the sea bottom. Fine particles may be associated with toxic
organics, metals and pathogens that adsorb to these solids.
Organic
matter
Biological degradation of organic matter poses oxygen demand and can deplete available
dissolved oxygen. The strength of wastewater is commonly expressed in the BOD
parameter (Biochemical Oxygen Demand). High BOD levels in natural waters can
therefore cause hypoxia and anoxia, especially in shallow and enclosed aquatic systems,
resulting in fish death and anaerobic conditions. Anaerobic conditions subsequently result
in release of bad odours (due to formation of hydrogen sulphide).
Nutrients
Nutrients increase primary production rates (production of oxygen and algal biomass);
adverse levels cause nuisance algal blooms, dieback of coral and seagrasses,
eutrophication that can lead to hypoxia and anoxia, suffocating living resources (fish).
Massive die-off of algal matter will result in additional organic matter.
Pathogens
Pathogens can cause human illness and possible death. Exposure to human pathogens
via contact with contaminated water or consumption of contaminated shellfish can result in
infection and disease.
Toxic organic
chemicals
Many toxic materials are suspected carcinogens and mutagens.
These materials can concentrate in shellfish and fish tissue, putting humans at risk through
consumption. Bio-accumulation affects fish and wildlife in higher food chain levels.
Metals Metals in specific forms can be toxic to various marine organisms and humans; shellfish
are especially vulnerable in areas with highly contaminated sediments
Fats, oil
and grease
Fats, oil and grease float on the surface of sea water, interfere with natural aeration, are
possibly toxic to aquatic life, destroy coastal vegetation, reduce recreational use of water
and beaches and threaten water fowl.
Mechanisms and prediction of effluent fate and transport 2.2.2
Design work and predictive studies on effluent discharge problems have to consider the
physical aspects of hydrodynamic mixing processes that determine the fate and distribution
of the effluent from the discharge location, and the formulation of mixing zone regulations
that intend to prevent any harmful impact of the effluent on the aquatic environment and
associated uses. Figure 2-2 illustrates the main pollutant sources and environmental
objectives to protect in coastal waters.

38
Figure 2-2 Pollutant sources and environmental objectives (underlined) in coastal waters (source: [Bleninger, 2006]).
Water management needs to balance pollutant reduction and ecosystem response
[Bleninger, 2006]. Mixing processes are interplay of ambient conditions and the outfall
configuration. Different hydrodynamic processes drive and control the system. Coastal
waters are driven primarily by winds and tides, although freshwater runoff from the land can
also be an important forcing mechanism. Because of differing climate, bathymetry and
density stratification, responses to these forcing mechanisms vary.
Most processes are running simultaneously, but with very clear dominance in different
temporal and spatial regions, according to their predominant flow characteristics. The effluent
flow passes through a succession of physical processes at scales from small-to-large
schematized in Figure 2-3 [Bleninger et al., 2010].
PHENOMENON
Initial jet mixing (rise of buoyant jets over an outfall diffuses in a stratified fluid).
Establishment of sewage field or cloud, travelling with the mean current; lateral gravitational spreading
Natural lateral diffusion and/or dispersion
Advection by currents (including scales of water motion too large compared to sewage plume to be called turbulence).
Large scale flushing (advection integrated over many tidal cycles); upwelling or downwelling; sedimentation
Figure 2-3 a) Physical processes that the effluent of a submerged outfall is subjected, b) Typical temporal and spatial scales for transport and mixing processes related to coastal wastewater discharges [Jirka et al., 1976,
Fischer et al., 1979].

39
2.2.2.1 Manifold processes
The first region of an outfall is the outfall pipe system, conceptualized as an internal
hydraulic manifold. It does not change effluent characteristics, but considerably contributes to
the subsequent dispersion processes by conveying the effluent to adequate discharge
locations and spatially distributing the effluent in the discharge region, Figure 2-4.
Figure 2-4 Schematic view of an operating multiport diffuser outfall merged with a laboratory picture of a trapped
waste plume in a stratified ambient (modified from Domenichini et al., 2002).
2.2.2.2 Near-field processes
In the second region, the "near-field" (also called active dispersal region or initial mixing
region), the initial jet characteristics of momentum flux, buoyancy flux, and outfall
configuration (orientations and geometries) influence the effluent trajectory and degree of
mixing. Source-induced turbulence entrains ambient fluid and dilutes the effluent. A general
review of these processes has been given by [Fischer et al. 1979, Wood et al. 1993, Roberts
1990, 1996 or Jirka and Lee 1994].
The simplest discharge case was the first one studied for ocean outfalls by [Rawn and
Palmer, 1929]: a single horizontal buoyant jet into a stationary, homogeneous environment.
Because of its buoyancy, the jet follows a trajectory that curves upwards towards the water
surface. As it rises, it entrains ambient fluid that mixes with and dilutes the effluent (Figure
40
2-5a). After impacting the water surface, it makes a transition to a horizontal flow that
spreads laterally where it may undergo an internal hydraulic jump and other mixing
processes that result in additional dilution.
A current flowing over the diffuser sweeps the plume downstream and increases its
dilution (Figure 2-5b) [Krauer, 1978; Brooks (1973)] and a density stratification in the
receiving water can have a profound effect on the rising plumes trapping the plume beneath
the water surface (Figure 2-5c).
a) b) c)
Figure 2-5. a) Horizontal buoyant jet into stationary homogeneous environment, b) Single plume in an unstratified
current, c) Horizontal buoyant jet in a stationary, stratified environment [Roberts et al., 2010].
2.2.2.3 Intermediate-field processes
The “intermediate-field” is characterized by the impact of the turbulent plume with
boundaries and the transition from the vertically rising (positively buoyant effluent) or falling
(negatively buoyant effluent) plume characteristics to a horizontal motion generated by the
gravitational collapse of the pollutant cloud. Only a few laboratory and field studies have
examined these processes in more detail [Jirka and Lee, 1994; Akar and Jirka, 1995]
[Bleninger, 2010].
2.2.2.4 Far-field processes
After the waste field establishment, ambient conditions will control trajectory and dilution
of the turbulent plume in the “far-field” (also called passive dispersal region), through passive
diffusion due to ambient turbulence, and passive advection by the often time-varying, non-
uniform, ambient velocity field. The flow is forced by tides and large-scale currents, wind
stress at the surface, pressure gradients due to free surface gradients (barotropic) or density
gradients (baroclinic), and by the effect of the Earth's rotation (Coriolis force). Dynamic
discharge related effects are unimportant in that region [Bleninger, 2010].
An overview of the physical processes is given in Figure 2-3, and an example for their
characteristic length and time scales for large discharges in the coastal environment in
Figure 2-4 [Bleninger et al., 2010, Brooks 1960, Munro and Mollowney 1974].
41
Potential microbial stressors and potential receptors 2.2.3
Effects arising from bacterial pollution are many and they involve public health, as well as
social and economic implication. The survival of enteric bacteria in the aquatic environment
has attracted interest in view of its public health significance [Gareth, Rees. 1993, Nelson et
al, 1996]. It has been shown that filter-feeding bivalves, for example mussels and oysters,
accumulate pathogenic bacteria in their tissues [Cabelli & Heffernan 1970, Prieur et al 1990],
making the shellfish unsafe for human consumption. In fact, contamination from sewage
discharge has resulted in closure or prohibition of many shellfish areas worldwide and on the
basis of these contaminations some of these areas have been designated as approved,
conditionally approved or not approved areas depending on the situation.
Potential microbial stressors in treated wastewater include pathogenic enteric bacteria,
protozoans, and viruses associated with human or animal wastes. Untreated raw sewage
typically contains fecal indicator bacteria (such as fecal coliforms, total coliforms, and fecal
streptococci) in concentrations ranging from several colonies to tens of millions of colonies
per 100 mL [Krauer, 1978; US EPA, 2003]. Survival of this microorganisms in water is
affected by a number of physical and biological factors, such as ultraviolet radiation and
predation by grazers [Wood et al., 1993]. Field measurements around the world provide a
range of values of the time needed for reduction of enteric bacterial populations in seawater
to 90 percent of their original concentrations (that is, T90). These values for T90 range from
0.6 to 24 hours in daylight to 60 to 100 hours at night (reviewed in [Wood et al., 1993]).
kT /)10(ln90 =
(2. 1)
Coliform bacteria are normally used as a tracer for following sewage discharges in the
marine environment and for determining the achieved dilution of the sewage effluent. The
mortality rate (k) is usually expressed as a first-order reaction of form:
kte N=N 0 −
(2. 2)
where N0 is the initial number of bacteria present, N is the number remaining after time t, and
k is the mortality rate constant.
Studies have shown that T90 decreases with increasing temperature, increasing salinity
and increasing solar radiation [Gameson and Gould, 1975; Akin, Hill and Clarke, 1975;
Mitchell and Chamberlin, 1975]. Error! Reference source not found. gives the orders of
magnitude for total bacteria concentration decrease in each phase.

42
Table 2-2. Orders of magnitude of the decrease of concentration in each phase of the mixing process.
PHASE PROCESSES ORDER OF MAGNITUDE
First phase
Rising plume Dilution by turbulent
diffusion Without diffuser
With diffuser
2 to 100*
10 to 1000*
Second phase
Horizontal transport for 1000m Dilution by vertical and horizontal dispersion 5 to 20
Third phase
Bacterial decay Equivalent to dilution
After 3h
After 6-8h
After 10-15h
10
100
1000
*increases roughly by the power of 3/2 of the depth [UNEP, 1996]
On the other hand, potential receptors of ocean outfall effluent constituents include any
organism that may be exposed to seawater containing effluent constituents. Such potential
receptors in the marine environment comprise a wide variety of animals and plants living in
or near brackish coastal waters or marine waters, including marine mammals, reptiles, fish,
birds, marine invertebrates, and aquatic vegetation. Humans also use the ocean for
recreation, fishing, and other activities and can be exposed by eating contaminated seafood.
Potential human receptors include recreational and industrial fishermen, boaters, workers
associated with ocean outfall operations or wastewater treatment and, if the exposure
pathways exist, recreational swimmers.
2.3 Structural design of submarine outfalls
Most submarine outfalls design manuals are still based on a deterministic design
philosophy, generally based upon a combination of experience, engineering skill and
hydraulic modelling studies with risks remaining implicit and managed by judgment informed
by experience.
The design of an ocean outfall commences after the location and orientation of the
diffuser is established in accordance with the processes of effluent mixing and dispersion
and the location of the headworks is determined. It includes considerations for internal
hydraulics, external hydrodynamic oceanic forces, structural integrity and stability, material
suitability, geomorphology of the seabed, competing uses of the ocean, as well as installation
and operational methodology [Roberts et al., 2010].
The internal pipe diameter is based on many factors that include the outfall length, the
present and future discharge, static head, available hydraulic head or acceptable head
losses for pumping, and cleansing velocities in the pipe lo prevent any significant deposition
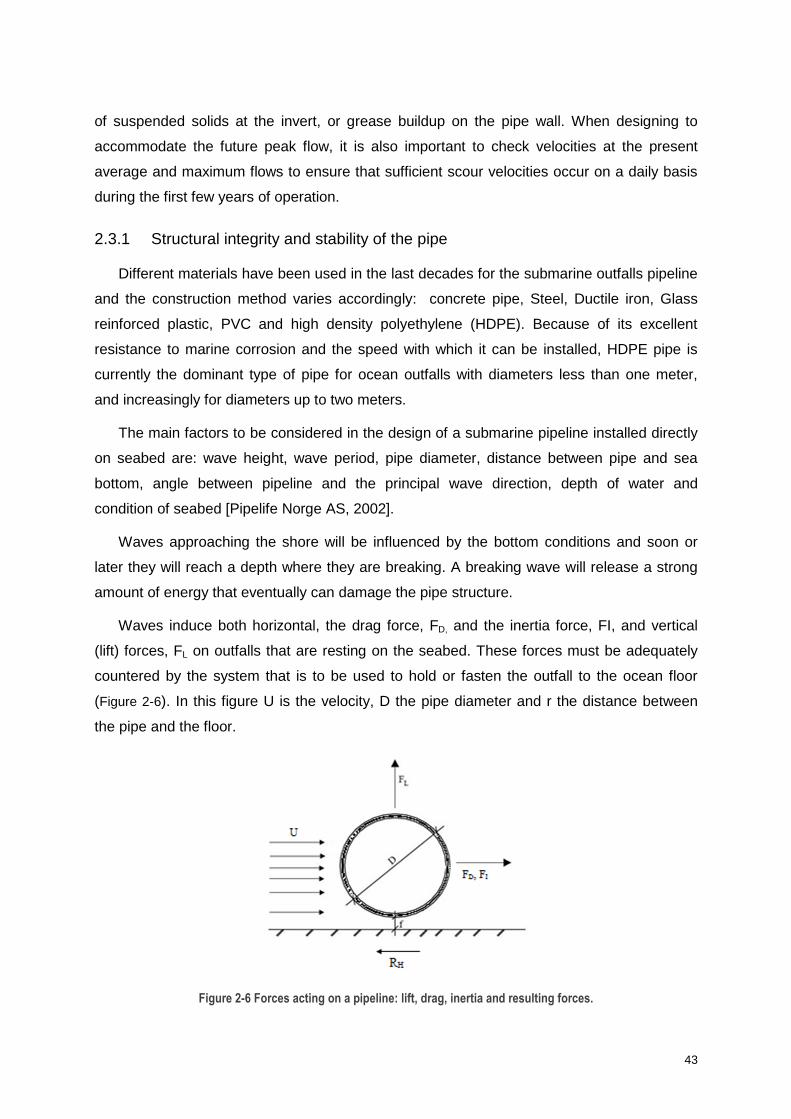
43
of suspended solids at the invert, or grease buildup on the pipe wall. When designing to
accommodate the future peak flow, it is also important to check velocities at the present
average and maximum flows to ensure that sufficient scour velocities occur on a daily basis
during the first few years of operation.
Structural integrity and stability of the pipe 2.3.1
Different materials have been used in the last decades for the submarine outfalls pipeline
and the construction method varies accordingly: concrete pipe, Steel, Ductile iron, Glass
reinforced plastic, PVC and high density polyethylene (HDPE). Because of its excellent
resistance to marine corrosion and the speed with which it can be installed, HDPE pipe is
currently the dominant type of pipe for ocean outfalls with diameters less than one meter,
and increasingly for diameters up to two meters.
The main factors to be considered in the design of a submarine pipeline installed directly
on seabed are: wave height, wave period, pipe diameter, distance between pipe and sea
bottom, angle between pipeline and the principal wave direction, depth of water and
condition of seabed [Pipelife Norge AS, 2002].
Waves approaching the shore will be influenced by the bottom conditions and soon or
later they will reach a depth where they are breaking. A breaking wave will release a strong
amount of energy that eventually can damage the pipe structure.
Waves induce both horizontal, the drag force, FD, and the inertia force, FI, and vertical
(lift) forces, FL on outfalls that are resting on the seabed. These forces must be adequately
countered by the system that is to be used to hold or fasten the outfall to the ocean floor
(Figure 2-6). In this figure U is the velocity, D the pipe diameter and r the distance between
the pipe and the floor.
Figure 2-6 Forces acting on a pipeline: lift, drag, inertia and resulting forces.
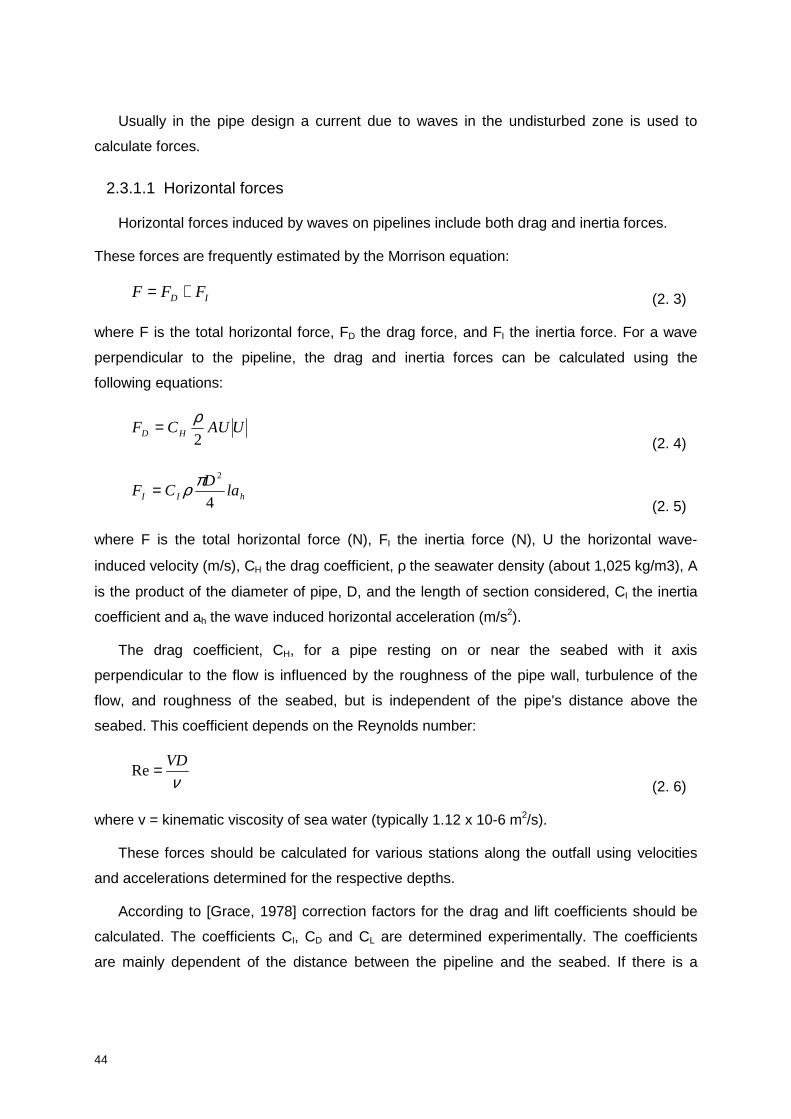
44
Usually in the pipe design a current due to waves in the undisturbed zone is used to
calculate forces.
2.3.1.1 Horizontal forces
Horizontal forces induced by waves on pipelines include both drag and inertia forces.
These forces are frequently estimated by the Morrison equation:
ID FFF += (2. 3)
where F is the total horizontal force, FD the drag force, and FI the inertia force. For a wave
perpendicular to the pipeline, the drag and inertia forces can be calculated using the
following equations:
UAUCF HD 2
ρ= (2. 4)
hII laD
CF4
2πρ= (2. 5)
where F is the total horizontal force (N), FI the inertia force (N), U the horizontal wave-
induced velocity (m/s), CH the drag coefficient, ρ the seawater density (about 1,025 kg/m3), A
is the product of the diameter of pipe, D, and the length of section considered, CI the inertia
coefficient and ah the wave induced horizontal acceleration (m/s2).
The drag coefficient, CH, for a pipe resting on or near the seabed with it axis
perpendicular to the flow is influenced by the roughness of the pipe wall, turbulence of the
flow, and roughness of the seabed, but is independent of the pipe's distance above the
seabed. This coefficient depends on the Reynolds number:
νVD=Re
(2. 6)
where v = kinematic viscosity of sea water (typically 1.12 x 10⁻⁶ m2/s).
These forces should be calculated for various stations along the outfall using velocities
and accelerations determined for the respective depths.
According to [Grace, 1978] correction factors for the drag and lift coefficients should be
calculated. The coefficients CI, CD and CL are determined experimentally. The coefficients
are mainly dependent of the distance between the pipeline and the seabed. If there is a

45
passage for the water under the pipeline, the coefficients will be reduced [Pipelife Norge AS,
2002].
2.3.1.2 Vertical forces
Waves also induce vertical forces on pipelines. This is primarily due to the induced
horizontal flow of water across the pipe. The vertical (lift) force on the pipe that is caused by
the horizontal flow due to waves can be determined by the same equation used to calculate
the lift force due to steady currents:
2
2AVCF LL
ρ= (2. 7)
where V is the maximum wave-induced horizontal velocity.
The lift coefficient, CL, decreases with decreasing roughness of the seabed and it
decreases with increasing pipe roughness. Furthermore, the magnitude of the vertical (lift)
force due to a horizontal current varies with the height of the pipeline above the sea bed. The
maximum lift force occurs when the pipe is resting on the ocean floor; as the height
increases the lift force decreases.
2.3.1.3 Internal and external horizontal forces
Balance between internal and external forces on the pipeline depends on the flow inside
the pipeline and on the pipeline depth. External forces due only to the hydrostatic pressure
increases with depth and depends on the average density of the water column. The pressure
inside the outfall pipe will be greater than the external hydrostatic pressure by an amount
equal to the head losses due to friction. During periods of no flow the internal and external
forces are equal which means that the height of the fresh water column inside the pipe will be
greater than the seawater depth.
The magnitude of the differential, expressed in meters of effluent, is given by:
−=∆ 1
E
SSDh
γγ
(2. 8)
where ∆h is the head differential (m), DS the depth of the outfall port(s) (m), γS the specific
weight of seawater (kN/m3) and γE the specific weight of effluent (kN/m3).

46
2.3.1.4 Stability of submarine pipelines lying on the seabed
It is almost always necessary to stabilize marine outfalls against hydrodynamic oceanic
forces to prevent movement and/or undermining beneath the pipe as this can also result in
movement and/or induced stresses in the pipe. The main reasons to prevent pipe movement
are to preclude loss of integrity of the pipe wall or joints and to avoid deformation that could
restrict flow.
There are four basic means to secure the HDPE pipe to the seabed: bury the pipe in an
excavated trench; install the outfall pipe through directional drilling or micro-tunneling; attach
sufficiently heavy ballast weights (usually concrete) to the pipe to resist movement due to
oceanic forces (lateral and vertical lift forces due to currents and waves); and attach the pipe
to mechanical anchors or piling drilled or driven into the seabed [Roberts et al.2010].
Of these, concrete ballast weights are most commonly used for HDPE outfalls.
Entrenchment, directional drilling, and micro-tunneling result in greater protection of the
outfall, but are usually significantly more expensive than weights or anchors.
2.3.1.5 Diffuser
The diffuser project includes designing to meet dilution requirements, port and/or riser
configurations, diffuser orientation, hydraulic considerations, and structural integrity [Roberts
et al., 2010].
Designing for dilution is usually an iterative process that is carried out by means of
computer-aided dilution models. The inputs include diffuser and ambient variables. The
ambient variables are determined by local oceanographic conditions. A range of diffuser
variables, including port diameter, number and spacing (which determines the diffuser
length) are selected based on mixing and dispersion processes, and the computer program
run to determine near and far field dilutions.
Common diffuser configurations are illustrated in Figure 2-7. The near field dilution
depends primarily on diffuser length; orientation perpendicular to the current gives highest
dilution and parallel gives lowest, and the difference between them increases as the current
speed increases. The diffusers ports can discharge vertically or, preferably, horizontally. A
vertical discharge may increase the plume rise somewhat when the receiving water is
stratified. Horizontal discharge results in the highest initial dilution. The difference can be
significant for diffusers in shallow water, but it decreases as the water depth increases
[Roberts et al.2010].

47
Figure 2-7 Straight, Y, and T-diffusers showing plumes for a current parallel to shore.
The details of the hydraulic design of diffusers is described in [Fischer et al., 1979] and
[Brooks, 1970].
The discharge from a port, Qj depends on the port design, the velocity and pressure in
the diffuser, and the port elevation relative to the previous one. It can be computed from:
gEACQ jPj 2= (2. 9)
where CP is the port discharge coefficient, Aj the port area, and E the difference in total
head across the port. Table 2-3 summarizes the stability verification of a submarine outfall,
including both pipe and diffuser.

48
Table 2-3 Stability verification of a submarine outfall.
Waves Characterization of local climate agents
Height, period, depth, currents, wave angle
Pipe
∑∆++=∆ y
g
vk
g
v
D
Lfh
oρρ
22
22
h∆ : pressure drop, f : friction coefficient
L : length of pipe (m), D : internal diameter (m) v : velocity in pipe (m/s), g : acceleration of gravity
(=9.81 m/s2)
∑ k : sum of coefficients for singular head losses, ρ∆ :
density difference water inside pipe and water in recipient
(kg/m3), 0ρ : density of water inside the pipe (kg/m3), y: water depth at outlet point
Pipe characterization Material, mechanical properties. Hydraulic design and capacity:
- Pressure drop (head loss) - Friction coefficient, Flow - Diameter int./ext. - Self cleaning velocity, Air transport
Static design: - internal pressure - external loads/buckling - water hammer - temperature stresses - bending stresses
Concrete weights
LBapwcwN FFwwwwF −−+++=
NF : normal force against seabed
cww : submerged weight pr. m pipe in seawater
ww : weight of water pr. m inside the pipe
pw : weight of pipe pr. m in air
aw : weight of air/gas pr. m inside pipe
BF : buoyancy of pipe pr. m
LF : lift force
Concrete weights characterization and stabilization
Criteria of stability: N
D
F
Ff ≥
(minimum friction coefficient to avoid sliding) Type of weight (e.g. rectangular, circular or starred)
Forces
2
2VACF HD ρ=
2
2AVCF LL
ρ=
hII aD
CF4
2πρ=
Forces acting on the submarine outfall Lift, drag , inertia, resulting forces
Adimensional coefficients CD, CH, CI
Safety verification of forces Drag, Inertia and lift
Diffuser
gEACQ jPj 2= ; jQ : discharge from a port
PC : port discharge coefficient; jA : Port area
E : Difference in total head across the port
Dilution requirements, port and/or riser configuration, diffuser orientation, hydraulic considerations, structural integrity Dilution models: - ambient variables: mixing and dispersion - diffuser variables: port diameter, number
and spacing (determines diffuser length)

49
ASD
LRFD
Structural reliability design
Risk based design
2.4 From the deterministic to risk design approach of submarine
outfalls
Various formats, with different risk methodologies have been applied for pipeline design
(Figure 2-8).
Figure 2-8. Pipeline design formats.
The most simplified design format applied is the Allowable Stress Design (ASD). In this
case calculated pipeline stresses should be limited to a fraction of the material minimum yield
stress, termed as the usage factor. The usage factor may be considered as a safety factor,
representing the total uncertainty of the stress design. The general form for ASD is:
( )21 ttdn QQQ
FS
R++≥ γ
(2-1)
where: nR is the nominal resistance, dQ the nominal dead load effect, 21 , tt QQ the nominal
transient load effects, γ the load combination factor and FS the factor of safety. The ASD
format is limited to a verification of pipeline stresses under conditions with internal over-
pressure, and does not cover other relevant failure modes. In addition, the use of a single
safety factor makes it difficult to identify and quantify the uncertainty associated with
individual design parameters.
In the late 70’s, early 80’s a change from ASD to Load and Resistance Factor Design
(LRFD) was proposed because of LRFD’s ability to better handle certain sources of
uncertainty. LRFD is a “deterministic” design criterion with partial safety factors. In order to
allow for a more practical application of risk and reliability design principles, the LRFD
methodology was introduced. A general design requirement for this methodology is to verify
that the factored load effect is less than the factored resistance for all relevant failure modes.

50
According to the DNV offshore standard (DNV, OS-F101) safety factors are introduced as
basic load effect factors, specific load effect factors and resistance factors. Each safety factor
represents the uncertainty in the corresponding parameter. Probabilistic methods have been
applied to calibrate the safety factors associated with each failure mode against accepted
failure probabilities. The general form for LRFD is:
2211 ttttddn QQQR γγγφ ++≥ (2-2)
where: nR is the nominal resistance, dQ the nominal dead load effect, 21 , tt QQ the nominal
transient load effects, dγ the load factor associated with the ith load effect andφ the
resistance factor.
Traditionally the following different limit states are considered in LRFD: serviceability limit
states (SLS), ultimate limit states (ULS) and accidental limit states (ALS). The design of the
pipeline is closely related to the risk analysis, in the sense that scenarios that entail a risk
that is unacceptable, typically due to their high frequency of occurrence, shall be considered
in the ALS design.
A structural reliability design includes a simplification both with respect to definition of
acceptable failure probabilities and with respect to assessment of consequences. Failure
modes are defined within limit states, with predefined failure probability limits according to
normal industrial practice. By introduction of safety classes, acceptable failure probability
limits are linked to the consequences of the corresponding failure. The overall objective of
the structural reliability analysis is to ensure that the predefined safety levels are achieved.
This means that estimated failure probabilities have to be less than the accepted failure
probabilities.
A complete risk based design provides a large amount of statistical data associated with
the input parameters. Based on this input relevant failure modes are to be identified and
evaluated with respect to failure probabilities and failure consequences, and then checked
against acceptable risk levels. However, due to the inconvenience of a risk based design,
such an approach is normally not applied in practice.
A schematic representation of the design approach evolution from a deterministic to a
risk based design is presented in Figure 2-9.
A few numbers of codes and standards are used to analyse and design submarine
pipelines. The traditional design of pipelines, where load factors typically have been used in
the design of pipe wall thickness, exemplifies an allowable stress design (ASD) format.

51
Designing a pipeline code using ASD is quite common, and parallels to the “limit states” can
be found.
Figure 2-9 Design approach evolution (adapted from: [Nessim et al., 2002]).
Pipeline design codes that are widely recognized include:
ASME B31.8-1999 Chapter VIII : Piping design, manufactured, installed
PD (Published Document) 8010 updated document of BS 8010 Part 3: Pipelines subsea:
design, construction and installation
ISO 13623: Petroleum and natural gas industries - Pipeline transportation systems
DNV-RP-F109: On-Bottom Stability Design of Submarine Pipelines
DNV OS-F101: Submarine Pipeline Systems
ABS GUIDE for Building and Classing Subsea Pipeline Systems
DNV 1981: Rules for Submarine Pipeline Systems
GL Germanischer Lloyd , Rules for classification and construction, III – Offshore
technology, Part 4 – Subsea pipelines and risers, 1995.
DIN German Standards Committee , DIN 2413, Steel pipes, calculation of wall thickness
subjected to internal pressure (1972) October 1993.
ASME B31.8, BS 8010 Part 3 and ISO 13623 are all codes that belong to the Allowable
Stress Design (ASD) family of codes. DNV OS-F101 adopts the Load and Resistance Factor
Design (LRFD) format as a basis for the given structural limitations.

52
Although there have been some efforts to make risks explicit and to formally describe
them ([Figueira2006], [Figueira2008a]), they have not been exhaustive and have had no real
consequences in current engineering practice. For example, [Simm1998] present a check list
of common risks for outfall/intake works which relate mainly to construction phase;
[Figueira2008a] presents a few examples of risks at conceptual, design, construction and
operation stages. There is also work on design based on safety factors, on failure
probabilities with respect to different modes of failure and on optimization techniques, and
some combine them (e.g. [Vrouwenvelder2002], [Castillo2004], [Castillo2006]). Moreover,
many new techniques for risk assessment and management have been developed recently
both in the USA and Europe ([Kay1987], Duckstein and Plate, 1987; Ganoulis, 1991c;
Haimes et al., 1992; Morel and Linkov, 2006; Hlavinek et al., 2008). These techniques aim to
quantify the risks arising from the various uses of water related to different factors (such as
physical, physico-chemical, biochemical and biological) which may affect the water
environment, for example urban water supply, irrigation and industrial processes. However,
how all these factors interconnect is not well known [Henriques, 2006] and few of these
developments have filtered into academic curricula, and even fewer into engineering
practice. The main reasons for this seem to be the large amount of data required and the
lack of engineers trained to deal with phenomena of a stochastic nature, including optimum
cost/benefit decisions under uncertainty.
The fact that in recent years a number of submarine outfalls suffered damage,
[Ombudsman1998] including accidents in Portugal [Reis2003], caused by a combination of
aspects (wave climate, structural strength, geotechnical stability, constructability), highlighted
that their good working
Failure modes and limit states for submarine outfalls 2.4.1
The first step of a deterministic or a risk design approach (see Error! Reference source
not found. ) of submarine outfalls, as well as other maritime structure, is the definition of the
possible failure modes.
Maritime structures are built to protect goods and services from the actions of the sea
and atmosphere. It is not usually possible, mainly for economic reasons, to build maritime
structures capable of operating under all prevailing meteorological and marine conditions.
Despite the fact that a structure must remain safe throughout its useful life, it is to be
expected that at times it will not be operational because the dynamic actions of the sea and
atmosphere exceed certain threshold values. For this reason, it is advisable to define
operational limit states, which unlike the ultimate and serviceability limit states, make it
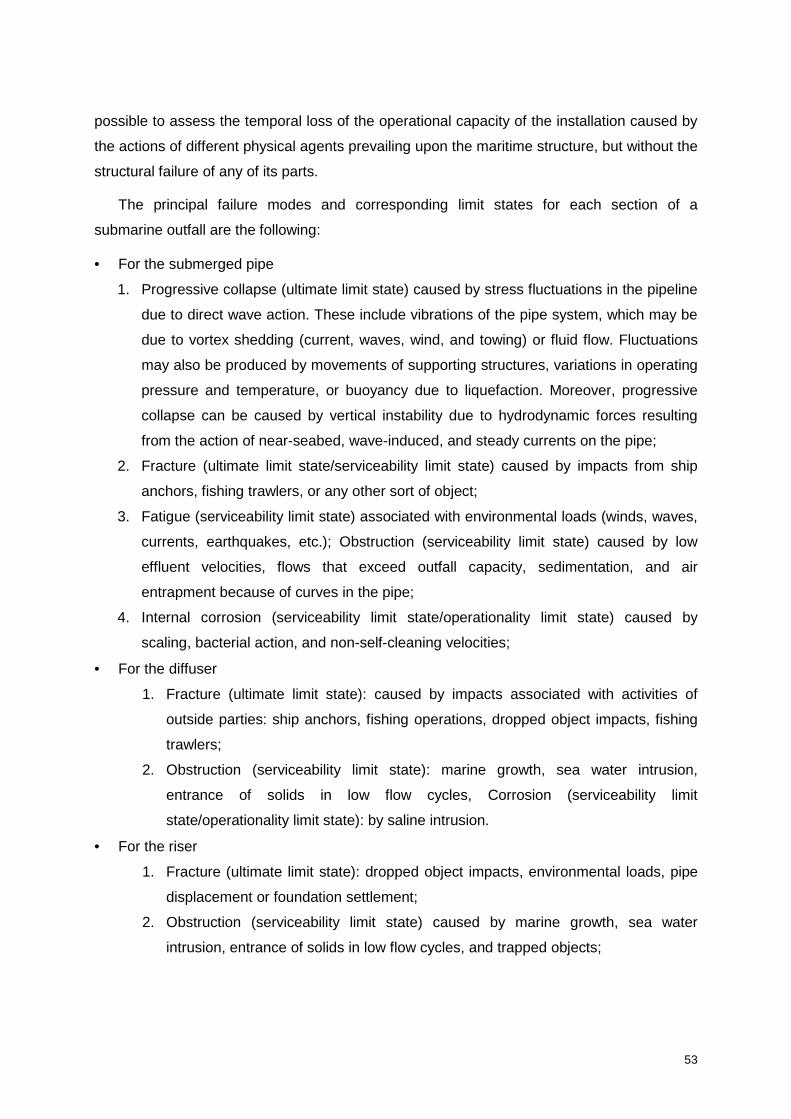
53
possible to assess the temporal loss of the operational capacity of the installation caused by
the actions of different physical agents prevailing upon the maritime structure, but without the
structural failure of any of its parts.
The principal failure modes and corresponding limit states for each section of a
submarine outfall are the following:
• For the submerged pipe
1. Progressive collapse (ultimate limit state) caused by stress fluctuations in the pipeline
due to direct wave action. These include vibrations of the pipe system, which may be
due to vortex shedding (current, waves, wind, and towing) or fluid flow. Fluctuations
may also be produced by movements of supporting structures, variations in operating
pressure and temperature, or buoyancy due to liquefaction. Moreover, progressive
collapse can be caused by vertical instability due to hydrodynamic forces resulting
from the action of near-seabed, wave-induced, and steady currents on the pipe;
2. Fracture (ultimate limit state/serviceability limit state) caused by impacts from ship
anchors, fishing trawlers, or any other sort of object;
3. Fatigue (serviceability limit state) associated with environmental loads (winds, waves,
currents, earthquakes, etc.); Obstruction (serviceability limit state) caused by low
effluent velocities, flows that exceed outfall capacity, sedimentation, and air
entrapment because of curves in the pipe;
4. Internal corrosion (serviceability limit state/operationality limit state) caused by
scaling, bacterial action, and non-self-cleaning velocities;
• For the diffuser
1. Fracture (ultimate limit state): caused by impacts associated with activities of
outside parties: ship anchors, fishing operations, dropped object impacts, fishing
trawlers;
2. Obstruction (serviceability limit state): marine growth, sea water intrusion,
entrance of solids in low flow cycles, Corrosion (serviceability limit
state/operationality limit state): by saline intrusion.
• For the riser
1. Fracture (ultimate limit state): dropped object impacts, environmental loads, pipe
displacement or foundation settlement;
2. Obstruction (serviceability limit state) caused by marine growth, sea water
intrusion, entrance of solids in low flow cycles, and trapped objects;
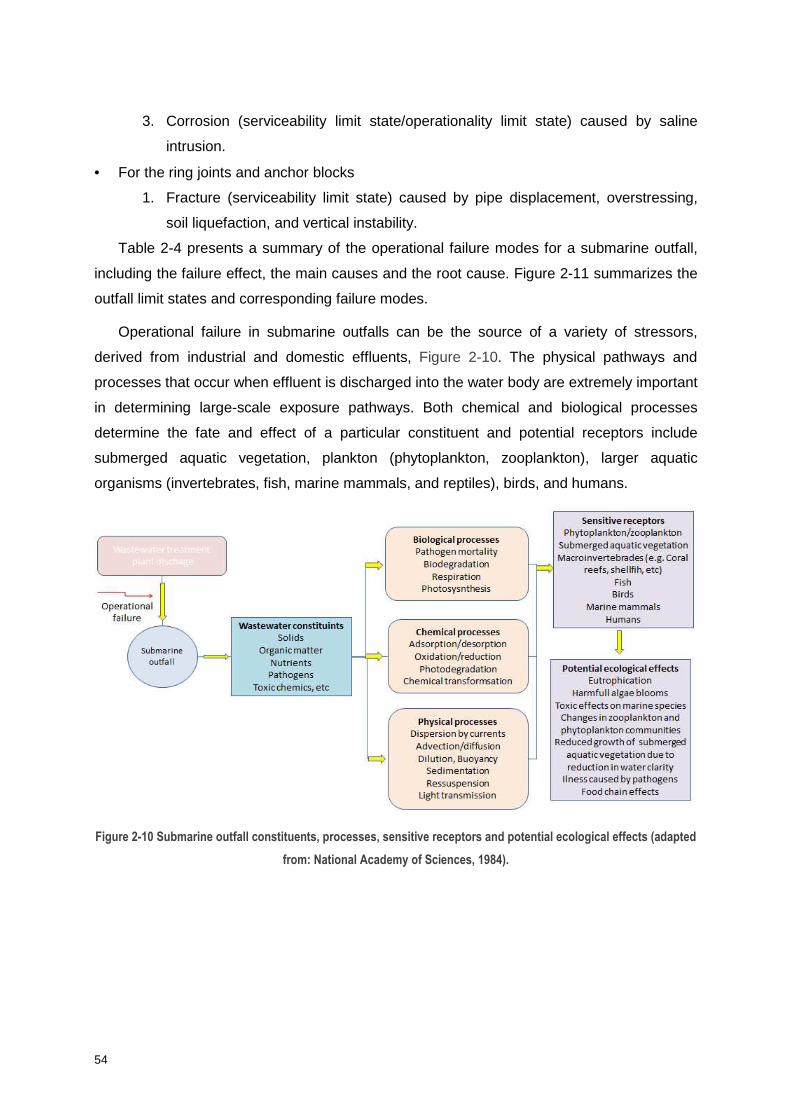
54
3. Corrosion (serviceability limit state/operationality limit state) caused by saline
intrusion.
• For the ring joints and anchor blocks
1. Fracture (serviceability limit state) caused by pipe displacement, overstressing,
soil liquefaction, and vertical instability.
Table 2-4 presents a summary of the operational failure modes for a submarine outfall,
including the failure effect, the main causes and the root cause. Figure 2-11 summarizes the
outfall limit states and corresponding failure modes.
Operational failure in submarine outfalls can be the source of a variety of stressors,
derived from industrial and domestic effluents, Figure 2-10. The physical pathways and
processes that occur when effluent is discharged into the water body are extremely important
in determining large-scale exposure pathways. Both chemical and biological processes
determine the fate and effect of a particular constituent and potential receptors include
submerged aquatic vegetation, plankton (phytoplankton, zooplankton), larger aquatic
organisms (invertebrates, fish, marine mammals, and reptiles), birds, and humans.
Figure 2-10 Submarine outfall constituents, processes, sensitive receptors and potential ecological effects (adapted
from: National Academy of Sciences, 1984).

55
Table 2-4 Operational failure modes for submarine outfalls.
FAILURE EFFECTS
FAILURE MODES CAUSES ROOT CAUSE
Hydraulic Pipe Obstruction
Flows that exceed outfall capacity
Blockage by marine growth in the upstream pipe. Action by nets and solid objects.
Changes in effluent composition : minimum velocities required for self-cleansing not respected.
Malfunction of the self-regulating valve .
Air intrusion : pipe curvatures, high slopes that influence additional sedimentation and air accumulation.
Improper equipment maintenance
Design deficiency
Changes in effluent composition
Poor control procedures
Hydraulic Diffuser
Clogging/ Obstruction
Blockage caused by marine growth or greasy substances around and inside the diffuser reducing partly or totally the flow section.
Sea water intrusion.
Entrance of oceanic sediments such as sill or sand.
Improper equipment maintenance
Poor control procedures
Low flux periods
Sea water and effluent density differences
Hydraulic Risers Obstruction
Blockage by marine growth or greasy substances.
Improper equipment maintenance
Poor control procedures
Environmental
Inefficient Plume
Dispersion
Insufficient dilution , insufficient dispersion. Offensive matter in effluent.
Effects of currents and wind .
Design deficiency
Installation errors
Improper equipment maintenance
Poor monitoring measures
Exceedance of Legislated
Values
Extreme events (e.g. high rainfall).
Effects of currents and wind .
Poor monitoring measures
Design deficiency
Improper equipment maintenance
Hydraulic Manholes Surcharging
Supercritical velocities � hydraulic jumps � pipes flowing full
Design deficiency
Hydraulic Buoyancy
due to Liquefaction
When soil liquefies, it behaves like a thick fluid; the pipe embedded in it will be subjected to the buoyant force from below.
Design deficiency

56
Figure 2-11 Schematic layout of an outfall limit states and corresponding failure modes.
57
2.5 Conclusions
This chapter describes submarine outfall main sections: onshore headwork, pipeline and
diffuser.
The functional design include the importance of water quality objectives when designing
a submarine outfall and the principal constituents in wastewater and their impact on the
marine environment are described. Moreover physical aspects of hydrodynamic mixing
processes that determine the fate and distribution of the effluent from the discharge location,
and the formulation of mixing zone regulations that intend to prevent any harmful impact of
the effluent on the aquatic environment and associated uses are highlighted together with
how potential microbial stressors are considered in the design.
A summary of the structural design of submarine outfalls is presented regarding its
integrity and stability (horizontal and vertical forces, hydrostatic pressure, stability of the pipe
on the seabed and diffuser.
A historical review of pipeline design evolution formats with different risk methodologies is
presented: from the traditional design where load factors typical have been used in the
design of pipe wall thickness to a complete risk based design where relevant failure modes
are identified and evaluated with respect to failure probabilities and failure consequences,
and then checked against acceptable risk levels. The common goal is that submarine outfalls
systems should be operated at an acceptable level of safety, at minimum cost and with a
large degree of operating flexibility. The principal failure modes and corresponding limit
states, first step of the design, are identified and particular attention is given to operational
failure modes since they are the focus of the methodology presented in this study.
The demands that are made on the level of protection against pollution also have to be
based on balancing of social costs against the benefits of improved submarine outfalls
design. However, the balance between costs and benefits can also change as a result of
changing social insights, the occurrence of polluting events and environmental or human
consequences, or the future climate agents’ change. To include all these aspects in the
design, it is necessary to have the new design techniques centered on risk- management
approach based on methodologies which account for randomness and uncertainty, that
incorporate all the existing information and data that account for the probability of failure of
the structures and its consequences. This study aims to be the first step in a conceptual risk
assessment methodology for operational limit states in submarine outfall projects.

58
59
3 | Intrinsic Nature of a Submarine Outfall
This chapter has been published integrally in the Journal of Environmental Management (2012):
Mendonça, A., Losada, M. A., Reis, M. T. and Neves, M. G. 2013. Risk Assessment in Submarine Outfall
Projects: the Case of Portugal. J. Env. Management, Elsevier, 116:186-95. doi: 10.1016/j.jenvman.2012.12.003
This chapter has been published partially as oral communication in the International Symposium on Outfall
Systems (2011):
Mendonça, A., Losada, M., Reis, M.T., Neves, M.G. 2011 “Incorporating probabilistic assessment of risks
and optimization methods into submarine outfall and water intake projects”. International Symposium on Outfall
Systems, 15-18 Mai, Mar del Plata, Argentina
3.1 Introduction
For a variety of reasons, an outfall structure may lose its resistance, structural capacity,
and/or operational capacity. This total or partial loss may take place at different speeds and
be temporary or permanent. The project design should thus be able to assure that the
structure will be reliable, functional, and operational. Consequently, values or target levels of
these attributes should be specified in the project design phase before the structure is
actually built. Evidently, the construction and maintenance costs of the outfall as well as its
use and exploitation depend on all of these factors.
The European Water Framework Directive (WFD 2000/60/EC) developed the concept of
Ecological Quality Status for the assessment of water masses and for the establishment of
water quality objectives. The designing of submarine outfalls is not fully contemplated in
some countries legislation. In the Portuguese legislation wastewater treatment plants
(WWTP) are the ones that require an Environmental Impact assessment (EIA) (Decree-Law
No.69/2000 of 3 May and Decree-Law No.197/2005 of 8 November). These studies can also
be required by the financing entity or within the administrative framework process. Moreover,
should be considered: Directive No.2006/7/CE, of the European Parliament and of the
Council of 15 February 2006, concerning the management of bathing water quality or other
specific local legislation.
The specification of target design levels of reliability, functionality, and operationality is far
from trivial. Decisions regarding a submarine outfall project should be based on previous
studies of the economic, social, and environmental impacts of the construction. However,
when one or more of such studies are not available, engineers need guidelines that will help
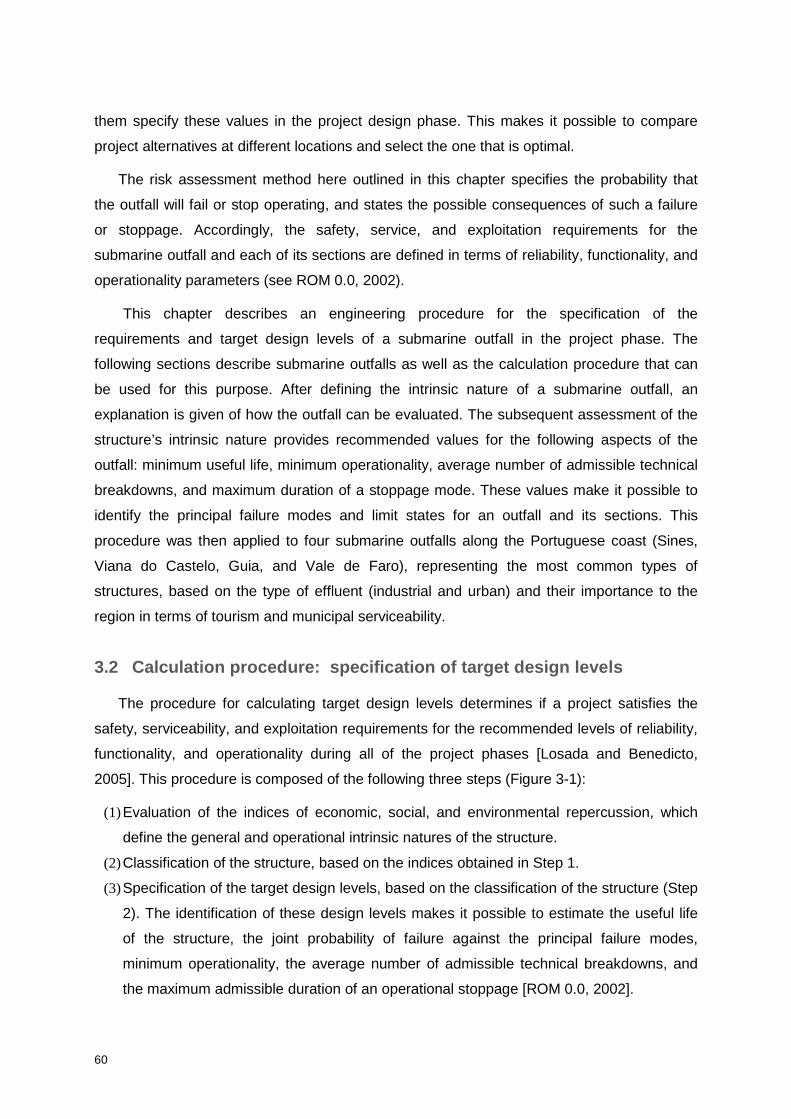
60
them specify these values in the project design phase. This makes it possible to compare
project alternatives at different locations and select the one that is optimal.
The risk assessment method here outlined in this chapter specifies the probability that
the outfall will fail or stop operating, and states the possible consequences of such a failure
or stoppage. Accordingly, the safety, service, and exploitation requirements for the
submarine outfall and each of its sections are defined in terms of reliability, functionality, and
operationality parameters (see ROM 0.0, 2002).
This chapter describes an engineering procedure for the specification of the
requirements and target design levels of a submarine outfall in the project phase. The
following sections describe submarine outfalls as well as the calculation procedure that can
be used for this purpose. After defining the intrinsic nature of a submarine outfall, an
explanation is given of how the outfall can be evaluated. The subsequent assessment of the
structure’s intrinsic nature provides recommended values for the following aspects of the
outfall: minimum useful life, minimum operationality, average number of admissible technical
breakdowns, and maximum duration of a stoppage mode. These values make it possible to
identify the principal failure modes and limit states for an outfall and its sections. This
procedure was then applied to four submarine outfalls along the Portuguese coast (Sines,
Viana do Castelo, Guia, and Vale de Faro), representing the most common types of
structures, based on the type of effluent (industrial and urban) and their importance to the
region in terms of tourism and municipal serviceability.
3.2 Calculation procedure: specification of target design levels
The procedure for calculating target design levels determines if a project satisfies the
safety, serviceability, and exploitation requirements for the recommended levels of reliability,
functionality, and operationality during all of the project phases [Losada and Benedicto,
2005]. This procedure is composed of the following three steps (Figure 3-1):
(1) Evaluation of the indices of economic, social, and environmental repercussion, which
define the general and operational intrinsic natures of the structure.
(2) Classification of the structure, based on the indices obtained in Step 1.
(3) Specification of the target design levels, based on the classification of the structure (Step
2). The identification of these design levels makes it possible to estimate the useful life
of the structure, the joint probability of failure against the principal failure modes,
minimum operationality, the average number of admissible technical breakdowns, and
the maximum admissible duration of an operational stoppage [ROM 0.0, 2002].

61
Figure 3-1 Intrinsic nature of a submarine outfall [revised and adapted from the ROM 0.0 (2002)]1..
3.3 General and operational intrinsic nature
The importance of a maritime structure or one of its sections as well as the economic,
social, and environmental impact produced in the case of serious damage or destruction or
total loss of service and functionality can be evaluated by means of the general intrinsic
nature (GIN) of the structure or any of its sections (Figure 3-1). The GIN is assessed by
selecting the failure mode that gives the highest repercussion value from the principal modes
assigned to the ultimate (ULS) and serviceability (SLS) limit states [ROM 0.0, 2002].
The general intrinsic nature of the structure is a function of the economic repercussion
index (ERI) and the social and environmental repercussion index (SERI), which classify the
structure in terms of two values (Ri, Si)1. The ensuing economic repercussions and the social
and environmental repercussions when the maritime structure stops functioning or reduces
its operational level are specified by its operational intrinsic nature (OIN). The OIN is
evaluated by selecting the operational stoppage mode that gives the minimum operational
1 The indices for submarine outfalls in the following sections are a revised and adapted version of the indices for maritime structures in the ROM 0.0.

62
level. It is then specified in terms of the operational index of economic repercussion (OIER)
and the operational index of social and environmental repercussion (OISER). The structure is
thus classified in terms of two values (RO,i, SO,i)2.
Economic Repercussion Index 3.3.1
This Economic Repercussion Index (ERI) quantitatively assesses the economic
repercussions of rebuilding the structure (CRD) and the negative consequences for the
economic activities related to the structure (CRI) in the event that it is destroyed or can no
longer be used (Figure 3-2). The repercussions cost (CRI) can be used to evaluate the
economic repercussions that are the consequences of the economic activities directly related
to the structure in the event of its destruction or total loss of exploitation capacity. These
activities refer to services offered after the structure has begun to function as well as to
services demanded because of damage to the goods being protected. The cost is valued in
terms of loss of gross added value at market prices during the time period that the rebuilding
is supposed to take place after the destruction or loss of operationality of the structure. The
cost is considered to occur once the economic activities directly related to the structure are
consolidated [ROM 0.0, 2002; Losada and Benedicto, 2005].The ERI is defined by:
0CRICRDC
ERI+
= (3. 1)
in which C0 is an economic parameter of dimensionalization. The value of this parameter
depends on the economic structure and the level of economic development in the country
where the structure will be built and consequently will vary over time. This value may be
representative of the average unit investment cost per meter of a maritime structure in the
country [Losada and Benedicto, 2005]. Based on their ERI value, submarine outfalls can be
classified in three groups (Ri, i = 1, 2, 3):
• R1: structures with low economic repercussion: ERI ≤ 5
• R2: structures with moderate economic repercussion: 5 < ERI ≤ 8
• R3: structures with high economic repercussion: ERI > 8
These scales are based on expert judgment and available information that characterizes
the structure’s importance (effluent volume, project flow, population served, population
equivalent, interviews to local people, etc).
2 In the absence of such a specification, the general intrinsic nature must be determined by the developer of the maritime structure.
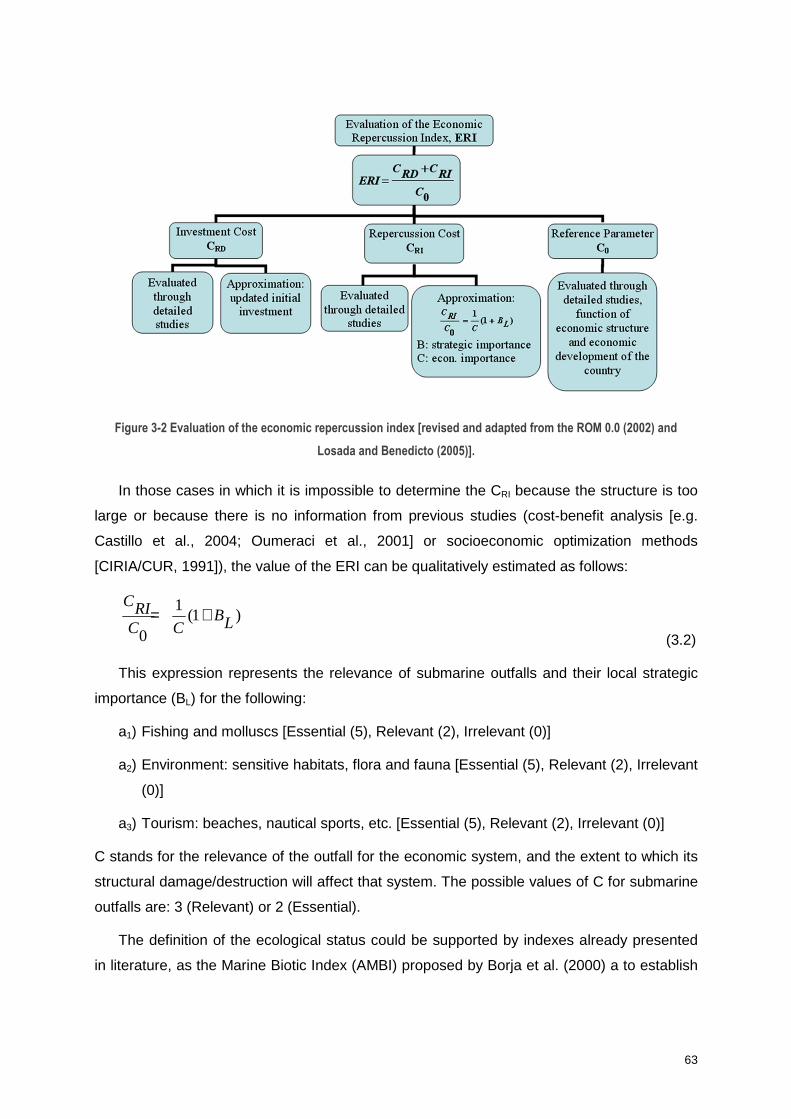
63
Figure 3-2 Evaluation of the economic repercussion index [revised and adapted from the ROM 0.0 (2002) and
Losada and Benedicto (2005)].
In those cases in which it is impossible to determine the CRI because the structure is too
large or because there is no information from previous studies (cost-benefit analysis [e.g.
Castillo et al., 2004; Oumeraci et al., 2001] or socioeconomic optimization methods
[CIRIA/CUR, 1991]), the value of the ERI can be qualitatively estimated as follows:
)1(1
0LB
CCRIC
+= (3.2)
This expression represents the relevance of submarine outfalls and their local strategic
importance (BL) for the following:
a1) Fishing and molluscs [Essential (5), Relevant (2), Irrelevant (0)]
a2) Environment: sensitive habitats, flora and fauna [Essential (5), Relevant (2), Irrelevant
(0)]
a3) Tourism: beaches, nautical sports, etc. [Essential (5), Relevant (2), Irrelevant (0)]
C stands for the relevance of the outfall for the economic system, and the extent to which its
structural damage/destruction will affect that system. The possible values of C for submarine
outfalls are: 3 (Relevant) or 2 (Essential).
The definition of the ecological status could be supported by indexes already presented
in literature, as the Marine Biotic Index (AMBI) proposed by Borja et al. (2000) a to establish

64
the ecological quality of soft-bottom benthos within European estuarine and coastal
environments.
Social and Environmental Repercussion Index 3.3.2
Submarine outfalls should guarantee the protection of aquatic ecosystems and enhance
the status of these ecosystems by minimizing risks to human health and protecting the
environmental value of the waters. Outfall project design should also consider the potential
(direct or indirect) impact of the structure on food chain processes. According to the ROM 0.0
(2002), the Social and Environmental Repercussion Index (SERI) qualitatively assesses the
social and environmental repercussions produced if the maritime structure is destroyed or
can no longer operate. The factors evaluated are the following:
• SERI1: impact on human health
• SERI2: damage to the environment and habitats
• SERI3: degree of social disruption when the failure occurs after the economic
activities directly related to the structure have been consolidated
Based on their SERI values, submarine outfalls have been classified in three groups (Si,
i = 1, 2, 3):
• S1: structures with low social and environmental impact, SERI ≤ 10
• S2,: structures with moderate social and environmental impact, 10 < SERI < 20
• S3: structures with high social and environmental impact, SERI ≥ 20
The SERI is defined as the sum total of the three subindices [ROM 0.0 2002]:
∑=
=3
1i iSERISERI (3.3)
Table 9 shows the subindex categories. The SERI1 is represented as:
[ ]CBi iaSERI +∑ == 311 (3.4)
where:
• ai is the direct impact from bathing in contaminated waters and having contact with
contaminated sand, potentially resulting in the following:
� a1: skin irritations [Irrelevant (0), Relevant (1)]
� a2: digestive problems [Irrelevant (0), Relevant (2)]

65
� a3: chronic diseases [Irrelevant (0), Relevant (5)]
• B is the indirect impact produced by the consumption of fish and molluscs [Irrelevant (0),
Relevant (2)].
• C is the sensitivity of the coastal area [Standard or Less Sensitive (1), Sensitive (2)].
In this respect, Portuguese law (i.e. Decreto-Lei n.º 152/97) defines coastal zones as
‘sensitive’ or ‘less sensitive’. The Algarve coast is included in the first category, whereas the
rest of the coast is included in the second.
Minimum Useful Life 3.3.3
The duration of a structure’s useful life (V) should be at least the value in Table 3-1,
based on the ERI of the submarine outfall. This table shows the results obtained in the four
case studies analyzed. The useful life of the outfall is initially defined for the three classes of
the ERI.
Table 3-1 Minimum useful life.
ECONOMIC REPERCUSSION INDEX USEFUL LIFE (YEARS)
ERI ≤ 5 15 ≤ V < 25
5 < ERI ≤ 8 25 ≤ V ≤ 50
ERI > 8 V > 50
Operational Index of Economic Repercussion 3.3.4
The operational index of economic repercussion (OIER) quantitatively assesses the costs
resulting from the operational stoppage of the structure. The value of the OIER can be
qualitatively estimated as shown in the next section. Based on their OIER value, submarine
outfalls can be classified in three groups (RO,i, i = 1, 2, 3):
• RO,1: structures with low economic repercussion (OIER ≤ 5)
• RO,2: structures with moderate economic repercussion (5 < OIER ≤ 20)
• RO,3: structures with high economic repercussion (OIER > 20)
The OIER is determined by the following formula [ROM 0.0 2002]:
[ ]EDFOIER += (3.5)
where D evaluates the simultaneity of the period of demand affected by the structure and the
period of agent intensity defining the serviceability level; E stands for the intensity of use in
the time period; and F refers to the adaptability of the demand and economic context to the

66
operational stoppage. Evidently, if the demand can easily adapt to the stoppage, the
economic repercussions of the stoppage are negligible (e.g. when a submarine outfall fails
and the effluent can be stored or re-directed to another available submarine outfall). These
coefficients can be determined with the values in Table 3-2.
Table 3-2 Evaluation parameters for the operational index of economic repercussion.
D E F
CLASSIFICATION VALUE CLASSIFICATION VALUE CLASSIFICATION VALUE
Non-simultaneous periods 0 Not intensive 0 High 0
Semi-simultaneous periods 3 Intensive 3 Moderate 1
Simultaneous periods 5 Very intensive 5 Low 3
Operational Index of Social and Environmental Repercussion 3.3.5
The Operational Index of Social and Environmental Repercussion (OISER) qualitatively
assesses the social and environmental repercussions in the event that the submarine outfall
stops operating (Figure 3-3). In most maritime structures, the OISER is zero since once an
operational stoppage occurs, all possible causes of environmental impact also disappear.
However, the stoppage of submarine outfalls can generate significant social and
environmental repercussions. Submarine outfalls have been classified in three groups (SO,i,
i = 1, 2, 3):
• SO,1: structures with low social and environmental impact (OISER < 20)
• SO,2: structures with high social and environmental impact (20 ≤ OISER < 30)
• SO,3: structures with a very high social and environmental impact (OISER ≥ 30)

67
Figure 3-3 Evaluation of the OISER [revised and adapted from the ROM 0.0 (2002) and Losada and Benedicto (2005)].
For submarine outfalls, the OISER is defined by the sum total of the following three
subindices [ROM 0.0 2002]:
∑=
=3
1i iOISEROISER (3.6)
Table 3-12 shows the evaluation of these subindices.
Use and Exploitation of a Structure during its Useful Life 3.3.6
The exploitation of any section of a structure can be defined in terms of the following:
(i) minimum levels of operationality (in a specified time period based on previous
economic studies);
(ii) average number of stoppages (in a time interval linked to social and
environmental factors);
(iii) maximum admissible duration of a stoppage in a time interval that depends on
economic factors and the cycle of demand.
3.3.6.1 Average Number of Stoppages
In a given time interval (usually a year), and for those cases in which it has not already
been specified, the average number of occurrences of all modes assigned to stoppage limit
states (Nstop) corresponds to the value shown in Table 3-3 . If the operational stoppage has
social and environmental repercussions (SO,3), no stoppages must be allowed to occur. The
submarine outfall should thus always be kept operational except in the event of extraordinary
unforeseen conditions.

68
The main reasons that submarine outfalls stop operating are the obstruction of the pipe
and diffuser, exceedance of the recommended limit values for the effluent discharge, and the
use of a bypass. Bypasses can pose a direct health risk to people who come into contact
with contaminated water. However, they can also indirectly affect people that consume
contaminated seafood (e.g. shellfish). Such stoppages mostly occur in periods of heavy rain
when the effluent exceeds the submarine outfall capacity. Information concerning bypasses
can help to determine whether operations or maintenance practices need to be improved or if
an upgrade of the submarine outfall is required. Nstop can be evaluated as follows (Table 3-3):
∑ == 31i iLstopN
(3.7)
where
• L1: Exceedance of limit values for the discharge
• L2: Obstruction of the pipe or diffuser
• L3: Bypass of the effluent due to overflow
Table 3-3 Parameters defining the average number of stoppages in the time interval.
L1 L2 L3 ∑ ==
3
1i istop LN
SERI ≤ 10 8 1 3 12
10 < SERI < 20 4 1 2 7
SERI ≥ 20 2 1 1 4
3.3.6.2 Maximum Duration of Stoppage
During the structure’s useful life (and when there are no previous specifications), the
probable maximum duration of a stoppage (in hours) cannot exceed the value in Table 3-4,
based on the OIER and OISER of the affected section of the structure.

69
Table 3-4 Probable maximum duration of a stoppage mode (hours).
OPERATIONAL INDEX
OF ECONOMIC
REPERCUSSION
OPERATIONAL INDEX OF SOCIAL AND
ENVIRONMENTAL REPERCUSSION
OISER < 20 20 ≤ OISER < 30 OISER ≥ 30
OIER ≤ 5 24 12 6
5 < OIER ≤ 20 12 6 3
OIER > 20 8 4 2
3.4 Limit States and Failure Modes for Submarine Outfalls
The procedure described in the ROM 0.0 (2002) specifies the overall probability of failure
in the useful life of a maritime structure for all the principal modes ascribed to limit states.
When principal failure and stoppage modes occur, there are evident consequences for the
reliability, functionality, and operationality of the structure. Moreover, their probability of
occurrence cannot be significantly reduced by increasing the construction cost and therefore
improving the design. A comparative analysis of the increase in cost and expected reduction
in the probability of failure must be performed to determine whether a failure mode is indeed
a principal failure mode. The principal failure modes, and limit states for each section of a
submarine outfall are described in chapter 2 (see 2.2.1)
Maximum safety and serviceability. Probability of failure 3.4.1
The main objective of the methodology is to provide a set of standards and technical
criteria for the design, construction, exploitation, maintenance, and repair of submarine
outfalls.
The general procedure helps to determine if a project design alternative satisfies the
safety, serviceability, and exploitation requirements in consonance with the recommended
levels of reliability, functionality, and operationality during all of the project phases. Moreover
the methodology can be applied to existing outfalls in the perspective of analyzing the
structure’s reliability, functionality, and operationality and possible mitigation measures.
In each project phase, the structure as a whole and each of its subsets, components,
subcomponents, should meet the project requirements for safety, serviceability, and
exploitation.

70
During a structure’s useful life, the maximum overall probability of failure could be
adjusted to the recommended values presented in the next section.
3.4.1.1 Failure Modes ascribed to Ultimate Limit States: Safety requirements
The minimum safety requirements for a submarine outfall (or any of its sections) within
the context of the possible limit states in the serviceability phase are in direct relation to the
consequences of the failure or the destruction of the structure. These consequences can be
evaluated in terms of the general nature of the submarine outfall. The value obtained cannot
be less than the value of the economic repercussion index (ERI) and the social and
environmental repercussion index (SERI). In this sense, greater safety precautions should be
taken when the social or environmental consequences of the breakage are more serious.
The maximum admissible failure probability of a submarine outfall within the context of all
the possible failure modes ascribed to limit states, Pf, ULS, and the structure’s corresponding
useful life and return period, TR, should be less than the maximum values in Table 3-5 for the
social and environmental repercussion index (SERI).
Table 3-5 Maximum overall probability of failure in the structure’s useful life for ultimate limit states.
SOCIAL AND ENVIRONMENTAL REPERCUSSION
INDEX PF, ULS V TR
SERI ≤ 10 0.1 25 240
10 < SERI < 20 0.1 50 475
SERI ≥ 20 0.05 50 975
3.4.1.2 Failure Modes ascribed to Serviceability Limit States: Serviceability
requirements
The minimum functionality of a submarine outfall (or each of its sections) within the
context of the set of serviceability limit states that can arise during the structure’s useful life is
a function of the consequences of a serviceability failure. In regards to useful life, the
structure’s general nature evaluates these consequences. This general nature is specified in
the same way as reliability, given that some of the failure modes ascribed to serviceability
limit states may also entail repairing the structure in order to recover project design
requirements. Similarly, the functionality or service capacity of the structure should be
greater when the social and environmental consequences of failure are more important.

71
The joint probability of failure of a submarine outfall against the principal failure modes
assigned to the serviceability limit states cannot exceed the values in Table 3-6 during the
structure’s useful life. Nonetheless, the recommended values of the joint probability of failure
are purely indicative. Time and experience will eventually provide the necessary information
to adjust these values.
Table 3-6 Maximum overall probability of failure during the structure’s useful life for serviceability limit states.
SOCIAL AND ENVIRONMENTAL REPERCUSSION
INDEX PF, SLS V TR
SERI ≤ 10 0.2 25 112
10 < SERI < 20 0.1 50 475
SERI ≥ 20 0.05 50 975
Minimum operationality. Requirements for Operational Stoppage Modes 3.4.2
The minimum operationality of a submarine outfall (or each of its sections) depends on
the consequences of a stoppage within the context of the operational stoppage limit states
that can arise during the serviceability phase, as well as the average number of stoppages
and maximum duration of a stoppage. For the serviceability phase, the operational nature of
the structure provides an overall evaluation of these consequences. The value, however,
cannot be less than the value obtained for the operational index of economic repercussion
(OIER) and the operational index of social and environmental repercussion (OISER). In this
sense, the structure’s operationality should be greater when the economic consequences of
operational stoppage are more important. During its useful life, the operationality of the
structure or one of its sections in reference to the principal modes assigned to the stoppage
limit states in normal working and operating conditions has to be at least the value in
Table 3-7 in accordance with the OIER.

72
Table 3-7. Minimum operationality in the useful life of the structure.
OPERATIONAL INDEX OF ECONOMIC
REPERCUSSION OPERATIONALITY, r F,OLS
OIER ≤ 5 0.90
5 < OIER ≤ 20 0.95
OIER > 20 0.99
3.5 Case Studies
This research focused on four submarine outfalls located on the Portuguese coastline,
Figure 3-4 a):
(i) Guia outfall in Cascais (Figure 3-4b, 5c), which, serves four municipalities near
Lisbon and which is the widest outfall in Portugal;
(ii) Sines outfall, the site of an important petrochemical industry;
(iii) Viana do Castelo outfall, which receives urban effluents as well as effluents from
a paper industry;
(iv) Vale de Faro outfall, serving an important tourist resort area.

73
Figure 3-4 (a) Submarine outfall location for the case studies; (b) Treatment plant of Guia, Cascais; (c) Submarine
outfall of Guia.
The case studies represent the most common types of submarine outfall in Portugal,
based on the type of effluent (industrial and urban) and their importance to the region in
terms of tourism and municipal serviceability (Table 3-8). The Guia submarine outfall began
operating in 1994. It is 2.8 Km long and has a diameter of 1,200 mm. Located at a depth of
40 m, it discharges approximately 170,000 m3 of urban effluent per day into the Atlantic
Ocean. The structure has a V-shaped geometry with 80 ports in each diffuser. The system
provides sanitation to about 720,000 inhabitants equivalent (I.E.) of four municipalities in the
western area of Lisbon. The population of this region is expected to reach 920,000
inhabitants in 2020, thus making it one of the largest submarine outfalls in Portugal. The
urban wastewater undergoes preliminary treatment, which includes a step-screen to remove
solids (<3 mm) and grit removal prior to discharge [Santos et al., 2008; Sanest et al., 2009;
Santos e Catarino, 2009].
(a) (b)
(c)

74
Table 3-8. Submarine outfall characteristics Source: [Seth, 2010; Santos et al., 2011; Reis et al., 2004].
CHARACTERISTICS GUIA,
CASCAIS
SINES
VIANA DO
CASTELO
VALE DE
FARO
Effluent type
Urban
Industrial (chemical
and refinery) +
urban
Industrial (paper
industry)
Urban
1994 1976 1973 2005
Investment cost 550 000 250 000 3 512 305
Treatment
Preliminary.
Disinfection in
summer
season
Secondary
Secondary
Secondary +
disinfection
Pop Equiv.
750 000
38 000 + Industrial 20 000 (urban) +
industrial
130 000
Exploration flow
(m3/day)
150 000
11 535
3 000
30 000
Project flow (m3/day) 450 000 172 800 77 760 101 952
Length (m) 3 100 2 480 2 200 1020
Maximum depth ZH
(m)
- 41
- 38
- 17
- 11
Pipe diameter (mm) 1 200 1 100 900 1000
Diffuser length (m) 1800 240 100 160
Diffuser ports 2×80 60 15 32
Outfall material
HDPE
Reinforced
concrete (with
steel)
Reinforced
concrete (with
steel)
HDPE
The Sines outfall has been in service since 1978 and discharges approximately 11,535
m3 of industrial effluent (chemicals and refinery) and urban effluent per day. The system
supplies sanitation to about 38,000 I.E. (urban), and the wastewater undergoes secondary
treatment. The outfall is 2,432 m long with a diameter of 1,100 mm, discharges the effluent
from a depth of 38 m and the diffuser has 60 ports [Reis e Neves 2003; Freire 2006].
The Viana do Castelo outfall at Praia do Cabedelo corresponds to 20,000 I.E., and has
been operating since 1973. Its effluent comes from a large paper industry, but it also
75
discharges urban effluent with secondary treatment. The exploration flow is 3,000 m3 per
day. The outfall is 2,250 m long with a diameter of 900 mm and discharges its effluent from a
depth of 17.5 m. The diffuser has 15 ports [Reis e Neves 2003; Freire 2006].
The Vale de Faro outfall has been operating since 1986 and is located in Praia do Inatel,
Albufeira, an important tourist area with a floating population of 14,000 habitants in summer.
The system supplies sanitation to about 130,000 I.E. In the summer, it receives urban
effluent with secondary treatment, which has also been disinfected. The outfall is 956 m long
with a diameter of 400 mm and discharges its effluent at a depth of 8 m. The diffuser has 8
ports [WW 2004].
The first step in this research study was to define the general and operational intrinsic
natures of the outfalls and specify their target design levels. We thus used the general
calculation procedure (see Section 3.2) to evaluate the indices of economic, social, and
environmental repercussions (ERI and SERI) for each outfall. Table 3-9 shows the parameter
values of the economic repercussion index (ERI) for each case study. These ERI values
indicate that the economic repercussions of the destruction or total loss of exploitation
capacity of the outfalls are low for Guia (ERI ≤ 5); moderate for Viana do Castelo and Vale
de Faro (5 < ERI ≤ 8); and high for Sines (ERI > 8).
Table 3-10 gives the parameter values of the social and environmental repercussion index
(SERI) for the four submarine outfalls. These SERI values indicate that the social and
environmental repercussions of the destruction or total loss of operationality of the outfalls
are low for Guia (SERI ≤ 10); moderate for Viana do Castelo and Vale de Faro
(10 < SERI < 20); and high for Sines (SERI ≥ 20).

76
Table 3-9 Parameter values of the economic repercussion index (ERI) for the case studies [source: Reis et al., 2004;
Seth, 2010].
PARAMETER DEFINITION PARAMETER GUIA,
CASCAIS SINES
VIANA DO
CASTELO
VALE DE
FARO
Updated investment cost CRD
(euros) - 880,000 600,000 250,000 240,000
Dimensionalization parameter,
C0 - 300,000 300,000 300,000 300,000
0CCRD - 2.93 2.0 0.83 0.8
Coefficient of economic
importance, C
3: Relevant 2:
Essential 3 2 2 2
Fishing/molluscs, a1
0: Irrelevant; 2:
Relevant 5:
Essential
2 5 5 5
Tourism, a2
0: Irrelevant; 2:
Relevant 5:
Essential
2 2 2 5
Environment and protected
habitats, a3
0: Irrelevant; 2:
Relevant 5:
Essential
0 5 5 0
Affected areas, BL ∑ =
3
1i ia
- 4 12 12 10
[ ]LRI BCCC +×= 110 - 1.67 6.5 6.5 5.5
ERI
00 CCCC RIRD +
- 4.60 8.5 7.33 6.3

77
Table 3-10 Parameter values of the social and environmental repercussion index (SERI) for the case studies.
PARAMETER DEFINITION PARAMETER GUIA,
CASCAIS SINES VIANA DO
CASTELO
VALE DE
FARO
Skin irritations a1 0: Irrelevant 1: Relevant 1 1 1 1
Digestive problems a2 0: Irrelevant 2: Relevant
2 2 2 2
Chronic diseases a3 0: Irrelevant 5: Relevant 0 5 5 0
Indirect, ingestion of fish and molluscs B
0: Irrelevant 2: Relevant 0 2 2 2
Coastal area C 1: Standard 2: Sensitive
1 1 1 2
SERI1 [ ] CBa
i i ×+∑ =
3
1 - 3 10 10 10
SERI2
0: Remote 2: Low 4: Moderate 8: High 15:Very high
2 4 4 2
SERI3
0: Low 5: Moderate 10: High 15: Very high
5 10 5 5
SERI ∑ =
3
1i iSERI
- 10 24 19 17
As part of this first step, it was also necessary to evaluate the indices of economic, social,
and environmental repercussion (OIER and OISER). This study found that the obstruction of
the submarine outfalls was the stoppage mode that resulted in the minimum operational
level. Table 3-11 shows the values of parameters D, E, and F, which were used to quantify
the OIER, taking into account that:
• All of the outfalls operate non-stop year round. However, the period of agent intensity
that defines the serviceability level (e.g. fracture due to direct wave action) occurs
only at certain times, though mainly in winter. The simultaneity of the period of
demand is thus D=3 (semi-simultaneous periods) in all cases;
• The intensity (E) of use and demand in the case of Sines and Viana do Castelo, both
of which are industrial and mixed submarine outfalls, is defined as very intense (E=5).
Since Guia receives urban effluent from four municipalities, it is considered intense,
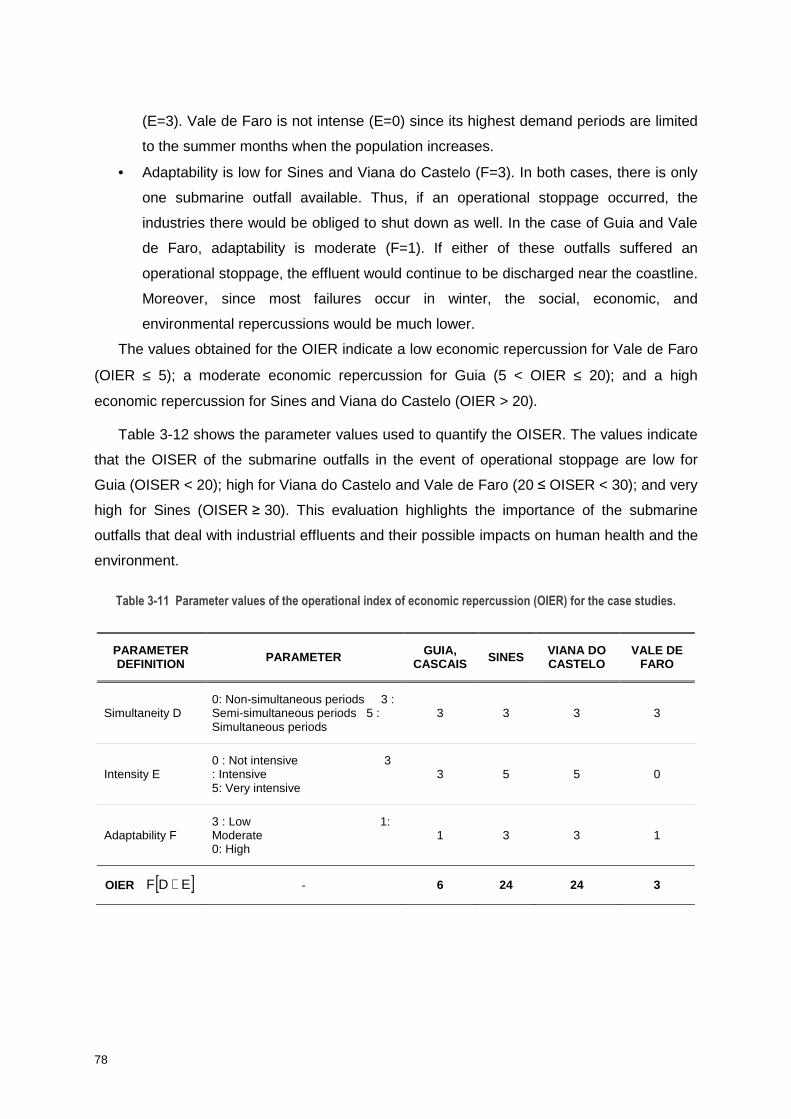
78
(E=3). Vale de Faro is not intense (E=0) since its highest demand periods are limited
to the summer months when the population increases.
• Adaptability is low for Sines and Viana do Castelo (F=3). In both cases, there is only
one submarine outfall available. Thus, if an operational stoppage occurred, the
industries there would be obliged to shut down as well. In the case of Guia and Vale
de Faro, adaptability is moderate (F=1). If either of these outfalls suffered an
operational stoppage, the effluent would continue to be discharged near the coastline.
Moreover, since most failures occur in winter, the social, economic, and
environmental repercussions would be much lower.
The values obtained for the OIER indicate a low economic repercussion for Vale de Faro
(OIER ≤ 5); a moderate economic repercussion for Guia (5 < OIER ≤ 20); and a high
economic repercussion for Sines and Viana do Castelo (OIER > 20).
Table 3-12 shows the parameter values used to quantify the OISER. The values indicate
that the OISER of the submarine outfalls in the event of operational stoppage are low for
Guia (OISER < 20); high for Viana do Castelo and Vale de Faro (20 ≤ OISER < 30); and very
high for Sines (OISER ≥ 30). This evaluation highlights the importance of the submarine
outfalls that deal with industrial effluents and their possible impacts on human health and the
environment.
Table 3-11 Parameter values of the operational index of economic repercussion (OIER) for the case studies.
PARAMETER DEFINITION PARAMETER GUIA,
CASCAIS SINES VIANA DO CASTELO
VALE DE FARO
Simultaneity D 0: Non-simultaneous periods 3 : Semi-simultaneous periods 5 : Simultaneous periods
3 3 3 3
Intensity E 0 : Not intensive 3 : Intensive 5: Very intensive
3 5 5 0
Adaptability F 3 : Low 1: Moderate 0: High
1 3 3 1
OIER [ ]EDF + - 6 24 24 3

79
Table 3-12 Parameter values of operational index of social and environmental repercussion (OISER) for the case
studies.
PARAMETER DEFINITION PARAMETER GUIA,
CASCAIS SINES VIANA DO CASTELO
VALE DE FARO
Impact on human health
OISER1
3: Relevant 10: High
15: Very high 20: Catastrophic
3 15 10 10
Damage to environment and
habitats
OISER2
2: Low 4: Moderate
8: High 15: Very high
4 15 8 8
Degree of social alarm OISER3
0: Low 5: Moderate
10: High 15: Very high
5 15 10 10
OISER
∑ =
3
1i iOISER - 12 45 28 28
In the second step of this procedure, the four submarine outfalls were classified, based
on the indices obtained in the first step. Since fracture is the worst failure mode ascribed to
an ultimate limit state, the following conclusions can be derived:
• The economic repercussion is low for Guia (R1); moderate for Viana do Castelo and
Vale de Faro (R2); and high for Sines (R3).
• The social and environmental impact is low for Guia (S1); moderate for Viana do
Castelo and Vale de Faro (S2); and high for Sines (S3).
• When obstruction occurs, the economic repercussion is high for all four outfalls (RO,3).
In contrast, the social and environmental impact is low for Guia (SO,1); high for Viana
do Castelo and Vale de Faro (SO,2); and very high for Sines (SO,3).
3.6 Conclusions
In this chapter a risk assessment procedure was described for the project design phase
of submarine outfalls. The methods and tools used account for randomness and uncertainty,
and are also conducive to cost optimization. This work outlines the initial steps of a
procedure that facilitates decision-making in regards to the target design levels for submarine
outfalls, whatever the materials, techniques, and elements used in their construction. This
80
procedure is a revised and adapted version of the ROM 0.0 classification of maritime
structures in terms of their general and operational intrinsic natures, based on various
repercussion indices [ROM 0.0, 2002; Losada and Benedicto, 2005]. These indices evaluate
the economic, social, and environmental consequences of the most severe failure and
stoppage modes.
This procedure was applied to four case studies of submarine outfalls located on the
Portuguese coast. Based on the type of submarine outfall and its importance to economy,
tourism, and the environment, values were obtained for the minimum useful life of the
structure, the joint probability of failure against the principal failure modes, minimum
operationality, average number of admissible technical breakdowns, and the maximum
duration of a stoppage mode.
81
4 | Incorporating a risk assessment procedure into submarine outfall projects
This chapter has been published partially as oral communication in the “International Short Course
Conference on Applied Coastal Research” (2013) and “International Conference on Coastal Engineering” (2012):
Mendonça, A., Solari, S., Losada, M.A., Neves, M.G. and Reis, M.T. 2013. “A tool for the design optimization
and management of submarine outfall projects: application to a Portuguese case-study”. Proceedings of the
International Short Course Conference on Applied Coastal Research, 28, Lisbon, Portugal
Mendonça, A.; Losada, M.A.; Solari, S.; Neves, M.G.; Reis, M.T. 2012. “Incorporating a risk assessment
procedure into submarine outfall projects and application to portuguese case studies”. International Conference
on Coastal Engineering, ICCE2012, 1-6 Jul 2012, Santander, Spain
4.1 Introduction
Submarine outfalls are built for sewage disposal acting as significant elements of an
integrated environmental protection system for coastal areas facilitating and/or creating
possibilities for economic activities within their immediate context. They are generally found
in countries with a densely populated and heavily industrialized coastline. In such contexts, it
is almost inevitable for waste to be discharged into estuaries and the sea [Grace, 2009].
In each project phase, the structure passes through a sequence of project states
characterized by the different values of the project factors. The project of a structure should
respond to project requirements, such as: spatial (site) and temporal (project phases)
domain; requirements for use and exploitation; geometry of the subset and the soil;
properties (parameters) of the physical environment and the materials; and agents that can
interact with the maritime structure and the environment, as well as the specific actions that
they carry out.
The project must verify that in every project state, all requirements pertaining to safety,
serviceability, as well as use and exploitation are satisfied [ROM 0.0, 2002].
The project of a submarine outfall is based on models derived from mathematics and
physics that are used to design and predict the behaviour of the structure during its useful life
and also to quantify the phenomena (physical, chemical, etc.) that affect it. In order to apply
these models, it is necessary to have information about the project factors that participate
either directly or indirectly in such processes.
The engineering procedure, adapted from ROM 0.0 and presented in chapter 3, for the
specification of requirements and target design levels of submarine outfall projects is

82
supported and bound to next step of the study: the development of a risk assessment
procedure for operational failure estimation and application to project design alternatives.
The procedure aims to verify if the proposed design alternatives for a submarine outfall
satisfies the design target levels dependent of the operational intrinsic nature of the structure.
A failure mode and corresponding limit state were selected for this application:
environmental failure mode and operational limit state. In this regard, the study considers the
influence of the physical environment (climate agents) to which the effluent plume will be
subject, and which can produce an inefficient plume dispersion and exceedance of pollutant
threshold values affecting submarine outfall operationality.
For each subset of the structure and for each stoppage mode, a threshold value of the
unfavorable term of the verification equation can be defined so that any values surpassing
the threshold contribute in a significant way to the loss of operationality of the subset against
the mode. This value is known as the threshold value of the mode assigned to an operational
limit state.
When the probability of failure of the subset is evaluated against the mode assigned to an
operational limit state, it is only necessary to consider the states associated with the
exceedance of a certain threshold value of the predominant factor, for which the probability
of stoppage is significant.
The methodology proposed aims to introduce a sufficient safety margin in the structure
design and operationality preventing inefficient plume dispersion and its social,
environmental and economic effects.
The methodology provides information about the conditions of the receiving medium,
predicting a long-term behaviour of the plume near the coastline, which allows a multicriteria
and an adaptative design of these structures assuring that they will remain operational during
their useful life.
The risk assessment procedure is proposed for this operational limit state focusing on
three main topics: environmental legislative framework, climate agents on the coastline and
effluent fate and distribution. The probability of occurrence of failure in the useful life is
calculated by applying Level III Verification Methods (Monte Carlo simulations) using a
methodology presented in Solari and Losada (2013).The results obtained help identifying the
structure’s probability of failure or stoppage and the definition of operational target design
levels enabling decision on project design alternatives.
83
The methodology application to project design alternatives for submarine outfalls allow
drawing solutions flexible enough to be constantly upgraded and improved in order to fulfill
expected environment protection requirements, as the Marine Strategy Framework Directive,
and established target design levels of operationality.
A numerical model TELEMAC-2D [Hervouet and Bates, 2000], is used to simulate
hydrodynamics and the effluent plume behavior in the study area.
Empirical orthogonal functions (EOFs) are applied to TELEMAC-2D results in order to
reduce the dimensionality of the system and find the most important patterns of variability.
To illustrate the procedure, an application to the submarine outfall Vale de Faro, situated
in Albufeira, in the south coast of Portugal, is analyzed and each part of the methodology is
described.
4.2 Limit states and failure modes
The procedure described in the ROM 0.0 (2002) specifies the overall probability of failure
in the useful life of a maritime structure for all the principal modes ascribed to limit states.
Chapter 3 presents the procedure adapted to submarine outfalls considering four
representative structures in the Portuguese coast and the main failure modes regarding
operational limit states are identified and described in chapter 2.
Preservation of satisfactory levels of quality in coastal waters, tied to ecological and
health considerations, must account for the risk that the pollution of such waters represents
for animal and plant species living in the sea, and for man through his use of the marine
environment (bathing) and its products (consumption of marine animals).
The risk that populations may incur from marine pollution comes primarily from two "uses"
of the sea, i.e. bathing and consumption of sea products (especially if they are consumed
raw, which relates mainly to consumption of shellfish). Therefore, regulations are generally
formulated as two series of standards concerning "bathing" and "shellfish culture" and are
based on the maximum content of seawater pollutants at levels which are considered
acceptable in terms of these two risks [UNEP-MAP, 2004]. The high variability of marine
conditions means that sustainable and efficient management of the outfall must be also
available for these conditions. Accordingly, this study focus on the environmental failure
effects of submarine outfalls related to the inefficient plume dispersion. The environmental
values considered should be centered on the aquatic ecosystem and recreational activities
(including aesthetics).
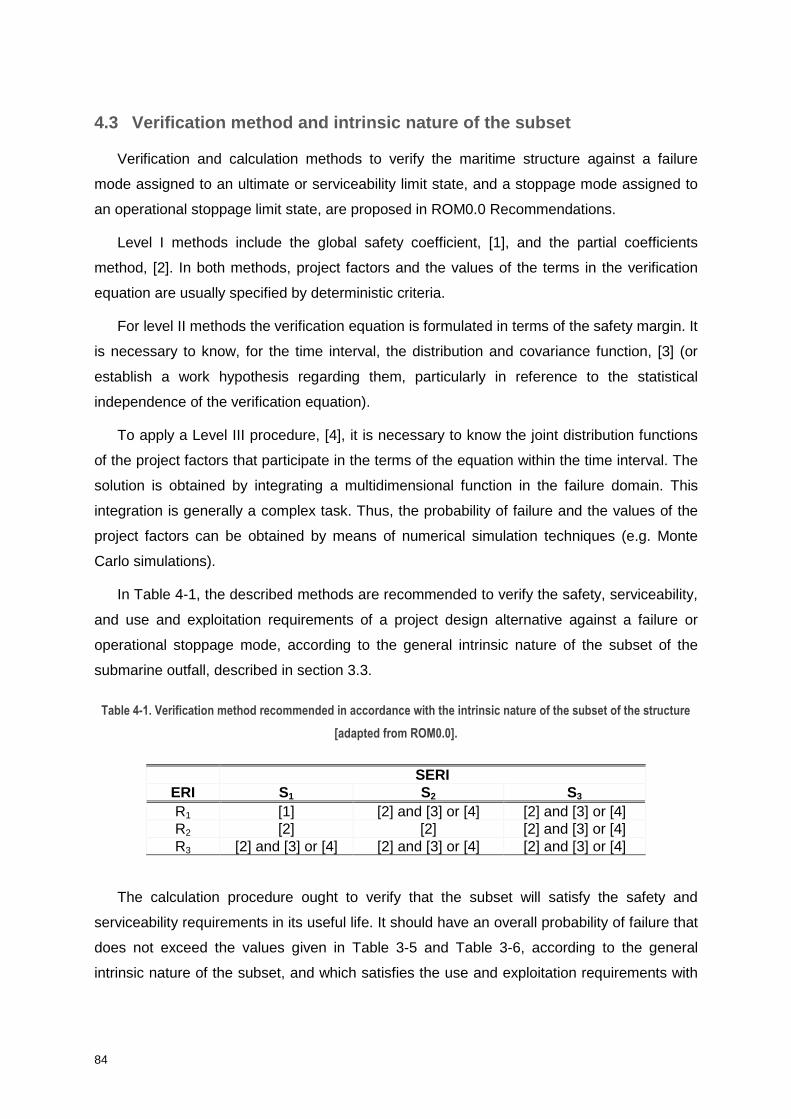
84
4.3 Verification method and intrinsic nature of the subset
Verification and calculation methods to verify the maritime structure against a failure
mode assigned to an ultimate or serviceability limit state, and a stoppage mode assigned to
an operational stoppage limit state, are proposed in ROM0.0 Recommendations.
Level I methods include the global safety coefficient, [1], and the partial coefficients
method, [2]. In both methods, project factors and the values of the terms in the verification
equation are usually specified by deterministic criteria.
For level II methods the verification equation is formulated in terms of the safety margin. It
is necessary to know, for the time interval, the distribution and covariance function, [3] (or
establish a work hypothesis regarding them, particularly in reference to the statistical
independence of the verification equation).
To apply a Level III procedure, [4], it is necessary to know the joint distribution functions
of the project factors that participate in the terms of the equation within the time interval. The
solution is obtained by integrating a multidimensional function in the failure domain. This
integration is generally a complex task. Thus, the probability of failure and the values of the
project factors can be obtained by means of numerical simulation techniques (e.g. Monte
Carlo simulations).
In Table 4-1, the described methods are recommended to verify the safety, serviceability,
and use and exploitation requirements of a project design alternative against a failure or
operational stoppage mode, according to the general intrinsic nature of the subset of the
submarine outfall, described in section 3.3.
Table 4-1. Verification method recommended in accordance with the intrinsic nature of the subset of the structure
[adapted from ROM0.0].
SERI ERI S1 S2 S3 R1 [1] [2] and [3] or [4] [2] and [3] or [4] R2 [2] [2] [2] and [3] or [4] R3 [2] and [3] or [4] [2] and [3] or [4] [2] and [3] or [4]
The calculation procedure ought to verify that the subset will satisfy the safety and
serviceability requirements in its useful life. It should have an overall probability of failure that
does not exceed the values given in Table 3-5 and Table 3-6, according to the general
intrinsic nature of the subset, and which satisfies the use and exploitation requirements with

85
an operationality level higher than the value in Table 3-7, according to the operational
intrinsic nature of the subset.
Even if Vale de Faro submarine outfall was classified with ERI (R2) and SERI (S2), a
Level III method is applied for sake of convenience.
4.4 Operational long-term forecast methodology
The procedure for calculating target design levels determines the safety, serviceability,
and exploitation requirements that the project must satisfy [Losada and Benedicto, 2005].
This procedure is detailed in section 3.2. As refereed, the identification of these design levels
makes it possible to estimate the useful life of the structure, the maximum admissible joint
probability of failure against the principal failure modes, the minimum operationality, the
admissible average number of technical breakdowns and the maximum admissible duration
of an operational stoppage [Puertos del Estado, 2002].
The exploitation of any section of a submarine outfall can be defined in terms of the
following:
i. average number of stoppages (in a time interval linked to social and environmental
factors);
ii. minimum levels of operationality (in a specified time period based on previous
economic studies);
iii. the maximum admissible duration of a stoppage in a time interval that depends on
economic factors and the cycle of demand.
In this chapter, the risk assessment procedure (Figure 4-1) is applied to operational limit
states (environmental failure modes) focusing on the effluent impact on the aquatic
environment and associated uses, the climate agents on the coast, the application of a
numerical model that represents both the coastal processes in the area and the effluent fate
and distribution from discharge.
Accepting that there will be uncertainties in any prediction, but that predictions are
required to manage development and conservation in the coastal zone prompts, a
probabilistic approach is presented where the environmental forcing and the morphological
response are treated as stochastic processes. From a probabilistic perspective, the output of
a deterministic model is treated as one possible realisation of the, for example,
pollutant/stressor concentration evolution process. To obtain useful and meaningful results in
this way it is necessary to:

86
i) run the model many times to generate a set of realisations;
ii) calculate sample statistics from the realisations to infer characteristics of the
whole population of possible outcomes; and
iii) choose the conditions for creating the realisations so that the set of realisations
can give a significant and unbiased estimate of the population statistics.
This procedure, Monte Carlo simulation, and the output of this approach is not a single,
well-defined solution for the pollutant concentration at a given time. Rather, it gives the
statistics of the solution, for example, the average and variance that can be very useful
information for coastal management.
Dynamical behavior of the system is analysed using empirical orthogonal functions and
the plume behavior is considered, in each time interval (1year), with the principal objectives
of:
• Calculate the probability of exceeding a representative threshold value whose
occurrence may be significant to the operationality of the structure (e.g. E. coli
concentration);
• Calculate the persistence of the exceedance of that threshold value;
• Calculate the frequency and seasonality;
• Identify the areas with high probability of exceedance of that threshold value;
• Establish a relation between wind forcing and surface currents, finding out if the
spatial variability of plumes is primarily determined by atmospheric forcing;
• Quantify the physical forcing mechanisms that govern the variability of plumes in the
studied coastal system; and
• Define the plume distribution function and its lower and upper characteristic levels.
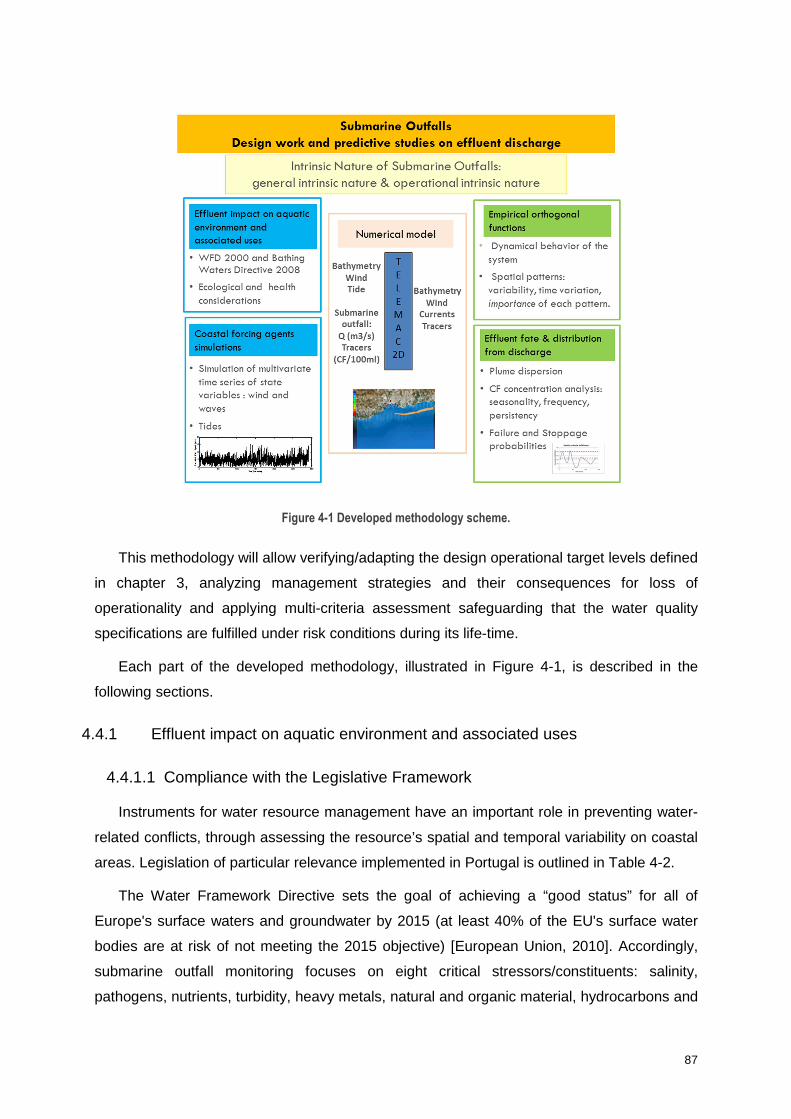
87
Figure 4-1 Developed methodology scheme.
This methodology will allow verifying/adapting the design operational target levels defined
in chapter 3, analyzing management strategies and their consequences for loss of
operationality and applying multi-criteria assessment safeguarding that the water quality
specifications are fulfilled under risk conditions during its life-time.
Each part of the developed methodology, illustrated in Figure 4-1, is described in the
following sections.
Effluent impact on aquatic environment and associated uses 4.4.1
4.4.1.1 Compliance with the Legislative Framework
Instruments for water resource management have an important role in preventing water-
related conflicts, through assessing the resource’s spatial and temporal variability on coastal
areas. Legislation of particular relevance implemented in Portugal is outlined in Table 4-2.
The Water Framework Directive sets the goal of achieving a “good status” for all of
Europe's surface waters and groundwater by 2015 (at least 40% of the EU's surface water
bodies are at risk of not meeting the 2015 objective) [European Union, 2010]. Accordingly,
submarine outfall monitoring focuses on eight critical stressors/constituents: salinity,
pathogens, nutrients, turbidity, heavy metals, natural and organic material, hydrocarbons and

88
pesticides. These eight constituents can be evaluated within the context of four different
environmental measurement areas: effluent, water column, sea floor environments, and fish
and shellfish. Table 2-1 resumes the stressors considered along with their potential effects on
the aquatic system and recreational environmental values.
The design of submarine outfalls consequently is tied to i) exceedance of threshold
values: related to agents of the physical environment (climatic agents); ii) unacceptable
environmental effect or social repercussion: stoppage modes carried out to avoid
damage to people, historical and cultural heritage, and environment; and iii) legal
constraints: stoppage modes carried out to fulfil legal requirements
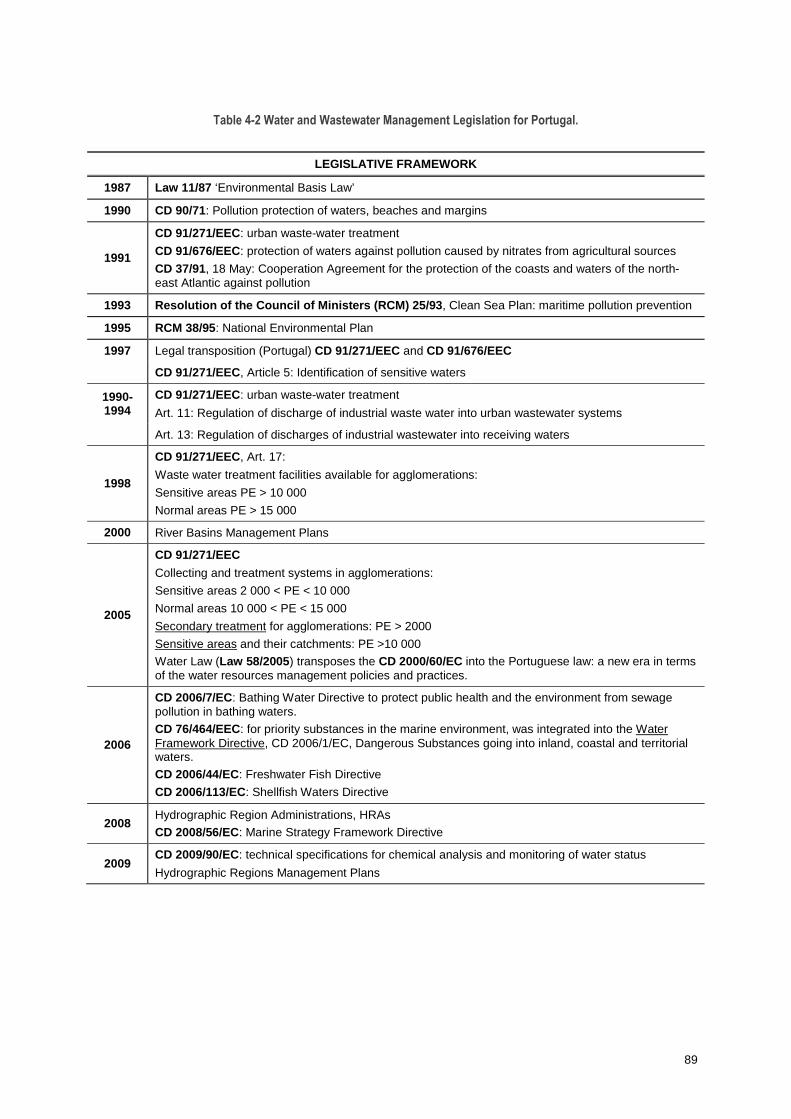
89
Table 4-2 Water and Wastewater Management Legislation for Portugal.
LEGISLATIVE FRAMEWORK
1987 Law 11/87 ‘Environmental Basis Law’
1990 CD 90/71: Pollution protection of waters, beaches and margins
1991
CD 91/271/EEC: urban waste-water treatment
CD 91/676/EEC: protection of waters against pollution caused by nitrates from agricultural sources
CD 37/91, 18 May: Cooperation Agreement for the protection of the coasts and waters of the north-east Atlantic against pollution
1993 Resolution of the Council of Ministers (RCM) 25/93 , Clean Sea Plan: maritime pollution prevention
1995 RCM 38/95: National Environmental Plan
1997 Legal transposition (Portugal) CD 91/271/EEC and CD 91/676/EEC
CD 91/271/EEC, Article 5: Identification of sensitive waters
1990-1994
CD 91/271/EEC: urban waste-water treatment
Art. 11: Regulation of discharge of industrial waste water into urban wastewater systems
Art. 13: Regulation of discharges of industrial wastewater into receiving waters
1998
CD 91/271/EEC, Art. 17:
Waste water treatment facilities available for agglomerations:
Sensitive areas PE > 10 000
Normal areas PE > 15 000
2000 River Basins Management Plans
2005
CD 91/271/EEC
Collecting and treatment systems in agglomerations:
Sensitive areas 2 000 < PE < 10 000
Normal areas 10 000 < PE < 15 000
Secondary treatment for agglomerations: PE > 2000
Sensitive areas and their catchments: PE >10 000
Water Law (Law 58/2005 ) transposes the CD 2000/60/EC into the Portuguese law: a new era in terms of the water resources management policies and practices.
2006
CD 2006/7/EC: Bathing Water Directive to protect public health and the environment from sewage pollution in bathing waters.
CD 76/464/EEC: for priority substances in the marine environment, was integrated into the Water Framework Directive, CD 2006/1/EC, Dangerous Substances going into inland, coastal and territorial waters.
CD 2006/44/EC: Freshwater Fish Directive
CD 2006/113/EC: Shellfish Waters Directive
2008 Hydrographic Region Administrations, HRAs
CD 2008/56/EC: Marine Strategy Framework Directive
2009 CD 2009/90/EC: technical specifications for chemical analysis and monitoring of water status
Hydrographic Regions Management Plans
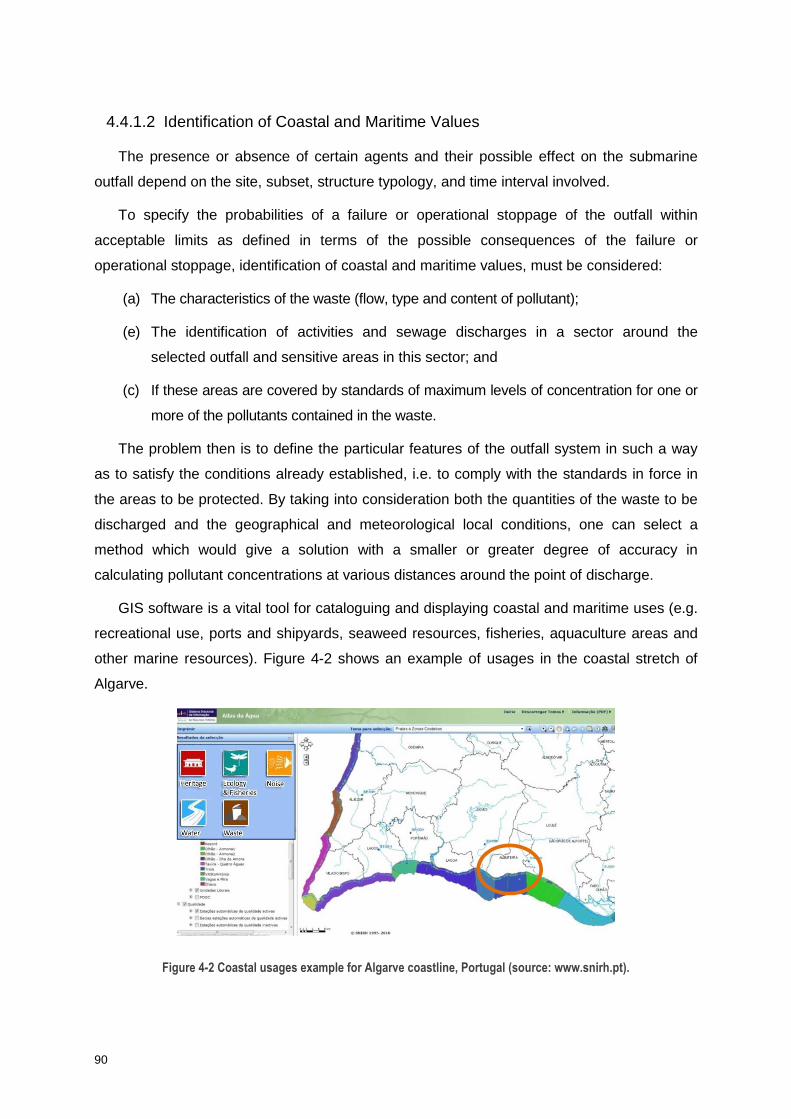
90
4.4.1.2 Identification of Coastal and Maritime Values
The presence or absence of certain agents and their possible effect on the submarine
outfall depend on the site, subset, structure typology, and time interval involved.
To specify the probabilities of a failure or operational stoppage of the outfall within
acceptable limits as defined in terms of the possible consequences of the failure or
operational stoppage, identification of coastal and maritime values, must be considered:
(a) The characteristics of the waste (flow, type and content of pollutant);
(e) The identification of activities and sewage discharges in a sector around the
selected outfall and sensitive areas in this sector; and
(c) If these areas are covered by standards of maximum levels of concentration for one or
more of the pollutants contained in the waste.
The problem then is to define the particular features of the outfall system in such a way
as to satisfy the conditions already established, i.e. to comply with the standards in force in
the areas to be protected. By taking into consideration both the quantities of the waste to be
discharged and the geographical and meteorological local conditions, one can select a
method which would give a solution with a smaller or greater degree of accuracy in
calculating pollutant concentrations at various distances around the point of discharge.
GIS software is a vital tool for cataloguing and displaying coastal and maritime uses (e.g.
recreational use, ports and shipyards, seaweed resources, fisheries, aquaculture areas and
other marine resources). Figure 4-2 shows an example of usages in the coastal stretch of
Algarve.
Figure 4-2 Coastal usages example for Algarve coastline, Portugal (source: www.snirh.pt).

91
Studies have been developed by the Portuguese Hydrographic Institute and the
Portuguese Water Institute on quality survey, and characterization and monitor of the main
Portuguese estuarine and coastal areas in order to assess the fulfillment of national
obligations regarding International Conventions as well as European Directives for water
quality management. The Portuguese Water Resources Information System, SNIRH,
operated by the Portuguese Water Institute has a General Use Interface developed based on
ArcView2 with data on climate, hydrology, ground-water and water uses, originated on over
1200 measurement stations in the country, as well as from the day-to-day management
tasks of the Institute (Figure 4-2).
Coastal forcing agents simulation 4.4.2
For modeling the effluent fate it is required to have the boundary conditions that force the
hydrodynamic model. After the astronomical tide, that is a deterministic variable, the main
forcing agent is the wind. For applying the probabilistic verification and design procedure
proposed in this work a methodology based in Monte Carlo simulations is implemented for
wind time series, accounting for both wind speed and wind direction. This procedure, applied
to the analysis of physical variability in the coastal area and plume behavior, under evolving
climate, offers an opportunity to contrast modern submarine outfall conditions with
reconstructed historical scenarios and future scenarios of change (e.g., associate with
climate change or with conditions post a major hydrological or hydrodynamic event). One
possibility for quantifying risks is the formulation of stochastic differential equations. Monte
Carlo simulation, used here, is a powerful technique for numerical representation of the
system and subsequent risk quantification. Another possibility is used available data to
determine extreme values and the risk of exceedance, such as the environmental risk.
The proposed methodology, developed in Solari and Losada (2011), is based on the use
of mixture non-stationary distributions for deseasonalization of the data, and a combination of
copula-based and autoregressive models for modeling auto and crosscorrelation of the
series. The methodology is summarized as follows:
- Wind speeds are fitted with a parametric probability distribution function. For this a
non-stationary mixture model is used, composed of a truncated two-parameter
Weibull distribution for the main-mass of the data and a generalized Pareto
distribution (GPD) for the upper tail (see Solari and Losada, 2011, 2012a, 2012b).
- A copula-based model is used for modeling the autocorrelation of the deseasonalized
wind speed time series. For the deseasonalization the Weibull-GPD model is used

92
(see Solari and Losada, 2011).
- Wind directions are fitted with a parametric model devised for circular variables (see
e.g. Fisher, 1993). In this case a non-stationary mixture model composed by two
Wrapped Student-t distributions is used (a detail description of this kind of distribution
is presented in Solari and Losada (2012c), though they use a mixture of Wrapped
Normal distributions).
- Fitting an autoregressive model for the deseasonalized wind directions, using
deseasonalized wind velocities as an exogenous variable (ARX model).
Once the four described models are fitted to the original data set, new time series are
simulated. For this, wind speed time series are simulated first, using the copula-based
dependence model and the Weibull-GPD distribution. Then, wind directions time series are
simulated conditional to the wind speed time series previously obtained, using in this case,
the ARX model and the mixture of wrapped distributions.
For applying the proposed simulation methodology a hindcast wind time series is used.
The data were provided by the Spanish Port Authorities (Puertos del Estado) and correspond
to a grid node located in the Atlantic Ocean next to Faro, Portugal (WANA point number
1050048).
Figure 4-3 shows empirical and modeled non-stationary probability distributions for
speeds and directions. It is noticed that the proposed model provides a good fit to the data.
In regards to auto and crosscorrelation, results presented in Figure 4-4 show that
autocorrelation of the simulated series is in good agreement with the autocorrelation of the
original series. On the other hand agreement between original and simulated
crosscorrelations is not as good as expected. However, given the low values taken by the
crosscorrelation of the original data series, no further analysis is performed. Finally, Figure
4-5 shows stretches of the original and simulated wind speed series.

93
Figure 4-3 Empirical (filled color contours) and modeled (black lines) mean annual non-stationary probability
density function for wind velocity (left) and wind direction (right).
Figure 4-4 Autocorrelation and crosscorrelation of wind speed and direction estimated from the original data series
(grey dots) and from the simulated series (green lines).
Time [y ear]
Win
d S
peed
[m
/s]
0 0.2 0.4 0.6 0.8 10
2
4
6
8
10
12
Empirical
Model [3 1 1]
Time [y ear]
Win
d D
irect
ion
0 0.2 0.4 0.6 0.8 1
S
SW
W
NW
N
NE
E
SE Empirical
Model [2 2 0 2 2 0 2]
0 1 2 3 4 5 6 70
0.2
0.4
0.6
0.8
1
Time lag [days]
AC
F V
Data
Simulation
0 1 2 3 4 5 6 70
0.2
0.4
0.6
0.8
1
Time lag [days]
AC
F D
-7 -6 -5 -4 -3 -2 -1 0 1 2 3 4 5 6 7-0.2
-0.1
0
0.1
0.2
Time lag [days]
Cro
ss C
orre
latio
n F
unct
ion
V-D

94
Figure 4-5 Original (top) and simulated (bottom) wind speed time series.
Numerical modelling 4.4.3
The model used in this simulations is Telemac-2D, a flow model based on the finite
element technique developed by the Laboratoire National d´Hydraulique (EDF, France) to
simulate the flow in estuaries and coastal zones [Hervouet, J.M. and Van Haren, 1994; 1996].
The Telemac-2D code solves the second order partial differential equations for depth-
averaged fluid flows derived from the full three dimensional Navier-Stokes equations.
As a finite-element model, the computational grids can be optimally fitted to domain
boundaries, where local refinements are possible to increase resolution in areas of special
interest [Hamilton et al., 2001]. The main results at each node of the computational mesh are
the depth of water and the depth-averaged velocity components. TELEMAC-2D is able to
take into account, among others, the following phenomena: propagation of long waves,
including non-linear effects, friction on the bed, the effects of meteorological phenomena
such as atmospheric pressure and wind, turbulence, influence of horizontal temperature and
salinity gradients on density, entrainment and diffusion of a tracer by currents, including
creation and decay and sink terms, particle tracking and computation of Lagrangian drifts,
inclusion of wave-induced currents (by link-ups with the ARTEMIS and TOMAWAC
modules), and coupling with sediment transport (SISYPHE module) [Mensencal, 2012].
The main goals of the numerical modeling process, implemented with TELEMAC-2D, are:
0 500 1000 1500 2000 2500 30000
5
10
15
20
Time [3hrs states]
Win
d S
peed
[m
/s]
0 500 1000 1500 2000 2500 30000
5
10
15
20
Sim
ulat
ed W
ind
Spe
ed [
m/s
]
Time [3hrs states]
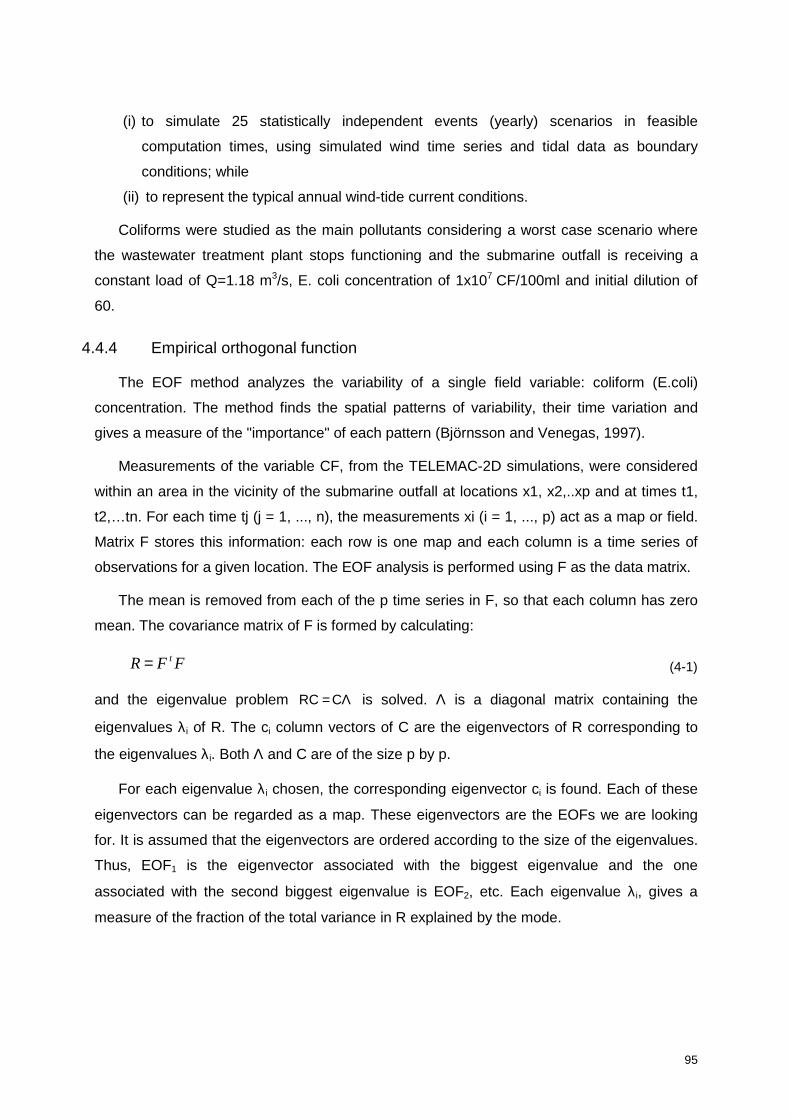
95
(i) to simulate 25 statistically independent events (yearly) scenarios in feasible
computation times, using simulated wind time series and tidal data as boundary
conditions; while
(ii) to represent the typical annual wind-tide current conditions.
Coliforms were studied as the main pollutants considering a worst case scenario where
the wastewater treatment plant stops functioning and the submarine outfall is receiving a
constant load of Q=1.18 m3/s, E. coli concentration of 1x10⁷ CF/100ml and initial dilution of
60.
Empirical orthogonal function 4.4.4
The EOF method analyzes the variability of a single field variable: coliform (E.coli)
concentration. The method finds the spatial patterns of variability, their time variation and
gives a measure of the "importance" of each pattern (Björnsson and Venegas, 1997).
Measurements of the variable CF, from the TELEMAC-2D simulations, were considered
within an area in the vicinity of the submarine outfall at locations x1, x2,..xp and at times t1,
t2,…tn. For each time tj (j = 1, ..., n), the measurements xi (i = 1, ..., p) act as a map or field.
Matrix F stores this information: each row is one map and each column is a time series of
observations for a given location. The EOF analysis is performed using F as the data matrix.
The mean is removed from each of the p time series in F, so that each column has zero
mean. The covariance matrix of F is formed by calculating:
FFR t= (4-1)
and the eigenvalue problem Λ= CRC is solved. Λ is a diagonal matrix containing the
eigenvalues λi of R. The ci column vectors of C are the eigenvectors of R corresponding to
the eigenvalues λi. Both Λ and C are of the size p by p.
For each eigenvalue λi chosen, the corresponding eigenvector ci is found. Each of these
eigenvectors can be regarded as a map. These eigenvectors are the EOFs we are looking
for. It is assumed that the eigenvectors are ordered according to the size of the eigenvalues.
Thus, EOF1 is the eigenvector associated with the biggest eigenvalue and the one
associated with the second biggest eigenvalue is EOF2, etc. Each eigenvalue λi, gives a
measure of the fraction of the total variance in R explained by the mode.

96
The pattern obtained when an EOF is plotted as a map represents a standing oscillation.
The time evolution of an EOF shows how this pattern oscillates in time. To see how EOF1
'evolves' in time: 11 cFarr
= .
The n components of the vector 1ar
are the projections of the maps in F on EOFi and the
vector is a time series for the evolution of EOFi. In general, for each calculated EOFj, a
corresponding aj is found. These are the principal component time series (PC's) or the
expansion coefficients of the EOFs.
Just as the EOFs were uncorrelated in space, the expansion coefficients are uncorrelated
in time.
The rationale is that the first N eigenvectors are capturing the dynamical behavior of the
system and the other eigenvectors (corresponding to the smallest eigenvalues) are just due
to random noise.
Effluent fate and distribution from the discharge 4.4.5
The presence or absence of certain agents and their possible effect on the submarine
outfall depend on the site, subset, structure typology, and time interval involved. The
parameters or environmental characteristics to be considered or studied in the design and
installation of these structures include [UNEP-MAP, 1996]:
a) Characteristics needed for outfall construction : topography and bathymetry,
bottom materials and morphology;
(b) Characteristics needed for setting the water quality objectives : openness of
the coast and activities and sewage discharges around the selected outfall;
(c) Parameters needed for the calculation of the efficiency of the outfall :
predominant surface currents and wind patterns and wastewater flow and
contaminant load;
(d) Other parameters : continuous current measurements, dispersion coefficients,
temperature profile and benthic populations, among others.
4.4.5.1 Multi-criteria assessment for design
Once the environmental agents and their actions exceed a certain magnitude, the
submarine outfall should stop operating to avoid damage themselves, the user or the
physical environment. Once the agent or its action falls below the threshold value, the
service may be resumed.

97
Operational limit states, therefore, do not cause damage to the maritime structure, but
are established to avoid this occurring. The operational limit states evaluate the exploitation
and management conditions of the structure, and thus should be analyzed and evaluated in
the design phase.
To evaluate the overall probability of failure of all the modes, the subset is said to
constitute a system composed of a set of elements, sub-elements, etc. The modes can affect
one or various elements; they can occur individually or all together; they can lead to other
modes, etc. The subset can fail because of the occurrence of one mode or several,
individually or sequentially until the structure collapses. The way that the behavior of the
subset is analyzed against the modes is by means of failure and stoppage trees. In ROM
Recommendations the analysis of the failure and stoppage modes is carried out by means of
diagrams of mutually exclusive modes (these modes cannot occur simultaneously and the
presentation of one of them excludes the others).
The diagrams types are: serial, parallel and compound. When the time interval used is a
year and the duration of the project phase is expressed in years considered as independent
intervals, the operationality of the phase is equal to the operationality of an average year.
After a subset of the structure and a time interval TL, which generally is a project phase,
has been selected, the calculation of its operationality is carried out according to the diagram
type of the stoppage mode. When the time interval used is a year and the duration of the
project phase is expressed in years considered as independent intervals, the operationality
of the phase is equal to the operationality of an average year.
In the case of a serial diagram and mutually exclusive modes, the average number of
operational stoppages is calculated as the sum of the average number of stoppages of each
of the modes. In the case of parallel diagrams, the average number of stoppages is
calculated for each of the sequence of chains that make up the parallel diagram.
The average number of stoppages, Nm,i, due to the occurrence of a mode i in V time
intervals is the following:
im
iim
pVN
,. τ
×=
(2. 10)
where, im,τ is the average duration of the stoppage and ip the probability that the stoppage
will occur in the time interval. The average duration can be obtained on the basis of the
distribution function of the stoppage mode in the time interval.

98
If the stoppage modes are independent, the total stoppage time produced by the
occurrence of M modes in V is equal to ∑×M
ipV ; the average number of stoppages of the
subset in V time intervals is given by:
∑∑
=
×=
Mim
i
M im
im
pV
pVN
,, ττ (2. 11)
Submarine outfalls are designed to prevent the pollution of bathing waters and the
capacity of these structures is directly related with the probability of incompliance with the
water quality criteria. In this way, it is advisable to draw up a “User and Operations Manual”
for the structure to inform the technician responsible for the operational limit states and
stoppage modes [ROM 0.0, 2002].
4.5 Case study
To illustrate the procedure, an application to the submarine outfall of Vale de Faro,
situated in Praia do Inatel, Albufeira, in the south coast of Portugal is analysed.
The south of Portugal is a region sheltered from the most dominant and important swell
source, the North Atlantic. Besides the long travel distance involved, storms generated in the
North Atlantic have to circumvent the southern Portuguese continental shelf to reach the
coast (Figure 4-6). These factors contribute to an important dissipation of storm energy and
wave height, which can consequently introduce different patterns into storm variability. The
local storm wave climate is also influenced from the southeast by stormy waves originating in
the Gibraltar Strait region [Almeida et al., 2011].
These site-specific characteristics and their possible effect on storminess are studied in
order to perform simulation of multivariate time series of the state variables that characterize
the local predominant forcing agents. Historical and climatic information of physical
oceanographic parameters (waves, tides, currents, winds, etc.) is available through the
Spanish Port Authorities (www.puertos.es). The case study used time series of WANA point
number 1047048 (Figure 4-6c).
Albufeira, in the south of Portugal, has 40 828 inhabitants that triplicate due to tourism
around the summer season. The submarine outfall of Vale de Faro was selected to represent
a common type of submarine outfall in Portugal, based on the type of effluent (urban) and
importance to the region in terms of tourism and municipal serviceability (Figure 4-6 a).

99
The submarine outfall, installed in 1986, became under designed due to increasing
number of tourists in the summer season and a new structure was proposed and constructed
in 2002. These structures have been monitored and supervised regarding wastewater and
environmental characteristics (e.g. topography and bathymetry, bottom materials and
morphology) and the description of important and minor failures that have occurred. The
system supplies sanitation to about 130 000 P.E:, disposing an urban effluent with secondary
treatment, plus disinfection in summer. The HDPE outfall is 1020 m long, with a 1000 mm
diameter and discharging at 11 m depth (datum level). The diffuser has 32 ports and is 160
m long.
The submarine outfall was designed to prevent the pollution of bathing waters and the
capacity of the submarine outfall is directly related with the probability of incompliance with
the water quality criteria.
Figure 4-6 (a) Case study area; (b) Vale de Faro submarine outfall location; (c) Puertos del Estado: Point 1047048
(source: www.puertos.es).
The average daily flow of Vale de Faro submarine outfall, for 2011, is illustrated in Figure
4-7. The summer period, as expected, presents higher average daily flows but also some
peaks in February, May and November-months that probably correspond to holidays (e.g.
Carnival and Eastern). The characteristics of the effluent flow entering the WWTP, before
(a) (b)
(c)
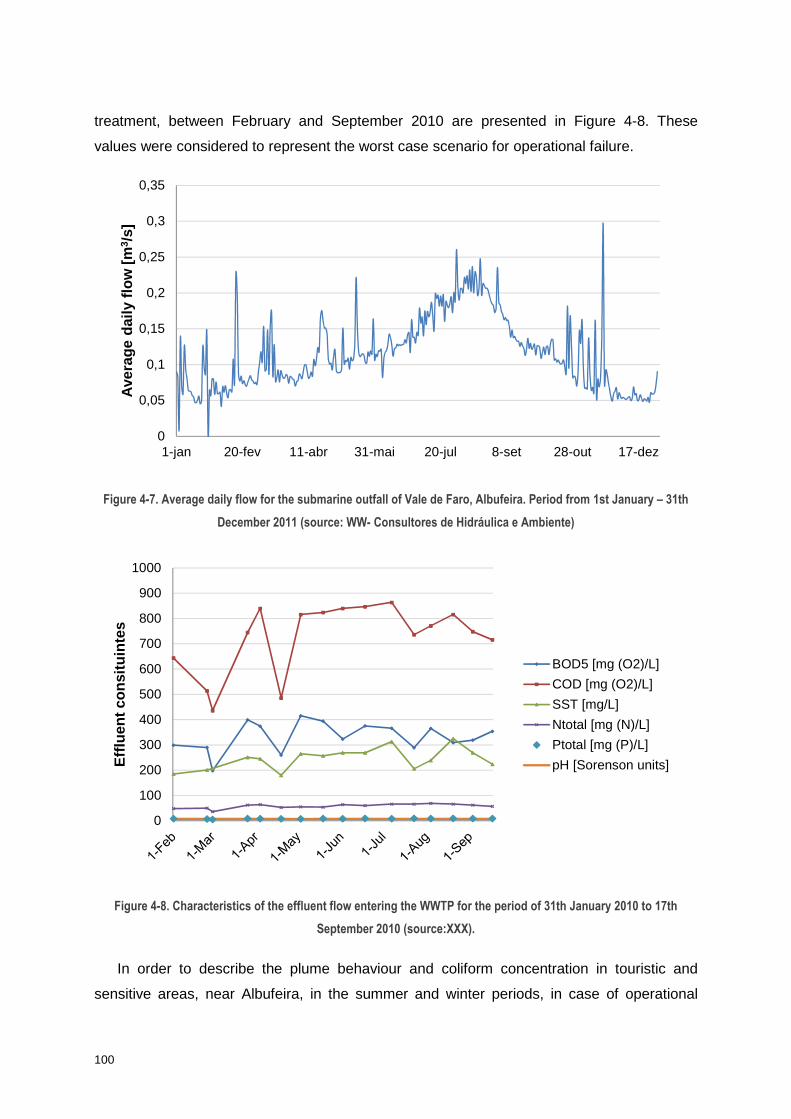
100
treatment, between February and September 2010 are presented in Figure 4-8. These
values were considered to represent the worst case scenario for operational failure.
Figure 4-7. Average daily flow for the submarine outfall of Vale de Faro, Albufeira. Period from 1st January – 31th
December 2011 (source: WW- Consultores de Hidráulica e Ambiente)
Figure 4-8. Characteristics of the effluent flow entering the WWTP for the period of 31th January 2010 to 17th
September 2010 (source:XXX).
In order to describe the plume behaviour and coliform concentration in touristic and
sensitive areas, near Albufeira, in the summer and winter periods, in case of operational
0
0,05
0,1
0,15
0,2
0,25
0,3
0,35
1-jan 20-fev 11-abr 31-mai 20-jul 8-set 28-out 17-dez
Ave
rage
dai
ly fl
ow [m
3 /s]
0
100
200
300
400
500
600
700
800
900
1000
Effl
uent
con
situ
inte
s
BOD5 [mg (O2)/L]
COD [mg (O2)/L]
SST [mg/L]
Ntotal [mg (N)/L]
Ptotal [mg (P)/L]
pH [Sorenson units]

101
failure, the hydrodynamic model TELEMAC-2D is forced with astronomical and
meteorological tides at the oceanic boundary (Le Provost Database), wind velocity and wind
direction on the ocean. The worst case scenario is represented considering a constant
coliform concentration of 1x10⁷ CF/100ml and a dilution of 60.
The computational grid goes from Lagos to Vila Real de Santo António, with around 112
kilometers length, and 12,245 triangular elements and 6,361 nodes (Figure 4-9a).
a)
b)
Figure 4-9 a) Computational mesh used in TELEMAC-2D, b) Coliform concentration and plume behavior around Vale
de Faro submarine outfall (28th February 2023).

102
Control points are selected based on their importance to human activities and protected
areas (P1 and P3 are observed in Figure 4-9b). The analysis of results focus on coliform
concentration along 25 years, considering the limits established in the Water Framework
Directive (maximum admissible value MAV, 2,000 CF/100ml and maximum recommended
value, MRV 100 CF/100ml). Special attention is given to the probability of exceeding the
coliform concentration value whose occurrence may be significant to the operationality of the
structure; persistence of the exceedance of that threshold value; and calculation of the
frequency and seasonality. Moreover, spatial and temporal variability of the water quality
(based on coliform concentration) in important/sensitive areas is analyzed. Figure 4-9b
presents an example of the plume behavior for Vale de Faro submarine outfall, where its
proximity to the coast and beach is observed.
Simulations with TELEMAC-2D reveal that the effluent dispersion caused by currents
generated under the influence of wind is greater than the dispersion resulted from the
currents generated by the tide only. Also, the area with high probability of exceedance of the
MRV (2,000 CF/100ml), that present the greatest evolution of tracers (E.coli) under the tide
and wind effects, occurs in the area around location P3.
Figure 4-10 represents E. coli concentration at control points P1 and P3, for the period of
October 2010 to October 2011. The 1 year-simulation shows that the failure events occur
mainly during the months of February to July and that the failure persistence varies between
1h-3h probably related to the wind pattern. Figure 4-10a, for point P1, shows that one failure
event occurs, i.e., one event occurs for which the coliform concentration exceeds the MAV
(2,000 CF/100ml). Figure 4-10b shows 34 failure events for point P3 that stands for the most
affected area in terms of pollution from the submarine outfall.

103
a)
b)
Figure 4-10 Coliform concentration at control points a) P1 and b) P3.
The EOF method is a 'map-series' method of analysis that takes all the variability in the
time evolving field and breaks it into a few standing oscillations and a time series to go with
each oscillation. Each of these oscillations (each EOF) is often referred to as a mode of
variability and the expansion coefficients of the mode (the PC) show how this mode oscillates
in time. The analysis of 25 years of coliform concentration in Vale de Faro area was
performed. The three leading EOF modes account together for 80.64% of the total monthly
coliform variance. Individually, they explain 50.19%, 19.12% and 1.33% of the variance. The
spatial patterns associated with these three coliform modes are shown in Figure 4-11 as
homogeneous correlation maps E1(CF), E2(CF) and E3(CF).
1 failure
event
34 failure
events
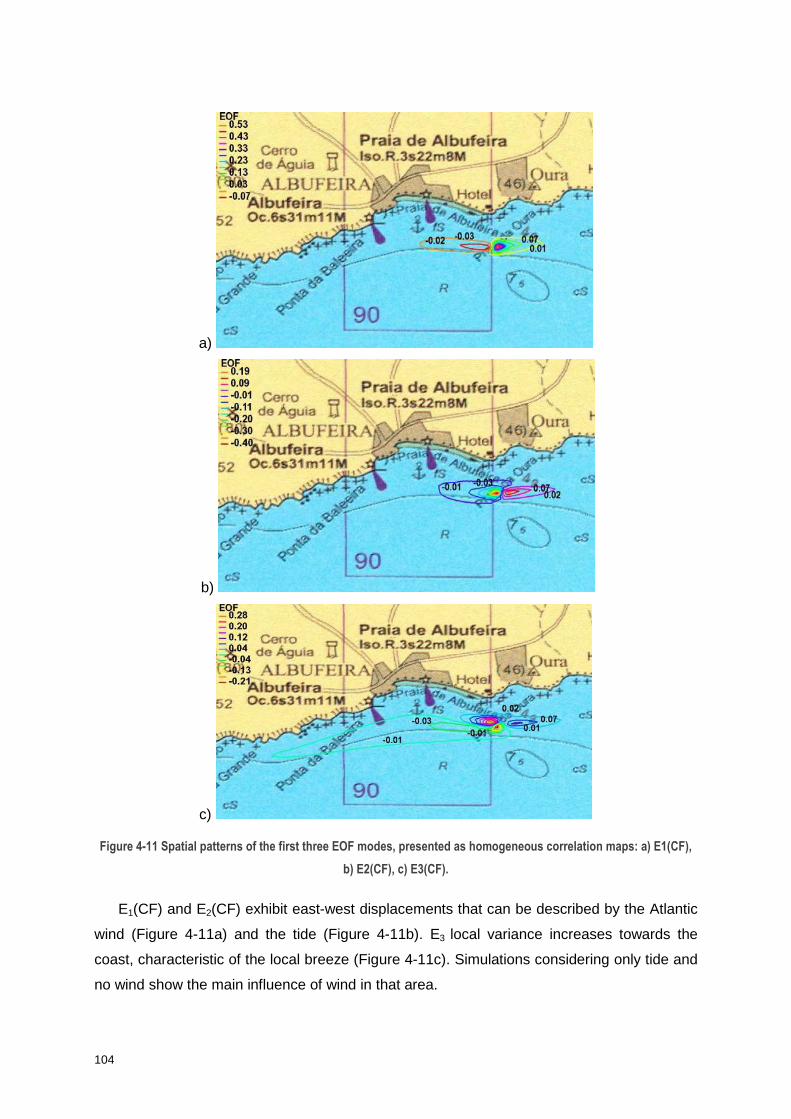
104
a)
b)
c)
Figure 4-11 Spatial patterns of the first three EOF modes, presented as homogeneous correlation maps: a) E1(CF),
b) E2(CF), c) E3(CF).
E1(CF) and E2(CF) exhibit east-west displacements that can be described by the Atlantic
wind (Figure 4-11a) and the tide (Figure 4-11b). E3 local variance increases towards the
coast, characteristic of the local breeze (Figure 4-11c). Simulations considering only tide and
no wind show the main influence of wind in that area.

105
The final purpose of this analysis is to verify the design target levels of operational limit
states developed in chapter 3.
The submarine outfall of Vale the Faro is characterized with SERI (S2: 10 <SERI < 20),
Table 3-10, pointing to a n average number of 4 operational stoppages in a 1-year period.
This value is highly surpassed on the eastern side area of the submarine outfall, affecting
beaches as Albufeira and Oura, as observed in point 3, Figure 4-10b, with 34 failures in a 1-
year period.
The probable maximum duration of a stoppage (hours) for the submarine outfall of Vale
de Faro was considered 12 hours, based on the OISER (S0,2: 20 < OISER < 30) and OIER
(R0,1: OIER ≤ 5) values, in Table 3-11 and Table 3-12. The results obtained in TELEMAC-2D
are in accordance with this criterion, with maximum duration of failure between 1 to 3 hours,
for the areas surrounding the submarine outfall.
Following the guidelines of chapter 3, a design alternative (e.g. longer submarine pipe,
alternative location) for the submarine outfall of Vale the Faro should be studied together with
the behavior of the plume and environmental impacts having in mind that reducing the
possibility of consequent damage is an essential benefit of the level of safety inherent in the
pollution protection.
4.6 Conclusions
Outfall systems should be operated at an acceptable level of safety, at minimum cost and
with a large degree of operating flexibility. The study of changes in water quality and the
environmental impact of projects related to water resources require adequate methodological
tools. The longer, stronger and more reliable the submarine outfalls are, the lower the
chance they will fail.
Reducing the possibility of consequent damage is the essential benefit of the level of
safety inherent in the pollution protection. To provide these benefits strengthening and install
longer submarine outfalls demands major investment from society. This can lead to designs,
which are unnecessarily conservative and consequently too costly, or inadequate and thus
leading to high maintenance costs. The demands that are made on the level of protection
against pollution also have to be based on balancing of social costs against the benefits of
improved submarine outfalls design. However, the balance between costs and benefits can
also change as a result of changing social insights, the occurrence of polluting events and
environmental or human consequences, or the future climate agents’ change. To include all

106
these aspects in the design, it is necessary to have the new design techniques cantered on
risk-based approach.
This chapter outlines the steps of a risk assessment for operational limit states that
facilitates decision-making in regards to the target design levels for submarine outfalls,
whatever the materials, techniques and elements used in their construction. The developed
methodology focus on three main aspects:
1. Environmental legislative framework: accomplish the environmental limitations
established in Portuguese and EU Directives;
2. Probabilistic assessment for the definition of climate agents on the coastline:
implementing a Monte Carlo simulation methodology that considers climatic
variability and mid long term trends; and
3. Effluent fate and distribution: implementing procedures to predict plume temporal
and spatial variability.
To illustrate the methodology the procedure was applied to the submarine outfall of Vale
the Faro, located on the southern Portuguese coast. The numerical model (TELEMAC-2D)
application quantifies the physical forcing mechanisms that govern the variability of the
plume, and consequently of pollutants, in the studied coastal system and a relation is
established between wind forcing and surface currents, where spatial variability of plumes is
primarily determined by atmospheric forcing. The transport of a non-buoyant tracer
(coliforms) was analyzed for 25 years together with the probability of exceeding a
representative threshold value whose occurrence may be significant to the operationality of
the submarine outfall. Moreover, the persistence of the exceedance of that threshold value,
the frequency and seasonality were also considered.
The methodology results are expected to help identifying the structure’s probability of
failure or stoppage and the definition of operational target design levels enabling decision on
project design alternatives. The outcome allows obtaining optimal yearly failure rates for
pollutants and a rational and systematic procedure for the optimal design of submarine
outfalls supporting the decision for management through multi-criteria decision analyses.
107
5 | Operational short-term forecast methodology for submarine outfall management
This chapter has been published partially in:
Mendonça, A.; Losada, M.A.; Neves, M.G.; Reis, M.T. 2012. “Operational forecast methodology for
submarine outfall management: application to a Portuguese case study”. Proc. MWWD 2012, 7th International
Conference on Marine Waste Water Discharges and Coastal Environment, 22 a 26 de Outubro, Budva,
Montenegro (referee). ISBN: 978-9944-5566-6-8
5.1 Introduction
The project of submarine outfalls is a complex problem for solving since equal
significance should be given to the environment, economy and social aspect of the problem
taking into account the: i) investment costs and permanent operating costs; ii) sensitive
management, since solutions are directly related to the environment and population; iii) long-
term resolutions, since implementation of problem solution and expected improvement of
environment conditions are slow, while monitoring measures should be carried out constantly
(UNEP-MAP, 2004).
The risk management of the project of submarine outfalls focusing on the design work
and predictive studies on effluent discharges, which may trigger important failure modes,
provides a rational and systematic procedure for automatic and optimal design of submarine
outfalls, granting a cost optimization of submarine outfall projects, preventing accidents with
these structures and their environmental dramatic consequences.
The economic, social and environmental repercussions produced when the structure
stops functioning or reduces its operational level are specified by means of its operational
intrinsic nature described in chapter 3.
In order to achieve appropriate discharge management, the authorities and the entities
that are developing and managing submarine outfall installations should be provided with
appropriate tools to improve discharge efficiency and to increase the effectiveness of effluent
dilution into the sea.
An operational forecast methodology is here proposed for the management of submarine
outfalls providing information to deal with the marine environment problems and to satisfy
needs at different levels for coastal communities. From a management perspective the

108
forecast methodology will support decision making by predicting where a discharged plume
is likely to be transported over a few days from its last known location.
Short-term forecasts of maritime climate and hydrological conditions along with foreseen
effluent characteristics (depending on seasons and population equivalent) of the studied
region should be used for an accurate estimation of the effluent plume advection and
diffusion processes near the coastline.
The methodology can be applied in the development of a tool for the operational
management of submarine outfalls that provides information in real time about the
conditions of the receiving medium and using this information to predict the behaviour of the
plume near the coastline. This contributes to an adaptive management in the operationality
of these structures and, when fully developed, can also be used as a powerful alert and
information tool for authorities, companies operating the installations, and the pertinent
environmental authorities.
The operational forecast methodology, continuously evaluating the plume behavior and
its relation within the protection perimeter (identified, for example, through a coastal usage
map), allows the implementation of a precautionary and adjustable management of the
submarine outfall. Corrective measures (e.g. increase dilution, increase the number of
outlets, increase outflow speed, temporary storage) may avoid possible operational
disruptions and minimize potential water quality impacts.
In this chapter, a failure mode related to the operational limit states of these structures
was selected from the ones described in chapter 2. An environmental failure effect is chosen
and its compliance with the European and Portuguese legislative framework is analysed. The
importance of identifying coastal and maritime values is outlined. A procedure is presented to
forecast at daily-bases the plume behavior of submarine outfalls near the coastline. The
developed methodology is illustrated with the submarine outfall of Vale de Faro, Portugal.
5.2 Operational Failure Modes
Sound design, available protective measures and regular maintenance and monitoring
programs contribute to the adequate functioning of submarine outfalls, which present among
their principal benefits low operating and maintenance costs, ability to cope with significant
seasonal variations in flow and ability to obtain an effective dilution that is normally enough to
prevent negative effects due to the discharge of organic matter and nutrients.

109
Nevertheless, in some cases submarine outfalls have presented low performances due to
maintenance problems, damage by winter storms and sailing and fishing vessels, among
others.
The main operative failure effects/modes in submarine outfalls and their causes are
represented in chapter 2, including modes that cause loss of use and exploitation without the
occurrence of a structural or functional failure.
This study focus on the environmental failure effects of submarine outfalls related to the
inefficient plume dispersion. The environmental values considered are aquatic ecosystem
and recreational activities (including aesthetics).
The aquatic ecosystem environmental value relates to the intrinsic value of the aquatic
ecosystem, including flora, fauna and habitat. This value is preserved by protecting the water
from risks that harm the ability to support and maintain a balanced community of aquatic
organisms. Moreover, the location of major recreational coastal zones (i.e. areas with high
levels of recreational activities, mostly surrounding highly populated shack areas and
campground locations) and sensitive areas in terms of fauna and flora have to be identified
for a suitable management of submarine outfalls.
Different environmental values require different types and levels of water quality
protection. The current legislative framework provides a context for the establishment of
codes of practice to minimize water quality risks, management and control of point and
diffusive sources of pollution and water criteria, discharge limits and listed pollutants.
5.3 Methodology
The hydrodynamic processes in the coastal zone are governed by two primary
phenomena, namely wind and tide. The winds are directly responsible for the generation of
waves, currents and water level fluctuations and as a result, for the plume transport onshore
and on the beach, while the tides express themselves in a periodic rising and falling of the
water and in tidal currents. To understand the problem of submarine outfall management and
to find proper control measures one must understand the hydrodynamic processes involved.
A good knowledge of wind, wave and tidal conditions along the route of the outfall is
required for a variety of reasons that goes from:
i) the design stage, where wave climate data is necessary to assess the expected rate
trench infill, stability of the pipe during installation, and choice of plant and downtime;

110
ii) during installation, where wave climate data may be augmented by real-time wave
forecasting to assist in operations planning; and
iii) during operation, where real time forecasting permits operational planning using
weather windows, assessment of ‘unforeseen condition’ claims, maintenance
operations and in situations where the plume reaches the shore with high
concentrations of nocive substances, measures to prevent its consequences and
implementation of potential corrective measures.
This study aims to create a methodology to adapt and improve the management of
submarine outfall discharges in the marine environment, during its operative phase.
The high variability of marine conditions means that sustainable and efficient
management of the outfall must be available for these conditions. At present, there are few
options that offer control and adaptation tools in the ordinary management of submarine
outfalls into the marine environment [Torres et al, 2009]. Therefore, the main objective is to
develop a methodology that provides this capacity in the following ways:
• Improve operation control: Supervise the correct operation of the submarine outfall
discharge, corroborate compliance with the EU Legislation and unacceptable
environmental effects and social repercussion; Have a real-time monitoring system
that enables awareness of the behaviour of the discharge.
• Adaptation: Avoid rigid discharge management by adapting to the conditions of the
receiving environment; A sustainable management strategy would be based on
maximizing the dilution of the waste in the most unfavourable conditions and
minimizing it when the conditions allow, given its lesser impact on the environment
(maximum turbulence conditions).
A real-time analysis of ocean-meteorological data from the marine environment and from
the effluent can optimize the marine environment forecast of the mixing capacity maximizing
the efficiency of the outfall system.
Daily forecasts offer short-term predictions of contemporary conditions, one or a few days
ahead, with a level of detail designed to be supportive of en route planning and interpretation
of plume behaviour.
The aim is to describe how hydrodynamics can control the water quality in a particular
region. The analysis can be based on the dispersion of passive traces (particle tracking
model), which simulate the transport of a generic contaminant dumped into the coastal area.
A Lagrangian model constitutes a powerful tool for studying dispersion in coastal areas. It

111
allows analysis of dispersion and estimation of residence times at a low computational cost
compared to eulerian models.
The main steps of the methodology, illustrated in Figure 5-1, are:
1. Short-term forecast data: wind, wave height, wave direction, wave period, tide,
submarine outfall flow;
2. Numerical modelling: i) Hydrodynamic model with short-term forecast data; ii)
Particle tracking model using the hydrodynamic model results;
3. Operational management: potential corrective activities and management
measures.
Figure 5-1. Operational forecast methodology scheme for submarine outfalls.
Forecast data 5.3.1
The dominant factors influencing the circulation and residence time of water should, in a
first stage, be analysed (e.g. non-tidal, i.e. winds, river flow, rainfall and evaporation).
Then information on wave climate should be gathered for the study area. Forecast data is
available through, among others, platforms like the National Oceanic and Atmospheric
Administration (http://www.nodc.noaa.gov/), MyOcean (www.myocean.eu), the Portuguese
National Meteorological Service (www.ipma.pt) or Weather Underground
(http://www.wunderground.com)

112
Information on the composition and quantification of wastewater discharged by the
submarine outfall must be known as well as the type of treatment performed at the WWTP up
to the discharge.
Numerical modeling: hydrodynamic model and particle tracking model 5.3.2
Understanding advective-diffusive transport of trace constituents in natural fluid flows is
an important challenge in Earth and environmental sciences with many diverse applications,
including simulating the fate of contaminants, inferring the location of their source, and model
assessment (e.g., [England and Maier, 2001;Waugh and Hall, 2002]). A wide variety and
complexity of hydrodynamic and Lagrangean models is available and many factors are
involved in the selection of an appropriate model that meets user capabilities and study
objectives.
The Coastal Modeling System [CMS, http://cirp.usace.army.mil/wiki/CMS] developed at
the US Army Engineer Research and Development Center, is a suite of hydrodynamics,
wave, and sediment transport models consisting primarily of three modeling modules, CMS-
Wave, CMS-Flow and CMS-PTM.
CMS-Flow is a hydrodynamic and sediment transport model capable of simulating depth-
averaged circulation, salinity and sediment transport forced by tides, wind, river inflow, and
waves [Buttolph et al., 2006]. The hydrodynamic model solves the conservative form of
shallow water equations by finite volume method and includes terms for the Coriolis force,
wind stress, wave stress, bottom stress, vegetation flow drag, bottom friction, and turbulent
diffusion [Demirbilek and Rosati, 2011].
The PTM employs a Lagrangian method of tracking particle pathways to estimate
migration of sediment particles as influenced by waves and currents. For its input, the PTM
requires a geometric surface defining the bottom elevation (depth) over which water level,
current velocity vectors, and waves are available at each point in the modeling domain. The
user specifies sediment sources and model parameters to perform a PTM simulation, within
the Surface Modelling System [Zundel, 2005, Zundel et al., 1998], for a given set of
hydrodynamic input (waves, water levels, and currents). PTM is applied to track neutrally
buoyant or sediment particle movements to assess water circulation, sediment transport, and
water-quality related issues. The model contains algorithms that represent transport, settling,
deposition, mixing, and resuspension processes in nearshore wave/current conditions. It
uses waves and currents developed through CMS-Flow and input directly to PTM as forcing
functions.
113
Results are analysed through residence time of particles in areas of interest (‘traps’): trap
is a user-defined polygon area defined for calculation of residence time. The retention time of
all particles within a trap (the shape, size, and location of which are defined by the user)
represents the residence time. The time during which particles remain within a trap is the
residence time [MacDonald et al. 2006; Demirbilek et al. 2005a, 2005b].
Operational management 5.3.3
The ability to automatically forecast the timing and location of a surface cyanobacterial
scum several days in advance would allow water managers to make better decisions to
potentially mitigate scum transport into recreational zones, and better inform recreational
users about potential health risks over the coming days. Before identifying the submarine
outfall mitigation measures and emergency discharge scenarios for the operation phase,
review of the pipe system design, historical emergency discharge records, and precautionary
design measures to control emergency discharge have to be conducted gathering
information on the structure.
The system should focus on three fundamental management scenarios:
1. The first of these is to detect stressors (e.g. pathogens, heavy metals, suspended
solids) in the near-field that could be potentially transported to the protection perimeter
identified in a coastal usages map (e.g. Figure 4-2). The forecast tool continuously
evaluates the stressors values in the near-field, and the conditions at the edge of the
marine protection perimeters. When necessary alternative management of the outfall is
adopted to avoid possible disruptions (e.g. increase the planned dilution, increase the
number of outlets, or increase the outflow speed).
2. The second is linked with the maritime climate , which implies changes in the energy
state of the sea and, therefore, in the dilution efficiency of the plume in both near-field
and far-field. A very useful management protocol might be to link the outfall
management and progress over time. This would not only prevent possible disruptions
caused by low energy, but it would also make use of greater turbulence scenarios, which
allows plume dilution.
3. The third is linked with the total forecasted flow for the submarine outfall; flow depends
on population seasonality and hydrological events. E.g. the forecast of extreme events
enables suitable application of early measures for the submarine outfall management.
If there is a potential of polluting the beach water, agencies should be immediately
informed with a joint investigation to assess the impact to the environment. If the incident

114
generates an environmental nuisance other than polluting the beach, water mitigation
measures should be worked out to reduce environmental impact. The environmental risk
estimation is based on the methodology described in chapter 4.
A Response Action should be prepared to avoid, if not possible, to minimize
environmental impact to the surrounding area and water.
In Portugal, for example, the competent authority for dealing with marine pollution is the
Direcção-Geral da Autoridade Marítima (DGAM), under the auspices of the National Maritime
Authority (Navy) and the Ministry of Defence. DGAM coordinates, at national level, the
response to marine pollution at sea and on shore. A national contingency plan ‘Clean Sea
Plan’ was approved in April 1993. This includes regional and local emergency plans.
DGAM operates a Marine Pollution Response Service, a central service with technical
expertise in pollution prevention and combat.
Corrective measures , temporary sewage bypass and emergency discharge scenarios
which may arise from climate agents (e.g. heavy rainfall, wind currents) during the operation
phase of the project, should be identified and planned to minimize the potential water quality
impacts. These measures are case sensitive and should be established for each submarine
outfall project. Some examples are described:
� Reduce/increase the flow rate or flow quantity being discharged
o Offsite disposal or alternative treatment facility;
o Onsite irrigation through emergency pumping;
o Temporary storage;
o In the case of ocean-meteorological conditions that favour dilution, the system
could help to optimize the operational cost by acting on the pumping capacity of
the dilution water or reducing the pressure in the discharge diffusers;
� Parallel contingency options
o Provide partial treatment of effluent being discharged; enhance pollution
prevention efforts; improve or change disinfection process; enhance solids removal
during treatment; primary effluent screening;
o Decrease the volume of effluent requiring discharge;
o Reuse subject to strict regulations: urban reuse (e.g. the irrigation of public parks,
school grounds, highway medians, and golf courses) agricultural reuse (irrigation

115
for non-food crops), recreational impoundments (e.g. ponds or lakes),
environmental reuse (e.g. the creation of artificial wetlands or enhancement of
natural ones) or industrial reuse (e.g. process or makeup water) [12];
� Emergency discharge
o Bypass, located either in the inlet chamber or in the outfall chamber, to allow
discharge of sewage to the seashore under emergency conditions;
o Manually cleaned screens at the overflow bypass to prevent the discharge of
floating solids into the receiving water;
� Close the concerned beach for public use.
5.4 Case study
To illustrate the application of the procedure steps a submarine outfall located in the
Portuguese coast is analysed. Vale de Faro submarine outfall was selected to represent a
common type of submarine outfall in Portugal, based on the type of effluent (urban) and
importance to the region in terms of tourism and municipal serviceability. The stude site is
described in more detail in chapter 4 (section 4.4).
The aim is to describe how hydrodynamics can control the water quality around Albufeira
region. The analysis are based on the dispersion of passive traces (particle tracking model),
which simulate the transport of a generic contaminant dumped into the area. In particular, it
is considered the two conditions representative of residence time: maritime summer and
winter conditions.
Generation of the grid and boundary conditions 5.4.1
The grid was constructed based on the bathymetry digitized from two nautical charts from
the Instituto Hidrográfico: chart “Cabo de São Vicente à Foz do Guadiana”, scale 1:150 000
and chart “Albufeira ao Rio Guadiana”, scale 1:150 000. The grid domain, presented in Figure
5-2, covers alongshore distance of around 100 km from Lagos to Vila Real de Santo António
and a cross-shore distance of 50 km. A regular grid was created with dx=y=100m (Figure
5-2).
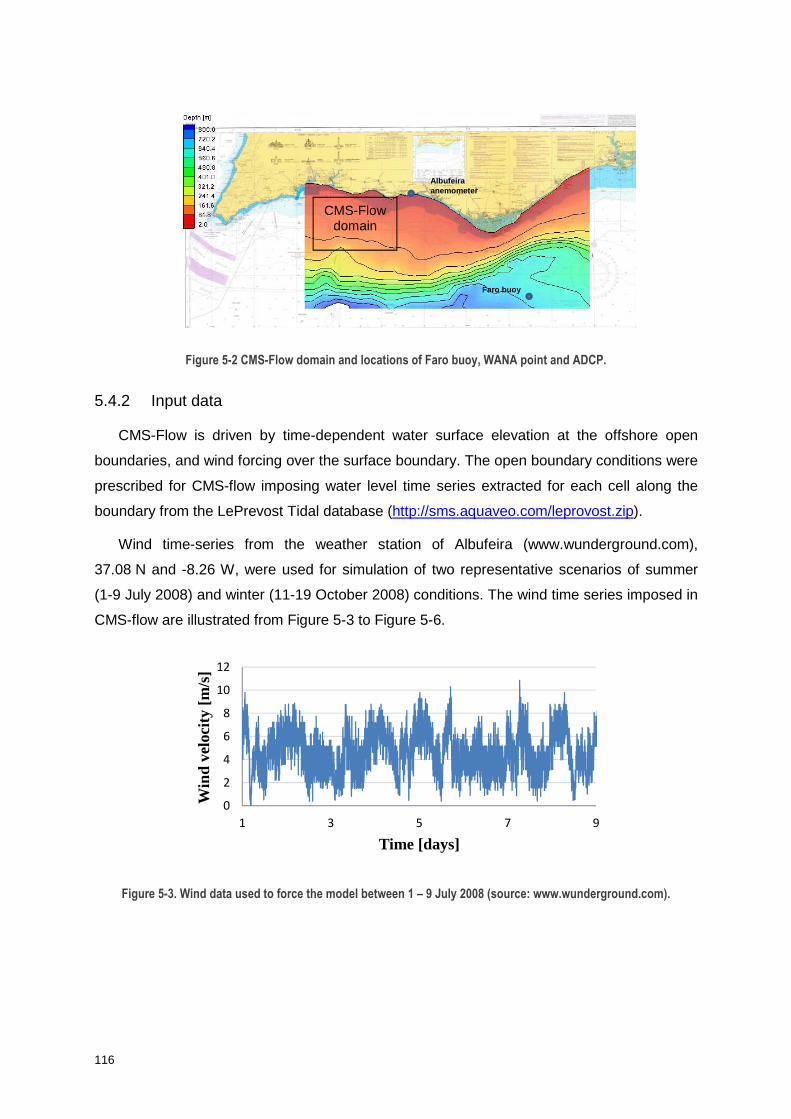
116
Figure 5-2 CMS-Flow domain and locations of Faro buoy, WANA point and ADCP.
Input data 5.4.2
CMS-Flow is driven by time-dependent water surface elevation at the offshore open
boundaries, and wind forcing over the surface boundary. The open boundary conditions were
prescribed for CMS-flow imposing water level time series extracted for each cell along the
boundary from the LePrevost Tidal database (http://sms.aquaveo.com/leprovost.zip).
Wind time-series from the weather station of Albufeira (www.wunderground.com),
37.08 N and -8.26 W, were used for simulation of two representative scenarios of summer
(1-9 July 2008) and winter (11-19 October 2008) conditions. The wind time series imposed in
CMS-flow are illustrated from Figure 5-3 to Figure 5-6.
Figure 5-3. Wind data used to force the model between 1 – 9 July 2008 (source: www.wunderground.com).
0
2
4
6
8
10
12
1 3 5 7 9
Win
d ve
loci
ty [
m/s
]
Time [days]
CMS-Flow domain
Faro buoy
Albufeira anemometer

117
Figure 5-4. Wind data used to force the model between 1 – 9 July 2008 (source: www.wunderground.com).
Figure 5-5. Wind data used to force the model between 10 – 19 October 2008 (source: www.wunderground.com).
Figure 5-6. Wind data used to force the model between 10 – 19 October 2008 (source: www.wunderground.com).
0
1000
2000
3000
4000
5000
6000
90 180 270 360
Fre
qu
en
cy
Bin
0
2
4
6
8
10
12
14
11 13 15 17 19
Win
d ve
loci
ty [
m/s
]
Time [days]
0
500
1000
1500
2000
2500
3000
3500
90 180 270 360
Fre
qu
en
cy
Bin

118
The coupling between CMS-Flow and PTM is made within SMS interface with all of the
variable interpolation and passing of variables from one model to another done with
communication files.
Hydrodynamic results 5.4.3
CMS-PTM [Demirbilek et al., 2008] is applied to compute the fate and pathways of
waterborne particles from the submarine outfall through the flow field and water exchange via
CMS-Flow. A passive tracer can be assigned to a water mass transporting any contaminant
released in that water mass. In this way, the probability of a given tracer to remain in the area
where it was initially placed is related to the residence time of the water in that area.
The results from the Lagrangean model can be analysed through monitoring ‘traps’
defined in sensitive areas as bathing areas, fishing areas, coastal and estuarine aquaculture
units. For every ‘trap’ the model computes the concentration of stressors (e.g. E.coli, SST,
etc).
The results of these processes are related to submarine outfall compliance of the water
quality criteria and coastal uses: series of particle locations over time and attributes of those
particles at each time, particle paths, identification of the percentage of time that limit
threshold concentrations of pollutants are surpassed and identification of the affected areas.
The CMS simulation was firstly conducted for a 20 day period of 10th May 2008 to 10th
July 2008. CMS-flow was calibrated against water surface elevation data from the same
period, at Faro buoy, located at 36 54 17 N and 7 53 54W, at around 93m (ML), Figure 5-2.
Figure 5-7 shows water surface elevation comparisons at site 1 (Faro buoy) from 10th to
25th May 2008. The calculated water levels show a good agreement with the measurements
in amplitude and phase. The correlation coefficient between the CMS and the data is 0.988
and the root mean square error is 0.093m. Velocity results reveal that longshore and
crosshore components have similar magnitudes.
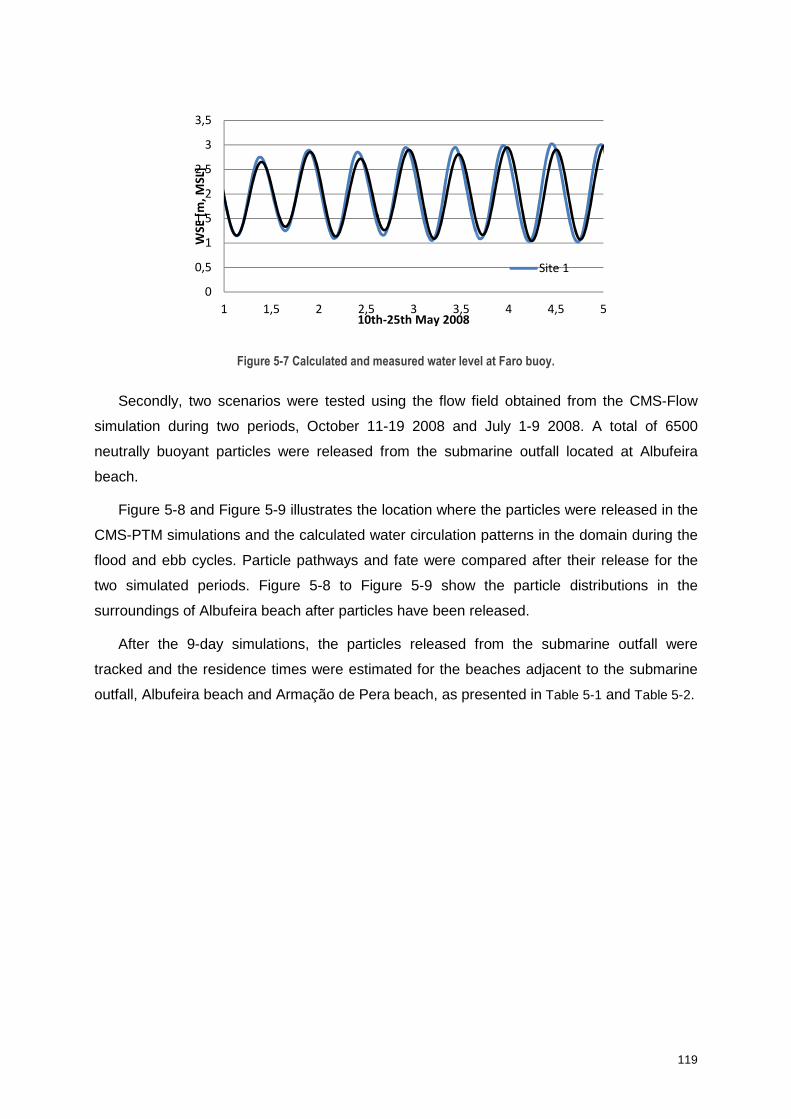
119
Figure 5-7 Calculated and measured water level at Faro buoy.
Secondly, two scenarios were tested using the flow field obtained from the CMS-Flow
simulation during two periods, October 11-19 2008 and July 1-9 2008. A total of 6500
neutrally buoyant particles were released from the submarine outfall located at Albufeira
beach.
Figure 5-8 and Figure 5-9 illustrates the location where the particles were released in the
CMS-PTM simulations and the calculated water circulation patterns in the domain during the
flood and ebb cycles. Particle pathways and fate were compared after their release for the
two simulated periods. Figure 5-8 to Figure 5-9 show the particle distributions in the
surroundings of Albufeira beach after particles have been released.
After the 9-day simulations, the particles released from the submarine outfall were
tracked and the residence times were estimated for the beaches adjacent to the submarine
outfall, Albufeira beach and Armação de Pera beach, as presented in Table 5-1 and Table 5-2.
0
0,5
1
1,5
2
2,5
3
3,5
1 1,5 2 2,5 3 3,5 4 4,5 5
WS
E [
m,
MS
L]
10th-25th May 2008
Site 1
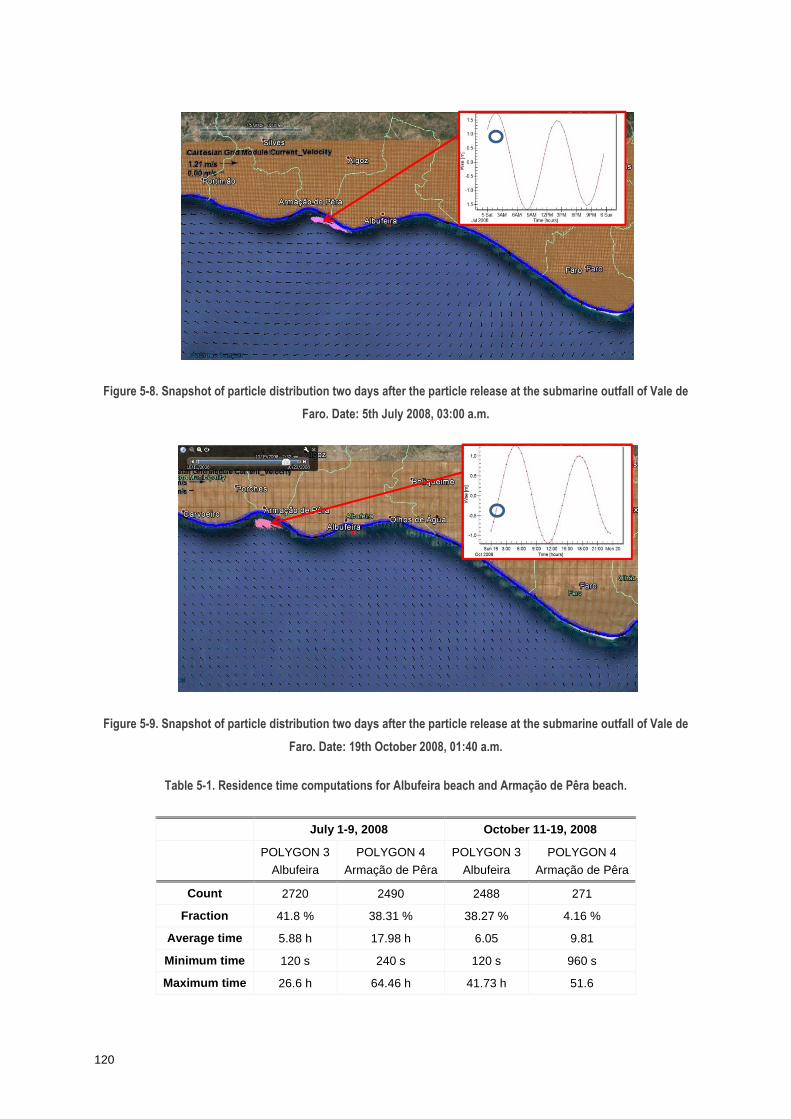
120
Figure 5-8. Snapshot of particle distribution two days after the particle release at the submarine outfall of Vale de
Faro. Date: 5th July 2008, 03:00 a.m.
Figure 5-9. Snapshot of particle distribution two days after the particle release at the submarine outfall of Vale de
Faro. Date: 19th October 2008, 01:40 a.m.
Table 5-1. Residence time computations for Albufeira beach and Armação de Pêra beach.
July 1-9, 2008 October 11-19, 2008
POLYGON 3
Albufeira
POLYGON 4
Armação de Pêra
POLYGON 3
Albufeira
POLYGON 4
Armação de Pêra
Count 2720 2490 2488 271
Fraction 41.8 % 38.31 % 38.27 % 4.16 %
Average time 5.88 h 17.98 h 6.05 9.81
Minimum time 120 s 240 s 120 s 960 s
Maximum time 26.6 h 64.46 h 41.73 h 51.6

121
Table 5-2. Residence time computations for Albufeira beach and Armação de Pêra beach for the 8th simulation day
July 8th, 2008 October 18th, 2008
POLYGON 3
Albufeira
POLYGON 4
Armação de Pêra
POLYGON 3
Albufeira
POLYGON 4
Armação de Pêra
Count 0 876 0 264
Fraction 0 13.47 % 0 4.06 %
Average time - 8.17 h 9.29 h
Minimum time - 240 s - 240 s
Maximum time - 35.1 h - 42.8 h
As can be seen by the model results, the amount of particles that reach Albufeira beach
and Armação de Pêra beach is higher in the period of July with the residence time for
Armação de Pêra beach doubling in the summer period.
In what concerns to residence times, it vary with location. Albufeira beach showed lower
residence times than Armação de Pêra, where particles tend to accumulate probably due to
the coastline geometry that affects circulation.
Even if the circulation pattern (resulting from tide and wind) in both simulations move
particles away from Albufeira beach, where the outfall is located, a high number of particles
still reaches the beach (July: 41% and October: 38%) even if with lower residence times that
Armação de Pêra.
The calculated flow field indicates relatively stronger currents in the period of July, that
can resulting from higher wind intensity that combined with the flood tide period retains
particles in the beach. As a result, a longer residence time is expected in that period.
The maximum period the particles remain trapped in the summer period is 2.6 days in
Armação de Pêra beach.
The days after the release that particles reach the beach also vary with location and time.
In July particles reach Albufeira beach one day after the release started, and Armação de
Pêra beach is reached 5 days after.
However, in October, particles reach Albufeira beach in the same day of the outfall
release, and Armação de Pêra 3 days after.
For Armação de Pêra beach, 17% of particles are still in the beach area at the 8-day in
the summer period and 4% for the autumn period.

122
In other words, the residence time of particles released by the submarine outfall are
longer than 9 days and in the summer period Armação de Pêra was retaining the highest
number of particles after eight days.
5.5 Conclusions
The operational short-term forecast methodology presented aims to predict coastal
particle movement and assist the local and regional planning and management for outfall
projects with the necessary flexibility to adapt to the favorable conditions of the marine
environment, maximizing dilution and minimizing effluent impact.
Daily forecasts of maritime and hydrological data can provide 72h-ahead estimates of
plume location and structure for planning purposes and for near real-time interpretation of
observations. The aim is to acknowledge how hydrodynamics controls water quality and
analysis is based on the dispersion of passive tracers which simulate the transport of generic
contaminants released at submarine outfalls in coastal areas. The procedure works with
residence times to identify several situations in which concentration would become
dangerously high or remain high for an extended period of time, starting with a simple
conservative substance. Also important is to characterize the flow rate of important rivers
since decreasing flow rates lead to lower wastewater dilution.
Water surface elevations and currents calculated by CMS-flow drive the PTM
computations that compute the paths of particles within the domain. The probability of
particles (contaminant) remaining in the areas of interest is analysed through the residence
time.
The methodology implemented as a real time or short term forecast tool, enables the
estimation of failure probability before it takes place and can be used as a decision support
tool for wastewater treatment plants and submarine outfalls. Due to the continuous loads
discharged from wastewater treatment plants and the event-dependent loads spilled from the
combined sewer overflows, potential danger can result for the receiving water ecosystem.
Wastewater treatment plant and submarine outfall must be considered as an integral part of
the wastewater system, both in engineering and in environmental sense.
The complete system, once incorporated into an operational warning system as part of a
future study, will become an important management tool for various users, including at a
municipal level for issuing official coastal warnings and closures and for communicating risks
to the public, and at a beach management level to prevent or minimize potential risks through

123
the early implementation of management strategies, for example the automated activation of
artificial mixing systems during scum-favorable conditions to prevent scum formation.
CMS-Flow time consuming simulations, lead to the subsequent application of TELEMAC-
2D model [Galland et al., 1991], developed by EDF-DRD and distributed by SOGREAH.
Limitations on PTM model, related to the incapacity of representing variation of pollutant
concentration associated to biological and chemical processes, suggests the need of a water
quality model.

124

125
6 | Risk assessment of aquatic systems induced by submarine outfalls: probabilistic approach
6.1 Introduction
Hydraulic and coastal structures are one of the means to solve a water management or a
coastal problem and substantial developments in design have taken place over recent years.
These have been due principally to an improved scientific understanding of the river and
coastal environment and to the development of better analytical and predictive techniques –
particularly through mathematical modelling.
The potential deleterious effects of pollutants from sewage effluents on the receiving
water quality of the coastal environment are manifold and depend on volume of the
discharge, the chemical composition and concentrations in the effluent. It also depends on
type of the discharge for example whether it is amount of suspended solids or organic matter
or hazardous pollutants like heavy metals and organochlorines, and the characteristics of the
receiving waters (NAP, 1984, Canter W., 1996: Nemerow and Dasgupta, 1991). High levels
of soluble organics may cause oxygen depletion (Peter and Robin, 2002) with a negative
effect on aquatic biota.
Contamination of the coastal water may result in changes in nutrient levels, abundance,
biomass and diversity of organisms, bioaccumulation of organic and inorganic compounds
and alteration of trophic interaction among species. Moreover, the requirements for
protection of marine organisms specify that: i) marine communities, including vertebrate,
invertebrate, and plant species, shall not be degraded; ii) The natural taste, odor, and color
of fish, shellfish, or other marine resources used for human consumption shall not be altered;
and iii) the concentration of organic materials in fish, shellfish or other marine resources used
for human consumption shall not bio-accumulate to levels that are harmful to human health.
It is clear that habitat degradation and continuing decreases in water quality are occurring
in many coastal estuaries (Harned and Davenport, 1990; Breitburg, 1992), but the direct and
indirect links between habitat quality and fish population responses remain unclear.
The ability of estuarine organisms to detect and avoid stressors/pollutants is not only the
cornerstone for assessing other consequences of that stressors including their effect on
growth and feeding, reproduction, and predation and competition, but is also important
information for future management plans. In addition, they help answer the broader question
126
of how fish populations and estuarine communities are influenced by environmental
perturbations.
Both of these components are crucial for subsequent water quality models capable of
predicting changes in fish populations as a direct result of land uses, nutrient loading, and
hydrodynamics.
Nowadays, the procedure for the assessment and management of submarine outfalls
relies on the legislative framework not accounting directly with their influence on the specific
species that belong to the marine ecosystems. The aim of this procedure is to go beyond this
approach and reformulate the problem of the design of submarine outfalls as:
How can the impact of these structures be quantified, at a long-term, in the evolution of
the ecosystem considering plume characteristics, behavior and associated effects?
The above problem is approached with the control volume analysis and the Reynolds
transport theorem: the effluent plume is analysed as a moving and deforming control volume,
making a balance of flow in versus flow out. Species are analysed based on their mobility
and spatial distribution.
Since the aim is to develop a risk assessment procedure for aquatic systems, the
probability stressor/contaminant in the plume passing a threshold value is calculated together
with the probability that a marine specie intersects that plume and the probability of
persistency by the specie in the plume.
The application of Monte Carlo simulations in the methodology allows a long-term
prediction of the above probabilities and the risk estimation of submarine outfalls in the
aquatic ecosystem.
Moreover, this approach is extended to the management of these structures, with short
and medium-term analysis, by, for example, quantifying their impact in the life cycles of
marine species and managing discharges accordingly.
This chapter starts by describing the developed methodology and objectives followed by
the significance of marine processes and biodiversity characterization to the procedure
application. The developed encounter probability model is described and applied to the
coastal region of Algarve, in the south of Portugal.

127
6.2 Objectives
The specific objectives of this study include:
• Identification and evaluation of risks/dangers to marine organisms that are
influenced by stressors (e.g. hypoxia);
• Calculation of the probability that the effluent exceeds a stressor/contaminant
threshold value;
• Calculation of the encounter probability species-effluent;
• Calculations of species residence times inside the effluent;
• Providing a base line study (in the design stage) concerning natural populations
(e.g. plankton, benthos and fish) in the area and evaluate benefits and losses to
area fisheries resulting from submarine outfall.
• Use the methodology in the design and management of submarine outfalls, has a
predictive tool, to quantify and assess ecosystems evolution and species life
cycles influence of these structures.
6.3 Methodology
The assessment and management of environmental risks is a preventive instrument that
is here applied with the objective of introducing a procedure aimed at minimizing the
environmental repercussions of contaminant emissions on coastal waters that are related to
project of submarine outfalls.
The methodology aims to, at a final stage, incorporate marine biodiversity life cycles in
the design of submarine outfalls offering an understanding of stressors levels that can cause
significant impact on marine benthic communities and a more rigorous basis on which to
establish critical thresholds to preserve fishery resources and to effectively conserve coastal
biodiversity.
The main procedure, illustrated in Figure 6-1, is composed by the following steps:
1) Development of a model to estimate the instantaneous flux of individuals that enter
and exit the plume, given a non-stationary plume and a probabilistic characterization
of mobility and spatial distribution of marine species (section 6.5.3.1);
2) Development of a model to estimate residence times, given the above fluxes of
individuals (section 6.5.3.2);
3) Implementation of a case-study testing the range of parameters correspondent to the
developed models (section 6.5.4).

128
Supporting tools include:
1) Application of an hydrodynamic model to characterize the physical processes (long-
term prediction: Monte Carlo simulations), in the study area, around the submerged
submarine outfall;
2) Characterization of the effluent to be discharged and/or selection of an environmental
operational failure mode;
3) Application of a water quality model to assess potential ecological effects based on
the physical, chemical and biological processes.
The impact of submarine outfalls in marine species is evaluated through the calculation of
individual in plume-residence times and the metabolic characteristics of marine species.
Figure 6-1. Risk assessment methodology based on the encounter probability method.

129
6.4 Water quality standards and marine biodiversity
The quality of surface water results from an intricate interplay of numerous biochemical,
chemical and physical processes.
The organic matter in surface water arises from discharges of wastewater and from the
primary production and mortality of phytoplankton (algae) and water plants. The assimilation
of carbon dioxide by phytoplankton produces dissolved oxygen (DO). The production is more
intense in nutrient (N, P) rich water, especially in highly eutrophic, shallow water systems.
Dead organic matter often called detritus is mineralised by bacteria and settles on the
sediment, where the decomposition continues. DO is consumed and carbon dioxide and
nutrients (ammonium, phosphate) are released in the mineralisation process. The
ammonium released is oxidised to nitrate in a microbial process called nitrification. DO
exchanges with the atmosphere proportional to de degree of super- or undersaturation.
All processes are highly dependent on temperature (directly) and solar radiation
(indirectly), which implies diurnal and seasonal variation of process rates and concentrations.
The seasonal differences may be large in moderate climates. The diurnal variation of the
dissolved oxygen concentration may also be large in connection with primary production
(assimilation) in eutrophic water systems.
If toxic substances are discharged, then biological species may disappear within a certain
distance from the discharge point (Figure 6-2).
Figure 6-2. Effects on water quality and species populations from sewage disposal (adapted from: Ganoulis, 2009)
According to Borchardt (1992) and Fischer (1998) spills from combined sewer overflows
can lead to acute danger (over a time span up to some hours) for the receiving water due to
hydraulic stress or chemical contamination. Delayed effects (some hours to some days) can
result from chemical contamination, especially from oxygen consuming components (organic
matter, ammonium). Bacteria and viruses can lead to a hygienic contamination, resulting in

130
both acute and delayed effects. As long-term effects (weeks, month or even years)
eutrophication, accumulation of pollutants as heavy metals in organisms and sediments and
possible impacts of micro pollutants and decrease in the variability of different species
ultimately affecting the life cycles of commercially important fish and crustaceans.
In the case where oyster farms have been developed, producing several millions of
tonnes of oysters every year, the risk of contamination of shellfishes by coliform bacteria
should be evaluated when designing a submarine outfall and a WWTP.
Table 6-1 provides an overview of common pollution problems, the associated state
variables, the important relations between state variables and the main forcing functions.
Table 6-1. Overview of common pollution problems (Deltares, 2014).
POLLUTION PROBLEM STATE VARIABLE (S) IMPORTANT PROCESSES FORCING
FUNCTIONS Bacteria pollution Coliform bacteria Mortality of bacteria Solar radiation
Oxygen problems
BOD (biochemical oxygen demand), dissolved oxygen
Decay of BOD, consuming oxygen and reaeration (exchange of oxygen between water and
atmosphere)
Water temperature, wind speed,
streamflow velocity
Eutrophication
Algae, inorganic nutrients (N-NH4, N-NO3, P-PO4, Si), particulate organic
matter
Growth and mortality of algae, mineralization of particulate
organic matter
Solar radiation, water temperature
Heavy metals Inorganic suspended solids, heavy metal
Partitioning, sedimentation, resuspension
Streamflow velocity, wind and waves
Duarte and Vaquer-Sunyer (2008) examined the variability in oxygen thresholds for
hypoxia across benthic organisms and showed that hypoxia thresholds vary greatly across
marine benthic organisms and that the conventional definition of 2 mg O2/liter to designate
waters as hypoxic is below the empirical sublethal and lethal O2 thresholds for half of the
species tested.

131
Figure 6-3.A massive kill of estuarine fish at Bayou Chaland, Plaquemines Parish, Louisiana, in September 2010
attributed to dissolved oxygen depletion in areas oiled by the Deepwater Horizon spill (photo by P. J. Hahn).
The differences in oxygen thresholds for hypoxia across taxa probably reflect the broad
differences in adaptations to cope with low oxygen conditions among benthic organisms,
which span a broad range of behavioral and metabolic changes [Vaquer-Sunyer and Duarte,
2008]. Metabolic adaptations to cope with hypoxia include depression of activity in the
presence of hypoxia, as reported for echinoderms [Diehl et al., 1979]; reduced feeding
activity (e.g., some crustaceans, molluscs, and polychaetes [Bell et al., 2003; Tamai, 1993;
Llanso and Diaz, 1994]); reduced metabolic rates (e.g., cnidarians [Rutherford and Thuesen,
2005]) and heartbeat rate (some crustaceans [Harper and Reiber, 1999]); and shift to
anaerobic metabolism over time scales of hours to days, an adaptation widespread among
bivalves [Brooks et al., 1991], polychaetes [Grieshaber and Volkel, 1998], oligochaetes
[Dubilier, 1997], echinoderms [Ellington, 1975], and the mud-shrimp Calocaris macandreae
[Anderson et al., 1994], among others.
A better understanding of localized marine species movements is required to estimate the
potential exposure of species to effluent plumes. The timing, frequency, and duration of times
that individuals spend within effluent plumes play an important role in determining the
potential exposure to contaminants. Volumes of effluent, and the levels of ammonia, chlorine,
and other chemicals that it contains, will vary over time. As a result, the timing of individuals
movements into areas that are affected by effluent plumes will have a direct effect on the
levels of ammonia and other chemicals that they are exposed to.
The water quality and marine biodiversity characterization is very important to provide
sufficient information for estimating the environmental risk of stressors/contaminants and to
act against those which constitute a risk which is unacceptable for the system. The

132
encounter probability model proposed, together with the overall methodology, aims to
reformulate the design of submarine outfalls and its management, by considering the above
problems.
6.5 Encounter probability model: contaminant emissions and marine
biodi versity
Most current models predict water quality based on nutrient loading, water motion, and
other parameters including phytoplankton biomass, salinity, and dissolved oxygen
concentration (Bowen, 1997). However, at present they lack the ability to include the
potential impact of stressors (e.g. hypoxia) on survival, movements, growth, and population
dynamics of estuarine species.
Duration of exposure is a particularly relevant factor in the potential chronic toxicity of
contaminants to fish (i.e., effects on growth, reproduction and susceptibility to disease). The
time duration that fish remain within effluent plumes, and the stressors/contaminants that
they are exposed to during these times are important variables that must be considered
when discussing the potential acute or chronic effects associated with exposure.
General 6.5.1
An encounter probability-based model is developed to analyse the encounter probability
between marine species and the plume, based on their mobility, and how much time species
remain in the plume. The calculation of residence times for species allows identifying when
concentration would become dangerously high or remain high for an extended period of time.
This procedure may be used to assess affected marine species predicting changes in
marine populations in the area and how effluent plumes can alter the distributions of fish or
other aquatic organisms, for example due to the effects of environmental operational failure,
estimating the benefits or losses to area fisheries.
Many fundamental ecological processes depend on encounters between organisms (e.g.
feeding, survival, reproduction) being fundamental to many research methods in ecological
science, including trapping of individuals and surveying of populations.
The most widely applied null models of encounter rates are variations of those developed
by Clausius (1859) and Maxwell (1860) to describe the statistical mechanical behavior of
“ideal free gases,” i.e., perfectly elastic, linearly moving spheres of fixed radius (Gurarie and
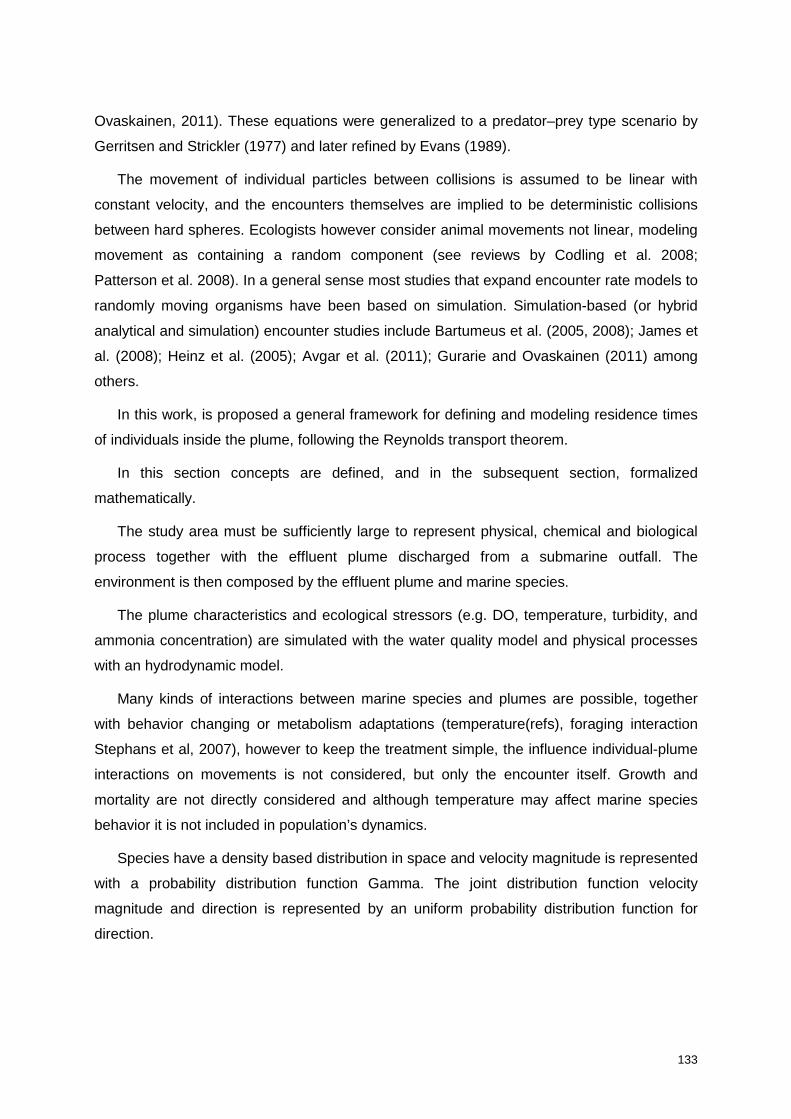
133
Ovaskainen, 2011). These equations were generalized to a predator–prey type scenario by
Gerritsen and Strickler (1977) and later refined by Evans (1989).
The movement of individual particles between collisions is assumed to be linear with
constant velocity, and the encounters themselves are implied to be deterministic collisions
between hard spheres. Ecologists however consider animal movements not linear, modeling
movement as containing a random component (see reviews by Codling et al. 2008;
Patterson et al. 2008). In a general sense most studies that expand encounter rate models to
randomly moving organisms have been based on simulation. Simulation-based (or hybrid
analytical and simulation) encounter studies include Bartumeus et al. (2005, 2008); James et
al. (2008); Heinz et al. (2005); Avgar et al. (2011); Gurarie and Ovaskainen (2011) among
others.
In this work, is proposed a general framework for defining and modeling residence times
of individuals inside the plume, following the Reynolds transport theorem.
In this section concepts are defined, and in the subsequent section, formalized
mathematically.
The study area must be sufficiently large to represent physical, chemical and biological
process together with the effluent plume discharged from a submarine outfall. The
environment is then composed by the effluent plume and marine species.
The plume characteristics and ecological stressors (e.g. DO, temperature, turbidity, and
ammonia concentration) are simulated with the water quality model and physical processes
with an hydrodynamic model.
Many kinds of interactions between marine species and plumes are possible, together
with behavior changing or metabolism adaptations (temperature(refs), foraging interaction
Stephans et al, 2007), however to keep the treatment simple, the influence individual-plume
interactions on movements is not considered, but only the encounter itself. Growth and
mortality are not directly considered and although temperature may affect marine species
behavior it is not included in population’s dynamics.
Species have a density based distribution in space and velocity magnitude is represented
with a probability distribution function Gamma. The joint distribution function velocity
magnitude and direction is represented by an uniform probability distribution function for
direction.

134
Mathematical-probabilistic framework 6.5.2
The model framework is based on plume behavior, individual flow entering and exiting the
plume and residence times inside the plume.
Figure 6-4. Relative velocity effects between a system and a control volume when both move and deform. The
system boundaries move at velocity V, and the control surface moves at velocity Vs (adapted form: White, 2003)
6.5.2.1 Plume-species encounter model
The individual fluxes are analysed based on Reynolds transport theorem, considering the
plume as a control volume that is both moving and deforming arbitrarily, where )(tφ is
considered the plume in instant t and )(tφ∂ the boundary plume in instant t.
Being )(ts any boundary point, fvr
the absolute fluid velocity, the flux of volume across
the control surface is proportional to the absolute normal velocity of the boundary nU F
r and
Ivr
the individual relative velocity in respect to the fluid. The individual velocity in respect to
the boundary is given by:
nUtsvtsvtsv FIf
rrrr −+= ),(),(),( (6-1)
According to the Reynolds transport theorem the net instant flux of individuals through the
boundary, is given by the integral of the velocityvr
, the boundary normal and the individuals
density, i.e.:
( )∫∂ ⋅−=)(| ),(),()(
tvN dsntsvtstFI φ
ρ rrr
, ),( tsρ (6-2)
With the negative sign meaning positive flux entering the plume.

135
Considering individuals with a random ),(~ iII Ufv θr, then the expected net flux through
the boundary is:
∫∫= IvNN dUdtFtFI
θ)()( |r
(6-3)
Since the net flux represents every individual that enters and exit the plume, not
representing the amount of time that the individuals are spending in the plume, gamma
functions are introduced in the model Eδ and Sδ to obtain )(tFE and )|( vtFS .
The residence time distribution of individuals inside a plume is a probability distribution
function that describes the amount of time that an individual could spend inside the plume.
(6-4)
Then,
( )∫∂ ⋅−=)(| )|,(),(|,)(
t IIEvE dsnvtsvtsvtstFI φ
ρδ rrrrr
(6-5)
The flux entering the plume )(| tFIvEr can be separated in three terms:
( ) ( ) ( ) ( ) ( ) ( )∫∫∫ ∂∂∂+⋅−⋅−=
)()()(| ,|,,|,,|,)(
tFIE
tIIE
tfIEvE dsUtsvtsdsnvtsvtsdsnvtsvtstF
I φφφρδρδρδ rrrrrrr
r
I II III
I: Flux of individuals advected;
II: Flux of individuals with independent movement;
III: Flux of individuals due to translation and/or expansion movements of the boundary.
Typical cases are identified in function of relative values of fvr
, Ivr
and FU :
1) FIf Uvv ,>> : when the fluid velocity is much higher than both the individuals
velocity related to the fluid and the plume velocity. In this case the flux of individuals
entering the plume depends mainly on advection processes related to the fluid (e.g.
areas with strong currents), since individuals and plume are almost standing in the
domain, being term I of equation the only being considered;
( ) 1|, =IE vtsrδ if ( ) 0<⋅ nv
rr
( ) 0|, =IE vtsrδ c.c.
( ) 1|, =IS vtsrδ
if ( ) 0>⋅ nvrr
( ) 0|, =IS vtsrδ
c.c.

136
2) FfI Uvv ,>> : when the individuals velocity related to the fluid is much higher than
the fluid velocity and than the plume velocity (e.g. cetaceans, tuna). In this case the
flux entering the plume is only dependent on the individuals mobility, so given by term
II;
3) FfI Uvv >>≈ : when the individuals velocity related to the fluid is of the same order
of magnitude as the fluid velocity and both have much higher velocity than the plume
velocity (e.g. seabass, pilchard), the flux entering the plume is given by term I + II.
4) fIF vvU ,>> : when the plume velocity is much higher than both the individuals
velocity related to the fluid and the fluid velocity (e.g. spills from combined sewer
overflows, treatment failure in the WWTP ), the flux entering the plume is given by
term III;
5) IfF vvU >>≈ : when the plume velocity is the same order of magnitude as the fluid
velocity and both velocities are much higher than the individuals velocity related to
the fluid (e.g. seafloor species), the flux entering the plume is given by terms I + III
6) IfF vvU ≈≈ : when the plume velocity, the fluid velocity and the individuals velocity
related to the fluid have the same order of magnitude, the flux entering the plume is
given by terms I + II + III
For each instant t )(tS φ∂∈ is identified and calculated, from the effluent plume
characteristics ),( tsv f
r and ),( tsU F .
Consider a possible group of ivr
and estimate )|,( IE vtsrδ and )|,( IS vts
rδ . For each ivr
it
is possible to estimate the integrals I, II and III.
Finally, since ivr
is random to obtain )(tFE and )(tFS integration in ( )ivfr
is performed.
( ) IIIIvEE ddUUftFtFI
θθπ
∫ ∫∞
=2
0 0
| ,)()( r
(6-6)
Individuals velocity related to the fluid can be related to several parameters, and
depending on the case study, a distribution function is selected ( )ivfr
.

137
6.5.2.2 Residence-time model
The expected number of individuals entering and exiting the plume between t and t+T is
calculated through )(tFE and )(tFS . These fluxes are assumed to follow a Poisson
distribution function with parameter λ.
( )λPoissonN ~, ∫
+=
dtt
t N dttF )(λ (6-7)
The Poisson parameter is the flux entering or exiting the plume multiplied by the time
interval under consideration:
)(~),( EE PoisTttN λ+ , ∫+
=Tt
t EE dttF )(λ (6-8)
)(~),( SS PoisTttN λ+ , ∫+
−=Tt
t SS dttF )(λ (6-9)
The number of individuals that enter and exit the plume, )(tE and )(tS , is calculated
together with the residence time of each individual. To select which individuals exit the plume
an hypothesis is established; that the exit is random.
The aim is to obtain a sample of residence times that allows the analysis of the residence
time distribution function. Estimation of residence times is the possible together with the
number of individuals that remain in the plume for a residence time higher than the specie
threshold value for a given constituent/stressor.
Case study: the coastal area of Algarve 6.5.3
Algarve coast has an abundant marine biodiversity, which might be related to its
geographical situation, where the water masses of the Mediterranean, the temperate Atlantic
and the tropical Atlantic, converge.
Site-specific characteristics are studied in order to perform simulation of multivariate time
series of the state variables, through Monte Carlo simulation, that characterize the local
predominant forcing agents (methodology described in chapter 4). Historical and climatic
information of physical oceanographic parameters (waves, tides, currents, winds, etc.) is
available through the Spanish Port Authorities (www.puertos.es).
To illustrate the procedure developed methodology, an application to the submarine
outfall of Vale de Faro, situated in Praia do Inatel, Albufeira, in the south coast of Portugal is
analysed.

138
The numerical model Telemac-2D [Galland et al., 1991] was applied to investigate the
hydrodynamics of Albufeira coastal area. The results have been used to drive the water
quality module DELWAQ [Postma et al., 2003] for the simulation of various parameters with
particular interest for this area. Calibration and validation of the hydrodynamic model are
presented in Attachment I, together with the results from initial sensitivity tests using the
water quality module.
For the application of the encounter-probability model each simulation has an uniform
density of individuals in the regular grid.
The tested cases are:
• Mobility-based species: a specie with no mobility ( Fi Uv <<r), a specie with high
mobility ( Fi Uv >>r), and a specie with mobility of the same order of the fluid ( Fi Uv ≈r
).
The individuals relative velocity in respect to the fluid is assumed to follow a gamma
distribution function and three pairs of parameters, shape and scale, are tested, having:
E[X]= 0.1, E[X]= 1.0 and E[X]= 10.
Figure 6-5. Gamma function and parameters tested.
• The influence of the stressor/contaminant threshold value in the plume is tested
based on its repercussion in the plume area: 8.1/ ≈ACR , 10/ ≈ACR and
20/ ≈ACR .
• The effect of fluid velocity 0=fvr
and 0≠fvr
in the individuals velocity ivr
and plume
velocity FU is analysed .

139
Figure 6-6 and Figure 6-7 illustrate the tested values of Gamma distribution: A=2 and
B=0.5; A=2 and B=0.05.
a) b)
Figure 6-6. Histogram of individuals with a Gamma distribution (A=2 and b=0.05): a) entering the plume, b) exiting
the plume.
a) b)
Figure 6-7. Histogram of individuals with a Gamma distribution (A=2 and b=0.5): a) entering the plume, b) exiting the
plume.
6.6 Conclusions and future developments
With the aim and interest in efficiently exploring sustainable development of coastal
waters related to submarine outfalls in terms of protection and improvement of the aquatic
environment a risk assessment methodology is developed with direct impact both on the
design and management of submarine outfalls.
An encounter probability model, based on Reynolds transport theorem, is developed to
calculate the probability that individuals remain within the plume and the correspondent
residence times.

140
Physical, chemical and biological processes are simulated through an hydrodynamic
model and a water quality model. Monte Carlo simulations are used to estimate long-term
predictions.
Supplying necessary information to assess the capability of mobile estuarine organisms
adjust their spatial distribution in response to water quality is a surplus, when applying the
developed methodology, to help answer the broader question of how marine populations and
estuarine communities are influenced by environmental perturbations.
The methodology applications include impact estimation on area fisheries due to effluent
discharges, assess the benefits or losses to area fisheries in the vicinity of the submarine
outfall and suggest fish management practices in the area of the discharge and plant
management practices which would reduce potential dangers.
The results of this study provide a basis for understanding the link between
stressors/contaminants and marine species distributions. Understanding these links and
translating them into effective policy is crucial for present and future attempts to protect and
enhance our coastal and estuarine environments.
After the risk assessment has been completed, the process of risk management should
be initiated, in which the preventive and corrective measures to be applied in order to reduce
these risks are proposed. For each of the measures applicable to the correction of the
various risks, a detailed study must be made in order to evaluate them since the adoption of
these measures must be justified, both in connection with their cost and with their special
characteristics. Finally, after making an evaluation of all of these measures, an order of
priority is established among all of the measures to be applied.
The results (impact probability on species) should also be incorporated in the intrinsic
nature procedure for submarine outfalls, through the specification of target design levels,
adapted to aquatic ecosystems.

141
7 | Conclusions and future research lines
The main conclusions are organized by chapters.
Chapter 2
This chapter describes submarine outfall main sections: onshore headwork, pipeline and
diffuser. The importance of water quality objectives when designing a submarine outfall is
highlighted and the principal constituents in wastewater and their impact on the marine
environment are described.
Moreover physical aspects of hydrodynamic mixing processes that determine the fate
and distribution of the effluent from the discharge location, and the formulation of mixing
zone regulations that intend to prevent any harmful impact of the effluent on the aquatic
environment and associated uses are highlighted
A summary of the deterministic design of submarine outfalls is presented regarding its: i)
integrity and stability (horizontal and vertical forces, hydrostatic pressure, stability of the pipe
on the seabed and diffuser, and; ii) how potential microbial stressors are considered in the
design.
The principal failure modes and corresponding limit states are identified and particular
attention is given to operational failure modes since they are the focus of the methodology
presented in this study.
A historical review of pipeline design evolution formats with different risk methodologies
is presented. The common goal is that submarine outfalls systems should be operated at an
acceptable level of safety, at minimum cost and with a large degree of operating flexibility.
This study aims to be the first step in a conceptual risk assessment methodology for
operational limit states in submarine outfall projects.
Chapter 3
In this chapter a risk assessment procedure was described for the project design phase
of submarine outfalls. The methods and tools used account for randomness and uncertainty,
and are also conducive to cost optimization. This work outlines the initial steps of a
procedure that facilitates decision-making in regards to the target design levels for submarine
outfalls, whatever the materials, techniques, and elements used in their construction. This
procedure is a revised and adapted version of the ROM 0.0 classification of maritime

142
structures in terms of their general and operational intrinsic natures, based on various
repercussion indices [ROM 0.0, 2002; Losada and Benedicto, 2005]. These indices evaluate
the economic, social, and environmental consequences of the most severe failure and
stoppage modes.
This procedure was applied to four case studies of submarine outfalls located on the
Portuguese coast. Based on the type of submarine outfall and its importance to economy,
tourism, and the environment, values were obtained for the minimum useful life of the
structure, the joint probability of failure against the principal failure modes, minimum
operationality, average number of admissible technical breakdowns, and the maximum
duration of a stoppage mode.
Chapter 4
Outfall systems should be operated at an acceptable level of safety, at minimum cost and
with a large degree of operating flexibility. The study of changes in water quality and the
environmental impact of projects related to water resources require adequate methodological
tools.
This chapter outlines the steps of a risk assessment for operational limit states that
facilitates decision-making in regards to the target design levels for submarine outfalls,
whatever the materials, techniques and elements used in their construction.
To illustrate the methodology the procedure was applied to the submarine outfall of Vale
the Faro, located on the southern Portuguese coast.
Chapter 5
The operational short-term forecast methodology presented aims to predict coastal
particle movement and assist the local and regional planning and management for outfall
projects with the necessary flexibility to adapt to the favorable conditions of the marine
environment, maximizing dilution and minimizing effluent impact.
The complete system, once incorporated into an operational warning system as part of a
future study, will become an important management tool for various users, including at a
municipal level for issuing official coastal warnings and closures and for communicating risks
to the public, and at a beach management level to prevent or minimize potential risks through
the early implementation of management strategies, for example the automated activation of
artificial mixing systems during scum-favorable conditions to prevent scum formation.

143
CMS-Flow time consuming simulations, lead to the subsequent application of TELEMAC-
2D model [Galland et al., 1991], developed by EDF-DRD and distributed by SOGREAH.
Limitations on PTM model, related to the incapacity of representing variation of pollutant
concentration associated to biological and chemical processes, suggests the need of a water
quality model.
Chapter 6
The assessment and management of environmental risks is a preventive instrument that
is here applied with the objective of introducing a procedure aimed at minimizing the
environmental repercussions of contaminant emissions on coastal waters that are related to
project of submarine outfalls.
An encounter probability model, based on Reynolds transport theorem, is developed to
calculate the probability that individuals remain within the plume and the correspondent
residence times.
Physical, chemical and biological processes are simulated through an hydrodynamic
model and a water quality model. Monte Carlo simulations are used to estimate long-term
predictions.
These outcomes are aimed to provide a scientific insight for coastal policy makers and
environmental managers on how changes in anthropogenic influences can impact the marine
ecosystem.
The methodology as a whole serves as a useful tool for coastal policy makers and
environmental managers to understand and predict how alternative project designs of
submarine outfalls can impact the marine ecosystem. Incorporating marine biodiversity life
cycles in the design of submarine outfalls offers an understanding of stressors levels that can
cause significant impact on marine benthic communities and a more rigorous basis on which
to establish critical thresholds to preserve fishery resources and to effectively conserve
coastal biodiversity.
144
Conclusiones y futuras líneas de trabajo
Este estudio tiene como objetivo ser el primer paso en una metodología de evaluación de
riesgo potencial para los estados límites operacionales en los proyectos de emisarios
submarinos. Las principales conclusiones del trabajo desarrollado en esta tesis doctoral se
presentan a continuación organizadas por capítulos.
Capítulo 2
En este capítulo se describen las secciones principales de un emisario submarino: parte
terrestre, tuberías y difusores. Se da especial relieve a la importancia, en el diseño de un
emisario, de la calidad del agua en la zona de desagüe del emisario, y se describen los
principales componentes de las aguas residuales a tener en cuenta y su impacto en el
medio marino.
Se destacan los aspectos físicos de los procesos de mezcla hidrodinámicas que
determinan el destino y la distribución del efluente desde su punto de descarga, así como la
formulación de la mezcla y los reglamentos existentes que tienen como objetivo evitar
impactos nocivos de los efluentes en el medio ambiente acuático y en los usos asociados.
Además se identifican los principales modos de falla y los estados límites
correspondientes y se da especial relieve a los modos de fallo de funcionamiento del
emisario, ya que son el foco de la metodología presentada en este estudio.
Se presenta un resumen de la concepción determinista de emisarios submarinos e una
revisión de la evolución en el proyecto de tuberías con diferentes metodologías de riesgo. El
objetivo común es que los sistemas de emisarios submarinos opere en un nivel aceptable de
seguridad, a un costo mínimo y con un alto grado de flexibilidad operativa.
Capítulo 3
En este capítulo se describe el procedimiento de evaluación de riesgos propuesto en
esta tesis para la fase de diseño de emisarios submarinos. Los métodos y herramientas
utilizados tienen en cuenta la aleatoriedad y la incertidumbre del proceso, y conducen a la
optimización de costes. Este trabajo describe los pasos iniciales de un procedimiento que se
pretende que facilite la toma de decisiones en lo que respecta a los niveles de diseño de
emisarios submarinos, cualesquiera que sean los materiales, técnicas y elementos utilizados
en su construcción.

145
Para ello se ha revisado y adaptado la ROM 0.0, Recomendaciones para obras
marítimas, al caso de emisarios submarinos, en términos de sus naturalezas intrínsecas
generales y operativas, en función de diversos índices de repercusión [ROM 0.0, 2002;
Losada y Benedicto, 2005]. Estos índices evalúan las consecuencias económicas, sociales y
ambientales de los modos de fallo y paro más severos.
Este procedimiento se aplicó a cuatro emisarios submarinos situados en la costa
portuguesa. Con base en el tipo de emisario submarino y su importancia para la economía,
para el turismo y para el medio ambiente, se obtuvieron los valores para la vida útil mínima
de la estructura, la probabilidad conjunta de fallo frente a los principales modos de fallo, la
operatividad mínima, el número medio admisible de paradas técnicas y la duración máxima
de parada.
Capítulo 4
Los emisarios submarinos deben ser operados con un nivel aceptable de seguridad, a un
costo mínimo y con un alto grado de flexibilidad operativa. El estudio de las alteraciones en
la calidad del agua y del impacto ambiental de proyectos de estructuras que interfieren con
los recursos hídricos requiere herramientas metodológicas adecuadas.
En este capítulo se describen y se presentan los pasos de una metodología de
evaluación de riesgos desarrollada en esta tesis para los estados límites de operación de un
emisario, que facilite la toma de decisiones en lo que respecta a los niveles de diseño,
cualquiera que sea el material, las técnicas y los elementos utilizados en su construcción.
Para ilustrar la metodología, el procedimiento se aplicó al emisario submarino de Vale el
Faro, situado en la costa sur de Portugal.
Capítulo 5
En este capítulo se presentó la metodología de predicción operativa a corto plazo del
movimiento de las partículas del efluente de un emisario submarino en la costa, de forma a
ayudar a la planificación y gestión local y regional de emisarios, con la flexibilidad necesaria
para adaptarse a las condiciones favorables del medio marino, maximizando la dilución de la
pluma y minimizando el impacto de los efluentes.
El sistema completo, una vez incorporado a un sistema de alerta operacional a
desarrollar en el futuro, se convertirá en una importante herramienta de gestión para los
distintos usuarios, en particular a nivel municipal, permitiendo la emisión de alertar y cierres
de partes de la costa por parte de las entidades oficiales, permitiendo la comunicación de los
riesgos para el público. Con ello será posible un nivel de gestión de las playas que permita

146
evitar o minimizar los riesgos potenciales a través de la pronta aplicación de las estrategias
de gestión tales como, por ejemplo, la activación automática de los sistemas de mezcla
artificiales durante condiciones favorables de forma a evitar la formación de espuma.
El tiempo computacional requerido por el modelo CMS-Flow para seguir el movimiento
de la pluma, aplicado en el capítulo 4, condujo a la aplicación, en este capítulo, del modelo
TELEMAC-2D [Galland et al., 1991], desarrollado por EDF- DRD y distribuido por
SOGREAH.
Limitaciones del modelo PTM, relacionadas con la incapacidad de representar la
variación de la concentración de contaminantes asociados a los procesos biológicos y
químicos, sugiere la necesidad de otro modelo de calidad del agua a implementar como
parte de la metodología desarrollada.
Capítulo 6
La evaluación y la gestión de los riesgos ambientales es un instrumento preventivo que
se aplica aquí con el objetivo de introducir un procedimiento destinado a minimizar las
repercusiones ambientales de las emisiones de contaminantes en las aguas costeras por
emisarios submarinos.
Para ello, se desarrolló un modelo de probabilidad de encuentro, basado en el teorema
de transporte de Reynolds, para calcular la probabilidad de que los individuos permanecen
dentro de la pluma y los tiempos de residencia correspondiente.
Se han simulado los procesos físicos, químicos y biológicos a través de un modelo
hidrodinámico y de un modelo de calidad de agua. Se utilizaran simulaciones de Monte
Carlo para estimar las predicciones a largo plazo.
Los resultados están orientados a proporcionar una visión científica a los responsables
políticos y a los gestores costeros ambientales sobre cómo los cambios en las influencias
antropogénicas pueden afectar el ecosistema marino.
La metodología en su conjunto sirve como una herramienta útil para los responsables de
las políticas costeras y gestores ambientales para entender y predecir cómo los diseños de
proyectos alternativos de emisarios submarinos pueden afectar el ecosistema marino. La
incorporación de los ciclos de vida de la biodiversidad marina en el diseño de emisarios
submarinos ofrece una comprensión de los niveles de los factores de estrés que pueden
causar un impacto significativo en las comunidades bentónicas marinas y una base más
rigurosa que le permita establecer umbrales críticos para preservar los recursos pesqueros y
la conservación efectiva de la biodiversidad costera.

147

148

149
Attachments

150

151
I Hydrodynamic and water quality modelling
I.1 Numerical models
The two main mechanisms for transporting dissolved constituents in coastal waters are
transport due to the flow velocity (advection), and turbulent diffusion, due to random velocity
fluctuations. Advection is a very important transport mechanism, so reliable knowledge of
currents is essential. This may be obtained by a hydrodynamic model, current
measurements, or, best of all, both.
Telemac-2D [Galland et al., 1991] developed by the Laboratoire National d’Hydraulique of
Electricité de France and described in chapter 5 (section 5.4.2) is applied in this
methodology.
A water quality model predicts the far field transport of constituents contained in the
wastewater and their chemical or biological transformations. The objective is to predict
pollutant/stressors concentrations and their temporal variations, in other words water quality.
DELWAQ transport modelling tool [Postma et al., 2003] originally developed as part of
the Delft-3D modelling system (http://delftsoftware.wldelft.nl/) has been configured to use
TELEMAC-2D flow model results; DELWAQ makes use of the hydrodynamic conditions (e.g.
velocities, water elevations, density, salinity) and solves the advection–diffusion equation
(XXX) on a predefined computational grid and for a wide range of model substances (e.g.
nutrients, organic matter, suspended sediment, dissolved oxygen, phytoplankton species,
bacteria and heavy metals)
[ ]tcFcuz
cD
zcu
y
cD
ycu
x
cD
xt
Czzyyxx ,=
−∂∂
∂∂−
−
∂∂
∂∂−
−∂∂
∂∂−
∂∂
where c is concentration, F the water quality process, Dx, Dy and Dz the dispersion
coefficients and ux, uy, uz velocity in the x, y, z directions. Extra transportation mechanisms
such as sedimentation and resuspension are modelled using additional processes specified
in the Delwaq process library. The model is described in more detail in WL | Delft Hydraulics
2006.
Telemac-2D, has been calibrated to investigate the hydrodynamics of Albufeira coastal
area, and the results have been used to drive the water quality module DELWAQ for the
simulation of various parameters with particular interest for this area. Calibration and
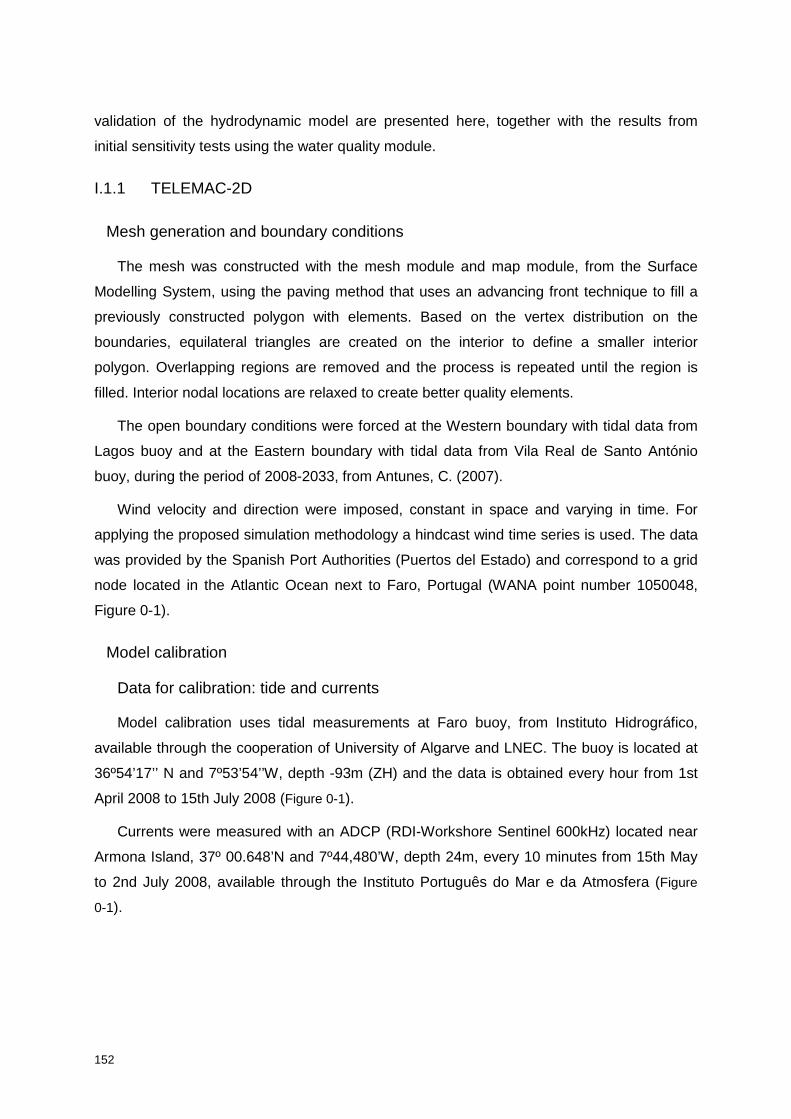
152
validation of the hydrodynamic model are presented here, together with the results from
initial sensitivity tests using the water quality module.
I.1.1 TELEMAC-2D
Mesh generation and boundary conditions
The mesh was constructed with the mesh module and map module, from the Surface
Modelling System, using the paving method that uses an advancing front technique to fill a
previously constructed polygon with elements. Based on the vertex distribution on the
boundaries, equilateral triangles are created on the interior to define a smaller interior
polygon. Overlapping regions are removed and the process is repeated until the region is
filled. Interior nodal locations are relaxed to create better quality elements.
The open boundary conditions were forced at the Western boundary with tidal data from
Lagos buoy and at the Eastern boundary with tidal data from Vila Real de Santo António
buoy, during the period of 2008-2033, from Antunes, C. (2007).
Wind velocity and direction were imposed, constant in space and varying in time. For
applying the proposed simulation methodology a hindcast wind time series is used. The data
was provided by the Spanish Port Authorities (Puertos del Estado) and correspond to a grid
node located in the Atlantic Ocean next to Faro, Portugal (WANA point number 1050048,
Figure 0-1).
Model calibration
Data for calibration: tide and currents
Model calibration uses tidal measurements at Faro buoy, from Instituto Hidrográfico,
available through the cooperation of University of Algarve and LNEC. The buoy is located at
36º54’17’’ N and 7º53’54’’W, depth -93m (ZH) and the data is obtained every hour from 1st
April 2008 to 15th July 2008 (Figure 0-1).
Currents were measured with an ADCP (RDI-Workshore Sentinel 600kHz) located near
Armona Island, 37º 00.648’N and 7º44,480’W, depth 24m, every 10 minutes from 15th May
to 2nd July 2008, available through the Instituto Português do Mar e da Atmosfera (Figure
0-1).

153
Mesh resolution tests
The effects of spatial discretization on the water surface elevation results were tested
with 2 mesh resolutions (Figure 0-1): mesh 1 with 40753 triangular finite elements, mesh 2,
refined in the coastal area, with 73529 triangular finite elements. Results indicate a better
representation of the water surface elevation at Faro buoy by mesh 2, the selected one for
the next simulations.
Figure 0-1. Mesh 2: localization of Faro buoy and ADCP.
Figure 0-2.Space discretization tests: mesh 1 with lower resolution and mesh 2 with higher resolution, in the coastal
area.
Sensitivity analysis of wind influence and tide
An initial set of short simulations was completed to investigate the sensitivity of the
system to variations in tidal elevation and wind, and the importance of tides on the barotropic
circulation, compared to wind (Figure 0-3).
1
1,5
2
2,5
3
3,5
4
4 5 6 7 8 9
Wse
[m]
Days
Faro buoy
mesh 1
mesh 2
Faro buoy
ADCP

154
Figure 0-3. Analysis of tide and wind influence.
Also tested is a global model of ocean tides (TPXO), with data obtained with OSU Tidal
Inversion Software. The methods used to compute the model are described in detail by
Egbert, Bennett, and Foreman, 1994 and further by Egbert and Erofeeva, 2002. Tidal data
from Antunes, C. (2007) produces much more precise tidal results so the latter was preferred
for the simulations.
Calibration of the source terms
The sensitivity of the model to the parameters of friction and turbulence were evaluated.
The sensitivity and initial calibration of the model to bed friction was investigated using
coefficients defined by the Manning (n) law. A range of model simulations for 1 week period 1
April to 1 June 2008 were completed, for friction coefficients: n = 0.018, 0.02, 0.025.
Results showed the magnitude of velocity to decrease with increasing magnitude of
Manning friction coefficient.
Figure 0-4 shows current magnitude comparisons between model results and ADCP
data, from 10th to 25th May 2008. The calculated current magnitude shows a good
agreement with the measurements in amplitude and phase. The correlation coefficient
between results and ADCP is 0.82 and the root mean square error is 0.088.
0
0,1
0,2
0,3
0,4
0,5
0,6
3 3,5 4 4,5 5
Cu
rre
nt
ma
gn
itu
de
[m
/s]
Days
Tide and wind
Tide

155
Figure 0-4. Sensitivity tests with Manning coefficient and calibration with ADCP data.
Turbulence was modeled with the constant viscosity model (velocity diffusivity 10-6) and
Smagorinsky model (coefficient of wind influence: 10-6), being the latest generally used for
maritime domains with large-scale eddy phenomena.
Figure 0-5 shows current magnitude comparisons between model results and ADCP data,
from 10th to 25th May 2008. The calculated current magnitude shows a good agreement with
the measurements in amplitude and phase. The correlation coefficient between results and
ADCP is 0.78 and the root mean square error is 0.082.
Figure 0-5. Sensitivity tests with turbulence models and calibration with ADCP data.
0
0,1
0,2
0,3
0,4
0,5
0,6
0,7
0,8
3 4 5 6 7
Cur
rent
mag
nitu
de [m
/s]
Days
ADCPn=0,018n=0,02n=0,025
0
0,1
0,2
0,3
0,4
0,5
0,6
3 3,5 4 4,5 5
Cur
rent
mag
nitu
de [m
/s]
Days
ConstantviscositySmagorinskymodelADCP

156
Figure 0-6. Sensitivity tests with velocity diffusivity and calibration with ADCP data.
The calculated current magnitude shows a good agreement with the measurements in
amplitude and phase. The correlation coefficient between results and ADCP is 0.71 and the
root mean square error is 0.068.
Figure 0-7. Sensitivity tests with the coefficient of wind influence and calibration with ADCP data (n=0.02).
The calculated current magnitude shows a good agreement with the measurements in
amplitude and phase. The correlation coefficient between results and ADCP is 0.65 and the
root mean square error is 0.053m.
I.1.2 D-Water Quality tests
The objective of the water quality modelling was to exemplify its application to a
submarine outfall test case and analyse the possible effects of stressors/pollutants (e.g.
0
0,1
0,2
0,3
0,4
0,5
0,6
0,7
2 3 4 5 6 7
Cu
rre
nt
ma
gn
itu
de
[m
/s]
Days
vellocity diffusivity: 1x10⁻⁶
vellocity diffusivity: 1x10⁻⁴
ADCP
0
0,1
0,2
0,3
0,4
0,5
0,6
2 3 4 5 6 7
Cu
rre
nt
ma
gn
itu
de
[m
/s]
Days
coefficient of wind influence:1x10⁻⁶
coefficient of wind influence:6x10⁻⁷
ADCP
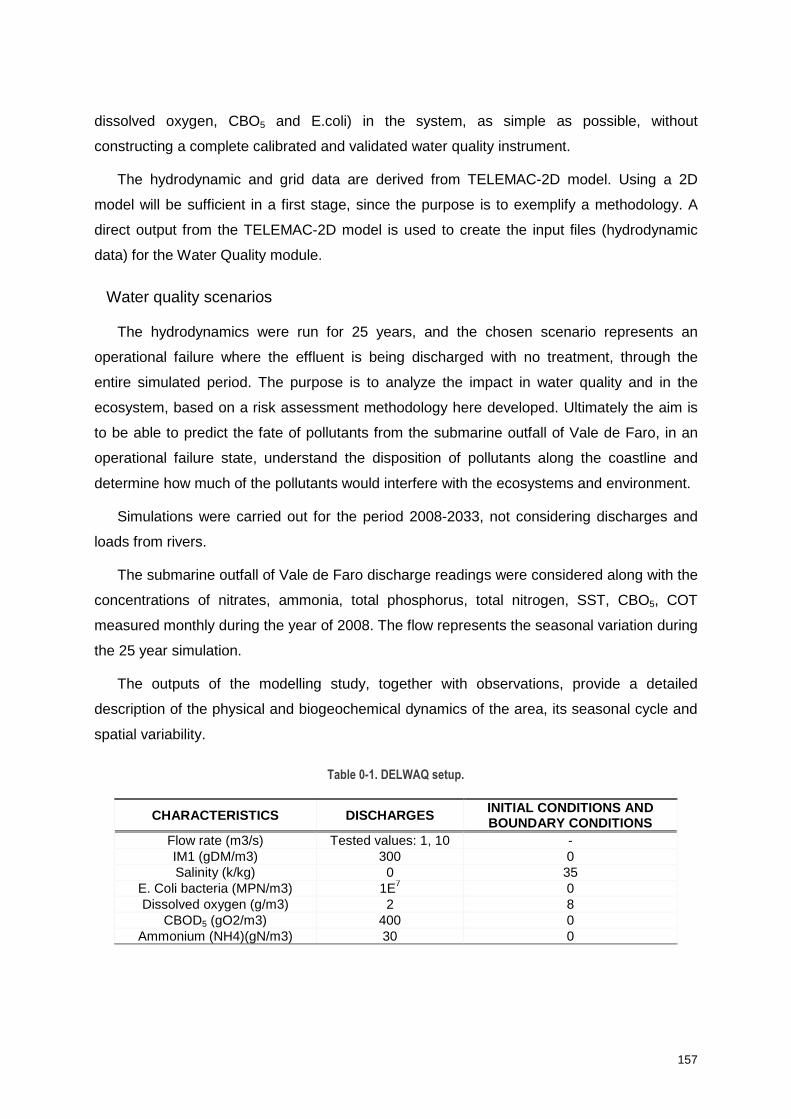
157
dissolved oxygen, CBO5 and E.coli) in the system, as simple as possible, without
constructing a complete calibrated and validated water quality instrument.
The hydrodynamic and grid data are derived from TELEMAC-2D model. Using a 2D
model will be sufficient in a first stage, since the purpose is to exemplify a methodology. A
direct output from the TELEMAC-2D model is used to create the input files (hydrodynamic
data) for the Water Quality module.
Water quality scenarios
The hydrodynamics were run for 25 years, and the chosen scenario represents an
operational failure where the effluent is being discharged with no treatment, through the
entire simulated period. The purpose is to analyze the impact in water quality and in the
ecosystem, based on a risk assessment methodology here developed. Ultimately the aim is
to be able to predict the fate of pollutants from the submarine outfall of Vale de Faro, in an
operational failure state, understand the disposition of pollutants along the coastline and
determine how much of the pollutants would interfere with the ecosystems and environment.
Simulations were carried out for the period 2008-2033, not considering discharges and
loads from rivers.
The submarine outfall of Vale de Faro discharge readings were considered along with the
concentrations of nitrates, ammonia, total phosphorus, total nitrogen, SST, CBO5, COT
measured monthly during the year of 2008. The flow represents the seasonal variation during
the 25 year simulation.
The outputs of the modelling study, together with observations, provide a detailed
description of the physical and biogeochemical dynamics of the area, its seasonal cycle and
spatial variability.
Table 0-1. DELWAQ setup.
CHARACTERISTICS DISCHARGES INITIAL CONDITIONS A ND BOUNDARY CONDITIONS
Flow rate (m3/s) Tested values: 1, 10 - IM1 (gDM/m3) 300 0 Salinity (k/kg) 0 35
E. Coli bacteria (MPN/m3) 1E7 0 Dissolved oxygen (g/m3) 2 8
CBOD5 (gO2/m3) 400 0 Ammonium (NH4)(gN/m3) 30 0

158
Water quality model results
The example calculations with the WAQ module are made for the present situation, using
the hydrological data of one week. Results of TELEMAC-2D model have been used.
The Delft3D-WAQ module allows for a large number of substances and processes to be
modelled. For use in the example calculations a few substances and some simple processes
have been selected. Several substances were selected for use in the example computations.
These substances are all subjected to the advection-diffusion equation that is solved by
Delft3D-WAQ.
Calculations for 25-year period enabled the spatial distribution of physical, chemical and
biological parameters in the Algarve coast to be traced.
The results of the example computations with the water quality model are presented for
different locations in Albufeira area. These locations are points P29164, P22189, P13788,
P26646 and observation area 1 (see Figure 0-8).
Different types of results are illustrated to represent possible analysis used in the
proposed methodology.
Figure 0-8. Identification of points P13788, P22189, P13788, P26646 and observation area 1.
Observation area 1
P29164 P22189
P13788
P26646 Submarine
outfall
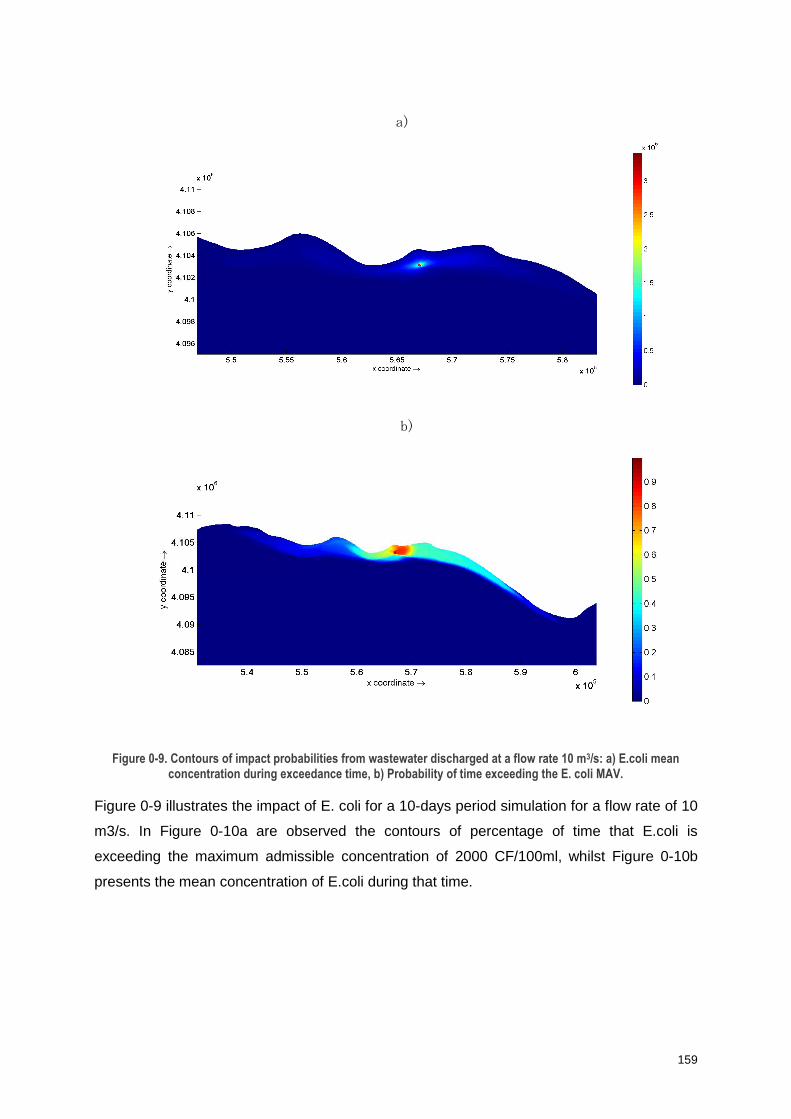
159
a)
b)
Figure 0-9. Contours of impact probabilities from wastewater discharged at a flow rate 10 m3/s: a) E.coli mean concentration during exceedance time, b) Probability of time exceeding the E. coli MAV.
Figure 0-9 illustrates the impact of E. coli for a 10-days period simulation for a flow rate of 10
m3/s. In Figure 0-10a are observed the contours of percentage of time that E.coli is
exceeding the maximum admissible concentration of 2000 CF/100ml, whilst Figure 0-10b
presents the mean concentration of E.coli during that time.
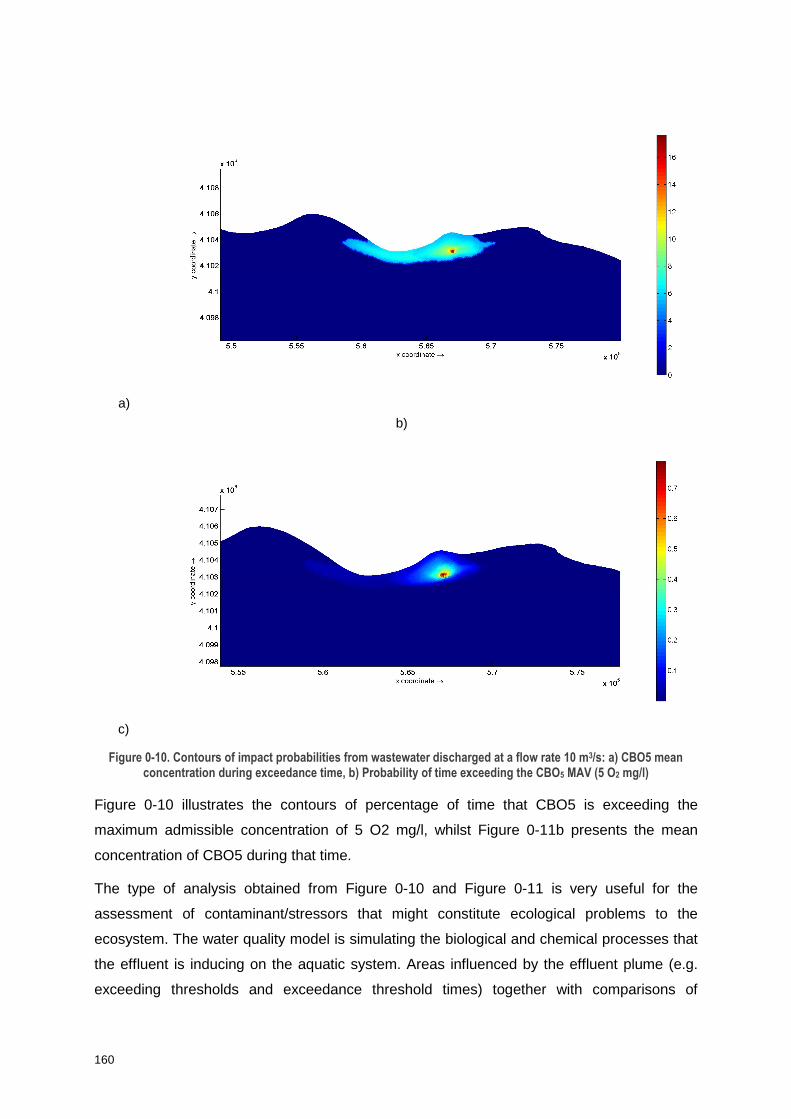
160
a)
b)
c)
Figure 0-10. Contours of impact probabilities from wastewater discharged at a flow rate 10 m3/s: a) CBO5 mean concentration during exceedance time, b) Probability of time exceeding the CBO5 MAV (5 O2 mg/l)
Figure 0-10 illustrates the contours of percentage of time that CBO5 is exceeding the
maximum admissible concentration of 5 O2 mg/l, whilst Figure 0-11b presents the mean
concentration of CBO5 during that time.
The type of analysis obtained from Figure 0-10 and Figure 0-11 is very useful for the
assessment of contaminant/stressors that might constitute ecological problems to the
ecosystem. The water quality model is simulating the biological and chemical processes that
the effluent is inducing on the aquatic system. Areas influenced by the effluent plume (e.g.
exceeding thresholds and exceedance threshold times) together with comparisons of

161
submarine outfall design alternatives are useful per se and an important information for the
probability encounter model. Stressors/effects (CBO5, DO, temperature) are then chosen
and used as input in the probabilistic encounter model to evaluate the impact on marine
species.
a) b)
Figure 0-11. Variation of a) Ammonium concentration and b) BOD5 concentration, from wastewater discharged at a
flow rate of 10 m3/s at observation area 1.
Variation of pollutants/stressors in time at points and areas is also a very useful analysis for
estimating the probability of failure occurring during a predefined period, the dependence of
stressors variation with the effluent flow, the immediate effects of introducing pollutants in the
ecosystem and its ability to recover.
The application is straightforward in cases of beaches, aquaculture areas (existing and
foreseen) and sensitive areas. Moreover, the calculation of residence times associated with
seasonality gives important results both in the design and management of submarine
outfalls.
a) b)
Figure 0-12. Variation of a) Dissolved oxygen concentration and b) E. coli concentration, from wastewater
discharged at a flow rate of 10 m3/s, at observation area 1.
MAV
MAV

162
a) b)
Figure 0-13. Variation of E. coli concentration, from wastewater discharged at a flow rate of 10 m3/s, at point P22189; b) dissolved oxygen from wastewater discharged at a flow rate of 10 m3/s, at P13788
Table 0-2. Residence times and failure probability at 4 observation points and 1 observation area.
TTOTAL=220h OBSERVATION AREA 1 N 22189 N 29164 N 13788 N 26646
Failure periods
2.66h, 20min, 93.33h, 1.66h, 20min, 4.33h, 102h
82.66h, 101h
95h, 1.33h, 48.33h
52h
82.33h, 20min, 7.33h, 20min, 20min
129.33, 7h, 6h,
3.66h, 3.66h,
5h, 4.33h
Pf 0.928 0.833 0.886 0.411 0.78

163
BIBLIOGRAPHY
Almeida, L.P., Ferreira, Ó., Vousdoukas, M., Dodet, G. (2011). “Historical Variation and Trends in Storminess along the Portuguese South Coast.” Natural Hazards and Earth System Sciences, 11, 2407-2417.
Akar, P. J. and G. H. Jirka (1995). "Buoyant Spreading Processes in Pollutant Transport and Mixing Part 2: Upstream Spreading in Weak Ambient Current." Journal of Hydraulic Research 33: 87-100.
Akin, E.W., W.F. Hill, and N. A. Clarke (1975). “Mortality of enteric viruses in marine and other waters”, p. 1-9. In A. L. H. Gameson (ed.), Proceedings of the International Symposium on Discharge of Sewage from Sea Outfalls. Pergamon Press, Oxford.
Anderson SJ, Taylor AC, Atkinson RJA (1994). Anaerobic metabolism during anoxia in the burrowing shrimp Calocaris macandreae Bell (Crustacea, Thalassinidea) Comp Biochem Phys A 108:515–522.
Antunes, C. (2007). Previsão de Marés dos Portos Principais de Portugal. FCUL Webpage, http://webpages.fc.ul.pt/~cmantunes/hidrografia/hidro_mares.html (in portuguese).
Avgar, T., Kuefler, D., Fryxell, J. (2011). Linking rates of diffusion and consumption in relation to resources. Am Nat 178:182– 190
Bartumeus F, Catalan J, Viswanathan G, Raposo E, da Luz M (2008) The influence of turning angles on the success of nonoriented animal searches. J Theor Biol 252:43–55
Bell GW, Eggleston DB, Wolcott TG (2003) Behavioral responses of free-ranging blue crabs to episodic hypoxia. II. Feeding. Mar Ecol Prog Ser 259:227–235.
Benoit, M., F. Marcos and F. Beck (1996). “Development of a third generation shallow-water wave model with unstructured spatial meshing.” pp.465-478. In: Proc. 25th Int. Conf. on Coastal Eng. (ASCE). Orlando, Florida, USA.
Björnsson, H. and Venegas, S.A., (1997). A manual for EOF and SVD - Analyses of Climatic Data. C2GCR Report No. 97-1.
Bleninger, T.; Lipari, G. and Jirka, G.H. (2002). “Design and optimization program for
internal diffuser hydraulics”. 2nd International Conference on Marine Waste Water Discharges (MWWD 2002), Istanbul, September 16-20.
Burcharth, H.F. (2000). “Reliability Based Design of Coastal Structures”. Coastal Engineering Research Center, Vicksburg, Mis. Figueira, P. (2008). Risk assessment in the construction of submarine outfalls and intakes. Proc. MWWD 2008, 5th International Conference on Marine Waste Water Disposal and Marine Environment, Dubrovnik, Croatia, October 27-31.
164
Borchardt, G. C. (1992, August). Understanding causal descriptions of physical systems. In AAAI (pp. 2-8).Borja, A., Franco, J., Pérez, V., 2000. “A marine biotic index to establish the ecological quality of soft-bottom benthos within European estuarine and coastal environments”. Marine Pollution Bulletin 40, 1100e1114.
Bowen, J.D. (1997). Evaluating the uncertainty in water quality predictions: a case study. In: 5th Int. Conf. on Estuarine and Coastal Modeling, Alexandria, VA
Brooks, S. P. J., De Zwaan, A., Van den Thillart, G., Cattani, O., Cortesi, P., & Storey, K. B. (1991). Differential survival of Venus gallina and Scapharca inaequivalvis during anoxic stress: covalent modification of phosphofructokinase and glycogen phosphorylase during anoxia. Journal of Comparative Physiology B, 161(2), 207-212. de Zwaan A, Cattan O, Puzer VM (1993) Sulfide and cyanide-induced mortality and anaerobic metabolism in the arcid blood clam Scapharca inaequivalvis. Comp Biochem Phys C 105:49–54.
Burcharth, H.F. (2000). “Reliability Based Design of Coastal Structures”. Coastal Engineering Research Center, Vicksburg, Mis.
Camenen, B., and Larson, M. (2007). "A unified sediment transport formulation for coastal inlet applications", ERDC/CHL-TR-06-7, US Army Engineer Research and Development Center, Coastal and Hydraulics Laboratory, Vicksburg, MS.
Castillo, C.; Mínguez, R.; Castillo, E.; Losada, M.A. (2006). An optimal engineering design method with failure rate constraints and sensitivity analysis. Application to composite breakwaters. Coastal Eng., 53, 1-25.
Castillo, E.; Losada, M.A.; Mínguez, R.; Castillo, C.; Baquerizo, A. (2004). “Optimal engineering design method that combines safety factors and failure probabilities: application to rubble-mound breakwaters”. Journal of Waterway, Port, Coastal and Ocean Engineering, Vol. 130(2), pp.77-88.
CIRIA/CUR (1991). “Manual on the use of rock in coastal and shoreline protection”. CIRIA Special Publication 83, London, UK, and CUR publication 154, Gouda, The Netherlands CUR/RWS, 1995. Manual on the use of Rock in Hydraulic Engineering. Publication 169 of CUR, Gouda, The Netherlands.
CIRIA (2007). The SUDS Manual, by Woods-Ballard, B.; Kellagher, R.; Martin, P.; Bray,
R.; Shaffer, P. CIRIA C697.
Clausius R (1859). On the mean length of the paths described by the separate molecules of gaseous bodies on the occurrence of molecular motion: together with some other remarks on the mechanical theory of heat. Philos Mag 17:81–91
Codling EA, Plank MJ, Benhamou S (2008). Random walk models in biology (review). J Roy Soc Interface 5:813–834
Das T, Stickle WB (1994). Detection and avoidance of hypoxic water by juvenile Callinectes sapidus and C. Similis. Mar Biol 120:593–600.

165
DeCarlo, E.H., V.L. Beltran, and M.S. Tomlinson 2004. “Composition of water and suspended sediment in streams of urbanized subtropical watersheds in Hawaii.” Applied Geochemistry 19 (7):1011–1037.
Deltares, 2014. Modelling coastline maintenance; a review of three coastline models.
Report 1206171.005, Delft, The Netherlands
Demirbilek, Z., K. J. Connell, N. J. MacDonald, and A. K. Zundel (2008). “Particle Tracking Model in the SMS10: IV. Link to Coastal Modeling System.” Coastal and Hydraulics Engineering Technical Note ERDC/CHL CHETN-IV-71. Vicksburg, MS: U.S. Army Engineer Research and Development Center. http://chl.erdc.usace.army.mil/chetn.
Diehl WJ, Mcedward L, Proffitt E, Rosenberg V, Lawrence JM (1979). Response of Luidia clathrata (Echinodermata, Asteroidea) to hypoxia. Comp Biochem Phys A 62:669–671.
Dubilier N, Windoffer R, Grieshaber MK, Giere O (1997). Ultrastructure and anaerobic metabolism of mitochondria in the marine oligochaete Tubificoides benedii: Effects of hypoxia and sulfide. Mar Biol 127:637–645.
Ellington WR (1975). Holothurian facultative anaerobiosis. Am Zool 15:808–808.
Figueira, P. (2008). “Risk assessment in the construction of submarine outfalls and intakes”. Proc. 5th International Conference on Marine Waste Water Disposal and Marine Environment, MWWD 2008, Dubrovnik, Croatia, October 27-31.
Fisher, N.I. (1993). “Statistical analysis of circular data.” Cambridge University Press.
Freire, A. (2006). “Campanha de Inspecções a ETAR com Descarga em Zonas Balneares Costeiras 2005”. Relatório Técnico, Inspecção-Geral do Ambiente e do Ordenamento do Território. Lisboa, 2006, 49 pp.
Fischer, J. (1998). Einfluss von Mischwassereinleitungen auf den Stoffhaushalt und die Biozönose kleiner Fließgewässer im ländlichen Raum Schriftenreihe der Fachgebiete Siedlungswasserwirtschaft und Abfallwirtschaft Band 19 Gesamthochschule Kassel, Kassel, Germany.
Plate, E. J., and Duckstein, L. (1987). Reliability in hydraulic design. In Engineering Reliability and Risk in Water Resources (pp. 27-60). Springer Netherlands.
Technical Note ERDC/CHL CHETN-IV-71. Vicksburg, MS: U.S. Army Engineer Research and Development Center. http://chl.erdc.usace.army.mil/chetn (2008).
Directive, C. (2006). 7/EC of the European Parliament and of the Council of 15 February 2006 concerning the management of bathing water quality and repealing Directive 76/160. EEC Official Journal L, 64(04), 03.
Environment Protection Authority (2007). “River Murray and Lower Lakes catchment risk assessment for water quality: results and management options.” ISBN: 978-1921125-36-2.

166
European Union (2010). “Water is for life: How the Water Framework Directive helps safeguard Europe’s resources.” Publications Office of the European Union. ISBN 978-92-79-13538-5, doi 10.2779/83017.
Evans GT (1989). The encounter speed of moving predator and prey. J Plankton Res 11:415–417
Figueira, P. (2006). “Uncertainties in the project of a sea outfall”. Proc. 4th International Conference on Marine Waste Water Disposal and Marine Environment, MWWD 2006, Antalya, Turkey, November 6-10.
Figueira, P. (2008). “Risk assessment in the construction of submarine outfalls and intakes”. Proc. 5th International Conference on Marine Waste Water Disposal and Marine Environment, MWWD 2008, Dubrovnik, Croatia, October 27-31.
Fisher, N.I. (1993). “Statistical analysis of circular data.” Cambridge University Press.
Fischer, H.B., E.J. List. R.C. Koh, J. Imberger and N.H. Brooks (1979). Mixing in inland and coastal waters. Academic.
Freire, A. (2006). “Campanha de Inspecções a ETAR com Descarga em Zonas Balneares Costeiras 2005”. Relatório Técnico, Inspecção-Geral do Ambiente e do Ordenamento do Território. Lisboa, 2006, 49 pp. (in Portuguese)
Galland, J.C., Goutal, N., Hervouet, J.M. (1991). “TELEMAC: A New Numerical Model for Solving Shallow Water Equations.” Advances in Water Resources AWREDI, Vol. 14, No. 3, pp. 138-148.
Ganoulis, J. (2009). Risk analysis of water pollution. John Wiley & Sons.
Gameson, A.L.H. and Gould, D.J. (1975). Effects of solar radiation on the mortality of some terrestrial bacteria in sea water. In Discharge of Sewage from Sea Outfalls ed. Gameson, A.L.H. pp. 209–19. Oxford and New York: Pergamon Press.
Gerritsen J, Strickler J (1977). Encounter probabilities and community structure in zooplankton: a mathematical model. J Fish Res Board Can 34:73–82
Grace, R.A. (2009). “Marine Outfall Construction Background, Techniques, and Case Studies”. American Society of Civil Engineers. ISBN-10: 0784409846 (1991).
Grieshaber, M.K., Volkel, S. (1998). Animal adaptations for tolerance and exploitation of poisonous sulfide. Annu Rev Physiol 60:33–53.
Gurarie E, Ovaskainen O (2011). Characteristic spatial and temporal scales unify models of animal movement. Am Nat 178:113–123
Haimes, Y.Y. et al. (eds) (1992) Risk-Based Decision Making in Water Resources V, ASCE, New York.
167
Harper, SL, Reiber, C. (1999). Influence of hypoxia on cardiac functions in the grass shrimp (Palaemonetes pugio Holthuis) Comp Biochem Physiol A 124:569–573.
Hlavinek, P. et al. (eds) (2008) Dangerous Pollutants (Xenobiotics) in UrbanWater Cycle, Springer.
Heinz S.K., Conradt L,Wissel C., Frank K. (2005). Dispersal behavior in fragmented landscapes: deriving a practical formula for patch accessibility. Landsc Ecol 20:83–99
Henriques, C., and Custódio, M. J. (2010). Turismo e Gastronomia: a valorização do património gastronómico na região do Algarve. Revista Encontros Científicos-Tourism & Management Studies, (6), 69-81.
Hervouet, J.-M. and Bates, P. (2000). “The TELEMAC modelling system Special issue." Hydrol. Process, 14: 2207–2208. doi: 10.1002/1099-1085(200009)14:13<2207::AID-HYP22>3.0.CO;2-B.
Hervouet, J.-M and Van Haren (1994). TELEMAC-2D Principle Note (Electricité de France, 1994, Technical Report HE- 43/94/051/B).
Hervouet, J.-M and Van Haren (1996). Recent advances in numerical methods for fluid flows In: Floodplain Processes. Eds. M.G. Anderson, D.E. Walling & P.D. Bates, 1996, 183-214.
James A, Plank M, Brown R et al (2008). Optimizing the encounter rate in biological interactions: ballistic versus Lévy versus Brownian strategies. Phys Rev E 78:51128
Jirka, G.H., Abraham, G., and Harleman, D.R.F. (1976). "An Assessment of Techniques for hydrothermal prediction", Department of Civil Engineering, MIT for U.S. Nuclear Regulatory Commission, Cambridge Jirka, G. H., & Lee, J. H. W. (1994). Waste disposal in the ocean. Water Quality and its Control”, M. Hino (ed.), Balkema, Rotterdam.
Lin, L., Demirbilek, Z., Mase, H., Zheng, J., and Yamada, F. (2008). CMS-Wave: a nearshore spectral wave processes model for coastal inlets and navigation projects. Tech. Report ERDC/CHL TR-08-13. Vick-sburg, MS: U.S. Army Engineer Research and Development Center.
Llanso R.J., Diaz R.J. (1994). Tolerance to low dissolved oxygen by the tubicolous polychaete Loimia medusa. J Mar Biol Assoc UK 74:143–148.
Losada, A. M. and Benedicto, M. I., (2005). Target Design Levels for Maritime Structures. J. Waterway, Port, Coastal, and Ocean Eng. 131, pp. 171-180.
Ludwig, J. A. (1988). Statistical ecology: a primer in methods and computing (Vol. 1). John Wiley & Sons.
MacDonald, N. J., M. H. Davies, A. K. Zundel, J. D. Howlett, T. C. Lackey, Z. Demirbilek, and J. Z. Gailani. 2006. PTM: Particle tracking Model; Report 1: Model theory,
implementation, and example applications. ERDC/CHL TR-06-20. Vicksburg, MS: U.S. Army Engineer Research and Development Center.
168
Maxwell, J. (1860). Illustrations of the dynamical theory of gases: part 1. On the motions and collisions of perfectly elastic spheres. Philos Mag 19:19–32
Mendonça, A., Losada, M.A., Neves, M.G., Reis, M.T., 2012b. “Operational forecast methodology for submarine outfall management: application to a Portuguese case study.” 7th International Conference on Marine Wastewater Discharges and Coastal Environment, MWWD & IEMES 2012, Montenegro, 21-16 October.
Mendonça, A., Losada, M.A., Reis, M.T.; Neves, M.G. (2013). “Risk Assessment in Submarine Outfall Projects: the Case of Portugal.” Journal of Environmental Management, Vol. 116, pp. 186-195.
Mendonça, A., Losada, M.A., Reis, M.T.; Neves, M.G. (2012a). “Risk Assessment in Submarine Outfall Projects: the Case of Portugal.” Journal of Environmental Management (in press).
Mendonça, A., Losada, M.A., Neves, M.G., Reis, M.T., (2012b). Operational forecast methodology for submarine outfall management: application to a Portuguese case study. MWWD & IEMES 2012 7th International Conference on Marine Wastewater Discharges and Coastal Environment, Montenegro, 21-16 October.
Mensencal, Y. (2012). “Use of TELEMAC software system as a technical modelling tool for coastal zone development studies.” SOGREAH Eau - Energie - Environnement - SPICOSA project.
Mitchell, R., & Chamberlain, C. (1975). Factors influencing the survival of enteric micro-organisms in the sea: an overview.Morel, Benoit, and Igor Linkov, eds. Environmental Security and Environmental Management: The Role of Risk Assessment: Proceedings of the NATO Advanced Research Workhop on The Role of Risk Assessment in Environmental Security and Emergency Preparedness in the Mediterranean Region, Held in Eilat, Israel, April 15-18, 2004. Vol. 5. Springer, 2006.
National Academy of Sciences. (1984). Disposal of Industrial and Domestic Wastes: Land and Sea Alternatives. Report of the Panel on Marine Sciences. Commission on Physical Sciences, Mathematics and Applications.
Nessim, M., Zimmerman, T., Glover, A., McLamb, M., Rothwell, B., & Zhou, J. (2002, January). Reliability-Based Limit States Design for Onshore Pipelines. In 2002 4th International Pipeline Conference (pp. 349-361). American Society of Mechanical Engineers.
Office of the Ombudsman (1998). Executive Summary of the Investigation Report on the Co-ordination between the Drainage Services Department and Environmental Protection Department over the Protection of Public Beaches from being Polluted by Sewage Discharges. Hong Kong, January.
Oumeraci, H.; Kortenhaus, A.; Allsop, W.; de Groot, M.; Crouch, R.; Vrijling, H.;
Voortman, H. (2001). “Probabilistic Design Tools for Vertical Breakwaters”. Balkema Publishers, Amsterdam.
169
Patterson T, Thomas L, Wilcox C, Ovaskainen O, Matthiopoulos J. (2008). State–space models of individual animal movement. Trends Ecol Evol 23:87–94
Pilarczyk, K.W. (2000). “Geosynthetics and Geosystems in Hydraulic and Coastal Engineering”, Balkema Publishers, Amsterdan. Postma, L.; Boderie, P. M.A.; Gils, J. A. G. van, BEEK, J. K. L. van (2003). Component Software Systems for Surface Water Simulation. ICCS 2003, LCNS 2657; Springer-Verlag Berlin Heidelberg (1): 649:658.
Pipelife Norge AS (2002). Technical catalogue for submarine installations of polyethylene pipes. Pipelife Norge AS, December 2002.
Puertos del Estado (2002). “General Procedure and Requirements in the Design of Harbor and Maritime Structures. Part I: Recommendations for Maritime Structures”, Ministerio de Fomento, Puertos del Estado, Spain. ISBN 84-88975-30-9.
Reis, M.T.; Neves, M.G. (2003). “Comportamento estrutural de emissários submarinos. Abordagem metodológica”. Relatório 24/03-NPE, Proc. 603/14/14053, 171p., LNEC, Lisboa, Portugal (in Portuguese).
Reis, M.T. ; Neves, M.G.; Silva, L.G. (2004). “Emissários submarinos em Portugal”. Recursos Hídricos, APRH, Vol. 25(3), pp. 31-41 (in Portuguese).
Roberts, Philip J. W., Salas, Henry J., Reiff, Fred M., Libhaber, Menahem, Labbe, Alejandro, Thomson, James C. (2010). "Marine Wastewater Outfalls and Treatment Systems". IWA Publishing. Print ISBN:9781843391890.
ROM 0.0 (2002). “General Procedure and Requirements in the Design of Harbor and Maritime Structures. Part I: Recommendations for Maritime Structures”, Ministerio de Fomento, Puertos del Estado, Spain. ISBN 84-88975-30-9.
Rutherford LD, Thuesen EV (2005) Metabolic performance and survival of medusae in estuarine hypoxia. Mar Ecol Prog Ser 294:189–200.
SANEST, CONSULGAL, SETH75 (2009). “Empreitada de “inspecção e manutenção/reparação do emissário submarino da Guia.” SANEST (in Portuguese).
Santos, C., Barreiros, A., Pestana, P., Cardoso, A., Freire, A. (2011). “Environmental status of water and sediment around submarine outfalls – west coast of Portugal.” Journal of Integrated Coastal Zone Management 11(2):207-217 (2011).
Santos, C., Catarino, J. (2009). “Monitorização Ambiental do Emissário Submarino da Guia – Caracterização do Meio Receptor – 2008”, Relatório final. Relatório INETI/Cendes, Março 2009, 42p +Anexos (in Portuguese).
Santos, C., Catarino, J., Figueiredo, Z., Calisto, S., Cunha, P., Antunes, M. (2008). “Water and Wastewater Monitoring of Guia Submarine Outfall – an 11 year survey”. 5th International Conference on Marine Waste Water Discharges and Coastal Environment. MWWD 2008, Cavtat (Dubrovnik, Croatia) – October 27-31.
170
Santos, M.N. & Erzini, K. (eds) (2007). Catálogo de espécies de peixes de interesse comercial da costa sul atlântica da Península Ibérica. Projecto Gestpesca II, Manual 1. Junta de Andalucia.
Seth 2010. “Emissário Submarino de Albufeira”. WWTP, WTP and Marine Outfall Report.
Simm, J.; Cruickshank, I. (1998). “Construction Risk in Coastal Engineering”. Thomas
Telford, London
Solari, S., and M.A. Losada (2011). Non-stationary wave height climate modeling and simulation. Journal of Geophysical Research, Vol. 116, C09032, doi:10.1029/2011JC007101.
Solari, S., and M.A. Losada (2012a). Unified distribution models for met-ocean variables: Application to series of significant wave height. Coastal Engineering, Vol. 68, 67-77, doi:10.1016/j.coastaleng.2012.05.004.
Solari, S. and M.A. Losada (2012c). Parametric and non-parametric methods for the study of the variability of wave directions: application to the Atlantic Uruguayan coasts. Proceedings of the 33th International Conference on Coastal Engineering.
Solari, S., and M.A. Losada (2012b). “A unified statistical model for hydrological variables including the selection of threshold for the peak over threshold method”. Water Resources Research, 48, Issue 10, October 2012, DOI: 10.1029/2011WR011475
Solari, S. and M.A. Losada (2012c). “Parametric and non-parametric methods for the study of the variability of wave directions: application to the Atlantic Uruguayan coasts”. Proceedings of the 33th International Conference on Coastal Engineering, ICCE2012, 1-6 Jul 2012, Santander, Spain.
Stephens D, Brown J, Ydenberg R (2007). Foraging: behavior and ecology. University of Chicago Press, Chicago
Tamai K (1993). Tolerance of Theora fragilis (Bivalvia, Semelidae) to low concentrations of dissolved oxygen. Nippon Suisan Gakkaishi 59:615–620.
Tolman, H. L. (2002). “User manual and system documentation of WAVEWATCH-III version 2.22.” NOAA / NWS / NCEP / OMB technical note 222, 133 pp.
Torres, M.H., Mascarell, A.H., Hernandez, M.N., Monerris, M.M., Molina, R., Cortes, J.M., (2009). “Monitoring and decision support Systems form impacts minimization of desalination plant outfall in marine ecosystems.” Environmental hydraulics: theoretical, experimental and computational solutions: proceedings of the International Workshop on Environmental Hydraulics, IWEH09, 29 & 30 October 2009, Valencia, Spain.
UNEP-MAP: United Nations Environment Programme-Mediterranean Action Plan 1996. “Guidelines for Submarine Outfall Structures for Mediterranean Small and Medium-Sized Coastal Communities.” Athens. UNEP(OCA)/MED WG.104/Inf.7.

171
UNEP-MAP: United Nations Environment Programme-Mediterranean Action Plan 2004. “Guidelines on sewage treatment and disposal for the Mediterranean region.” Athens. MAP Technical Reports Series No. 152.
US EPA (2003). AP-42, fifth ed., vol. 1, Miscellaneous Sources, US Environmental Protection Agency, Research Triangle Park, NC; (Chapter 13).
Vaquer-Sunyer, R., & Duarte, C. M. (2008). Thresholds of hypoxia for marine biodiversity. Proceedings of the National Academy of Sciences, 105(40), 15452-15457. Vrouwenvelder, A. C. W. M. (2002). Developments towards full probabilistic design codes. Structural safety, 24(2), 417-432.
Vaquer-Sunyer, R. and Duarte, C.M. (2008). Thresholds of hypoxia for marine biodiversity. Proceedings of the National Academy of Sciences 105 (40): 15452-15457. DOI: 10.1073/pnas.0803833105, 2008England MH, Maier-Reimer E (2001) Using chemical tracers to assess ocean models. Rev Geophys 39:29–70
Zielke W. & Mayerle R., 1999, “Küstengewässer” in: Zielke , W. [Hrsg.]: Numerische Modelle von Flüssen, Seen und Küstengewässer, DVWK Schriften 127, Bonn
Wannamaker C.M. and Rice J.A. (2000). Effects of hypoxia on movements and behavior of selected estuarine organisms from the southeastern United States. J Exp Mar Biol Ecol 249:145–163.
Waugh DW, Hall TM (2002) Age of stratospheric air: theory, observations, and models. Rev Geophys 40(4):1010. doi: 10.1029/2000RG000101
White, F. M. (2003). Fluid Mechanics. McGraw-Hill Inc.
WW- Consultores de Hidráulica e Obras Marítimas 2004. “Empreitada de concepção-construção de reforço da etapa de desinfecção da ETAR de Vale de Faro, em Albufeira e das correspondentes infra-estruturas de rejeição no mar das águas residuais tratadas.” Emissário Submarino. Projecto de Execução (in Portuguese).
UNEP-MAP: United Nations Environment Programme-Mediterranean Action Plan (2004). “Guidelines on sewage treatment and disposal for the Mediterranean region.” Athens. MAP Technical Reports Series No. 152.
UNEP-MAP: United Nations Environment Programme-Mediterranean Action Plan (1996). “Guidelines for Submarine Outfall Structures for Mediterranean Small and Medium-Sized Coastal Communities.” Athens. UNEP(OCA)/MED WG.104/Inf.7.