Il commercio al dettaglio in Veneto nel 2015: prove ... · Dinamica dei prezzi al consumo (NIC) e...
19
1/19 Il commercio al dettaglio in Veneto: prove tecniche di ripresa Venezia, 13 luglio 2015 Il commercio al dettaglio in Veneto nel 2015: prove tecniche di ripresa Venezia, 13 luglio 2015 Serafino Pitingaro Unioncamere Veneto | Area Studi e Ricerche Osservatorio Unioncamere – Confcommercio sul commercio al dettaglio in Veneto
Transcript of Il commercio al dettaglio in Veneto nel 2015: prove ... · Dinamica dei prezzi al consumo (NIC) e...
1/19Il commercio al dettaglio in Veneto: prove tecniche di ripresaVenezia, 13 luglio 2015
Il commercio al dettaglio in Veneto nel 2015:prove tecniche di ripresa
Venezia, 13 luglio 2015
Serafino PitingaroUnioncamere Veneto | Area Studi e Ricerche
Osservatorio Unioncamere – Confcommercio sul commercio al dettaglio in Veneto
2/19Il commercio al dettaglio in Veneto: prove tecniche di ripresaVenezia, 13 luglio 2015
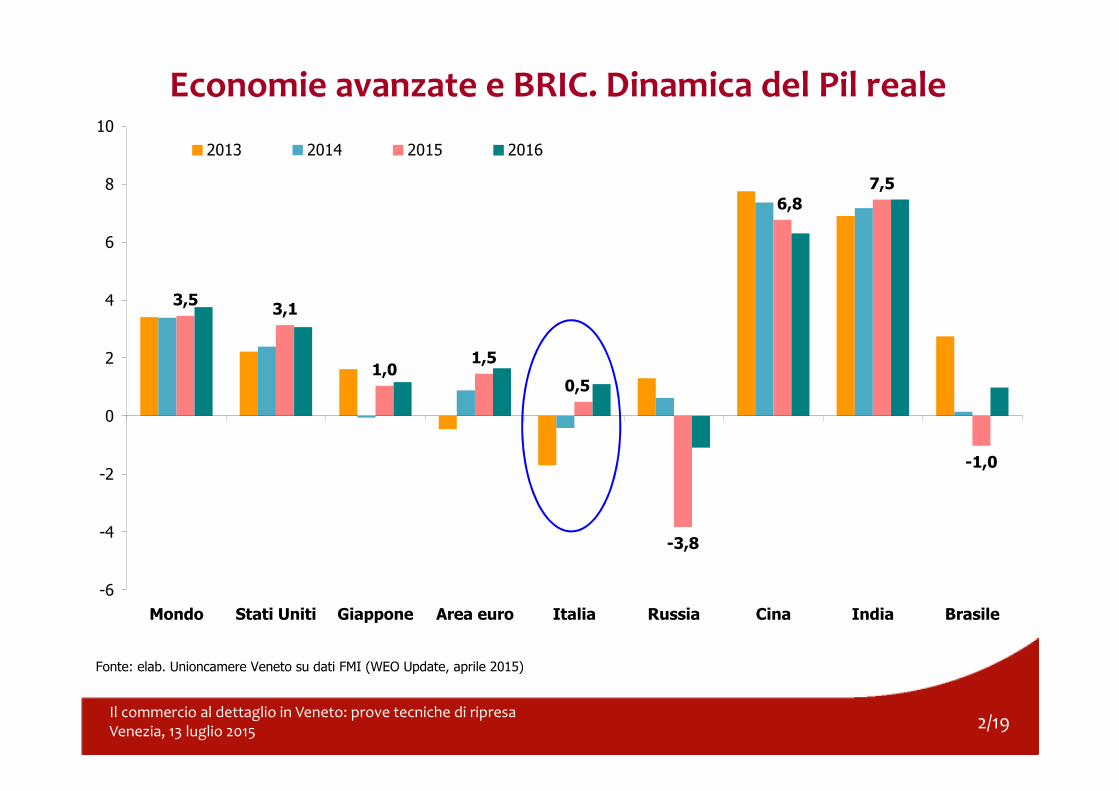
Economie avanzate e BRIC. Dinamica del Pil reale
3,53,1
1,01,5
-3,8
7,5
-1,0
6,8
0,5
-6
-4
-2
0
2
4
6
8
10
Mondo Stati Uniti Giappone Area euro Italia Russia Cina India Brasile
2013 2014 2015 2016
Fonte: elab. Unioncamere Veneto su dati FMI (WEO Update, aprile 2015)

3/19Il commercio al dettaglio in Veneto: prove tecniche di ripresaVenezia, 13 luglio 2015
Italia (tecnicamente) fuori dalla recessione. Andamento del Pil. Anni 2010-2015
380 .0 0 0
385.0 0 0
390 .0 0 0
395.0 0 0
40 0 .0 0 0
40 5.0 0 0
410 .0 0 0
I II III IV I II III IV I II III IV I II III IV I II III IV I
20 10 20 11 20 12 20 13 20 14 20 15
Fonte: elab. Unioncamere Veneto su dat i Istat
+0 ,3%
0 ,0 %

4/19Il commercio al dettaglio in Veneto: prove tecniche di ripresaVenezia, 13 luglio 2015
Veneto. Consumi delle famiglie, investimenti e esportazioni (n.i. 2000=100). Anni 2000-2014

5/19Il commercio al dettaglio in Veneto: prove tecniche di ripresaVenezia, 13 luglio 2015
Veneto. Produzione industriale in ripresa: +1,7% nel 1/2015 (+1,8% la media 2014).
Fonte: Unioncamere del Veneto – Indagine VenetoCongiuntura
72,7
80
90
10 0
110
120
I II III I I II III I I II III I I II III I I II III I I II III I I II III I I
20 0 8 20 0 9 20 10 20 11 20 12 20 13 20 14 20 15
50
60
70
80
90
10 0
Grado d i ut ilizzo degli impiant i
Ind ice grezzo (20 10 =10 0 )
Ind ice destag ionalizzato
6/19Il commercio al dettaglio in Veneto: prove tecniche di ripresaVenezia, 13 luglio 2015
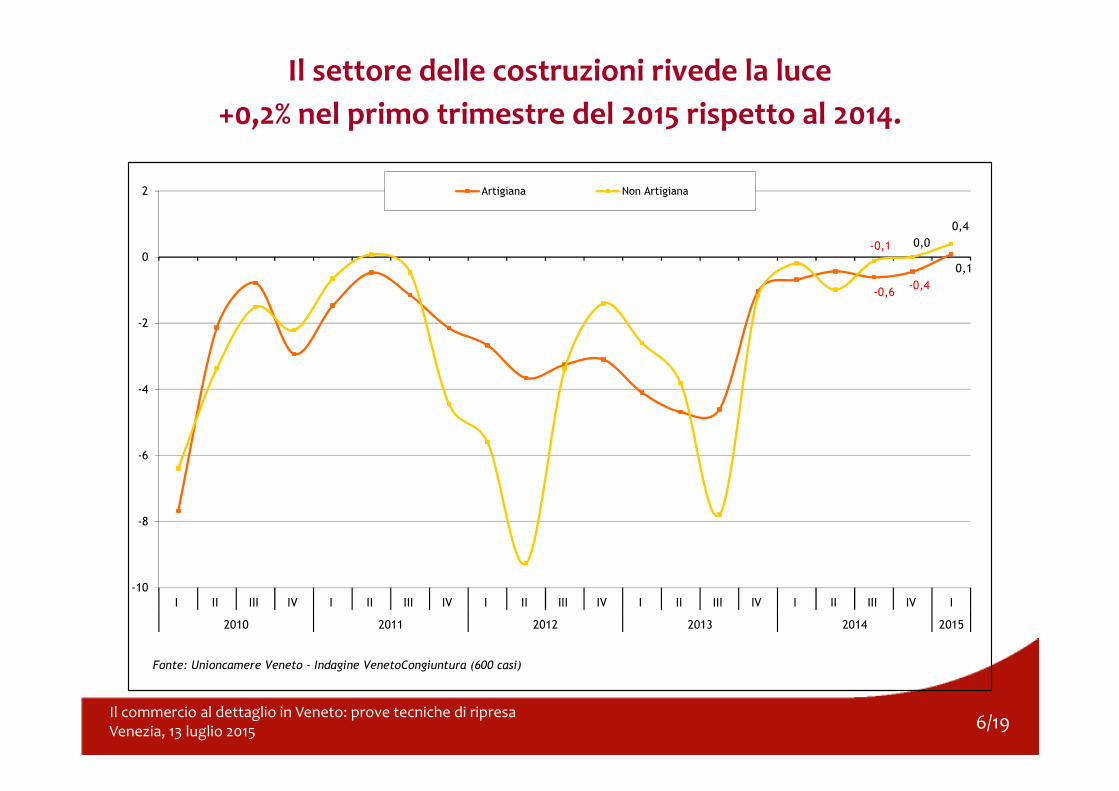
Il settore delle costruzioni rivede la luce
+0,2% nel primo trimestre del 2015 rispetto al 2014.
-0,6 -0,4
0,1
-0,1 0,0
0,4
-10
-8
-6
-4
-2
0
2
I II III IV I II III IV I II III IV I II III IV I II III IV I
2010 2011 2012 2013 2014 2015
Fonte: Unioncamere Veneto - Indagine VenetoCongiuntura (600 casi)
Artigiana Non Artigiana
7/19Il commercio al dettaglio in Veneto: prove tecniche di ripresaVenezia, 13 luglio 2015
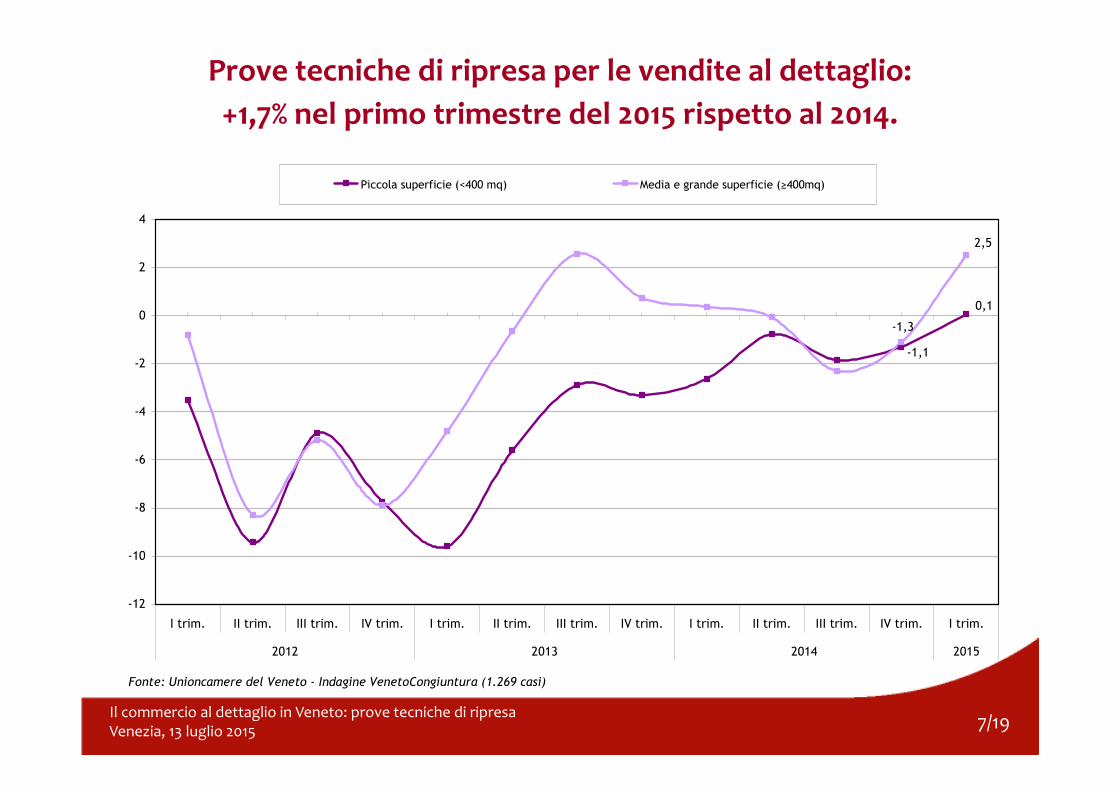
Prove tecniche di ripresa per le vendite al dettaglio:
+1,7% nel primo trimestre del 2015 rispetto al 2014.
Fonte: Unioncamere del Veneto - Indagine VenetoCongiuntura (1.269 casi)
0,1
-1,3
2,5
-1,1
-12
-10
-8
-6
-4
-2
0
2
4
I trim. II trim. III trim. IV trim. I trim. II trim. III trim. IV trim. I trim. II trim. III trim. IV trim. I trim.
2012 2013 2014 2015
Piccola superficie (<400 mq) Media e grande superficie (≥400mq)
8/19Il commercio al dettaglio in Veneto: prove tecniche di ripresaVenezia, 13 luglio 2015
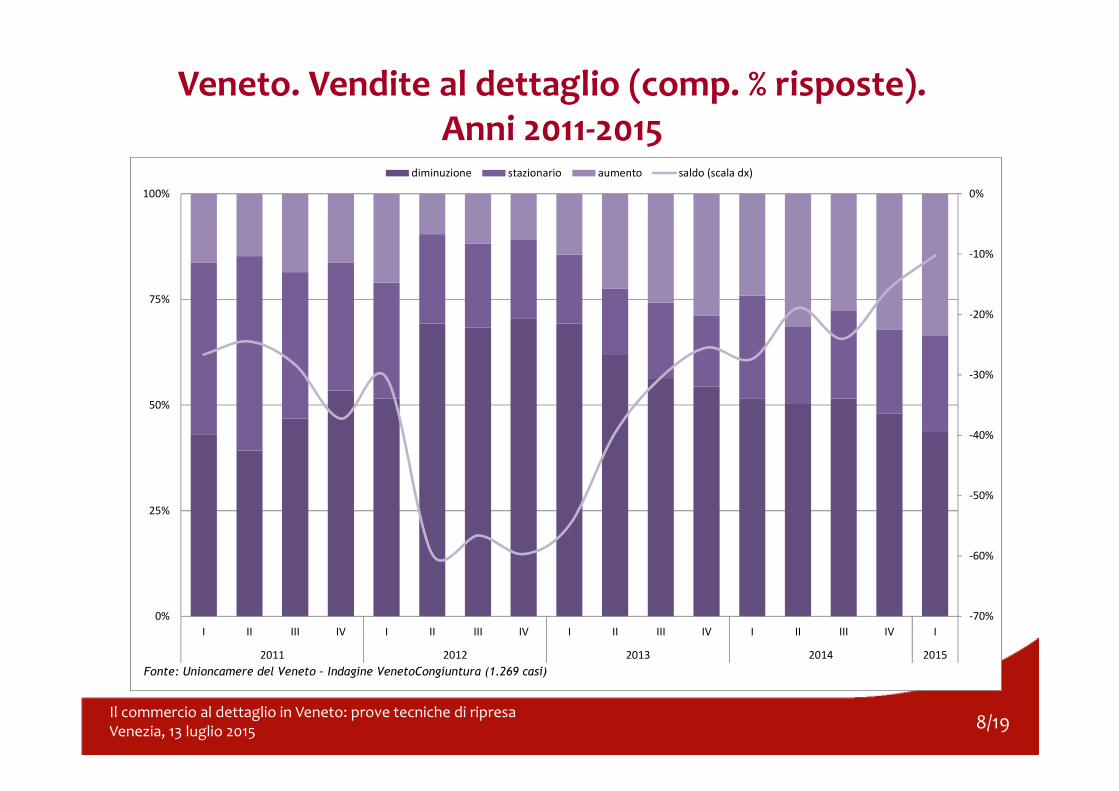
Veneto. Vendite al dettaglio (comp. % risposte). Anni 2011-2015
-70%
-60%
-50%
-40%
-30%
-20%
-10%
0%
0%
25%
50%
75%
100%
I II III IV I II III IV I II III IV I II III IV I
2011 2012 2013 2014 2015
diminuzione stazionario aumento saldo (scala dx)
Fonte: Unioncamere del Veneto – Indagine VenetoCongiuntura (1.269 casi)
9/19Il commercio al dettaglio in Veneto: prove tecniche di ripresaVenezia, 13 luglio 2015
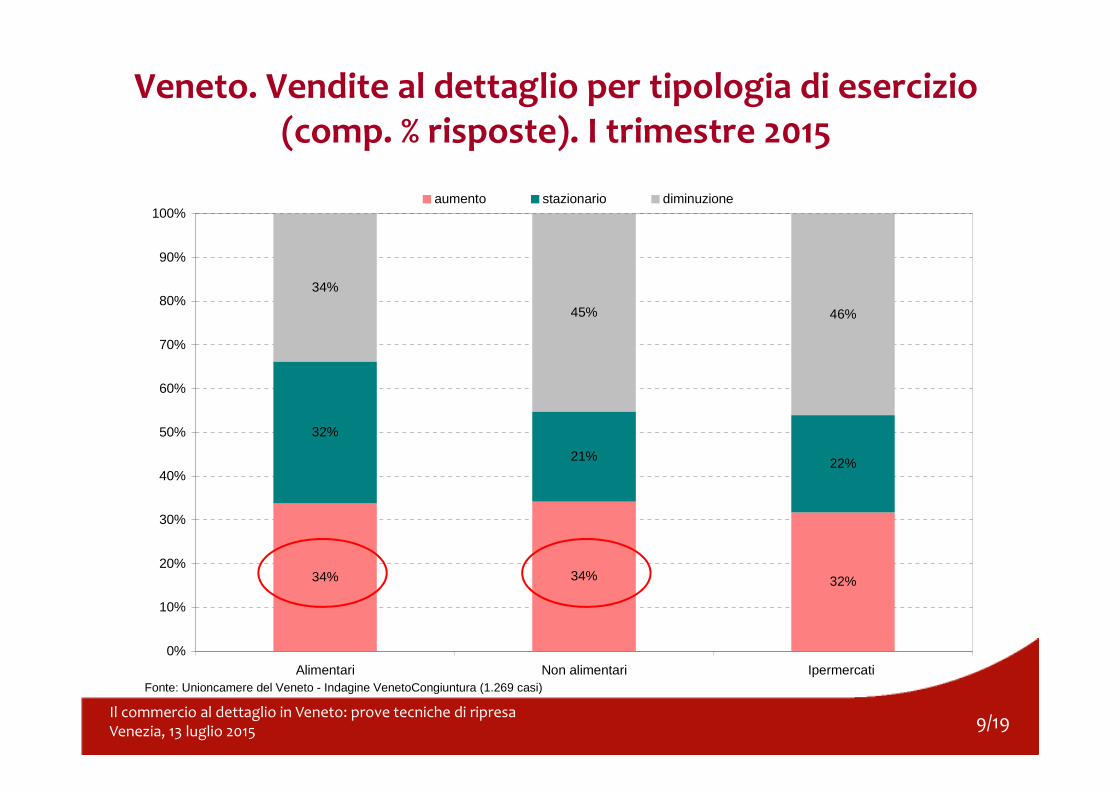
Veneto. Vendite al dettaglio per tipologia di esercizio (comp. % risposte). I trimestre 2015
34% 34% 32%
32%
21% 22%
34%
45% 46%
0%
10%
20%
30%
40%
50%
60%
70%
80%
90%
100%
Alimentari Non alimentari Ipermercati
aumento stazionario diminuzione
Fonte: Unioncamere del Veneto - Indagine VenetoCongiuntura (1.269 casi)

10/19Il commercio al dettaglio in Veneto: prove tecniche di ripresaVenezia, 13 luglio 2015
0%
25%
50%
75%
100%
I II III IV I II III IV I II III IV I II III IV I
2011 2012 2013 2014 2015
-60%
-50%
-40%
-30%
-20%
-10%
0%
10%
diminuzione stazionario aumento saldo (scala dx)
Fonte: Unioncamere del Veneto – Indagine VenetoCongiuntura (1.269 casi)
Veneto. Previsioni a tre mesi delle vendite al dettaglio (comp. % risposte). Anni 2011–2015
11/19Il commercio al dettaglio in Veneto: prove tecniche di ripresaVenezia, 13 luglio 2015
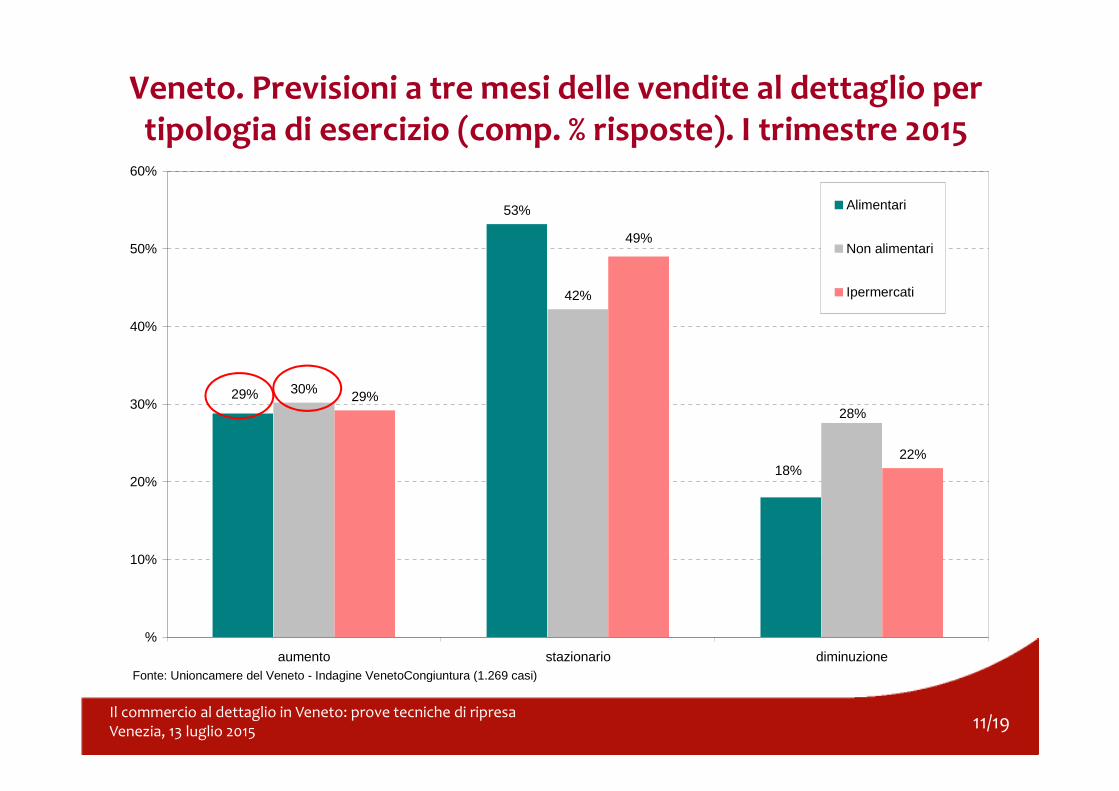
Veneto. Previsioni a tre mesi delle vendite al dettaglio per tipologia di esercizio (comp. % risposte). I trimestre 2015
53%
30%
42%
29%
22%18%
29%28%
49%
%
10%
20%
30%
40%
50%
60%
aumento stazionario diminuzione
Alimentari
Non alimentari
Ipermercati
Fonte: Unioncamere del Veneto - Indagine VenetoCongiuntura (1.269 casi)
12/19Il commercio al dettaglio in Veneto: prove tecniche di ripresaVenezia, 13 luglio 2015
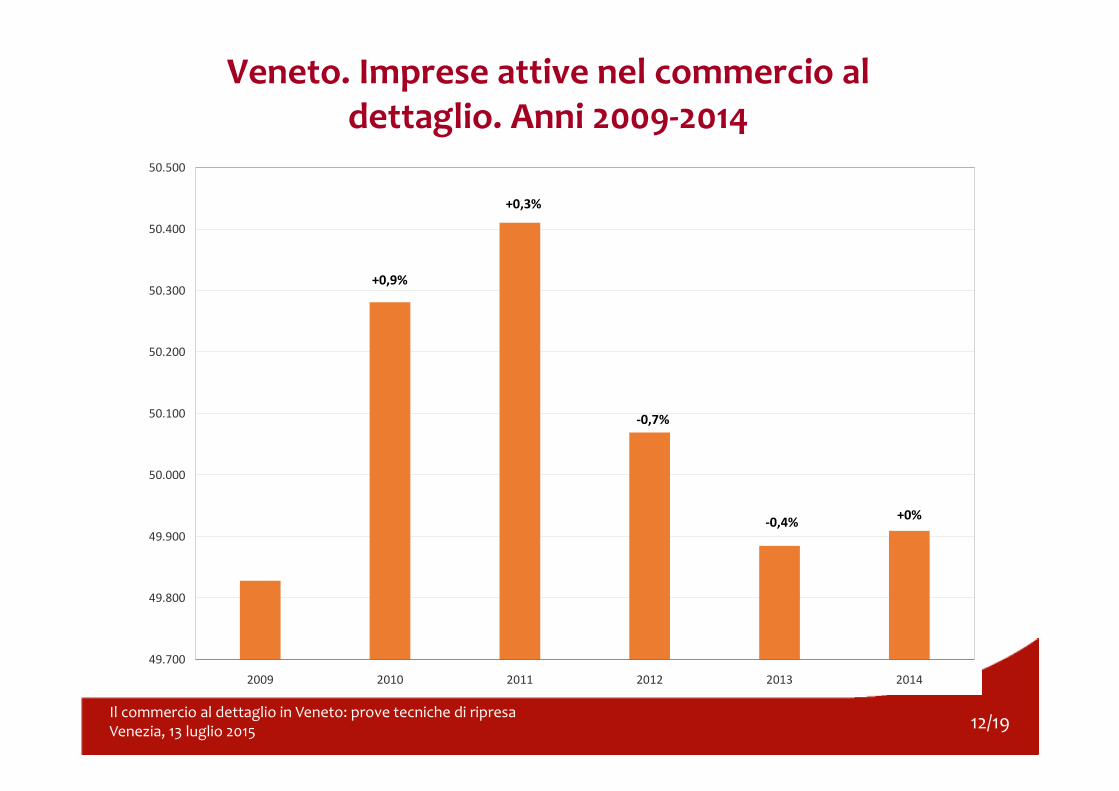
Veneto. Imprese attive nel commercio al dettaglio. Anni 2009-2014
49.700
49.800
49.900
50.000
50.100
50.200
50.300
50.400
50.500
2009 2010 2011 2012 2013 2014
-0,4%+0%
-0,7%
+0,3%
+0,9%
13/19Il commercio al dettaglio in Veneto: prove tecniche di ripresaVenezia, 13 luglio 2015
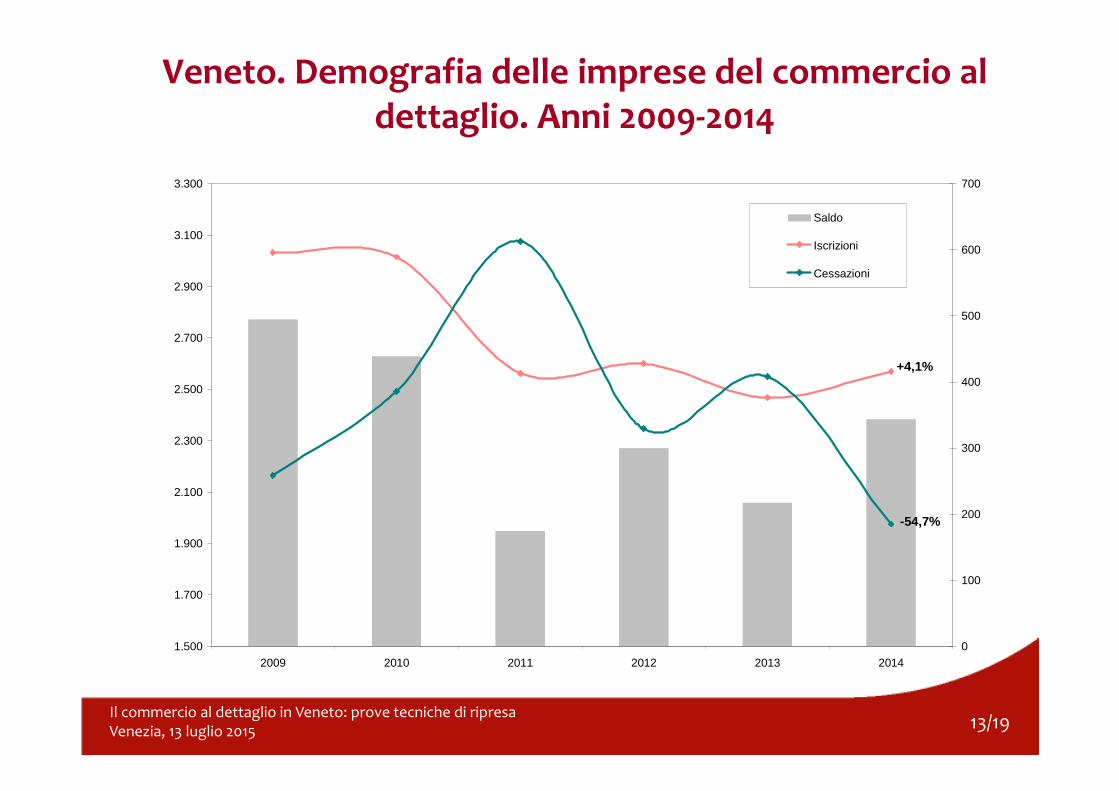
1.500
1.700
1.900
2.100
2.300
2.500
2.700
2.900
3.100
3.300
2009 2010 2011 2012 2013 20140
100
200
300
400
500
600
700
Saldo
Iscrizioni
Cessazioni
-54,7%
+4,1%
Veneto. Demografia delle imprese del commercio al dettaglio. Anni 2009-2014

14/19Il commercio al dettaglio in Veneto: prove tecniche di ripresaVenezia, 13 luglio 2015
Riparte il mercato dell’auto: +4,2% le immatricolazioni nel 2014 (prima variazione positiva dal 2007).
80.000
100.000
120.000
140.000
160.000
180.000
200.000
220.000
2000 2001 2002 2003 2004 2005 2006 2007 2008 2009 2010 2011 2012 2013 2014
Fonte: elab. Unioncamere Veneto su dati Unrae
15/19Il commercio al dettaglio in Veneto: prove tecniche di ripresaVenezia, 13 luglio 2015
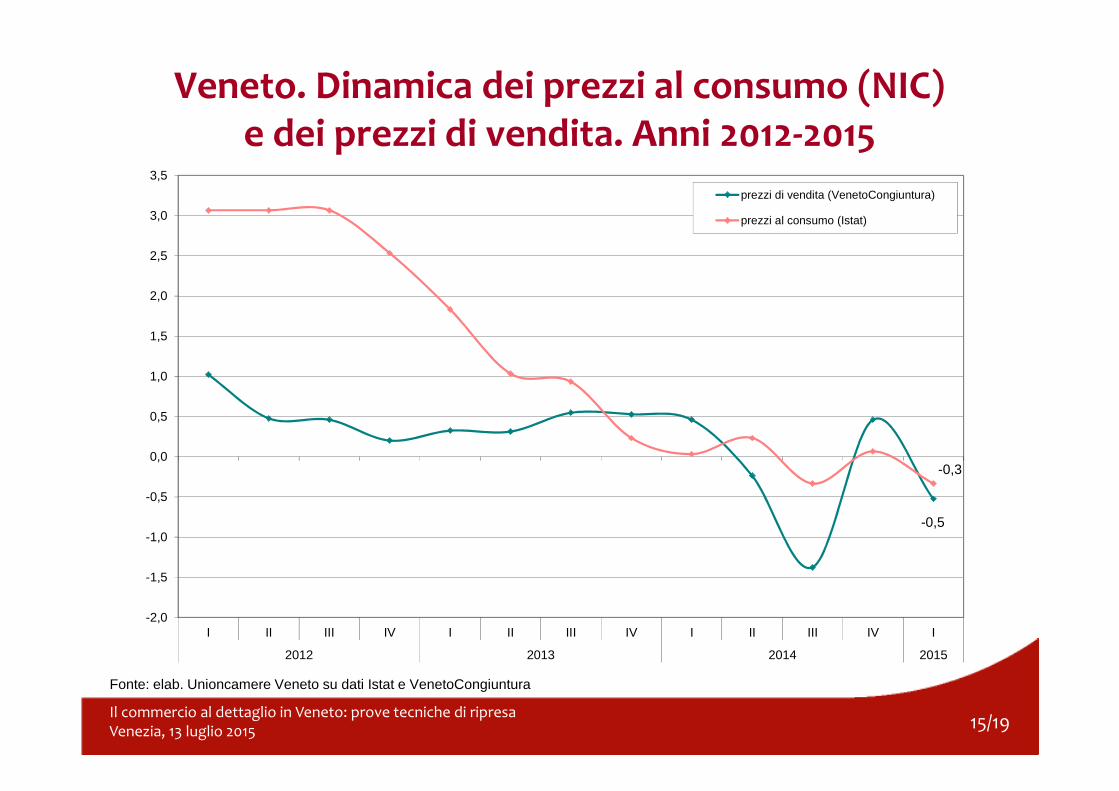
Veneto. Dinamica dei prezzi al consumo (NIC) e dei prezzi di vendita. Anni 2012-2015
Fonte: elab. Unioncamere Veneto su dati Istat e VenetoCongiuntura
-0,5
-0,3
-2,0
-1,5
-1,0
-0,5
0,0
0,5
1,0
1,5
2,0
2,5
3,0
3,5
I II III IV I II III IV I II III IV I
2012 2013 2014 2015
prezzi di vendita (VenetoCongiuntura)
prezzi al consumo (Istat)
16/19Il commercio al dettaglio in Veneto: prove tecniche di ripresaVenezia, 13 luglio 2015
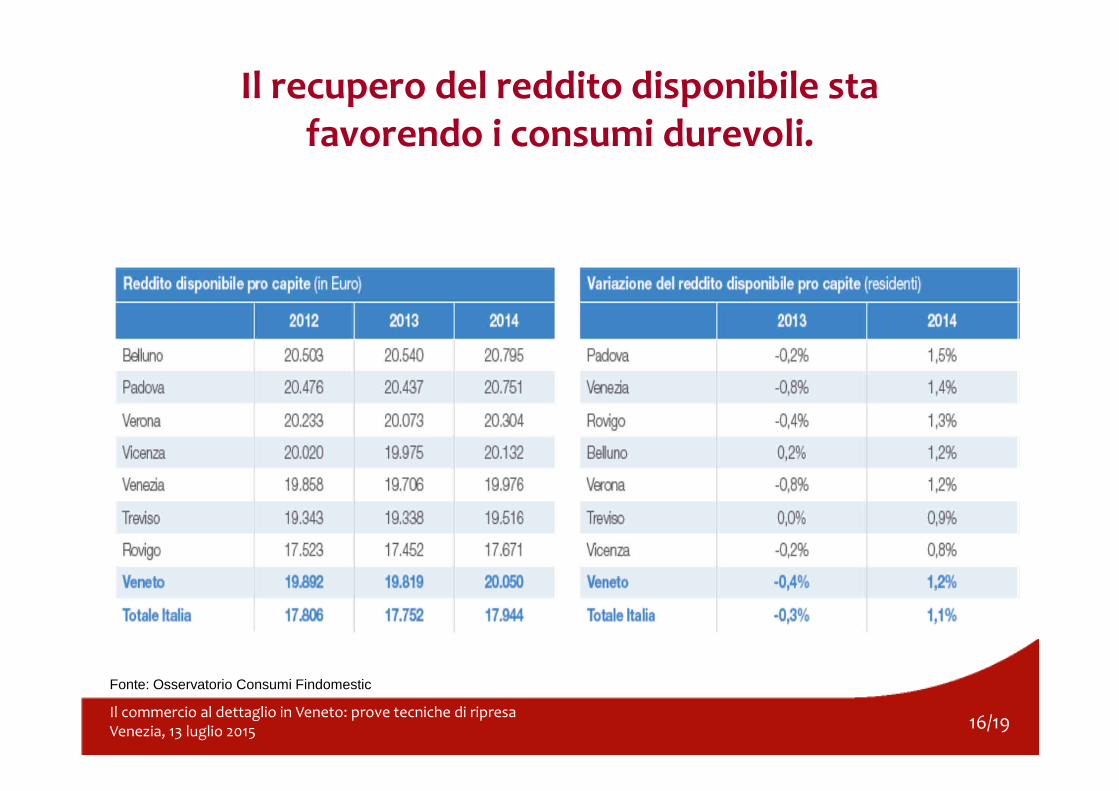
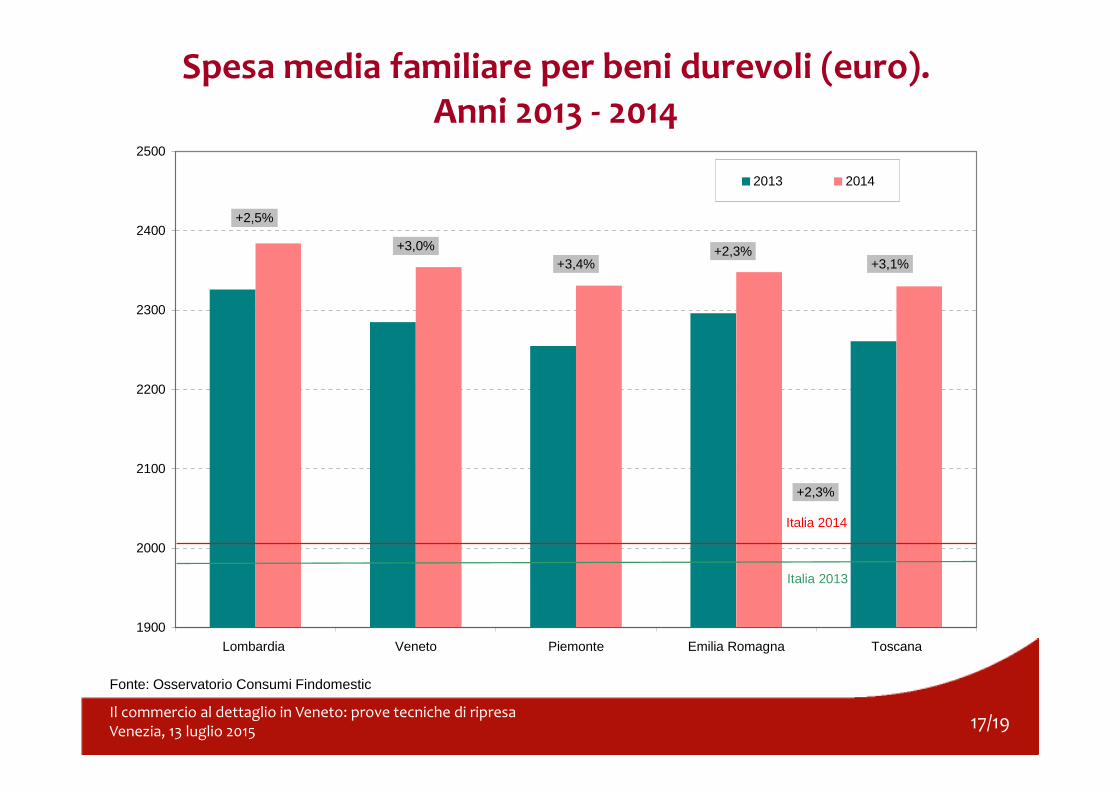
Il recupero del reddito disponibile sta favorendo i consumi durevoli.
Fonte: Osservatorio Consumi Findomestic
17/19Il commercio al dettaglio in Veneto: prove tecniche di ripresaVenezia, 13 luglio 2015
Spesa media familiare per beni durevoli (euro). Anni 2013 - 2014
1900
2000
2100
2200
2300
2400
2500
Lombardia Veneto Piemonte Emilia Romagna Toscana
2013 2014
Italia 2014
Italia 2013
+2,5%
+3,0%+3,4%
+2,3%+3,1%
+2,3%
Fonte: Osservatorio Consumi Findomestic
18/19Il commercio al dettaglio in Veneto: prove tecniche di ripresaVenezia, 13 luglio 2015
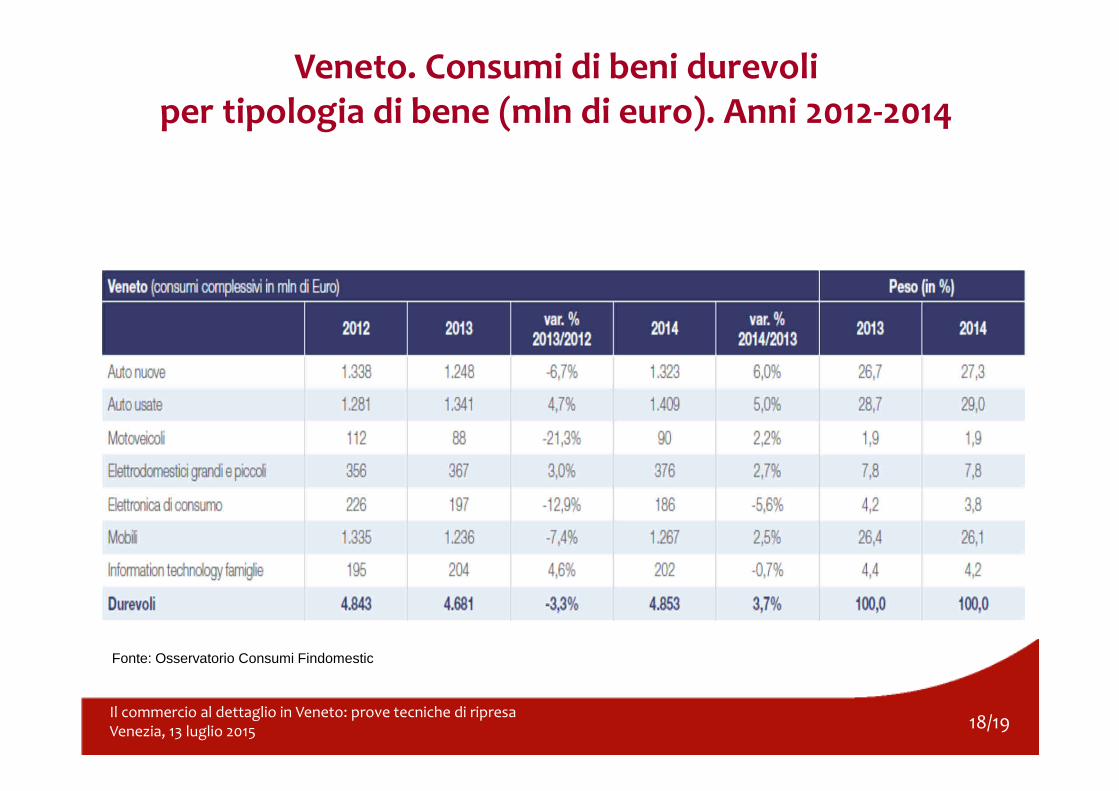
Veneto. Consumi di beni durevoli per tipologia di bene (mln di euro). Anni 2012-2014
Fonte: Osservatorio Consumi Findomestic

19/19Il commercio al dettaglio in Veneto: prove tecniche di ripresaVenezia, 13 luglio 2015
Grazie per l’attenzione!
Tutti i risultati delle indagini congiunturali sono disponibili nel sito
www.venetocongiuntura.it