III Convegno Nazionale CINFAI 15 ottobre 2015 ... · aree polari (Artide e Antartide). ... Isola di...
42
IL CONSORZIO TRA OFFERTA E RICHIESTA DI RICERCA: ANALISI E PROSPETTIVE DI MERCATO III Convegno Nazionale CINFAI Rovereto, 14 – 15 ottobre 2015 Caratterizzazione dell'aerosol atmosferico in aree a differente grado di antropizzazione Roberto Udisti Dipartimento di Chimica, Universita' di Firenze [email protected] Nome Università
Transcript of III Convegno Nazionale CINFAI 15 ottobre 2015 ... · aree polari (Artide e Antartide). ... Isola di...
IL CONSORZIO TRA OFFERTA E RICHIESTA DI RICERCA:ANALISI E PROSPETTIVE DI MERCATO
III Convegno Nazionale CINFAI
Rovereto, 14 – 15 ottobre 2015
Caratterizzazione dell'aerosol atmosferico in aree a differente
grado di antropizzazione
Roberto Udisti
Dipartimento di Chimica, Universita' di Firenze
Nome Università

IL CONSORZIO TRA OFFERTA E RICHIESTA DI RICERCA:ANALISI E PROSPETTIVE DI MERCATO
III Convegno Nazionale CINFAI
Rovereto, 14 – 15 ottobre 2015 Nome Università
2
Composizione UdR UniFI
Dip. Chimica
Roberto Udisti – Prof. Ass.Rita Traversi – Ric. Conf.Silvia Becagli – Laur. Tecn.Mirko Severi – AssegnistaDaniele Frosini – DottorandoMiriam Marconi – DottorandaLaura Caiazzo – DottorandaFabio Giardi – DottorandoFederica Bellandi – BorsistaCostanza Scopetani - Borsista
Dip. Fisica - INFN
Franco Lucarelli – Prof. Ass.Silvia Nava – Ric. INFNMassimo Chiari – Ric. INFNGiulia Calzolai – AssegnistaMartina Giannoni – Borsista
6 Strutturati4 Dottorandi5 Assegnisti/Borsisti

3
Sintesi attivita' scientifiche UdR UniFI
Caratterizzazione chimica di campioni di interesse climatico, ambientale, alimentare, tecnologico e biochimico in matrici complesse (atmosfera, acque, sedimenti, suoli, alimenti, materiali, tessuti biologici.
Studio delle interazioni tra processi climatici e ambientali per il presente e nel passato (analisi chimica e isotopica di carote di ghiaccio e di sedimenti marini in Antartide).
Studio dei processi di origine e trasporto di componenti chimici immessi nell’atmosfera da processi naturali o antropici nel Bacino del Mediterraneo e in aree polari (Artide e Antartide).
Valutazioni di impatto ambientale e di qualita’dell’aria e dell’ambiente.

4
Strumentazione ed Attrezzature UdR UniFI
Cromatografia Ionica
EC-OC Termo-OpticalAnalyser
ICP-AES / ICP-HR-MSIntegrated System
SEM-EDX Analysis

Strumentazione ed attrezzature UdR UniFI
PIXE -Particle Ind. x-ray Emiss.PIGE - Particle Ind. g-ray Em.14C Determination
INFN-3 MV Tandetron Accelerator
Gas Analysis
Classificatori di particolato
Sistemi campionamento
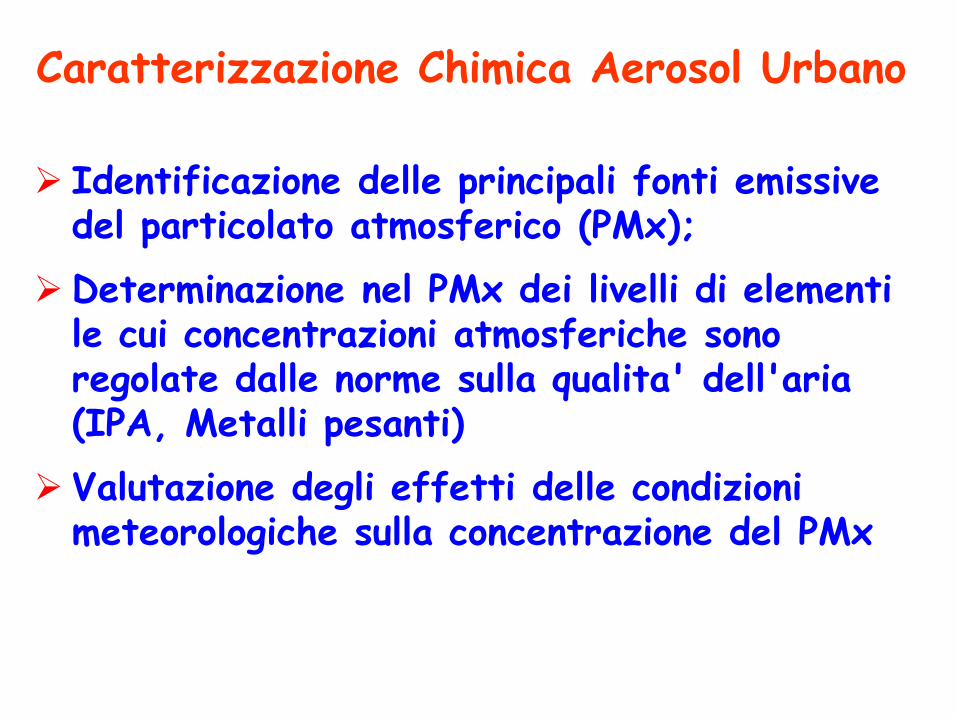
Caratterizzazione Chimica Aerosol Urbano
Identificazione delle principali fonti emissive del particolato atmosferico (PMx);
Determinazione nel PMx dei livelli di elementi le cui concentrazioni atmosferiche sono regolate dalle norme sulla qualita' dell'aria (IPA, Metalli pesanti)
Valutazione degli effetti delle condizioni meteorologiche sulla concentrazione del PMx

Progetto PATOS I e II
PM10 e PM2.5 in 6 siti in Toscana, rappresentativi di aree di differente
tipologia (differenti fonti
emissive e topografia)
Arezzourban traffic
LivornoSub-urban background
Grossetourban background
Firenzeurban background
LuccaUrban background
Pratourban traffic

PM2.5 Source Apportionment
Analisi Statistica MultivariataPositive Matrix Factorization (PMF)
Sito Urbano-Fondo
Sito Marino-Fondo
Sito Urbano-Traffico

Distribuzione giornaliera media della popolazione di nano-particelle in un sito urbano periferico.
Picchi di particolato intorno alle 8:00 e
dalle 18:00 alle 20:00 correlati
all'andamento del traffico.
Valori notturni mediamente piu'
elevati di quelli delle ore centrali della
giornata per effetto della differente efficienza della
circolazione verticale
Nano-Particelle in Sito Urbano-Periferico

Formazione strato diinversione termica
Circolazione verticale
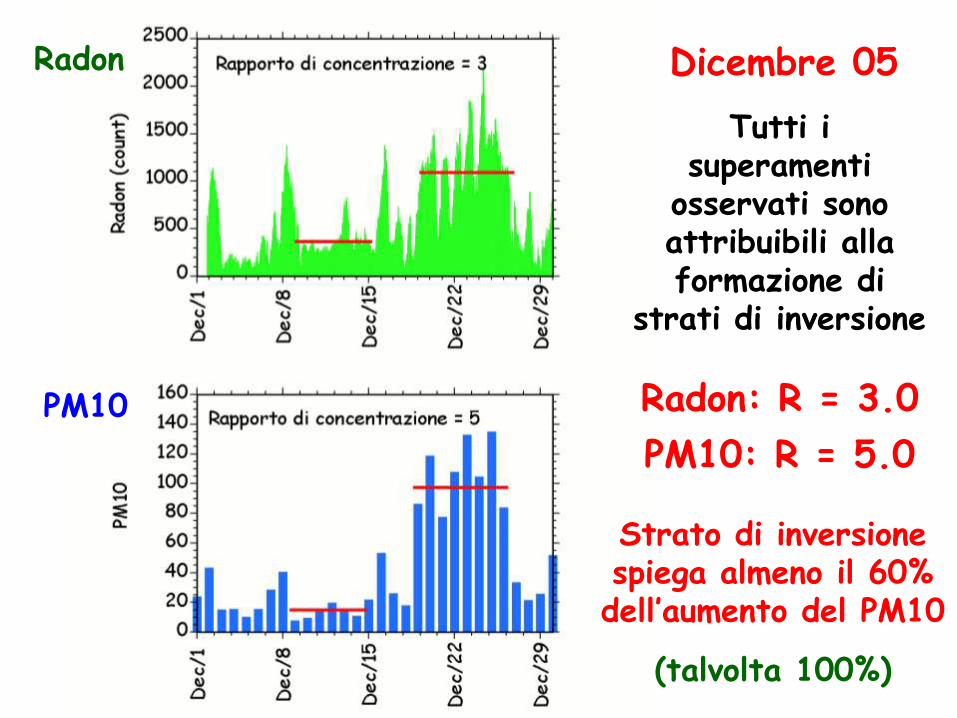
Radon
PM10
Dicembre 05
Tutti i superamenti
osservati sono attribuibili alla formazione di
strati di inversione
Radon: R = 3.0
PM10: R = 5.0
Strato di inversione spiega almeno il 60% dell’aumento del PM10
(talvolta 100%)

AIRUSE LIFE+: SYNERGISTIC DAILY AND HOURLY PMx SOURCE APPORTIONMENT IN URBAN ENVIRONMENTS OF SOUTH EUROPE
Florence
BarcellonaAtene
Oporto
Milano
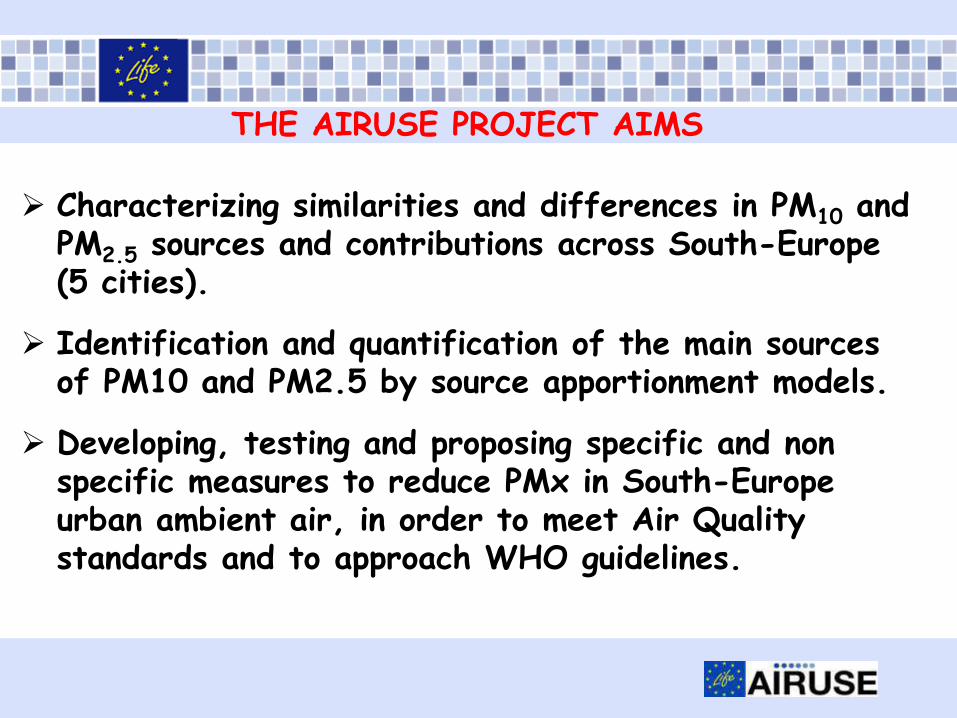
Characterizing similarities and differences in PM10 and PM2.5 sources and contributions across South-Europe (5 cities).
Identification and quantification of the main sources of PM10 and PM2.5 by source apportionment models.
Developing, testing and proposing specific and non specific measures to reduce PMx in South-Europe urban ambient air, in order to meet Air Quality standards and to approach WHO guidelines.
THE AIRUSE PROJECT AIMS

Florence – PMF Source Apportionment

BIOMASS BURNING: comparison among different sites
g/m3 ATHENS BARCELONA FLORENCE MILAN PORTO
PM10 PM2.5 PM10 PM2.5 PM10 PM2.5 PM10 PM2.5 PM10 PM2.5
Biomass burn. 1.4 1.2 - - 3.0 2.9 7.8 5.3 4.3 4.3
BB contributions reproduced the
gradients found for Levoglucosan
among the AIRUSE cities (with Levo
about 4/8% of BB)
- not found in Barcelona
- OC/EC: ~3 at Athens and Porto, ~6 at Florence and Milan (more secondary)
- tracers of waste comb. in Athens

• Fe at all sites• Ca in BCN• EC in POR, MLN and FI• S in ATH
OC/EC:• <1 at POR-TR• 1.8-3.7 at UB sites• 16 at ATH-SUB (low diesel)
TRAFFIC: comparison among different sites
g/m3 ATHENS BARCELONA FLORENCE MILAN PORTO
PM10 PM2.5 PM10 PM2.5 PM10 PM2.5 PM10 PM2.5 PM10 PM2.5
Vehicle exhaust 2.1 1.7 3.3 3.0 2.5 2.5 2.8 1.8 8.0 8.0
Vehicle non-ex. 1.8 0.6 2.6 0.2 1.9 0.3 3.4 2.6 2.9 1.3

NASA/MODIS
35.5°N, 12.6°E
Isola di Lampedusa
Studio della frequenza e
dell'origine degli eventi di trasporto
delle polveri sahariane
Relazione tra produttivita' marina primaria e marker
biogenici nell'aerosol nel Mediterraneo
Meridionale
Valutazione dell'impatto sulla qualita' dell'aria delle emissioni da traffico navale nel Canale di Sicilia

Identificazione Aree Sorgenti Saharan Dust da Back-Trajectory

Identificazione Aree Sorgenti Saharan Dust da Geochimica

Chl-a map calculated by L-Dorma algorithm.
Antoine D & Morel A, 1996,. Global Biogeochemical Cycles 10, 43-55.
Relationship between aerosol markers and
phytoplanktonic activity – Mediterranean Basin

21
Clorofilla-a
Irraggiamento Solare
Produttivita' Primaria
Indice di Produttivita'Primaria Specifica PB
MSA(Acido Metansolfonico)
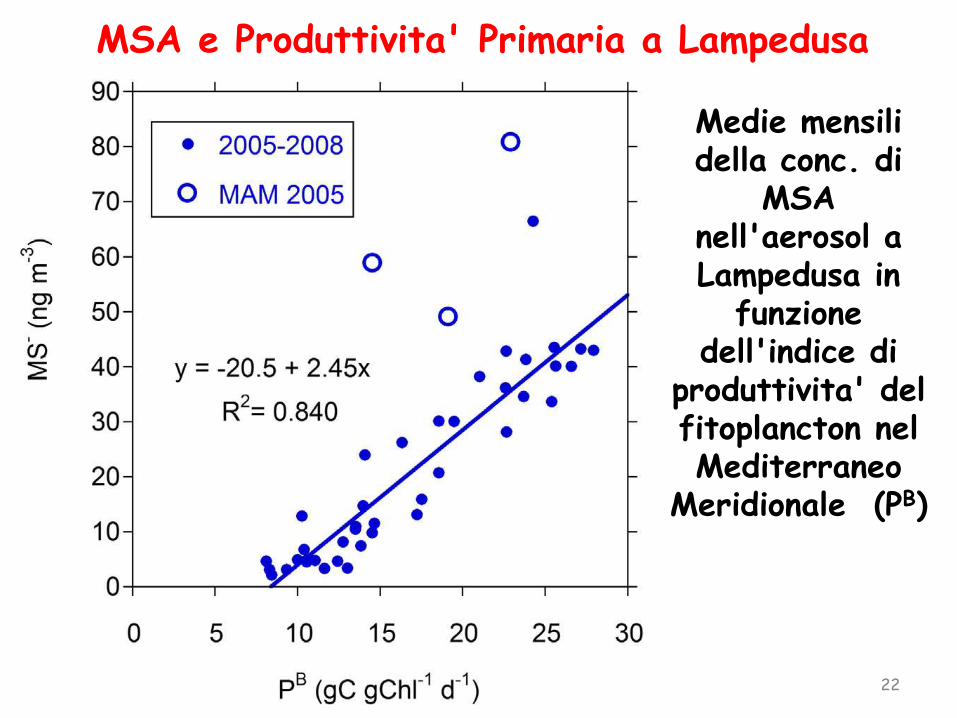
Lampedusa: MSA vs. PB
22
Medie mensilidella conc. di
MSA nell'aerosol a Lampedusa in
funzionedell'indice di
produttivita' del fitoplancton nelMediterraneo
Meridionale (PB)
MSA e Produttivita' Primaria a Lampedusa

Assessment of the Large scale Impact of Ship Emissions
on the aerosol burden over Mediterranean Sea
Acronym: LIFE-ALISEOSSector: Environment and HealthProject duration: 3 yearsCode number: LIFE15 ENV/IT/000329
LIFE Environment and Resource Efficiency - Call 2015
BENEFICIARIES
Coordinating beneficiary: Università degli Studi di Firenze - Dipartimento di Chimica
Associated beneficiary: Agencia Estatal Consejo Superior de Investigacione Scientificas (CSIC), Spagna.ENEA - Dipartimento sostenibilità dei sistemi produttivi e territoriali. INFN -Istituto Nazionale di Fisica Nucleare.NOA - National Observatory of Athens, GreciaL-Universita' ta' Malta.

Gozo
Lampedusa
NavarinoFinokalia
Barcellona
LIFE – ALISEOS Project Goal
To assess the contribution of ship emissions to the aerosol budget over the Mediterranean Sea in order to address European authorities toward efficient and cost effective policies for atmospheric particulate management.

Mediterranean Sea measurements (Lampedusa Island):
Average % nssSO42- from ship : 32.5%
Max value: 7.2 g/m3 (66.3% of total nssSO42-- 32.4% of PM10 mass)
Ship emission characterization
Ship emissions
Ce
La V
Ni
VTernary
Plot
Becagli et al., Atm.Chem.Phys., 2012, 12, 3479-3492
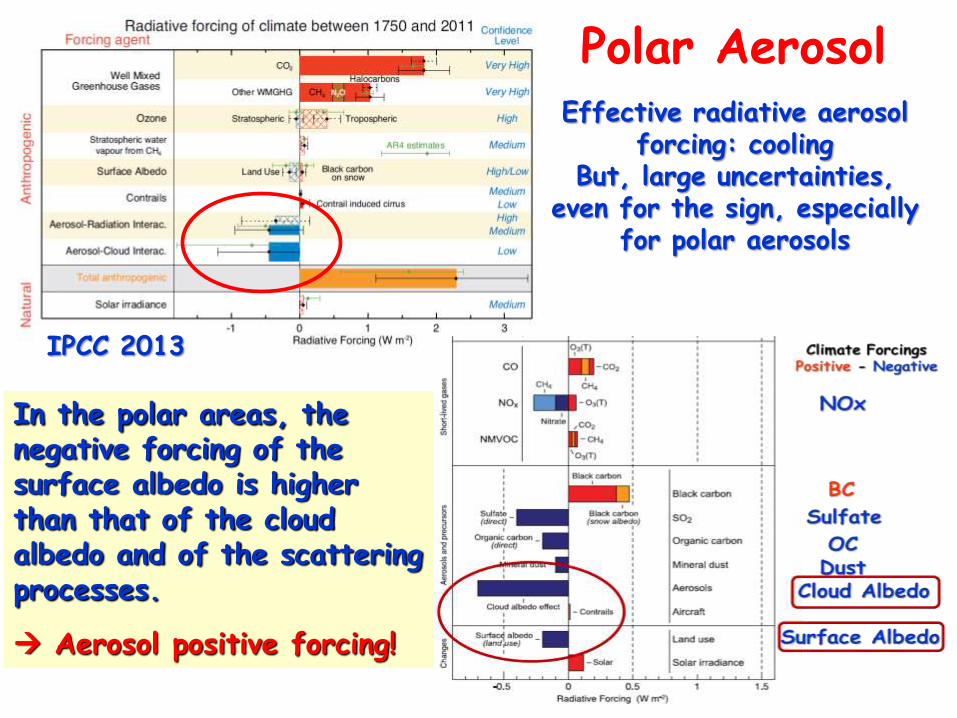
IPCC 2013
Effective radiative aerosol forcing: cooling
But, large uncertainties, even for the sign, especially
for polar aerosols
In the polar areas, the negative forcing of the surface albedo is higher than that of the cloud albedo and of the scattering processes.
Aerosol positive forcing!
Polar Aerosol
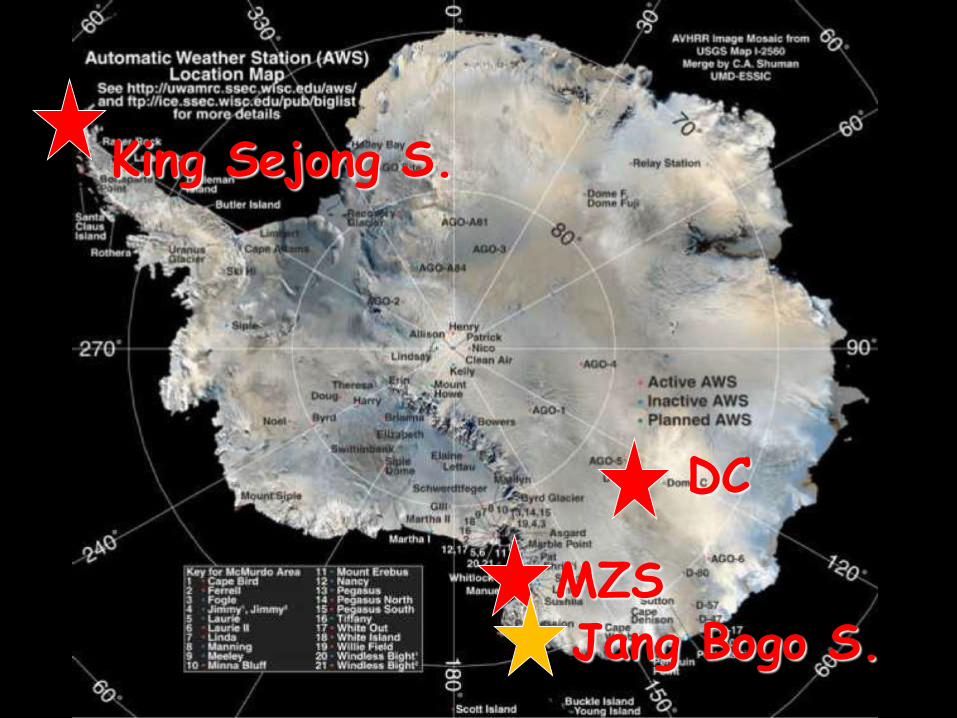
DC
MZS
King Sejong S.
Jang Bogo S.

Ny AlesundSvalbardIslands
Thule
RussianCapBarànovaStationSevernayaZemlya Is.

Ny Ålesund
78°56′ N - 11°56′ E
Spitsbergen
Svalbard (Norway)
Gruvebadet Observatory
800 m from Ny Alesundabout 50 m a.s.l.

Baloon measurementsup to 1000 m altitude
Airship shapeabout 15 kg payload
2011-2015 Campaigns
Meteo ProbesOPC measurementsNano-Particle Count.NephelometerAerosol samplingOzoneBlack CarbonVideo-CameraData Trasm. (156MHz)
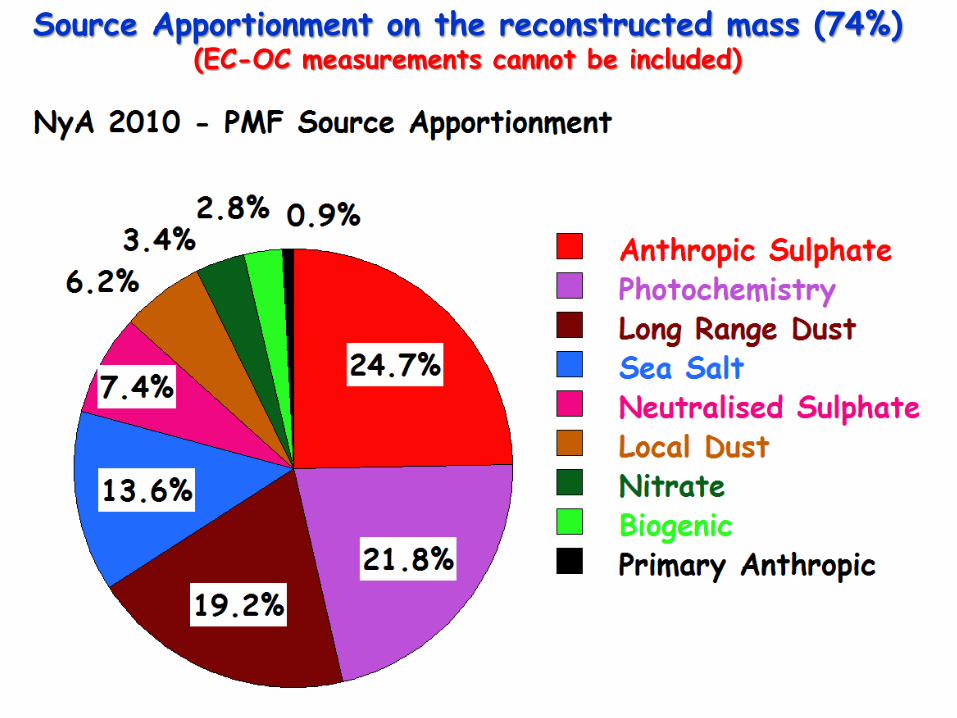
Source Apportionment on the reconstructed mass (74%)(EC-OC measurements cannot be included)

Evaluation of the sulfate source fractionsDC - Antarctica
Biogenic SO42-/MSA ratio
ssSO42-
from ssNa+
Crust-SO42-
from nssCa2+
bio-SO42-
Ny Alesund
Biogenic SO42-/MSA ratio
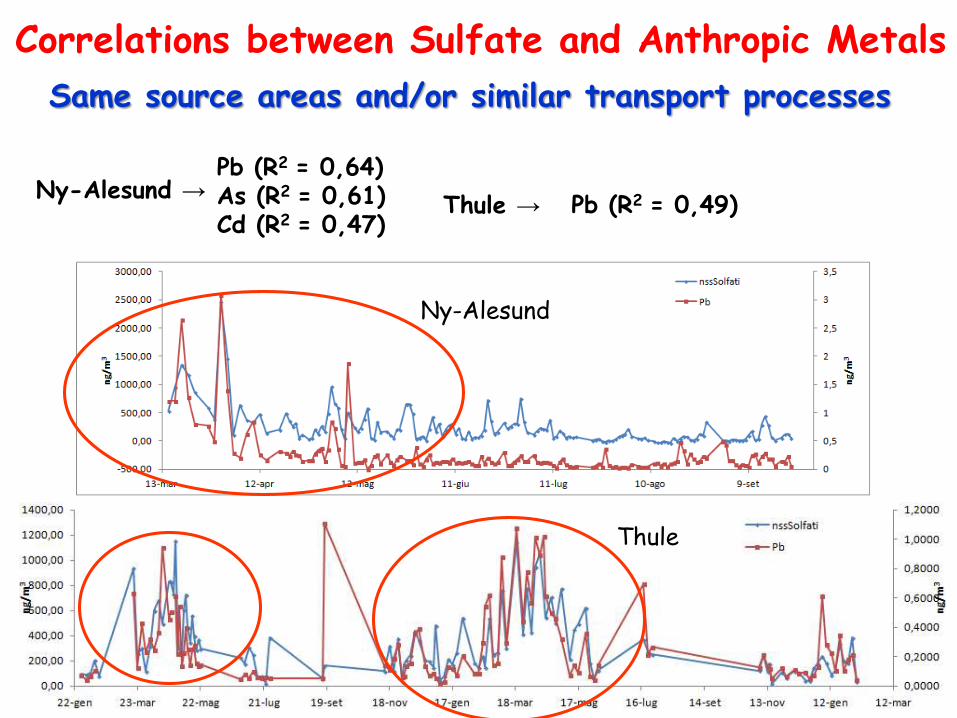
Correlations between Sulfate and Anthropic Metals
Ny-Alesund →Pb (R2 = 0,64)As (R2 = 0,61)Cd (R2 = 0,47)
Thule → Pb (R2 = 0,49)
Ny-Alesund
Thule
Same source areas and/or similar transport processes
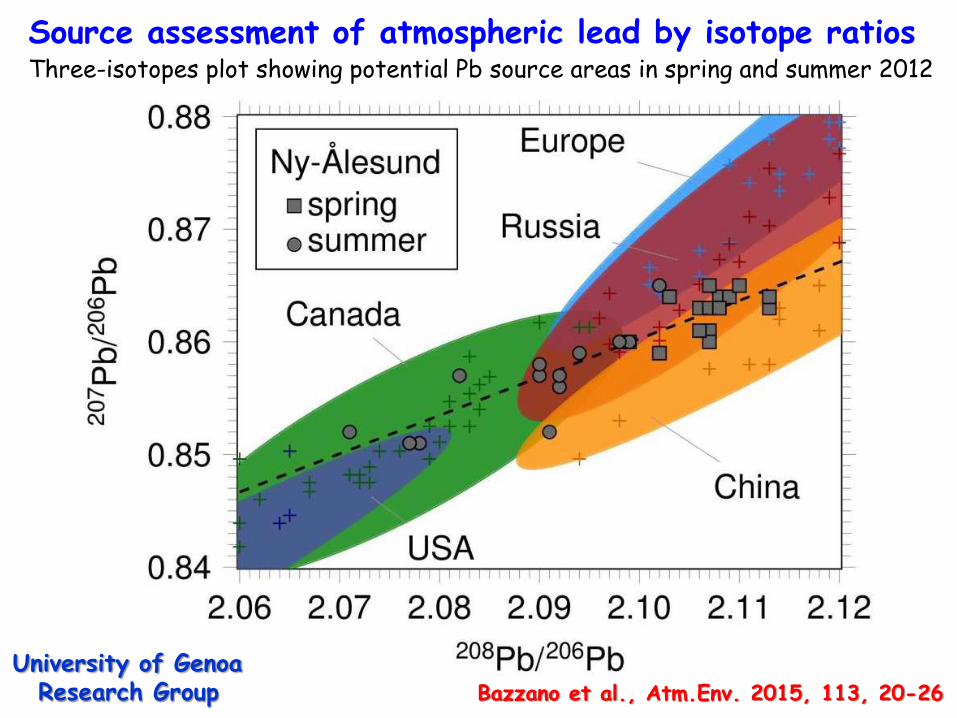
Source assessment of atmospheric lead by isotope ratiosThree-isotopes plot showing potential Pb source areas in spring and summer 2012
University of GenoaResearch Group Bazzano et al., Atm.Env. 2015, 113, 20-26
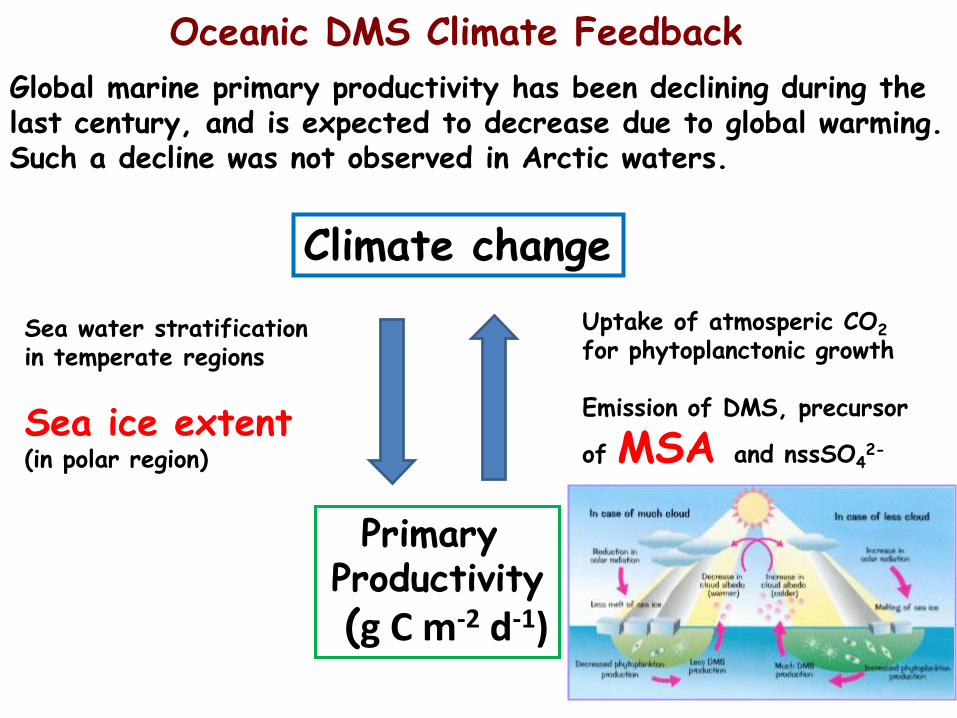
PrimaryProductivity(g C m-2 d-1)
Climate change
Uptake of atmosperic CO2
for phytoplanctonic growth
Emission of DMS, precursor
of MSA and nssSO42-
Sea water stratificationin temperate regions
Sea ice extent(in polar region)
Global marine primary productivity has been declining during the last century, and is expected to decrease due to global warming. Such a decline was not observed in Arctic waters.
Oceanic DMS Climate Feedback
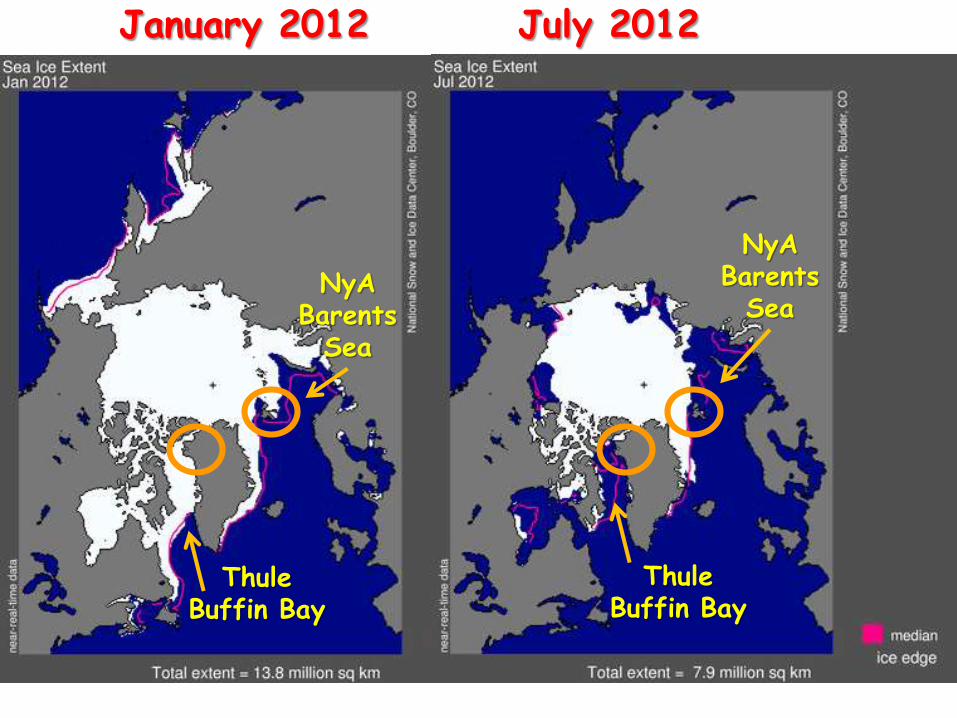
January 2012 July 2012
ThuleBuffin Bay
NyABarents
Sea
ThuleBuffin Bay
NyABarents
Sea
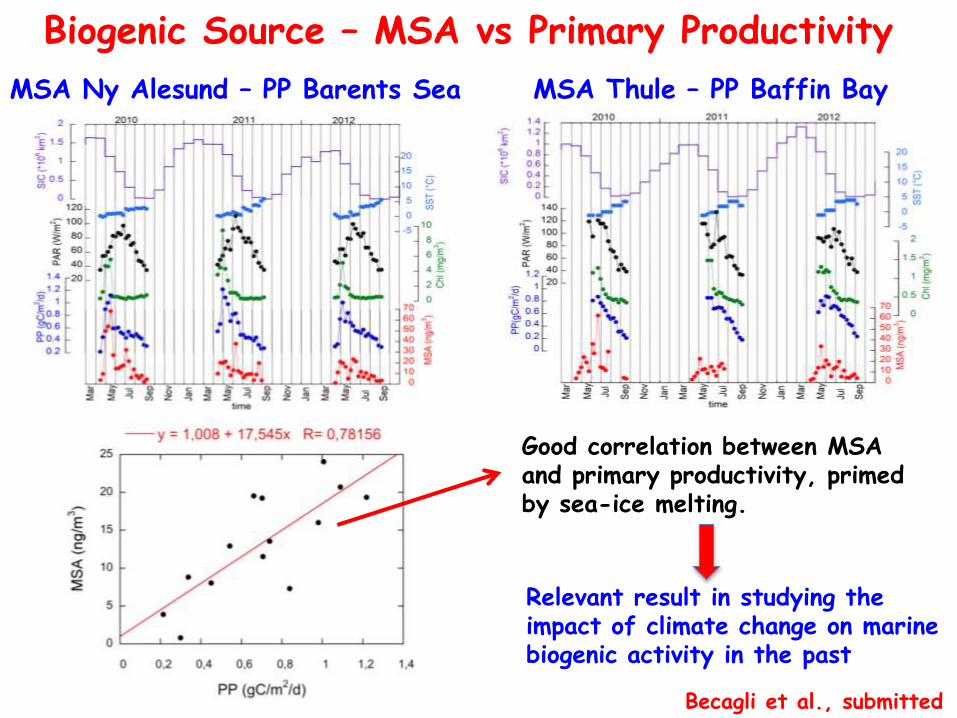
Becagli et al., submitted
Good correlation between MSA and primary productivity, primed by sea-ice melting.
Relevant result in studying the impact of climate change on marine biogenic activity in the past
Biogenic Source – MSA vs Primary Productivity
MSA Thule – PP Baffin BayMSA Ny Alesund – PP Barents Sea

Arctic sea ice extent in Sept. 2012(3.6 Mkm2)
Magenta line indicates mean sea ice extent
for 1979-2011.
Sept. 2012 represents a 49%
decline.
Future trans-Arctic shipping

Longitudinal and Latitudinal transects
from Tromsø to Svalbard Islands
during theAREX 2011 Cruise
Polish ShipOceania
Collaboration withInstitute of Oceanology of the Polish Academy of Sciences

0
5
10
15
20
25
30
35
40
45
50
55
60
65
S1 S2 S3 S4 S5 S6 S7 S8 S9 S11 S12 S14 S15 S16 S17 S19 S20 S21 S22 S23 S24
pg
/m
3
DBghiP
I123cdP
DBahA
BaP
BeP
BkF
BbjF
CHR
CPcdP
BaA
PYR
FLNT
ANT
PHE
FLN
ACT
ACTY
NAPH
S18 PAH species = 18.1 ± 14.0 pg/m3
PAH species and spatial distribution
Longyearbyen
M.G. Perrone – University of Milano-Bicocca

Percentage contribution of PAH species
0%
5%
10%
15%
20%
25%
30%
IPA
/S-1
8IP
A
PAH pattern
Phenanthrene, Fluoranthene and Pyreneconstitute 58% of the PAHs sum
Phenanthrene: Heavy Fuel Oil Fluoranthene: Coal Power Plants
Pyrene: CombustionProcesses
M.G. Perrone – University of Milano-Bicocca