GESTIONE DEI GAS MEDICINALI E DEI GAS DISPOSITIVI MEDICI ...
M. Bruno, F. Cannata, M. D’Agostino, E. Geraci, P. Marini, J. De Sanctis, G. Vannini
NUCL-EX Collaboration:INFN e Universita’ Bologna, Firenze, Milano, Napoli,
TriesteINFN – Laboratori Nazionali di Legnaro
LPC e GANIL – Caen (Francia)IPN – Orsay (Francia)
Evidenze sperimentali di transizione di fase Evidenze sperimentali di transizione di fase liquidoliquido--gas nei nucleigas nei nuclei
Universita’ Bologna INFN-Bologna

SchemaSchema
Che osservabili prevede la teoria nelletransizioni di faseCosa si misura e come Come si analizzano i dati: osservabili, sortingConfronto fra dati e teoriaCosa ancora si deve misurare
Non necessariamente in questo ordine !!!
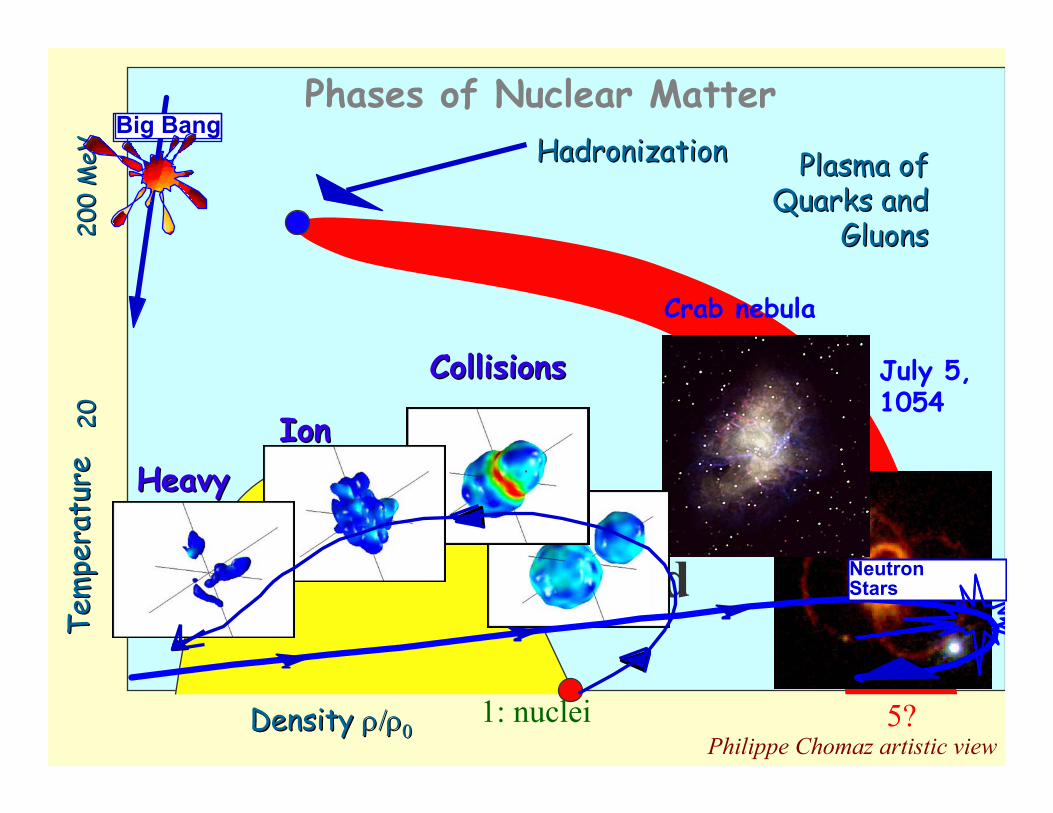
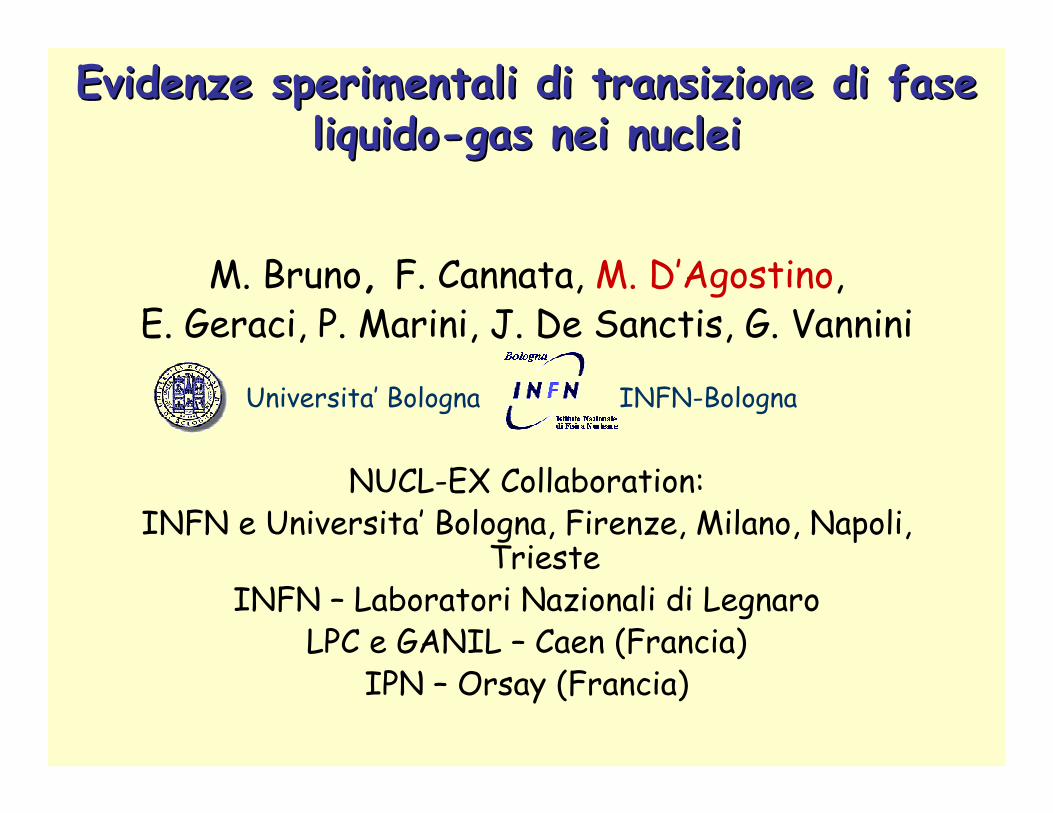
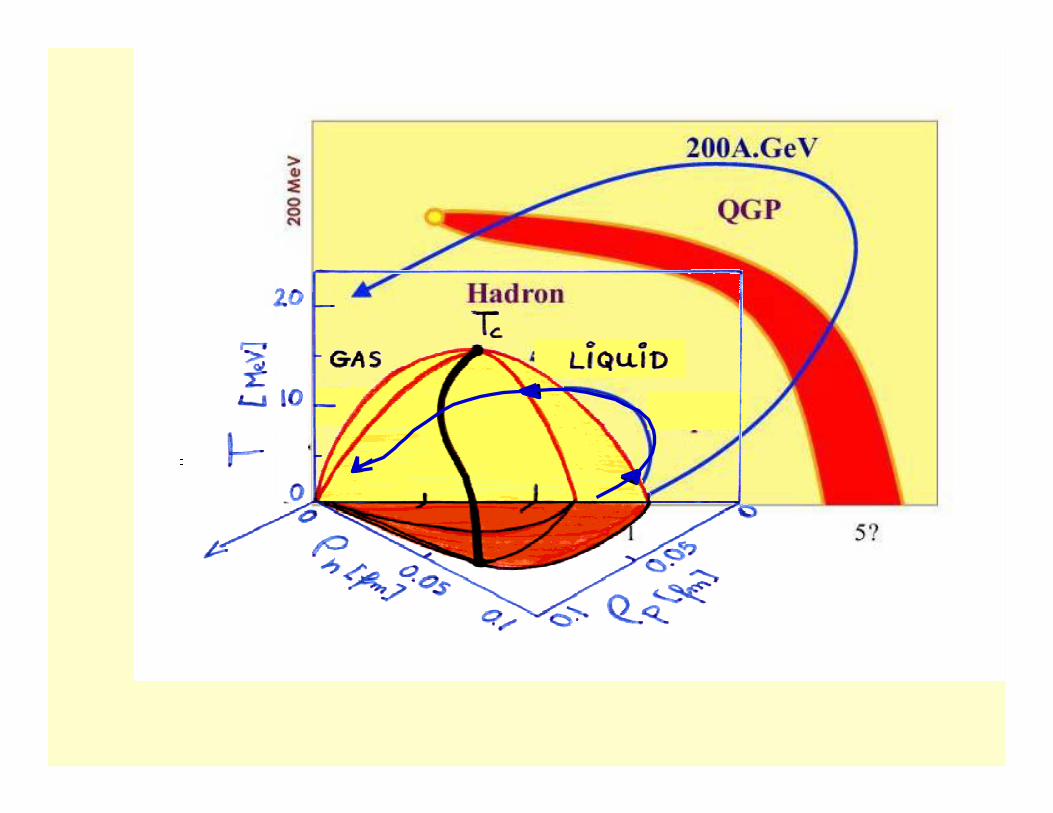
GasLiquid
Density Density ρ/ρρ/ρ00
Tem
pera
ture
Te
mpe
ratu
re
202020
0 M
eV20
0 M
eV Plasma of Plasma of Quarks and Quarks and
Gluons Gluons
Crab nebula
July 5, 1054
CollisionsCollisions
HeavyHeavyIonIon
1: nuclei 5?
Phases of Nuclear Matter
Philippe Chomaz artistic view
Big Bang HadronizationHadronization
Neutron Stars
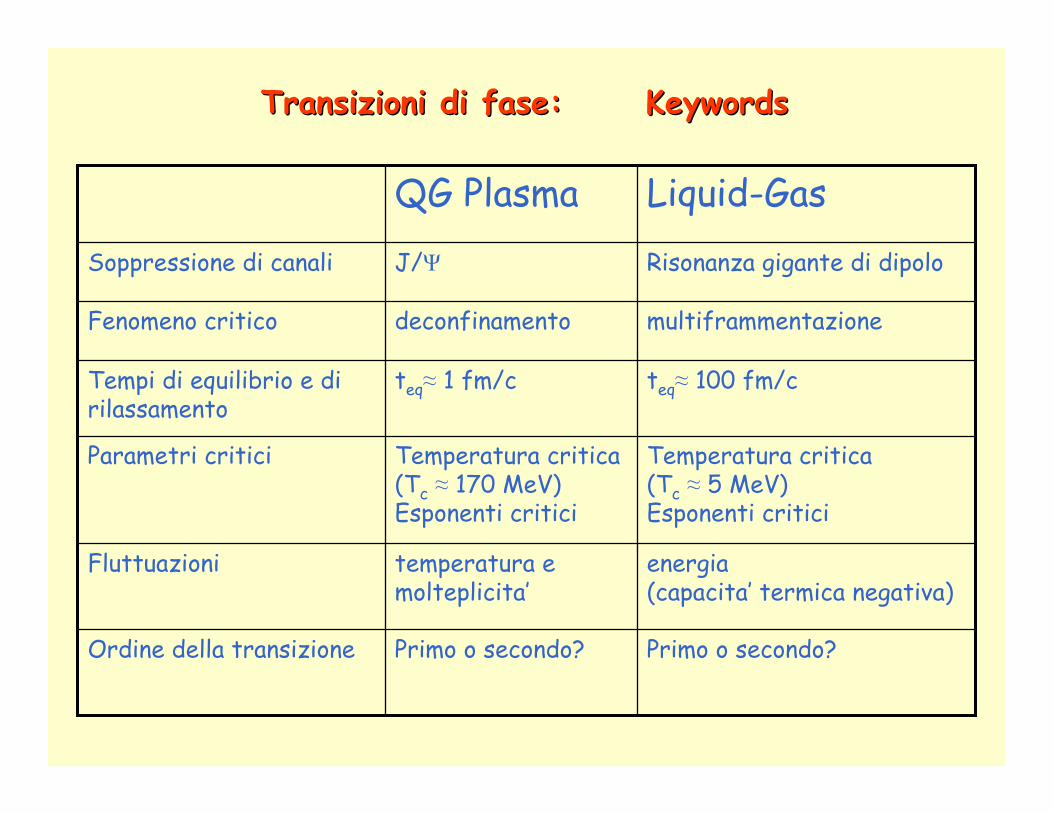
TransizioniTransizioni di di fase: Keywordsfase: Keywords
energia(capacita’ termica negativa)
temperatura e molteplicita’
Fluttuazioni
Primo o secondo?Primo o secondo?Ordine della transizione
Temperatura critica(Tc ≈ 5 MeV)Esponenti critici
Temperatura critica(Tc ≈ 170 MeV)Esponenti critici
Parametri critici
teq≈ 100 fm/cteq≈ 1 fm/cTempi di equilibrio e di rilassamento
multiframmentazionedeconfinamentoFenomeno critico
Risonanza gigante di dipoloJ/ΨSoppressione di canali
Liquid-GasQG Plasma

H.Jaqaman et al. PRC27(1983)2782
ForzeForze nuclearinucleari::
repulsive a piccole distanzeattrattive a grandi distanze
Simili a forze di Van der Waals
Calore (Calorie per grammo)
Tem
pera
tura
(Gra
di)

Aladin PRL1995
R. Wada et al., PRC 39, 497 (1989)
EquazioneEquazione di di statostato delladella materiamateria nuclearenucleare
Sono possibilitransizioni di fase?Il nucleo a basseenergie di eccitazionesi comporta come unliquido (formula dimassa di Weizsäcker)ad alta energie di eccitazione come un gas (modello a gasdi Fermi)
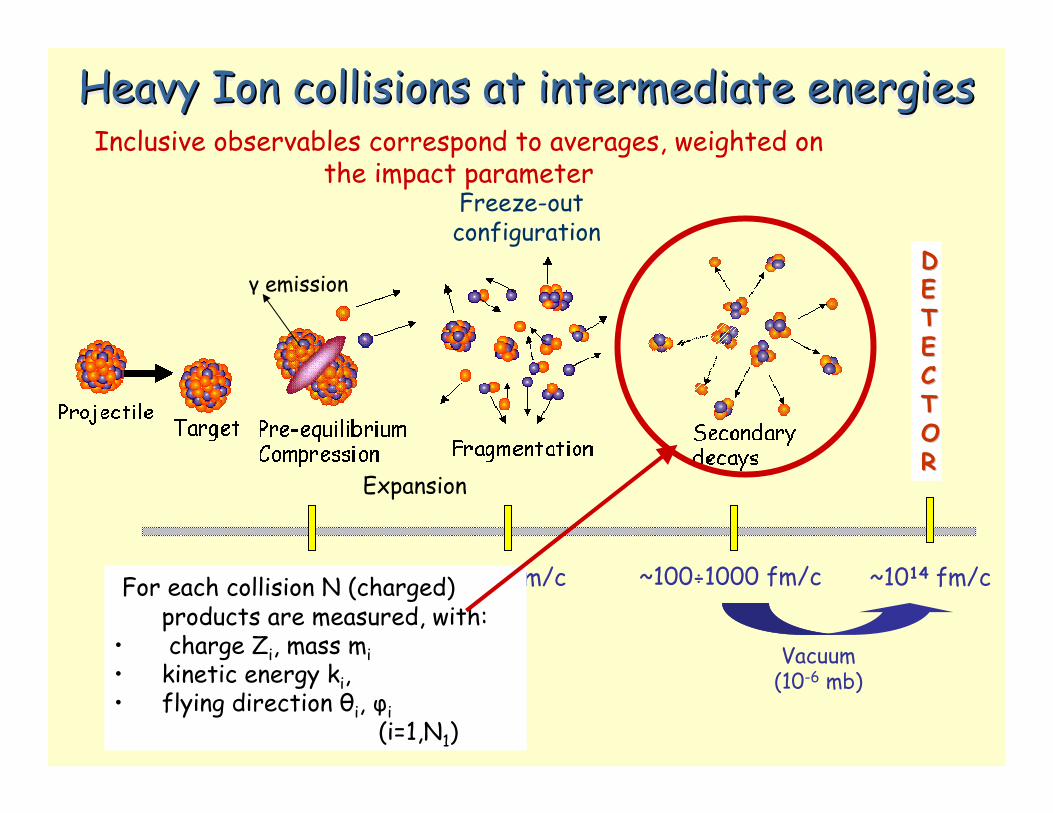
Heavy Ion collisions at intermediate energiesHeavy Ion collisions at intermediate energiesHeavy Ion collisions at intermediate energies
~100 fm/c
DDEETTEECCTTOORR
~20 fm/c(10-22 sec)
~100÷1000 fm/c ~1014 fm/c
Vacuum (10-6 mb)
Expansion
γ emission
Freeze-outconfiguration
For each collision N (charged) products are measured, with:
• charge Zi, mass mi• kinetic energy ki,• flying direction θi, φi
(i=1,N1)
Inclusive observables correspond to averages, weighted on the impact parameter

H.I. Collisions , intermediate energies (10-100 AMeV): 1-st generation 4π devices
•The decaying system can be identified and its calorimetric excitation energy can be estimated from the energy balance:
( )nnni
M
ii kmMkmmE +++=+ ∑
=
)(*1
0
•Zi, ki, θi, φi are measured for almost all charged products, event by event, with high energy resolution (few %) and low energy thresholds (gas detectors)
•Statistical multidimensional analyses performed on global (event) observables allow to sort the events in classes of centrality.
•Fragments and particles are detected at ~1014 fm/c, as they were at 103 fm/c, since the propagation in vacuum does not allow further interactions with matter.
•mi are measured only for light products•neutrons and γ are quite often not measured

How many detection cells are needed?How many detection cells are needed?
N = expected multiplicity, X = number of detectorsε = geometrical coverage/4π = probability to detect
1 particle ε(1)
•P(double)=(N-1)/(2X)
A reasonable compromise is P(double)~few%
P(double) = 1% X=250 for N=50,X=2500 for N=500
. . . . . . etc.
•ε (N) = ε(1)N

Chimera detector@LNS (CT) (~103 detection cells)Incident energies up to 50 A.MeV

Alice detector@CERN (CH) Incident energies up to 500 A.GeV
157 000 cells, 150 m2 for TOF

Structure of the measured quantities
1. N1 (Zi, mi, ki, θi, φi , i=1,N1)2. N2 (Zi, mi, ki, θi, φi , i=1,N2)3. N3 (Zi, mi, ki, θi, φi , i=1,N3)4. N4 (Zi, mi, ki, θi, φi , i=1,N4)5. N5 (Zi, mi, ki, θi, φi , i=1,N5)
. . . . . . . X NX (Zi, mi, ki, θi, φi , i=1,NX)
X = about 108
(some GigaBytes-> some TeraBytes after analysis)
event Primary quantities:
Each event = N (charged) products,
• charge Zi, mass mi• kinetic energy ki,• flying direction θi, φi
(i=1,N1)
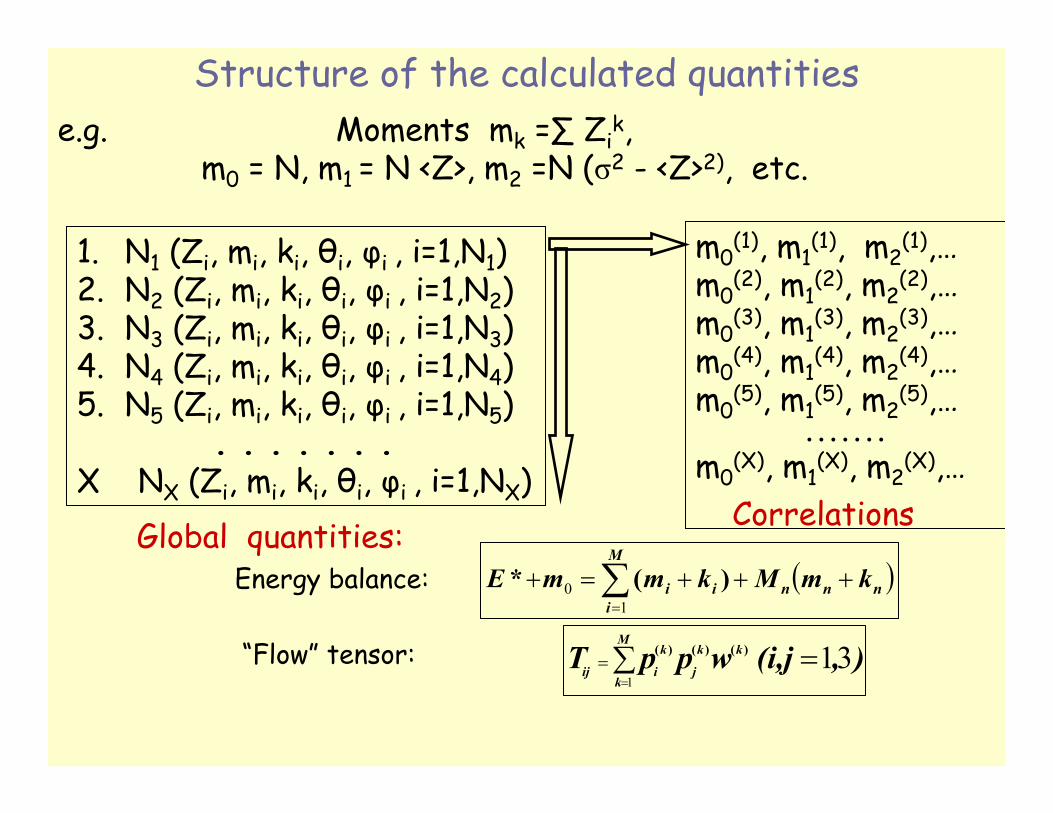
Structure of the calculated quantities
Energy balance: ( )nnni
M
ii kmMkmmE +++=+ ∑
=
)(*1
0
1. N1 (Zi, mi, ki, θi, φi , i=1,N1)2. N2 (Zi, mi, ki, θi, φi , i=1,N2)3. N3 (Zi, mi, ki, θi, φi , i=1,N3)4. N4 (Zi, mi, ki, θi, φi , i=1,N4)5. N5 (Zi, mi, ki, θi, φi , i=1,N5)
. . . . . . . X NX (Zi, mi, ki, θi, φi , i=1,NX)
),(i,j wppT kM
k
k
j
k
iij 311
=∑=
= )()()(
Global quantities:
e.g. Moments mk =∑ Zik,
m0 = N, m1 = N <Z>, m2 =N (σ2 - <Z>2), etc.
m0(1), m1
(1), m2(1),…
m0(2), m1
(2), m2(2),…
m0(3), m1
(3), m2(3),…
m0(4), m1
(4), m2(4),…
m0(5), m1
(5), m2(5),…
. . . . . . .m0
(X), m1(X), m2
(X),…
“Flow” tensor:
Correlations
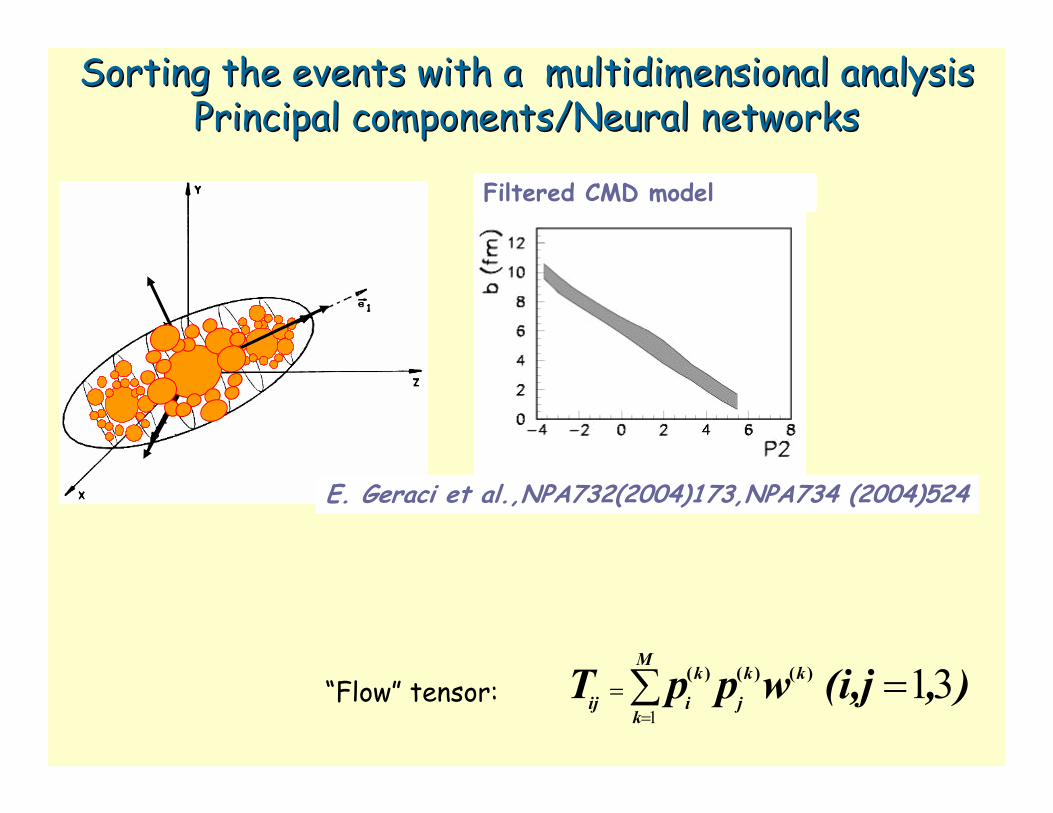
Sorting the events with a multidimensional analysisSorting the events with a multidimensional analysisPrincipal components/Neural networksPrincipal components/Neural networks
),(i,j wppT kM
k
k
j
k
iij 311
=∑=
= )()()(
Filtered CMD model
E. Geraci et al.,NPA732(2004)173,NPA734 (2004)524
“Flow” tensor:
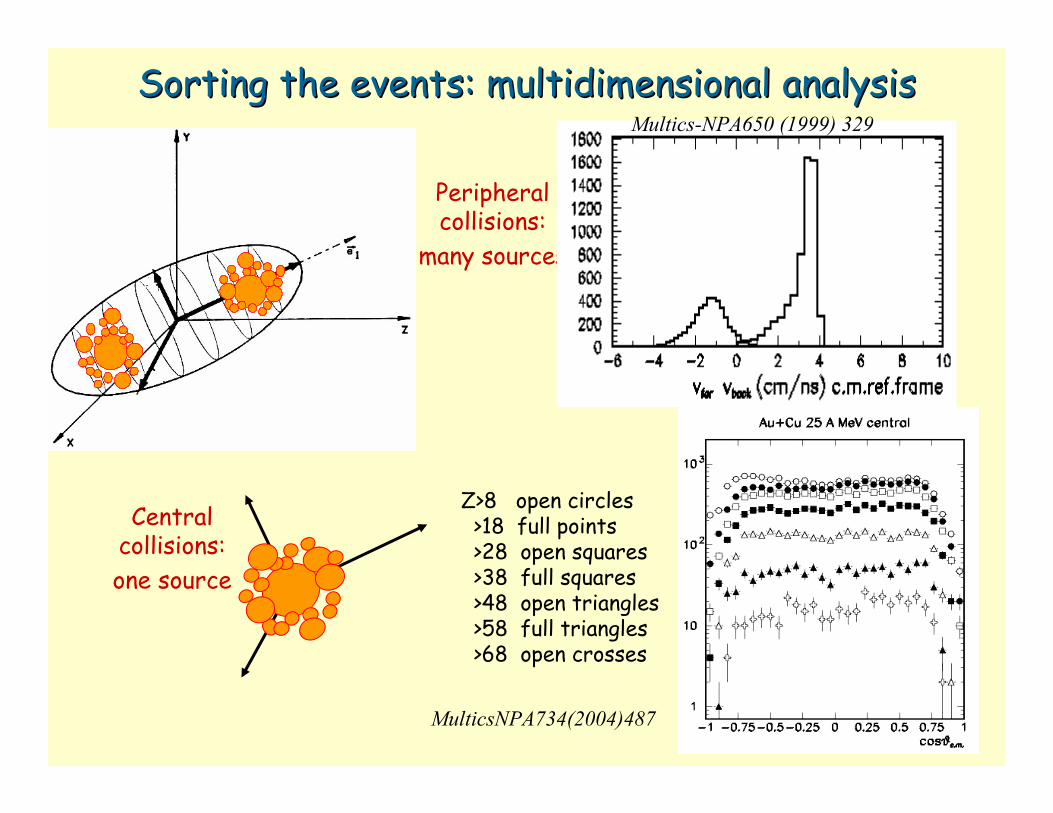
Sorting the events: multidimensional analysisSorting the events: multidimensional analysis
Central collisions: one source
Peripheral collisions:
many sources
Multics-NPA650 (1999) 329
Z>8 open circles>18 full points>28 open squares>38 full squares>48 open triangles>58 full triangles>68 open crosses
MulticsNPA734(2004)487
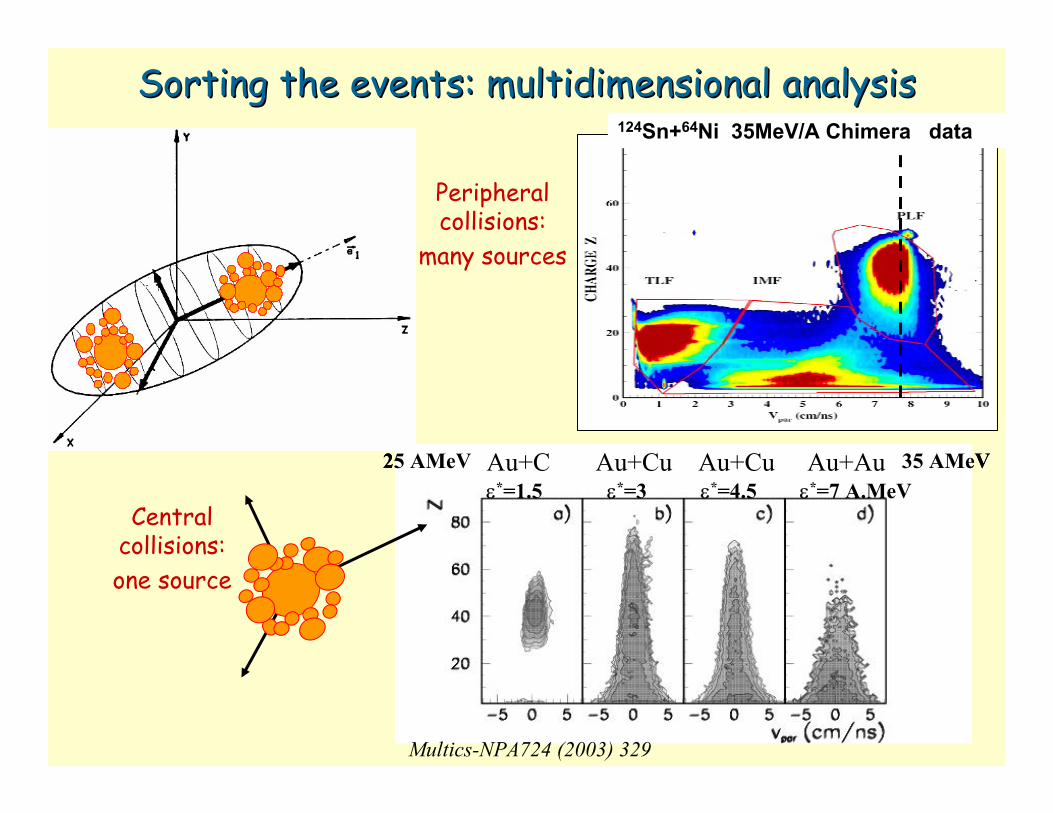
Au+C Au+Cu Au+Cu Au+Auε*=1.5 ε*=3 ε*=4.5 ε*=7 A.MeV
25 AMeV 35 AMeVAu+C Au+Cu Au+Cu Au+Auε*=1.5 ε*=3 ε*=4.5 ε*=7 A.MeVAu+C Au+Cu Au+Cu Au+Auε*=1.5 ε*=3 ε*=4.5 ε*=7 A.MeV
25 AMeV 35 AMeV
Multics-NPA724 (2003) 329
Sorting the events: multidimensional analysisSorting the events: multidimensional analysis
Central collisions: one source
Peripheral collisions:
many sources
124Sn+64Ni 35MeV/A Chimera data

DallaDalla previsioneprevisione del del fenomenofenomeno allaalla rivelazionerivelazione
Q
Theory
Experiment+device
asymptoticbacktrace the dataQ
<Q>,σ
Filter the theory (if event by event)*
* To be compared with data, Coulomb trajectories are needed. True for:• Statistical models• Classical Molecular DynamicsNot still true for: Lattice gas modelFalse for: percolation
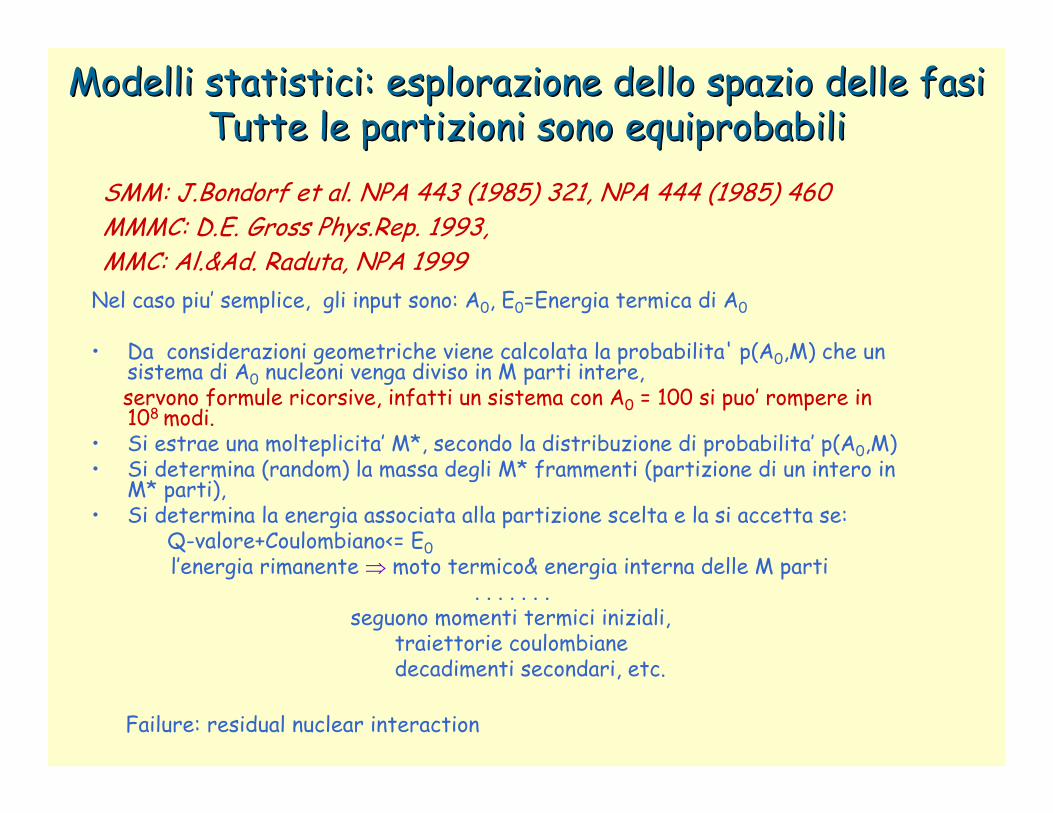
ModelliModelli statisticistatistici: : esplorazioneesplorazione dellodello spaziospazio delledelle fasifasiTutteTutte le le partizionipartizioni sonosono equiprobabiliequiprobabili
Nel caso piu’ semplice, gli input sono: A0, E0=Energia termica di A0
• Da considerazioni geometriche viene calcolata la probabilita' p(A0,M) che un sistema di A0 nucleoni venga diviso in M parti intere, servono formule ricorsive, infatti un sistema con A0 = 100 si puo’ rompere in 108 modi.
• Si estrae una molteplicita’ M*, secondo la distribuzione di probabilita’ p(A0,M)• Si determina (random) la massa degli M* frammenti (partizione di un intero in
M* parti),• Si determina la energia associata alla partizione scelta e la si accetta se:
Q-valore+Coulombiano<= E0 l’energia rimanente ⇒ moto termico& energia interna delle M parti
. . . . . . . seguono momenti termici iniziali,
traiettorie coulombianedecadimenti secondari, etc.
SMM: J.Bondorf et al. NPA 443 (1985) 321, NPA 444 (1985) 460MMMC: D.E. Gross Phys.Rep. 1993, MMC: Al.&Ad. Raduta, NPA 1999
Failure: residual nuclear interaction
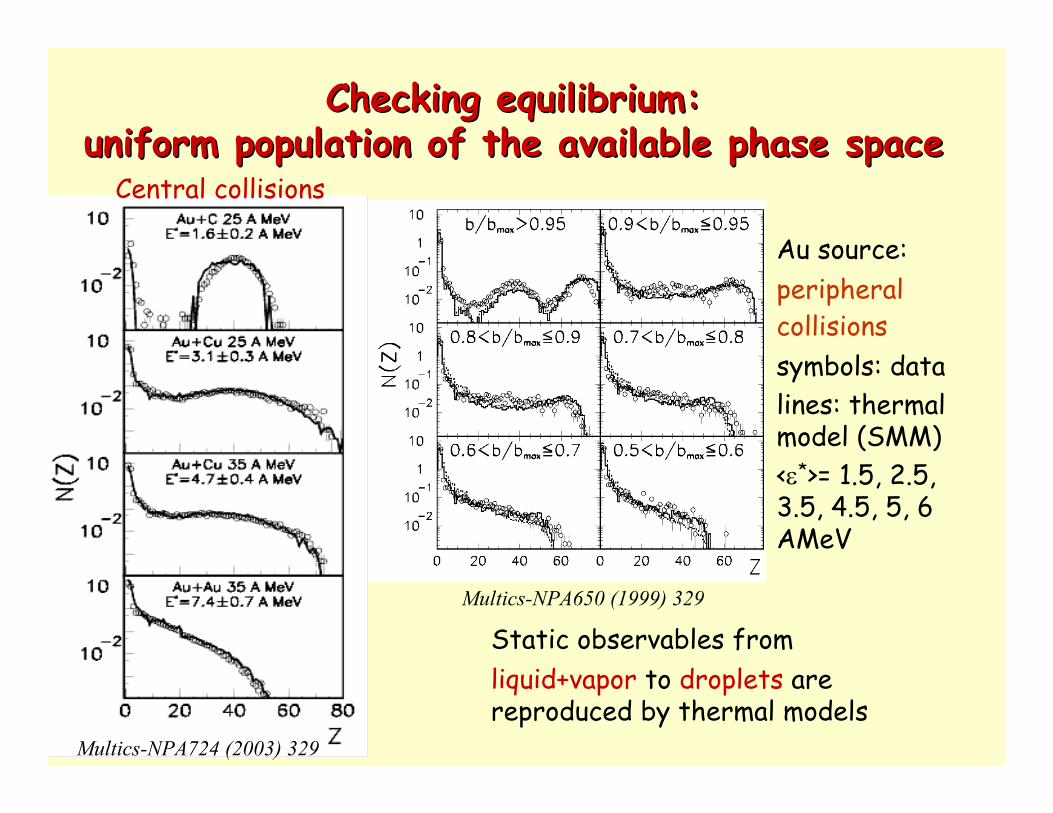
Checking equilibrium: Checking equilibrium: uniform population of the available phase spaceuniform population of the available phase space
Static observables from liquid+vapor to droplets arereproduced by thermal models
Multics-NPA650 (1999) 329
Au source: peripheral collisionssymbols: data lines: thermal model (SMM)<ε*>= 1.5, 2.5, 3.5, 4.5, 5, 6 AMeV
Multics-NPA724 (2003) 329
Central collisions

La variazione di energia libera quando si forma una goccia di liquido dimassa A da un gas di A+B nucleoni (A e B in equilibrio, cioe’ alla stessatemperatura e pressione) e’ data dalla differenza fra:Gcon goccia = µℓA + μgB + 4π R2 σ(T) + T τ lnAGno goccia = μg(A+B), dove4π R2 σ = tensione superficiale della goccia,T τ lnA = termine che tiene conto che la goccia e’ finita e la sua superficie e’ chiusaFisher inoltre scrive il termine di superficie 4π R2 σ(T) = 4π r0
2 A2/3 σ(T)come as (Tc-T)Aσ con σ esponente che descrive il rapportosuperficie/volume della goccia e tiene conto del fatto che al punto criticoliquido e vapore sono indistinguibili.
si puo’ anche includere δC = variazione della energia di Coulomb,(J.Lopez and C.Dorso,World Scientific -2000)
Transizioni di fase: modello di FisherTransizioni di fase: modello di Fisher(M. E. Fisher, Rep. Prog. Phys. 30 (1967) 615)

Transizioni di fase: modello di FisherTransizioni di fase: modello di Fisher
La probabilita’ (insieme gran canonico) di formazione di unagoccia di massa A, a partire da un gas di A+B nucleoni e’:
Alla coesistenza µg = µℓ
Al punto critico µg = µℓ
as(T-Tc)=0
⇒ P(A) = Y0 A-τ
−
−=
=
∆−=
−
TT)A-(T aA
Tµµ
expA Y
TGexp YP(A)
csgτ0
0
σl
M. E. Fisher, Rep. Prog. Phys. 30 (1967) 615
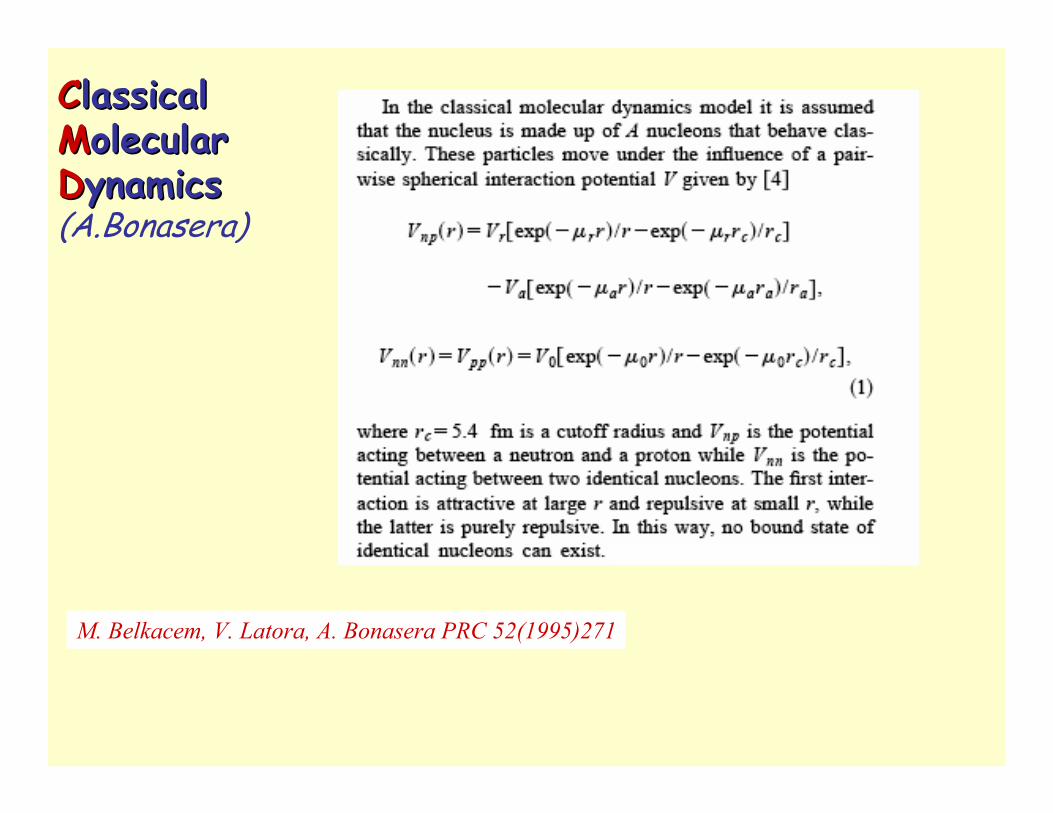
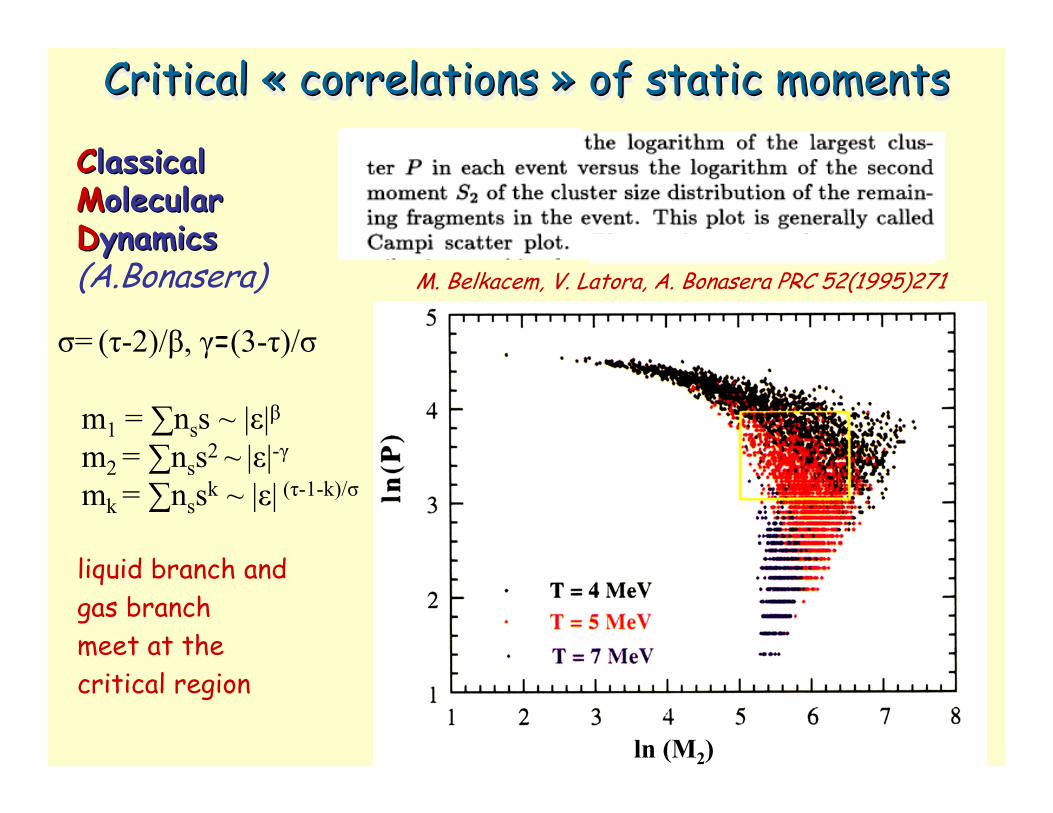
CClassical lassical MMolecular olecular DDynamicsynamics(A.Bonasera)
M. Belkacem, V. Latora, A. Bonasera PRC 52(1995)271

M. Belkacem, V. Latora, A. Bonasera PRC 52(1995)271
CClassical lassical MMolecular olecular DDynamicsynamics(A.Bonasera)
−
−=
=
∆−=
−
TT)A-(T aA
Tµµ
expA Y
TGexp YP(A)
csgτ0
0
σl
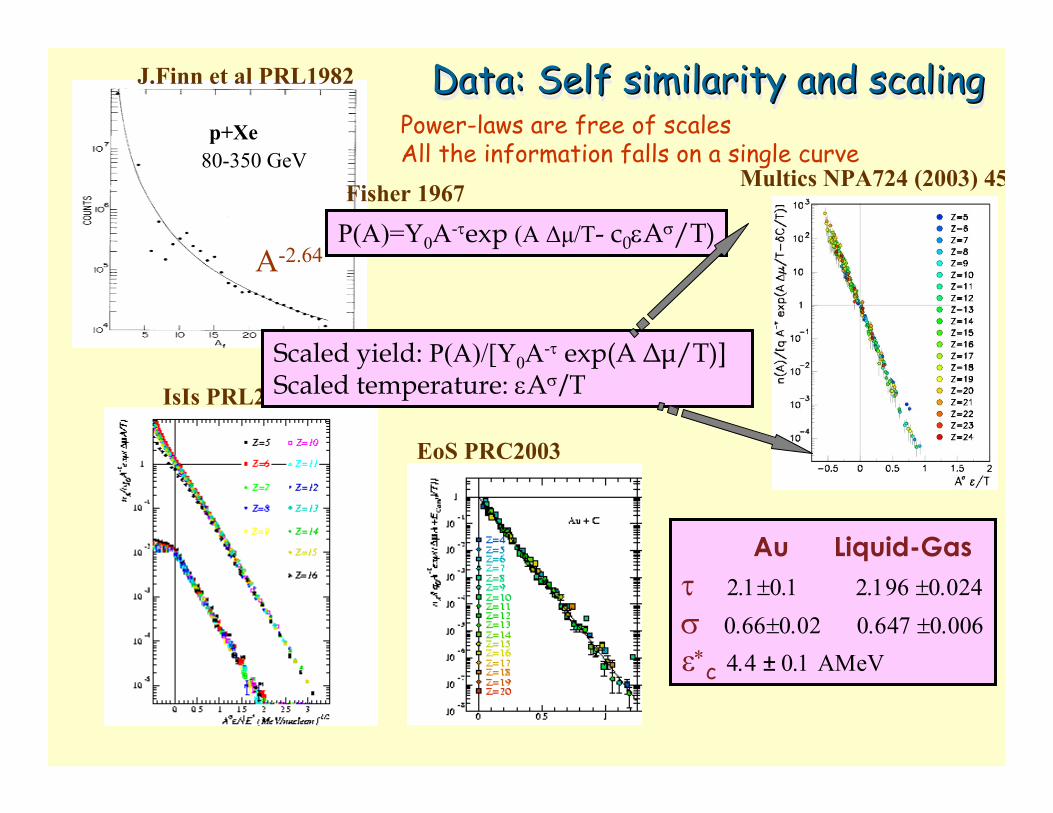
Au Liquid-Gasτ 2.1±0.1 2.196 ±0.024
σ 0.66±0.02 0.647 ±0.006
ε∗c 4.4 ± 0.1 ΑΜeV
IsIs PRL2002
EoS PRC2003
J.Finn et al PRL1982
p+Xe80-350 GeV
A-2.64
Multics NPA724 (2003) 45
Data: Self similarity and scalingData: Self similarity and scalingData: Self similarity and scalingPower-laws are free of scalesAll the information falls on a single curve
Scaled yield: P(A)/[Y0A-τ exp(A ∆µ/T)]Scaled temperature: εAσ/T
P(A)=Y0A-τexp (A ∆µ/T- c0εAσ/T)Fisher 1967
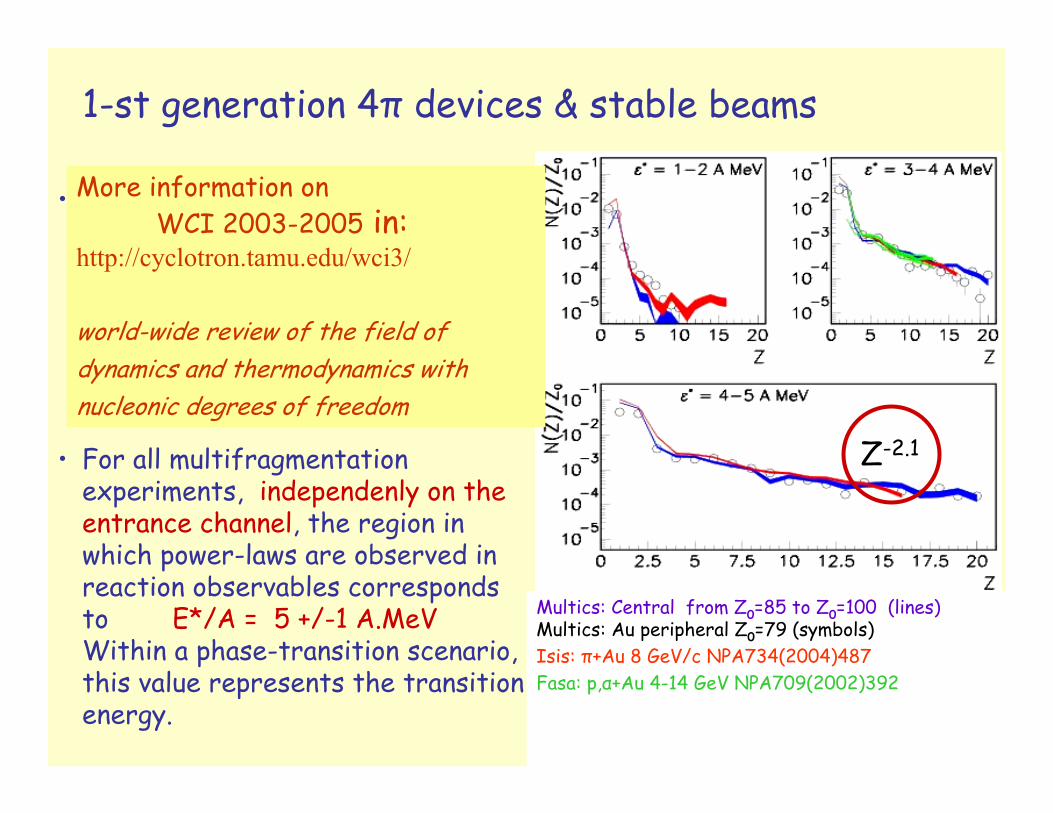
Multics: Central from Z0=85 to Z0=100 (lines)Multics: Au peripheral Z0=79 (symbols)Isis: π+Au 8 GeV/c NPA734(2004)487Fasa: p,α+Au 4-14 GeV NPA709(2002)392
1-st generation 4π devices & stable beams
• For all multifragmentation experiments, independenly on the entrance channel, the region in which power-laws are observed in reaction observables corresponds to E*/A = 5 +/-1 A.MeVWithin a phase-transition scenario, this value represents the transition energy.
• The current state of nuclear calorimetry permits determination of the E*/A of the fragmenting source to an accuracy of about 20%.Nearly all experiments can be made self-consistent within this range
Z-2.1
More information on WCI 2003-2005 in:
http://cyclotron.tamu.edu/wci3/
world-wide review of the field of dynamics and thermodynamics with nucleonic degrees of freedom
−
−=
=
∆−=
−
TT)A-(T aA
Tµµ
expA Y
TGexp YP(A)
csgτ0
0
σl
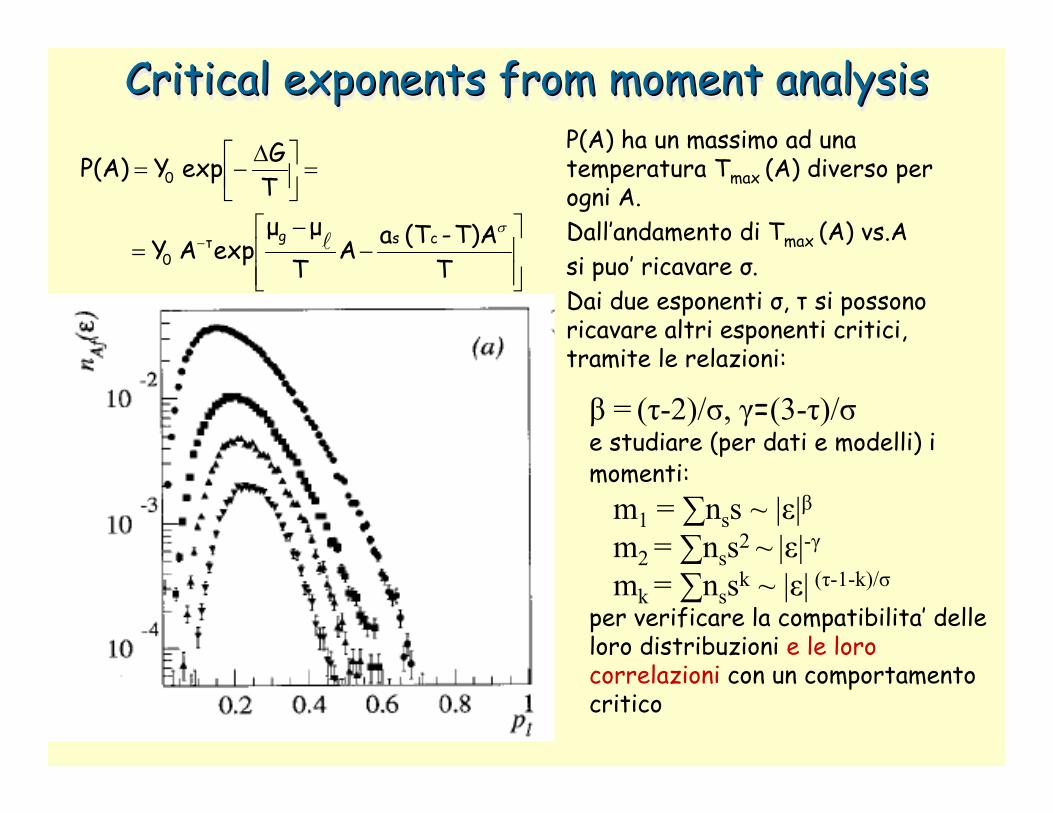
P(A) ha un massimo ad unatemperatura Tmax (A) diverso per ogni A.Dall’andamento di Tmax (A) vs.Asi puo’ ricavare σ.Dai due esponenti σ, τ si possonoricavare altri esponenti critici, tramite le relazioni:
β = (τ-2)/σ, γ=(3-τ)/σe studiare (per dati e modelli) i momenti:
m1 = ∑nss ~ |ε|βm2 = ∑nss2 ~ |ε|-γmk = ∑nssk ~ |ε| (τ-1-k)/σ
per verificare la compatibilita’ delleloro distribuzioni e le lorocorrelazioni con un comportamentocritico
Critical exponents from moment analysisCritical exponents from moment analysisCritical exponents from moment analysis
M. Belkacem, V. Latora, A. Bonasera PRC 52(1995)271
ln (M2)
CClassical lassical MMolecular olecular DDynamicsynamics(A.Bonasera)
σ= (τ-2)/β, γ=(3-τ)/σ
m1 = ∑nss ~ |ε|βm2 = ∑nss2 ~ |ε|-γmk = ∑nssk ~ |ε| (τ-1-k)/σ
Critical « correlations » of static momentsCritical Critical «« correlationscorrelations »» of of staticstatic momentsmoments
liquid branch andgas branchmeet at the critical region
τ
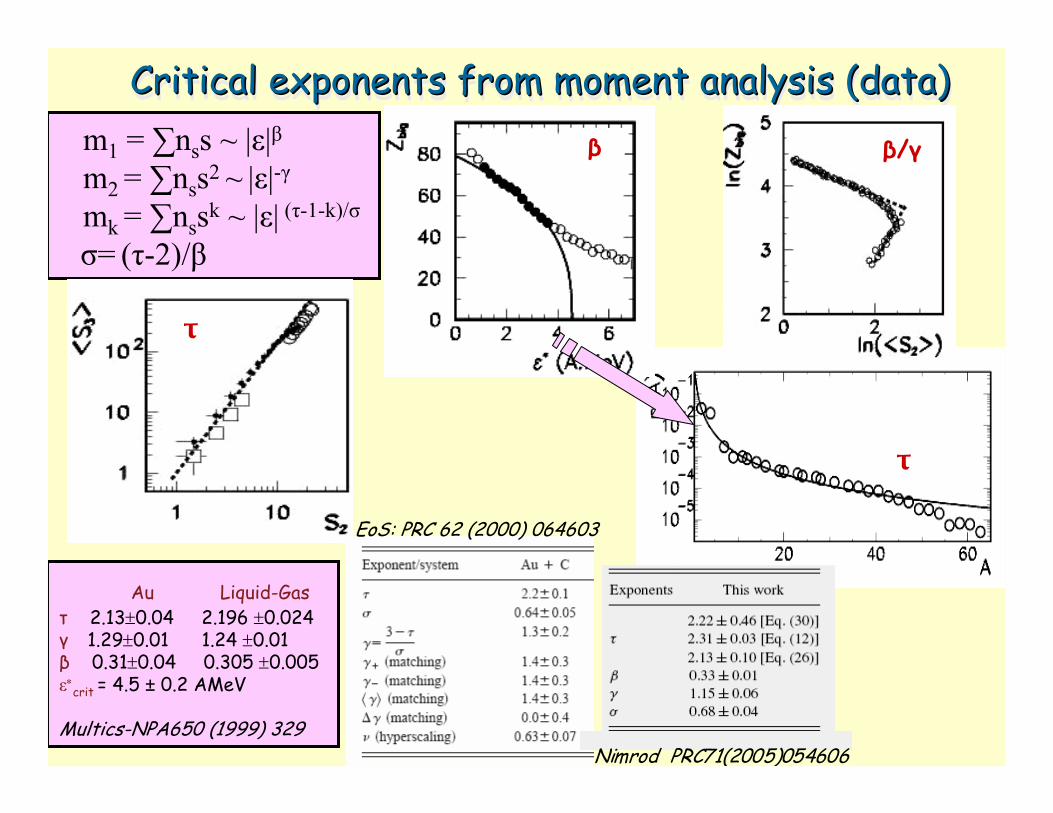
Critical exponents from moment analysis (data)Critical exponents from moment analysis (data)Critical exponents from moment analysis (data)m1 = ∑nss ~ |ε|βm2 = ∑nss2 ~ |ε|-γmk = ∑nssk ~ |ε| (τ-1-k)/σ
σ= (τ-2)/β
β β/γ
τ
Au Liquid-Gasτ 2.13±0.04 2.196 ±0.024γ 1.29±0.01 1.24 ±0.01β 0.31±0.04 0.305 ±0.005ε∗
crit = 4.5 ± 0.2 AMeV
Multics-NPA650 (1999) 329
EoS: PRC 62 (2000) 064603
Nimrod PRC71(2005)054606
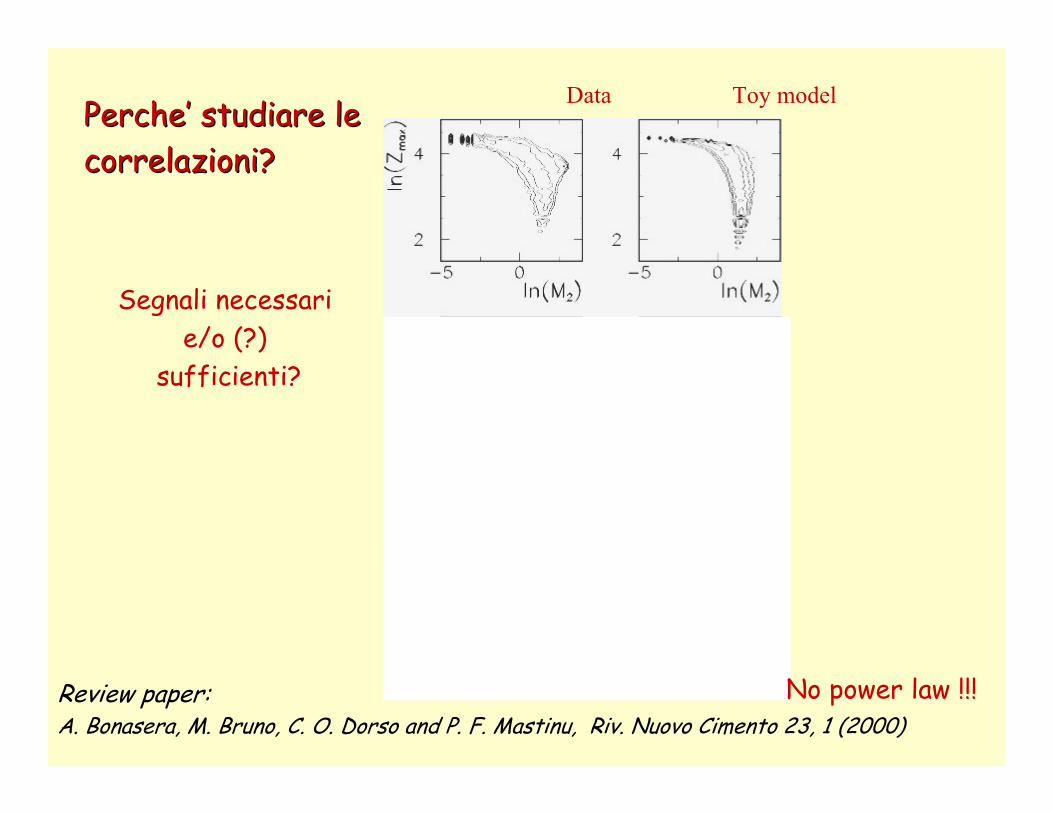
Toy modelDataPerchePerche’’ studiarestudiare le le correlazionicorrelazioni??
Segnali necessarie/o (?)
sufficienti?
Review paper:A. Bonasera, M. Bruno, C. O. Dorso and P. F. Mastinu, Riv. Nuovo Cimento 23, 1 (2000)
No power law !!!
A0
A0-1
(A0-1)/2
1
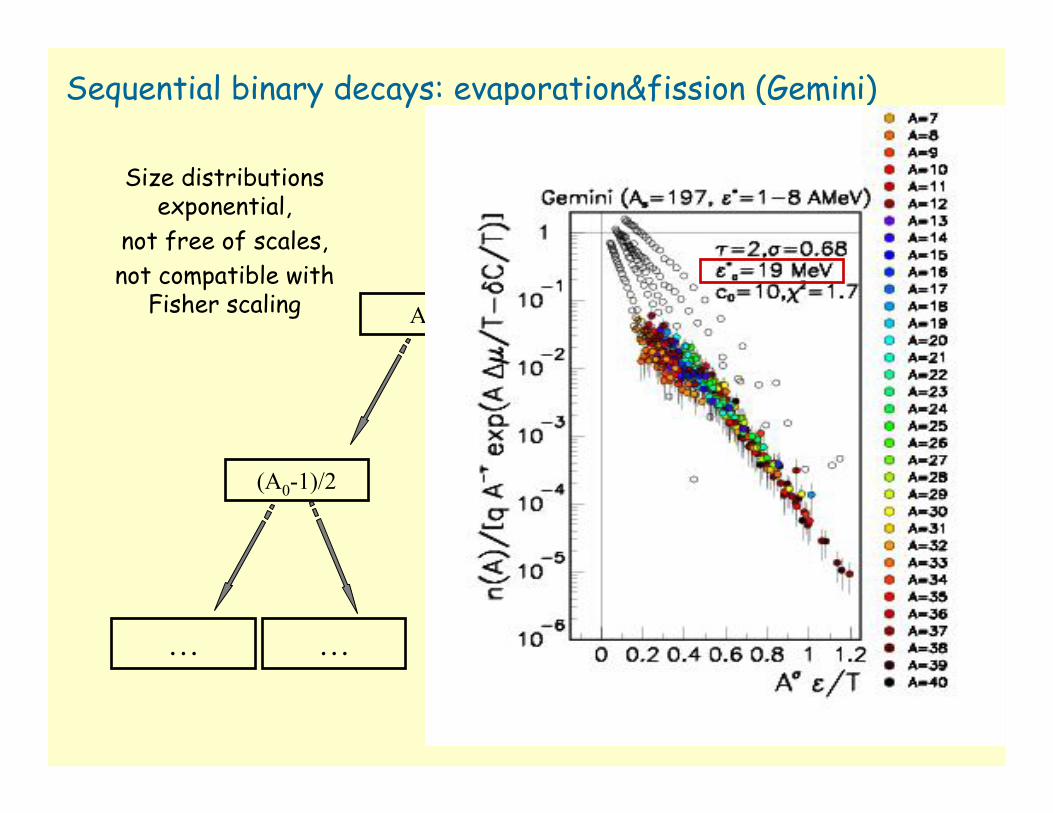
Sequential binary decays: evaporation&fission (Gemini)
(A0-1)/2
… … … …
Size distributions exponential,
not free of scales,not compatible with
Fisher scaling

Au Liquid-Gasτ 2.13±0.04 2.196 ±0.024γ 1.29±0.01 1.24 ±0.01β 0.33±0.04 0.305 ±0.005ε∗
crit = 4.5 ± 0.2 AMeV
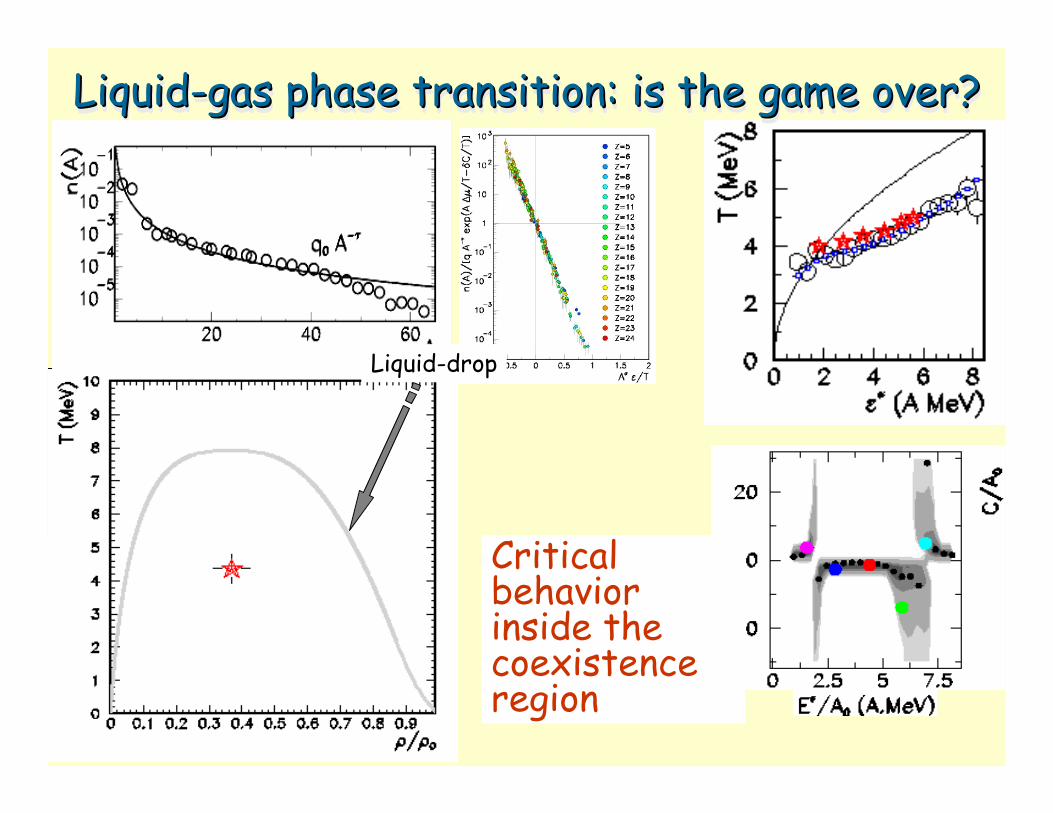
Liquid-gas phase transition: is the game over?LiquidLiquid--gas phase transition: is the game over?gas phase transition: is the game over?
• equilibrated collisions behaving as a universal process, independent of the entrance channel
• fragment yields described by critical exponents (liquid-gas universality class)
We observed:• suppression/enhancement of
branching ratios (liquid-gas)
Can we conclude that the system reached the critical point?Can we conclude that the system reached the critical point?Can we conclude that the system reached the critical point?
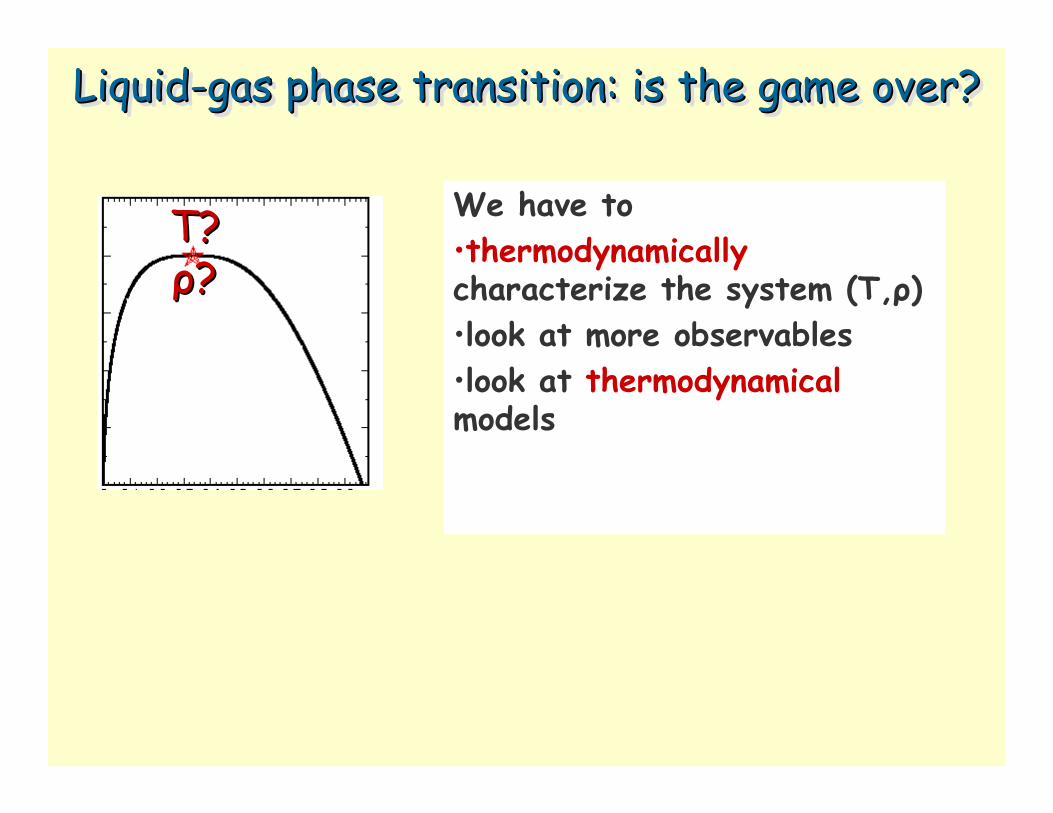
Liquid-gas phase transition: is the game over?LiquidLiquid--gas phase transition: is the game over?gas phase transition: is the game over?
T? T? ρρ??
We have to •thermodynamically characterize the system (T,ρ) •look at more observables•look at thermodynamical models

Lattice gas modelLattice gas modelLattice gas model
F. Gulminelli, V.Duflot, Ph.ChomazPRL 1999
The system is finite:
power-laws are found at all densities
Also inside thecoexistence region
•Cubic lattice (L3), •A0 nucleons occupy A0 sites , ρ = A0/L3
•occupancy (τ =0,1) from the partition sum:
Z(A0,β)=∑ W(E) exp(-βE)•interaction among nearest neighboring
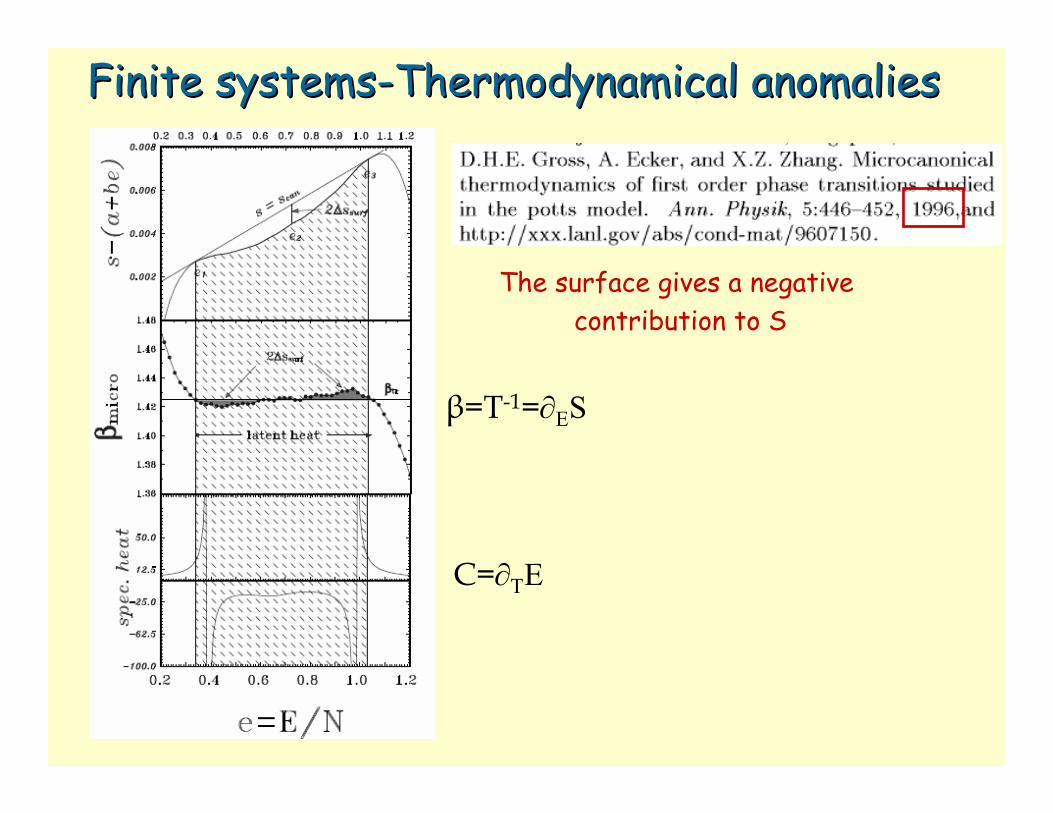
The surface gives a negative contribution to S
Finite Finite systemssystems--ThermodynamicalThermodynamical anomaliesanomalies
β=T-1=∂ΕS
C=∂ΤE
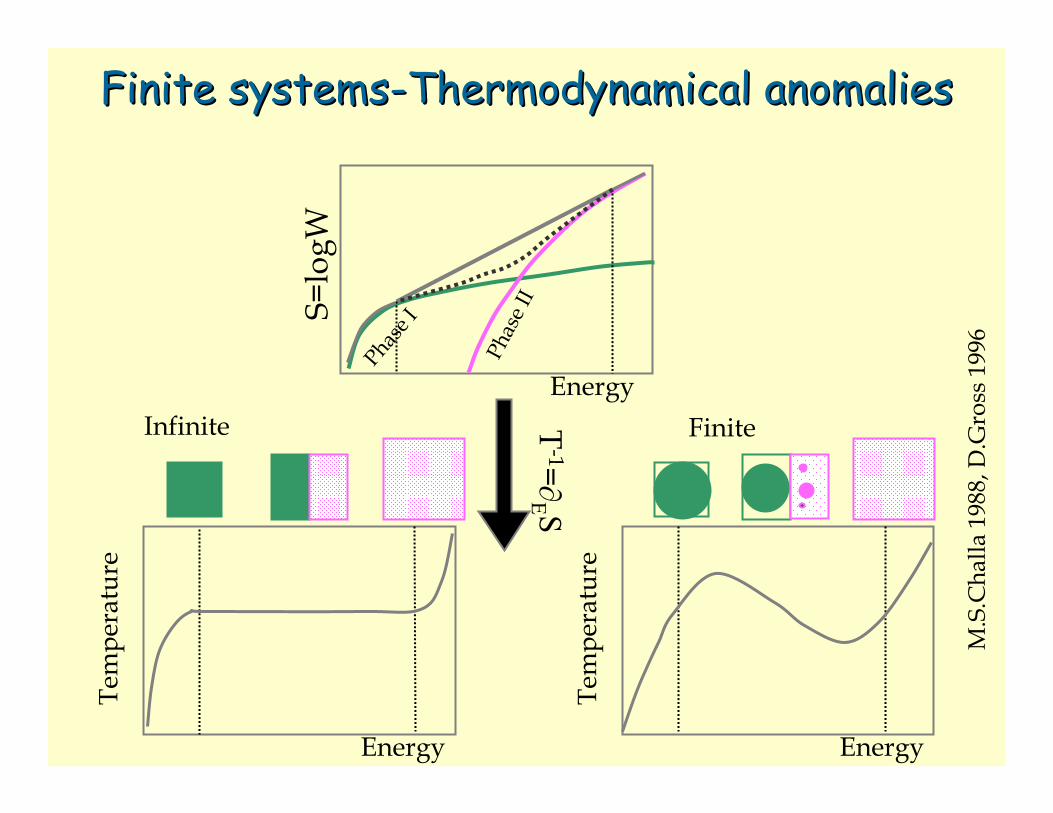
Finite Finite systemssystems--ThermodynamicalThermodynamical anomaliesanomalies
T-1=∂
Ε S
Tem
pera
ture
Tem
pera
ture
Energy Energy
M.S
.Cha
lla19
88, D
.Gro
ss 1
996
Phas
e II
Phase IS=
logW
EnergyInfinite Finite
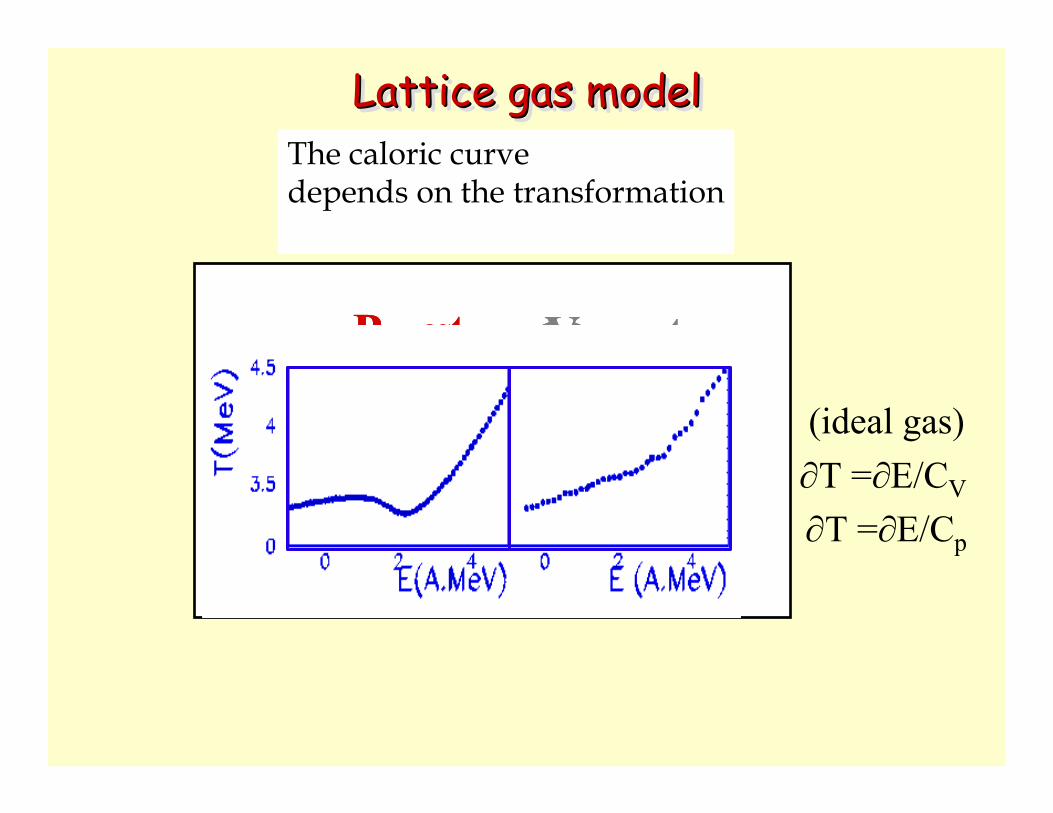
Lattice gas modelLattice gas modelLattice gas model
P = cst <V> = cstP = cst <V> = cst
The caloric curve depends on the transformation
(ideal gas)∂T =∂E/CV
∂T =∂E/Cp
Ep
E
P(E
k)
0 0
W k (E k )W p (E p )
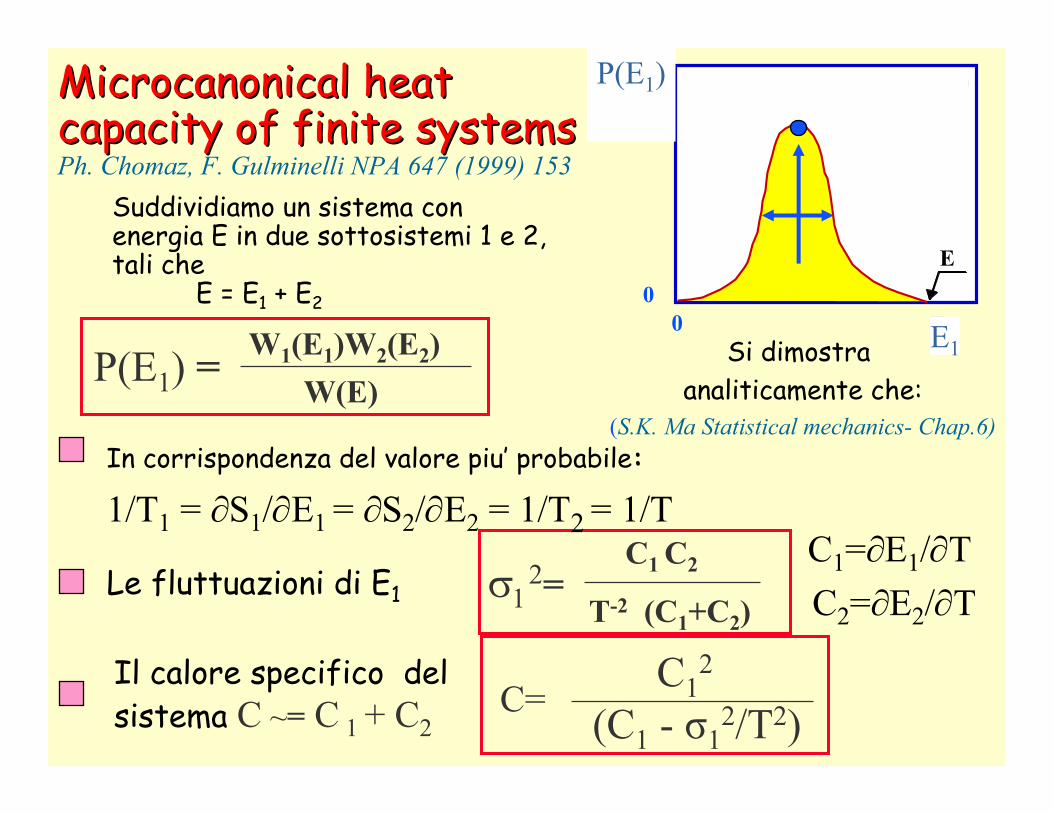
W(E)Microcanonical heat Microcanonical heat capacity of finite systemscapacity of finite systemsPh. Chomaz, F. Gulminelli NPA 647 (1999) 153
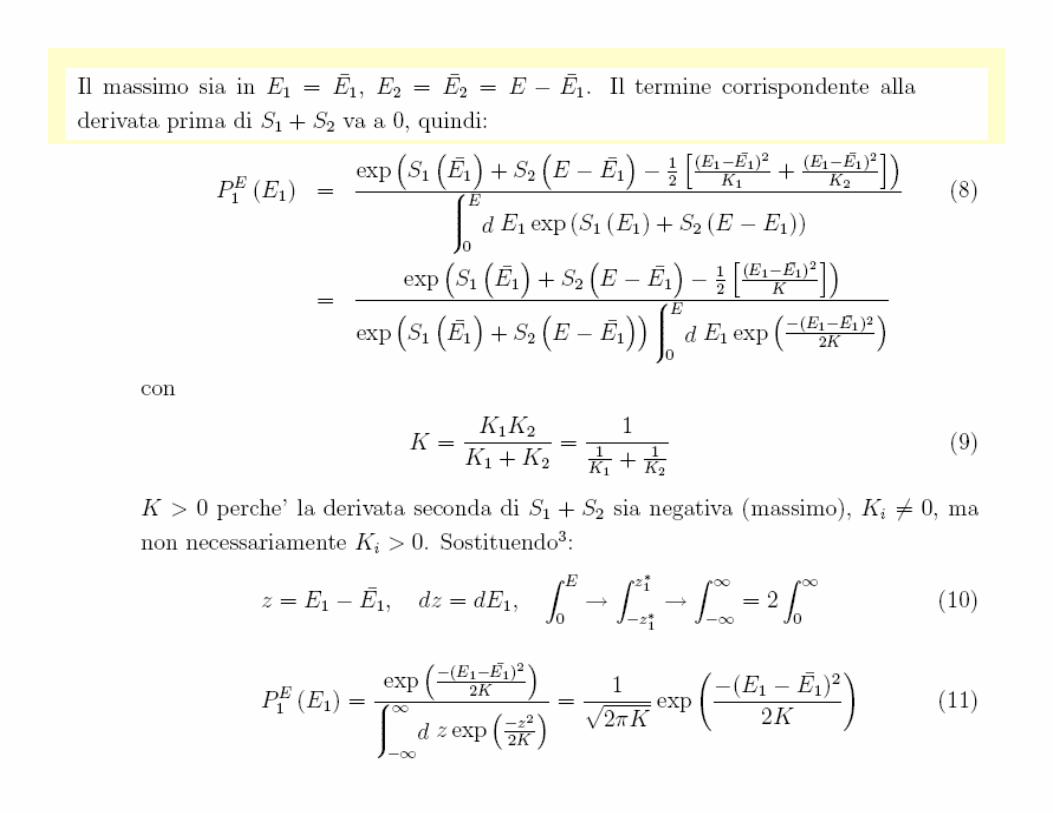
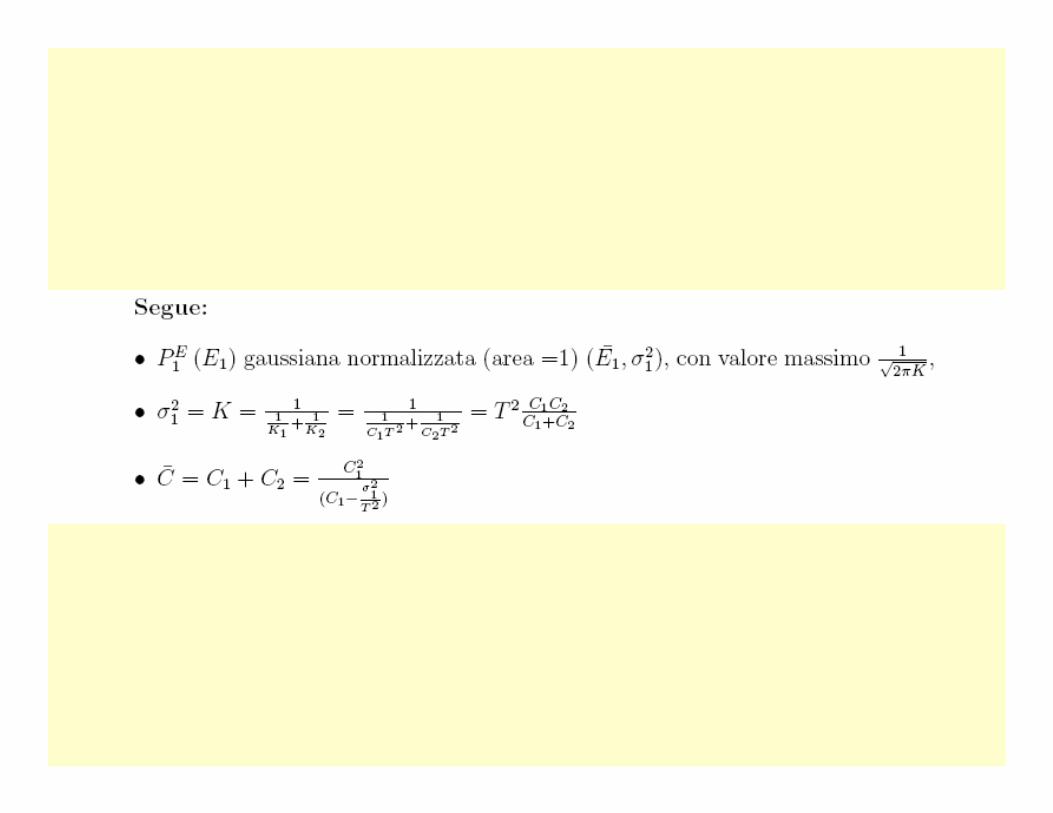
Suddividiamo un sistema con energia E in due sottosistemi 1 e 2, tali che
E = E1 + E2
W(E)W1(E1)W2(E2)P(E1) =
C1 C2
T-2 (C1+C2)Le fluttuazioni di E1
(C1 - σ12/T2)
C12Il calore specifico del
sistema C ~= C 1 + C2
P(E1)
E1
In corrispondenza del valore piu’ probabile:
1/T1 = ∂S1/∂E1 = ∂S2/∂E2 = 1/T2 = 1/T
Si dimostraanaliticamente che:
(S.K. Ma Statistical mechanics- Chap.6)
C=
σ12=
C1=∂E1/∂T C2=∂E2/∂T

Microcanonical heat Microcanonical heat capacity of finite systemscapacity of finite systemsPh. Chomaz, F. Gulminelli NPA 647 (1999) 153
2nd order
1st order
C = C12/(C1-σ1
2/T2)
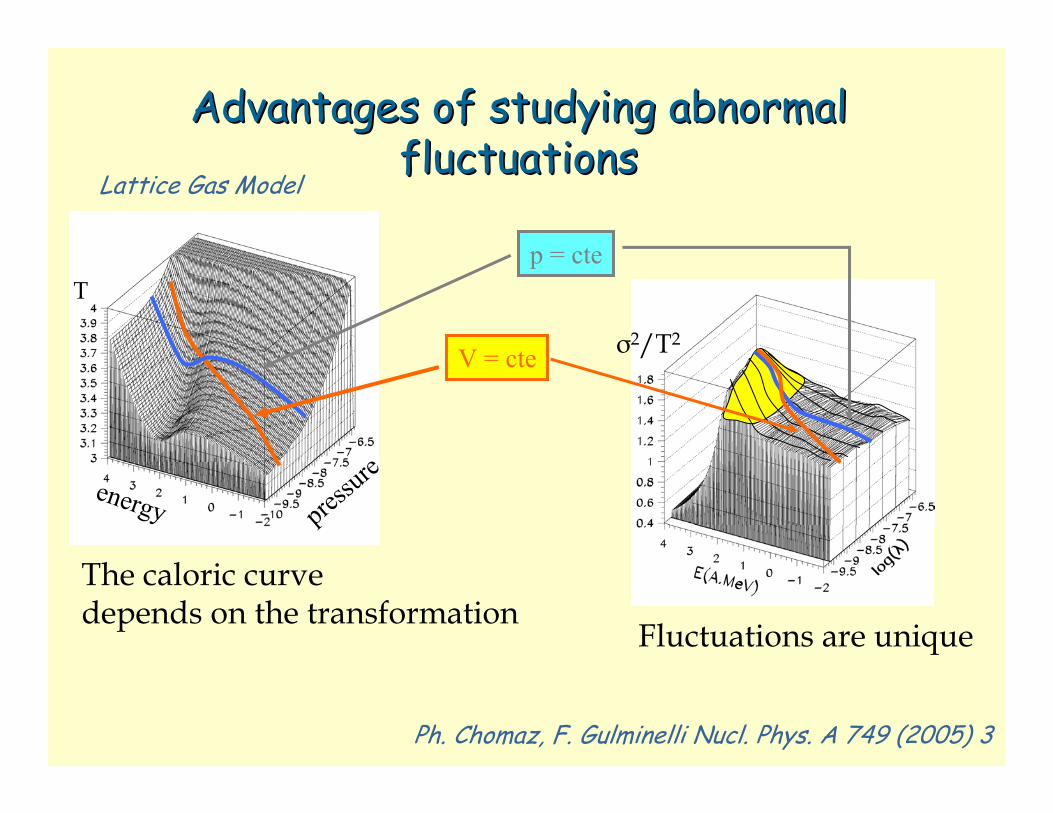
AdvantagesAdvantages of of studyingstudying abnormalabnormalfluctuationsfluctuations
T
σ2/T2
p = cte
V = cte
The caloric curve depends on the transformation
Fluctuations are unique
energy pressure
Ph. Chomaz, F. Gulminelli Nucl. Phys. A 749 (2005) 3
Lattice Gas Model
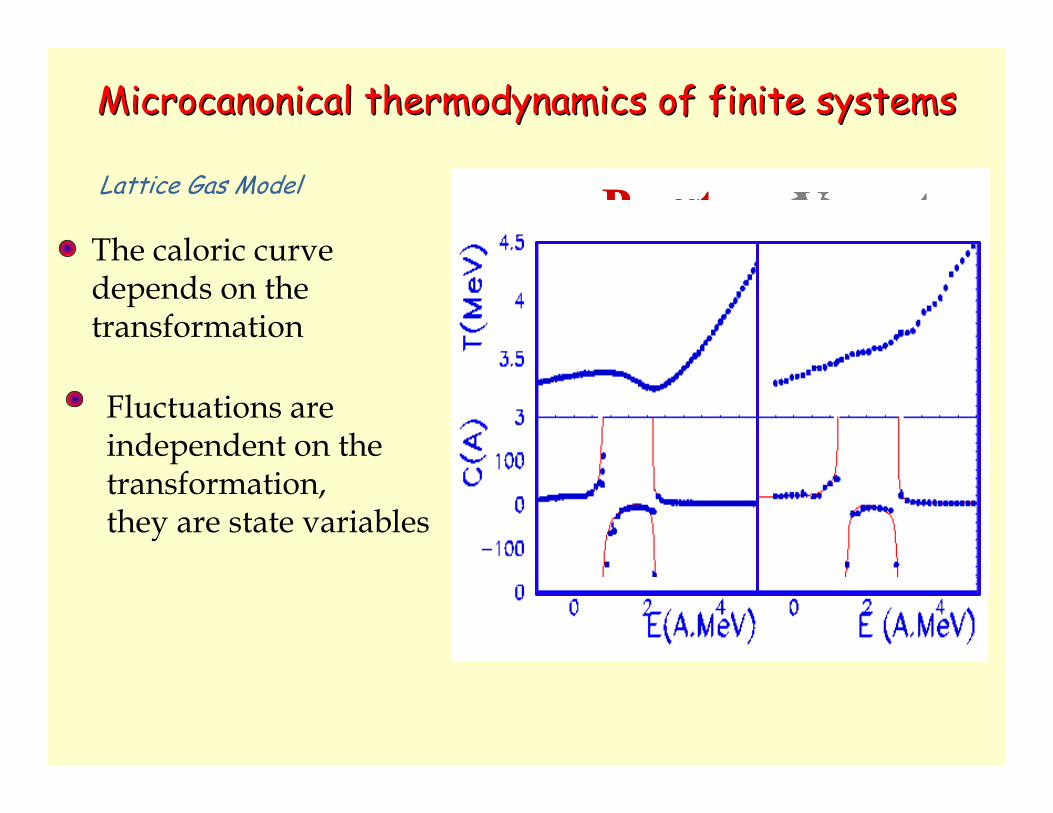
Microcanonical thermodynamics of finite systemsMicrocanonical thermodynamics of finite systems
P = cst <V> = cstP = cst <V> = cstThe caloric curve depends on the transformation
Fluctuations are independent on the transformation,they are state variables
Lattice Gas Model

Microcanonical thermodynamics of finite systems
Microcanonical thermodynamics of finite Microcanonical thermodynamics of finite systemssystems
We can back-trace from data•the average volume (ρ) of the system
E*= Econfig + EkinE*= Ecoul(V)+Qv+ Eint(T)+Etr(T)
Events sorted as a function of E* (calorimetry)
•the temperature T
under the constraint of energy conservationMultics-Nucl.Phys.A699(2002)795

Early information from measured observables: average volume
Early information from measured observablesEarly information from measured observables: : average volumeaverage volume
Circles=Multics dataSquares=Coulomb trajectories

Early information from measured observables : Temperature
Early information from measured observables : Early information from measured observables : TemperatureTemperature
Isotope thermometerP.M.Milazzo,PRC58(1998) 953
Indra correlation dataN.Marie,PRC58(1998)256
<Ekin>=(3/2) <m-1>T+<ΣaAIMF>T2
Multics-NPA699(2002)795
1)2/3( −=
mET tr
T, Eint from independent measurements/methods
Liquid-drop
Aladin PRL1995
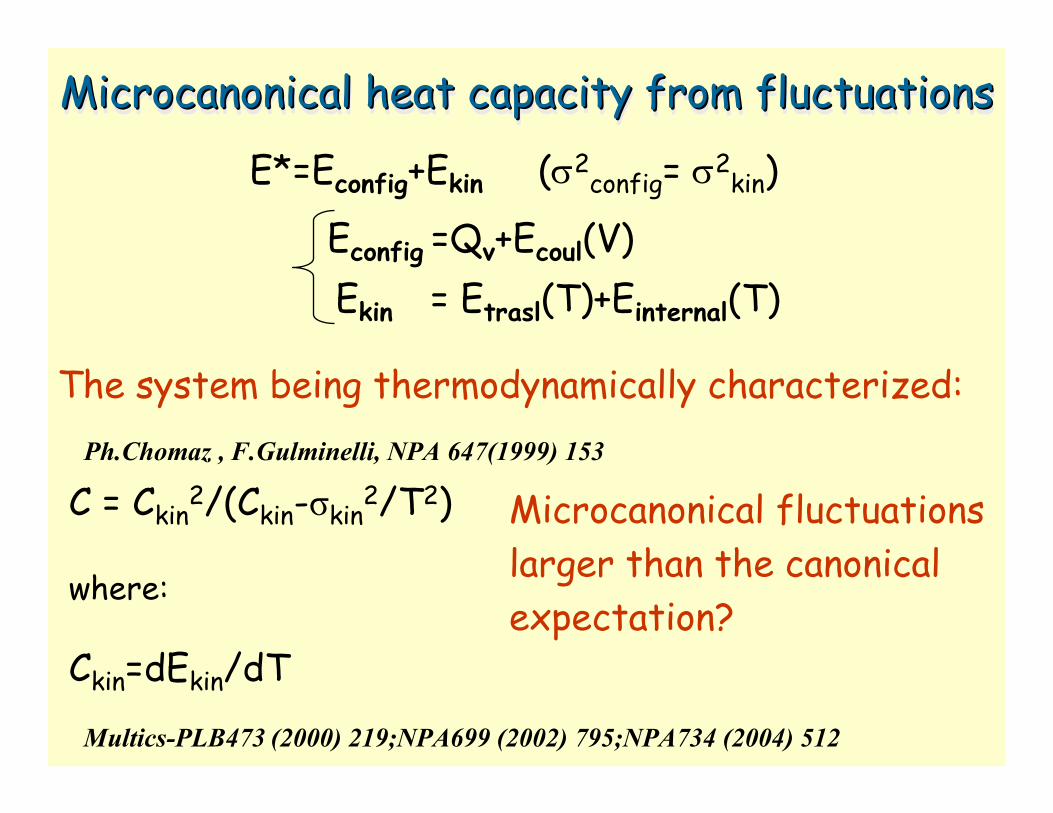
Microcanonical heat capacity from fluctuationsMicrocanonical heat capacity from fluctuationsMicrocanonical heat capacity from fluctuations
E*=Econfig+Ekin (σ2config= σ2
kin)
Ph.Chomaz , F.Gulminelli, NPA 647(1999) 153
Ekin = Etrasl(T)+Einternal(T)Econfig =Qv+Ecoul(V)
The system being thermodynamically characterized:
Multics-PLB473 (2000) 219;NPA699 (2002) 795;NPA734 (2004) 512
Microcanonical fluctuationslarger than the canonical expectation?
C = Ckin2/(Ckin-σkin
2/T2)
where:
Ckin=dEkin/dT

Heat capacity from fluctuations Heat capacity from fluctuations Heat capacity from fluctuations
Grey area: peripheral collisions
Points: central collisions:
Indra: NPA699(2002)795
Au+C Au+Cu Au+Au
Multics:PLB473 (2000) 219NPA699 (2002) 795NPA734 (2004) 512
11--st order phase transitionst order phase transition
Au Liquid-Gasτ 2.1±0.1 2.196 ±0.024
σ 0.66±0.02 0.647 ±0.006
ε∗c 4.4 ± 0.1 ΑΜeV
Liquid-gas phase transition: is the game over? LiquidLiquid--gas phase transition: is the game over? gas phase transition: is the game over?
Critical behavior inside thecoexistenceregion
Liquid-drop

What is left for future measurements? What is left for future measurements? What is left for future measurements?
Multics E1=2±0.3 E2=6.5±0.7Isis E1=2.5 E2 =7.Indra E2=6.±0.5
Coincident experimental information are needed on:•critical partitioning of the
system, fluctuations•calorimetric excitation energy•isotopic temperature•proximity of the decay
products
4π mass and charge detection !!
Multics NPA 2004
E*/A (A.MeV)
A better quantitative nuclear metrology of hot nuclei
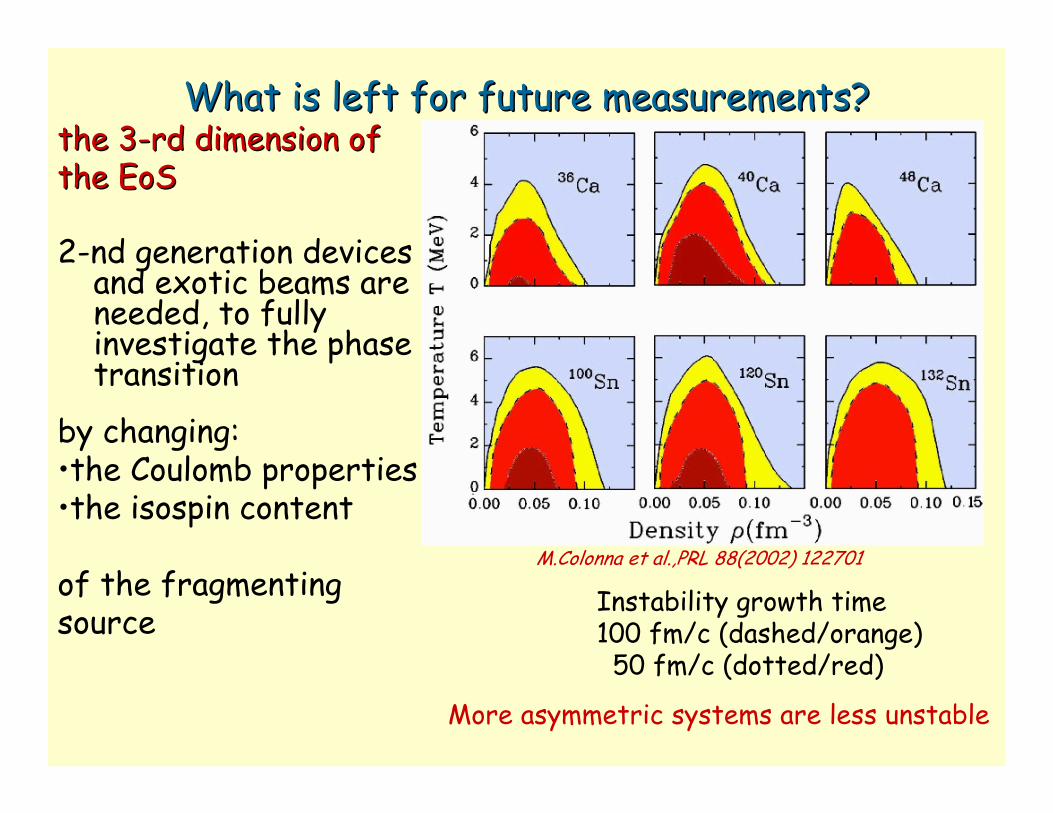
2-nd generation devices and exotic beams are needed, to fully investigate the phase transition
by changing:•the Coulomb properties •the isospin content
of the fragmenting source
the 3the 3--rd dimension of rd dimension of the EoSthe EoS
M.Colonna et al.,PRL 88(2002) 122701
Instability growth time 100 fm/c (dashed/orange)
50 fm/c (dotted/red)
More asymmetric systems are less unstable
What is left for future measurements?What is left for future measurements?
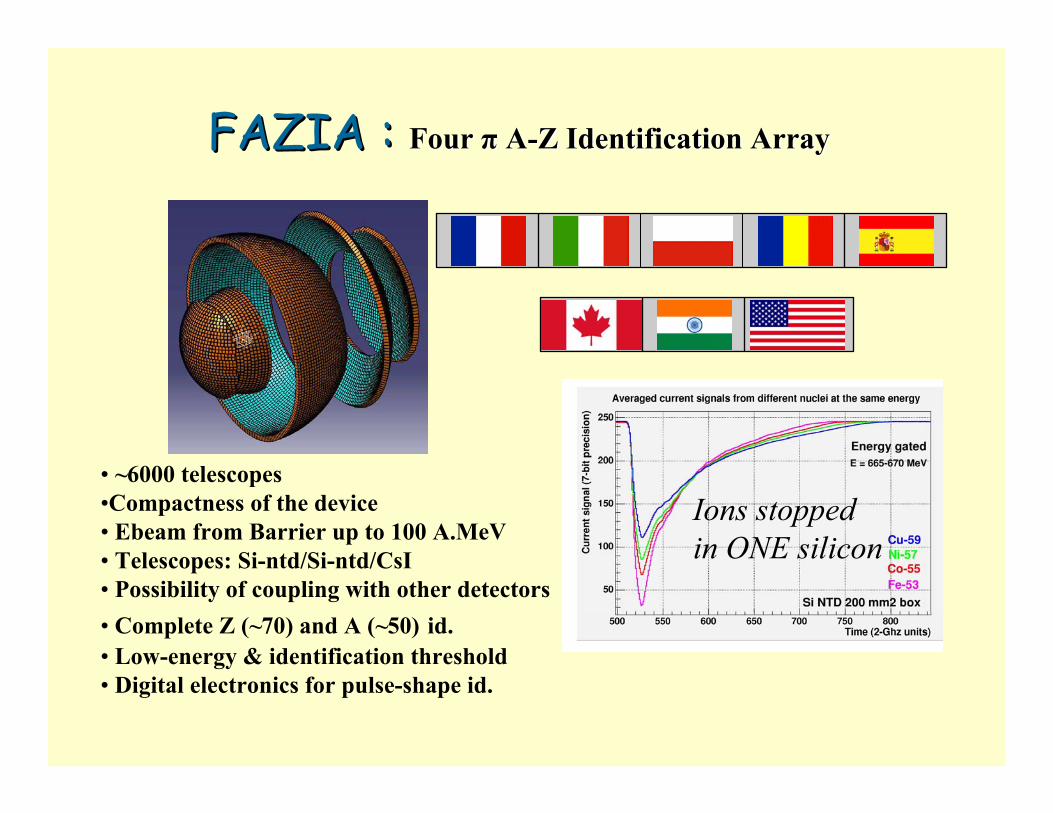
FAZIAFAZIA : : Four Four ππ AA--Z Identification Z Identification ArrayArray
• ~6000 telescopes•Compactness of the device• Ebeam from Barrier up to 100 A.MeV• Telescopes: Si-ntd/Si-ntd/CsI• Possibility of coupling with other detectors• Complete Z (~70) and A (~50) id.• Low-energy & identification threshold• Digital electronics for pulse-shape id.
Ions stoppedin ONE silicon


Systems and subsystemsSystems and subsystemsS.K. Ma Statistical mechanics- Chap.6


T from double ratios: Y(He3)/Y(He4)Y(Li6)/Y(Li7)
TB
p
n1 e)Z,N(Y
)Z,Y(N:nuclei)mirror(forratioIsobaric
∆≈ρρ
22
1
V1=V2
Isotope analysis

TemperaturaTemperatura
Ipotesi: equilibrio
slope: effetti dinamici
doppio rapporto isotopicosi elimina la dipendenzadalle proprieta’ chimiche
popolazione di stati eccitati

Symmetry energy and free nucleon densities
E. Geraci, et al., Nucl. Phys. A 732 (2004) 173, Nucl .Phys. A734 (2004) 524
ZN
NiSn
NiSn e)Z,N(Y)Z,N(Y
)Z,N(R
:ratioIsotopic
βα +
+
+ ∝=58112
64124
21
2
2
2
1
−
=
AZ
AZ
TCsymα
TB
p
n1 e)Z,N(Y
)Z,Y(N:nuclei)mirror(forratioIsobaric
∆≈ρρ
22
1
α = 0.44 ± 0.01
Symmetry Energy~18-20 MeV
112,124Sn+58,64Ni 35 AMeV central collisionsCHIMERA-REVERSE Experiment
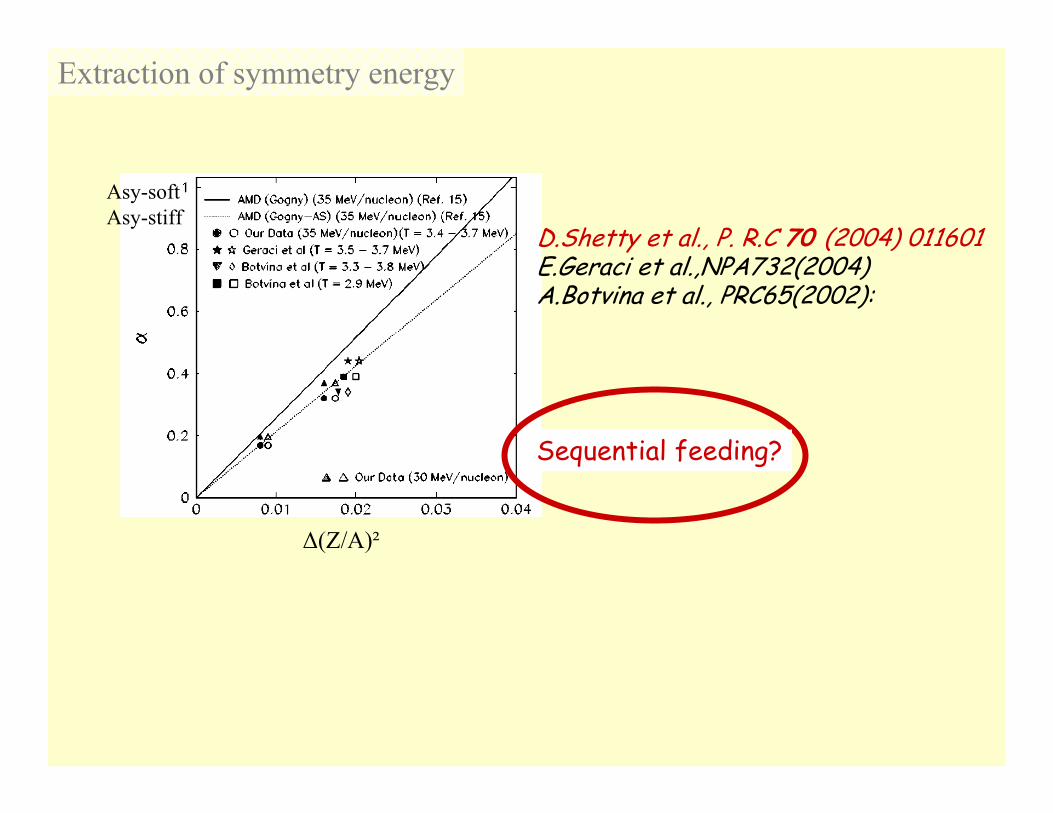
∆(Z/A)²
D.Shetty et al., P. R.C 70 (2004) 011601E.Geraci et al.,NPA732(2004)A.Botvina et al., PRC65(2002):
Extraction of symmetry energy
Asy-softAsy-stiff
Sequential feeding?
1+R(
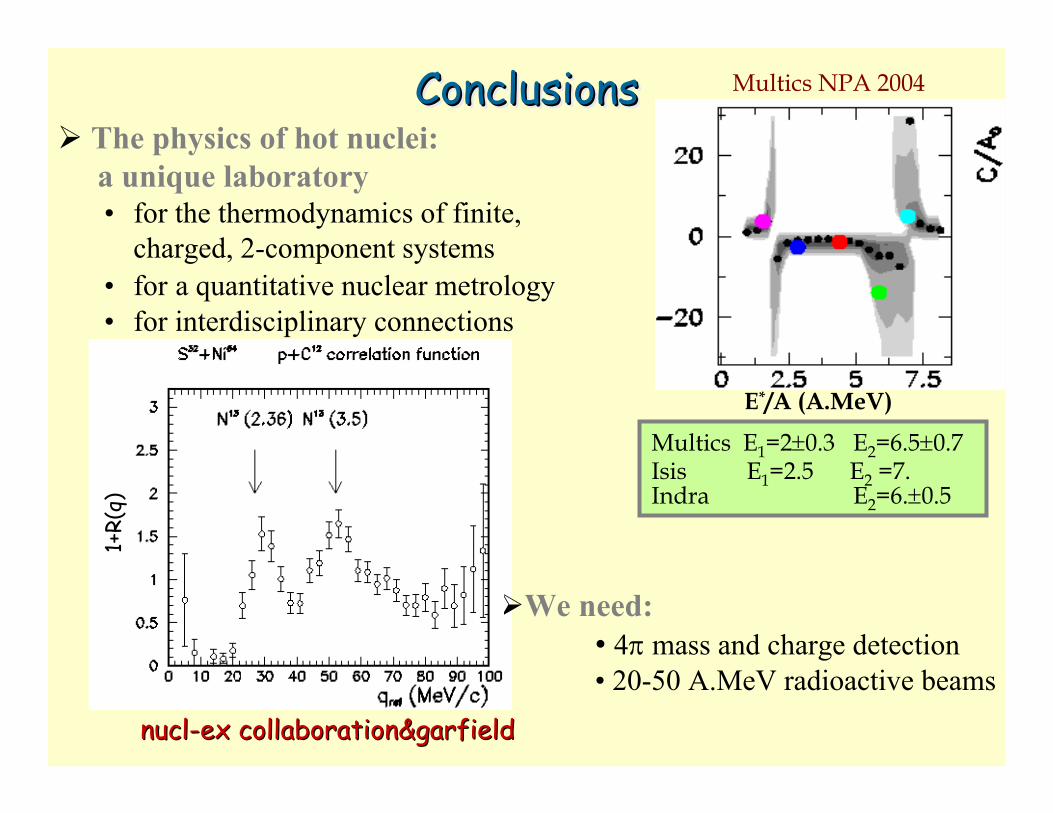
q)ConclusionsConclusionsConclusions
The physics of hot nuclei: a unique laboratory • for the thermodynamics of finite,
charged, 2-component systems• for a quantitative nuclear metrology• for interdisciplinary connections
Multics E1=2±0.3 E2=6.5±0.7Isis E1=2.5 E2 =7.Indra E2=6.±0.5
We need:• 4π mass and charge detection• 20-50 A.MeV radioactive beams
Multics NPA 2004
E*/A (A.MeV)
1+R(
q)
nuclnucl--ex ex collaboration&garfieldcollaboration&garfield

J. Pochodzalla et al, PRL 75, 1040 (1995)
For the caloric curve one needs to measure:
• Heavy residue (or QP)
• Slopes of 1-st chance l.c.p. energy spectra
• Isotopes (for double ratios)
Temperature and caloric curveTemperature and caloric curve
R. Wada et al., PRC 39, 497 (1989)
N.Le Neindre et al , NIM A490 (2002) 251
Sequential feeding?
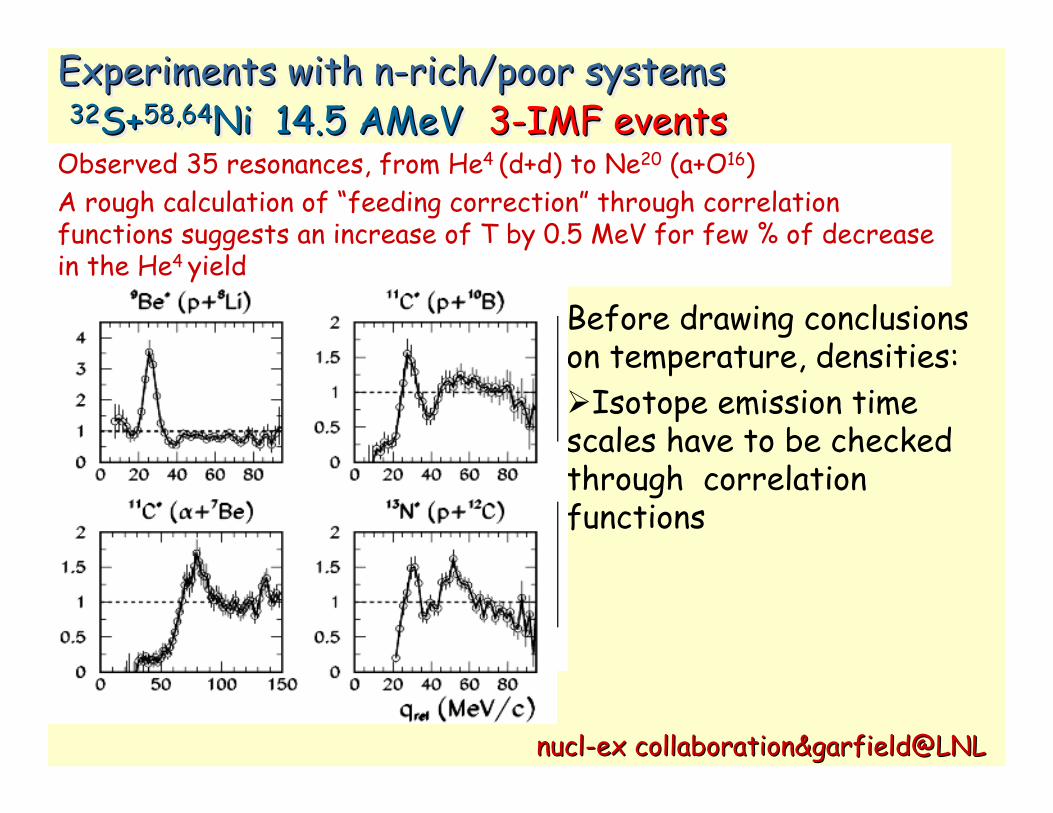
Experiments with n-rich/poor systems32S+58,64Ni 14.5 AMeV 3-IMF events
Experiments with nExperiments with n--rich/poor systemsrich/poor systems3232S+S+58,6458,64Ni 14.5 AMeVNi 14.5 AMeV 33--IMF eventsIMF events
Before drawing conclusions on temperature, densities:
Isotope emission time scales have to be checked through correlation functions
nuclnucl--ex ex collaboration&garfield@LNLcollaboration&garfield@LNL
Observed 35 resonances, from He4 (d+d) to Ne20 (a+O16) A rough calculation of “feeding correction” through correlation functions suggests an increase of T by 0.5 MeV for few % of decrease in the He4 yield

Position-se
nsitive h
odoscope
Pochodzalla et al., PRC35 (1987)1695
t-α correlation function (Li7*)
m=multiplicity, N=number of detectors•ε (m) = ε(1)m
•P(double)=(m-1)/(2N)
A reasonable compromise is P(double)<5%For m=3 N=10
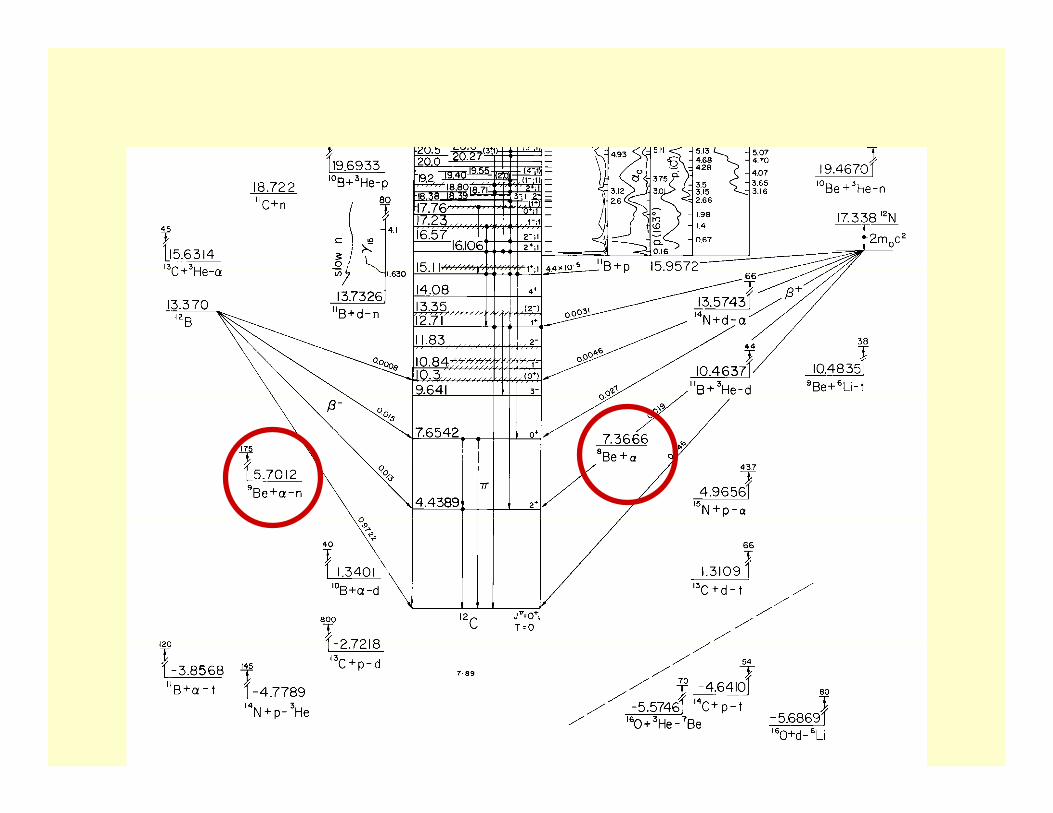
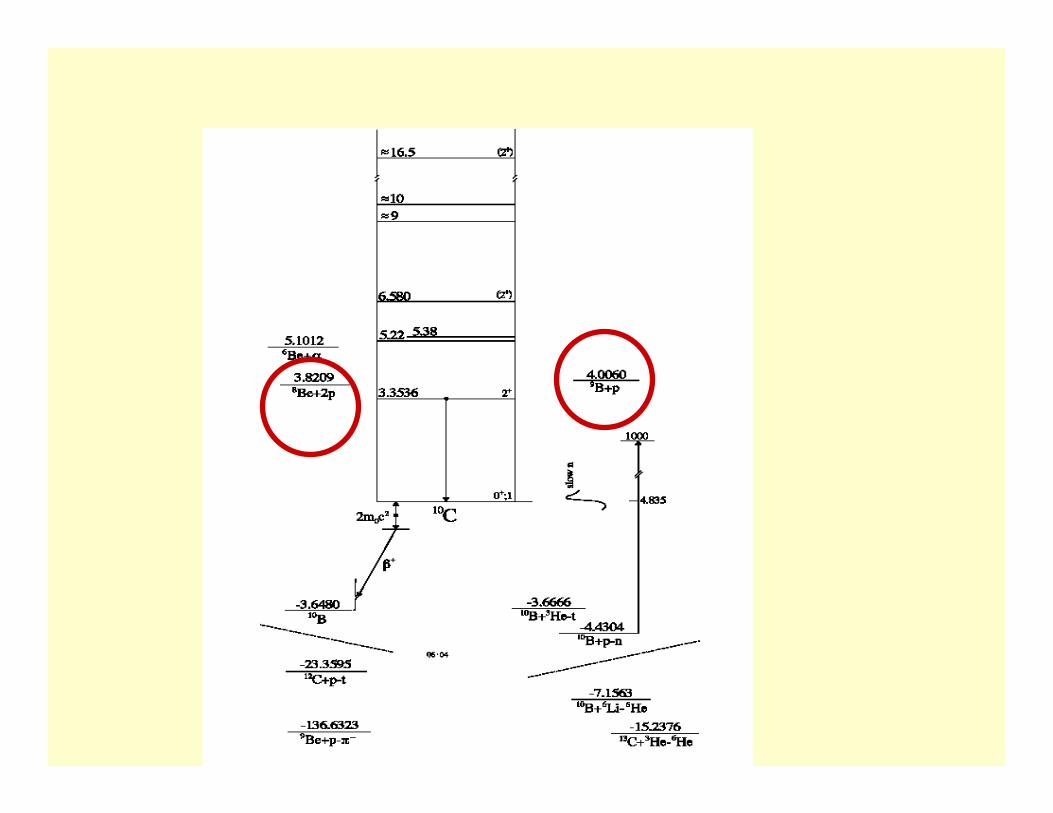
Resonance spectroscopyResonance spectroscopy
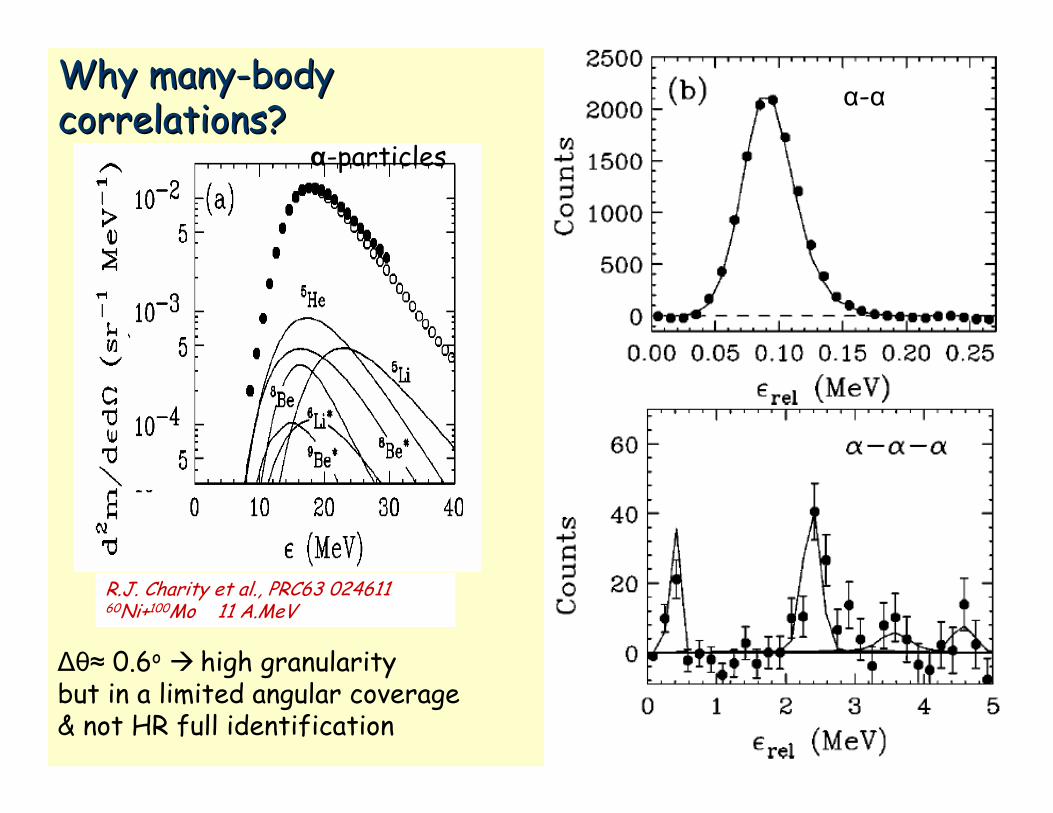
Why manyWhy many--bodybodycorrelations?correlations?
R.J. Charity et al., PRC63 024611 60Ni+100Mo 11 A.MeV
α-particles
α-α
∆θ≈ 0.6o high granularitybut in a limited angular coverage & not HR full identification

112Sn+58Ni and 124Sn+64Ni 35 AMeV central collisionsCHIMERA-REVERSE Experiment
E. Geraci, et al., Nucl. Phys. A 732 (2004) 173, Nucl .Phys. A734 (2004) 524
ZN
NiSn
NiSn e)Z,N(Y)Z,N(Y
)Z,N(R
:ratioIsotopic
βα +
+
+ ∝=58112
64124
21
2
2
2
1
−
=
AZ
AZ
TCsymα
TB
p
n1 e)Z,N(Y
)Z,Y(N:nuclei)mirror(forratioIsobaric
∆≈ρρ
22
1
α = 0.44 ± 0.01
Csym= Symmetry Energy~18-20 MeVD.Shetty et al., P. R.C 70 (2004) 011601