Electroactive macromonomers and multi-responsive graft ...
21
Supporting Information New electroactive macromonomers and multi-responsive PEDOT graft copolymers Sara Marina a , Daniele Mantione b , Kasina Manoj Kumar c , Kari Vijayakrishna c , Junkal Gutierrez d,e , Agnieszka Tercjak d , Ana Sanchez-Sanchez *f , David Mecerreyes *a,g a. POLYMAT, University of the Basque Country UPV/EHU, Joxe Mari Korta Centre, Avda. Tolosa 72, 20018, Donostia-San Sebastian, Spain. Email:[email protected] b. Laboratoire de Chimie des Polymères Organiques, Université Bordeaux/CNRS/INP, Allée Geoffroy Saint Hilaire, Bâtiment B8, 33615 Pessac Cedex, France c. Department of Chemistry, School of Advanced Sciences, VIT University, Vellore 632 014, Tamil Nadu, India d. Group `Materials + Technologies´ , Faculty of Engineering Gipuzkoa, University of the Basque Country (UPV/EHU), Plaza Europa 1, 20018 Donostia, Spain. e. Faculty of Engineering Vitoria-Gasteiz, University of the Basque Country (UPV/EHU), C/Nieves Cano 12, 01006 Vitoria-Gasteiz, Spain f. University of Cambridge, Dept. of Eng., Electrical Eng. Division, 9 JJ Thomson Avenue, Cambridge, CB3 0FA, UK. * Corresponding authors : g. Ikerbasque, Basque Foundation for Science, E-48011 Bilbao, Spain Electronic Supplementary Material (ESI) for Polymer Chemistry. This journal is © The Royal Society of Chemistry 2018
Transcript of Electroactive macromonomers and multi-responsive graft ...
Supporting Information
New electroactive macromonomers and multi-responsive PEDOT graft copolymersSara Marinaa, Daniele Mantioneb, Kasina Manoj Kumarc, Kari Vijayakrishnac, Junkal Gutierrezd,e, Agnieszka Tercjakd, Ana Sanchez-Sanchez*f, David Mecerreyes*a,g
a. POLYMAT, University of the Basque Country UPV/EHU, Joxe Mari Korta Centre, Avda. Tolosa 72, 20018, Donostia-San Sebastian, Spain.
Email:[email protected]. Laboratoire de Chimie des Polymères Organiques, Université Bordeaux/CNRS/INP, Allée Geoffroy
Saint Hilaire, Bâtiment B8, 33615 Pessac Cedex, Francec. Department of Chemistry, School of Advanced Sciences, VIT University, Vellore 632 014, Tamil Nadu,
India d. Group `Materials + Technologies´ , Faculty of Engineering Gipuzkoa, University of the Basque
Country (UPV/EHU), Plaza Europa 1, 20018 Donostia, Spain.e. Faculty of Engineering Vitoria-Gasteiz, University of the Basque Country (UPV/EHU), C/Nieves Cano
12, 01006 Vitoria-Gasteiz, Spainf. University of Cambridge, Dept. of Eng., Electrical Eng. Division, 9 JJ Thomson Avenue, Cambridge,
CB3 0FA, UK. * Corresponding authors : g. Ikerbasque, Basque Foundation for Science, E-48011 Bilbao, Spain
Electronic Supplementary Material (ESI) for Polymer Chemistry.This journal is © The Royal Society of Chemistry 2018
1
Table of Contents1. General Information S1
2. Synthetic procedures & NMRs S1
3. Synthesis of ProDOT end capped functional electroactive macromonomers S7
3.1. ProDOT-POEGMA 1H-
NMR, FTIR & GPC spectra S7
3.2. ProDOT-PNIPAM 1H-
NMR, FTIR, UV-Vis-NIR & UV-Vis spectra S8
3.3. ProDOT-PMMA FTIR
and MALDI-TOF spectra S10
4. Homopolymerization of ProDOT-PMMA macromonomers. S13
4.1. UV-Vis-NIR & FTIR spectra S13
5. Synthesis of PEDOT based graft copolymers . S14
5.1. PEDOT-g-POEGMA copolymer FTIR spectra, and TEM and AFM images S15
5.2. PEDOT-g-PNIPAM copolymer UV-Vis-NIR and FTIR spectra S18
6. References S19
S1
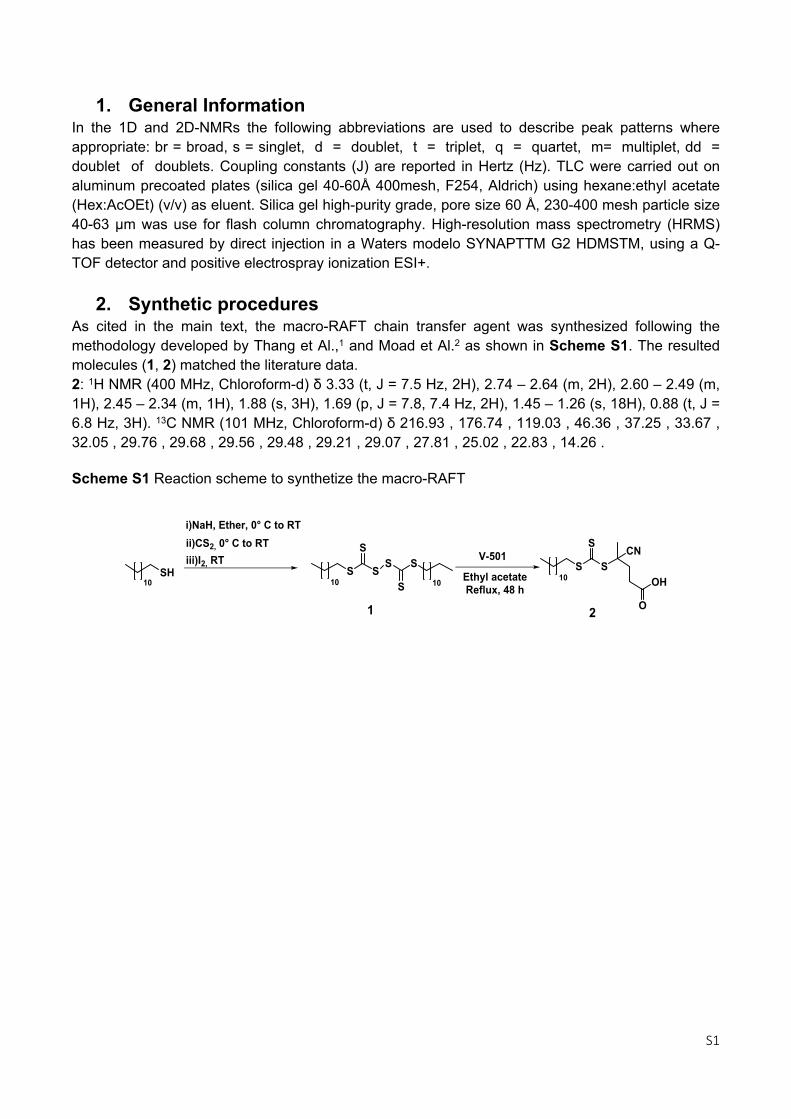
1. General InformationIn the 1D and 2D-NMRs the following abbreviations are used to describe peak patterns where appropriate: br = broad, s = singlet, d = doublet, t = triplet, q = quartet, m= multiplet, dd = doublet of doublets. Coupling constants (J) are reported in Hertz (Hz). TLC were carried out on aluminum precoated plates (silica gel 40-60Å 400mesh, F254, Aldrich) using hexane:ethyl acetate (Hex:AcOEt) (v/v) as eluent. Silica gel high-purity grade, pore size 60 Å, 230-400 mesh particle size 40-63 μm was use for flash column chromatography. High-resolution mass spectrometry (HRMS) has been measured by direct injection in a Waters modelo SYNAPTTM G2 HDMSTM, using a Q-TOF detector and positive electrospray ionization ESI+.
2. Synthetic proceduresAs cited in the main text, the macro-RAFT chain transfer agent was synthesized following the methodology developed by Thang et Al.,1 and Moad et Al.2 as shown in Scheme S1. The resulted molecules (1, 2) matched the literature data.2: 1H NMR (400 MHz, Chloroform-d) δ 3.33 (t, J = 7.5 Hz, 2H), 2.74 – 2.64 (m, 2H), 2.60 – 2.49 (m, 1H), 2.45 – 2.34 (m, 1H), 1.88 (s, 3H), 1.69 (p, J = 7.8, 7.4 Hz, 2H), 1.45 – 1.26 (s, 18H), 0.88 (t, J = 6.8 Hz, 3H). 13C NMR (101 MHz, Chloroform-d) δ 216.93 , 176.74 , 119.03 , 46.36 , 37.25 , 33.67 , 32.05 , 29.76 , 29.68 , 29.56 , 29.48 , 29.21 , 29.07 , 27.81 , 25.02 , 22.83 , 14.26 .
Scheme S1 Reaction scheme to synthetize the macro-RAFT
SH10
i)NaH, Ether, 0° C to RTii)CS2, 0° C to RT
S S
SS
S
S10 10
V-501
Ethyl acetateReflux, 48 h
S S
SCN
OH
O
10
iii)I2, RT
1 2
S2
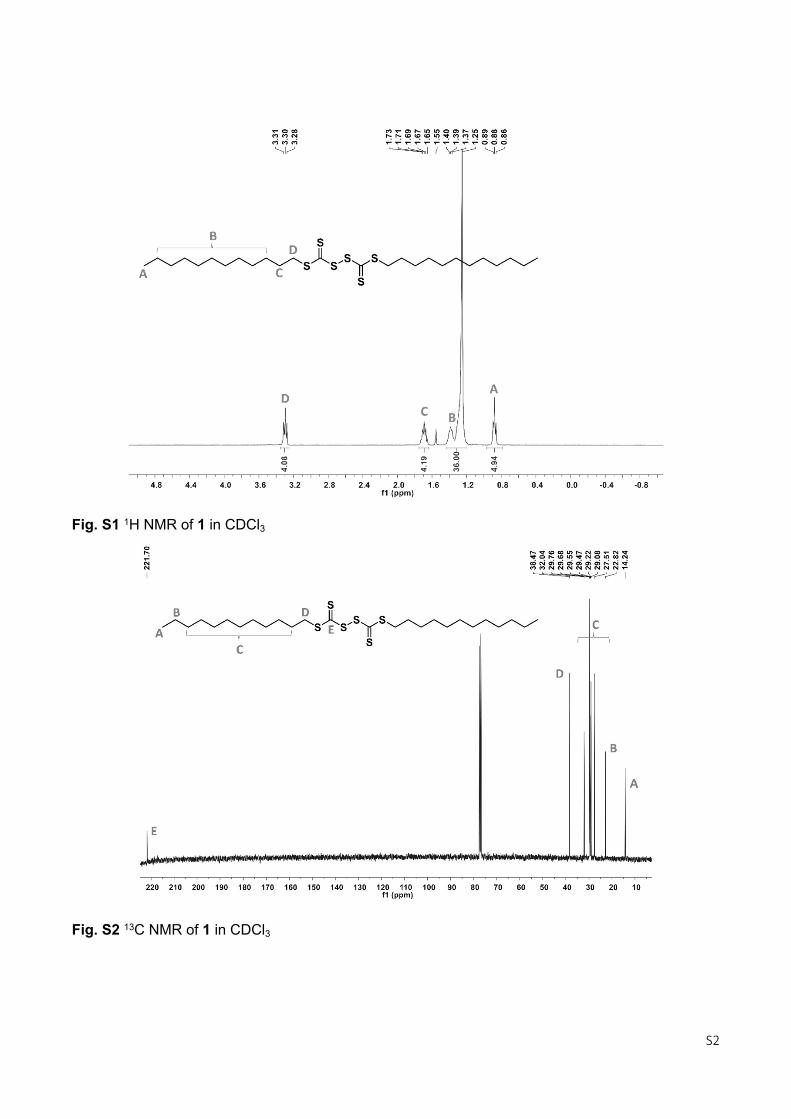
Fig. S1 1H NMR of 1 in CDCl3
Fig. S2 13C NMR of 1 in CDCl3
S3
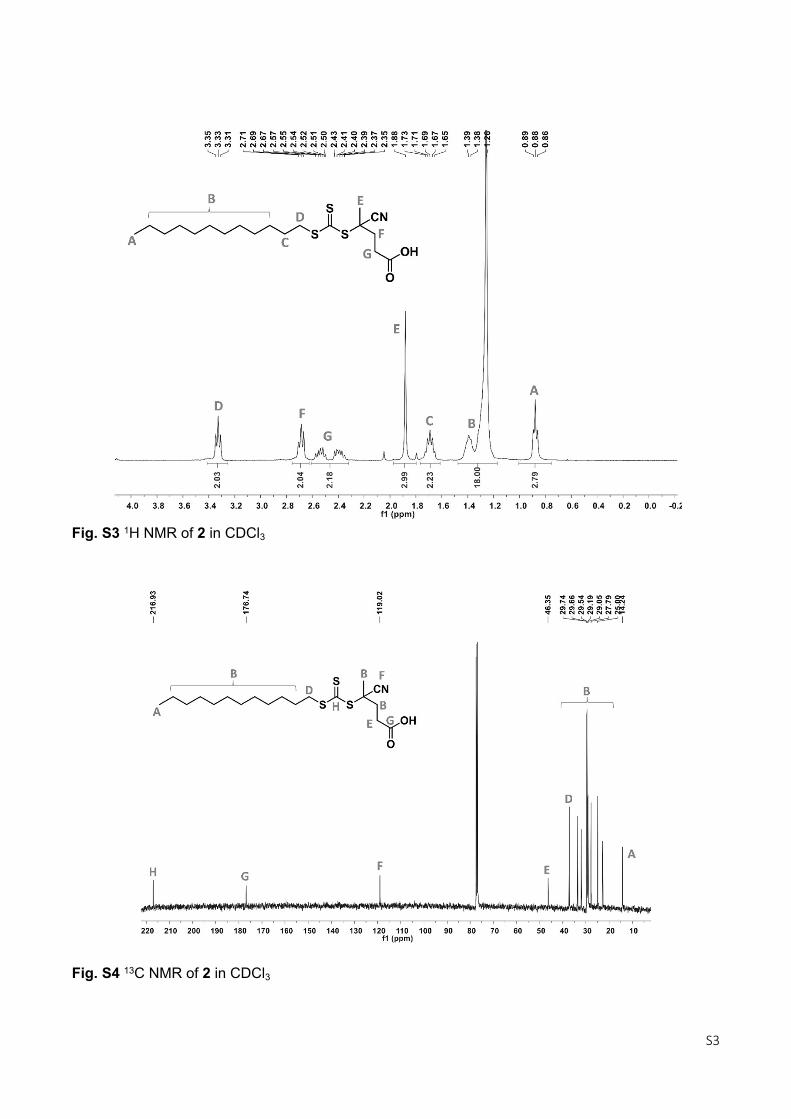
Fig. S3 1H NMR of 2 in CDCl3
Fig. S4 13C NMR of 2 in CDCl3
S4
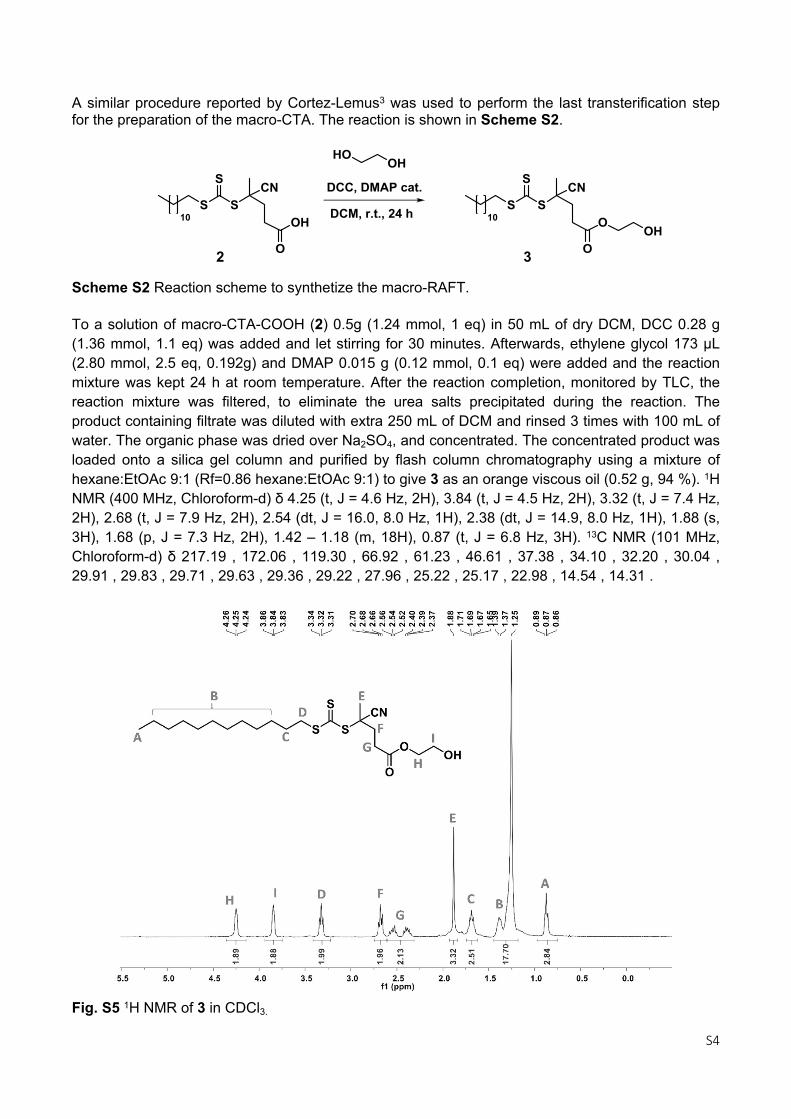
A similar procedure reported by Cortez-Lemus3 was used to perform the last transterification step for the preparation of the macro-CTA. The reaction is shown in Scheme S2.
To a solution of macro-CTA-COOH (2) 0.5g (1.24 mmol, 1 eq) in 50 mL of dry DCM, DCC 0.28 g (1.36 mmol, 1.1 eq) was added and let stirring for 30 minutes. Afterwards, ethylene glycol 173 µL (2.80 mmol, 2.5 eq, 0.192g) and DMAP 0.015 g (0.12 mmol, 0.1 eq) were added and the reaction mixture was kept 24 h at room temperature. After the reaction completion, monitored by TLC, the reaction mixture was filtered, to eliminate the urea salts precipitated during the reaction. The product containing filtrate was diluted with extra 250 mL of DCM and rinsed 3 times with 100 mL of water. The organic phase was dried over Na2SO4, and concentrated. The concentrated product was loaded onto a silica gel column and purified by flash column chromatography using a mixture of hexane:EtOAc 9:1 (Rf=0.86 hexane:EtOAc 9:1) to give 3 as an orange viscous oil (0.52 g, 94 %). 1H NMR (400 MHz, Chloroform-d) δ 4.25 (t, J = 4.6 Hz, 2H), 3.84 (t, J = 4.5 Hz, 2H), 3.32 (t, J = 7.4 Hz, 2H), 2.68 (t, J = 7.9 Hz, 2H), 2.54 (dt, J = 16.0, 8.0 Hz, 1H), 2.38 (dt, J = 14.9, 8.0 Hz, 1H), 1.88 (s, 3H), 1.68 (p, J = 7.3 Hz, 2H), 1.42 – 1.18 (m, 18H), 0.87 (t, J = 6.8 Hz, 3H). 13C NMR (101 MHz, Chloroform-d) δ 217.19 , 172.06 , 119.30 , 66.92 , 61.23 , 46.61 , 37.38 , 34.10 , 32.20 , 30.04 , 29.91 , 29.83 , 29.71 , 29.63 , 29.36 , 29.22 , 27.96 , 25.22 , 25.17 , 22.98 , 14.54 , 14.31 .
Fig. S5 1H NMR of 3 in CDCl3.
Scheme S2 Reaction scheme to synthetize the macro-RAFT.
DCC, DMAP cat.
DCM, r.t., 24 hS S
SCN
OH
O
10
2
S S
SCN
O
O
10
3
OH
HOOH
S5
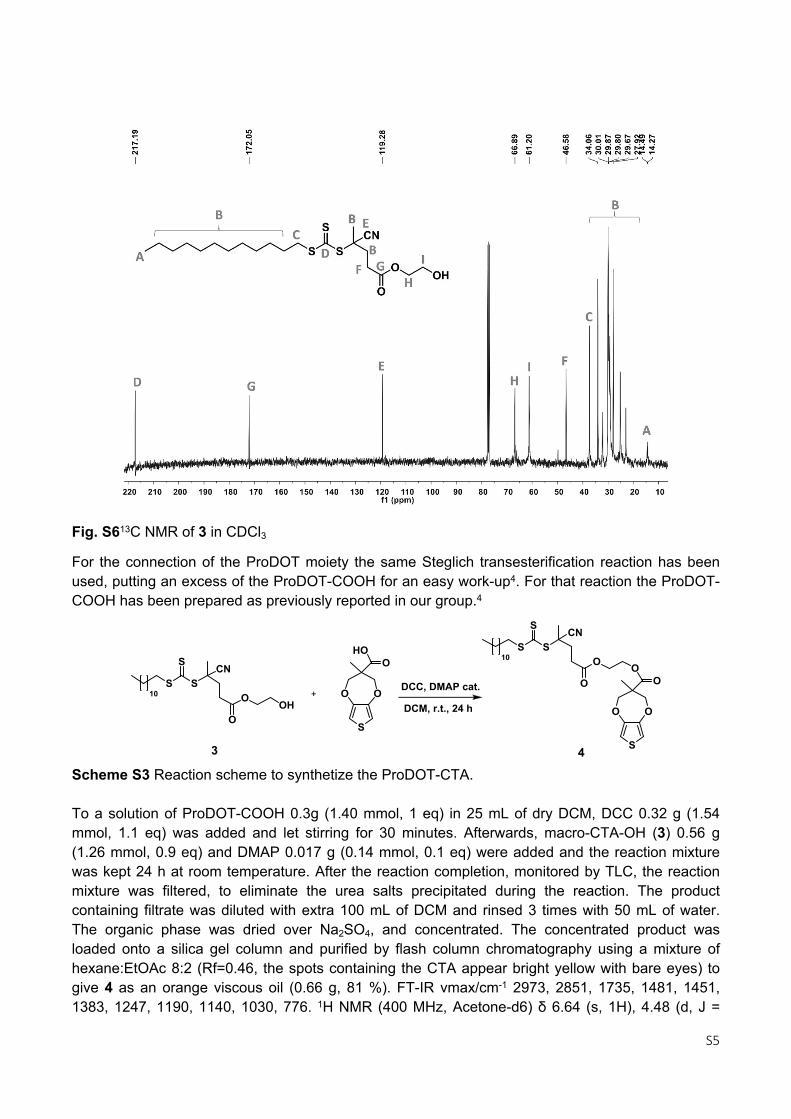
Fig. S613C NMR of 3 in CDCl3
For the connection of the ProDOT moiety the same Steglich transesterification reaction has been used, putting an excess of the ProDOT-COOH for an easy work-up4. For that reaction the ProDOT-COOH has been prepared as previously reported in our group.4
Scheme S3 Reaction scheme to synthetize the ProDOT-CTA.
To a solution of ProDOT-COOH 0.3g (1.40 mmol, 1 eq) in 25 mL of dry DCM, DCC 0.32 g (1.54 mmol, 1.1 eq) was added and let stirring for 30 minutes. Afterwards, macro-CTA-OH (3) 0.56 g (1.26 mmol, 0.9 eq) and DMAP 0.017 g (0.14 mmol, 0.1 eq) were added and the reaction mixture was kept 24 h at room temperature. After the reaction completion, monitored by TLC, the reaction mixture was filtered, to eliminate the urea salts precipitated during the reaction. The product containing filtrate was diluted with extra 100 mL of DCM and rinsed 3 times with 50 mL of water. The organic phase was dried over Na2SO4, and concentrated. The concentrated product was loaded onto a silica gel column and purified by flash column chromatography using a mixture of hexane:EtOAc 8:2 (Rf=0.46, the spots containing the CTA appear bright yellow with bare eyes) to give 4 as an orange viscous oil (0.66 g, 81 %). FT-IR νmax/cm-1 2973, 2851, 1735, 1481, 1451, 1383, 1247, 1190, 1140, 1030, 776. 1H NMR (400 MHz, Acetone-d6) δ 6.64 (s, 1H), 4.48 (d, J =
DCC, DMAP cat.
DCM, r.t., 24 h
S S
SCN
O
O
10
3
OHOO
OHO
S
S S
SCN
O
O
10
OO
OO
S4
S6
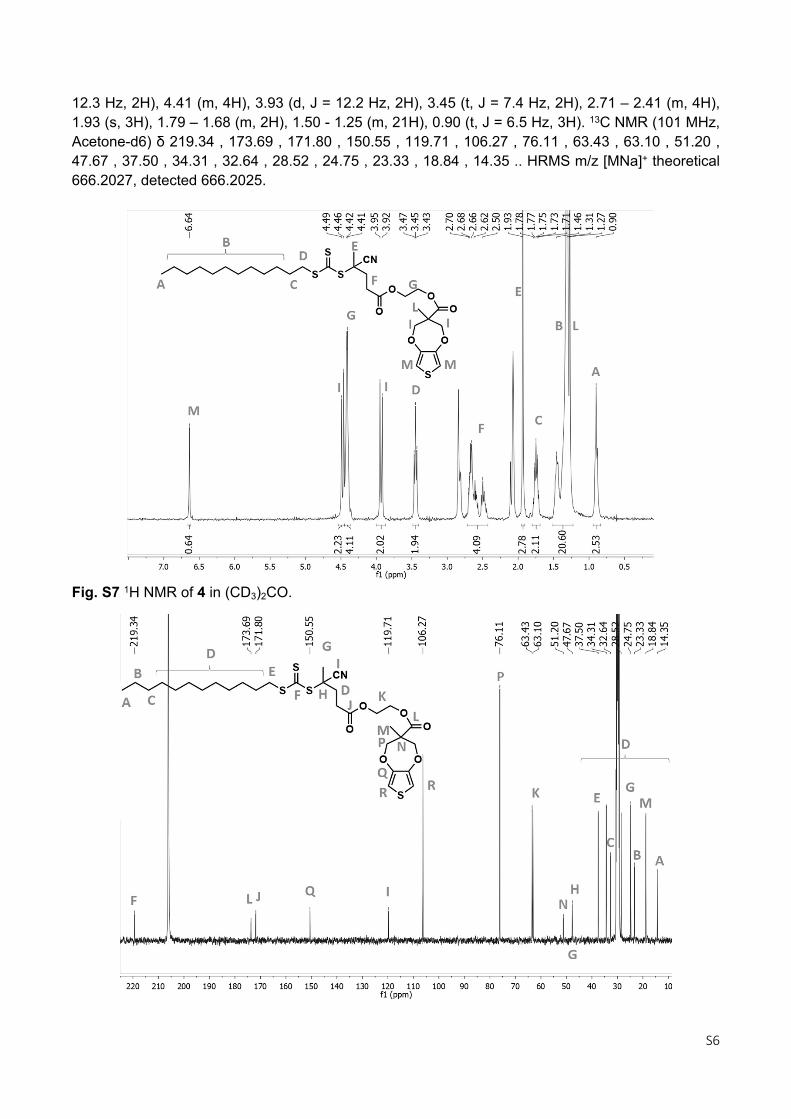
12.3 Hz, 2H), 4.41 (m, 4H), 3.93 (d, J = 12.2 Hz, 2H), 3.45 (t, J = 7.4 Hz, 2H), 2.71 – 2.41 (m, 4H), 1.93 (s, 3H), 1.79 – 1.68 (m, 2H), 1.50 - 1.25 (m, 21H), 0.90 (t, J = 6.5 Hz, 3H). 13C NMR (101 MHz, Acetone-d6) δ 219.34 , 173.69 , 171.80 , 150.55 , 119.71 , 106.27 , 76.11 , 63.43 , 63.10 , 51.20 , 47.67 , 37.50 , 34.31 , 32.64 , 28.52 , 24.75 , 23.33 , 18.84 , 14.35 .. HRMS m/z [MNa]+ theoretical 666.2027, detected 666.2025.
Fig. S7 1H NMR of 4 in (CD3)2CO.
S7
Fig. S8 13C NMR of 4 in (CD3)2CO
3. Synthesis of ProDOT end capped functional electroactive macromonomers
3.1. ProDOT-POEGMA macromonomer
1.01.52.02.53.03.54.04.55.05.56.06.5f1 (ppm)
b
d
b
e
f
gc
a
j k
h
i
S
OO
OO
O
ONC
S S C11H23
SO
O n
7-8
O
O
OCH3
aa
bb
ccd efg
hh
ii
j
k
j
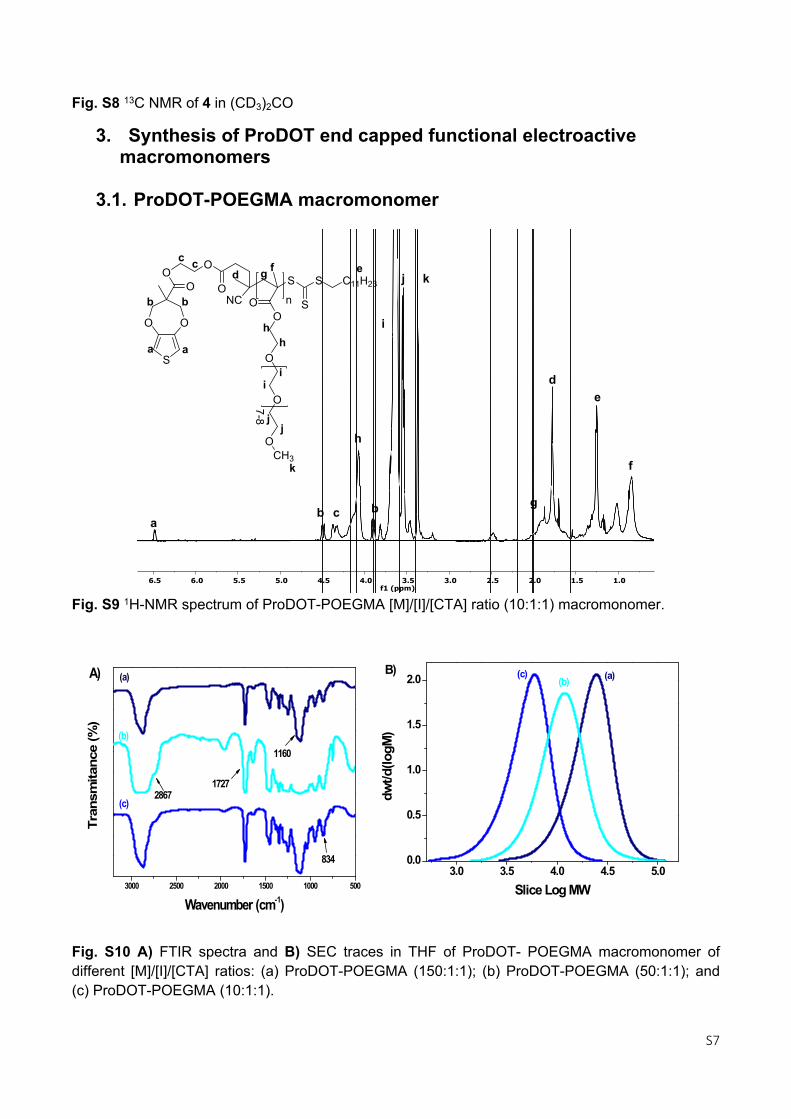
Fig. S9 1H-NMR spectrum of ProDOT-POEGMA [M]/[I]/[CTA] ratio (10:1:1) macromonomer.
3000 2500 2000 1500 1000 500
1160
2867
834
Tran
smita
nce
(%)
Wavenumber (cm-1)
(a)
(b)
(c)
1727
A)
3.0 3.5 4.0 4.5 5.00.0
0.5
1.0
1.5
2.0 (c)(b)
dwt/d
(logM
)
Slice Log MW
(a)B)
Fig. S10 A) FTIR spectra and B) SEC traces in THF of ProDOT- POEGMA macromonomer of different [M]/[I]/[CTA] ratios: (a) ProDOT-POEGMA (150:1:1); (b) ProDOT-POEGMA (50:1:1); and (c) ProDOT-POEGMA (10:1:1).
S8
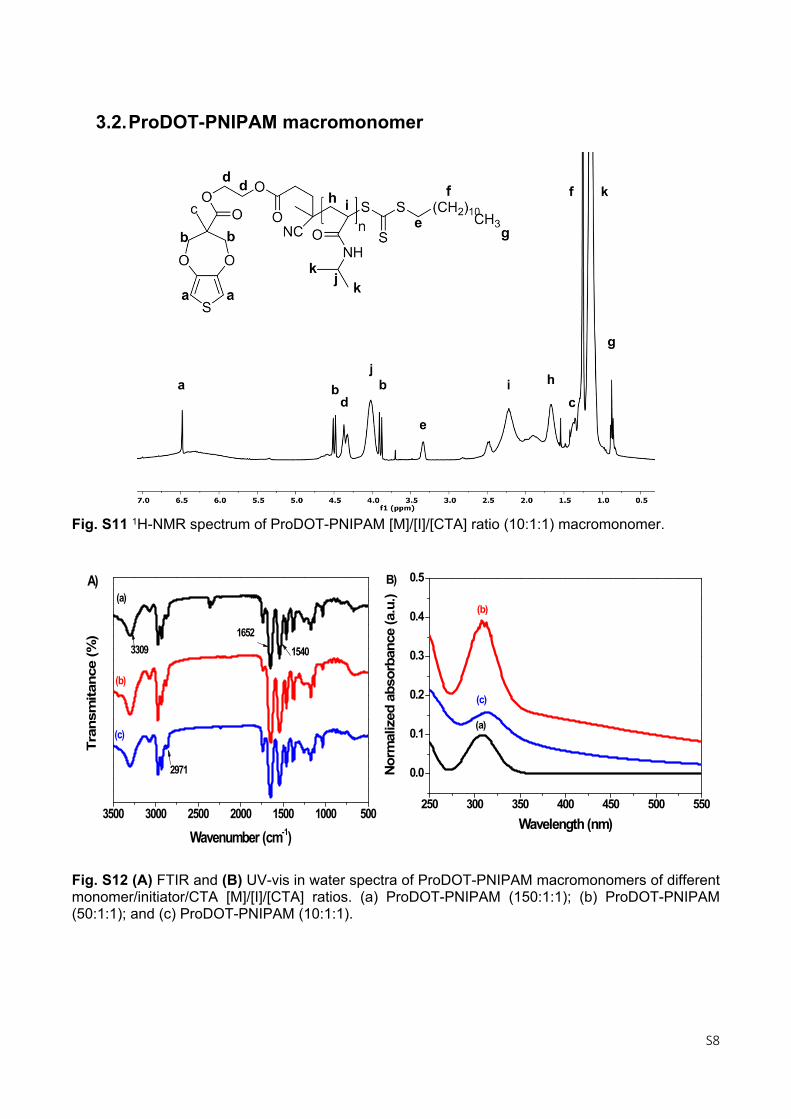
3.2.ProDOT-PNIPAM macromonomer
Fig. S11 1H-NMR spectrum of ProDOT-PNIPAM [M]/[I]/[CTA] ratio (10:1:1) macromonomer.
3500 3000 2500 2000 1500 1000 500
1540
Tran
smita
nce
(%)
Wavenumber (cm-1)
(a)
(b)
(c)
1652
2971
3309
A)
250 300 350 400 450 500 550
0.0
0.1
0.2
0.3
0.4
0.5
(c)
(b)
Norm
aliz
ed a
bsor
banc
e (a
.u.)
Wavelength (nm)
(a)
B)
Fig. S12 (A) FTIR and (B) UV-vis in water spectra of ProDOT-PNIPAM macromonomers of different monomer/initiator/CTA [M]/[I]/[CTA] ratios. (a) ProDOT-PNIPAM (150:1:1); (b) ProDOT-PNIPAM (50:1:1); and (c) ProDOT-PNIPAM (10:1:1).
S9
300 400 500
0.0
0.5
1.0
Nor
mal
ized
abs
orba
nce
(a.u
.)
Wavelength (nm)
21-28 ªC 29 ºC 30 ºC 31 ºC
300 400 500
0.0
0.5
1.0 19ºC 21ºC 22ºC 23ºC 24ºC 25ºC 26ºC
N
orm
aliz
ed a
bsor
banc
e (a
.u.)
Wavelength (nm)
(A) (B)
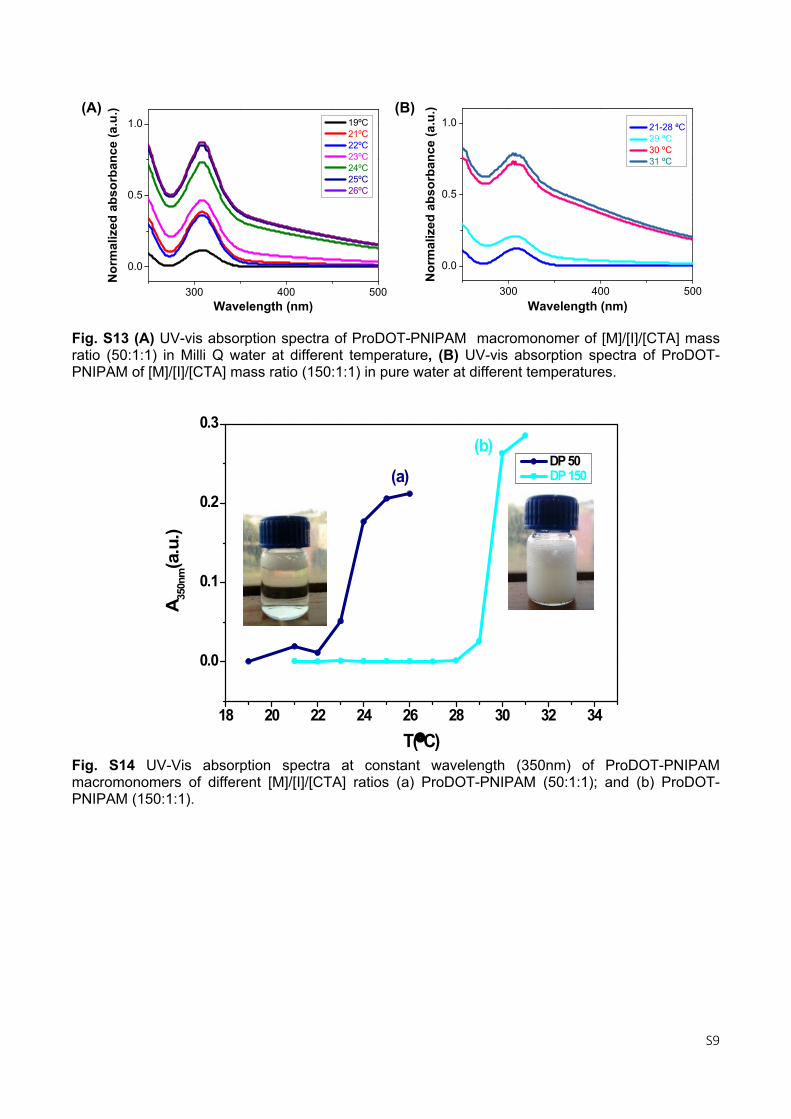
Fig. S13 (A) UV-vis absorption spectra of ProDOT-PNIPAM macromonomer of [M]/[I]/[CTA] mass ratio (50:1:1) in Milli Q water at different temperature, (B) UV-vis absorption spectra of ProDOT-PNIPAM of [M]/[I]/[CTA] mass ratio (150:1:1) in pure water at different temperatures.
18 20 22 24 26 28 30 32 34
0.0
0.1
0.2
0.3(b)
A 350n
m(a
.u.)
T(C)
DP 50 DP 150 (a)
Fig. S14 UV-Vis absorption spectra at constant wavelength (350nm) of ProDOT-PNIPAM macromonomers of different [M]/[I]/[CTA] ratios (a) ProDOT-PNIPAM (50:1:1); and (b) ProDOT- PNIPAM (150:1:1).
S10
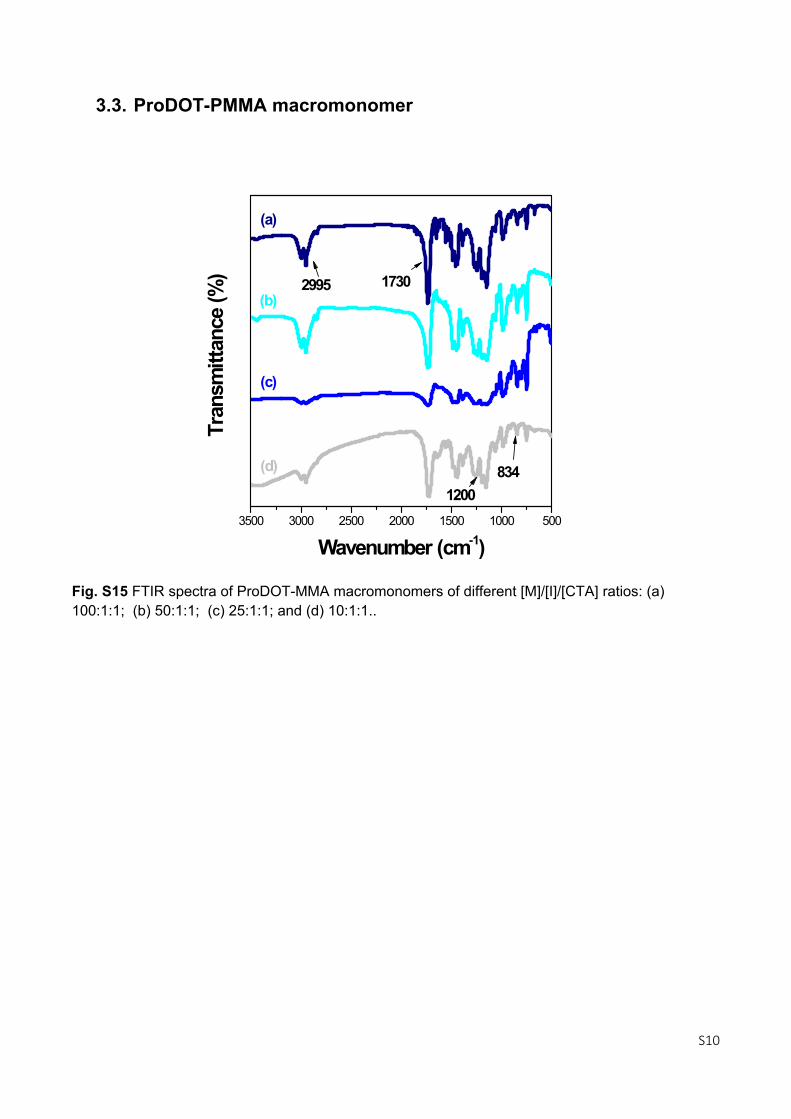
3.3. ProDOT-PMMA macromonomer
3500 3000 2500 2000 1500 1000 500
8341200
Tran
smitt
ance
(%)
Wavenumber (cm-1)
(a)
(b)
(c)
(d)
17302995
Fig. S15 FTIR spectra of ProDOT-MMA macromonomers of different [M]/[I]/[CTA] ratios: (a) 100:1:1; (b) 50:1:1; (c) 25:1:1; and (d) 10:1:1..
S11
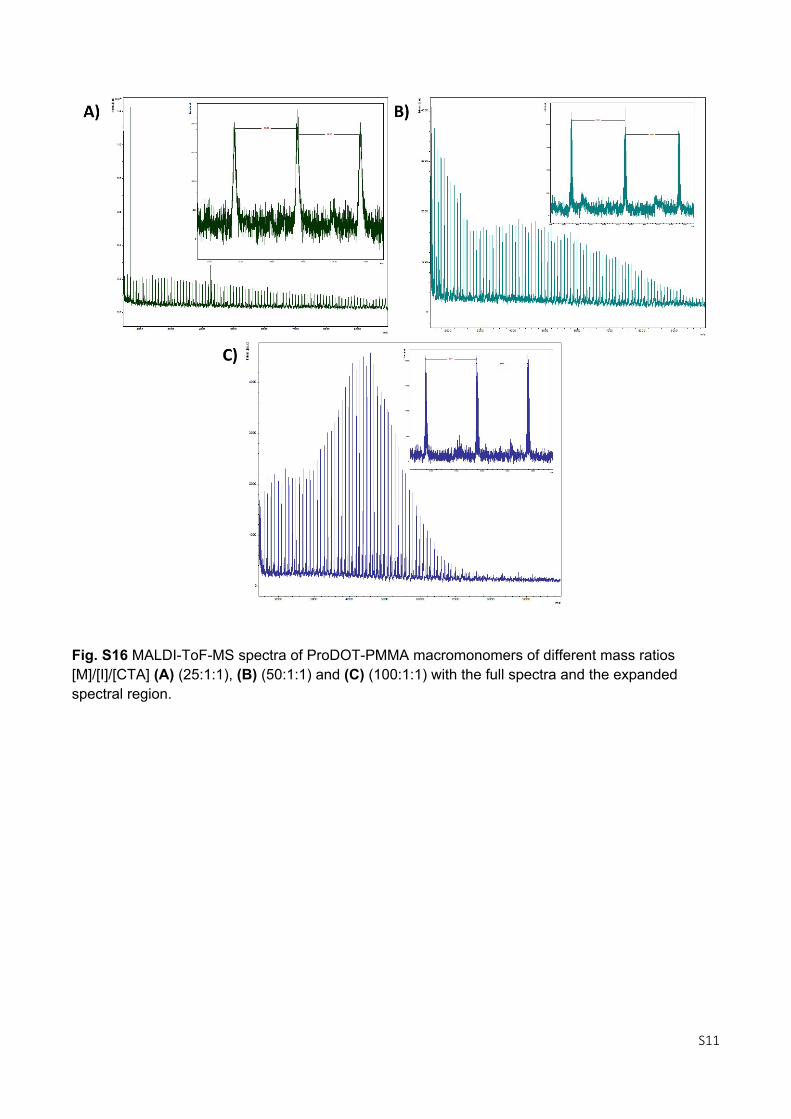
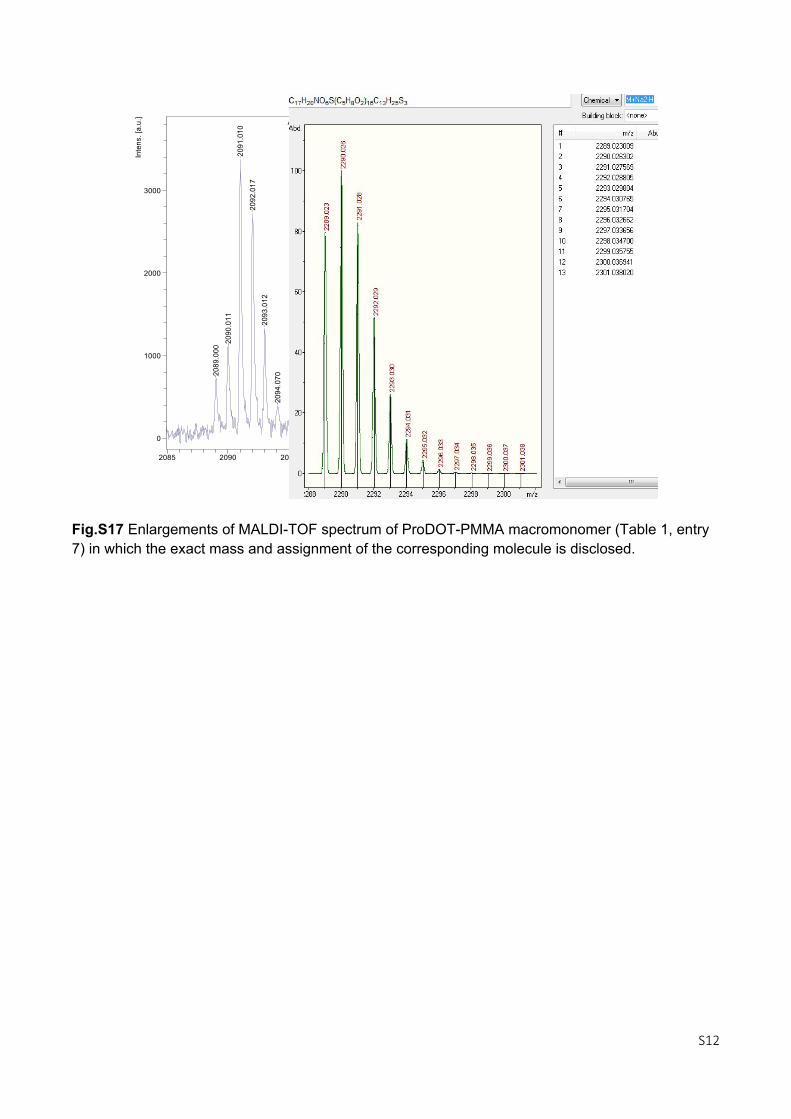
Fig. S16 MALDI-ToF-MS spectra of ProDOT-PMMA macromonomers of different mass ratios [M]/[I]/[CTA] (A) (25:1:1), (B) (50:1:1) and (C) (100:1:1) with the full spectra and the expanded spectral region.
S12
2091
.010
2092
.017
2093
.012
2090
.011
2089
.000
2094
.070
AS13cal DCTB NaTFA 1kDaDef 50Pot 1-10kDa 10kshots RP 0:J13 MS, BaselineSubtracted
0
1000
2000
3000
Inte
ns. [
a.u.
]
2085 2090 2095 2100 2105 2110 2115m/z
Fig.S17 Enlargements of MALDI-TOF spectrum of ProDOT-PMMA macromonomer (Table 1, entry 7) in which the exact mass and assignment of the corresponding molecule is disclosed.
S13
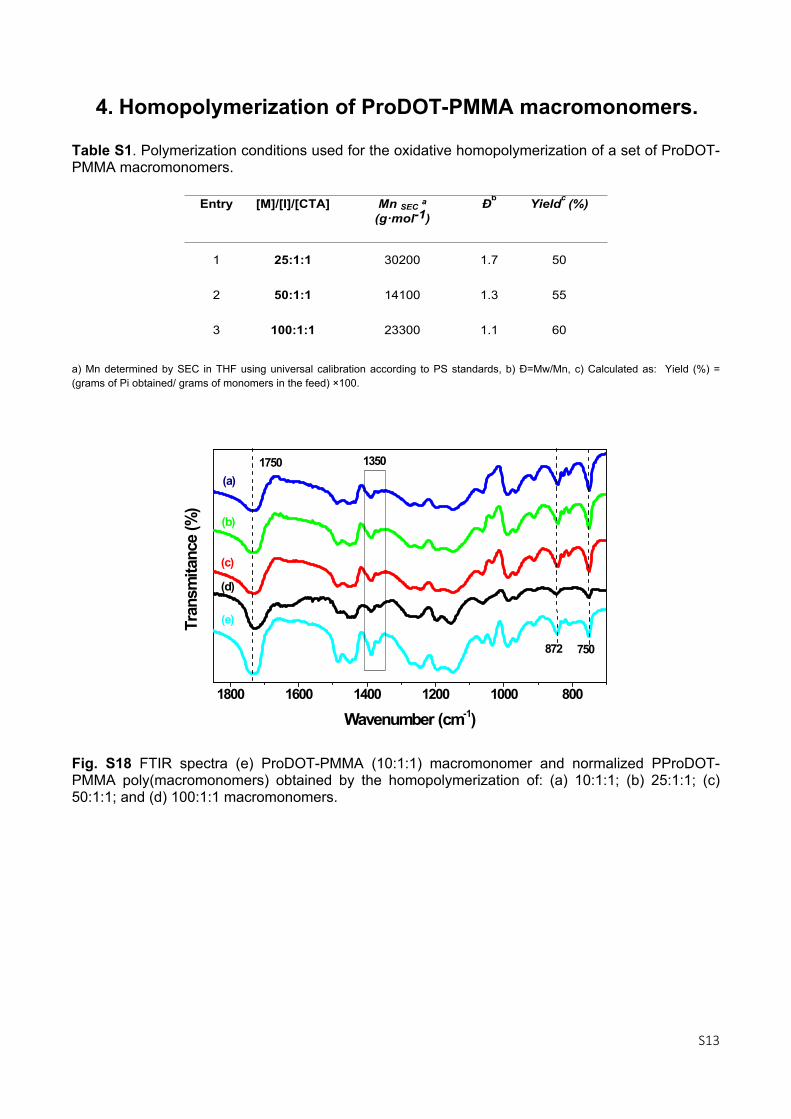
4. Homopolymerization of ProDOT-PMMA macromonomers.
Table S1. Polymerization conditions used for the oxidative homopolymerization of a set of ProDOT-PMMA macromonomers.
a) Mn determined by SEC in THF using universal calibration according to PS standards, b) Ð=Mw/Mn, c) Calculated as: Yield (%) = (grams of Pi obtained/ grams of monomers in the feed) ×100.
1800 1600 1400 1200 1000 800
1350
750872
(e)
(d)
(c)
(b)
Tran
smita
nce
(%)
Wavenumber (cm-1)
(a)1750
Fig. S18 FTIR spectra (e) ProDOT-PMMA (10:1:1) macromonomer and normalized PProDOT-PMMA poly(macromonomers) obtained by the homopolymerization of: (a) 10:1:1; (b) 25:1:1; (c) 50:1:1; and (d) 100:1:1 macromonomers.
Entry [M]/[I]/[CTA] Mn SEC a(g·mol-1)
Ðb Yieldc (%)
1 25:1:1 30200 1.7 50
2 50:1:1 14100 1.3 55
3 100:1:1 23300 1.1 60
S14
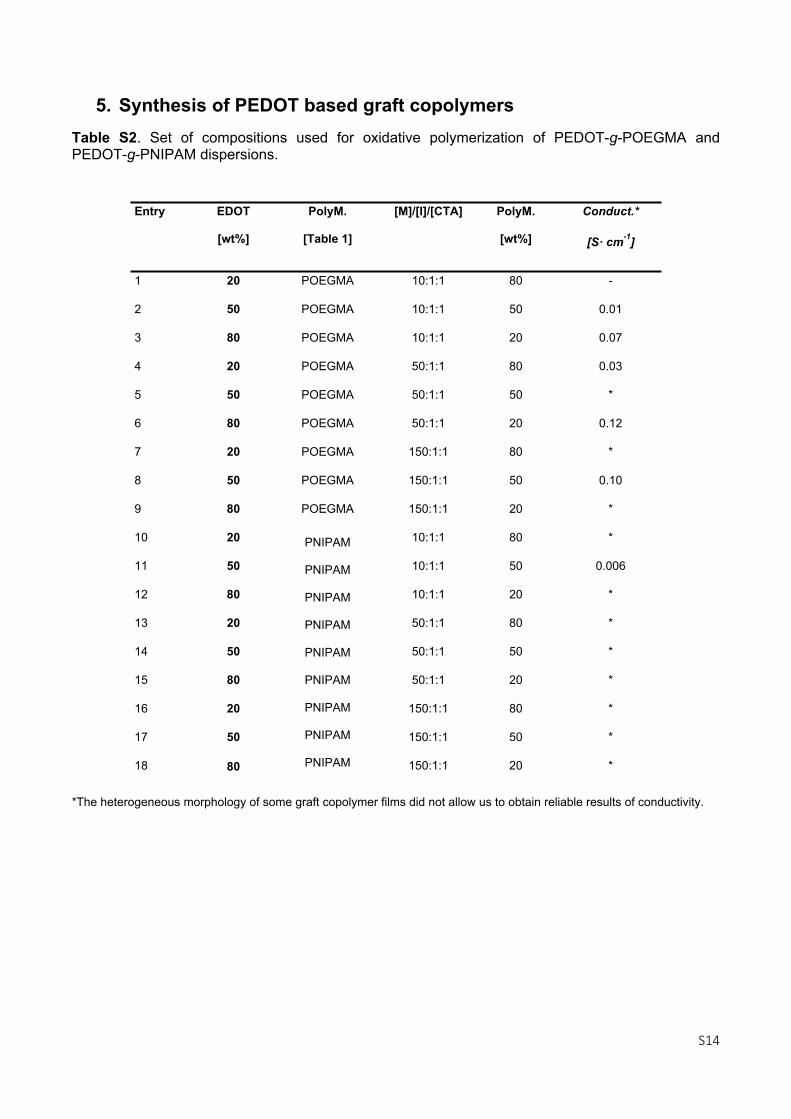
5. Synthesis of PEDOT based graft copolymersTable S2. Set of compositions used for oxidative polymerization of PEDOT-g-POEGMA and PEDOT-g-PNIPAM dispersions.
*The heterogeneous morphology of some graft copolymer films did not allow us to obtain reliable results of conductivity.
Entry EDOT
[wt%]
PolyM.
[Table 1]
[M]/[I]/[CTA] PolyM.
[wt%]
Conduct.*
[S· cm-1]
1 20 POEGMA 10:1:1 80 -
2 50 POEGMA 10:1:1 50 0.01
3 80 POEGMA 10:1:1 20 0.07
4 20 POEGMA 50:1:1 80 0.03
5 50 POEGMA 50:1:1 50 *
6 80 POEGMA 50:1:1 20 0.12
7 20 POEGMA 150:1:1 80 *
8 50 POEGMA 150:1:1 50 0.10
9 80 POEGMA 150:1:1 20 *
10 20 10:1:1 80 *
11 50 10:1:1 50 0.006
12 80 10:1:1 20 *
13 20 50:1:1 80 *
14 50 50:1:1 50 *
15 80 50:1:1 20 *
16 20 150:1:1 80 *
17 50 150:1:1 50 *
18 80
PNIPAM
PNIPAM
PNIPAM
PNIPAM
PNIPAM
PNIPAM
PNIPAM
PNIPAM
PNIPAM 150:1:1 20 *
S15
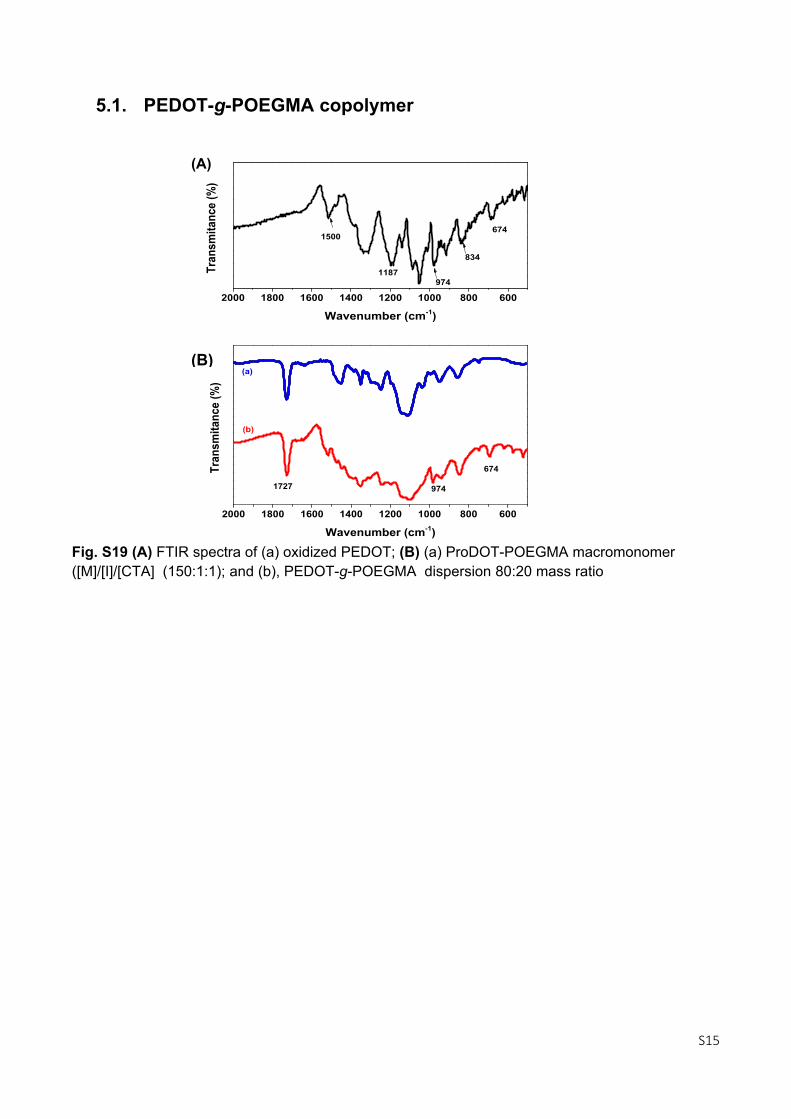
5.1. PEDOT-g-POEGMA copolymer
2000 1800 1600 1400 1200 1000 800 600
1187
1500674
974
Tran
smita
nce
(%)
Wavenumber (cm-1)
834
2000 1800 1600 1400 1200 1000 800 600
(b)
974
Tran
smita
nce
(%)
Wavenumber (cm-1)
1727
674
(a)
(A)
(B)
Fig. S19 (A) FTIR spectra of (a) oxidized PEDOT; (B) (a) ProDOT-POEGMA macromonomer ([M]/[I]/[CTA] (150:1:1); and (b), PEDOT-g-POEGMA dispersion 80:20 mass ratio
S16
A
500 nm
B
500 nm
C
200 nm
A
500 nm
200 nm
(A)B
(B)
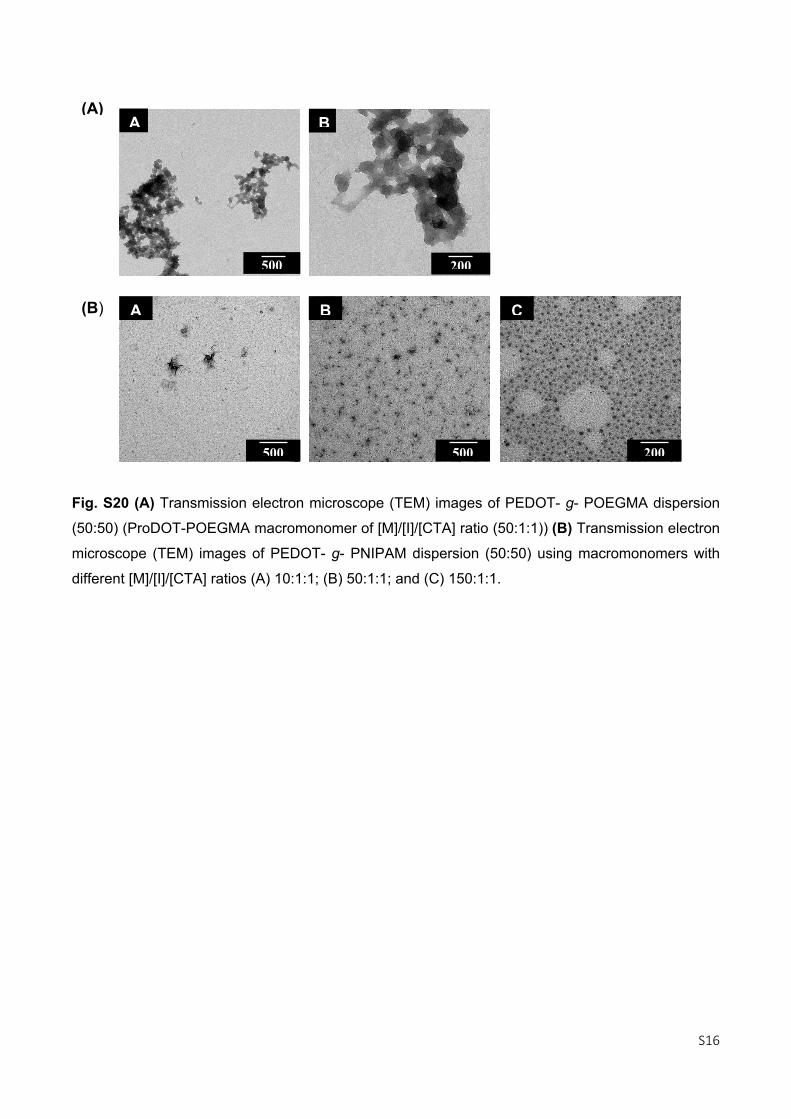
Fig. S20 (A) Transmission electron microscope (TEM) images of PEDOT- g- POEGMA dispersion
(50:50) (ProDOT-POEGMA macromonomer of [M]/[I]/[CTA] ratio (50:1:1)) (B) Transmission electron
microscope (TEM) images of PEDOT- g- PNIPAM dispersion (50:50) using macromonomers with
different [M]/[I]/[CTA] ratios (A) 10:1:1; (B) 50:1:1; and (C) 150:1:1.
S17
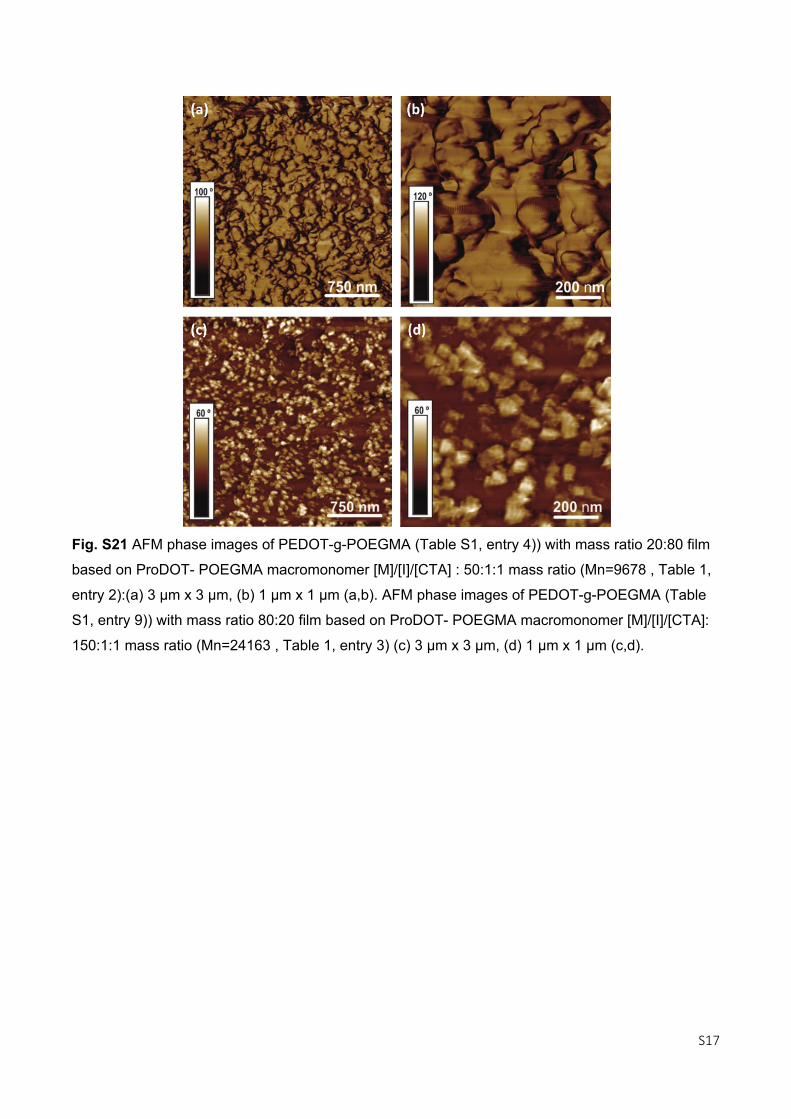
Fig. S21 AFM phase images of PEDOT-g-POEGMA (Table S1, entry 4)) with mass ratio 20:80 film
based on ProDOT- POEGMA macromonomer [M]/[I]/[CTA] : 50:1:1 mass ratio (Mn=9678 , Table 1,
entry 2):(a) 3 µm x 3 µm, (b) 1 µm x 1 µm (a,b). AFM phase images of PEDOT-g-POEGMA (Table
S1, entry 9)) with mass ratio 80:20 film based on ProDOT- POEGMA macromonomer [M]/[I]/[CTA]:
150:1:1 mass ratio (Mn=24163 , Table 1, entry 3) (c) 3 µm x 3 µm, (d) 1 µm x 1 µm (c,d).
S18
5.2. PEDOT-g-PNIPAM copolymer
200 400 600 800 1000 1200 1400
0,0
0,2
0,4
0,6
0,8
1,0 Doped PEDOT 80:20 (150) 80:20 (50) 50:50 (150) 80:20 (10) 20:80 (150) PNIPAM (150)
Abs
orba
nce
(a.u
.)
Wavelength (cm-1)
(a)
(b)
(c)
(d)
(e)(f)
(g)
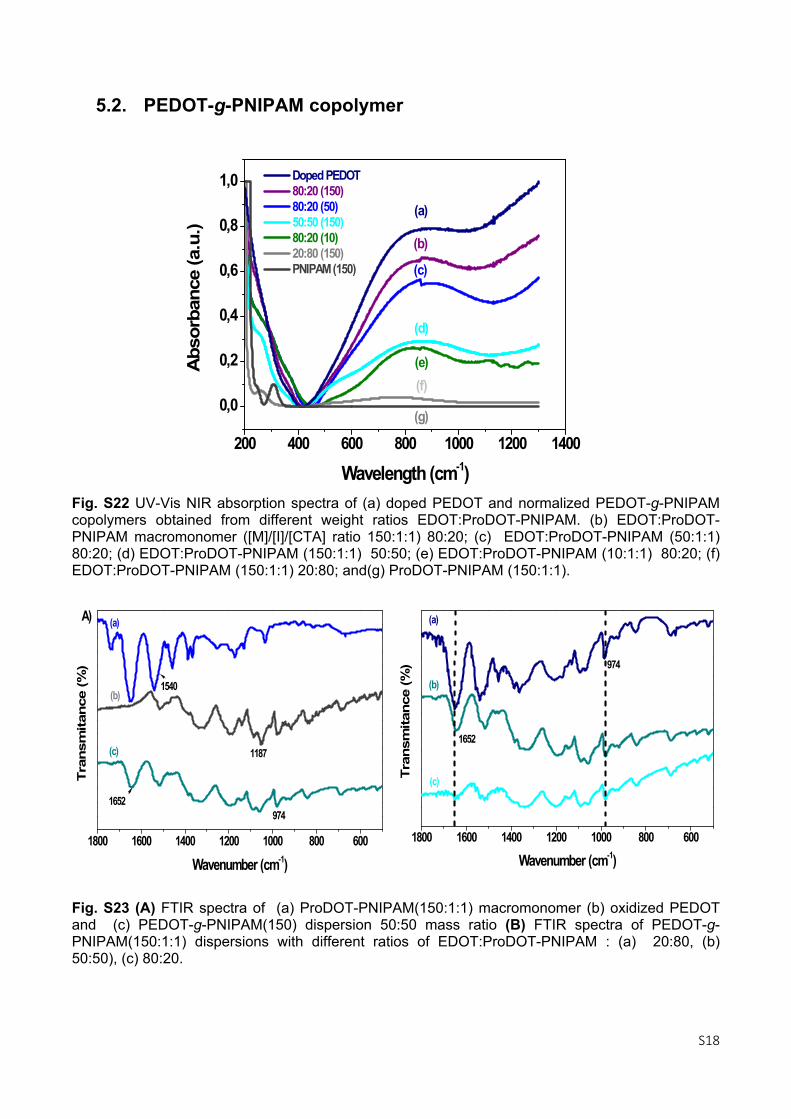
Fig. S22 UV-Vis NIR absorption spectra of (a) doped PEDOT and normalized PEDOT-g-PNIPAM copolymers obtained from different weight ratios EDOT:ProDOT-PNIPAM. (b) EDOT:ProDOT-PNIPAM macromonomer ([M]/[I]/[CTA] ratio 150:1:1) 80:20; (c) EDOT:ProDOT-PNIPAM (50:1:1) 80:20; (d) EDOT:ProDOT-PNIPAM (150:1:1) 50:50; (e) EDOT:ProDOT-PNIPAM (10:1:1) 80:20; (f) EDOT:ProDOT-PNIPAM (150:1:1) 20:80; and(g) ProDOT-PNIPAM (150:1:1).
1800 1600 1400 1200 1000 800 600
(c)
(b)
Tra
nsm
itan
ce (%
)
Wavenumber (cm-1)
9741652
1540
1187
(a)A)
1800 1600 1400 1200 1000 800 600
1652
(c)
(b)
Tran
smita
nce
(%)
Wavenumber (cm-1)
(a)
974
Fig. S23 (A) FTIR spectra of (a) ProDOT-PNIPAM(150:1:1) macromonomer (b) oxidized PEDOT and (c) PEDOT-g-PNIPAM(150) dispersion 50:50 mass ratio (B) FTIR spectra of PEDOT-g-PNIPAM(150:1:1) dispersions with different ratios of EDOT:ProDOT-PNIPAM : (a) 20:80, (b) 50:50), (c) 80:20.
S19
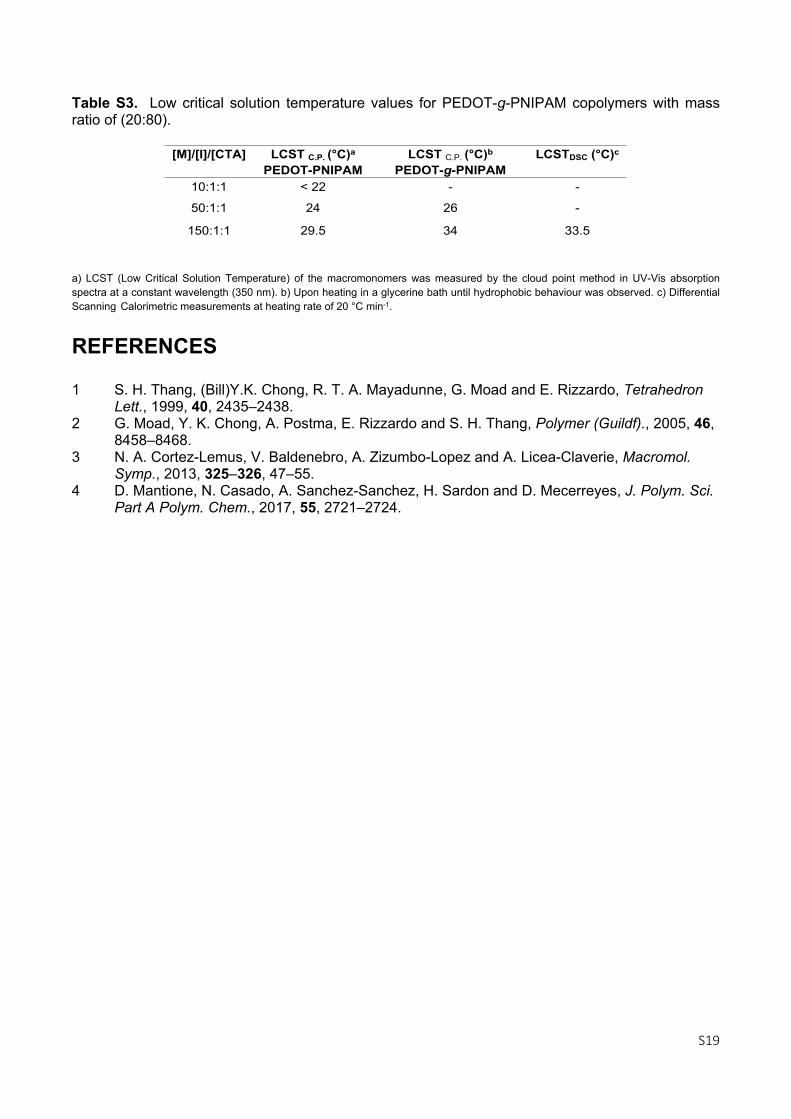
Table S3. Low critical solution temperature values for PEDOT-g-PNIPAM copolymers with mass ratio of (20:80).
a) LCST (Low Critical Solution Temperature) of the macromonomers was measured by the cloud point method in UV-Vis absorption spectra at a constant wavelength (350 nm). b) Upon heating in a glycerine bath until hydrophobic behaviour was observed. c) Differential Scanning Calorimetric measurements at heating rate of 20 °C min-1.
REFERENCES
1 S. H. Thang, (Bill)Y.K. Chong, R. T. A. Mayadunne, G. Moad and E. Rizzardo, Tetrahedron Lett., 1999, 40, 2435–2438.
2 G. Moad, Y. K. Chong, A. Postma, E. Rizzardo and S. H. Thang, Polymer (Guildf)., 2005, 46, 8458–8468.
3 N. A. Cortez-Lemus, V. Baldenebro, A. Zizumbo-Lopez and A. Licea-Claverie, Macromol. Symp., 2013, 325–326, 47–55.
4 D. Mantione, N. Casado, A. Sanchez-Sanchez, H. Sardon and D. Mecerreyes, J. Polym. Sci. Part A Polym. Chem., 2017, 55, 2721–2724.
[M]/[I]/[CTA] LCST C.P. (°C)a PEDOT-PNIPAM
LCST C.P. (°C)b
PEDOT-g-PNIPAM LCSTDSC (°C)c
10:1:1 < 22 - -
50:1:1 24 26 -
150:1:1 29.5 34 33.5