Companies' Italian market - Politecnico di Milano · Su questo concetto basilare si fonda...
107
POLITECNICO DI MILANO Scuola di Ingegneria Industriale e dell’Informazione Corso di Laurea Magistrale in Ingegneria Gestionale “Analysis and evolution of the Energy Service Companies' Italian market” Relatore: Prof. Davide CHIARONI Autore: Michele Bassi Matr. 837629 Anno Accademico 2015 – 2016
Transcript of Companies' Italian market - Politecnico di Milano · Su questo concetto basilare si fonda...

POLITECNICO DI MILANO
Scuola di Ingegneria Industriale e dell’Informazione
Corso di Laurea Magistrale in
Ingegneria Gestionale
“Analysis and evolution of the Energy Service
Companies' Italian market”
Relatore: Prof. Davide CHIARONI
Autore: Michele Bassi
Matr. 837629
Anno Accademico 2015 – 2016

2
SUMMARY
1. Figures index ........................................................................................... 4
2. Tables index ............................................................................................. 6
3. Acronyms index ...................................................................................... 7
4. Abstract .................................................................................................... 8
5. Abstract (Italian version) ........................................................................ 9
6. General introduction ............................................................................. 10
7. Introduction and contextualization of the market .............................. 11
7.1 The energy efficiency target and the role of the ESCos .................... 11
7.2 What is an ESCo ............................................................................... 14
7.2.1 Definitions ........................................................................................... 14
7.2.2 Classifications and business models ................................................... 19
7.3 The contracts ..................................................................................... 24
7.3.1 Contracts typologies and financing modes .......................................... 24
7.3.2 The contracts related risks .................................................................. 29
7.3.3 SPINs and EPC+ contracts ................................................................. 32
8. Practical example of an energy efficiency project ............................. 36
9. The state-of-the-art of the Italian Energy Efficiency market .............. 42
10. Methodology of the analysis .............................................................. 58
11. The ESCo-market analysis by industry and by technology ............. 64
11.1 Results and comments by industry .................................................. 64
11.1.1 The “revenues-proportional” approach .............................................. 64
11.1.2 The “absolute percentage” approach ................................................. 70
11.2 Results and comments by technology ............................................. 73
11.2.1 The “revenues-proportional” approach .............................................. 73
11.2.2 The “absolute percentage” approach ................................................. 77
11.3 Results and comments per specific sectors and tecnologies .......... 81
12. ESCos’ market analysis by contract .................................................. 83
12.1 Results and comments .................................................................... 83

3
SUMMARY
13. Insights and trends ............................................................................. 88
13.1 Energy Service Companies and Small-Medium Enterprises ........... 88
13.2 Energy Service Companies and Logistics ....................................... 94
14. Conclusions and future perspectives ............................................... 99
15. Bibliography ...................................................................................... 104

4
1. FIGURES INDEX
Fig.1 The 20-20-20 targets.......................................................................... 11
Fig.2 The specialized operators’ market composition ................................. 21
Fig.3 The integrated operators’ market composition ................................... 21
Fig.4 The Energy Efficiency Service Providers’ market .............................. 22
Fig.5 The target markets ............................................................................. 23
Fig.6 Third parties financing with ESCo borrowing. ..................................... 28
Fig.7 Third parties financing with energy user/customer borrowing ............ 29
Fig.8 The phases of an energy efficiency project ........................................ 36
Fig.9 The phases of an energy efficiency project ........................................ 36
Fig.10 The growth of the Italian market for energy efficiency ...................... 44
Fig.11 The partitioning of the investments per sector ................................. 45
Fig.12 The partitioning of the investments per technology .......................... 46
Fig.13 The investments in GDO and Hotels ................................................ 50
Fig.14 Detailed investments of Food Industry ............................................. 51
Fig.15 Detailed investments of Paper Industry............................................ 51
Fig.16 Detailed Investments of Chemical Industry ...................................... 51
Fig.17 Detailed investments of Mechanical Industry ................................... 52
Fig.18 Detailed investments of Products for Metallurgy Industry ................ 52
Fig.19 Detailed investments of Products for Building Industry .................... 52
Fig.20 Detailed investments of Glass Industry ............................................ 53
Fig.21 Detailed investments of the GDO industry ....................................... 53
Fig.22 Detailed investments of the Hotel Industry ....................................... 53
Fig.23 The ESCos incidence on core and non-core activities ..................... 54
Fig.24 The incidence of the TEE on the investments .................................. 56
Fig.25 The revenues of the sample per industry ......................................... 64
Fig.26 The revenues of the market per industry (1st approach) .................. 68
Fig.27 The revenues of the market per industry (2nd approach) .................. 72
Fig.28 The revenues of the sample per technology .................................... 73
Fig.29 The revenues of the market per technology (1st approach) ............. 77

5
1. FIGURES INDEX
Fig.30 The revenues of the market per technology (2nd approach) ............. 79
Fig.31 The partitioning of the contracts typologies ...................................... 84
Fig.32 The revenues of the market per contract typology ........................... 85
Fig.33 Relations between barriers and drivers for energy efficiency ........... 91
Fig.34 Relations between ESCos and drivers for energy efficiency ............ 93

6
2. TABLES INDEX
Tab.1 Activities and phases of typical intervention ...................................... 16
Tab.2 Activities and phases of a typical intervention ................................... 16
Tab.3 The specialized operators’ activities ................................................. 19
Tab.4 The integrated operators’ activities ................................................... 20
Tab.5 The contracts’ typologies .................................................................. 32
Tab.6 SPIN’s strength and weaknesses ..................................................... 34
Tab.7 SPIN’s opportunities and threats ....................................................... 35
Tab.8 Economic evaluation of an energy efficiency project ........................ 39
Tab.9 Total energy consumption per industry ............................................. 42
Tab.10 The partitioning of the Italian market for energy efficiency .............. 44
Tab.11 The inclination index towards energy efficiency .............................. 48
Tab.12 The inclination index for GDO and Hotels ....................................... 50
Tab.13 The revenues of the sample ............................................................ 63
Tab.14 The revenues of the sample ............................................................ 63
Tab 15-16 Investments and revenues rankings .......................................... 69
Tab 17 The revenues rankings .................................................................... 70
Tab 18 The shares of revenues per sector ................................................. 71
Tab 19 The shares of revenues per technology .......................................... 78
Tab 20 The revenues of the market ............................................................ 81
Tab 21 The revenues of the market ............................................................ 81
Tab 22 Categories of logistics operators ..................................................... 97
7
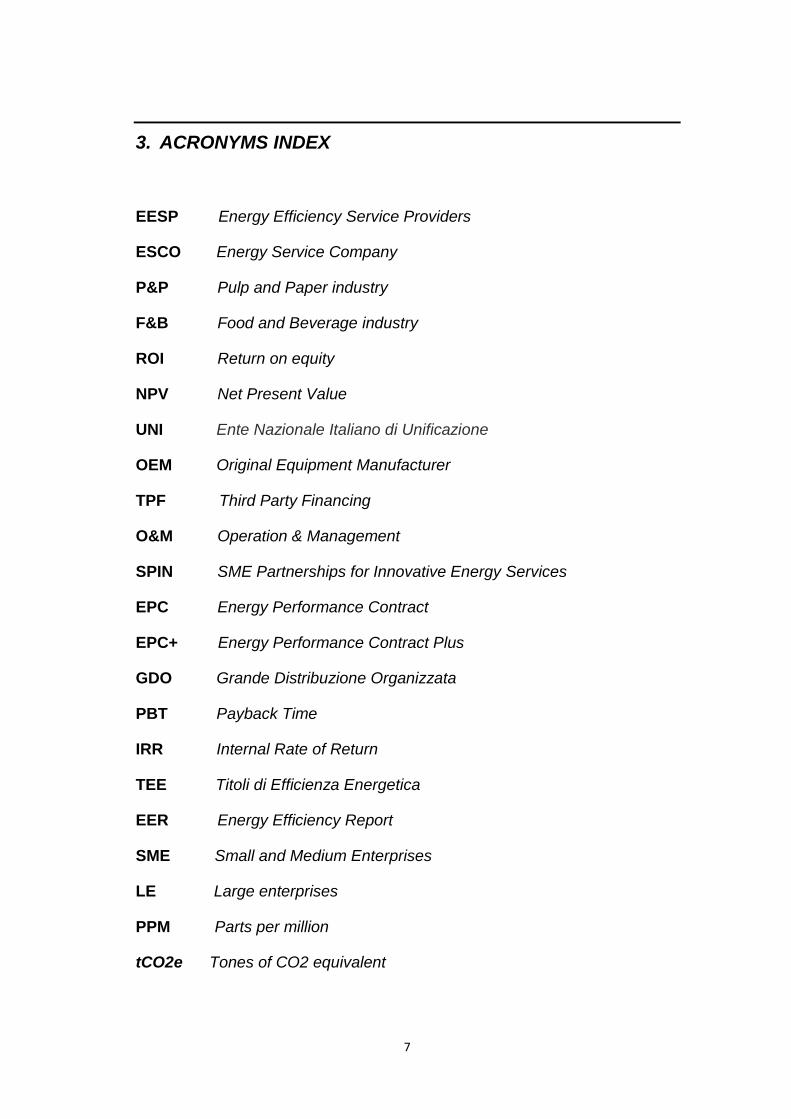
3. ACRONYMS INDEX
EESP Energy Efficiency Service Providers
ESCO Energy Service Company
P&P Pulp and Paper industry
F&B Food and Beverage industry
ROI Return on equity
NPV Net Present Value
UNI Ente Nazionale Italiano di Unificazione
OEM Original Equipment Manufacturer
TPF Third Party Financing
O&M Operation & Management
SPIN SME Partnerships for Innovative Energy Services
EPC Energy Performance Contract
EPC+ Energy Performance Contract Plus
GDO Grande Distribuzione Organizzata
PBT Payback Time
IRR Internal Rate of Return
TEE Titoli di Efficienza Energetica
EER Energy Efficiency Report
SME Small and Medium Enterprises
LE Large enterprises
PPM Parts per million
tCO2e Tones of CO2 equivalent
8
4. ABSTRACT
The concept of energy efficiency must not be confused with the “energy
conservation” one; with this one indeed, it is meant a decrease in consumption
which, not necessarily, coincide with the subsistence of the expected level of
performance. To switch-off lights at home it’s energy conservation; to
substitute an hold lamp with a LED one, and keep it switched-on for the same
time, it’ energy efficiency.
The actions of Energy Service Companies are based on this fundamental but
simple concept: to grant an equal (or even better) level of performance to the
customer, compared to a decrease in consumptions, and, consequently, in
the energy costs. The appropriation of a quote of the savings is the key to
success of this business model and it allows to offer to the customer “cash-
free” installations.
This thesis work, basing on previous industries classification studies, wants to
deepen the way ESCos interface with customers in the real world and how
they face the intrinsic complexity of the energy efficiency market. As shown in
the literature indeed, in this field there are many possible business models, as
well as many specific know-hows, portfolio of offered services and levels of
integration. About that, the ultimate goal of this thesis won’t be the one of
purposing further categorizations, but instead the one of analyzing the contact
mechanisms with the client, the barriers, the trends of the single industries
and the possible future developments for a market which was born more than
10 years ago.
The nature of this work will be twofold: quantitative and qualitative. It is
quantitative for what concerns the definition of the weights of the industries
and technologies, in terms of turnover. It is qualitative, once the dimensions
of the market have been understood, in terms of investigating the relationships
with customers before, during and AFTER an energy efficiency intervention.
The ESCos are a facilitator and an implementer, recognized by law, of the
achievement of the environmental goals: their mission is not just to “make the
business” but to create and to stimulate demand too.

9
5. ABSTRACT (ITALIAN VERSION)
Il concetto di efficienza energetica non va confuso con quello di
“conservazione dell’energia”; con quest’ultimo infatti, si intende una
diminuzione dei consumi, che non per forza coincide con il mantenimento del
livello atteso di performance. Spegnere la luce di casa è conservare energia;
sostituire la vecchia lampada con una a LED, utilizzandola per lo stesso
tempo, è fare efficienza energetica.
Su questo concetto basilare si fonda l’operato di una Energy Service
Company: garantire al cliente un livello di performance equivalente (o
migliorato), a fronte di una riduzione dei consumi e, conseguentemente, dei
costi energetici. L’appropriamento di una quota del risparmio è la chiave di
successo di questo modello di business e consente di offrire al cliente
un’installazione “cash-free”.
Questo lavoro di tesi, basandosi su precedenti studi di inquadramento del
settore, intende approfondire il modo in cui le ESCo si interfacciano con i
clienti nel mondo reale e come esse affrontino la complessità intrinseca del
mercato dell’efficienza energetica. Come si evince dalla letteratura infatti, i
modelli di business in questo campo sono molteplici, così come i know-how
specifici, i portafogli di servizi offerti ed i possibili livelli di integrazione. A tal
proposito, il fine ultimo della tesi non sarà quello di proporre ulteriori
categorizzazioni, ma bensì di analizzare i meccanismi di contatto col cliente,
le barriere, le tendenze dei singoli segmenti e i possibili sviluppi futuri di un
mercato che esiste ormai da più di un decennio.
La natura del lavoro sarà dunque duplice: quantitativa e qualitativa.
Quantitativa nella definizione dei pesi dei segmenti e delle tecnologie sul
piano dei fatturati. Qualitativa, una volta comprese le dimensioni del mercato,
nell’indagare i rapporti con i clienti prima, dopo e durante un intervento di
efficientamento energetico.
Le ESCo sono un facilitatore ed un attuatore, riconosciuto a norma di legge,
del raggiungimento degli obiettivi ambientali: la loro mission non è soltanto
“fare il business” ma è anche creare e stimolare la domanda.
10
6. GENERAL INTRODUCTION
The thesis work has been organized through eight main chapters, which will
guide the reader through a dissertation about the dynamics of the Energy
Service Companies’ market.
The chapters, from seven to fourteen, can be grouped into three phases:
1) The first phase will provide definitions and frameworks to give a precise
contextualization of the operators in terms of structures, level of
integration, portfolios of services and contracts. Chapter seven will focus
on the relationships between European Regulations and the role of the
ESCos and, in a second moment, on the theoretical classification of the
different actors and contracts. Chapter nine will provide the results of
previous market-analyses (mainly from the Energy Efficiency Report
2016 by the Energy & Strategy Group), which will be used as a basis and
a benchmark for the correct quantification of the results (chapters 10 and
11). Chapter eight describes instead the phases of a “typical” energy
efficiency project.
2) The second phase consists in the presentation of the results, coming
from the surveys and the interviews. The numerical data from the surveys
will be organized with a similar structure with respect to the Energy
Efficiency Report, so as to be able to make considerations about their
accuracy and affordability. The operative and “real-business” issues will
be discussed with reference to the interviews, to favor a better framing of
the dynamics and mechanisms which lay “behind the numbers”. Chapter
ten explains the methodologies used for the analysis of industries and
technologies (chapter eleven) and of the contracts (chapter twelve).
3) The third and last phase of the work consists in the evaluation of the
evolutionary dynamics in the short-medium and long term. Some topics
(which have been the objects of personal and direct experiences) will be
deeply analyzed and final conclusions will be presented together with
future perspectives (chapters thirteen and fourteen).

11
7. INTRODUCTION AND CONTEXTUALIZATION OF THE
MARKET.
7.1 The energy efficiency target and the role of the ESCOs.
In 2010 the European Union established the 20-20-20 goals for energy
efficiency, Co2 Emissions and renewable sources. The 2020 threshold was a
fundamental step for World’s sustainability and the whole green economy,
being the first pragmatic set of objectives, which derived from the well-known
conferences undertaken at the end of the century and during the 2000’s.
Today these targets are continuously monitored and are going to be updated,
new protocols are going to become effective and new conferences like the
Paris one are setting long terms strategies and new goals for the near future.
The institutional attention towards the sustainability cause is increasing year
after year; the time needed for protocols’ ratification overtime is a proof of this
global trend: Kyoto protocols took years to be confirmed while the Paris
COP21 just took some months, thanks to the stronger will of European leaders
and to the earlier participation of new countries and institutions.
In the graph below the three objectives are reported together with the timeline
of the real progresses.
Fig.1-The 20-20-20 targets.
12
Some observations about this representation are then needed to clearly
understand what is the real distance from the benchmarks and to realize if the
current trends have the right intensity to meet them within the deadlines. The
Renewables and Greenhouse Gases objectives have been defined compared
with 1990, with the result that, when they were set in 2010, a part of them had
already been satisfied. Today these 2 goals have very good projection for the
future and they can be supposed to reach or even exceed final targets by
2020.
As for the Energy Efficiency Goal instead, the evaluation of the progresses
with respect to the final target must be particularly careful, given that it must
be compared to 2005 consumptions (which was the first year in which
consumptions started to decrease, and so the first useful year to set the
target), so that it is practically a more recent target. Looking at future
projections, it is understandable that it will not be easy to reach the decrease
of 20% of consumptions by 2020, even if some nations like Italy have already
reached it. During the next decade the Energy Efficiency target together with
the Renewable Sources one will be fundamental as a driver for the Emissions
Reduction target, which is actually set on the 450 ppm (Parts per million);
indeed, even if this target is going to be reached, it seems that it will not be
consistent enough to keep world temperature under the “2 degrees maximum
increase”. The Paris COP21 wants to move right on this direction, enforcing
measures and placing stricter standards, even if at the moment, the global
scientific community is skeptical about the containment of temperatures
increases within the 2 degrees. Given all these very generic considerations, it
is easy to understand that there are almost two main reasons why enforcing
the energy efficiency market is fundamental for the entire world: the energy
efficiency target is currently the most challenging one and it is a strong driver
to furtherly reduce CO2 emissions.
By relying on this strategic vision and on these macro trends, the European
Union issued the first Energy Efficiency Plan in 2011, which aims to put into
practice measures and guidelines to reach objectives, with a more
“operational” vocation. It is basically articulated over three main priorities:
1. Renewal of building stocks

13
2. Promoting the exemplary role of the public sector (3% restructuring per
year)
3. Promoting the development of the business model of the ESCOs
In 2012 with the directive 2012/27/EU each member state had to set its own
national energy efficiency targets in a non-binding way. For Italy, for example,
the quote was 126 Mtoe (Million tons of oil equivalent) and each state had to
bring into force these directives by 5th June 2014. During 2011 the three
aforementioned priorities were a little modified and redefined (the fact of
updating guidelines and priorities at a European level is crucial to keep contact
with the single countries in the medium term, putting “steps” for markets and
“references” for institutions and laws-adjournments) as following:
1. Promotion of long term strategies for renewal of building stocks
2. Promote the exemplary role of the public sector (3% restructuring per
year)
3. Reduction of the energy sales by 1.5% each year (importance of TEE
market)
4. Promotion of specific measures for energy audits and energy
management systems involving large enterprises.
These two lists of priorities constitute the “pillars” of the Energy Efficiency
market definition for what concerns operational procedures aimed to demand
stimulation and market development; furthermore it is possible to notice that
the individuation of the Energy Service Companies as enabling-actors of the
market is clear and well-defined. This is the evidence of the fact that the ESCo
,as an “entity”, is strongly incentivized by the European regulation, which also
certifies them uniformly (UNI-CEI11352): the ESCo is described as an actor
which works as a “trait d’ union” between EU guidelines and their application
into the real market, guaranteeing standardization, reliability and legality.
Anyway, as it will be explained afterwards in the next sections, the ESCos are
uniformly defined only for what concerns their final purpose (Energy
Efficiency) and European certifications: the structure, the size, the role in the
market, the contracting and the core activities instead, can slightly vary from
one company to another.
14
Now that the “macro” institutional role of the ESCOs is clarified, the aim of the
introduction will be the one to explain what they are, how they work, what are
the main contract forms and what is the state of the Italian energy efficiency
market.
7.2 What is an ESCO.
7.2.1 Definitions.
The energy efficiency objectives can bring very different types of advantages:
the decrease in the degree of energetic dependence from other countries and
from fossil fuels, the possibility to pursue costs reductions and the GHG
reduction are just some of them. It is evident that energy efficiency takes with
it a large series of benefits but it is also true that there are a lot of barriers to
it: some of them are the lack of information and knowledge, the presence of
not qualified entities carrying out projects, the high initial costs and sometimes
a sort of “general apathy” of the specific sectors. In this contest the Energy
Service Companies acts exactly as an “Access door to energy efficiency”,
offering consultancy, knowledge, experience, historical data, dedicated
solutions, assuming technological and financial risks.
It is very difficult to give a precise definition of an Energy Service Company,
because they sell very different services, have different internal structures,
work at different stages of the supply chain and have very different ranges of
integration and specialization, by the way a first definition was given in Italy in
the Decreto Legislativo 115/2008 :
“A person or a company selling energy services and efficiency actions
in the user’ s property assuming a well-defined financial risk. The
remuneration depends totally or partially on the value of the amount of
energy saved thanks to the efficiency intervention”.
The ESCos are different from the ESPCos (Energy Service Provider
Companies) which have not the same focus on energy efficiency that we find
in the previous definition, they are indeed a sort of more “generic actors” which
operate in the market for energy efficiency, but which have not the same
15
institutional value and do not mandatorily assumes technological or financial
risks. These are two central concepts for the definition of an Energy Service
Company which:
“assumes the technological risk of the intervention”
And moreover:
“assumes the financial risk of the intervention”
In the reality, none of these two last sentences is strictly necessary to define
an ESCO, but they are two key points for the framing of the entire business
model of an Energy Service Company which, as a consequence, will always
have to be technologically upgraded and able to make investments by itself or
through third parties. Some other general characteristics describing the
ESCOs, found out in the decrees and in literature, are the model of
remuneration (which is directly dependent on the customer savings), the
guarantee of the savings given by the ESCO itself and the general focus
towards energy efficiency topics.
At this point, it is almost clear that an ESCo, as it is defined, must use financial
and technological resources in the most effective way during the phases of a
project, so that this can be identified as an always-present characteristic for
every kind of company working in this sector. There is then another crucial
perspective which is useful to give definitions and generic figures of Energy
Service Companies: looking at its behavior and portfolio of offered services
over the different phases of a project. During the design & engineering,
construction, running and maintenance phases the ESCos are normally the
only responsible of the actions taken, so that the next step will be the one of
understanding the width and depth levels referred to the sets of actions
provided during an Energy Efficiency Project. These actions can be grouped
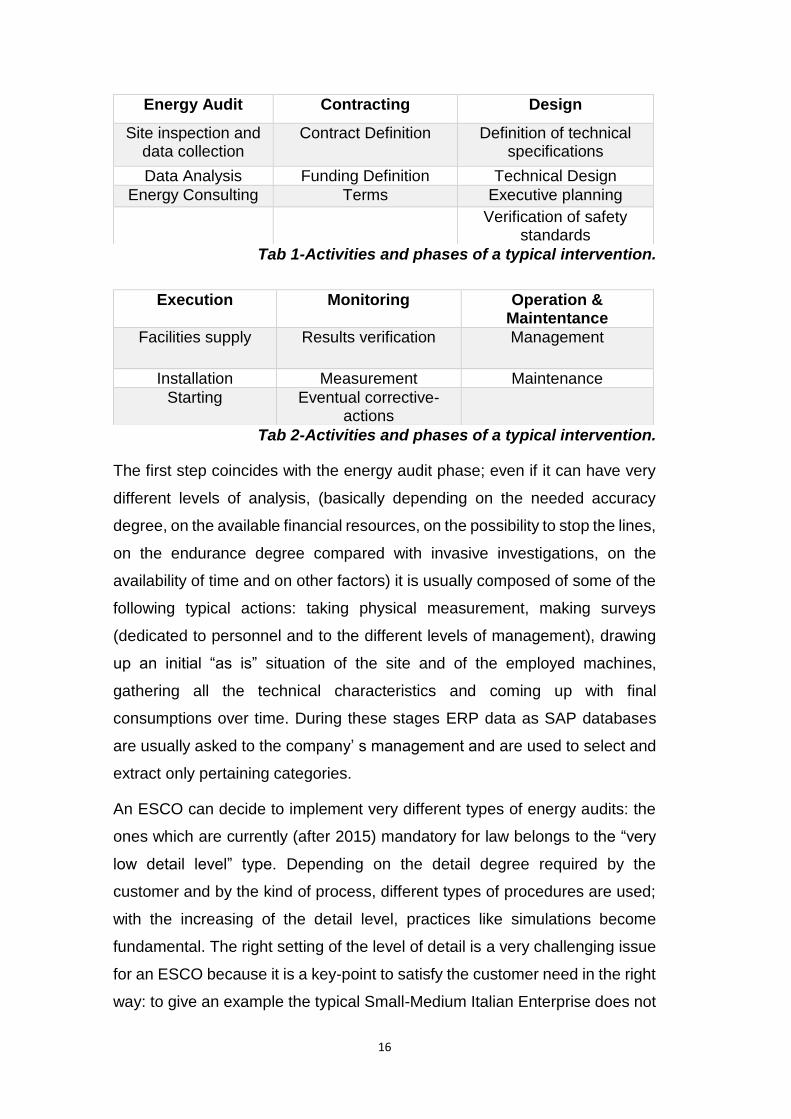
for every step of a “typical intervention” like it is proposed in the following tab:
16
Tab 1-Activities and phases of a typical intervention.
Tab 2-Activities and phases of a typical intervention.
The first step coincides with the energy audit phase; even if it can have very
different levels of analysis, (basically depending on the needed accuracy
degree, on the available financial resources, on the possibility to stop the lines,
on the endurance degree compared with invasive investigations, on the
availability of time and on other factors) it is usually composed of some of the
following typical actions: taking physical measurement, making surveys
(dedicated to personnel and to the different levels of management), drawing
up an initial “as is” situation of the site and of the employed machines,
gathering all the technical characteristics and coming up with final
consumptions over time. During these stages ERP data as SAP databases
are usually asked to the company’ s management and are used to select and
extract only pertaining categories.
An ESCO can decide to implement very different types of energy audits: the
ones which are currently (after 2015) mandatory for law belongs to the “very
low detail level” type. Depending on the detail degree required by the
customer and by the kind of process, different types of procedures are used;
with the increasing of the detail level, practices like simulations become
fundamental. The right setting of the level of detail is a very challenging issue
for an ESCO because it is a key-point to satisfy the customer need in the right
way: to give an example the typical Small-Medium Italian Enterprise does not
Energy Audit Contracting Design
Site inspection and data collection
Contract Definition Definition of technical specifications
Data Analysis Funding Definition Technical Design
Energy Consulting Terms Executive planning
Verification of safety standards
Execution Monitoring Operation & Maintentance
Facilities supply Results verification Management
Installation Measurement Maintenance
Starting Eventual corrective-actions
17
need high level of details and does not want to stop processes during
inspection phases, so the ESCOs are moving towards light solutions, quick
methodologies and software to make energy audits in the less invasive
possible way (it is important to remember that the basic concept to be
respected in this case, is that the final benefit brought by the energy audit
actions must exceed the total cost the energy audit itself). Another key-issue,
besides quickness and low invasiveness of procedures, is to provide
forecasted economic results (with the best approximation possible), in order
to give the customer an early idea of the savings, before going into deeper
investigations; this is a generic and fundamental principle for the “sales-area”,
and it is particularly effective when the customer is not completely aware of
the benefits given by the product/service: trying to sell the basic
product/service first, providing certain results, then going deeper into further
investigations and interventions opportunities. Another important issue at this
stage of an energy efficiency project is setting the right priorities both from an
economical-advantage point of view and from a “customer-preference” point
of view, so that the final solutions will be recommended in order of priority for
easier selection.
Once the type of intervention, together with very general parameters, has
been defined, the ESCO is in charge to offer a contract for each new plant or
retrofit-solution (i.e. the installation of new LED lamps into old fixtures
previously mounting neon lamps). The parameters of a contract are various
and this topic will be deepened in a dedicated chapter (depending on the kind
of contract the parameters can change in typology and value too), anyway the
most frequent elements inside this type of contracts are: the share of savings
dedicated to the ESCO, the share of saving dedicated to the customer, the
guaranteed saving performance, the duration of the contract, the condition
given by the ESCO for operating and managing the plant in the first years, the
presence or not of the possibility for the customer to redeem the plant and the
guaranteed payback-time. In this phase also the funding methodology is
defined, the investment indeed, can be carried out by the customer, by the
ESCO, by a bank institute or again by mixed quotes of different actors (this
final solution can get high degrees of complexity as returns must be divided

18
by taking into account different weights of the invested quotes and different
degrees of financial risk and cost of capital).
The third phase of an energy efficiency project is the design of the new
solution or of the retrofit solution; in the first case the design is simpler and
requires less collaboration between the ESCO and the customer. The
definition of the technical specification must coincide with the technical
translation of the economical parameters defined in the contracting phase: the
plant must be dimensioned to give the best possible economical result, under
the constraints of space, time required for installation, minimum performance,
health & safety, productivity and so on. At this point an executive planning can
be defined and, at the end of this procedure, all the safety standards must be
checked and valued as compliant both with law regulations and with company’
s safety policies.
As it will be better explained in the next chapter, an ESCO does not always
undertake all the previous and the next phases but its business model can be
focused just on some of them. An example of this fact is the frequent
outsourcing of the installation procedures (in particular for integrated
operators) or interventions (typical plants whose installation is outsourced by
the ESCOs are PV plant).
The installation follows the gathering of all the necessary components which
are rarely produced by the ESCO, (there are just some examples of big and
very specialized ESCO which produce some components for their own plants)
indeed in the current market the components are supplied by specialized
operators mainly for higher specialization and cost efficiency reasons.
After the plant has been installed and tested, and after that fixed parameters
have been confirmed by the real functioning of the plant, it can start working
under continuous monitoring. In this phase the role of the ESCO is
fundamental for the optimization of the plant, indeed even though the plant
have been properly designed and it is in line with the customer needs, some
changings in settings and parameters are always needed after the installation
(let’s think about the effects of the increase of external temperatures over the
setting of heating systems, or increasing the “lumen/m2” in a given area of a

19
site, due to changes in regulations), in order to get the best possible efficiency
from the plant. An ESCo is indeed much more qualified in monitoring plants
with respect to the customer; the data coming the monitoring activities
anyway, are usually available also for customer’s consultations. As for
operations & maintenance practices, the ESCos often support the customers
during the period in which it runs the plant so that the company will be able to
do it better when the period of competence for the ESCo will come to an end.
7.2.2 Classifications and Business models.
An ESCO can provide all or just a part of the six aforementioned actions, so
each ESCO can have a different degree of coverage over Energy Efficiency
Projects; for this reason, a first categorization is needed, dividing the ESCOs
in specialized and integrated, depending on the number of carried out
activities. The criteria and the data reported in the following lines have been
taken from the energy efficiency report 2015, in which all the Energy Efficiency
Operators (not only certified ESCOs) have been classified. The specialized
operators work on no more than 2/3 phases and are more likely to focus on
the upstream part of the projects (almost 30% of the sample makes the Energy
Audit phase).
Energy
Audits
Solution
design
Installation Maintenance &
Monitoring
Incentives Manageme
nt
Frequence
X
11%
X X
9%
X X X
8%
X X 8%
Tab.3-The specialized operators’ activities.
The most diffused configuration is the first one, followed by the second, these
operators are usually consultancy studies which specialize over energy
efficiency topics; they normally have a network of installers’ companies they
use to collaborate with, in order to link the energy audits and the design
solutions with the final installation. The Operators which use to effectuate also
20
the installation stages have more complex structures and need more
personnel and more heterogeneous competences. In the end a minority of the
operators focuses on monitoring and maintenance issues, these operators
rarely identify with ESCos because they don’ t carry out the first three phases
which are fundamental for being considered an ESCo (they do not assume
technological or financial risks and they do not stimulate demand in any way).
The second category is identified by the integrated operators, which instead
work on almost all the phases of an energy efficiency project; in particular,
28% of the sample of the integrated operators work on all the six phases.
These actors are obviously more likely to be larger companies than the ones
belonging to the category of the specialized operators. The two stages which
are more frequently outsourced are the installation and the maintenance and
monitoring phase: the first one is usually outsourced to specialized installers
(to give an example, PV installers can have a much more specialized and
dedicated company structure than an ESCO which offers various types of
installations and services); this choice is mainly due to the different operative
nature competing to this kind of activity. The second one instead, is frequently
outsourced to societies which are specialized in quality-control and in the
monitoring of the processes.
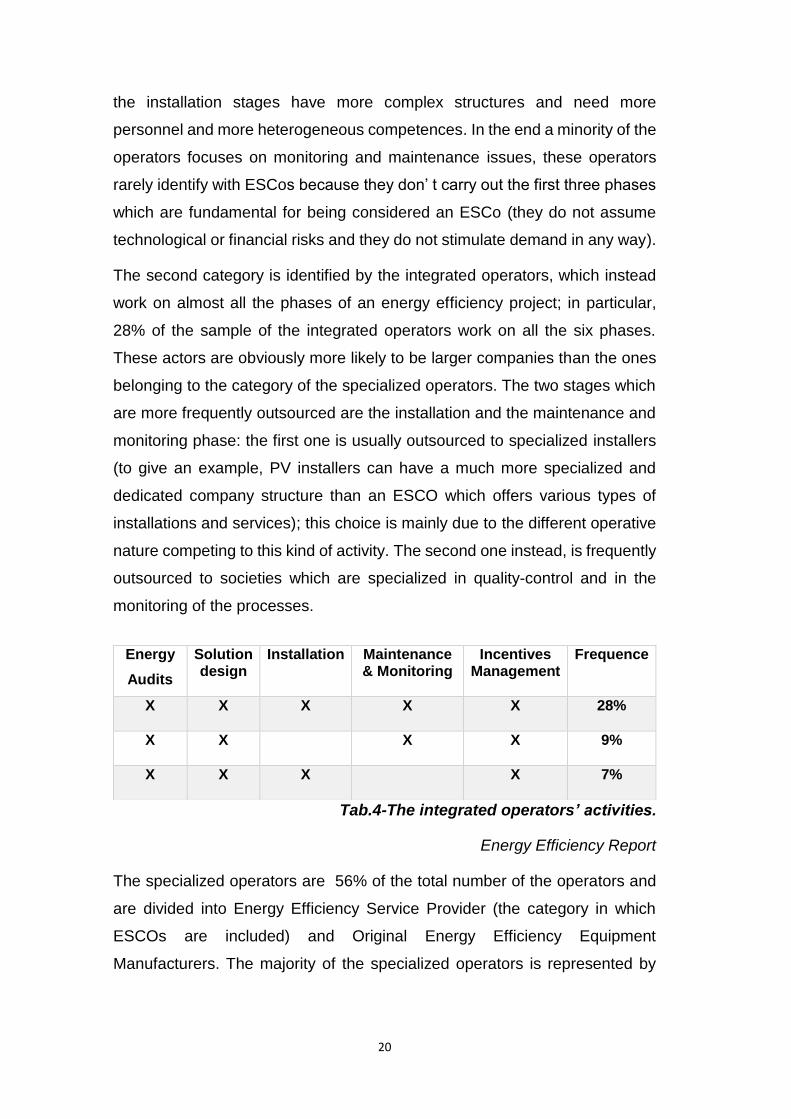
Tab.4-The integrated operators’ activities.
Energy Efficiency Report
The specialized operators are 56% of the total number of the operators and
are divided into Energy Efficiency Service Provider (the category in which
ESCOs are included) and Original Energy Efficiency Equipment
Manufacturers. The majority of the specialized operators is represented by
Energy
Audits
Solution design
Installation Maintenance & Monitoring
Incentives Management
Frequence
X X X X X 28%
X X
X X 9%
X X X
X 7%

21
EESPs which are indeed dedicated operators for this kind of activities, while
the OEEEM’ s focus is the manufacturing of energy efficiency solutions.
Fig.2-The specialized operators’ market composition.
Energy Efficiency Report
The integrated operators are 44% of the total number of the operators and are
divided into Energy Efficiency Service Providers and Original Energy
Efficiency Equipment Manufacturers. The majority of the integrated operators
are again EESPs (for the same motivations of the previous case).
Fig.3-The integrated operators’ market composition.
Energy Efficiency Report
96%
4%
Market composition
EESP
OEEEM
85%
15%
Market composition
EESPs
OEEEM

22
As mentioned before, ESCOs are included into EESPs, which is a much more
generic and less restrictive group of companies in terms of distinctive
characteristics: in the following graph we can notice that Energy Service
Companies are 58% of this wider categorization.
Fig.4-The Energy Efficiency Service Providers’ market.
Energy Efficiency Report
By analyzing these graphs, it is finally possible to conclude that ESCOs are
almost equally distributed between specialized and integrated operators (with
a prevalence of specialized operators).
Another, and probably more significant categorization, from a merely “market
perspective”, is related to the ESCos’ target market. This kind of perspective
indeed, gives the opportunity to group ESCos’ activities and competences with
a horizontal logic (basically concerning the width of the services and products
offered on the different target markets), while the previous categorization was
more likely to distinguish different portions of a sort of “extended supply-chain”
for energy efficiency. In the specific case of the Energy Efficiency market, it is
important to specify that the most fitting definition of supply chain (which is a
very wide, and sometimes undefined concept) is the one given by Mentzer in
2001 (“The Supply Chain is a series of three or more entities, organizations or
individuals, which are directly involved in upstream or downstream fluxes of
products, services, money or information from primary sources to the final
27%
4%
11%
58%
The Energy Efficiency Service Providers
Facility and plant management
Utility
Advisory
Energy Efficiency
23
customer”), considering the “efficiency project” as the “object” of the supply
chain and treating it as a unique product/service which is sold to the customer.
By going back to the subject, an ESCO has today three possibilities to set its
target market: focusing on the industrial sector, focusing on the tertiary,
residential and building sector or focus on both these two categories. In this
case the ESCO obviously needs a much more complex and developed
structure together with a spread knowledge, enabling to invest over different
realities which have completely different capability to invest, needs to be
satisfied, risks perceptions and type of competences. The diffusion of the
ESCOs in the residential sector is anyway very low in the current market,
which is constituted for the moment by just some pilot projects (mainly in the
field of energetic-class qualifications of residential complexes), while it is more
frequent to find collaborations between building companies and ESCOs for
what concerns the construction of big residential complexes respecting new
requirements in terms of energy consumptions, to obtain the higher possible
classification.
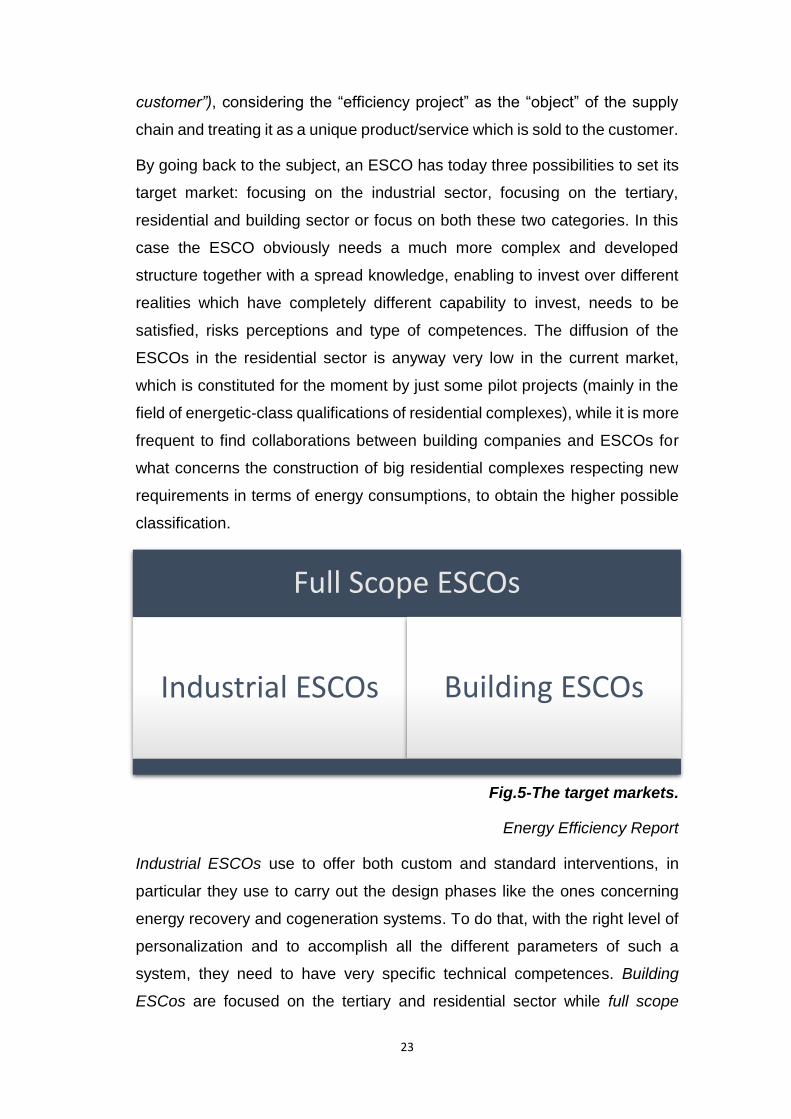
Fig.5-The target markets.
Energy Efficiency Report
Industrial ESCOs use to offer both custom and standard interventions, in
particular they use to carry out the design phases like the ones concerning
energy recovery and cogeneration systems. To do that, with the right level of
personalization and to accomplish all the different parameters of such a
system, they need to have very specific technical competences. Building
ESCos are focused on the tertiary and residential sector while full scope
Full Scope ESCOs
Industrial ESCOs Building ESCOs
24
ESCos act on both the target markets. Industrial ESCos are larger in terms of
revenues and generally offer specialized and technically advanced solutions
which need high personalization degrees and high durability. The other two
categories have a slightly different approach towards the final market: they
often try to enter partnerships with OEMs (Original Equipment Manufacturers),
they try to perceive standardization, ease of installation and sometimes cost
leadership.
As a conclusion of this chapter, it is important to give a unique view of all these
categories (both horizontal and vertical), by providing a general idea of the
nature of an ESCO. The first observation regards the huge variety in terms of
carried out activities and levels of integration (vertical perspective) in the
Energy Efficiency Supply Chain (see previous definition). The second one
instead, highlights the presence of different strategies in terms of approaching
the final customer and, as a consequence, the need of developing different
marketing skills and strategies (aimed at fixing quality or cost leaderships)
depending on the target market (horizontal perspective). The combination of
the two categorizations gives the big picture of the market, which results to be
very heterogeneous. This big variety perfectly reflects into the real market, in
which an ESCo division controlled by a big energy player, an Original
Equipment Manufacturer and a Consulting ESCO are acting together and,
maybe, offering similar services to the same target market. Furthermore
consider that also non-certified operators can compete in the market too, for
what concerns portfolios of services which do not mandatory need a UNI-
certified operator). At this point, the different degrees of operational structure,
technical knowledge and competences have been highlighted, but there are
other two very big elements of heterogeneity: the typology of the offered
contracts and the financing modes, which consequently affect the financial
structure of each company; these two aspects are going to be analyzed in the
following chapter.
25
7.3 The contracts.
7.3.1 Contracts typologies and financing modes.
Different contracts typologies are used in the nowadays market for energy
efficiency; their parameters usually differentiate depending on customer
needs and on the characteristics of the intervention so that, as consequence,
the ESCo must be able to find out the best-fitting contractual form for the
specific situation. In the following chapter the most spread contractual forms
will be analyzed, pointing out pros and cons of each typology.
The first type of contracts is called “Standard contracts”; they are usually
referred to the pure outsourcing of energy management and have been used
since the ‘80s, for turnkey services mainly related to plants dedicated to heat
production. The guaranteed performance in terms of volumetric units and day
degrees are both explicitly expressed parameters. The nature of the contract
is firstly related to the outsourcing of energy management issues and, as a
consequence, it is not mandatory that the specific project has to provide the
construction of a plant. In some cases indeed, some of these contracts directly
act on already existing plants, dealing with operational and maintenance
activities. During the whole duration of the contract the ESCo results in being
the effective owner of the plant and the customer lose every right to take
operational decisions over the plant. This type of contract does not usually
provide a direct dependence between the ESCo’s profits and the effective
savings for the customer, but some clauses can put upper and lower limits to
ESCO revenues on the basis of the procured savings. Another option of the
standard contracts is the possibility to protect the customer, by guaranteeing
a fixed price for fuels or electric energy supply, so that the variability of
performances decreases and the degree of guarantee over final results
increases (This fact can be an advantage not only for the customer but for the
ESCo too, which can better control and forecast the performance trends of the
plant). In Italy the evolution of these contracts over time went through two
subsequent stages: from the “contratto calore”, which provided the
management and maintenance of a boiler, trying to improve its overall
utilization-efficiency, to the “servizio energia”, which provided the insertion into
the contract of new parameters, the most important one is the explicit forecast
26
of the customer’s saving during the years. This element was someway
“preparing the ground” for the issuing of the Energy Performance Contracts,
which appeared on the market some years later.
The second macro-type of contracts is called “Energy Performance
Contracts”. This typology has been changing during years, and is continuously
evolving, innovating and adapting to different needs of the customers and to
the increasing different nature of projects and technologies. The very essential
characteristic is in this case the direct dependence of the ESCo’s revenues
on the effective savings for the customer, this fact highlights a distinctive
feature of the ESCo compared with a normal energy consultancy company: in
the first case the customer buys (through its savings) certain results, while in
the second one he pays for knowledge (and not for a final result). While
standard contracts are particularly focused on management, operative control
and maintenance, the EPCs are mainly aimed at the renewal of buildings and
plants and at the installation of new technological solutions for energy
efficiency, pursuing innovation and, as a result, the maximum possible
Negawatts (the unit of measurement representing the saved Megawatts); by
respecting at the same time all the constraints of the specific case, from the
financial ones, to the technical ones. The ESCo’s attempt to obtain the
maximum possible savings is just due to the fact that maximum savings
translates into maximum revenues when using the EPCs: this is a
fundamental driver for the development of new technologies (in particular
when they guarantee higher savings with respect to older ones but their
market is still developing and their prices are still higher), for the stimulation of
their demand and for their effective spread into the market. Energy
Performance Contracts are to all intents the perfect contractual means for the
diffusion of new energy efficiency solutions, they are able to valorize economic
feasibility and technological goodness of the solution at the same time, making
the first one strictly depending on the second one. The most common EPC
forms show at least three general variants which differ for the risks allocation
among the involved actors, debt-capital remuneration and ESCO-capital
remuneration. The “Shared Saving” is the most classical form: the ESCO
provides the capital with its own equity or with third parties financing, then the

27
parties agree on the subdivision of the final savings. These contracts usually
last longer than the case in which the savings are completely assumed by the
ESCO, because only one part of the savings is contributing to the recovery of
the investment. They can last from 5 to 10 years, even if the real payback time
of the investment (by considering the total returns/savings as the sum of the
returns for the customers and the returns for the Energy Service Company),
would be much lower. Also in this typology of contract the property of the plant
stays in the hand of the ESCOs and only at the end of the contract it comes
back to the customer. The operation & management is usually made by the
ESCO, with predefined comfort, operative and functioning parameters.
Another well-known typology is represented by the “first out” contracts, in
which the savings are used to repay the interests and the depreciation of the
contracted loans, for this reason they last less than the “shared savings” and
the return of the investment results to be faster (usually 3-5 years). At the
conclusion of the competence period of the contract, the savings completely
pass to the customer.
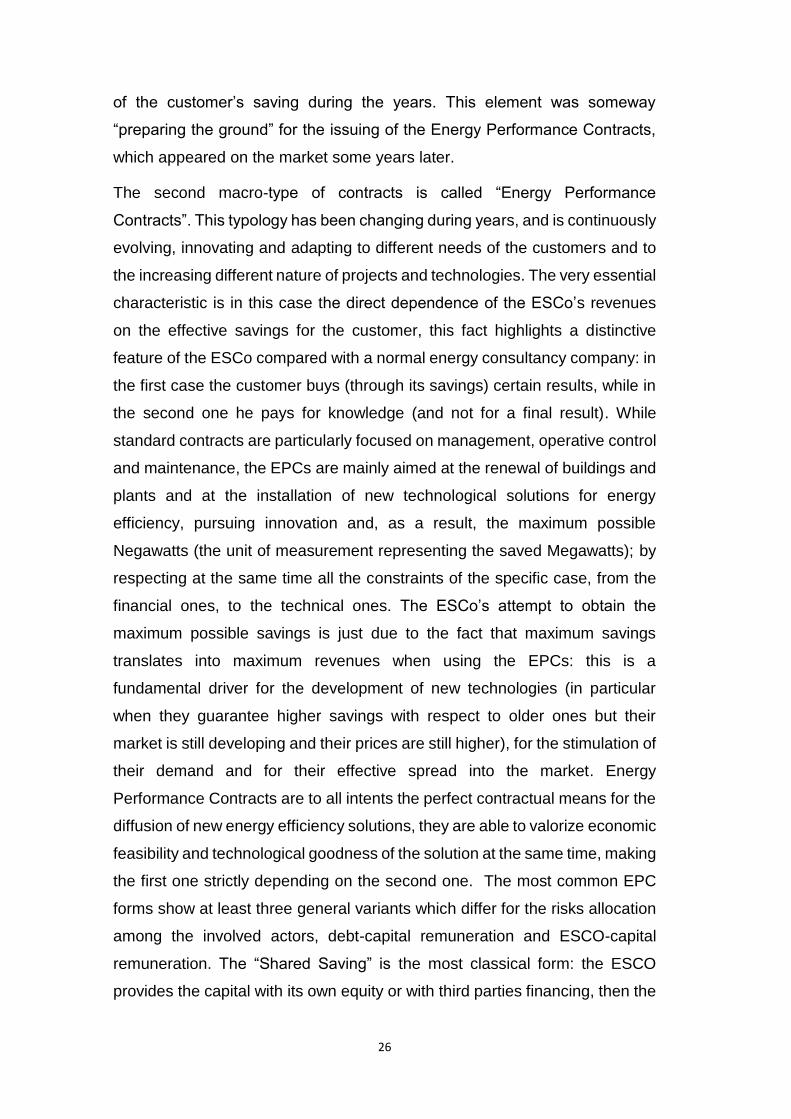
The “Guaranteed saving” instead, is the wording used to describe a sort of
leasing provided with a guaranteed energy saving for the customer. In the US
this form is typically accompanied with a third party financing: the customer
underwrites the loan with the third party, while the ESCo have to guarantee a
certain level of returns (the ESCo in this case is the guarantor of the technical
feasibility and provides the third party with technical parameters useful to set
the financial ones with the final customer). The financial risk is in the end in
charge of the client and of the third party, so the Energy Service Company is
only bearing one of the two typical risks which were mentioned in the
definition’s chapter: the financial risk. For this type of contracts the duration is
usually 4-8 years. Sometimes in the contracts there are some clauses which
can guarantee fixed energy savings, fixed energy prices or again the use of
the most convenient source of energy.
In short, the financing modes can be structured so that the entire invested
capital is provided by the customer or by the Energy Service Company. The
second alternative is represented by the intervention of the aforementioned
“third party” which was previously mentioned during the description of the

28
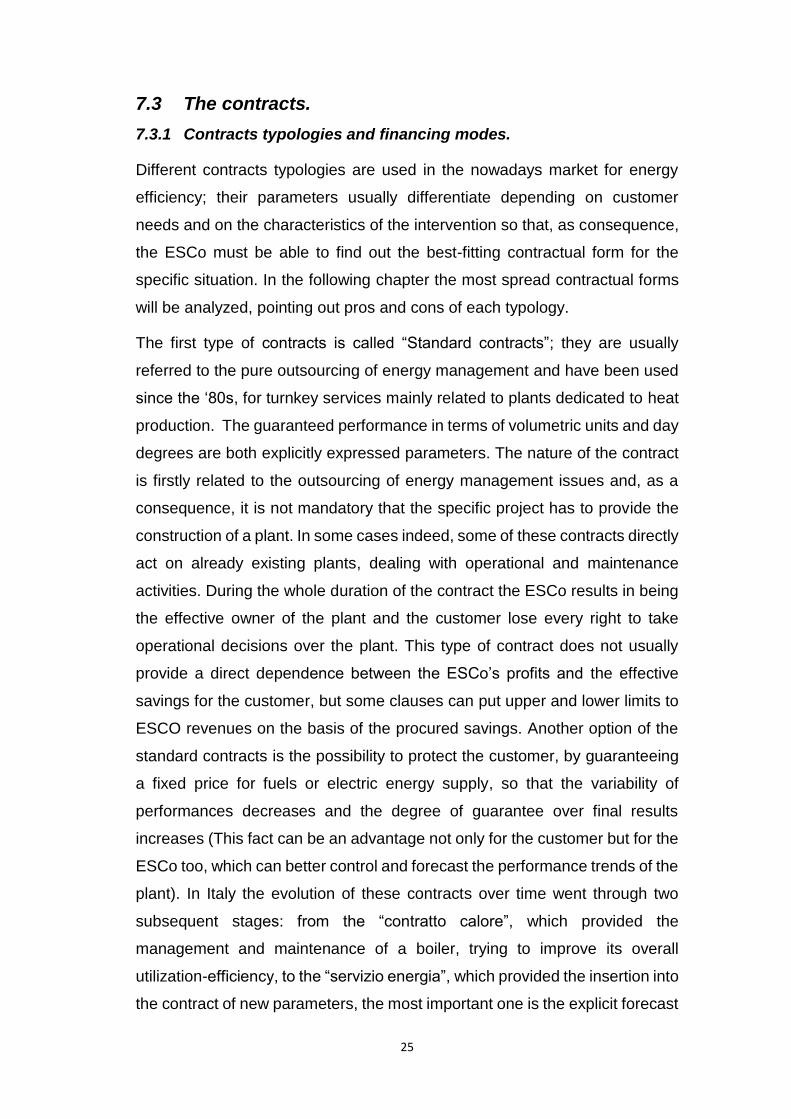
“guaranteed savings” contract: the third party is usually a bank institute
(sometimes it can also be represented by a big energy distributors) which can
participate to the investment by providing the whole amount of the investment
or just a part of it (in this case the other part can be provided by the ESCo or
by the customer itself). In the latter situation the definition of the contract
becomes more difficult, given that different actors have to remunerate different
portion of the capital invested. Besides the amount of capital with which the
bank institute is going to participate to the investment, there is another
important variable, which is the definition of the entity the third party is
interacting with. The bank instead, can find a financing agreement both with
the customer and with the ESCo, this passage basically defines who is the
final responsible for the financial risk. In Italy the very common situation is that
the bank interacts with the ESCo, which can assume the function of “technical
guarantor” which was previously described while defining the “guaranteed
savings” concept. Nowadays bank institutes are “adapting” to this financing
scheme, by providing dedicated offices and services with specific skills and
competences which can better interact with the ESCo. This could be a key-
issue for pushing investments in the Italian energy efficiency market: if bank
institutes succeed in defining standardized parameters and conditions which
can be met by ESCo competences and guarantees, it could be much easier
to finance energy efficiency investments.
To better clarify the two “third party financing modes” described before, two
schemes showing fluxes of money and services between the entity are
provided:
29
Fig.6-Third parties financing with ESCo borrowing.
Fig.7-Third parties financing with energy user/customer borrowing.
7.3.2 The contracts related risks.
When different actors participate to an Energy Service Contract they all incur
in different sources of risk; they can perceive risks in different ways and each

30
risk typology can have different effective impacts on the specific entity,
depending on the Energy Service which is going to be contracted.
First of all the operative risk refers to the responsibility on the design and
installation of the technologic solutions concerning its good functioning at the
starting of the plant. This risk can be undertaken both by an Energy Service
Company or by an installers’ company: whoever takes this risk anyway,
should guarantee that the solution is going to effectively work and that it is
compatible and well-integrated with the other parts of the plant. When the
Energy Efficiency Service Provider which is facing the operating risk is a
specialized operator in the installation, design or operation of a particular
technology or plant, the operating risk can be lower. This happens because
specific experience in the fields of installation and plants’ “running-skills” is
fundamental when dealing with strictly practical and operational issues: the
cumulated knowledge can be decisive when installers have to face particular
physical constraints or problems of any type in the conduction of the plant.
The energetic performance risk refers to the responsibility upon energetic
consumptions of the customer which follows the energy efficiency
intervention. The entity bearing this kind of risk is linking its remunerations to
the cash flow coming from the energy savings obtained in a certain time. This
fact results in the need of good legal competences given that the energy
performance needs to be guaranteed. Legal competences play a central role
in this field: a good energetic performance could depend on the activities of
two different agents (let’s consider a customer and an ESCo in this case) and,
if the initially fixed performance is not going to be reached, it would be difficult
to determine the specific responsibilities. The solution to completely leave to
the ESCo the operations of a given plant can be found, in part, right in this
fact: the goal is to centralize the responsibilities in the hand of the ESCos, so
that the customer can be better legally guarded in the case that fixed results
are not attained at all.
A further source of risk is related to energy supply; it is basically caused by
the dependence of the Energy Service Provider’s profits upon the energy
supply competitiveness, reliability and the stability of prices. When incentives,
electricity prices, fuel prices are particularly variable it is indeed more difficult
31
to precisely determine contractual parameters and to guarantee the initially
fixed results. Two practices anyway can help to reduce this source of risk: the
energy trading and the risk management on energy prices (making forecasts
about the trend and the volatility of the future energy prices). Buying electricity
through futures can be a good instrument to get constant electricity prices and,
in general, all the so called “administrative energy efficiency” practices can
play an important role too.
The financial risk, by considering the most general definition possible, refers
to the uncertainty linked to the future value of any investment and its volatility.
The entity that bears this risk finances the investment through equity capital,
if the risk is considered too high, it will be necessary to try to resort to third
party financing. This risk is reduced thanks to the capability of evaluating
investments and to make affordable costs/benefit analysis. Furthermore, as a
definition, the financial risk is “linked” to the balance of incoming and
outcoming flows (given that it is the risk impacts on the company liquidity), and
when the volatility of these flows in linked to weather conditions, energy prices
and a lot of other variables, it becomes a fundamental source of risk to be
considered.
In the end the functioning risk is a sort of “all-in-one” risk which relieves the
customer from every kind of responsibility: in this case the entity bearing the
risk is not just carrying out an energy efficiency intervention but it is completely
guaranteeing and managing the entire service offered by the plant, ensuring
a continuous and efficient delivery of the service. A good perception and
capability of analysis of the company processes is a driver for the reduction of
this source of risk.
When an energy efficiency project has to be carried out, it is very important to
have a clear view of the risks set before the realization; that is a key point, the
complete evaluation of the risks must be clear before starting every kind of
activity because it represents an important threshold for outsourcing/in-house
decisions. An energy efficiency project is indeed composed of phases
completely different the one from the other, and one of these differences is
right the impact upon different risks categories: each phase of the project can
be more, or less adaptable to the ESCo’s structure and business plan in terms

32
of the set of risks (and related intensities) which it bears with itself. As a
conclusion (particularly for big players working on big energy efficiency
projects) the risks’ effects evaluation and combination is crucial in this sector.
Thanks to the basic considerations coming from the previous chapters, a
specific framework categorizing the contracts typologies can be issued, with
reference to the Energy Efficiency Report 2016. This framework will be used
afterwards to qualitatively describe the results of the surveys which has been
applied to the ESCOs. The framework reports the contract typologies and, for
each one, the associated risks, so that different typologies of operators (which
identifies in operators issuing a specific contractual form) are distinguished
with the criteria of evaluating their exposure to one or more risks’ typologies.
Obviously a single operator can decide to offer different types of contracts
(bearing different risks), depending on the customer it is dealing with and, in
particular, depending on what are the specific market and technologies
involved. There are indeed some cases in which the same operators cannot
bear the energy performance risk relative to a given technology and customer,
but it can bear the same risk when installing another kind of technology for
another type of customer (in terms of dimensions or needed guarantees in
terms of results).
Tab.5-The contracts’ typologies.
CONTRACT TYPOLOGY ASSOCIATED RISK
Turnkey Contract Operative risk
Energy Performance Contract Operative risk
Energy performance risk
Finance Contract Operative risk
Energy performance risk
Financing risk
All risk Contract Operative risk
Energy performance risk
Financing risk
Energy supply risk
Functioning risk

33
At this point a clear general overview of the most used contractual forms has
been provided and it will be discussed again during the analysis phase.
7.3.3 SPINs and EPC+ contracts
There is anyway another innovative contract form which is further and further
being developed: the EPC+ contract. This particular contract allows different
Energy Efficiency Service Providers to issue a single EPC collaborative
contract regulating a unique intervention indeed, as it was previously shown,
EESPs are very different one from the other, especially for what concerns
competences and core activities. This practice has been experimented in
some contexts as a collaboration between partners acting at different levels
of the Energy Efficiency Projects (Specialized installers, auditors, designers
and so on) or partners focused on different technologies; the collaboration
among these small partners has taken the acronym of SPIN (Small-Medium-
Enterprise Partnership for Innovative Energy services). Let’s consider, for
instance, that an ESCo has very good performances for what concerns the
installation of HVACs systems, this ESCo has technical competences and the
right experts and contacts for this kind of intervention. An optimized HVAC
system anyway often requires a good combination with building envelope
measures (i.e. roof insulation, windows replacement, etc.) to obtain the best
performances. The aforementioned ESCo cannot be able to provide technical
skills for this kind of installations and, furthermore, the two specific financial
analysis could be completely different: while the HVACs investments are
typically judged from a pay-off point of view, the building envelope measures
are evaluated by a depreciation point of view. These very different
perspectives, together with the need for of the customer to be served in a
dedicated way (which allows an integrated installation of the two solution) is
the source of the need for the SPINs’ contract. A SPIN between the two actors
indeed, could be fundamental in a case like this one, and could afford to offer
a very highly specialized and integrated intervention, increasing the quality
and the satisfaction of the customer. It is easy to understand that a contract
which aims to regulate such a kind of collaborative intervention and to involve
in it the customer too, could be very complex. It must basically consider a very
34
wide range of variables from the technical point of view (parameters) and also
from the financial point one. If furthermore we conjecture that the contract
provides a remuneration through the sharing of the savings, the complexity
from the legal point of view will be consistent too, being the savings shared
between two entities (or three considering the customer). It will not be easy to
quantify the exact “competence-quotes” of the shares for each actor involved
(from an economical point of view) and defining different responsibilities upon
final results will be difficult too.
The EPC+ contracts have been progressively standardized in the last years
and some business model canvas have been redacted, a lot of pilot projects
have been started through Europe, creating clusters of SMEs offering
integrated energy efficiency services. The potential of this solution is
enormous, the knowledge can be shared between the ESCo, which can enter
new markets through partnerships. Another factor that must be considered is
the need of integration which would perfectly fit some interventions. Let’ s think
about the “home” environment: the PV, the heat pumps together with
automation and HVACs system: just a few big and very integrated players
can offer the entire package of interventions.
The “EPC platform” is today active for the European states, allowing to
exchange not only information and know-how relative to the standard EPC but
also to better develop the SPIN perspective; in Italy a list of ESCOs
participating to a SPIN is present and specified into the Federesco site. It is
for this moment anyway, a field in continuous evolution which has been
deepened more by pilot projects than by the natural market demand. To
conclude, a brief SWOT analysis of SPINs is reported below.
STRENGHTS WEAKNESSES
Services can be offered in higher
quality compared to services offered
by a single ESCO
Insufficient definition of an
appropriate SPIN-management
structure
Services can be provided at lower
cost to the customer
Different approaches from experts
lead to higher development costs

35
Tab.6-SPIN’s strengths and weaknesses.
Tab.7-SPINs’ opportunities and threats.
Allow a quick and efficient response
upon consumer needs and marked
demand
Absence of a spin-framework leads
to:
-Less transfer of sales opportunities
-Limited know-how sharing Allows transfer of know-how among
SPINs to persist in fast changing
environment
OPPORTUNITIES THREATS
There is growing demand for
specialized, innovative and high
quality energy efficiency solutions
Retention of know how of SPIN
experts due to mistrust
Small scale services providers seem
to be less anonymous
Interest of the own company is seen
as more important than the success
of the SPIN
Local SMEs are likely to be preferred
by some clients
Know-how sharing may leads to a
growing number of competitors
SPINs can be also capable to cover
bigger areas
Unfavourable market conditions
may hinder the supply of services of
SPINs Various backgrounds of SPIN
members help to be more resilient
36
8. PRACTICAL EXAMPLE OF AN ENERGY EFFICIENCY
PROJECT.
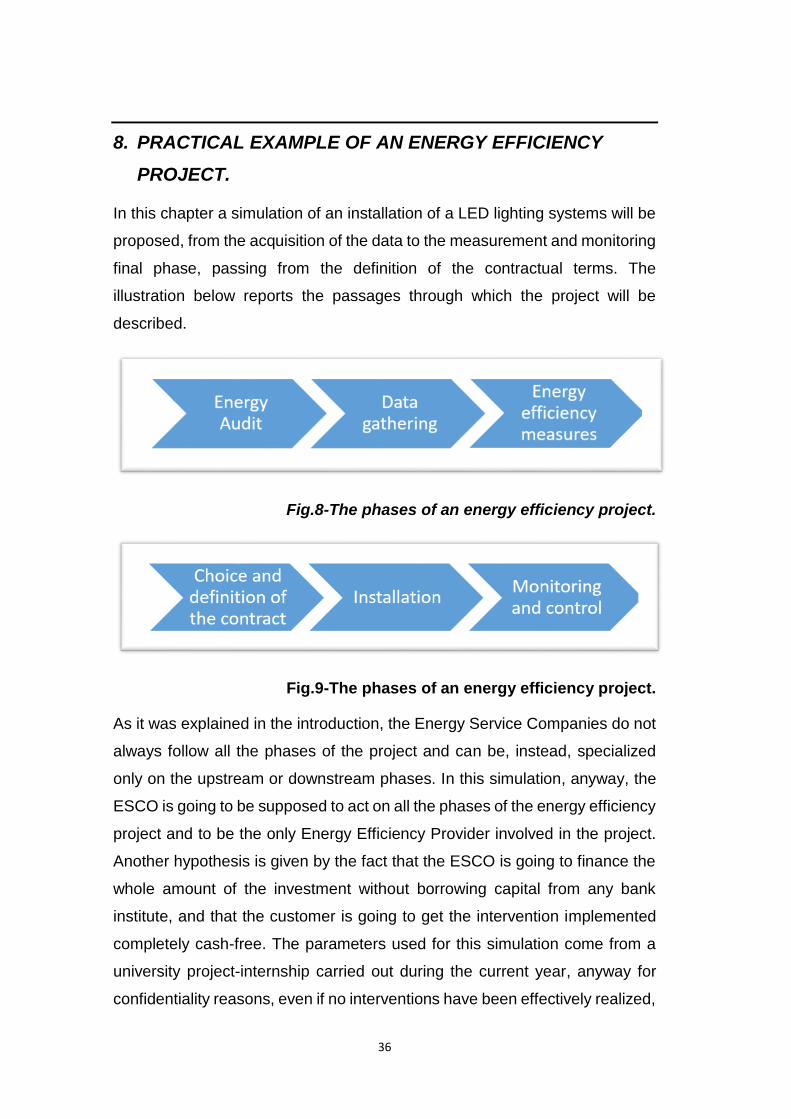
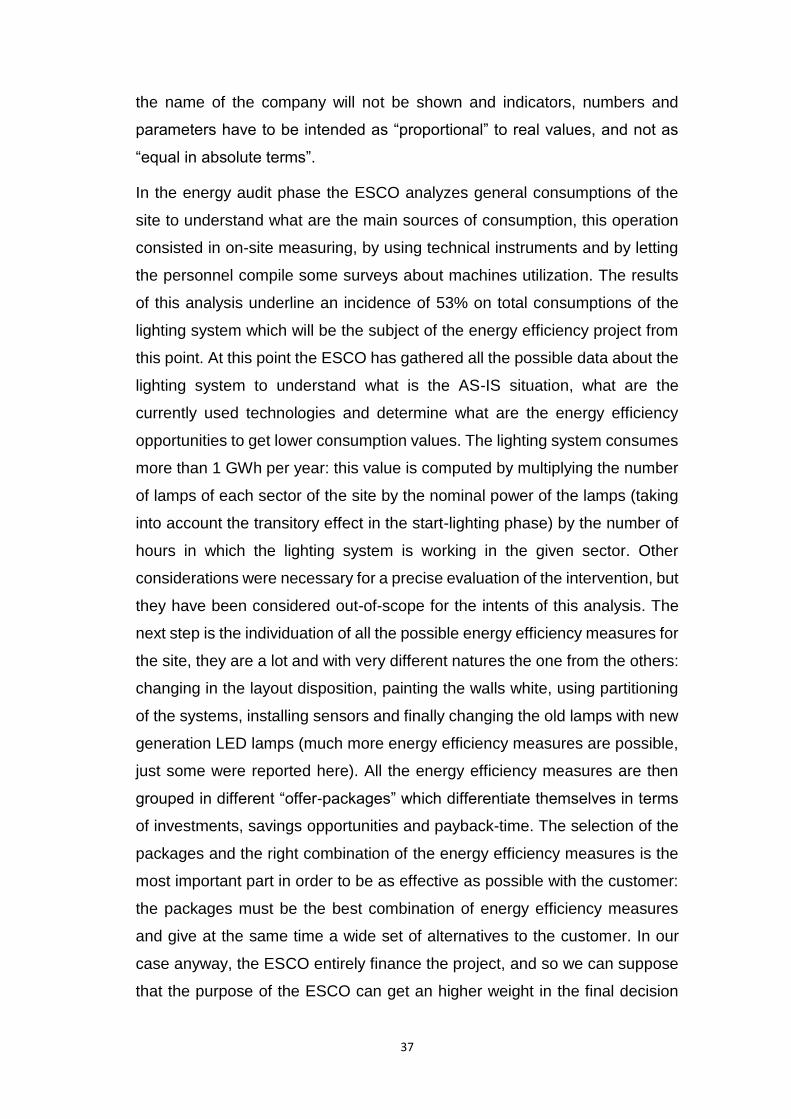
In this chapter a simulation of an installation of a LED lighting systems will be
proposed, from the acquisition of the data to the measurement and monitoring
final phase, passing from the definition of the contractual terms. The
illustration below reports the passages through which the project will be
described.
Fig.8-The phases of an energy efficiency project.
Fig.9-The phases of an energy efficiency project.
As it was explained in the introduction, the Energy Service Companies do not
always follow all the phases of the project and can be, instead, specialized
only on the upstream or downstream phases. In this simulation, anyway, the
ESCO is going to be supposed to act on all the phases of the energy efficiency
project and to be the only Energy Efficiency Provider involved in the project.
Another hypothesis is given by the fact that the ESCO is going to finance the
whole amount of the investment without borrowing capital from any bank
institute, and that the customer is going to get the intervention implemented
completely cash-free. The parameters used for this simulation come from a
university project-internship carried out during the current year, anyway for
confidentiality reasons, even if no interventions have been effectively realized,
37
the name of the company will not be shown and indicators, numbers and
parameters have to be intended as “proportional” to real values, and not as
“equal in absolute terms”.
In the energy audit phase the ESCO analyzes general consumptions of the
site to understand what are the main sources of consumption, this operation
consisted in on-site measuring, by using technical instruments and by letting
the personnel compile some surveys about machines utilization. The results
of this analysis underline an incidence of 53% on total consumptions of the
lighting system which will be the subject of the energy efficiency project from
this point. At this point the ESCO has gathered all the possible data about the
lighting system to understand what is the AS-IS situation, what are the
currently used technologies and determine what are the energy efficiency
opportunities to get lower consumption values. The lighting system consumes
more than 1 GWh per year: this value is computed by multiplying the number
of lamps of each sector of the site by the nominal power of the lamps (taking
into account the transitory effect in the start-lighting phase) by the number of
hours in which the lighting system is working in the given sector. Other
considerations were necessary for a precise evaluation of the intervention, but
they have been considered out-of-scope for the intents of this analysis. The
next step is the individuation of all the possible energy efficiency measures for
the site, they are a lot and with very different natures the one from the others:
changing in the layout disposition, painting the walls white, using partitioning
of the systems, installing sensors and finally changing the old lamps with new
generation LED lamps (much more energy efficiency measures are possible,
just some were reported here). All the energy efficiency measures are then
grouped in different “offer-packages” which differentiate themselves in terms
of investments, savings opportunities and payback-time. The selection of the
packages and the right combination of the energy efficiency measures is the
most important part in order to be as effective as possible with the customer:
the packages must be the best combination of energy efficiency measures
and give at the same time a wide set of alternatives to the customer. In our
case anyway, the ESCO entirely finance the project, and so we can suppose
that the purpose of the ESCO can get an higher weight in the final decision

38
which is supposed to be the one of installing the best configuration possible:
the chosen configuration is an innovative smart-lighting system in which all
the selected energy efficiency measures are integrated to work all together in
an optimized way. It is basically a smart lighting system in which each lighting
fixture is equipped with different sensors such as motion, temperature and
daylight detectors. Each luminaire is then connected to a central server
through a Wi-Fi network, which serves as a controller for the performance of
the fixtures. The site’s personnel could control, wirelessly from the software,
the light utilization based on set parameters. Moreover, they could
automatically set up the system’s luminous output for the day, as well as
checking the status of each luminaire in all circumstances.
The definition of the financial parameters has been carried out by interviewing
some suppliers and so it refers to absolutely valid and real numbers. The
following step is the determination of the forecasted savings, which will be the
base for the definition of the contract parameters with the customer. The
smart-lighting solutions offers incredibly good results in terms of savings, so
that, despite of the very high initial investment needed, the offered paybacks
is inferior to 3 years, which is usually the limit imposed by the majority of the
Italian companies for what concerns investments in energy efficiency
measures. The estimated savings in terms of consumptions are indeed the
90%, this value must obviously be referred to the actual installed technology
of the site (in other cases the same intervention could lead to higher or lower
savings in terms of consumptions) and to the very high degree of
innovativeness of the new one. Considering the price of the energy at 0,158
€/kwh the savings per year have been estimated in 170.000 € as regards the
sole avoided energy consumption. In a second moment also TEE certificates
incomes and incentives have been evaluated and included in the returns.
Instead, as for the cost of the investment all the possible variables have been
taken into consideration: system layout modification costs, cost of the lamps,
costs of installation, insurance costs, disruption costs and VAT at 10% has
been considered too. At this point it is possible to define the investment with
the usual parameters NPV, IRR, ROI and payback-time, as it is reported in
the following tab.
39
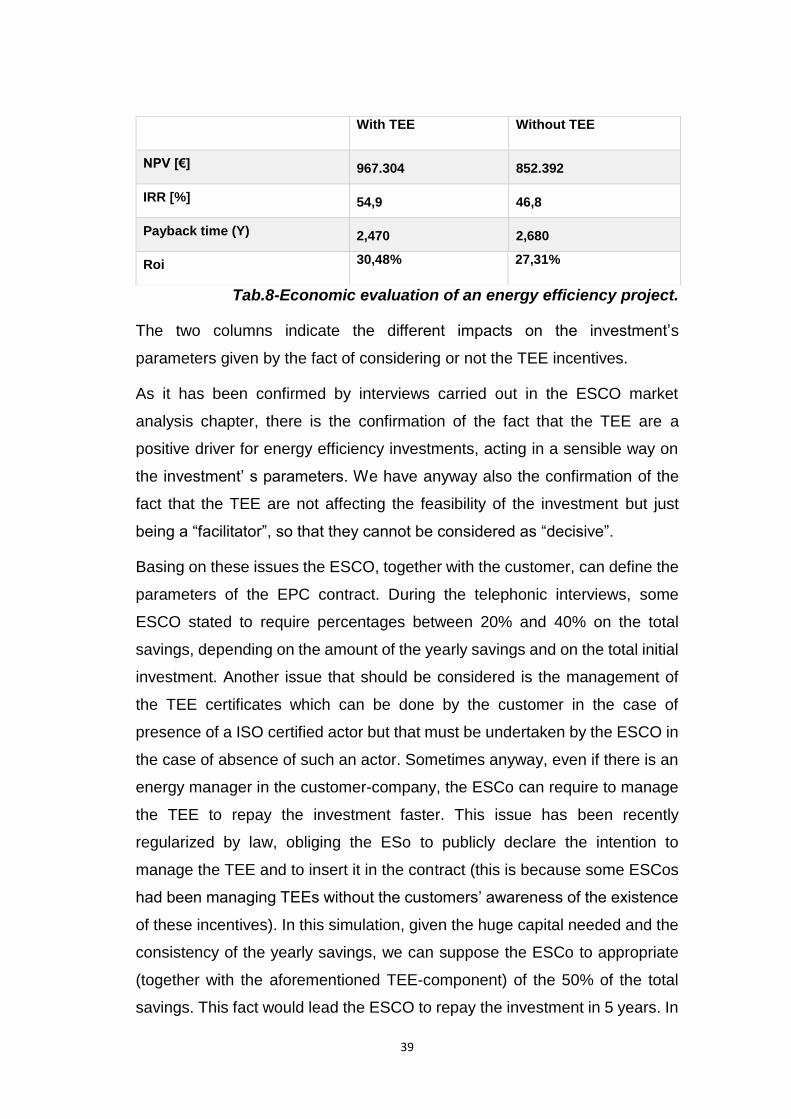
Tab.8-Economic evaluation of an energy efficiency project.
The two columns indicate the different impacts on the investment’s
parameters given by the fact of considering or not the TEE incentives.
As it has been confirmed by interviews carried out in the ESCO market
analysis chapter, there is the confirmation of the fact that the TEE are a
positive driver for energy efficiency investments, acting in a sensible way on
the investment’ s parameters. We have anyway also the confirmation of the
fact that the TEE are not affecting the feasibility of the investment but just
being a “facilitator”, so that they cannot be considered as “decisive”.
Basing on these issues the ESCO, together with the customer, can define the
parameters of the EPC contract. During the telephonic interviews, some
ESCO stated to require percentages between 20% and 40% on the total
savings, depending on the amount of the yearly savings and on the total initial
investment. Another issue that should be considered is the management of
the TEE certificates which can be done by the customer in the case of
presence of a ISO certified actor but that must be undertaken by the ESCO in
the case of absence of such an actor. Sometimes anyway, even if there is an
energy manager in the customer-company, the ESCo can require to manage
the TEE to repay the investment faster. This issue has been recently
regularized by law, obliging the ESo to publicly declare the intention to
manage the TEE and to insert it in the contract (this is because some ESCos
had been managing TEEs without the customers’ awareness of the existence
of these incentives). In this simulation, given the huge capital needed and the
consistency of the yearly savings, we can suppose the ESCo to appropriate
(together with the aforementioned TEE-component) of the 50% of the total
savings. This fact would lead the ESCO to repay the investment in 5 years. In
With TEE Without TEE
NPV [€] 967.304 852.392
IRR [%] 54,9 46,8
Payback time (Y) 2,470 2,680
Roi 30,48% 27,31%
40
the years following the fifth, the percentage of savings in favour of the ESCO
could progressively decrease, letting to the customer the possibility of highest
savings. In the case of this installation, it could be reasonable for the ESCO
to progressively decrease savings almost for another three or four years in
order to get the right profits by the project realization (the shared savings could
be scaled as following: 50%, 40%, 30%, 20%).
These parameters cannot be described in a standardized way, they indeed
strictly depend on the risk level of the intervention and on the yield of the
investment. The installation phase instead is surely the most complex from
the point of view of the operations; even if it is under the responsibility of the
ESCO, it can be carried out by a specialized installer, because of the use of
particular structures or machines and because of specific know-how reasons.
The height of the site is indeed considerable (14 meters) and normally also
the most integrated ESCo do not own the right equipment for such an
installation. Considering the current case of LED-installation a possible
criticality might be the mounting of the new lamps without interrupting the
activities of the site; issues like that must be carefully analysed with the site’s
management because they can decisively affect the profitability of the whole
investment, even if indirectly. Let’s suppose for example that lights must be
changed above a warehouse aisle, in this case the installation should be made
during weekends not to stop freights’ handling, furthermore the platforms to
perform the installation could be twelve meters high or even more, needing
specialized personnel with particular patents and certified machines.
These are only some of the main reasons why ESCos often interact with
specialized installers which have the capability to make non-invasive
interventions and which dispose of the right equipment (sometimes ESCOs
have internal installers but some interventions could have health & safety
requirements which the ESCo’ s installers do not have).
Another issue of the installation phase is the possibility to make it “retrofit”, so
that the previous system can be adapted to the new one, in case of a LED
installation for example, it could be possible to install new lamps into the old
ceilings to reduce the initial cost of the investment. Once the system is finally
working the monitoring phase must guarantee that the terms of the contract
41
are respected, and the results of the monitoring reports must be available in
the same form both for the ESCO and for the Customer.
The main point of the monitoring phase is the determination of the nature of
the increases and the decreases in the final energy bills: to have a good
control of the system performances indeed, it is necessary to understand if
these changings are due to internal or external factors (cost of electricity,
increase or decrease in heating electrical consumptions due to the
temperatures ongoing, higher activities of the site in a certain period and so
on). This “causes’ differentiation” is fundamental from a contractual point of
view, because the responsibility and the guarantees which competes to the
ESCo usually regards the efficient performance of the installed plant and the
effects of the internal factors. In order to do that correctly, it is important that
the monitoring is not made with a “final-balance” modality but that it is carried
out in real time and separated from the other sources of consumptions of the
site. Nowadays, ICT technologies coupled with on-site sensors can play a
fundamental role, by mapping the consumptions of the system and
communicating them to both the parties of the EPC contract. In this way it is
possible to give a real-time and coherent picture of the performances which
allow to differentiate external and internal effects upon performances. The
monitoring phase has not only a “guarantee” function but an improving
function too: indeed it is possible to set the system in a better way thanks to
the data included in the monitoring reports, making it more efficient for the
future (a LED system is not really the better example to show the exploiting of
this function because the only parameter that can be varied is the time during
which the system is switched-on; for heating plants instead, monitoring reports
can be fundamental to set the system with the optimal parameters). The last
function of the monitoring phase is the maintenance one: if the system is
continuously monitored in real-time indeed, it basically allows to carry out a
more specific maintenance and make prompt interventions.

42
9. THE STATE-OF-THE-ART OF THE ITALIAN ENERGY
EFFICIENCY MARKET.
The first variable which must be analyzed when trying to describe a national
energy efficiency market is represented by consumptions because of their
direct impact on this market. Italian industrial consumptions are here reported
per each sector, by using the data of the energy efficiency report 2016 (tertiary
sector is excluded). These data are expressed in absolute terms so that they
have to be compared with the effective dimensions of the single sectors for a
better understanding of the degree of energy intensity of the industry.
Tab.9-Total energy consumptions per industry.
Energy Efficiency Report
It is possible to observe, by consulting the scientific literature, that the
industries with the highest energy intensities are the cement production
industry, the cold storage industry, the pulp and paper and the glass industry.
The first consideration that can be done is that energy intensity of a company
is not mandatorily linear with total consumptions: if we consider energy
intensity as the energy consumed for the unit of profit it depends on the value
of the products, and it is the same thing if we take the weight unit as a
reference to refer the energy consumed. It is almost clear that the real
inclination to energy efficiency of a company won’t be directly addressed to its
consumptions, but instead, to the incidence of these lasts on turnovers or
costs. Other considerations about energy efficiency inclination can be done
by considering the state of the technology used by the different industries:
INDUSTRIAL SECTOR TOTAL ENERGY CONSUMPTION [mld €]
Metallurgy 17,1
Mechanical 11
Food 10,2
Chemical 8,75
Paper 6,5
Products for building 6,45
Glass and Ceramic 5,4
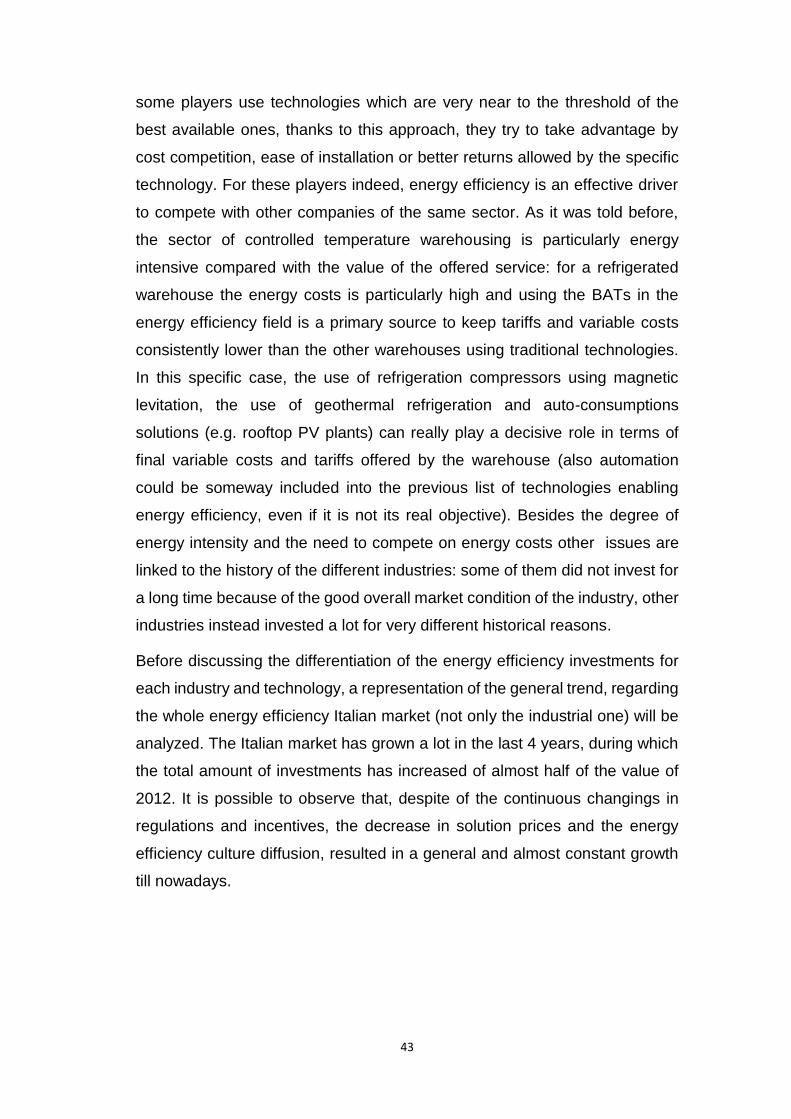
43
some players use technologies which are very near to the threshold of the
best available ones, thanks to this approach, they try to take advantage by
cost competition, ease of installation or better returns allowed by the specific
technology. For these players indeed, energy efficiency is an effective driver
to compete with other companies of the same sector. As it was told before,
the sector of controlled temperature warehousing is particularly energy
intensive compared with the value of the offered service: for a refrigerated
warehouse the energy costs is particularly high and using the BATs in the
energy efficiency field is a primary source to keep tariffs and variable costs
consistently lower than the other warehouses using traditional technologies.
In this specific case, the use of refrigeration compressors using magnetic
levitation, the use of geothermal refrigeration and auto-consumptions
solutions (e.g. rooftop PV plants) can really play a decisive role in terms of
final variable costs and tariffs offered by the warehouse (also automation
could be someway included into the previous list of technologies enabling
energy efficiency, even if it is not its real objective). Besides the degree of
energy intensity and the need to compete on energy costs other issues are
linked to the history of the different industries: some of them did not invest for
a long time because of the good overall market condition of the industry, other
industries instead invested a lot for very different historical reasons.
Before discussing the differentiation of the energy efficiency investments for
each industry and technology, a representation of the general trend, regarding
the whole energy efficiency Italian market (not only the industrial one) will be
analyzed. The Italian market has grown a lot in the last 4 years, during which
the total amount of investments has increased of almost half of the value of
2012. It is possible to observe that, despite of the continuous changings in
regulations and incentives, the decrease in solution prices and the energy
efficiency culture diffusion, resulted in a general and almost constant growth
till nowadays.
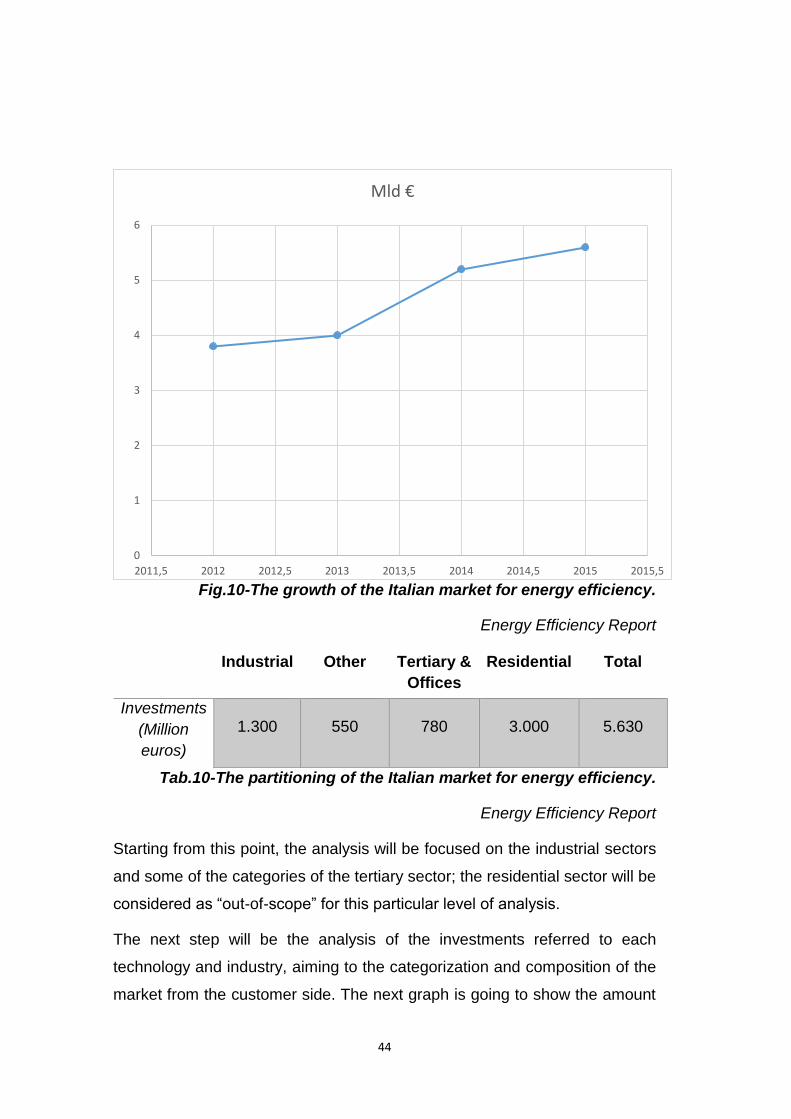
44
Fig.10-The growth of the Italian market for energy efficiency.
Energy Efficiency Report
Tab.10-The partitioning of the Italian market for energy efficiency.
Energy Efficiency Report
Starting from this point, the analysis will be focused on the industrial sectors
and some of the categories of the tertiary sector; the residential sector will be
considered as “out-of-scope” for this particular level of analysis.
The next step will be the analysis of the investments referred to each
technology and industry, aiming to the categorization and composition of the
market from the customer side. The next graph is going to show the amount
Industrial Other Tertiary &
Offices
Residential Total
Investments
(Million
euros)
1.300
550
780
3.000
5.630
0
1
2
3
4
5
6
2011,5 2012 2012,5 2013 2013,5 2014 2014,5 2015 2015,5
Mld €

45
of investments divided per sector, showing the shares of the different
technology installation for each sector. This view is sector specific, it helps to
understand what are the industries investing more in absolute value and to
identify the technologies which have a major impact in terms of investments
undertaken by the different industrial sectors.
Fig.11-The partitioning of the investments per sector.
Energy Efficiency Report
This second graph is instead going to show the amount of investments for
each energy efficient technology. The total amount of investments considered
is the same of the previous graph, which corresponds to the 1.300 million
euros of the sole industrial sector.
0 50 100 150 200 250 300 350 400
FOOD & BEVERAGE
PULP & PAPER
CHEMICALS
MECANICS
METALLURGY
BUILDINGS
GLASS & CERAMICS
The investments per sector
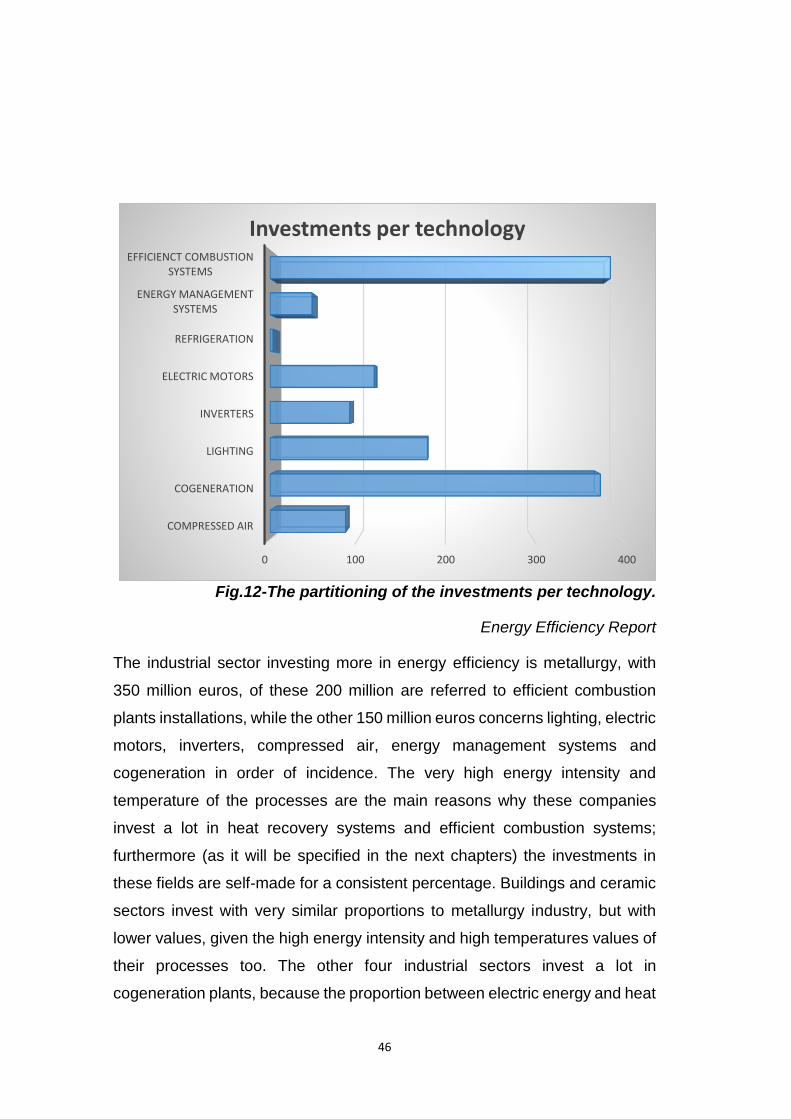
46
Fig.12-The partitioning of the investments per technology.
Energy Efficiency Report
The industrial sector investing more in energy efficiency is metallurgy, with
350 million euros, of these 200 million are referred to efficient combustion
plants installations, while the other 150 million euros concerns lighting, electric
motors, inverters, compressed air, energy management systems and
cogeneration in order of incidence. The very high energy intensity and
temperature of the processes are the main reasons why these companies
invest a lot in heat recovery systems and efficient combustion systems;
furthermore (as it will be specified in the next chapters) the investments in
these fields are self-made for a consistent percentage. Buildings and ceramic
sectors invest with very similar proportions to metallurgy industry, but with
lower values, given the high energy intensity and high temperatures values of
their processes too. The other four industrial sectors invest a lot in
cogeneration plants, because the proportion between electric energy and heat
0 100 200 300 400
COMPRESSED AIR
COGENERATION
LIGHTING
INVERTERS
ELECTRIC MOTORS
REFRIGERATION
ENERGY MANAGEMENT SYSTEMS
EFFICIENCT COMBUSTION SYSTEMS
Investments per technology
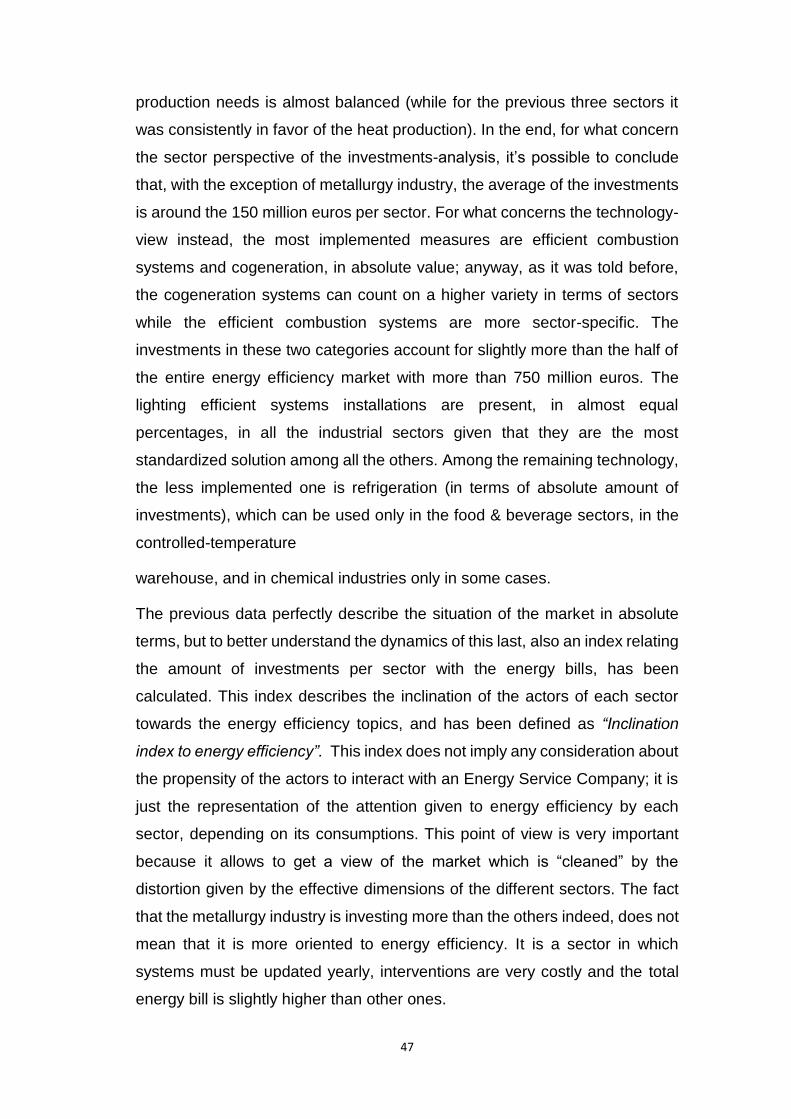
47
production needs is almost balanced (while for the previous three sectors it
was consistently in favor of the heat production). In the end, for what concern
the sector perspective of the investments-analysis, it’s possible to conclude
that, with the exception of metallurgy industry, the average of the investments
is around the 150 million euros per sector. For what concerns the technology-
view instead, the most implemented measures are efficient combustion
systems and cogeneration, in absolute value; anyway, as it was told before,
the cogeneration systems can count on a higher variety in terms of sectors
while the efficient combustion systems are more sector-specific. The
investments in these two categories account for slightly more than the half of
the entire energy efficiency market with more than 750 million euros. The
lighting efficient systems installations are present, in almost equal
percentages, in all the industrial sectors given that they are the most
standardized solution among all the others. Among the remaining technology,
the less implemented one is refrigeration (in terms of absolute amount of
investments), which can be used only in the food & beverage sectors, in the
controlled-temperature
warehouse, and in chemical industries only in some cases.
The previous data perfectly describe the situation of the market in absolute
terms, but to better understand the dynamics of this last, also an index relating
the amount of investments per sector with the energy bills, has been
calculated. This index describes the inclination of the actors of each sector
towards the energy efficiency topics, and has been defined as “Inclination
index to energy efficiency”. This index does not imply any consideration about
the propensity of the actors to interact with an Energy Service Company; it is
just the representation of the attention given to energy efficiency by each
sector, depending on its consumptions. This point of view is very important
because it allows to get a view of the market which is “cleaned” by the
distortion given by the effective dimensions of the different sectors. The fact
that the metallurgy industry is investing more than the others indeed, does not
mean that it is more oriented to energy efficiency. It is a sector in which
systems must be updated yearly, interventions are very costly and the total
energy bill is slightly higher than other ones.

48
The results need to be carefully analyzed: the sectors with a high incidence of
energy costs are the most inclined to energy efficiency, anyway they are also
sectors belonging to the “Process industry”, in which physical and chemical
transformations together with manufacturing procedures are very well
consolidated. This means that the energy efficiency issues have been an
Tab.11-The inclination index towards energy efficiency.
Energy Efficiency Report
“everyday challenge” for these sectors and today the companies themselves
are the major experts in that field. Paper, Glass and Metallurgy companies
perceive energy efficiency as a necessity and as a source of cost
competitiveness. Sometimes the level of attention to these topics is related to
historical events or to the conditions of the market in which the company
operates. The propensity to energy efficiency anyway, has neither to be
related only to energy consumptions’ absolute values nor to green-image,
eco-labelling or policy reasons. A wide set of external conditions influences
indeed the ongoing and trends of the energy efficiency market in a given
sector and these conditions can slightly change overtime. Difficult general
conditions of a market, or lacks of liquidity could distract the management from
these topics or could have the opposite effect. To give an example, after the
crisis of the textile sector, some Italian companies were found to be very
inclined to energy efficiency, because of the necessity to reduce costs as
much as possible: this could appear to be a very strange trend for a sector
which is in low liquidity conditions but it revealed to be a driver to compete on
costs with Chinese companies, which also had to deal with expedition costs
INDUSTRIAL SECTOR INCLINATION INDEX
Paper 2,8
Glass 2,67
Products for building 2,47
Metallurgy 2,07
Chemical 1,60
Mechanical 1,59
Food 1,36
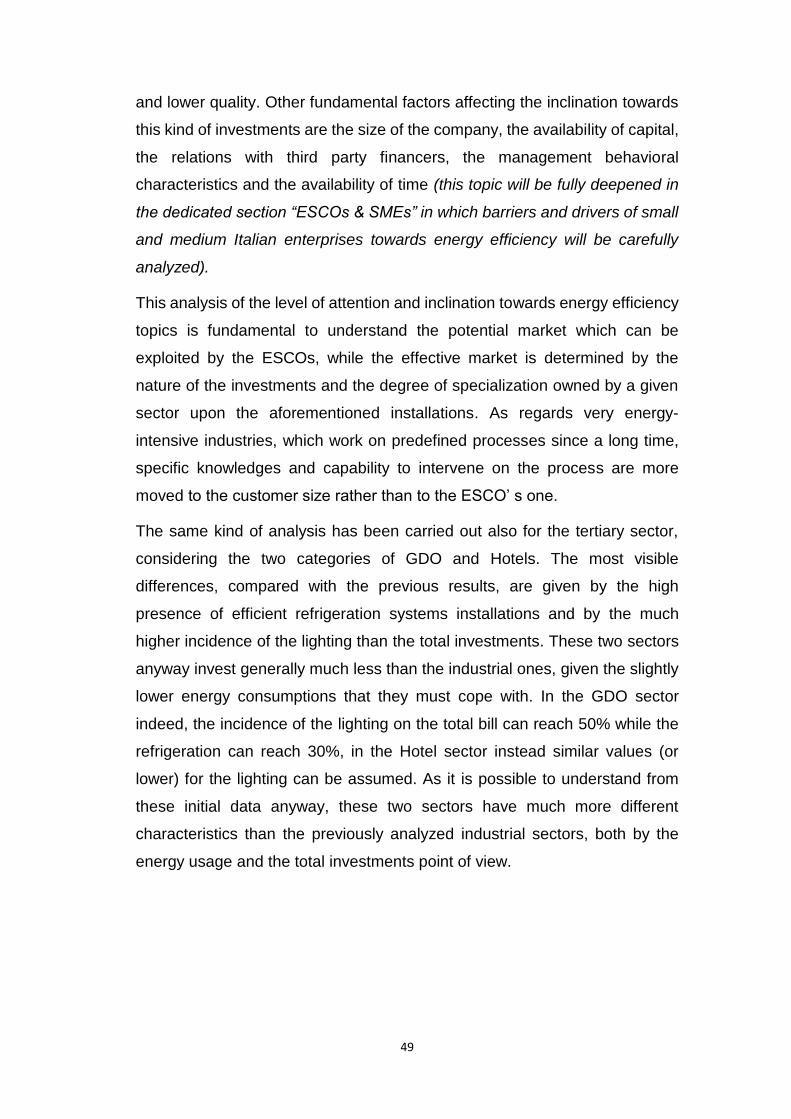
49
and lower quality. Other fundamental factors affecting the inclination towards
this kind of investments are the size of the company, the availability of capital,
the relations with third party financers, the management behavioral
characteristics and the availability of time (this topic will be fully deepened in
the dedicated section “ESCOs & SMEs” in which barriers and drivers of small
and medium Italian enterprises towards energy efficiency will be carefully
analyzed).
This analysis of the level of attention and inclination towards energy efficiency
topics is fundamental to understand the potential market which can be
exploited by the ESCOs, while the effective market is determined by the
nature of the investments and the degree of specialization owned by a given
sector upon the aforementioned installations. As regards very energy-
intensive industries, which work on predefined processes since a long time,
specific knowledges and capability to intervene on the process are more
moved to the customer size rather than to the ESCO’ s one.
The same kind of analysis has been carried out also for the tertiary sector,
considering the two categories of GDO and Hotels. The most visible
differences, compared with the previous results, are given by the high
presence of efficient refrigeration systems installations and by the much
higher incidence of the lighting than the total investments. These two sectors
anyway invest generally much less than the industrial ones, given the slightly
lower energy consumptions that they must cope with. In the GDO sector
indeed, the incidence of the lighting on the total bill can reach 50% while the
refrigeration can reach 30%, in the Hotel sector instead similar values (or
lower) for the lighting can be assumed. As it is possible to understand from
these initial data anyway, these two sectors have much more different
characteristics than the previously analyzed industrial sectors, both by the
energy usage and the total investments point of view.

50
Fig.13-The investments in GDO and Hotels.
Energy Efficiency Report
The value of the inclination index is lower than the industrial sectors and, as it
is reported in the tab below, it is a bit higher for the GDO.
Tab.12-The inclination index for GDO and Hotels.
Energy Efficiency Report
The next step for better understanding the Italian energy efficiency market is
to deepen what is the portion of each sector-specific market competing to the
ESCOs, to finally obtain the total amount of carried out investments. These
values will be very interesting in terms of comparison with the ones obtained
by the interviews of the next chapter, which concerns the revenues streams
for the single ESCOs; the proportions among the investments and then among
revenues streams coming from each sector indeed, should be generally
confirmed.
0 10 20 30 40 50 60 70 80
GDO
HOTEL
The investments per sector
TERTIARY SECTOR INCLINATION INDEX
GDO 1,57
Hotel 1,44

51
Fig.14-Detailed investments of Food industry.
Energy Efficiency Report
Fig.15-Detailed investments of Paper industry.
Energy Efficiency Report
19,9
64,5
73,9
0 10 20 30 40 50 60 70 80
TEE
ESCO
SELF MADE
[MLN
€]
FOOD
33,5
11,5
170,8
0 20 40 60 80 100 120 140 160 180
TEE
ESCO
SELF MADE
[MLN
€]
PAPER

52
Fig.16-Detailed investments of Chemical industry.
Energy Efficiency Report
Fig.17-Detailed Investments of Mechanical industry.
Energy Efficiency Report
22,4
42
97,9
0 20 40 60 80 100 120
TEE
ESCO
SELF MADE
[MLN
€]
CHEMICAL
25,1
66
108,7
0 20 40 60 80 100 120
TEE
ESCO
SELF MADE
[MLN
€]
MECHANICAL
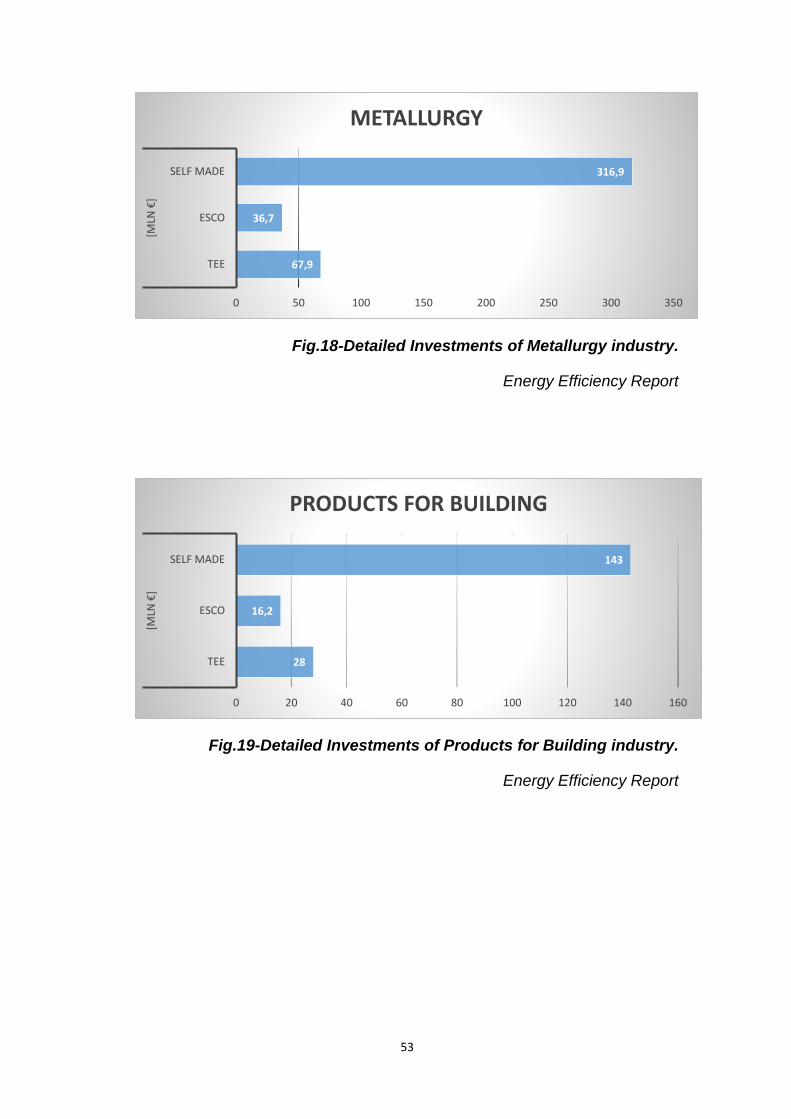
53
Fig.18-Detailed Investments of Metallurgy industry.
Energy Efficiency Report
Fig.19-Detailed Investments of Products for Building industry.
Energy Efficiency Report
67,9
36,7
316,9
0 50 100 150 200 250 300 350
TEE
ESCO
SELF MADE
[MLN
€]
METALLURGY
28
16,2
143
0 20 40 60 80 100 120 140 160
TEE
ESCO
SELF MADE
[MLN
€]
PRODUCTS FOR BUILDING

54
Fig.20-Detailed investments of Glass industry.
Energy Efficiency Report
Fig.21-Detailed investments of the GDO industry.
Energy Efficiency Report
25,4
14,2
130
0 20 40 60 80 100 120 140
TEE
ESCO
SELF MADE
[MLN
€]
GLASS
11,2
32,6
45
0 5 10 15 20 25 30 35 40 45 50
TEE
ESCO
SELF MADE
[MLN
€]
GDO

55
Fig.22-Detailed investments of the Hotel industry.
Energy Efficiency Report
It is possible to observe that the three sectors with the majority of ESCOs’
investments are the Food & Beverage, the Building and the Chemical sectors,
while Metallurgy and Paper are the one where ESCOs invest less. The
metallurgy and paper industries are the two industries showing the highest
self-made investments (in particular metallurtgy with 353,8 mln €).
At this point a synthesis is needed, the ESCOs investments in the Italian
market are a consistent share, and for some industries they are a fundamental
one. The total amount of ESCOs’ investments is fixed at 303 million € which
correspond to 21,2% of the total. The self-made investments are preponderant
when concerning energy efficiency interventions on core processes with an
amount of 922 million €. The ESCOs, on the other side, execute 40% of the
total non-core projects. As it is shown in the two next graphs ESCOs invest
less in absolute value and are concentrated for more than 60% on non-core
activities.
7,8
19,8
34,2
0 5 10 15 20 25 30 35 40
TEE
ESCO
SELF MADE
[MLN
€]
HOTEL
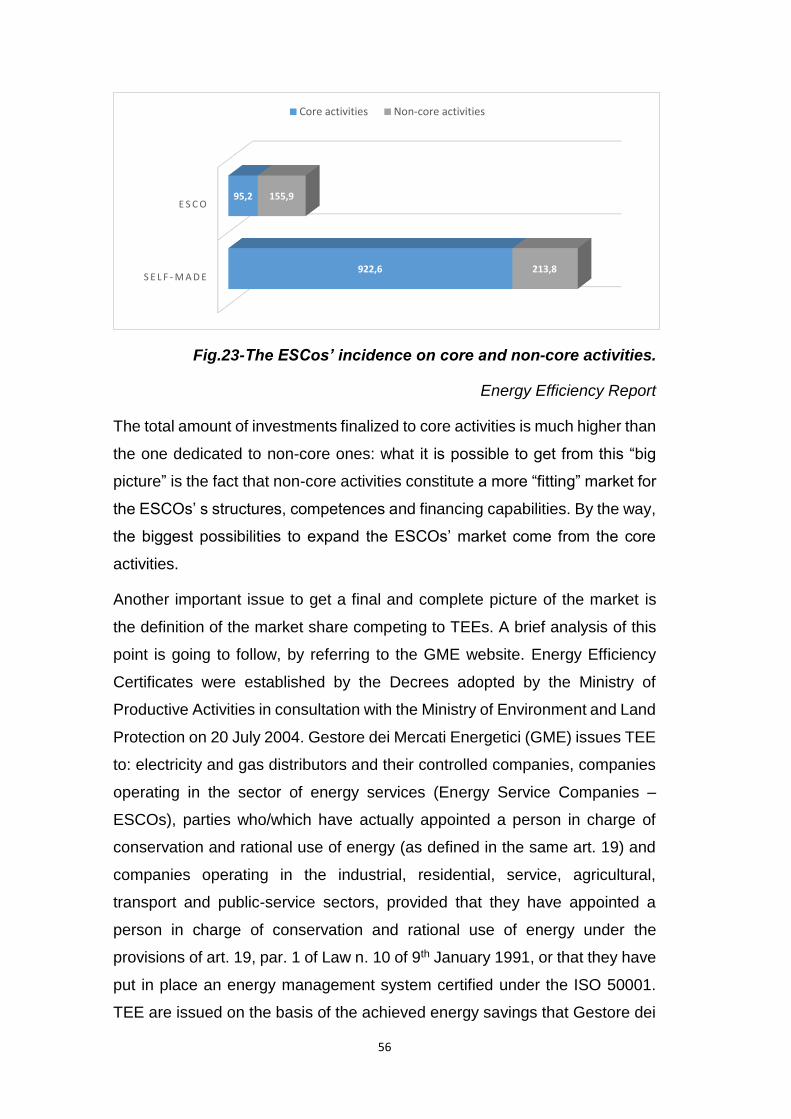
56
Fig.23-The ESCos’ incidence on core and non-core activities.
Energy Efficiency Report
The total amount of investments finalized to core activities is much higher than
the one dedicated to non-core ones: what it is possible to get from this “big
picture” is the fact that non-core activities constitute a more “fitting” market for
the ESCOs’ s structures, competences and financing capabilities. By the way,
the biggest possibilities to expand the ESCOs’ market come from the core
activities.
Another important issue to get a final and complete picture of the market is
the definition of the market share competing to TEEs. A brief analysis of this
point is going to follow, by referring to the GME website. Energy Efficiency
Certificates were established by the Decrees adopted by the Ministry of
Productive Activities in consultation with the Ministry of Environment and Land
Protection on 20 July 2004. Gestore dei Mercati Energetici (GME) issues TEE
to: electricity and gas distributors and their controlled companies, companies
operating in the sector of energy services (Energy Service Companies –
ESCOs), parties who/which have actually appointed a person in charge of
conservation and rational use of energy (as defined in the same art. 19) and
companies operating in the industrial, residential, service, agricultural,
transport and public-service sectors, provided that they have appointed a
person in charge of conservation and rational use of energy under the
provisions of art. 19, par. 1 of Law n. 10 of 9th January 1991, or that they have
put in place an energy management system certified under the ISO 50001.
TEE are issued on the basis of the achieved energy savings that Gestore dei
S E L F - M A D E
E S C O
922,6
95,2
213,8
155,9
Core activities Non-core activities
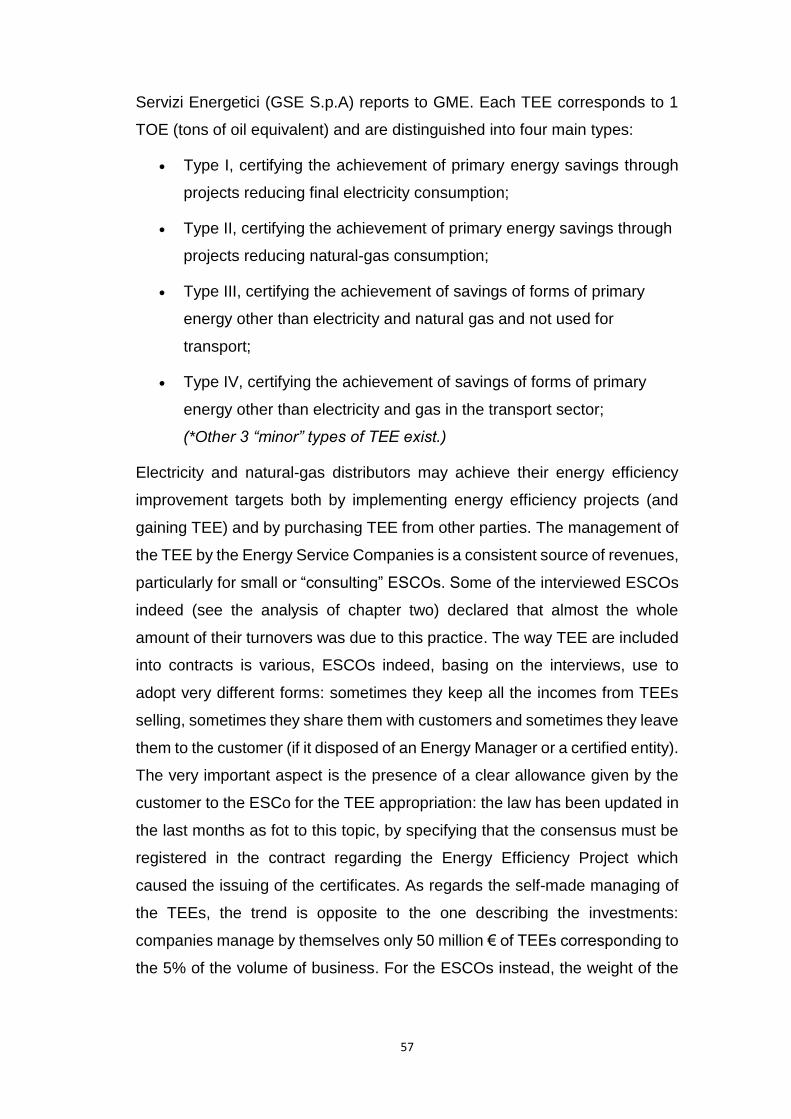
57
Servizi Energetici (GSE S.p.A) reports to GME. Each TEE corresponds to 1
TOE (tons of oil equivalent) and are distinguished into four main types:
Type I, certifying the achievement of primary energy savings through
projects reducing final electricity consumption;
Type II, certifying the achievement of primary energy savings through
projects reducing natural-gas consumption;
Type III, certifying the achievement of savings of forms of primary
energy other than electricity and natural gas and not used for
transport;
Type IV, certifying the achievement of savings of forms of primary
energy other than electricity and gas in the transport sector;
(*Other 3 “minor” types of TEE exist.)
Electricity and natural-gas distributors may achieve their energy efficiency
improvement targets both by implementing energy efficiency projects (and
gaining TEE) and by purchasing TEE from other parties. The management of
the TEE by the Energy Service Companies is a consistent source of revenues,
particularly for small or “consulting” ESCOs. Some of the interviewed ESCOs
indeed (see the analysis of chapter two) declared that almost the whole
amount of their turnovers was due to this practice. The way TEE are included
into contracts is various, ESCOs indeed, basing on the interviews, use to
adopt very different forms: sometimes they keep all the incomes from TEEs
selling, sometimes they share them with customers and sometimes they leave
them to the customer (if it disposed of an Energy Manager or a certified entity).
The very important aspect is the presence of a clear allowance given by the
customer to the ESCo for the TEE appropriation: the law has been updated in
the last months as fot to this topic, by specifying that the consensus must be
registered in the contract regarding the Energy Efficiency Project which
caused the issuing of the certificates. As regards the self-made managing of
the TEEs, the trend is opposite to the one describing the investments:
companies manage by themselves only 50 million € of TEEs corresponding to
the 5% of the volume of business. For the ESCOs instead, the weight of the
58
TEE is significant and equal to 241 million €, which must be added to the 303
million € coming from the investments.
The graph below reports the incidence of the volume of business deriving from
the TEE management and from the investments.
Fig.24-The incidence of the TEE on the investments.
Energy Efficiency Report
The low portion of the TEE in the self-made investments market is mainly due
to the lack of certified Energy Managers that can manage these certificates
(In Italy the qualification finalized to handle the TEE’s management is
indicated by the wording “Esperto in Gestione dell’Energia” or “EGE”. ESCOs
usually have much more available channels to sell certificates and this is a
fundamental driver to reduce the time needed to transform the TEEs into cash
and to sell them at the right moment considering the prices on the market.
These are the main reasons why the TEE market is almost completely
controlled by ESCOs accounting, in some cases, for more than the half of their
revenues. The low portion of the TEE gives an idea of their role into the
market: they are very good form of incentive but usually do not affect the
investments’ feasibility; furthermore, their concept is fundamental to link the
industrial players to the energy efficiency targets. In other words, they are a
sort of global guarantee of consumptions reductions and they are globally
recognized too: that is a fundamental fact to homogenize the European market
country by country.
S E L F - M A D E
E S C O
50
241
1120
303
TEE Investments

59
To conclude this chapter, a brief summarize of the market will be provided:
the final total investments market dimension is 5,63 mld € of which 654 mln
come from ESCOs and 4.970 are self-made. For what concerns revenues
ESCOs account for a total of 1,54 mld € of which 454 mln € come from the
TEEs management, 330 mln from the provision of additional services (like the
“servizio calore”) and the remaining 654 mln from the investments.
60
10. METHODOLOGY OF THE ANALYSIS
The analysis of the ESCo-market will be carried out by using two different
types of approaches (which will be explained later in this chapter) which both
bases on the results of 20 telephonic interviews. The total number of
telephonic interviews has actually been greater than 20, but the whole sample
included some data which would have distorted the analysis from a numerical
point of view. Furthermore, only certified ESCos have been included in the
final results to guarantee a major overall conformity of the analysis. The
interviews which have not been included in the final twenty ones, have been
anyway very useful to understand the global nature and state of art of a market
in which still a big part of the Energy Service Providers are not certified
entities.
The interviews were structured with standardized questions; when it was
possible, (when the ESCo considered as “not confidential” the required data)
the interviewed were asked to answer by providing absolute values, while in
other cases, they answered in percentage terms (in this case the answers
have been compared with total revenues from AIDA, to get a reliable order of
magnitude of the provided data).
The questions regarded both the market-positioning of the ESCos and their
contractual-portfolio, these two areas of analysis allowed the redaction of 4
big sets of results:
1)The ESCo market analysis by technology.
2)The ESCo market analysis by sector.
3)The ESCo market cross-sectional analysis (coupling technologies and
markets).
4)The ESCo market analysis by contract.
In the next pages an anonymous example of telephonic survey is presented.
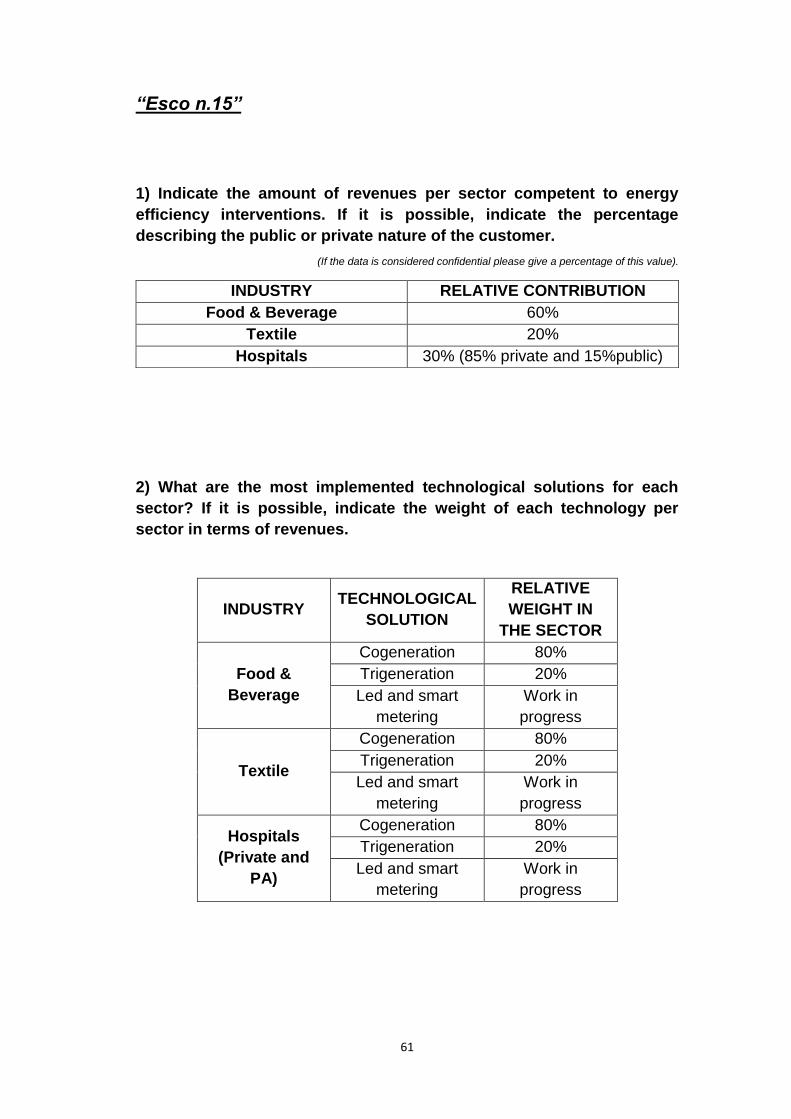
61
“Esco n.15”
1) Indicate the amount of revenues per sector competent to energy
efficiency interventions. If it is possible, indicate the percentage
describing the public or private nature of the customer.
(If the data is considered confidential please give a percentage of this value).
2) What are the most implemented technological solutions for each
sector? If it is possible, indicate the weight of each technology per
sector in terms of revenues.
INDUSTRY TECHNOLOGICAL
SOLUTION
RELATIVE
WEIGHT IN
THE SECTOR
Food &
Beverage
Cogeneration 80%
Trigeneration 20%
Led and smart
metering
Work in
progress
Textile
Cogeneration 80%
Trigeneration 20%
Led and smart
metering
Work in
progress
Hospitals
(Private and
PA)
Cogeneration 80%
Trigeneration 20%
Led and smart
metering
Work in
progress
INDUSTRY RELATIVE CONTRIBUTION
Food & Beverage 60%
Textile 20%
Hospitals 30% (85% private and 15%public)

62
3) Indicate what are the contractual forms of your contracts-portfolio
and, per each technological solution, show the most “fitting” ones. If it
possible, indicate the weight on the total revenues.
4) Other information:
-Guaranteed savings.
-10 years average duration for EPCs.
-Data related to the quote of savings reserved to the customers: 20% (fixed
for the whole duration of the contract) from the first year.
-There is the possibility to vary it depending on the energy prices’ ongoing.
CONTRACTUAL
FORM
RELATIVE
CONTRIBUTION
Turnkey contract Almost zero
EPC contract with
financial risk borne
by the customer
40%
EPC contract with
financial risk borne
by the ESCo
60%
EPC contract with
energy trading
Almost zero
INDUSTRY TECHNOLOGICAL
SOLUTION CONTRACTUAL FORM
Food & Beverage
Cogeneration EPC – ESCo’s RISK
Trigeneration EPC – ESCo’s RISK
Led and smart
metering
Work in progress
Textile
Cogeneration EPC – ESCo’s RISK
Trigeneration EPC – ESCo’s RISK
Led and smart
metering
Work in progress
Hospitals
Cogeneration EPC – ESCo’s RISK
Trigeneration EPC – ESCo’s RISK
Led and smart
metering
Work in progress
63
After the compilation of these forms, a more “general” conversation about
qualitative aspects usually followed the standard survey, this operation was
fundamental to get the a good idea of the effective perception which the
service providers have about their market.
The results have been analyzed with two different approaches: the first one
consisted in a proportional comparison of the specific revenues of the sample
and the total revenues of the ESCO industry (From the Energy Efficiency
Report 2016). The second approach instead, has been developed to avoid
distortions in the results, caused by the possible wrong representativeness
that so little a sample could give: for this reason, the analysis was made on
percentages and not on absolute values.
The first approach is supposed to be more quantitative and specific for what
concerns the description of the sample, while the second one is supposed to
give a better general description of the ESCO market. The two approaches
will be replicated for every chapter (Analysis by sector, analysis by technology
and cross-sectional analysis) so that a precise and specific picture of the
sample and a general description of the industry will be contextually given.
The first step consists in showing the revenues of the sample coming from
each customer-industry and related technology. The revenues must be
considered as cleaned of their amount coming from the TEE management
which has been supposed in the order of 40%, based on the data of the energy
efficiency report 2016. The analyzed industries are: paper, chemical, glass-
ceramic-bricks (g.c.b from this point on), metallurgy, mechanics, food and
beverage (f&b from this point on), textile, pharma, building, publishing and
printing (p&p from this point on), plastics, hospital, public administrations,
private offices, hotels and sport centers (hotels from this point on) and GDO
& logistics (GDO from this point on). The analyzed technologies instead are:
co/trigeneration (gogeneration from this point on), leds and oleds (LED from
this point on), organic rankine cycles and heat recoveries (ORC from this point
on), heat pumps, inverters, buildings upgrading, electric motors, renewables,
compressed air, metering and refrigeration.

64
The revenues for each ESCO has been obtained by consulting the AIDA
database, in the case of ESCOs which are spin-offs of a corporate,
considerations on the corporate revenues have been carried out to come up
to the final value. In the next tab a first sight of the data of the sample is
provided, the goal of the analysis will be the discussion of these data from the
three perspectives of industries, technologies and cross-sectional analysis, by
using the two approaches explained before to provide final considerations
about macro-trends and future possibilities.
Another observation regards the choice of shifting the investments in logistics
from the single sectors to the GDO category, this was due to the high
incidence of the investments in logistics, to their different nature with respect
to the industry-specific ones and to their similar nature among different
industries. To give an example the led substitution in the warehouses of a
mechanic or textile company are almost similar interventions even if they are
carried out in two companies which have completely different priorities for
what concerns the energy efficiency issues. In other words separating the
interventions in the input/output logistics activities allows to allocate to the
different industries only the industry-specific more typical interventions, with
the result to get a more representative analysis (cleaned of the “logistics
component”). Another factor which lead to this choice has been the increasing
market of the logistics contractors, which is contributing to the composition of
a stand-alone industry of logistics, with different needs from the others in terms
of energy efficiency issues.
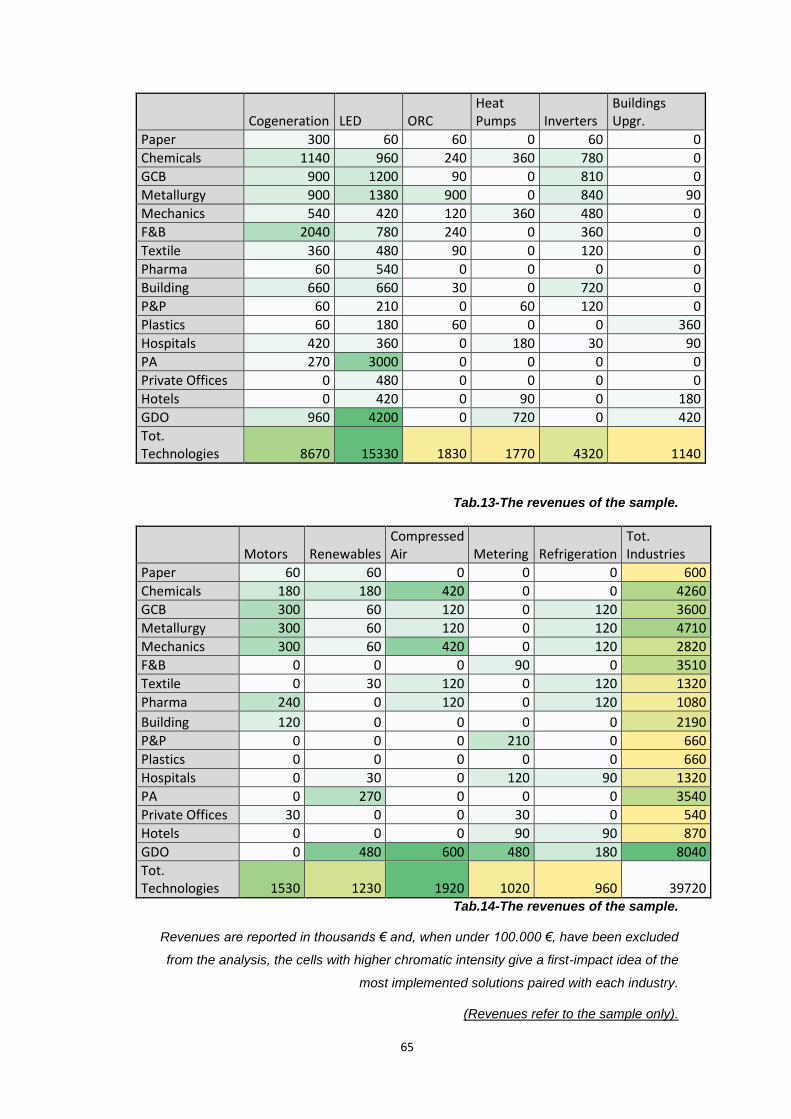
65
Cogeneration LED ORC Heat Pumps Inverters
Buildings Upgr.
Paper 300 60 60 0 60 0
Chemicals 1140 960 240 360 780 0
GCB 900 1200 90 0 810 0
Metallurgy 900 1380 900 0 840 90
Mechanics 540 420 120 360 480 0
F&B 2040 780 240 0 360 0
Textile 360 480 90 0 120 0
Pharma 60 540 0 0 0 0
Building 660 660 30 0 720 0
P&P 60 210 0 60 120 0
Plastics 60 180 60 0 0 360
Hospitals 420 360 0 180 30 90
PA 270 3000 0 0 0 0
Private Offices 0 480 0 0 0 0
Hotels 0 420 0 90 0 180
GDO 960 4200 0 720 0 420
Tot. Technologies 8670 15330 1830 1770 4320 1140
Tab.13-The revenues of the sample.
Motors Renewables Compressed Air Metering Refrigeration
Tot. Industries
Paper 60 60 0 0 0 600
Chemicals 180 180 420 0 0 4260
GCB 300 60 120 0 120 3600
Metallurgy 300 60 120 0 120 4710
Mechanics 300 60 420 0 120 2820
F&B 0 0 0 90 0 3510
Textile 0 30 120 0 120 1320
Pharma 240 0 120 0 120 1080
Building 120 0 0 0 0 2190
P&P 0 0 0 210 0 660
Plastics 0 0 0 0 0 660
Hospitals 0 30 0 120 90 1320
PA 0 270 0 0 0 3540
Private Offices 30 0 0 30 0 540
Hotels 0 0 0 90 90 870
GDO 0 480 600 480 180 8040
Tot. Technologies 1530 1230 1920 1020 960 39720
Tab.14-The revenues of the sample.
Revenues are reported in thousands € and, when under 100.000 €, have been excluded
from the analysis, the cells with higher chromatic intensity give a first-impact idea of the
most implemented solutions paired with each industry.
(Revenues refer to the sample only).

66
11. THE ESCO MARKET ANALYSIS BY INDUSTRY AND
TECHNOLOGY.
11.1 Results and comments by industry.
11.1.1 The “revenues-proportional” approach.
Fig.25-The revenues of sample per industry.
By using this approach the dimension of the single ESCOs is taken into
account, given that the percentage of the volume of business declared during
the interviews has been multiplied by the revenues provided by AIDA
67
database. This gives a very quantitatively and precise idea of the sample, but
can create distortions when reported to the total revenues of the entire ESCO
industry (because of the presence of big players or conversely, of smaller
ones). The dimension of the analyzed sample corresponds to 20 ESCOs
which are about one tenth of the total Italian ESCOs, and the revenues
referred to it are about 40 million. Considering that the revenues of the whole
market are 624 million euros (without TEEs and residential sector), it is
possible to conclude that the average dimension of the companies in the
sample in terms of revenues is smaller than the average of the whole market.
In the next figure the revenues streams are divided into sub-streams for each
customer-industry served by the energy efficiency services market.
The interviews revealed a very low diffusion of residential projects, indeed
just one ESCO declared to get almost the 30% of its revenues from this
market, by installing building envelopes in new residential buildings
(technology on which the player was particularly specialized) and heat pumps.
Although a specific section for the residential sector was not included in the
survey, every company was asked to describe the reasons why they did not
enter the market and the reasons why they did not succeed in doing it in case
they tried. The first underlined barrier to the entrance to this market has been
found to be the inconsistency of the savings in absolute terms, not for the
customer but for the ESCO itself, which has described the residential
customer as “too small” in the majority of the cases. Another barrier which has
been highlighted in some interviews was the difficulty in communicating with
this market for the majority of the ESCOs because of their “unfitting”
structures. These ESCOs stated that they believe in the possibility to make
profitable investments also in the residential sector but that they don’t have
the right structure and trade channels to do this. The global impression, on the
current residential energy efficiency market, which emerged from the analysis
is not completely static: ESCOs just take the 1% of this market but some
players (in particular the spin-offs of some big distributors) are starting
implementing new products for domestic sector, with particular attention to big
residential complexes. A big driver for the future spreading through this sector
could be the development of collaborations and partnerships with the

68
construction companies, particularly when the energy efficiency service
players are also distributors (or spin-offs of a distributor; this could make it
easier to reach the market), conversely for the moment, the interventions in
this sector result to be almost all “ex-post installations” of solar plants, heat
pumps, refrigeration plants and so on.
Public Administrations sector has revealed to be a difficult sector to be
analyzed: just three ESCOs of the sample resulted in investing in this field,
but when they do it, this represents a big part of their revenues. This is mainly
due to “big-fish projects” which are not always easy to win, but that can result
in very big revenues streams in case of success. The first of the three ESCos
declared to derive 60% of its revenues from the energetic upgrading of Public
Administration offices, the second one 40% from the LED installation for
municipal lighting, and the last one (a very big player) the 90% of total
revenues from PAs (10% comes from LED installations and the 90% comes
from “heat management” of the hospitals). A representative issue highlighted
by these actors is the high residual availability of interventions for LED
installations in the municipal-lighting (very big areas of important
municipalities are still lighted with classic lamps), which have been described
as low-risk investment for the ESCOs with very constant returns/savings.
Another fact emerging from the interviews of these three actors have been the
necessity to divide the hospital category from the PA category: today almost
half of the Italian hospitals are private and projects in this field can move big
amounts of investments; so the hospitals have been considered a per se
category from that moment on. The most spread installations for hospitals
resulted in LED installations and cogeneration for a total amount of 1.3 million
euros (the same amount of the textile industry from the sample), confirming
the big importance of these structures (both private and public) for the ESCo
market. Almost the same amount of investments come from the hotels and
private offices.
GDO industry (remember that this category collects GDO operators, third
parties logistics providers and internal interventions for energy efficiency in
inbound and outbound logistics) gave particularly important results, reflecting
the green logistics trend, which is pushing big players to put more attention on

69
the entire life cycle of the product and not only of its production. Big logistics
contractors try to get important labels and certifications and the interest for
reducing consumptions and emissions is higher and higher as demonstrated
by the Global Logistics Emissions Council (GLEC), led by the Smart Freight
Centre. In the current analysis, the GDO category includes also logistics
activities because, in addition to the growing importance of the “per se sector
of logistics providers”, the nature and the weight of the interventions are very
different from the process’ one of the others industrial sectors. To sum up, the
data regarding the GDO category refer to every kind of intervention regarding
logistics activities: activities in the nodes (warehouses, transit points), point of
sales of the GDO, and transportation activities of both logistics providers and
the industrial sectors.
The total amount of investments resulted in 8 million euros which can be
compared to almost one third of the total of the industrial sector revenues. The
big concentration in LED installation well reflects the nature of this category,
in which technologies like the cogeneration, the ORC assume a lower
importance, while they have a very high incidence on the industrial sectors.
Among the industrial sectors (accounting for 25.4 million euros together) the
one which resulted to be the best “customer-sector” for the ESCo market has
been the metallurgy one, with 4.7 million euros, followed by the chemical
sector with 4.3 million euros. The other industrial sectors are all included in
the range between 2 and 4 million euros, except from paper, textile, pharma,
plastics and print and publishing which resulted to be sharply under the
average. The results of this category have been particularly affected by some
big players investing specifically in a few sectors (or sometimes just one of
them), so that, given the small dimension of the sample, it resulted in a
distortion of the single categories (this fact will become clearer with the
analysis in the next graph and with the second approach of the next chapter).
The final data have been then reported to the total amount of ESCOs’
revenues, which comes from the investments in energy efficiency: the total
revenues of 1.4 billion € have been cleaned of the TEE component and of the
additional services component (like the “servizio calore”), giving a total final
amount of 654 million €. Furthermore, this amount has been decreased of

70
other 30 million euros, which represents the share of the residential energy
efficiency market taken by the ESCOs (1% of the total market dimensions,
which is 3 milliard), indeed the residential sector has been considered as “out
of scope” for this analysis because of its very different identifying
characteristics. At this point it is possible to get a first sectorial sight of the
market:
Fig.26-The revenues of the market per industry (1st approach).
A comparison with the Energy Efficiency Report is now possible, particularly
for what concerns the categories of the industrial sectors (in the other macro
categories there are some differences in the boundaries definition, like it was

71
previously explained for the GDO). The comparison will not be set on the
absolute revenues values but on a ranking, the reason of this choice is that
the data in the Energy Efficiency Report 2016 are referred to the investments
made by ESCOs and not to the revenues coming from each sector: these are
surely two comparable sets of data but not in absolute terms.
The first four sectors coming respectively from the Energy Efficiency Report
ranking and from the current analysis ranking are provided:
Tab.15-16-Investments and revenues rankings.
This comparison confirms the fact that the industrial sectors appear
particularly distorted when reported to the total amount of the market’ s
revenues streams using this approach. It’ s possible to conclude that this
method gives a very precise description of the sample but it gives heavy
distortions too, when trying to give a global perspective of the market. For
these reason the second methodology has been used for this purpose and it
will be faced in the next chapter.
Revenues Ranking
1) Metallurgy
2) Chemicals
3) Ceramic & Glass
4) Food & Beverage
Investments Ranking from E.E.R.
1) Mechanics
2) Food & Beverage
3) Chemicals
4) Metallurgy
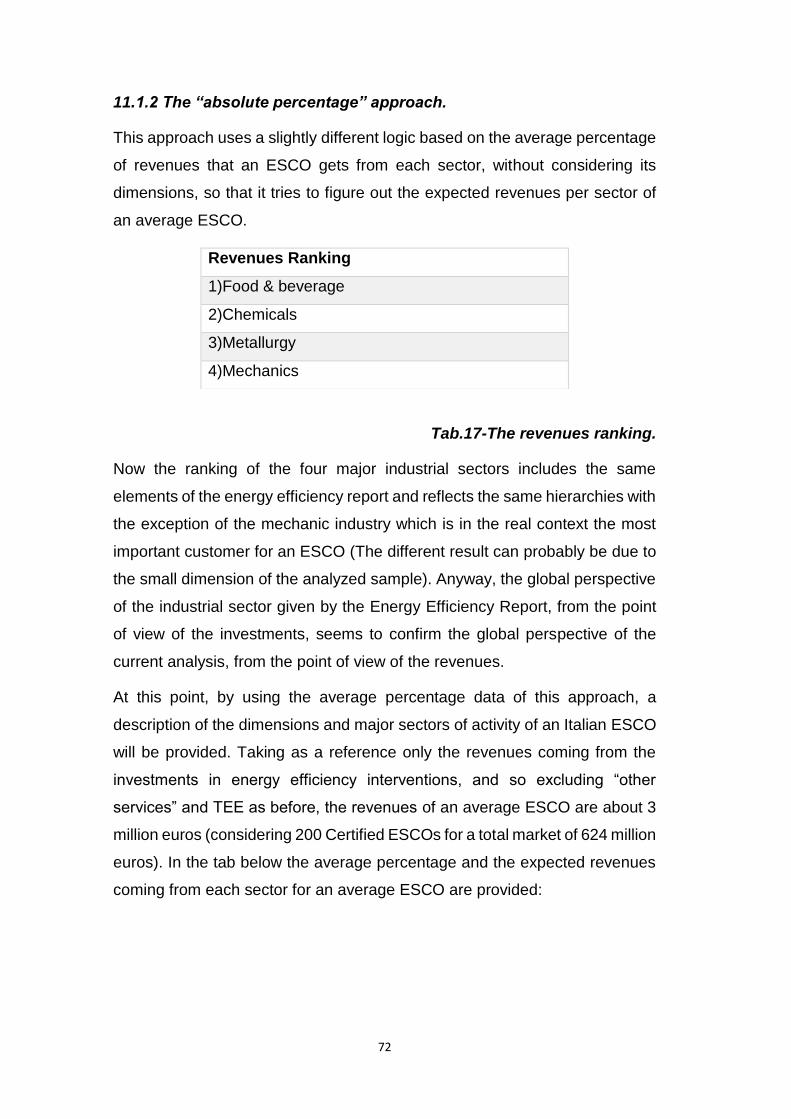
72
11.1.2 The “absolute percentage” approach.
This approach uses a slightly different logic based on the average percentage
of revenues that an ESCO gets from each sector, without considering its
dimensions, so that it tries to figure out the expected revenues per sector of
an average ESCO.
Tab.17-The revenues ranking.
Now the ranking of the four major industrial sectors includes the same
elements of the energy efficiency report and reflects the same hierarchies with
the exception of the mechanic industry which is in the real context the most
important customer for an ESCO (The different result can probably be due to
the small dimension of the analyzed sample). Anyway, the global perspective
of the industrial sector given by the Energy Efficiency Report, from the point
of view of the investments, seems to confirm the global perspective of the
current analysis, from the point of view of the revenues.
At this point, by using the average percentage data of this approach, a
description of the dimensions and major sectors of activity of an Italian ESCO
will be provided. Taking as a reference only the revenues coming from the
investments in energy efficiency interventions, and so excluding “other
services” and TEE as before, the revenues of an average ESCO are about 3
million euros (considering 200 Certified ESCOs for a total market of 624 million
euros). In the tab below the average percentage and the expected revenues
coming from each sector for an average ESCO are provided:
Revenues Ranking
1)Food & beverage
2)Chemicals
3)Metallurgy
4)Mechanics
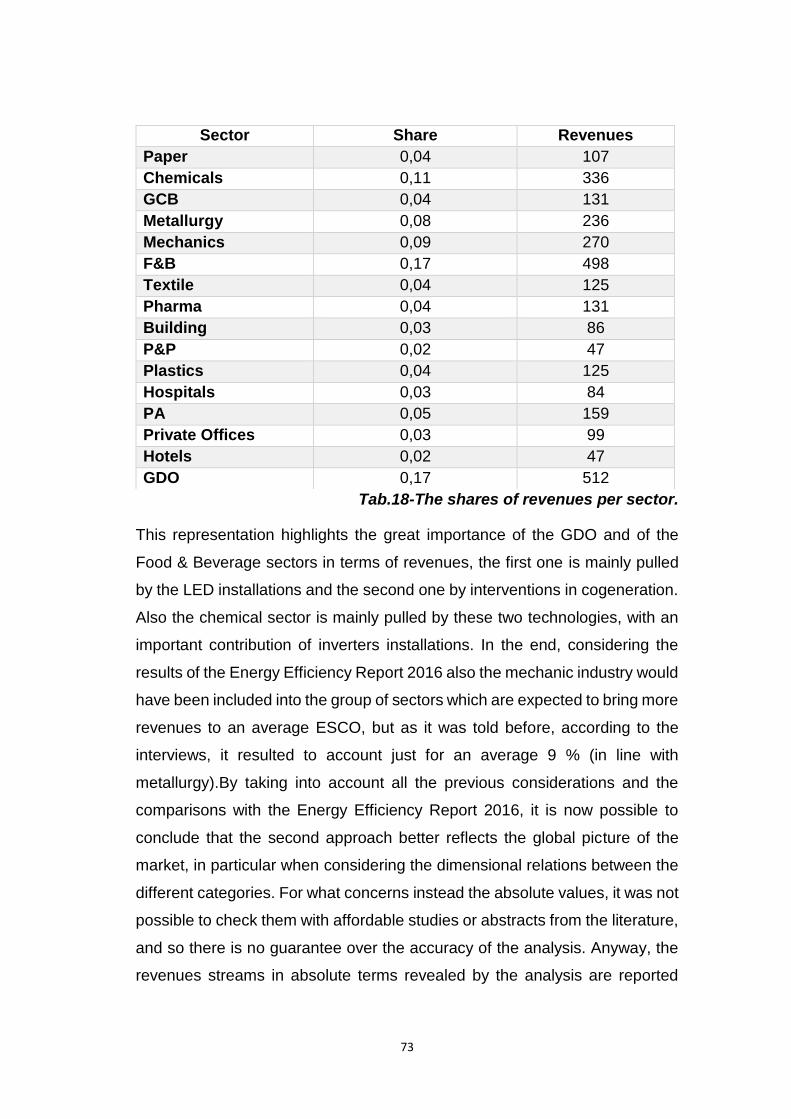
73
Tab.18-The shares of revenues per sector.
This representation highlights the great importance of the GDO and of the
Food & Beverage sectors in terms of revenues, the first one is mainly pulled
by the LED installations and the second one by interventions in cogeneration.
Also the chemical sector is mainly pulled by these two technologies, with an
important contribution of inverters installations. In the end, considering the
results of the Energy Efficiency Report 2016 also the mechanic industry would
have been included into the group of sectors which are expected to bring more
revenues to an average ESCO, but as it was told before, according to the
interviews, it resulted to account just for an average 9 % (in line with
metallurgy).By taking into account all the previous considerations and the
comparisons with the Energy Efficiency Report 2016, it is now possible to
conclude that the second approach better reflects the global picture of the
market, in particular when considering the dimensional relations between the
different categories. For what concerns instead the absolute values, it was not
possible to check them with affordable studies or abstracts from the literature,
and so there is no guarantee over the accuracy of the analysis. Anyway, the
revenues streams in absolute terms revealed by the analysis are reported
Sector Share Revenues
Paper 0,04 107
Chemicals 0,11 336
GCB 0,04 131
Metallurgy 0,08 236
Mechanics 0,09 270
F&B 0,17 498
Textile 0,04 125
Pharma 0,04 131
Building 0,03 86
P&P 0,02 47
Plastics 0,04 125
Hospitals 0,03 84
PA 0,05 159
Private Offices 0,03 99
Hotels 0,02 47
GDO 0,17 512
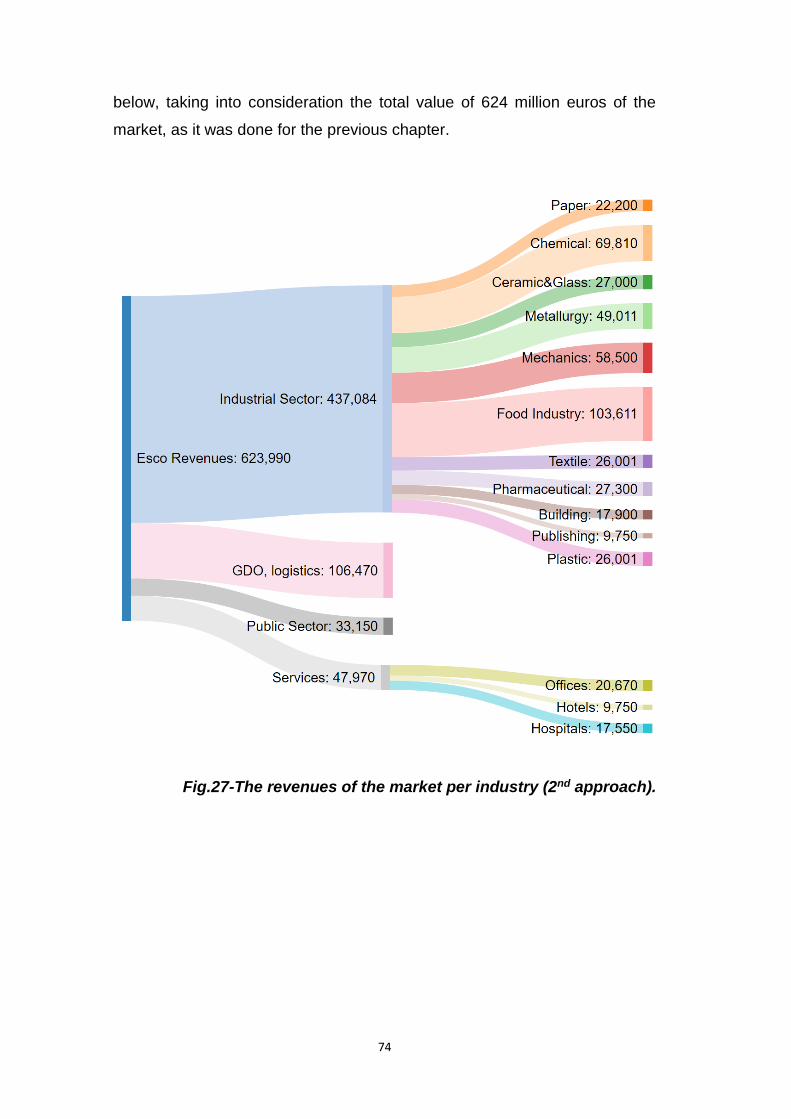
74
below, taking into consideration the total value of 624 million euros of the
market, as it was done for the previous chapter.
Fig.27-The revenues of the market per industry (2nd approach).
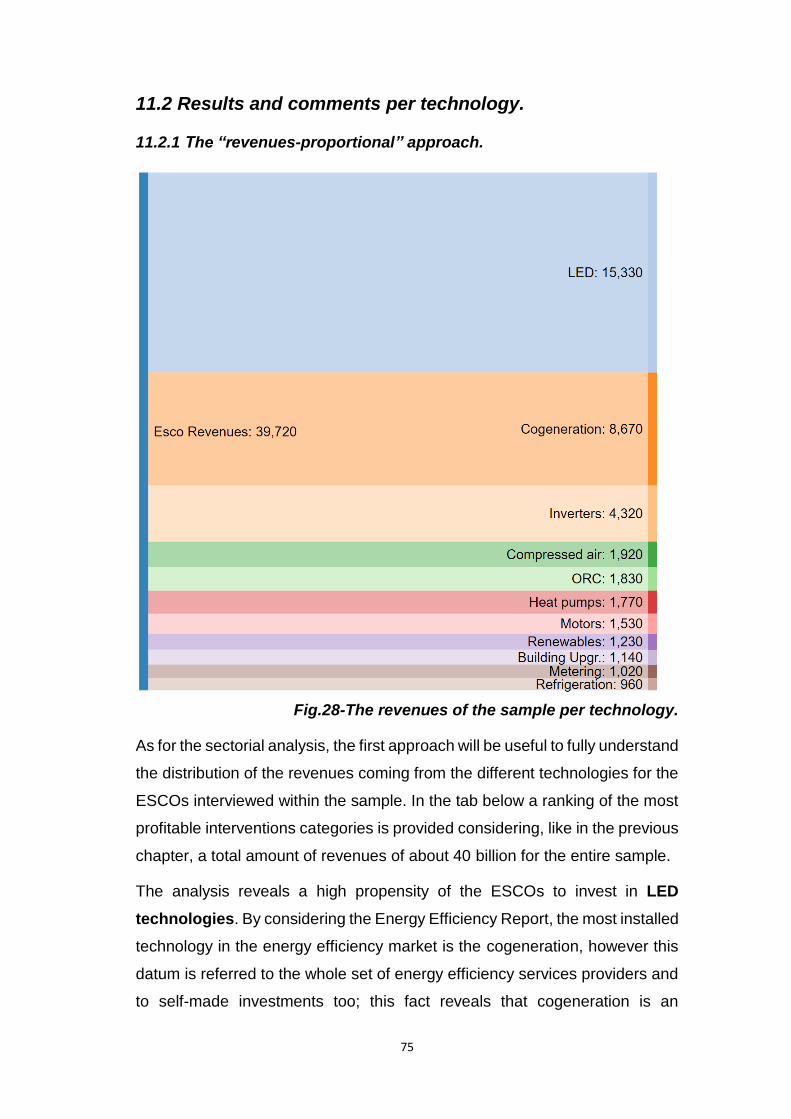
75
11.2 Results and comments per technology.
11.2.1 The “revenues-proportional” approach.
Fig.28-The revenues of the sample per technology.
As for the sectorial analysis, the first approach will be useful to fully understand
the distribution of the revenues coming from the different technologies for the
ESCOs interviewed within the sample. In the tab below a ranking of the most
profitable interventions categories is provided considering, like in the previous
chapter, a total amount of revenues of about 40 billion for the entire sample.
The analysis reveals a high propensity of the ESCOs to invest in LED
technologies. By considering the Energy Efficiency Report, the most installed
technology in the energy efficiency market is the cogeneration, however this
datum is referred to the whole set of energy efficiency services providers and
to self-made investments too; this fact reveals that cogeneration is an

76
absolutely highly incident sector for the ESCOs revenues but that there is also
a big part of self-made investments as regards this technology. Conversely
the LED market appears to be globally smaller than the market for
cogeneration technologies, anyway it appears to be the bigger revenues
stream for ESCO companies. Some of the ESCOs of the sample were asked
to explain why they got such good results in this field and to specify if it was
due to the continuous growth of this market, to the availability of new
installations for by the public administrations or to the characteristics of this
type of investment in terms of payback-time and savings. The ESCO revealed
that the growth of the global market allowed a reduction in the prices by the
suppliers and easier and smarter installation modalities, but they described
the current situation of the municipal lighting and the typical characteristics of
the investments, as the two main variables driving to this very high incidence
of LEDs on their revenues. The LED’s installations indeed, are typically costly
interventions, but given the very high savings, they allow low paybacks too:
this is the condition which, in the ESCO’s opinion, usually convince the
customer to look forward a LED solution (this is particularly true for small and
medium enterprises). The high cost of the investment anyway lead the
customer to contact the ESCOs and the high opportunities for savings give
almost in all the cases the possibility to find the right parameters for setting an
EPC contract which allows the ESCo to recover the investment in a brief time
and to let to the customer the benefits of the whole savings after a quite short
period. Furthermore, the LEDs installation are not influenced by changings in
temperatures, weather conditions and use-time of the machines: these factors
allow to define in an easier way the EPC contract with respect to other
technologies which need more guarantees by the ESCOs towards the
customers. To sum up, the LEDs investments can give a very good level of
risk for all the risk categories: the operative risk is low because it is not difficult
to guarantee the compatibility and the integration of these systems (design
and installation procedures are quite standardized). The energy performance
risk results low too, given the high constancy of the savings. The financial risk
assumes good levels, given that the future perspectives for this technology
are good and the market is expected to grow again in the next years.

77
As regards the cogeneration market it is possible to state that this technology
almost equally distributes among all the industrial sectors, accounting for 8.7
millions of revenues over the analyzed sample. A major fact which emerged
during the interviews is that a lower number of ESCos has this technology
within their portfolio, because an higher level of specialization is needed: the
knowledge of the specific process or location in which the intervention must
happen and the more complex design and installation procedures, concur to
create an higher degree of complexity than LEDs installations. A
demonstration of this fact is the presence of an actor of medium dimensions
(revenues around 3 millions) which only installs cogeneration plants and is
completely specialized in this technology: the specific knowhow in this field
can be a very important differentiation factor, in particular for projects
presenting high design and realization complexity. Even if the industrial sector
is the major cluster of customers for cogeneration plants, also GDO is an
important one, with almost 1 million of revenues considering the analyzed
sample. The different risk typologies are surely higher than they are for the
LEDs, because the savings can be less constant and depending on the
activities carried out in the work floor (basically the reasons are the opposite
ones compared with LEDs).
The inverters represent another growing market, given the very wide range
of application (machines speed control, energy and material consumption
optimization and coordination of different machines) the installations distribute
almost equally among all the sectors, furthermore the market is pulled by the
photovoltaic growth. As it was explained in the introduction cross cutting
technologies always represent good opportunities for the ESCOs and
inverters can be considered into this category in some ways: they can be
applied to very different activities from centrifugal pumps to compressed air
systems. The very wide field of application anyway does not affect too much
the complexity of the interventions, inverters are today standard components
(even if the market is still moving in terms of quality/price) and big players like
Huawei and ABB supply them on the market. These are just some of the
reasons why inverters represent another good field for the ESCOs which,
even if showing a major degree of complexity in the installation (mostly in the
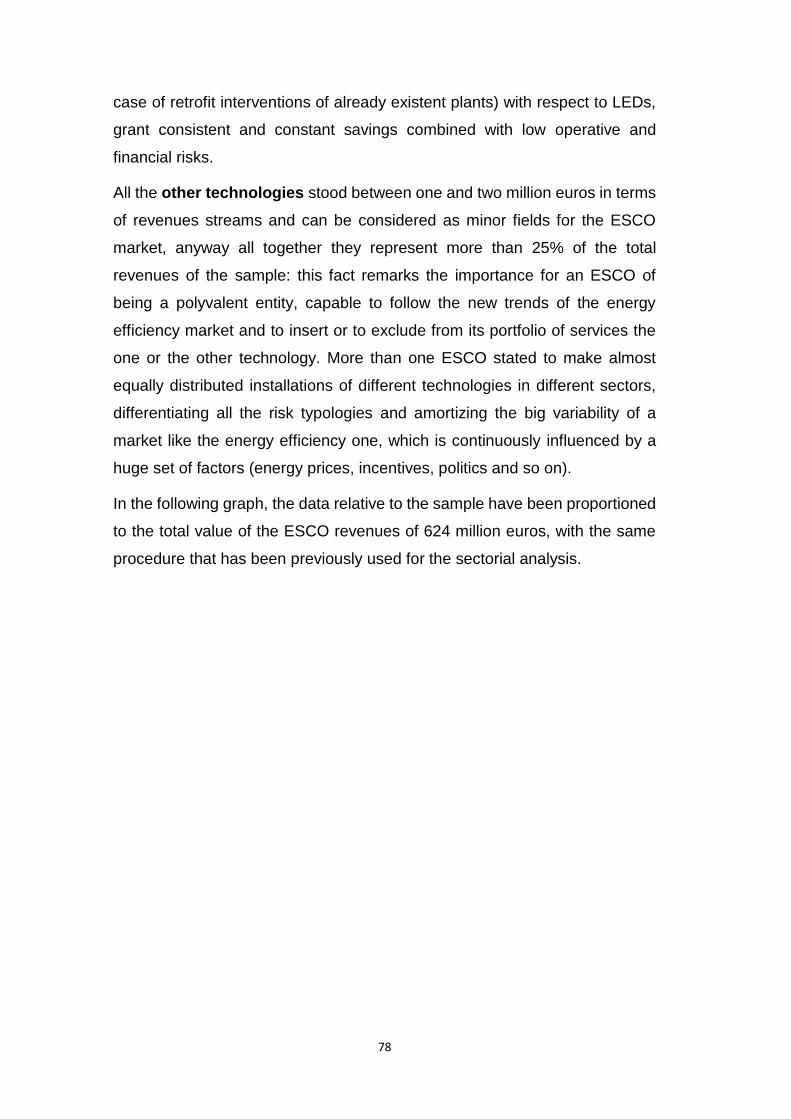
78
case of retrofit interventions of already existent plants) with respect to LEDs,
grant consistent and constant savings combined with low operative and
financial risks.
All the other technologies stood between one and two million euros in terms
of revenues streams and can be considered as minor fields for the ESCO
market, anyway all together they represent more than 25% of the total
revenues of the sample: this fact remarks the importance for an ESCO of
being a polyvalent entity, capable to follow the new trends of the energy
efficiency market and to insert or to exclude from its portfolio of services the
one or the other technology. More than one ESCO stated to make almost
equally distributed installations of different technologies in different sectors,
differentiating all the risk typologies and amortizing the big variability of a
market like the energy efficiency one, which is continuously influenced by a
huge set of factors (energy prices, incentives, politics and so on).
In the following graph, the data relative to the sample have been proportioned
to the total value of the ESCO revenues of 624 million euros, with the same
procedure that has been previously used for the sectorial analysis.
79
Fig.29-The revenues of the market per technology (1st approach).
11.2.2 Absolute percentage approach.
To get a better perspective of the market, the second approach (which uses
the average percentage shares per technologies) will be carried out to
understand if there are big changes if compared with the previous one and to
finally give some overall considerations of the market from the point of view of
the technologies. The following tab shows the expected revenues for an
average ESCO (3 million revenues) based on the average percentages
declared during the interviews for each single technology.

80
Tab.19-The shares or revenues per technology
Again, this second approach allow to clean some distortions: the biggest
interviewed player (with total revenues equal to the double of the ones of the
second biggest player) indeed stated to derive a consistent part of its
revenues from the lighting installation and not to install cogeneration solutions
at all; this fact was particularly affecting the analysis in terms of absolute
revenues. To conclude, a last representation of the market derived from the
second approach is provided in the figure below.
Technology Share Revenues Streams
LED 0,26 780
Cogeneration 0,24 720
Inverters 0,15 450
Compressed air 0,03 90
ORC 0,09 270
Heat pumps 0,03 90
Motors 0,05 150
Renewables 0,06 180
Building Upgr. 0,03 95
Metering 0,03 90
Refrigeration 0,03 89

81
Fig.30-The revenues of the market per technology (2nd approach).
The overall picture of the market slightly changes as regards LED installations,
ORC, renewables and Motors. This hierarchy seems to be more realistic then
the previous one in particular as for the ORC which resulted to be installed in
all the industrial sectors. The energy efficiency report 2016 confirms (with
exception for renewable sources which are not included in the analysis) that
the 5 major installed technologies in the total energy efficiency market (
comprising the self-installations too) are LED, cogeneration, inverters, ORC
and electric motors. An interesting comparison can be made regarding the
ORC & efficient systems of combustion: in the Efficiency Report they result to
be almost at the same level of investments as the cogeneration systems. This
kind of installations anyway (particularly in the heavy industrial sectors) are
sometimes self-made, given the big degree of integration needed with the

82
existing machines and complex processes. Some ESCOs figured out that big
companies using heavy combustion plants already implemented these
systems investing by themselves: this can be a reason why the results
describe this technology as a minor revenues stream for an ESCO, compared
with others.
Another important issue regards the administrative efficiency as a consultancy
support to energy management in terms of operations and decisions: this
category has not been included in the analysis because it cannot be
considered as a technology, but it is an important service that an ESCo can
deliver to customers and it is sometimes referred to specific technologies and
plants. An example of this issue is represented by the interview of an ESCo
which stated to carry out almost exclusively consultancy activities (without
any installation or design practices) mainly deriving its revenues from
administrative efficiency consultancies and TEE management. To make an
example, a possible consultancy recommendation which does not involve any
installation but that is at the same time referred to a specific technology is the
following one: some warehouses with controlled temperature stocks can be
advised to low the temperature under the needed value when electric energy
costs less and to switch off the refrigeration plan when it costs more (letting
the temperature come back to the standard value, and starting again the
system in a second moment). Other possible recommendations can regard
the maintenance of some cross-cutting technologies, the elimination of
compressed air systems losses, the substitution and cleaning of the lamps or
again the organization of the on/offs of some lighting sectors depending on
the work shifts. All these measures are not matched by any big investment but
can result in good source of revenues for the ESCOs; this fact highlights again
the very high importance to have a diversified knowhow in all the different
technologies and sectors.

83
11.3 Results and comments per specific sectors and
technologies.
Tab.20-The revenues of the market.
Tab.21-The revenues of the market.
The highest incidence of a technology over a particular sector is represented
by the lighting over the GDO: in this industry, the lighting assumes huge
shares on the total consumptions than to other sectors, which have to face
with other bigger energy vectors. The incidence over the total revenues

84
coming from the GDO sector is 27% while it is 20% over the total revenues
coming from the Public Administrations, these two sectors indeed are the one
in which the LED market is developing more. Another technology which has a
high incidence on a particular sector is the Cogeneration on the Food &
Beverage industry, which accounts for 23%. The companies of this sector
indeed typical have high heat intensive processes which account for the
majority of their total energy consumptions: pasteurization and cooking for
example use a lot of electric energy and need a lot of heat too, so that the best
conditions for a cogeneration investment are created. Also other industrial
sectors have plants requiring and dissipating big quantity of heat like
Chemicals, Bricks production, Metallurgy and Mechanics, anyway there are
some differences compared with the food and beverage that makes them less
desirable for an ESCO: bricks and metallurgy in particular are process
industries which have the best knowledge possible on their processes and so
they are usually well performing on the process energy efficiency.
The investments in the cogeneration technology coming from the Chemical,
GCB, Metallurgy and Mechanics are very high and account all together for a
40% of the total investments in cogeneration technology. Another interesting
datum is represented by the investments in ORC which comes from the
metallurgy industry for 50% of the total amount, in fact this is one of the most
classical and suitable sectors for heats recoveries. Compressed air and
inverters seem to have good incidence homogeneously on all the industrial
sectors while they have lower incidences on Hospitals, PAs, Private offices
and hotels.
85
12. THE ESCO MARKET ANALYSIS BY CONTRACT
12.1 Results and comments.
As it was reported in the introduction chapter about contracts, the forms
provided by the ESCOs are very different the one from the others in terms of
formulation of the contract, shares of the savings, financing modalities,
undertook risks, duration and clauses.
The initial aim of the interviews was to allocate the different typologies of
contracts to particular sectors or technologies but it revealed to be a hard task,
because almost half of the ESCos stated that they did not make any difference
about the typology of contract with respect to the particular sectors. Some
ESCOs indeed declared to provide all the possible contractual forms to try to
deal as best as they could with the customer, and that sometimes some
“hybrid” solutions are adopted to find a point of agreement. Other ESCOs
instead, defined some sectors or technologies as more suitable for some
contracts typologies, but it was not enough to build a definitive framework
pairing sectors/technologies and contracts. It was possible anyway to define
what are the most used contractual forms given that the ESCO were asked to
define the percentage of their revenues coming from each contractual form.
The contractual forms have been categorized as follows:
1)Turnkey
2)EPC with financial risk taken by the ESCO
3)EPC with financial risk taken by the customer
4)EPC plus energy trading
Besides these categories the interviewed ESCOs were asked to declare if
they used equity or borrowed capital, but in the majority of the cases the
answer has been that there is not a unique policy. None of the ESCOs stated
to use only borrowed capital, some of them stated to use only equity capital
and others to use borrowed capital only in periods of low liquidity or just for a
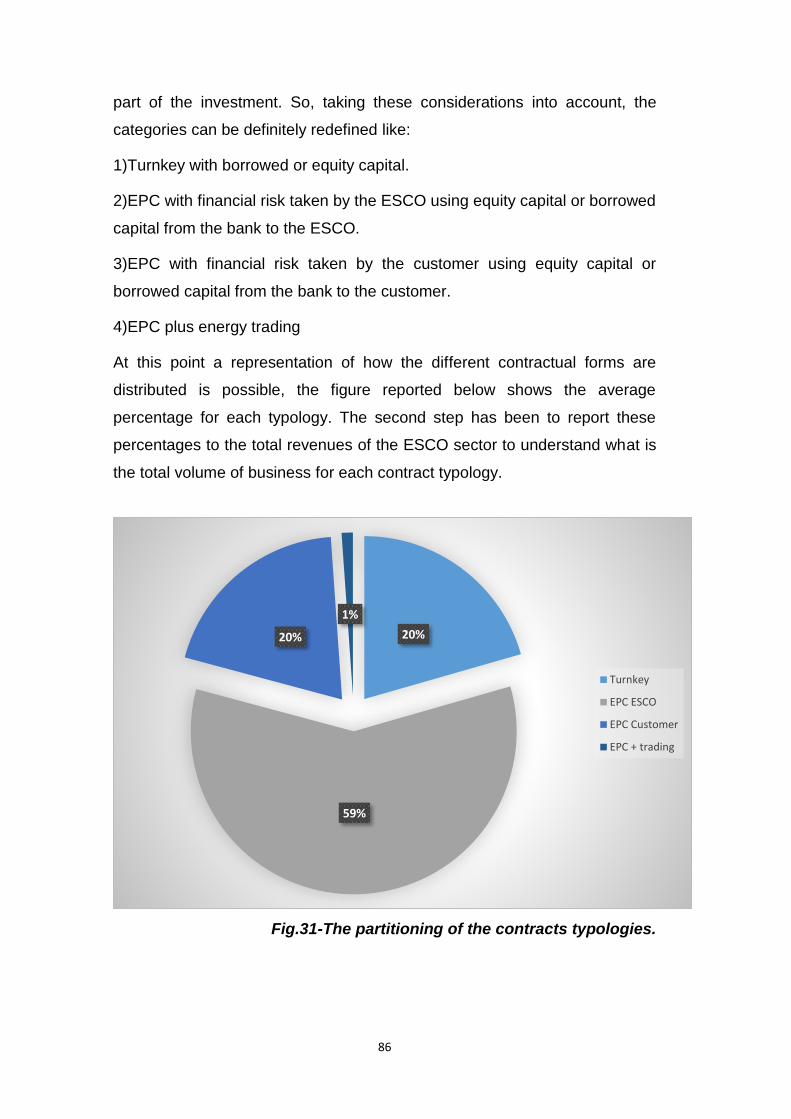
86
part of the investment. So, taking these considerations into account, the
categories can be definitely redefined like:
1)Turnkey with borrowed or equity capital.
2)EPC with financial risk taken by the ESCO using equity capital or borrowed
capital from the bank to the ESCO.
3)EPC with financial risk taken by the customer using equity capital or
borrowed capital from the bank to the customer.
4)EPC plus energy trading
At this point a representation of how the different contractual forms are
distributed is possible, the figure reported below shows the average
percentage for each typology. The second step has been to report these
percentages to the total revenues of the ESCO sector to understand what is
the total volume of business for each contract typology.
Fig.31-The partitioning of the contracts typologies.
20%
59%
20%
1%
Turnkey
EPC ESCO
EPC Customer
EPC + trading
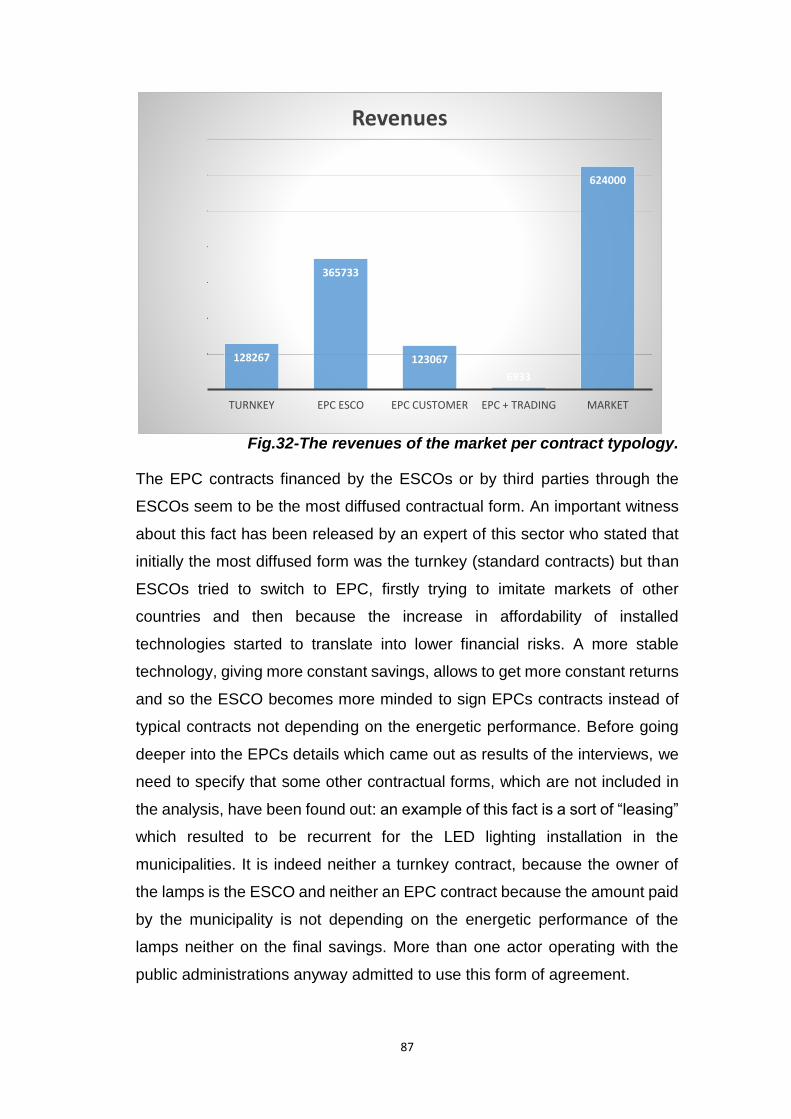
87
Fig.32-The revenues of the market per contract typology.
The EPC contracts financed by the ESCOs or by third parties through the
ESCOs seem to be the most diffused contractual form. An important witness
about this fact has been released by an expert of this sector who stated that
initially the most diffused form was the turnkey (standard contracts) but than
ESCOs tried to switch to EPC, firstly trying to imitate markets of other
countries and then because the increase in affordability of installed
technologies started to translate into lower financial risks. A more stable
technology, giving more constant savings, allows to get more constant returns
and so the ESCO becomes more minded to sign EPCs contracts instead of
typical contracts not depending on the energetic performance. Before going
deeper into the EPCs details which came out as results of the interviews, we
need to specify that some other contractual forms, which are not included in
the analysis, have been found out: an example of this fact is a sort of “leasing”
which resulted to be recurrent for the LED lighting installation in the
municipalities. It is indeed neither a turnkey contract, because the owner of
the lamps is the ESCO and neither an EPC contract because the amount paid
by the municipality is not depending on the energetic performance of the
lamps neither on the final savings. More than one actor operating with the
public administrations anyway admitted to use this form of agreement.
128267
365733
123067
6933
624000
TURNKEY EPC ESCO EPC CUSTOMER EPC + TRADING MARKET
Revenues

88
The most used EPC formula is the “shared savings” one, which split savings
between the ESCo and the customer during the operating years of the plant.
In the majority of the cases these percentages are not constant but change
over years with higher values for the ESCOs in the first years and lower ones
in the last years. This especially happens when the ESCos invest directly, so
that it easier to repay the investment in a shorter time and leave before 100%
of the savings to the customer, once it is completely recovered.
As regards a generic EPC saving contract the duration resulted to be around
the 7,5 years, with percentages favoring the customer with the passing of the
years; sometimes after some years (normally 2/3) the customer can decide to
redeem the plant (paying an amount of money) and continue to operate it
instead of the ESCO: it happens when the customer takes the necessary
competences to do so during these years and wants to run the plant itself to
take all the savings. The value of the savings dedicated to the ESCO differs
depending on the investment and on the needs of the customer too, usually
the share dedicated to the ESCO can be between 15 and 20 % and can
decrease during years in different ways (depending on the duration of the
contract). A clear example was given by a very big player specialized in
cogeneration, ORC and efficient heat plants who defined a particularly
standardized contractual form specifically for the “heat interventions”:
contracts are quite short in time (considering the type of investment) with a
range of 5 to 9 years, they are based on euros per cubic meter saved and they
include a sort of guarantee for the customer (a part of the returns is fixed
independently from the savings). A last consideration on the EPC with ESCO-
financing derives from an interview with an expert of the sector who
externalized the difficulty for little ESCOs to issue them: these companies
often offer these solutions but sometimes, especially when the projects require
big investments they try to switch to the turnkey before signing the contract
and sometimes this attempt causes the end of the negotiations.
To conclude, the EPC with associated energy trading is not diffused at all, and
it is mainly devoted to large ESCOs or spin-offs of energy distribution players,
which can make some interesting variations to the original form of the EPC

89
contract, like discounts on the energy prices or dedicated services for the
energy buying, by using the futures.

90
13. INSIGHTS AND TRENDS
In this chapter two main issues will be deepened. The first one is the role of
the SMEs as ESCos’ customers, analyzing how Energy Service Companies
can interact with other stakeholders, in order to pursue the most typical drivers
for the overcoming of the barriers to energy efficiency. The other issue is a
detailed analysis of the GDO & logistics category because of its high incidence
resulting from the analysis.
13.1 Energy Service Companies and Small-Medium enterprises.
The aim of this chapter will be the one to evaluate all the possible touchpoints
between the needs of the Small and Medium enterprises and the services
provided by the Energy Service Companies, to do that two abstracts by Trianni
and Cagno about “Barriers” and “Drivers” of the SMEs compared with energy
efficiency will be taken as a base.
In Italy and in the other European Countries too, the customers of the Energy
Service Companies are mainly Small and Medium enterprises; to better
understand the role of the SMEs it is important to understand what is their
incidence on the total industrial consumption, what are their barriers to energy
efficiency and how the ESCOs could be a driver to overcome some of these
barriers. According to the European Commission Observatory of SMEs
research of 2012 only 4% of European SMEs have put in place a
comprehensive system to monitor and control energy consumption,
furthermore 90% of SMDs have not yet or have only recently adopted a few
measures to control their energy consumption. In addition to this, according to
a 2011 investigation led by the European Commission, SMEs are also
strategic for the European domestic economy, responsible for approximately
60% of the Gross Domestic Product produced and about 85% of new job
opportunities.

91
From the two aforementioned abstracts it is possible to define some principal
categories of barriers for small and medium enterprises like:
1)Technology related
2)Information related
3)Economic
4)Behavioural
5)Organizational
6)Competences-related
7)Awareness
In particular, some of the most incident barriers resulted to be the lack of time,
the lack of liquidity and the lack of competences and awareness of a great
part of the interviewed SMEs. As it was told before an ESCO is often an entity
with multidisciplinary competences and which can offer very different types of
services, from installations to financing, passing by consultancy activities,
energy trading and TEE management. That is basically why it is interesting to
go deeper into the relations existing between the ESCO services and the
barriers of SME; this could be an interesting field to furtherly expand the
scientific literature too: getting a quantitatively valid framework about the most
impacting drivers exercised by the ESCO upon the SMEs could be an
instrument for both the actors acting in the market.
Among all the drivers provided by the abstracts a part of them has been
chosen, considering the drivers that can be enforced by an Energy Service
Companies:
1) Informative drivers: management support, external energy audit,
external cooperation, awareness, knowledge of non-energy benefits,
availability and clarity of information
2) Economic drivers: cost reduction from lower energy use, private
financing
3) Regulatory: green image and release of certifications
4) Vocational training: technical support and programs of education and
training
92
The first category is mainly related to the issues coming from the Energy
Audits that can signal inefficiencies and show possible non-energy benefits
(benefits which are not directly related with energy efficiency but that can be
pursued by developing energy efficiency measures) deriving from different
interventions. The support of an ESCo to a company can also be devoted to
the management, aiming at the design of an environmental management
system. Some of the interviewed ESCos stated to provide support for the
creation of Energy Management Systems too, both by providing direct
consultancies and by providing software and hardware. Furthermore, the
ESCos have available and clear information about all their past interventions
and this is fundamental to provide companies with real cases of applications
(to demonstrate them that effective economical and performance benefits are
possible regarding a specific technology/installation). Also the regulatory
drivers can be pushed by some of the ESCo services: some interviewed
ESCos declared to release the ISO 50001 for the implementation of an Energy
Management System. This is another important service given the very
dynamic environment of regulations and policies of this market, and given the
difficulties of the customers in staying tuned with new standards and
objectives. The economic drivers instead are mainly related to the financing
capacity of an ESCo or to the guarantees that can exercise (in terms of
technical affordability of a project and in terms of returns) in the case of a third
party financing with a bank institute. The different contractual forms offered by
an ESCo can be considered an economic driver too: the possibility for the
customer to find different financial solutions, with different paybacks and
returns can be a great advantage when trying to pursue expensive energy
efficiency installations. In the end the last category, vocational training, has
not been reflected in any interview but can be considered as a service that an
ESCo could decide to include in its portfolio, and that could have considerable
impacts on the awareness of a company’ s personnel.
In the following graph, (from the Trianni and Cagno study “Exploring drivers
for energy efficiency within small- and medium-sized enterprises: First
evidences from Italian manufacturing enterprises”) a framework on how
different stakeholders like technology suppliers, firms and government can act

93
on drivers is provided; the scheme divides the positive actions of drivers on
different barriers for each phase of the decision making process (Awareness,
needs and opportunities identification, technology identification, planning,
financial analysis and financing). The original study anyway is not specifically
contextualized neither for the Small and Medium Enterprises nor for the ESCO
market but, given the right conditions and limitations, can be very useful to get
a big picture of the interactions occurring among the Energy Service
Companies, SMEs, Banks institutes, Technology Suppliers and the
Government. The barriers listed before are allocated in each decision-making
phase: awareness, needs and opportunities identification, technology
identification, planning, financial analysis and financing, installation, startup
and financing. The arrows show the relations and positive actions of the
drivers on the barriers, these effects can combine (normally positively) acting
on the same barrier to energy efficiency or again a single driver can act on
more than one barrier. In the top part of the figure there are the stakeholders
that are a sort of “enablers” of this model, they are in other words the suppliers
of resources that allow to the drivers to become effective.
Fig.33-Relations between barriers and drivers for energy efficiency.

94
By adding the entity “ESCO” to the initial situation, the previous scheme
slightly changes because of the ESCOs’ capability to interact with the other
stakeholders compared with the SMEs’ one. ESCOs can easily interact with
technology suppliers (finding out the best technologies available and
assuming a sort of “market monitoring” function which is not usually
undertaken by small & medium enterprises), with the government
(undertaking a similar function than the previous one but concerning
certifications, standards development, new incentives introduction and future
legislations forecasting), with banks institutes (offering a much more
affordable profile in terms of competences and guaranteeing the goodness of
the interventions on behalf of the customer) and with other companies (an
example can be given by energy distributors: ESCOs usually have a complete
vision of the energy supply offers in the market and can find the right solutions
for the customers acting on drivers for energy efficiency like the cost of
electricity per kwh). Summing up, the ESCO assumes the function of “unique
interface”, which basically puts the customer in better conditions for
understanding and perceiving the market with respect to the classical situation
in which the Small-Medium enterprise must interface with a lot of different
actors.
At this point a little modification to the previous framework is purposed by
considering the presence of an ESCo with the role of “market-facilitator”.

95
Fig.34-Relations between ESCos and drivers for energy efficiency.
This can be an important point of view of the market for an ESCO, when
defining its portfolio of services, depending on its dimensions and local
conditions of the market. The ESCO could try to define what are the most
impacting drivers on the most common barriers of its target market, so that it
can set priorities and better define services-portfolio and internal structure.
The ESCO should basically understand which are the major barriers of the
target customers, understand what of the aforementioned drivers could act on
them and, in the end, chose the better ways to interact with other stakeholders,
to enforce these drivers in order of priority (impacting as much as possible on
the barriers demonstrating more need of improvement).
This analysis, coupled with the telephonic interviews, helped to understand
what is the current situation of the ESCos in terms of fitting in the right way
the needs of the customers; some ESCos resulted to move forward the right
direction, being flexible with the small customers and providing them software
and tools for the energy management, together with quick methodologies for
energy audits giving brief and precise results. Some ESCO also stated to
provide to SMEs simplified and more flexible contracts that enable the
96
possibility to change quotes and shares of the savings overtime (another
source of flexibility in that sense can be referred to the EPC+ contracts,
sending back to the specific chapter in the introduction). Other players instead
did not move in this direction, they are very specialized and big players
(usually providing big plants design and installation), and they do not need to
offer such flexible and specific solutions, given the very different nature of their
customers which are bigger than the average (In this case the personalization
provided by the ESCO is more on the “design” than on the “contract”). In the
end another category of ESCO can be defined and it is a part of the small
providers, which were simple installers or technology suppliers before getting
the ISO certification, these providers do not offer all these solutions and
services and are neither multi-disciplinary nor flexible: these actors basically
work with small customers (which have the aforementioned specific needs
typical of these companies) without fitting their needs in the best way, limiting
themselves to sell products, installing them and managing them for the period
fixed by the contract (usually a turnkey contract).
To conclude, it is now clearer how complex a business model of an ESCO can
be, and how difficult it is for an ESCO to move through such a heterogeneous
market, defining the right portfolio of services and at the same time adapting
to its original structure. For an average Italian ESCO anyway, except for some
specific cases, the attention towards the small medium companies seems to
be essential and it is surely a key-point and success factor for the near future.
13.2 Energy Service Companies and Logistics.
The GDO and logistics field resulted to be one of the most important market
for the Energy Service Companies, accounting for more revenues than all the
single industrial sectors. It is important to repeat that this fact is mainly due to
the inclusion in this category of all the interventions related to inbound or
outbound logistics activities, comprising also the ones entertained by
companies operating in the industrial sectors. The effect of this classification
is a very heterogeneous category, which has not to be intended as a real
conventional market sector but as a group of different kind of customers all
97
looking for logistics efficient solutions. The two main reasons why this
classification was chosen are the following: the growing importance of green
logistics and the type on installations needed in this field. The green logistics
is becoming more crucial, new standards are developed every year, in
particular for what concerns emissions and transportation protocols,
furthermore the logistic sector itself is continuously growing and expanding
the market with new customers. This growth is accompanied by the stronger
growth of the e-commerce, creating ulterior and multiple implications with
consumption reductions and energy efficient solutions related to the sales or
buying of products through the internet. Collaboration forms among upstream
and downstream companies are a growing trend in logistics, and it has further
implications on the optimization of the energy consumption from a supply-
chain point of view. In the end, the most “classical” point for an ESCO, is the
nature of interventions on inbound & outbound logistics themselves, which are
usually cross-cutting technologies highly impacting on the total energy
consumption of these activities; furthermore, these are quite standardized
solutions (in comparison with other solutions for process-industry which
require an higher degree of complexity in the design and the installation of the
solution) which ESCOs regularly install. To sumup, this sector is growing,
presenting both disruptive (e-commerce and collaboration) and “cash cow”
opportunities (cross-cutting technologies) for energy efficiency and represents
a key point for the energy service companies. If the “what” of this sector is
clear, let’ s now consider the “who”, because here is probably the major
element of difficulty in the relations between the ESCOs and the customers of
this sector: large road carriers, small road carriers, express couriers,
intermodal terminal operators, warehouse operators, railway carriers and
intermodal rail-road transport operators, third party logistics providers and
freight forwarders. These operators basically refer to the logistics outsourcing,
a fast-growing sector, with growing competition in which the decrease of the
energy costs results in an important success factor. But what are the actors
with which an ESCO should try to interface more? Road carriers, express
couriers and freight forwarders give great attention to consumptions due to
competition reasons and ESCO are not the right support entities for complex
transportation problems (or better, they are not for now, considering the

98
current average dimension of an ESCO in the Italian market), furthermore
given the dimension of the analyzed ESCos it seems difficult to imagine them
to have as customers logistics player which are bigger than them.
Furthermore, also big multinational third part logistics providers are difficult
operators to interact with: given their dimensions and their attention to
consumptions. Companies like DHL, Kuhene&Nagel or CEVA have milliard
euros of revenues and can easily invest locally through the corporate’s founds.
But what about the intermodal terminal operators and the warehouse
operators? They are usually Italian companies and they were born in a
completely different market with respect to the current one, they don’t always
care of energy efficiency issues but they should start doing it to compete with
the bigger aforementioned players. These providers offer storage, inter-ports,
material handling activities and are sometimes grouped in porters
cooperatives (typical Italian entities). These operators do not always have big
financial resources and improving in technologies like electric motors and
LEDs can bring to big impacts on liquidity. Besides all these actors, which can
be grouped into the outsourced-logistics there are all the companies operating
in industrial sector which internally manage inbound or outbound logistics
operations, these activities are not typically core for those companies which
sometimes make the mistake to look at energy efficiency issues only for what
concerns their core activities. Reading some abstracts about this topic it
appeared to be clearer that some big multinational are more likely to invest in
green policies regarding their core activities (in particular production) for eco-
labelling purposes, referred to single products or processes. This digression
was aimed to explain that the attention towards the whole supply chain is not
always high and in these cases market opportunities for ESCOs can be
generated. In the end, there are GDO companies which are more congealed
and classical ESCOs’ customers, in particular as regards the sales points. To
sum up a lot of different actors have been highlighted in this chapter, with
completely different dimensions and needs but all requiring the same
technologies in very similar application-environments with very similar
incidences on consumptions. To conclude a brief classification of the logistics
actors is provided, relating each actor with some general features of interest
for an ESCO.

99
Tab.22-Logistics operators categories.
The two last categories of operators have been highlighted because they are
the most “national” entities operating in the logistics outsourcing, and the two
categories which could be more likely to interact with an ESCo for the reasons
which were explained before. To give an example, a standard energy
efficiency intervention (like a LED installation) of an ESCo on a small
warehouse operator’s site could be decisive in terms of diminishing its fee per
pallet-place and help it do provide more competitive fees; by, at the same time,
not weighting on its liquidity.
Investment
capabilities
Awareness Incidence of
crosscutting
technologies
Total
energy
costs
INTERNAL
LOGISTICS
LEs Medium Medium Medium Medium
SMEs Low Low Medium Medium
OUTSOURCED
LOGISTICS
Road carriers
(LEs)
Medium High Low High
Road carriers
(SEs)
Low High Low High
Expr. Couriers High Medium Low High
Terminal
operators
Low Low High Medium-
High
Warehouse
operators
Low Low High Medium-
High

100
To conclude, the revenues coming from this macro sector for what concerns
EPCs and turnkey contracts (excluding TEE and “other services” component)
revealed to account for 126 billion euros. As a possible future development (to
furtherly analyze the ESCos’ market) it would be very interesting to
understand what part of these revenues comes from internally managed
logistics, what part compete to outsourced logistics and what is instead the
component relative to the points of sales.
101
14. CONCLUSIONS AND FUTURE PERSPECTIVES.
This final chapter wants to summarize some relevant factors of the current
state of the energy service companies’ market, omitting the economical and
numerical perspective in favor of a more practical and “real world” oriented
analysis. The first conclusion is that the ESCO market is heterogeneous, the
European certifications and the existence of some actors and associations like
“FIRE” and “Federesco” are making it more coherent; today anyway there are
still a lot of companies working in this market without respecting the
parameters of guarantee and sharing of the energy savings. This is how FIRE
itself expresses about the heterogeneity and lack of standardization of the
market: “This risks to create confusion in the current market and, in the next
future, a possible loss of image, creating a consistent disadvantage for all the
actors operating in the “mechanism”. These impressions have been confirmed
by the interviews carried out in this thesis, in particular an ex-operator of the
sector pointed out the fact that some ESCOs (in particular the smallest one)
offer among their services the contractual form of the EPCs but in the end they
do not practically issue them. This is surely a key-point: the conformity with
the European certifications should be reflected into the real business,
otherwise the certification becomes a sort of “label”, losing its fundamental
function, which is ensuring that the everyday activities of an ESCo are going
in the same direction of the final goals determined by European Union itself,
together with the single nations. To conclude, the heterogeneity of the sector
is generally an advantage, because energy efficiency must be offered at every
level and at every price to every kind of company (which have different
contractual and financial needs); anyway the sector must conserve its
credibility and its mission, which is not only to “make the business” but it is to
stimulate the “non-existing-demand” too, and to do to this, it needs particular
integrity. A key-point for the demand creation is the switch from a “provider”

102
perspective to the “customer perspective”, by interpreting all the non-energy
efficiency benefits and the non-energy efficiency losses. When proposing an
intervention to the customer indeed, it is important to highlight all the possible
benefits in the final evaluation and also to quantify the possible indirect losses
so that the customer can be more comfortable in the perception of the
installation. From the literature it is possible to understand that non-energy
efficiency benefits can account from the 40 to the 120% more compared with
the standard returns on the initial investments. It’s fundamental for the ESCos
to adopt this point of view of “general efficiency” while making energy
efficiency in a “lean” optic, providing better productivity, health and safety
parameters, waste and emissions reductions and so on. For this moment
anyway a lot of providers still have a strictly “provider point of view” and need
a changing in the relationships with the customer.
The other key-issue for the near future in addition to the conformity to
certifications and to the community objectives is the growing attention of the
financial institutes to the energy-efficiency topics, indeed the third parties
financing are going to be easier in near future: all the Italian banks in last years
have developed, or are developing, more and more specific and dedicated
“offices” which are charged of evaluating energy efficiency projects. By
referring again to the FIRE report, there is an important issue coming from the
banks’ feedbacks: a high percentage of financings are refused by banks,
because of the poor contents and the superficiality of the projects presented
by the ESCOs. This is another key-issue, which is somehow linked to the first
point of this chapter: the conformity with standards and norms is fundamental
because it can help to overcome liquidity problems and “unlock” more financial
capital. From that point of view, standards and norms should be furtherly
developed, in order to get standardized forms and parameters, that can make
it easier for financial institutes to assess and compare different projects.
Regarding the topic of “superficiality”, there is another fact which should be
underlined and this is the mandatory energy audit which is provided by law
from 2015: the majority of the ESCos release it as it was a mere certification,
but it is instead an opportunity to create awareness and to stimulate demand.
These observations come from the examination of some reports and from the
103
guidelines which are described by the Italian decree about mandatory energy
audits; the form is not specific enough and is not oriented to effective future
solutions. In the end these audits should be completed by possible
recommendations about practical interventions at different levels,
accompanied by examples of previous installations showing that savings can
be real and payback-times are short, providing the names of suppliers and
giving physical contacts, in particular to Small and Medium Enterprises.
These last points have not been underlined to point out a pessimistic
perspective of the market but instead they should be intended as good
practices that ESCos must follow to keep the head of a sector which is
growing faster and changing over years. There are indeed new incentives
which are going to be issued in next months and new technologies which
will be soon commercialized, creating new markets in which ESCOs will
play a fundamental role. For what concerns the incentives, the eco-bonus
should be extended since 2019 and incentives for building restructuring
could be coupled with the ones for anti-seismic criteria. Furthermore, the
value of the Green Certificates (referred to already-built plants which
obtained the permission to receive these certificates some years ago) is
going to be lowered almost to the value of the White Certificates (basically
pushing the market towards the use of a single type of certificates). The
sector of biogas and biomethane is expected to change too, from the
regulatory point of view; given the forecasts about the growth of the sector
indeed, the regulatory scheme (which provides for the moment the
“Certificati di immissione in consumo”) could be furtherly modified. New
technologies are then going to spread over the market, given the decrease
in prices, the growing standardization and the good results obtained in
other countries. In order of importance (although with completely different
characteristics and level of progress) the infrastructures of the charging-
points for e-mobility and of the LNG distributors will be the two biggest
short-medium term challenges. If the first topic is anyway well-known and
has been “in the spotlight” for some years, the development of the LNG
infrastructures is surely less discussed but equally important and ready to
be carried out: the European Union wants to build a distributor every 400
kilometers, new liquid-methane vehicles (also for heavy transportation) are
now available and in Italy the construction of 20 new distributors is
104
forecasted, so that, these premises given, the attention towards biogas and
liquefaction plants is going to grow faster and faster in our country. In the
end, new technologies for energy storage, from new generation lithium
batteries to graphene and sugar devices, will be another huge market which
is going to develop more and more during the next years, in particular for
what concerns e-mobility and electric-transportation. For all these reasons
the structure and the capability of interventions of the ESCO will be required
to adapt to these new challenges (in particular as for the world of
transportation in which the ESCO are not moving big businesses at the
moment). Another key-role will be played (for what concerns the approach
to new businesses and the technologies) by collaborations with the
specialized companies of the specific sectors, a good example for this issue
is the “internet-of-things” market. As it was revealed by the CESEF (Centro
studi per l’ efficienza energetica) indeed, the potential market for our
country in this sector is enormous and has not been exploited by regulators,
ESCOs and a big portion of the Italian companies which could get big
advantages by the use of these technologies: “The IoT can better the
performances of the traditional technologies: it is estimated that the
installation of a “smart” management-tool for operations in an industrial
plant, could lead to energy savings for 30-40%”. Furthermore the CESED
underlined the barriers to the diffusions of the IoT, declaring that the
demand has to be stimulated and that the role of the regulators and the
utilities is fundamental: these factors are absolutely positive for the
intervention in the market by the ESCOs, both from the point of view of the
stimulation of the demand and from the point of view of being the “mean of
application” of new regulations and incentives. Again ESCOs are a good
environment where competences of IoT specialized actors, energy
efficiency goals and regulations can get in touch for better integrations and
application on the final market (which is forecasted to account for 25 milliard
euros in 2025, at European level).
These aforementioned trends are very big and general market forces which
will represent new fields and challenges for the ESCOs, because they get
away from the traditional “design-install-manage” way to operate, which is
basically focused on the traditional plant, by pushing the ESCO towards a
multidisciplinary and more dynamic environment. There are some news
anyway, also for the traditional way to operate of the ESCOs, which are

105
represented by the diffusion of new technologies in the field of the
“classical” installations: the natural lighting through “solar-tubes” is starting
to spread over Europe and the use of new efficient electric domestic-
heating devices (typical of Scandinavian countries) is becoming familiar in
Italy too. The new solar-tubes can bring in the inside environments almost
95% of the sun-light and can be integrated with sensor and LEDs to keep
a constant level of lighting; actually, they seem to have the possibilities to
play an important role in the retailers and shops markets.
As a latest conclusion, it is important to point-out some of the more recent
FIRE’s declarations about the short term: as regards the sectorial
subdivision, the Energy Services Companies are going to get stronger on
the Tertiary sector and on Public Administrations, while an increase in the
core-interventions is forecasted for large companies. From a very general
point of view instead, the market seems to be in a sort of stall condition,
beneficing of the consolidated technologies and, at the same time, suffering
from the uncertainties linked with the new developing markets and with the
new forms of incentives.
There is a unique fact which is a sort of evidence, and it is that the global
energy efficiency market is growing and evolving fast. The directions are
maybe not clear at all, and ESCos will need to be dynamic in order to chose
the right ones (being as effective as they can compared with EU directives),
but the energy revolution has not come yet, and Energy Service Companies
are the only certified entities which can operatively speed it up in the
“everyday-business”.
106
15. BIBLIOGRAPHY
http://www.assoesco.org/
http://www.federesco.org/it/
http://www.enea.it/it
http://italy.epcplus.org/spin-partnership-tra-pmi/
http://www.gse.it/it/Pages/default.aspx#&panel2-2&panel3-1
http://www.mercatoelettrico.org/It/
http://www.fire-talia.org/il-mercato-delle-esco/
http://www.qualenergia.it/lavori_verdi
http://orizzontenergia.it/news.php?id_news=5635
www.rinnovabili.it
https://www.iea.org/
www.pmi.it/tag/efficienza-energetica
www.sviluppoeconomico.gov.it/index.php/it/energia/efficienza-energetica
https://www.key4biz.it/internet-of-things-mercato-europeo-a-21-miliardi-di-
euro-nel-2025/158763/
http://www.agenzianova.com/a/0/1410244/2016-09-06/speciale-energia-
studio-europarlamento-societa-esco-potrebbero-aiutare-a-raggiungere-
obiettivi-ue-su-riduzione-emissioni
http://www.eccj.or.jp http://www.tecnologieefficienti.it
http://www.forumenergia.net http://www.caroligiovanni.it http://www.aem.it
http://www.e-quem.enea.it/ESCO http://www.autorita.energia.it
http://www.fire-italia.it
“Dealing with barriers to energy efficiency and SMEs: Some empirical
evidences” A.Trianni, E.Cagno.
“A novel approach for barriers to industrial energy efficiency” A.Trianni,
E.Cagno.

107
15. BIBLIOGRAPHY
“Exploring drivers for energy efficiency within small- and medium- sized
enterprises: First evidences from Italian manufacturing enterprises”
Rete Nazionale delle Agenzie Energetiche Locali: Efficiency - Quaderni di
Efficienza Energetica: Le Società di Servizi Energetici; 2002
Federazione Italiana per l'uso Razionale dell'Energia (FIRE): Gestione
Energia - Periodico di informazione tecnica per gli Energy Manager; Numeri
4-2002, 1-2003
Bozzo G, Gomez A, Licheni J.: Le E.S.Co. in Italia: il mercato, gli strumenti
contrattuali e finanziari; Università degli Studi di Roma - Master Universitario
di II livello in “Management dell’Energia e dell’Ambiente”, 2004.
EPC PLUS: Leutgöb, K., Irrek, W. et al.: Strategic product development for
the Energy Efficiency Service market, The ChangeBest Energy Efficiency
Service Development Guide, 2011 (www.changebest.eu).