Caro Danilo… Questa sessione mi sembra molto interessante ... · Paziente vigile, orientato...
143
Caro Danilo… Questa sessione mi sembra molto interessante… Casi clinici particolari e messaggi pratici…
Transcript of Caro Danilo… Questa sessione mi sembra molto interessante ... · Paziente vigile, orientato...

Caro Danilo…
Questa sessione mi sembra molto
interessante…
Casi clinici particolari e messaggi
pratici…
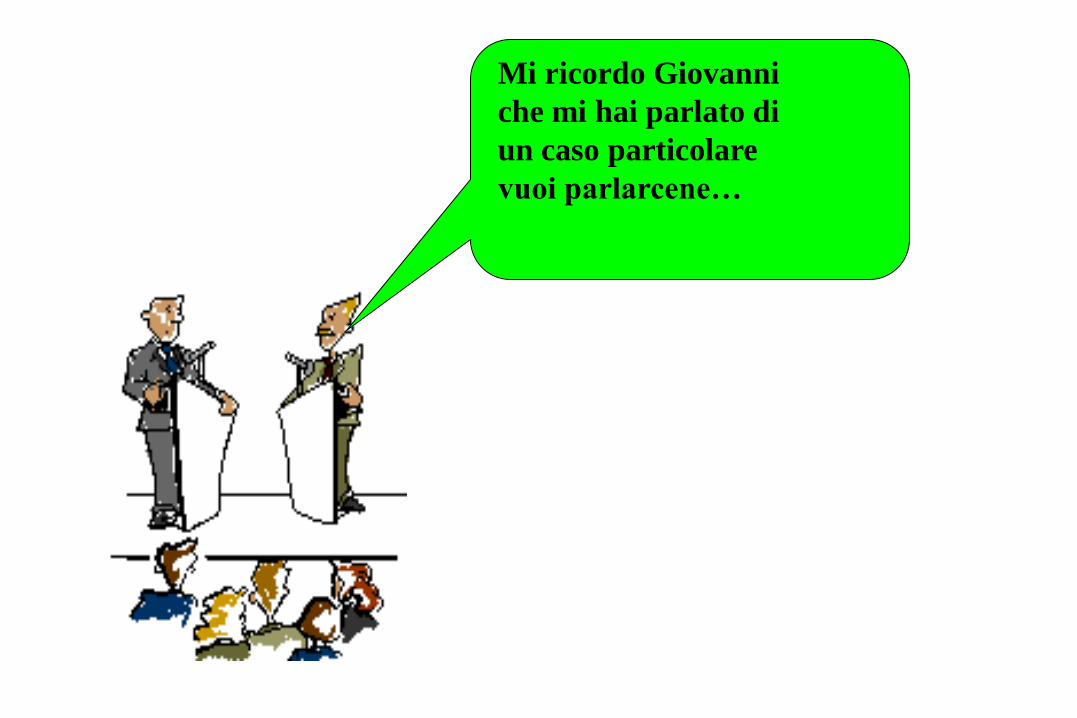
Mi ricordo Giovanni
che mi hai parlato di
un caso particolare
vuoi parlarcene…
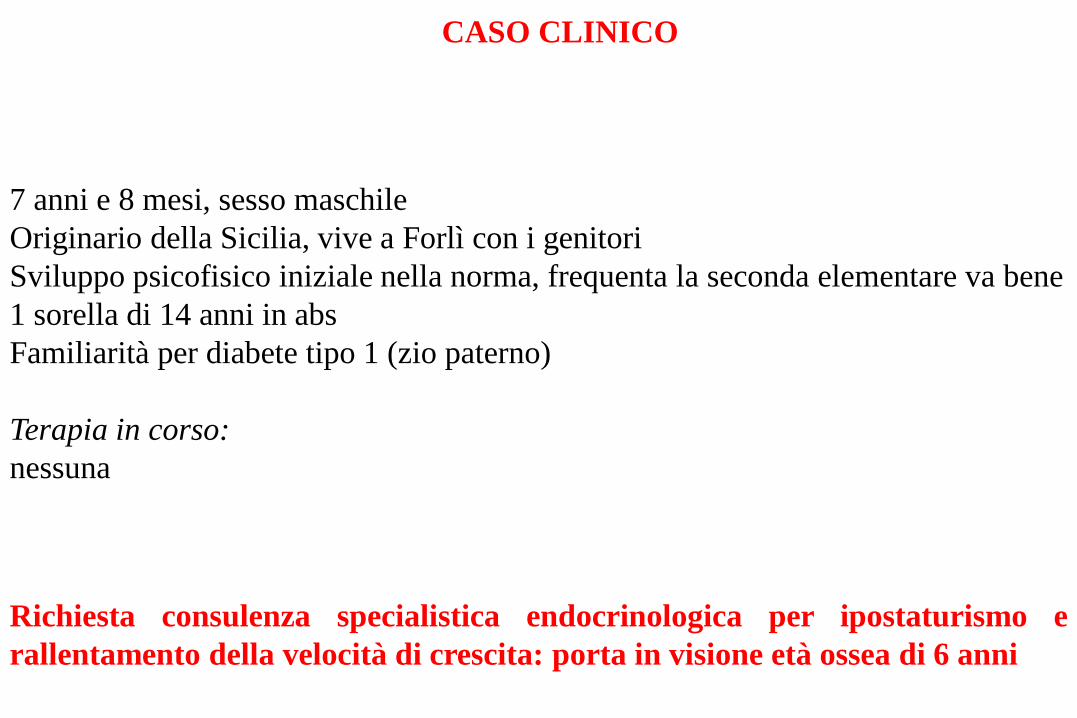
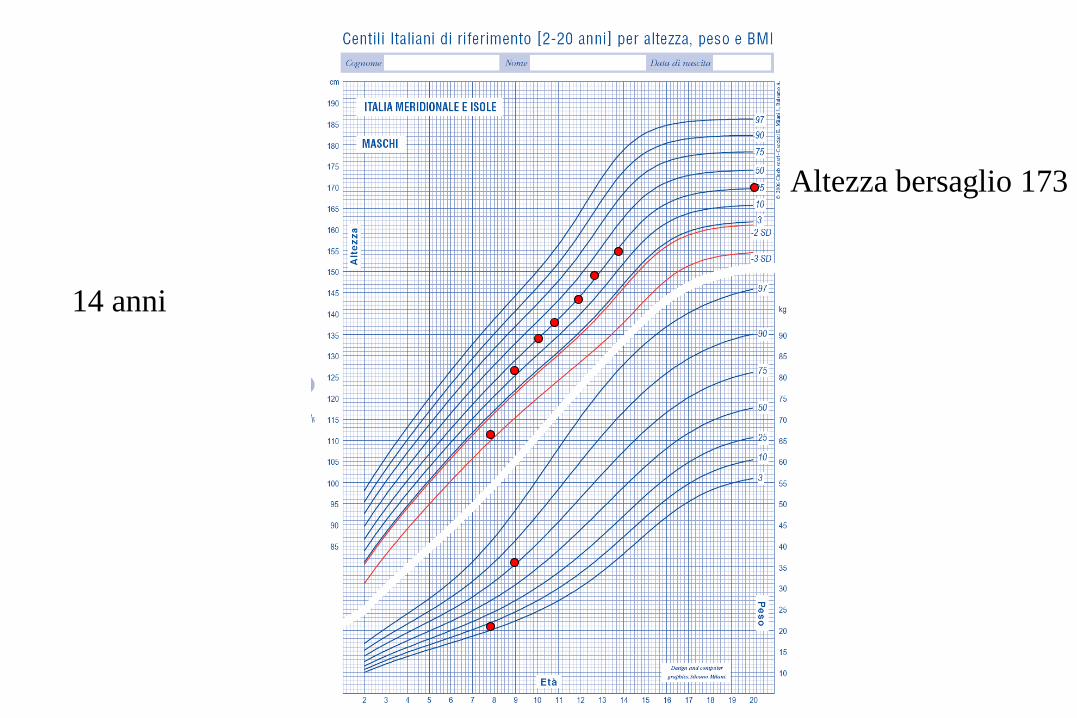
7 anni e 8 mesi, sesso maschile
Originario della Sicilia, vive a Forlì con i genitori
Sviluppo psicofisico iniziale nella norma, frequenta la seconda elementare va bene
1 sorella di 14 anni in abs
Familiarità per diabete tipo 1 (zio paterno)
Terapia in corso:
nessuna
Richiesta consulenza specialistica endocrinologica per ipostaturismo e
rallentamento della velocità di crescita: porta in visione età ossea di 6 anni
CASO CLINICO
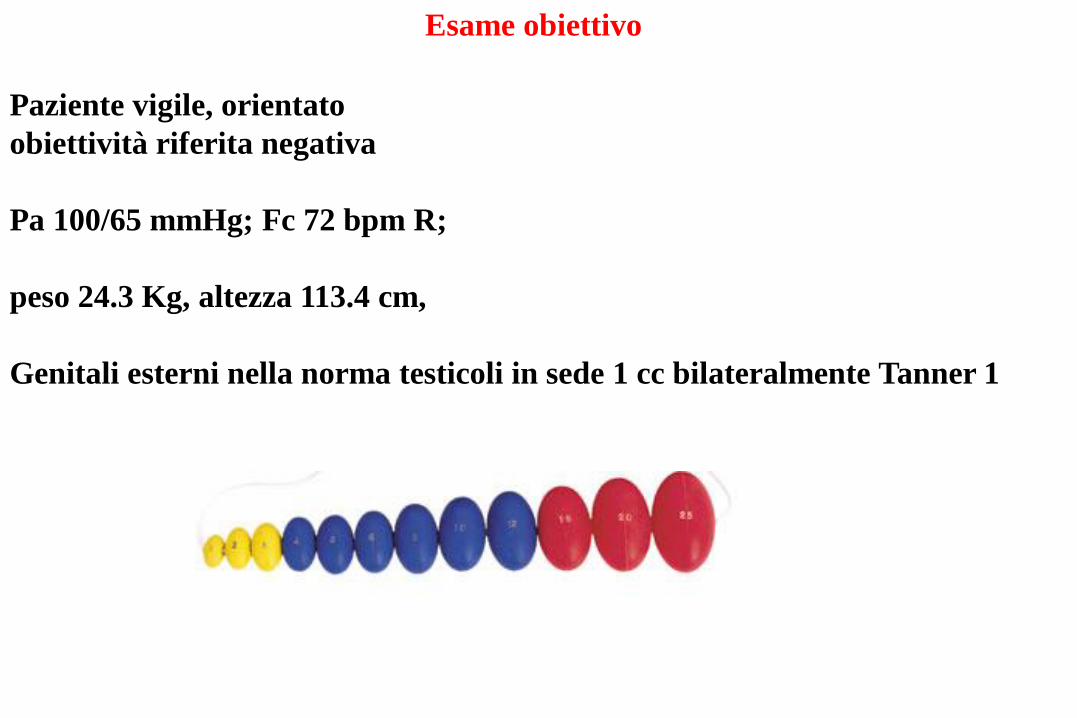
Paziente vigile, orientato
obiettività riferita negativa
Pa 100/65 mmHg; Fc 72 bpm R;
peso 24.3 Kg, altezza 113.4 cm,
Genitali esterni nella norma testicoli in sede 1 cc bilateralmente Tanner 1
Esame obiettivo
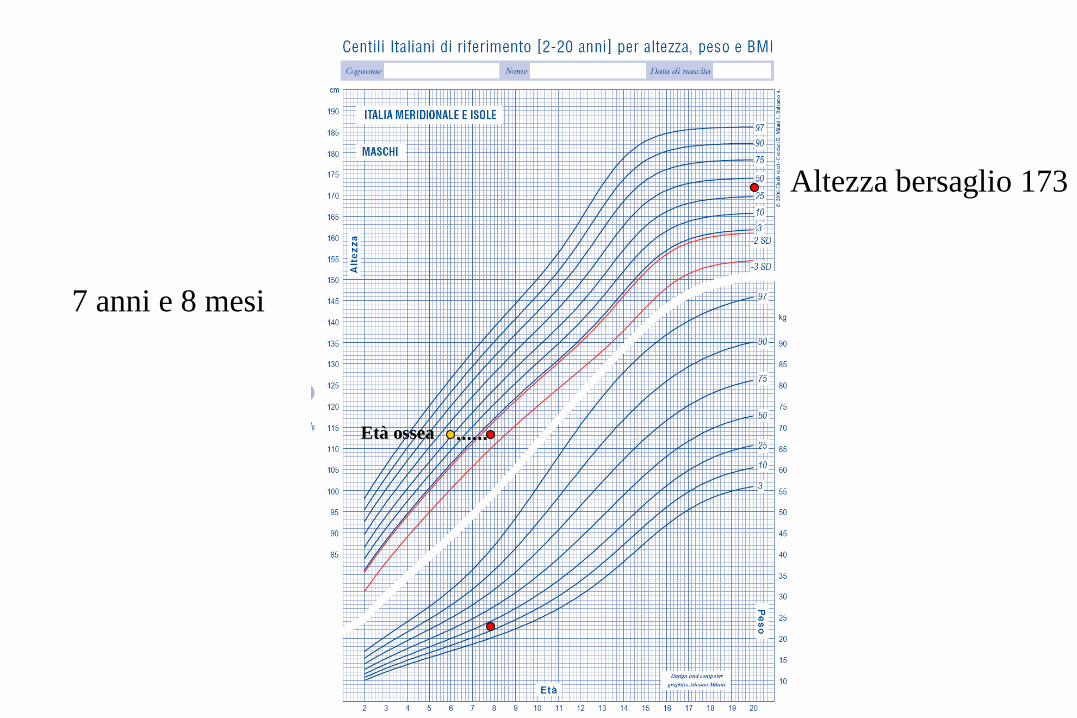
Altezza bersaglio 173
7 anni e 8 mesi
Età ossea
Quali accertamenti diagnostici consigliereste?
1. Nulla, rassicuriamo e lo rivalutiamo a 3 mesi
2. RMN ipofisi
3. Esami generali e ormonali basalidinamici
4. RX sella turcica
5. Non saprei
Dati bioumorali generali
Na+ mEq/L 137 (135-146)
Ca + + mEq/L 9.6 (8-11.5)
K+
mg/dl 3.8 (3.5-5.3)
Glicemia mg/dl 85 (60-110)
Creatinina mg/dl 0.53 (0.5-1.2)
Globuli bianchi 6.55x10³
(4.2-9)
Globuli rossi 4.7 6
(4.2-5.5)
Piastrine 288x103 (130-400)
Emoglobina 13.2 (13-16.5)
VCM fL 85.6 (80-96)
MCH 40.2 (27-31)
Formula leucocitaria
Neutrofili
Linfociti
Monociti
Eosinofili
Basofili
40.0
37.0
7.1
17.2
0.7
(40-74)
(19-48)
(3-9)
(0-6)
(0-1.5)
VES mm/h 11 <15
Sideremia mcg/dl 82 (50-165)
Screening celiachia Neg
Esami ormonali basali
LH 0.4 U/L (0.6-7)
FSH 0.1 U/L (2-18)
Testosterone totale 1.02 nmol/L (10-22)
ACTH 16.7 pg/ml (<46)
Cortisolo 193 ng/ml (70-210)
GH <0.1 ng/ml (<5)
IGF-1 53 ng/ml (188-474)
TSH 0.39 U/L (0.3-5)
FT4 9.0 pg/ml (7-19)
PRL 15 ng/ml ( <15)

Quali esami diagnostici dinamici consigliereste?
1. Nulla, rassicuriamo e lo rivalutiamo a 3 mesi
2. Test clonidina
3. GH RH
4. GH-RH + arginina
5. L-dopa
Test dinamici
FSH
ng
/ml
Tempi
Test con arginina test
0
1
2
3
4
5
6
7
8
9
10
0 30 60 90 120
FSH
ng
/ml
Tempi
Test alla clonidina
0
1
2
3
4
5
6
7
8
9
10
0 30 60 90 120
Test dinamici
ng
/ml
FSH
ng
/ml
Tempi
Test con L dopa
0
1
2
3
4
5
6
7
8
9
10
0 30 60 90

Presenza di processo occupante spazio ad estrinsecazione,
prevalentemente soprasellare con calcificazioni intrasellari. La
formazione occupa le cisterne soprasellari e si estende verso l’alto
fino ad interessare il foramen bilateralmente.
Il terzo ventricolo è compresso e male apprezzabile.
L’iniezione endovenosa con mdc paramagnetico provoca uno
sfumato enhancemen della periferia della lesione.
I ventricoli laterali sono modicamente dilatati
RMN encefalo
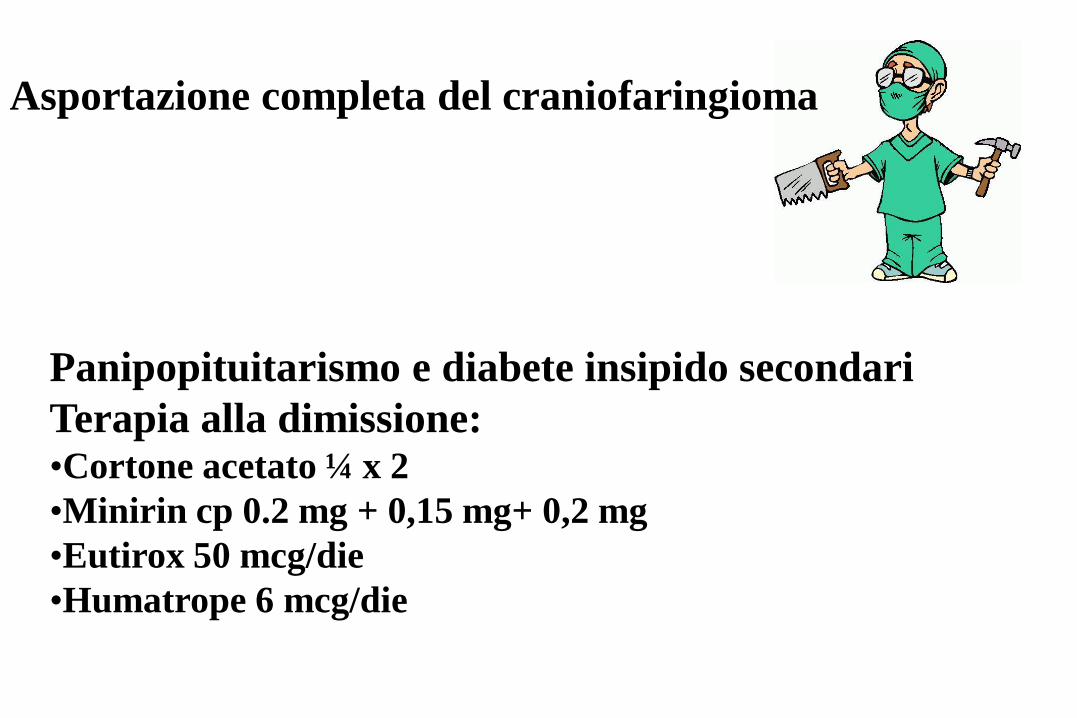
Asportazione completa del craniofaringioma
Panipopituitarismo e diabete insipido secondari
Terapia alla dimissione: •Cortone acetato ¼ x 2
•Minirin cp 0.2 mg + 0,15 mg+ 0,2 mg
•Eutirox 50 mcg/die
•Humatrope 6 mcg/die
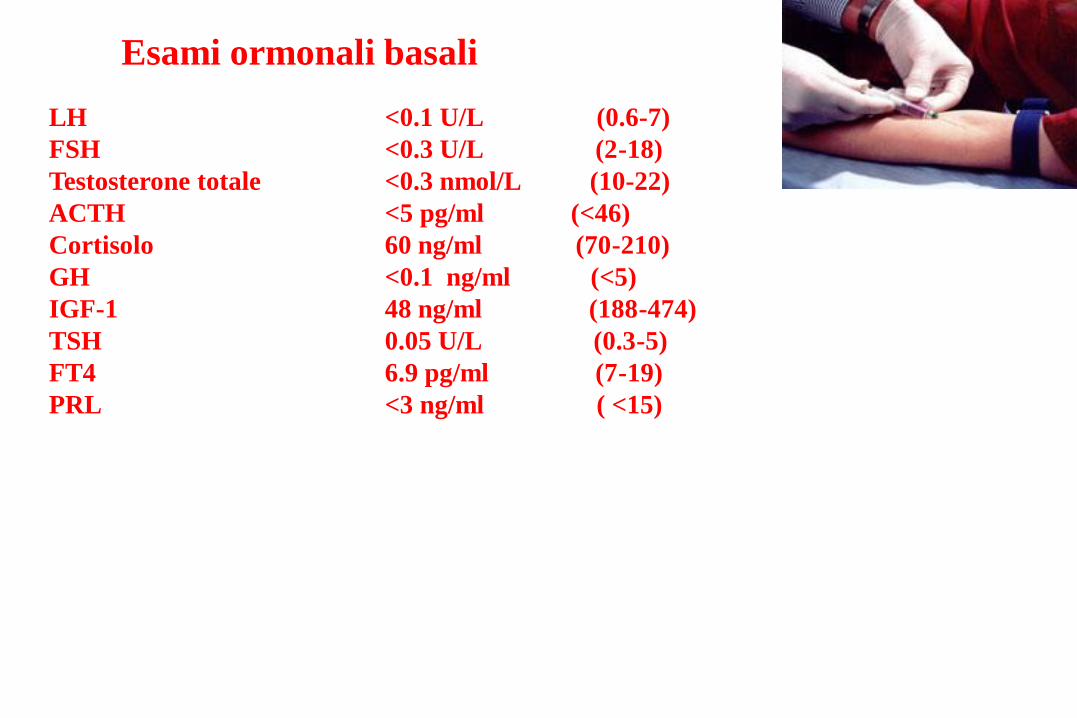
Esami ormonali basali
LH <0.1 U/L (0.6-7)
FSH <0.3 U/L (2-18)
Testosterone totale <0.3 nmol/L (10-22)
ACTH <5 pg/ml (<46)
Cortisolo 60 ng/ml (70-210)
GH <0.1 ng/ml (<5)
IGF-1 48 ng/ml (188-474)
TSH 0.05 U/L (0.3-5)
FT4 6.9 pg/ml (7-19)
PRL <3 ng/ml ( <15)
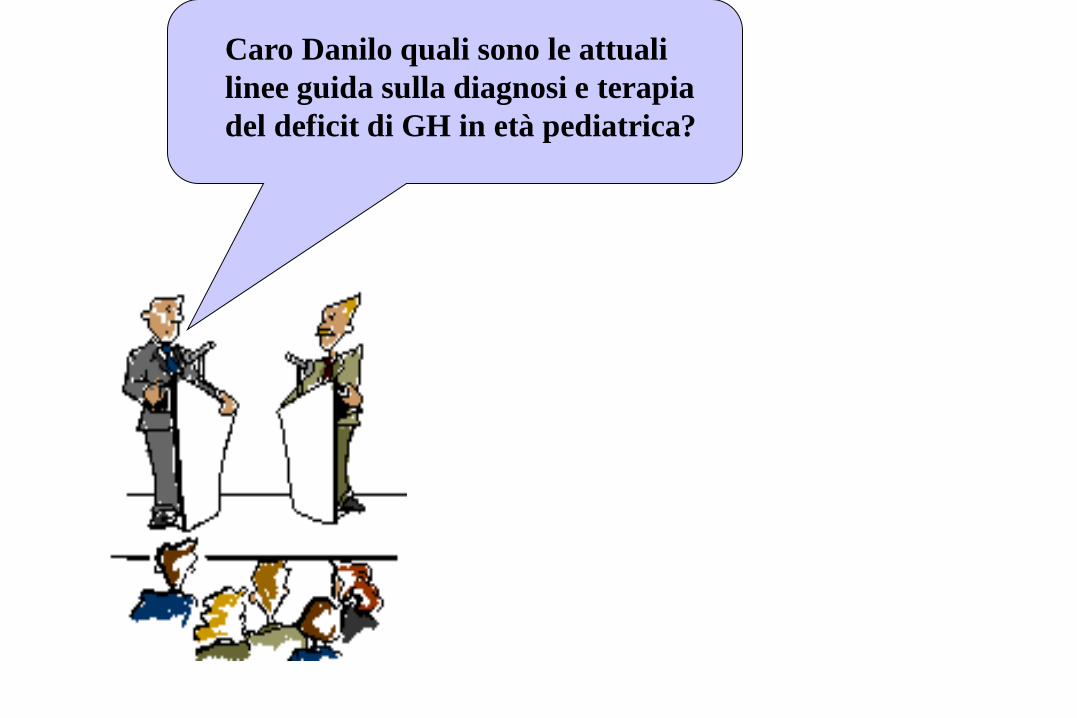
Caro Danilo quali sono le attuali
linee guida sulla diagnosi e terapia
del deficit di GH in età pediatrica?
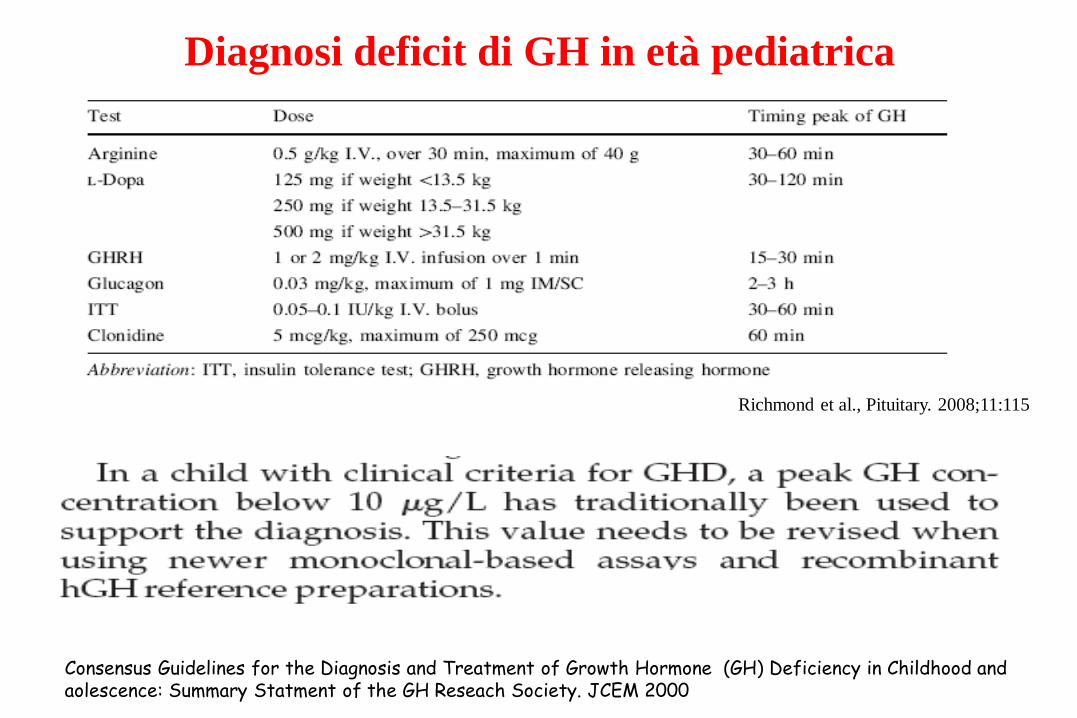
Diagnosi deficit di GH in età pediatrica
Consensus Guidelines for the Diagnosis and Treatment of Growth Hormone (GH) Deficiency in Childhood and aolescence: Summary Statment of the GH Reseach Society. JCEM 2000
Richmond et al., Pituitary. 2008;11:115

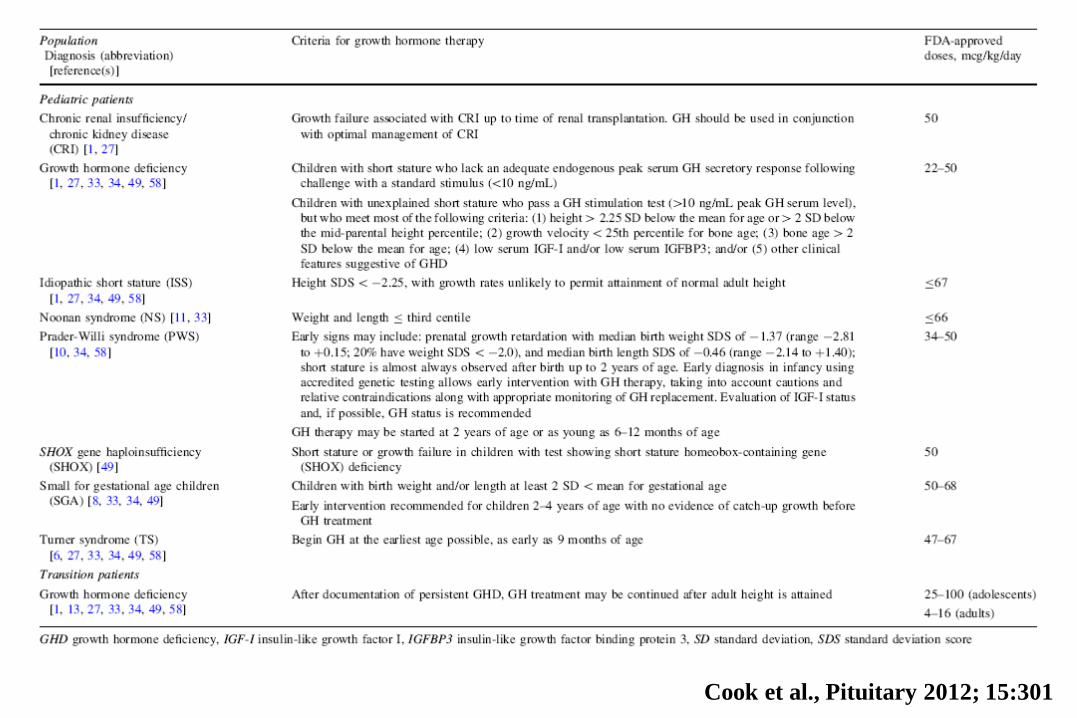
This review will summarize the current guidelines for FDA-approved uses of GH
among children and transition patients. A greater knowledge of these guidelines by
medical providers will be instrumental in ensuring that patients with disorders of
short stature are recommended for treatment and that they are treated
appropriately.
Cook et al., Pituitary 2012; 15:301
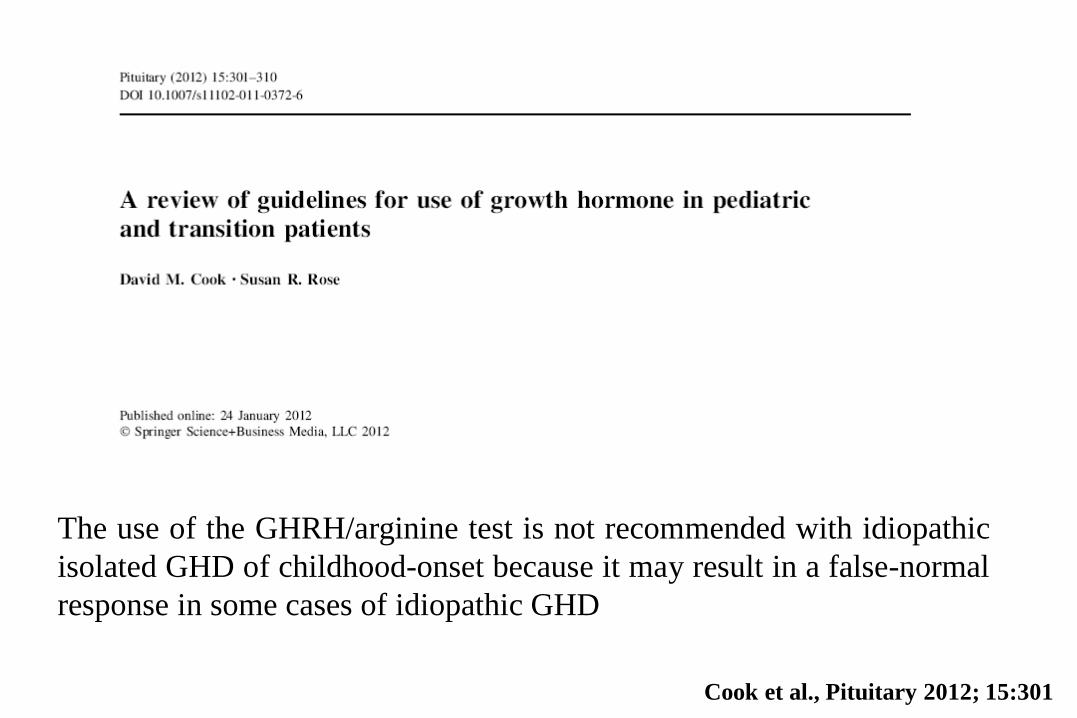
The use of the GHRH/arginine test is not recommended with idiopathic
isolated GHD of childhood-onset because it may result in a false-normal
response in some cases of idiopathic GHD
Cook et al., Pituitary 2012; 15:301
Cook et al., Pituitary 2012; 15:301
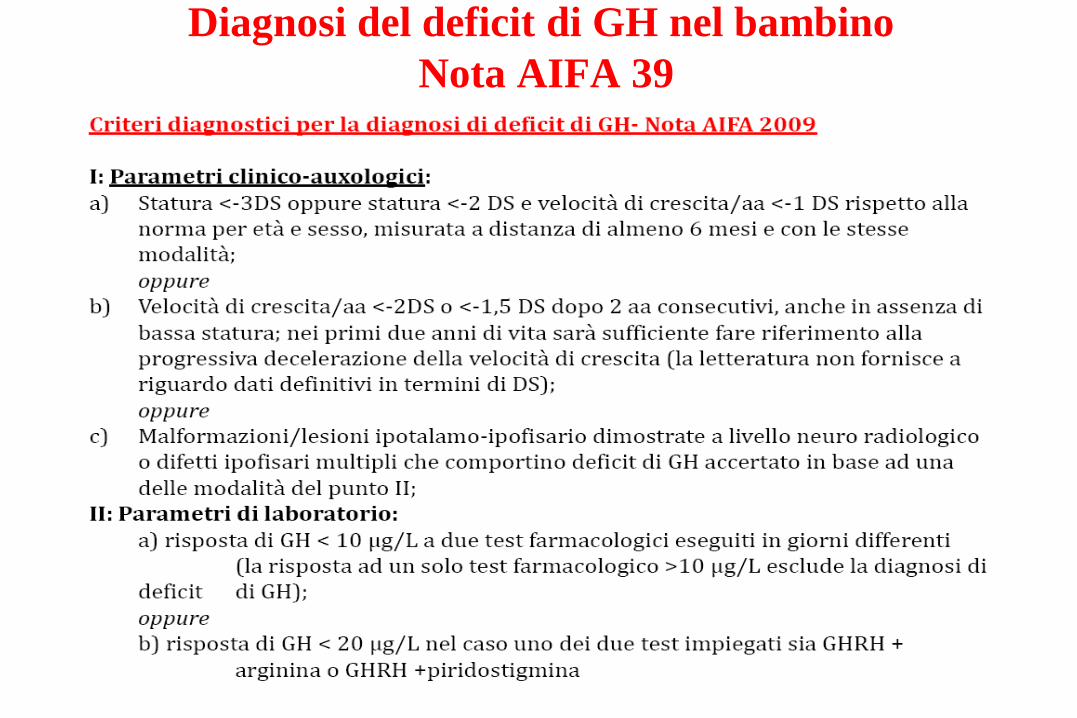
Diagnosi del deficit di GH nel bambino
Nota AIFA 39
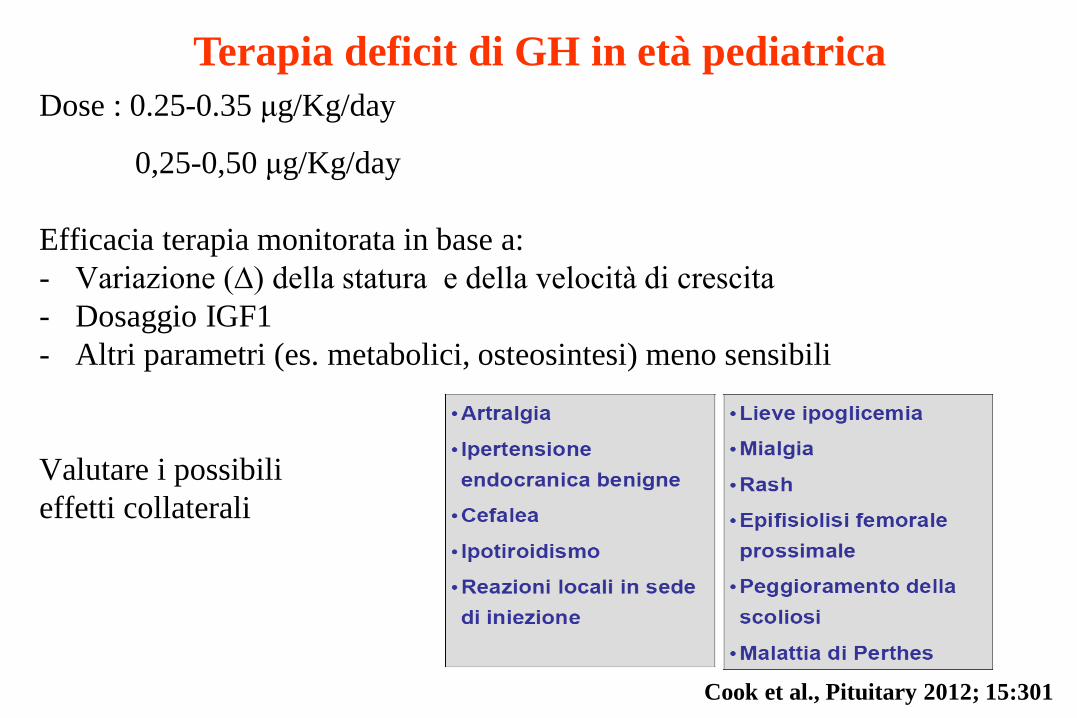
Terapia deficit di GH in età pediatrica
Dose : 0.25-0.35 μg/Kg/day
0,25-0,50 μg/Kg/day
Efficacia terapia monitorata in base a:
- Variazione (∆) della statura e della velocità di crescita
- Dosaggio IGF1
- Altri parametri (es. metabolici, osteosintesi) meno sensibili
Valutare i possibili
effetti collaterali
Cook et al., Pituitary 2012; 15:301

Tp con rhGH in età pediatrica: effetto sulla crescita
• Appare essenziale “massimizzare” il guadagno
staturale prima dell’inizio della pubertà
• Se la pubertà compare quando la statura non è
ancora completa, è opportuno prendere in
considerazione:
• incremento delle dosi di GH
• l’aggiunta di analoghi del GnRH al GH
• La valutazione del rapporto tra l’incremento
dell’età staturale e l’incremento dell’età ossea
rappresenta un indice sensibile per valutare
l’efficacia della terapia con GH
Cook et al., Pituitary 2012; 15:301
Altezza bersaglio 173
14 anni

Giovanni e con la
pubertà che si fa?…
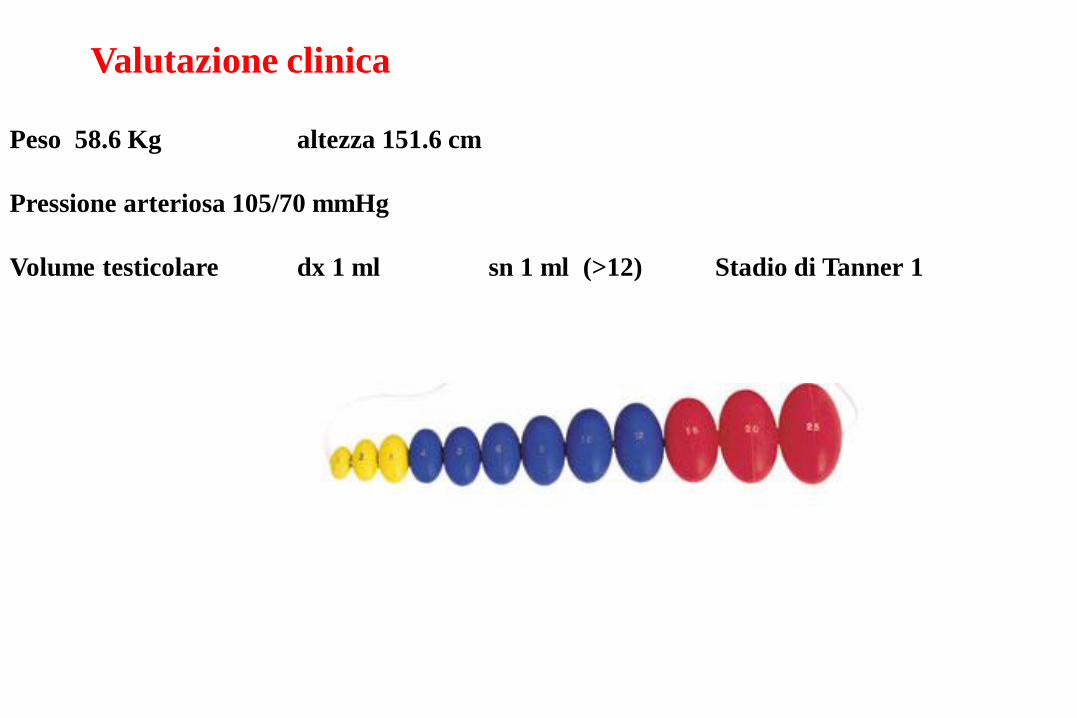
Valutazione clinica
Peso 58.6 Kg altezza 151.6 cm
Pressione arteriosa 105/70 mmHg
Volume testicolare dx 1 ml sn 1 ml (>12) Stadio di Tanner 1
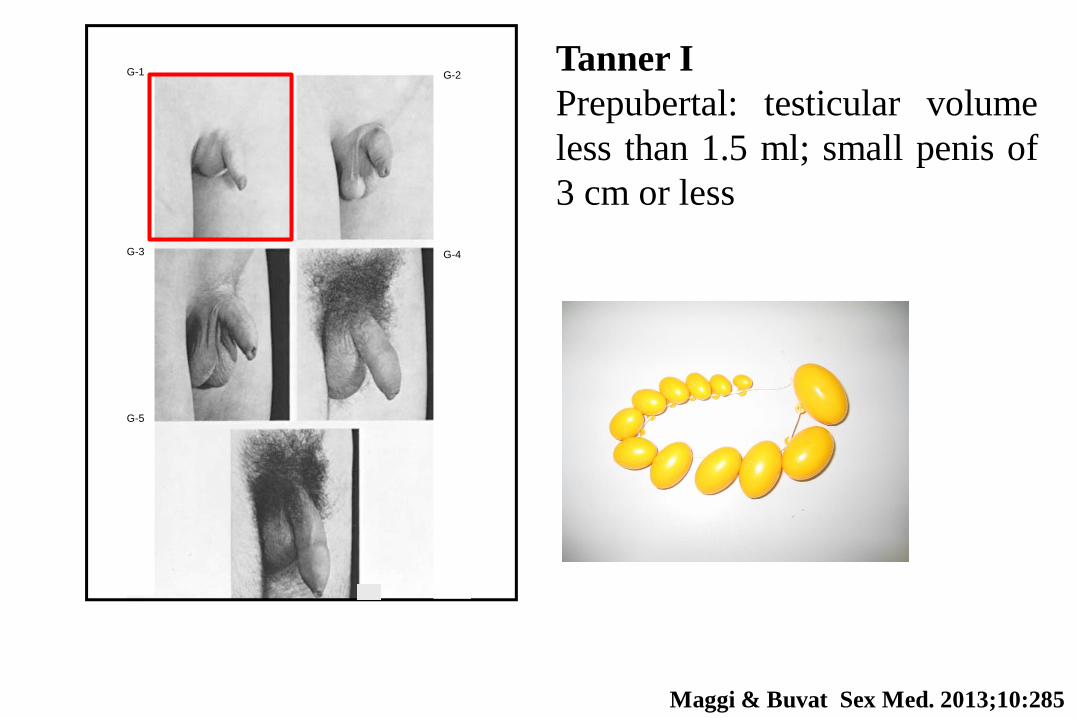
G-1
G-3
G-5
G-2
G-4
A. B.
Tanner I
Prepubertal: testicular volume
less than 1.5 ml; small penis of
3 cm or less
Maggi & Buvat Sex Med. 2013;10:285
Maggi & Buvat Sex Med. 2013;10:285
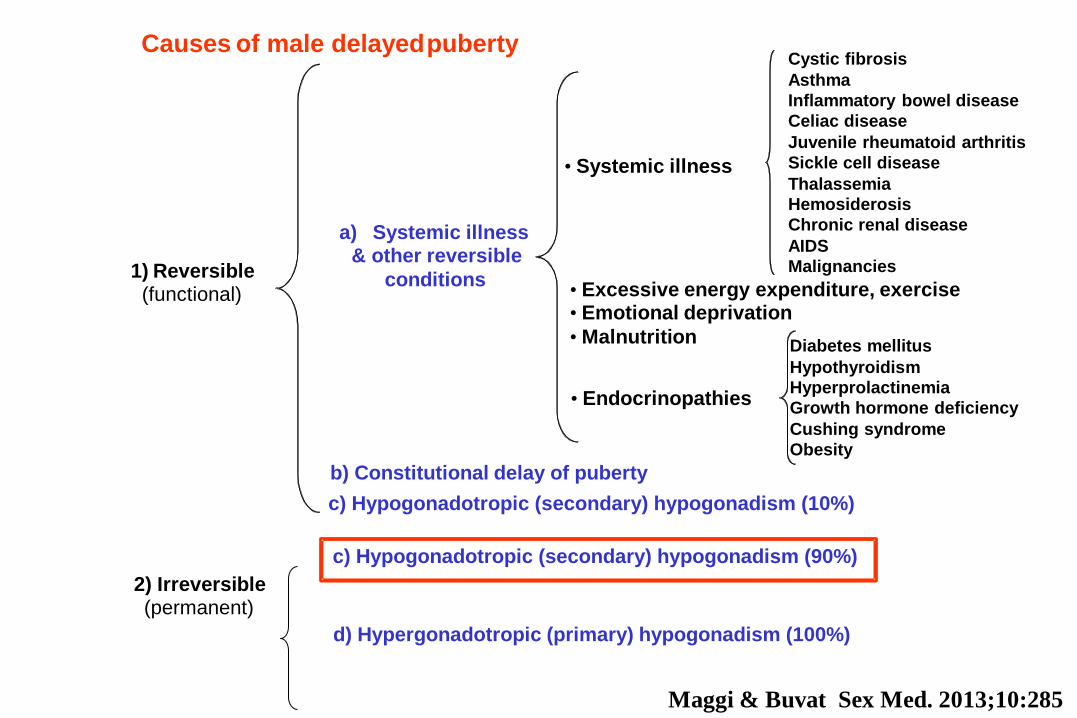
Causes of male delayed puberty
1) Reversible
(functional)
2) Irreversible
(permanent)
c) Hypogonadotropic (secondary) hypogonadism (90%)
d) Hypergonadotropic (primary) hypogonadism (100%)
b) Constitutional delay of puberty
a) Systemic illness & other reversible
conditions
Cystic fibrosis
Asthma
Inflammatory bowel disease
Celiac disease
Juvenile rheumatoid arthritis
Sickle cell disease
Thalassemia
Hemosiderosis
Chronic renal disease
AIDS
Malignancies
Diabetes mellitus
Hypothyroidism
Hyperprolactinemia
Growth hormone deficiency
Cushing syndrome
Obesity
• Systemic illness
• Excessive energy expenditure, exercise
• Emotional deprivation
• Malnutrition
• Endocrinopathies
c) Hypogonadotropic (secondary) hypogonadism (10%)
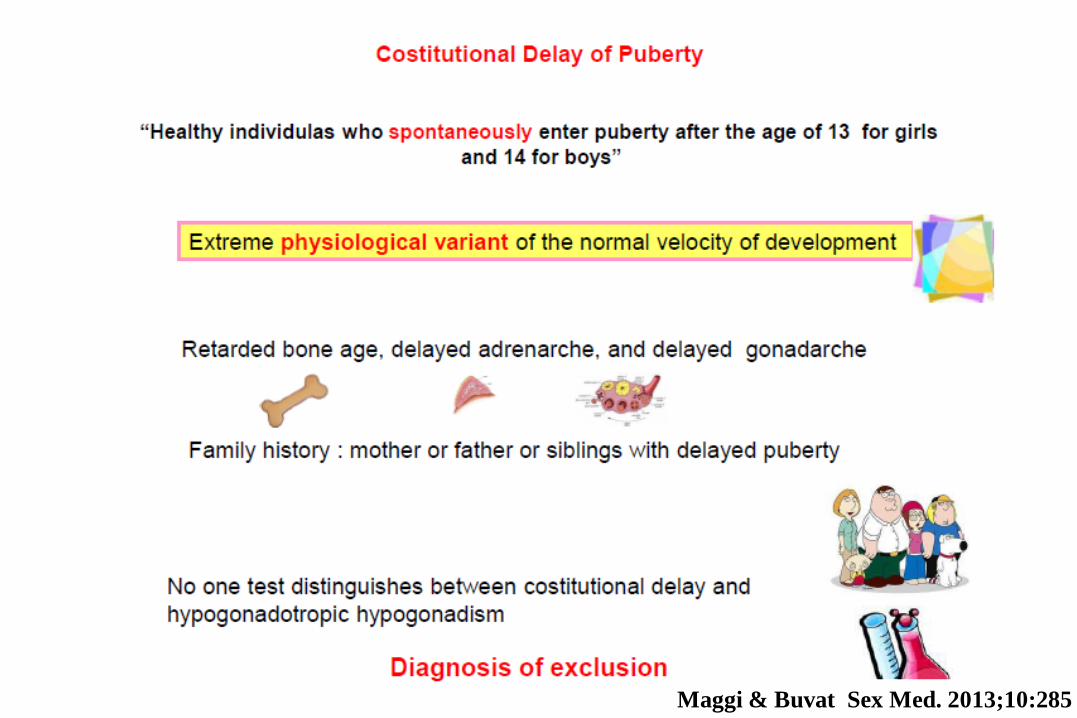
Maggi & Buvat Sex Med. 2013;10:285
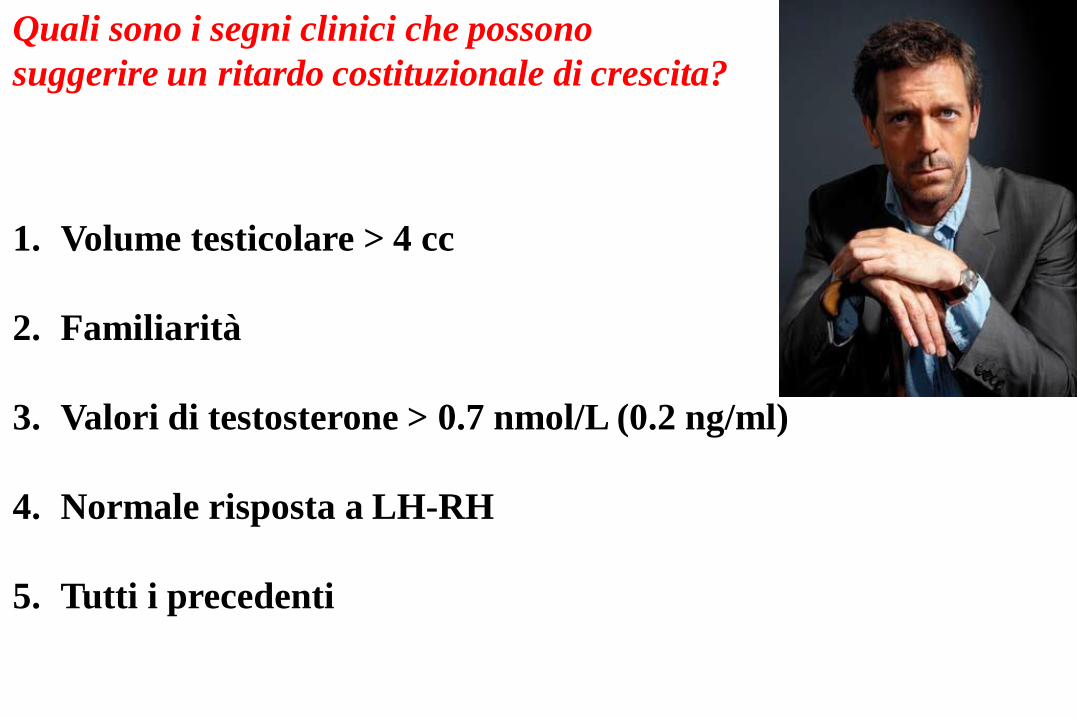
Quali sono i segni clinici che possono
suggerire un ritardo costituzionale di crescita?
1. Volume testicolare > 4 cc
2. Familiarità
3. Valori di testosterone > 0.7 nmol/L (0.2 ng/ml)
4. Normale risposta a LH-RH
5. Tutti i precedenti

I livelli di testosterone possono essere usati come segno
predittore di pubertà: un valore maggiore di 0.7 nmol/L (0.2
ng/ml; 20 ng/dl) indica un volume testicolare superiore a 4
mL entro 12 mesi nel 77% ed entro 15 mesi 100%.
Maggi & Buvat Sex Med. 2013;10:285
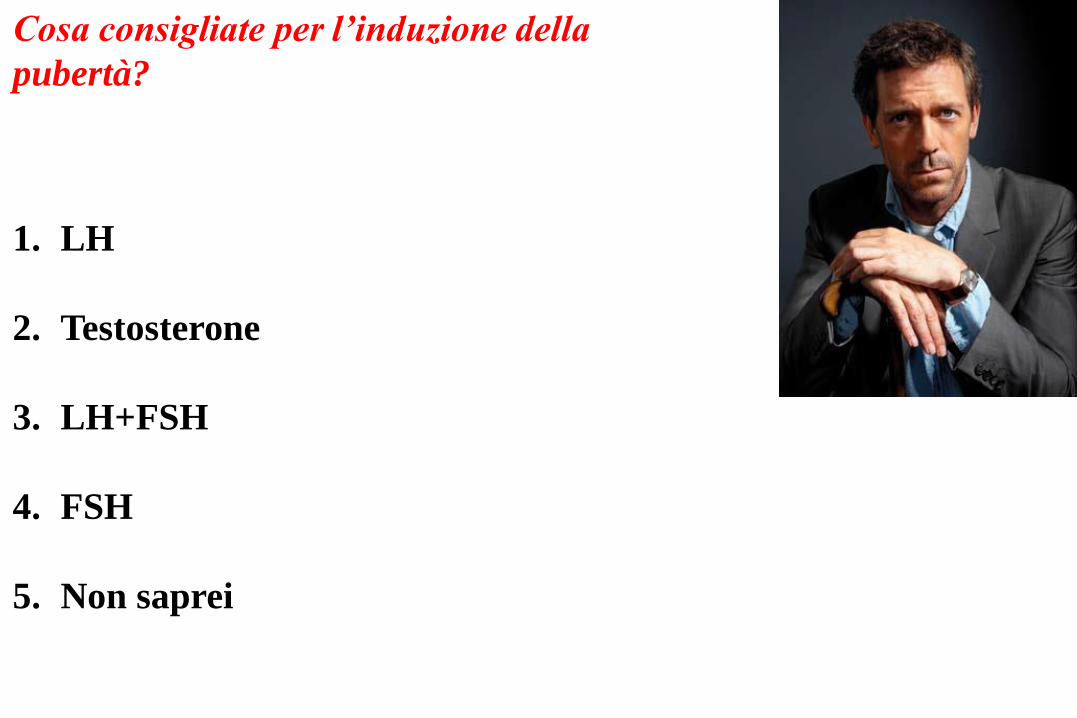
Cosa consigliate per l’induzione della
pubertà?
1. LH
2. Testosterone
3. LH+FSH
4. FSH
5. Non saprei
•Trattamento con testosterone: circa il 15 -25 % della dose abituale dell’adulto è
sufficiente per ottenere una normale virilizzazione e una normale crescita nel
tempo, senza indurre un chiusura precoce delle cartilagini di cogniugazione (EBM
level lb).
Maggi & Buvat J Sex Med. 2013;10:285
•Trattamento con gonadotropine: 1250–5000 IU hCG in associazione con
12.5–150 IU hMG 3 volte settimana
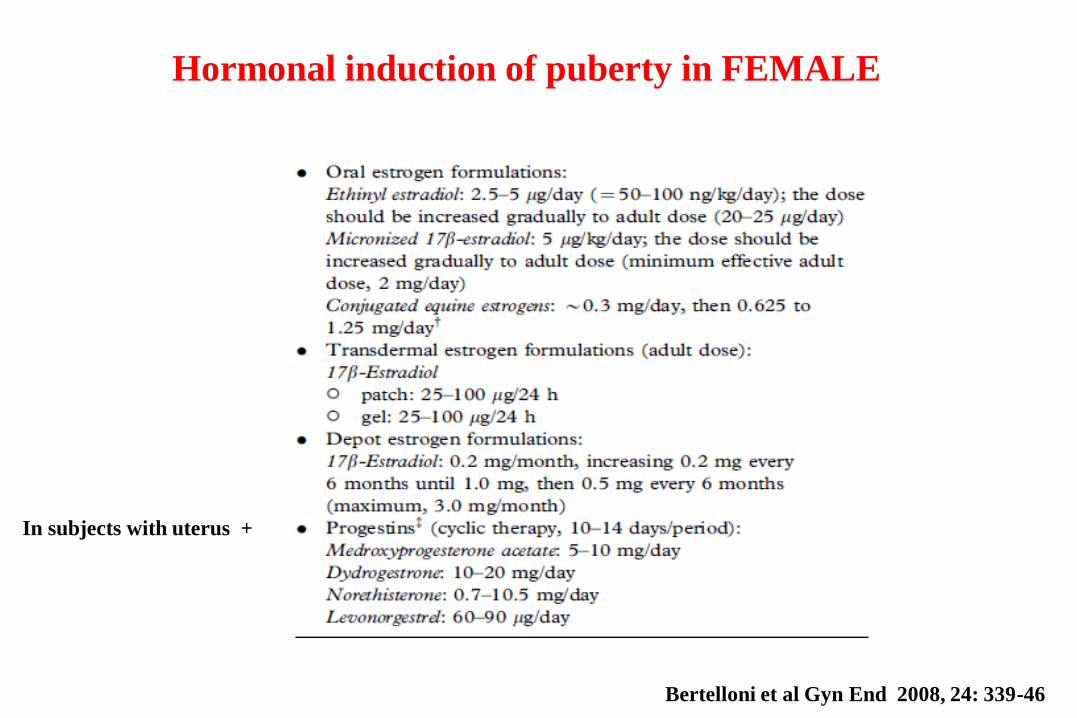
Hormonal induction of puberty in FEMALE
Bertelloni et al Gyn End 2008, 24: 339-46
In subjects with uterus +
Gonadotropins Testosterone
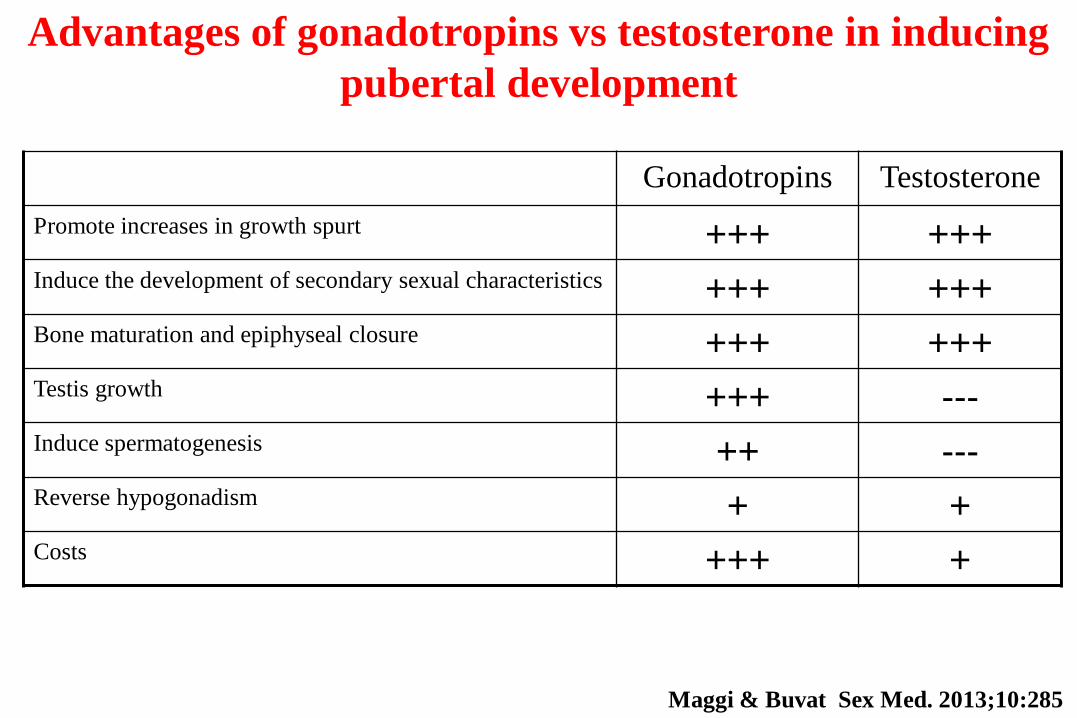
Promote increases in growth spurt +++ +++ Induce the development of secondary sexual characteristics +++ +++ Bone maturation and epiphyseal closure +++ +++ Testis growth +++ --- Induce spermatogenesis ++ --- Reverse hypogonadism + + Costs +++ +
Advantages of gonadotropins vs testosterone in inducing
pubertal development
Maggi & Buvat Sex Med. 2013;10:285
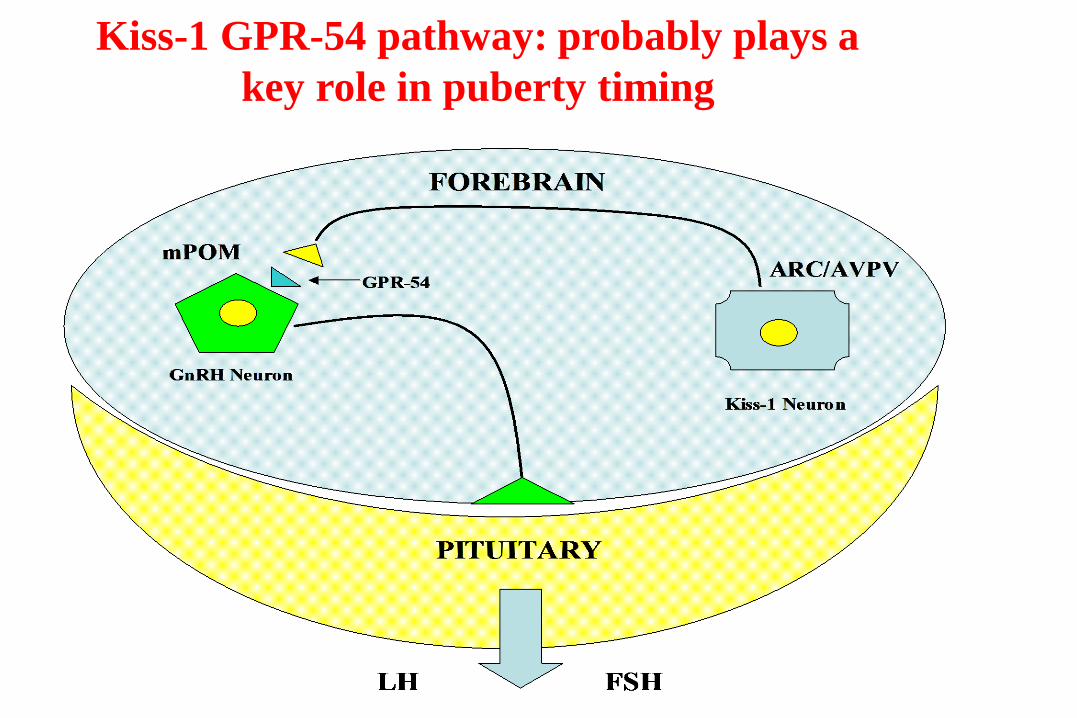
Kiss-1 GPR-54 pathway: probably plays a
key role in puberty timing
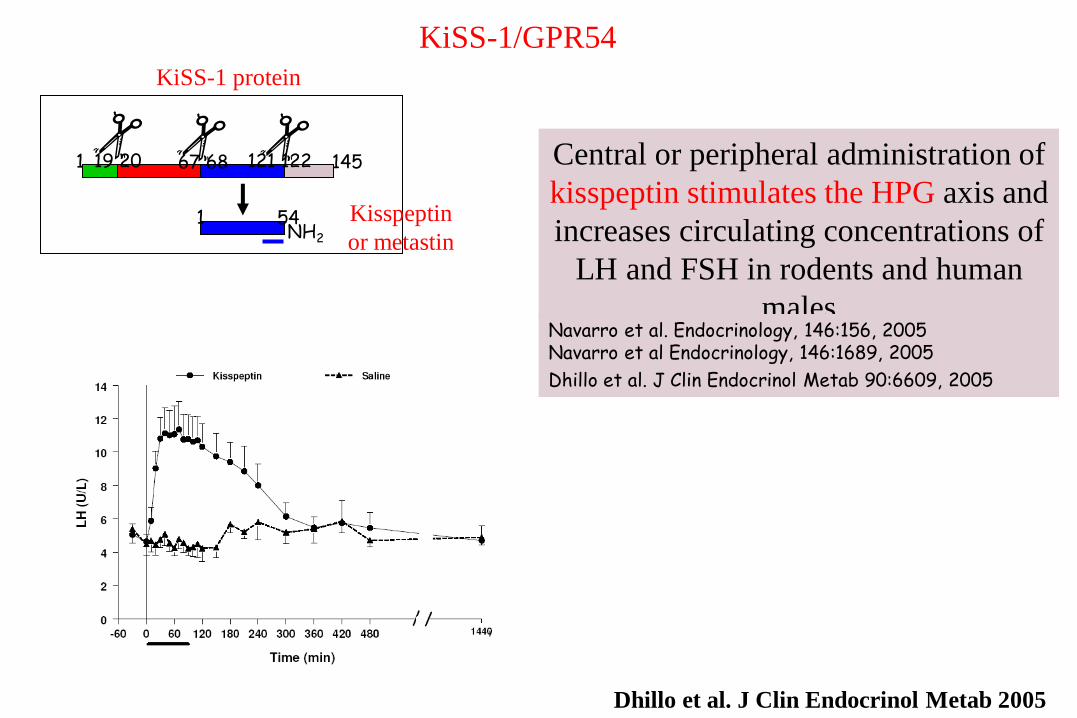
KiSS-1/GPR54
1 19 20 67 68 121 122 145
1 54 NH2
Kisspeptin
or metastin
KiSS-1 protein
Central or peripheral administration of
kisspeptin stimulates the HPG axis and
increases circulating concentrations of
LH and FSH in rodents and human
males
Navarro et al. Endocrinology, 146:156, 2005 Navarro et al Endocrinology, 146:1689, 2005
Dhillo et al. J Clin Endocrinol Metab 90:6609, 2005
Dhillo et al. J Clin Endocrinol Metab 2005
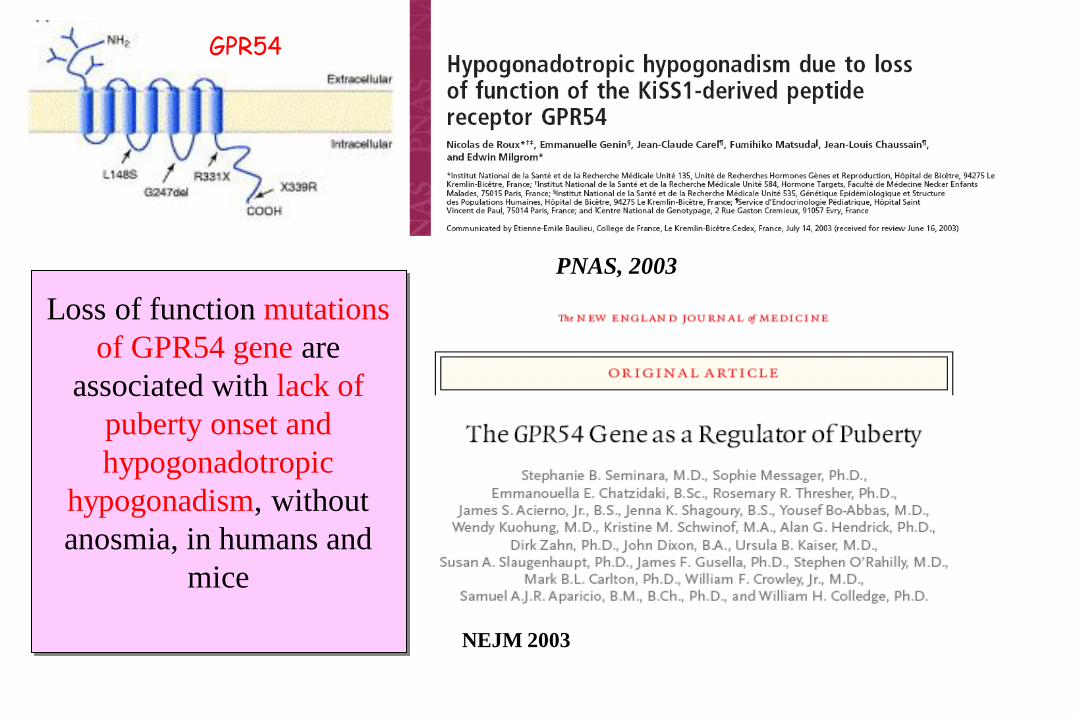
NEJM 2003
Loss of function mutations
of GPR54 gene are
associated with lack of
puberty onset and
hypogonadotropic
hypogonadism, without
anosmia, in humans and
mice
GPR54
PNAS, 2003

2008,358:709
Teles et al., N Engl J Med. 2008
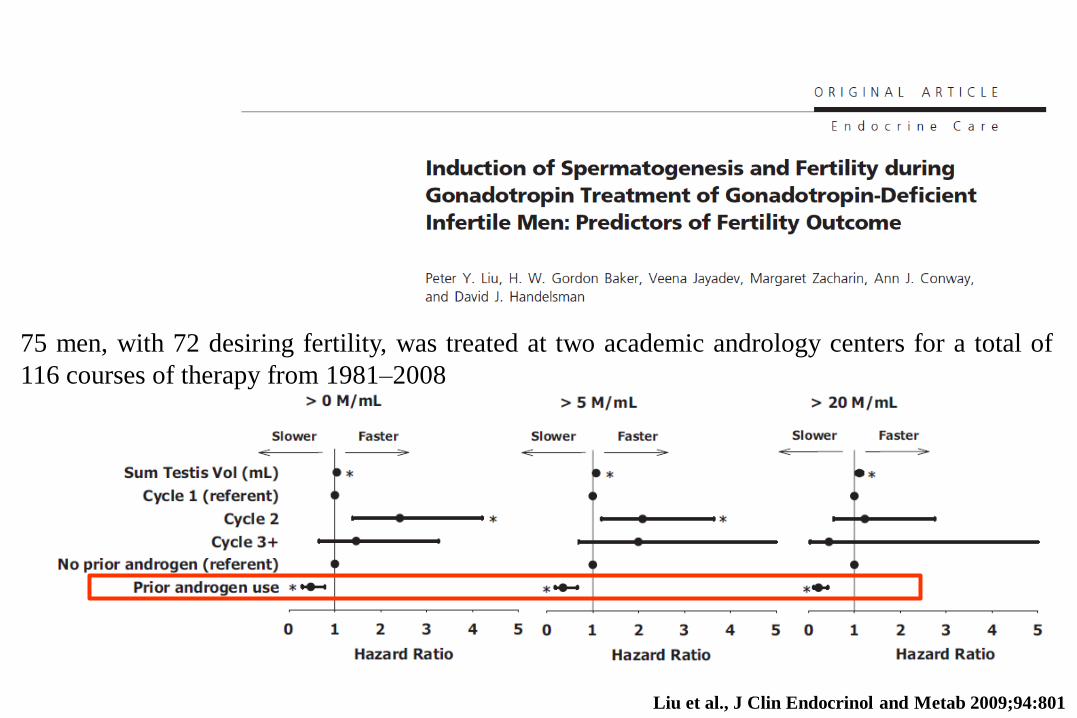
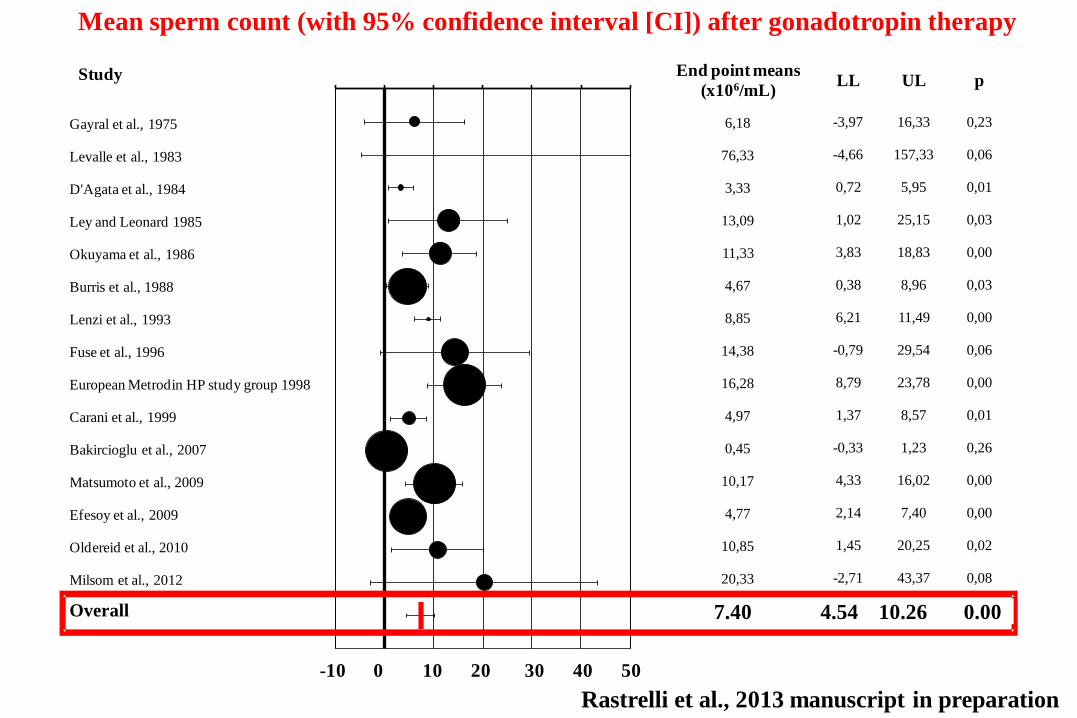
Liu et al., J Clin Endocrinol and Metab 2009;94:801
75 men, with 72 desiring fertility, was treated at two academic andrology centers for a total of
116 courses of therapy from 1981–2008

Rastrelli et al., 2013 manuscript in preparation
-10
,00
0,0
0
10
,00
20
,00
30
,00
40
,00
50
,00 End point means
(x106/mL)LL UL p
6,18 -3,97 16,33 0,23
76,33 -4,66 157,33 0,06
3,33 0,72 5,95 0,01
13,09 1,02 25,15 0,03
11,33 3,83 18,83 0,00
4,67 0,38 8,96 0,03
8,85 6,21 11,49 0,00
14,38 -0,79 29,54 0,06
16,28 8,79 23,78 0,00
4,97 1,37 8,57 0,01
0,45 -0,33 1,23 0,26
10,17 4,33 16,02 0,00
4,77 2,14 7,40 0,00
10,85 1,45 20,25 0,02
20,33 -2,71 43,37 0,08
7,40 4,54 10,26 0,00
Study
Gayral et al., 1975
Levalle et al., 1983
D'Agata et al., 1984
Ley and Leonard 1985
Okuyama et al., 1986
Burris et al., 1988
Lenzi et al., 1993
Fuse et al., 1996
European Metrodin HP study group 1998
Carani et al., 1999
Bakircioglu et al., 2007
Matsumoto et al., 2009
Efesoy et al., 2009
Oldereid et al., 2010
Milsom et al., 2012
Overall
-10 0 10 20 30 40 50
Mean sperm count (with 95% confidence interval [CI]) after gonadotropin therapy
Rastrelli et al., 2013 manuscript in preparation
Overall 7.40 4.54 10.26 0.00
-10
,00
0,0
0
10
,00
20
,00
30
,00
40
,00 End point means
(x106/mL)LL UL p
13,09 1,02 25,15 0,03
11,33 3,83 18,83 0,00
16,28 8,79 23,78 0,00
13,69 8,84 18,54 0,00
6,18 -3,97 16,33 0,23
3,33 0,72 5,95 0,01
4,67 0,38 8,96 0,03
8,85 6,21 11,49 0,00
14,38 -0,79 29,54 0,06
6,10 2,86 9,34 0,00
-10 0 10 20 30 40
Study
Ley and Leonard 1985
Okuyama et al., 1986
European Metrodin HP study group 1998
Overall mixed pre and post pubertal onset HG
Gayral et al., 1975
D'Agata et al., 1984
Burris et al., 1988
Lenzi et al., 1993
Fuse et al., 1996
Overall only pre pubertal onset HG
Heterogenity Q=6.51; p=0.01
Mean sperm count (with 95% confidence interval [CI]) after gonadotropin therapy
Overall mixed pre and post pubertal onset 13.69 8.84 18.54 0.00
Overall only pre pubertal onset 6.10 2.86 9.34 0.00
Rastrelli et al., 2013 manuscript in preparation

-10
,00
0,0
0
10
,00
20
,00
30
,00
40
,00
50
,00Study
Ley and Leonard 1985
Fuse et al., 1996
Carani et al., 1999
Overall Urinary derived FSH
Lenzi et al., 1993
European Metrodin HP study group 1998
Overall Purified FSH
Okuyama et al., 1986
Bakircioglu et al., 2007
Matsumoto et al., 2009
Efesoy et al., 2009
Milsom et al., 2012
Overall Recombinant FSH
End point means
(x106/mL)LL UL p
13,09 1,02 25,15 0,03
14,38 -0,79 29,54 0,06
4,97 1,37 8,57 0,01
7,78 1,80 13,75 0,01
8,85 6,21 11,49 0,00
16,28 8,79 23,78 0,00
11,71 4,62 18,79 0,00
11,33 3,83 18,83 0,00
0,45 -0,33 1,23 0,26
10,17 4,33 16,02 0,00
4,77 2,14 7,40 0,00
20,33 -2,71 43,37 0,08
6,27 1,59 10,94 0,01
Heterogenity Q=1.578; p=0.454
-10 0 10 20 30 40 50
Mean sperm count (with 95% confidence interval [CI]) after gonadotropin therapy
Overall urinary derived FSH 7.78 1.80 13.75 0.01
Overall purified FSH 11.71 4.62 18.79 0.00
Overall recombinant FSH 6.27 1.59 10.94 0.01
Rastrelli et al., 2013 manuscript in preparation

-10,00
0,00
10,00
20,00
30,00
40,00
50,00
Study
Okuyama et al., 1986
Lenzi et al., 1993
European Metrodin HP study group 1998
Carani et al., 1999
Bakircioglu et al., 2007
Matsumoto et al., 2009
Efesoy et al., 2009
Oldereid et al., 2010
Milsom et al., 2012
Overall hCG+FSH
Levalle et al., 1983
D'Agata et al., 1984
Burris et al., 1988
Overall hCG only
End point means
(x106/mL)LL UL p
11,33 3,83 18,83 0,00
8,85 6,21 11,49 0,00
16,28 8,79 23,78 0,00
4,97 1,37 8,57 0,01
0,45 -0,33 1,23 0,26
10,17 4,33 16,02 0,00
4,77 2,14 7,40 0,00
10,85 1,45 20,25 0,02
20,33 -2,71 43,37 0,08
7,98 4,12 11,83 0,00
76,33 -4,66 157,33 0,06
3,33 0,72 5,95 0,01
4,67 0,38 8,96 0,03
4,03 0,25 7,81 0,04
Heterogenity Q=2.058; p=0.151
-10 0 10 20 30 40 50
Mean sperm count (with 95% confidence interval [CI]) after gonadotropin therapy
Overall hCG+FSH 7.98 4.12 11.83 0.00
Overall only hCG 4.03 0.25 7.81 0.04
Rastrelli et al., 2013 manuscript in preparation

-10,00
-5,00
0,00
5,00
10,00
15,00
20,00
25,00
30,00Study
D'Agata et al., 1984
Okuyama et al., 1986
Lenzi et al., 1993
Overall No previous TRT
Levalle et al., 1983
Ley and Leonard 1985
Burris et al., 1988
European Metrodin HP study group 1998
Carani et al., 1999
Bakircioglu et al., 2007
Matsumoto et al., 2009
Overall Previous TRT
End point means
(x106/mL)LL UL p
3,33 0,72 5,95 0,01
11,33 3,83 18,83 0,00
8,85 6,21 11,49 0,00
7,18 2,50 11,87 0,00
76,33 -4,66 157,33 0,06
13,09 1,02 25,15 0,03
4,67 0,38 8,96 0,03
16,28 8,79 23,78 0,00
4,97 1,37 8,57 0,01
0,45 -0,33 1,23 0,26
10,17 4,33 16,02 0,00
7,38 2,61 12,14 0,00
Heterogenity Q=0.003; p=0.955
c
-10 5 0 5 10 15 20 25 30
Mean sperm count (with 95% confidence interval [CI]) after gonadotropin therapy
Overall no previous TRT 7.18 2.50 11.87 0.00
Overall previous TRT 7.38 2.61 12.14 0.00
Rastrelli et al., 2013 manuscript in preparation
Altezza bersaglio 173
14 anni Testoviron depot 50 mg/mese per 2 mesi
poi 100 mg/mese
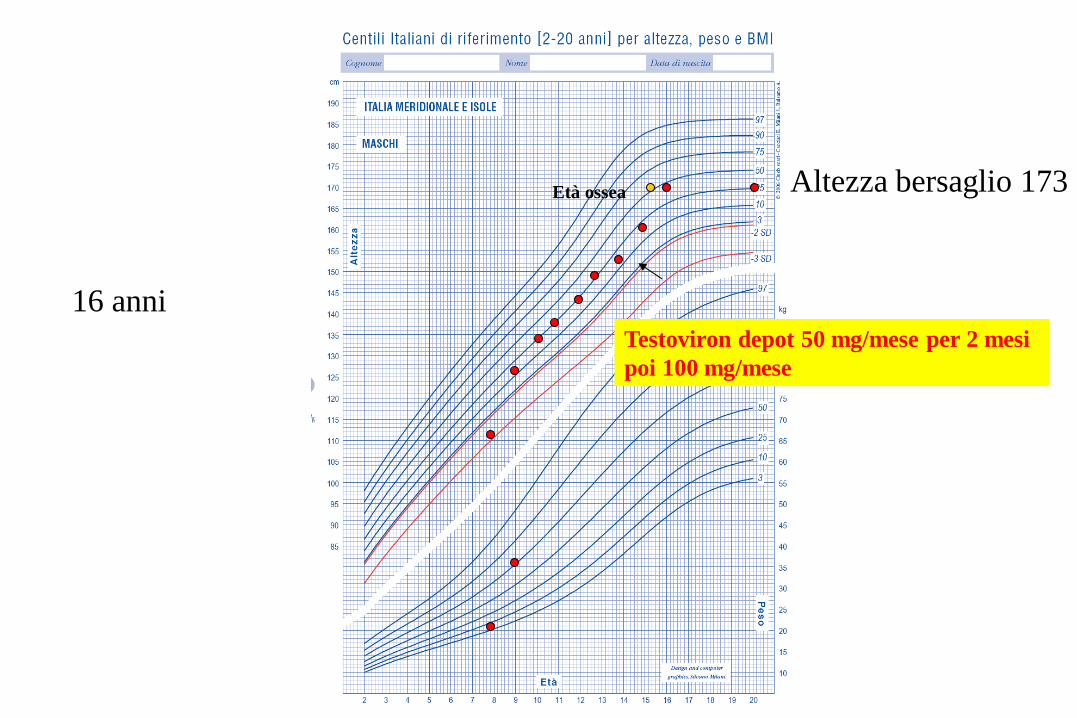
Altezza bersaglio 173
16 anni Testoviron depot 50 mg/mese per 2 mesi
poi 100 mg/mese
Età ossea

Caro dottore ho conosciuto una
ragazzina… siamo insieme da alcuni
mesi.
Non abbiamo ancora avuto rapporti
completi ma durante la stimolazione
genitale mi sento poco eccitato
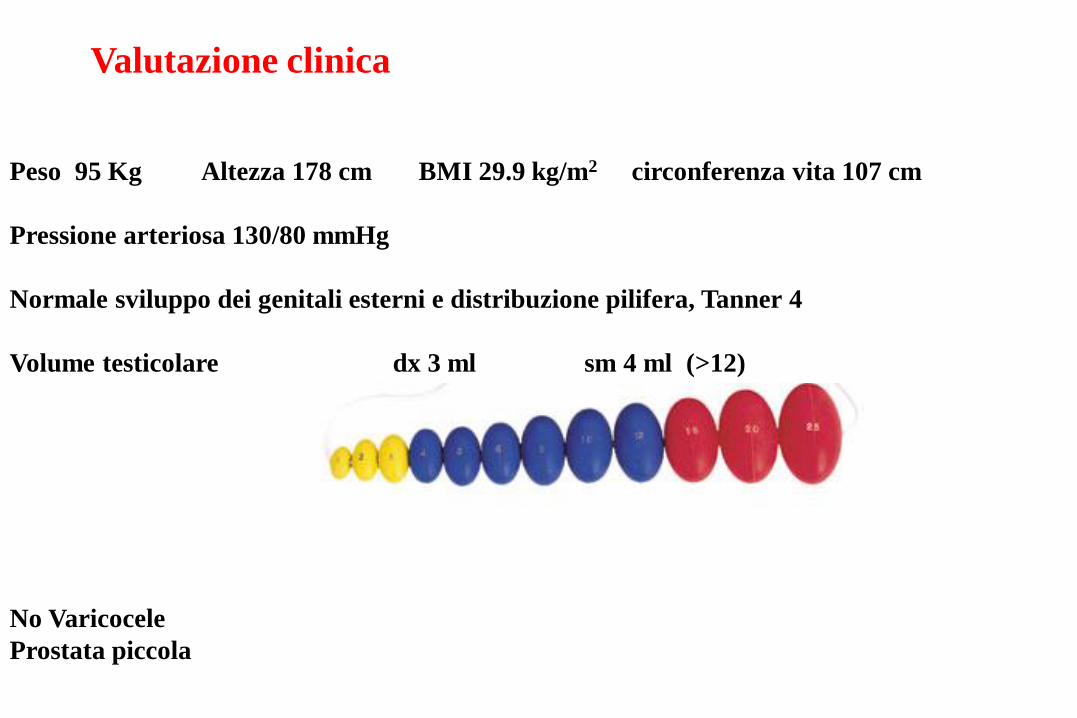
Valutazione clinica
Peso 95 Kg Altezza 178 cm BMI 29.9 kg/m2 circonferenza vita 107 cm
Pressione arteriosa 130/80 mmHg
Normale sviluppo dei genitali esterni e distribuzione pilifera, Tanner 4
Volume testicolare dx 3 ml sm 4 ml (>12)
No Varicocele
Prostata piccola
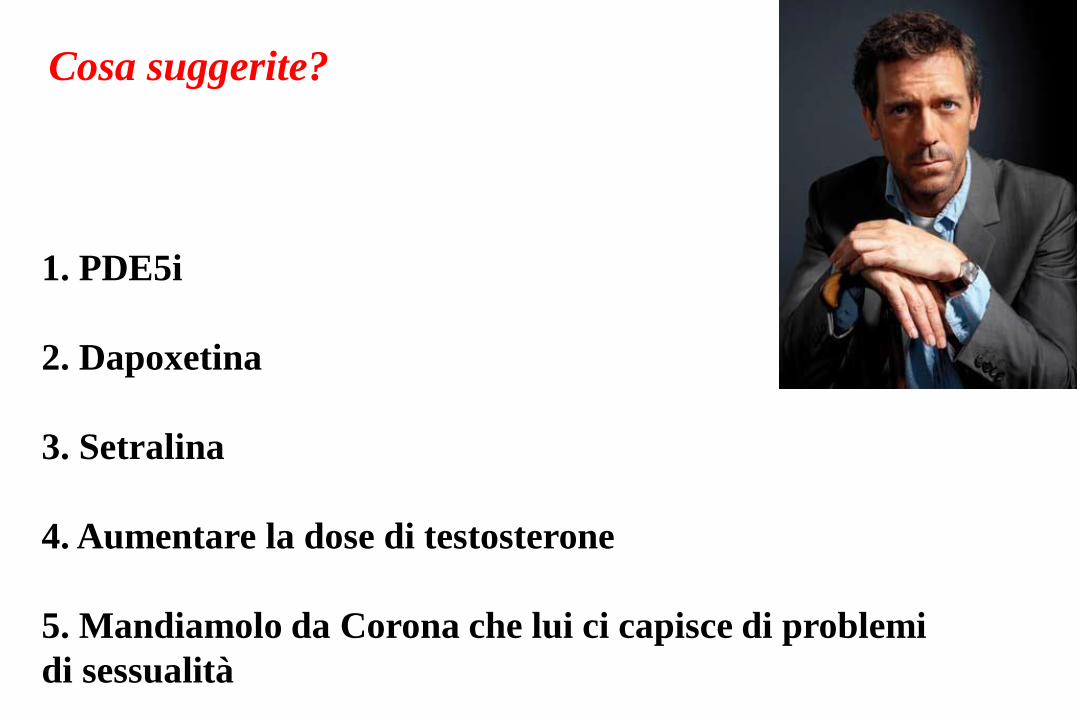
Cosa suggerite?
1. PDE5i
2. Dapoxetina
3. Setralina
4. Aumentare la dose di testosterone
5. Mandiamolo da Corona che lui ci capisce di problemi
di sessualità
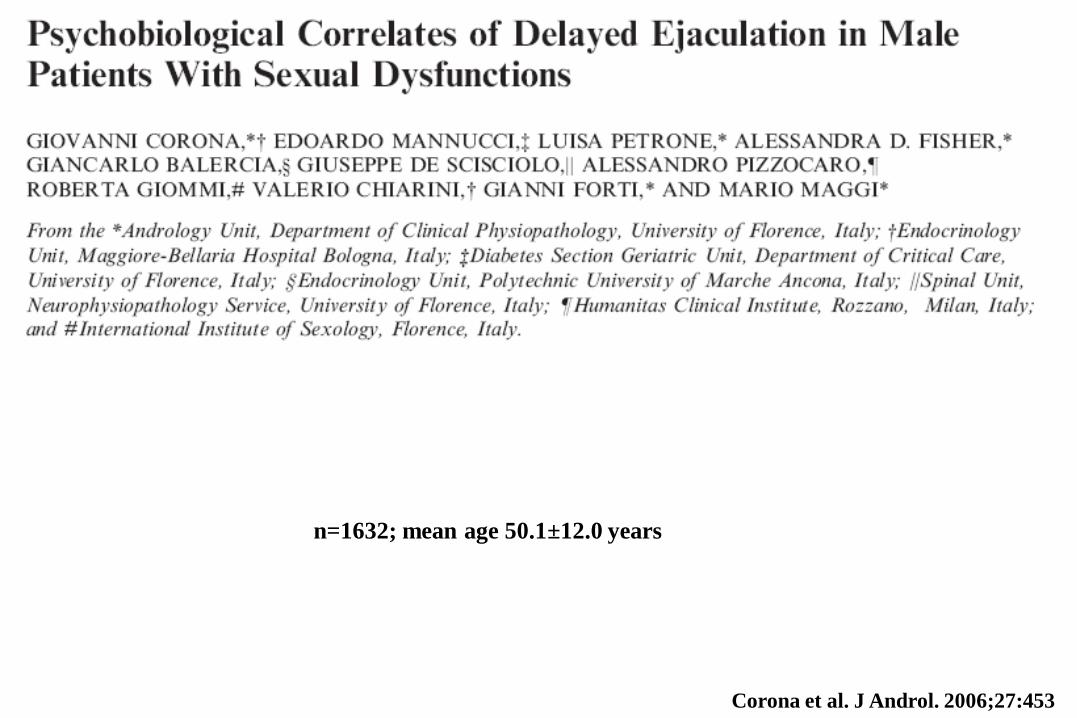
Corona et al. J Androl. 2006;27:453
n=1632; mean age 50.1±12.0 years
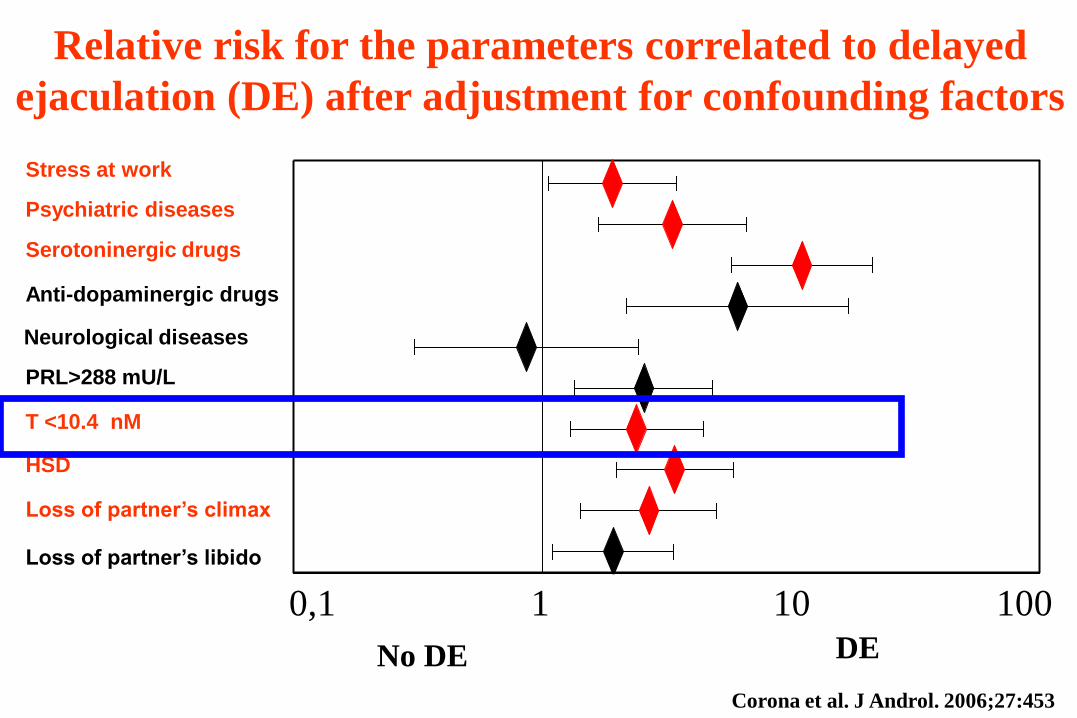
0,1 1 10 100
No DE DE
Anti-dopaminergic drugs
HSD
Serotoninergic drugs
Neurological diseases
Psychiatric diseases
PRL>288 mU/L
Stress at work
Loss of partner’s climax
Loss of partner’s libido
T <10.4 nM
Relative risk for the parameters correlated to delayed
ejaculation (DE) after adjustment for confounding factors
0,1 1 10 100
Corona et al. J Androl. 2006;27:453

25-39 40-54 55-70
Years
Tota
l te
sto
ste
rone n
mol/L
*
*
* *
Fre
e-
testo
ste
rone n
mol/L
* *
*
*
25-39 40-54 55-70
Years
12
13
14
15
16
17
18
19
20
21
15
20
25
30
35
40
45
50
55
*
*
* * *
§
§
*
Premature ejaculation (PE)
Delayed ejaculation (DE)
No premature, no delayed ejaculation *p<0.05 vs. PE §p<0.05 vs. no PE, no DE
Corona et al. J Sex Med. 2008;5:1991
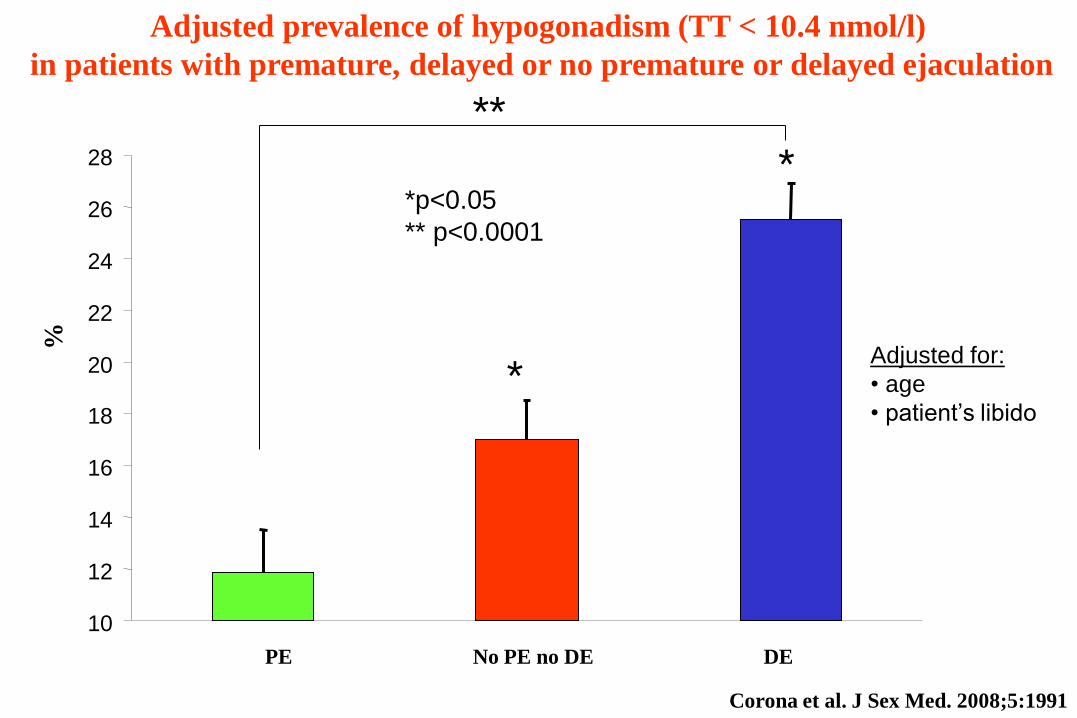
Adjusted prevalence of hypogonadism (TT < 10.4 nmol/l)
in patients with premature, delayed or no premature or delayed ejaculation
%
PE No PE no DE DE
*
*p<0.05
** p<0.0001
*
10
12
14
16
18
20
22
24
26
28
*
*p<0.05
** p<0.0001
*
**
Adjusted for:
• age
• patient’s libido
Corona et al. J Sex Med. 2008;5:1991
Testo
ste
rone (
nm
ol/l)
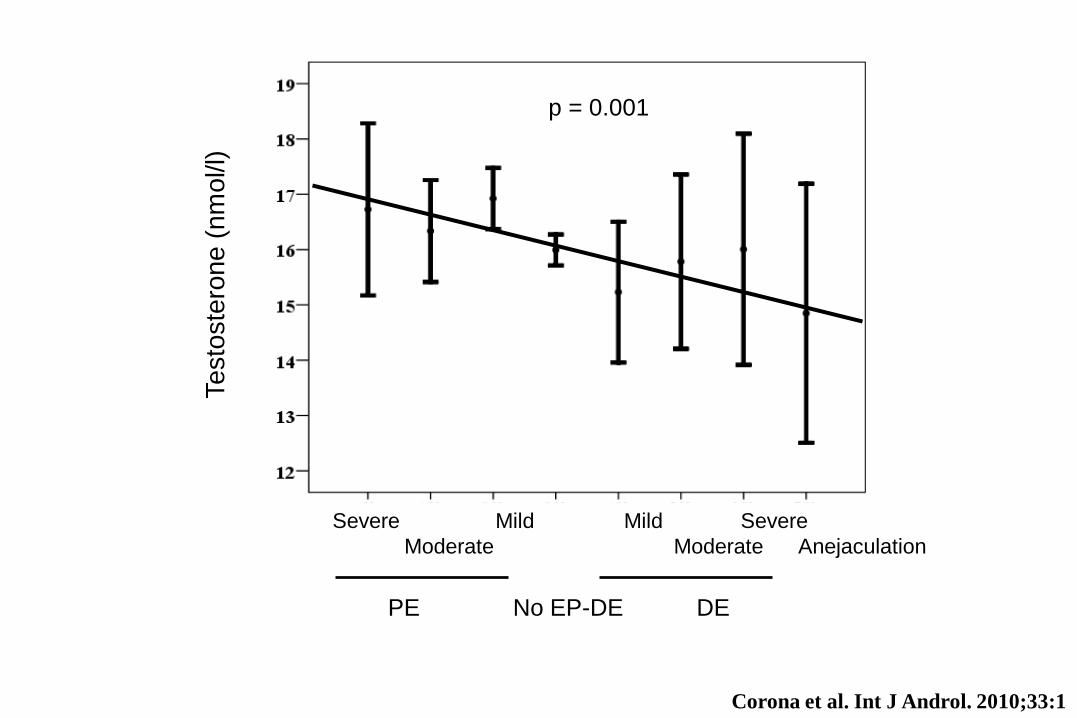
Severe Mild Mild Severe
Moderate Moderate Anejaculation
PE No EP-DE DE
p = 0.001
Corona et al. Int J Androl. 2010;33:1
Adjusted for:
Age
Smooking and drinking behaviours
ED severity
Anxiety and depressive symptoms
Psychiatric disease
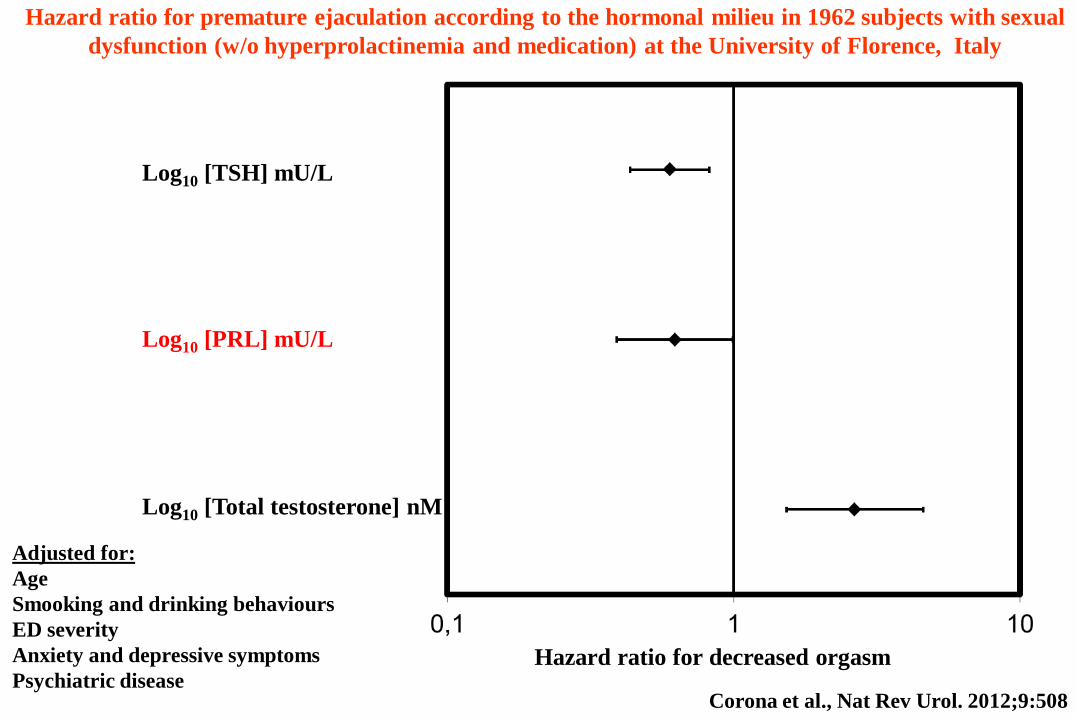
Log10 [TSH] mU/L
Log10 [PRL] mU/L
Log10 [Total testosterone] nM
Hazard ratio for premature ejaculation according to the hormonal milieu in 1962 subjects with sexual
dysfunction (w/o hyperprolactinemia and medication) at the University of Florence, Italy
Hazard ratio for decreased orgasm
Corona et al., Nat Rev Urol. 2012;9:508
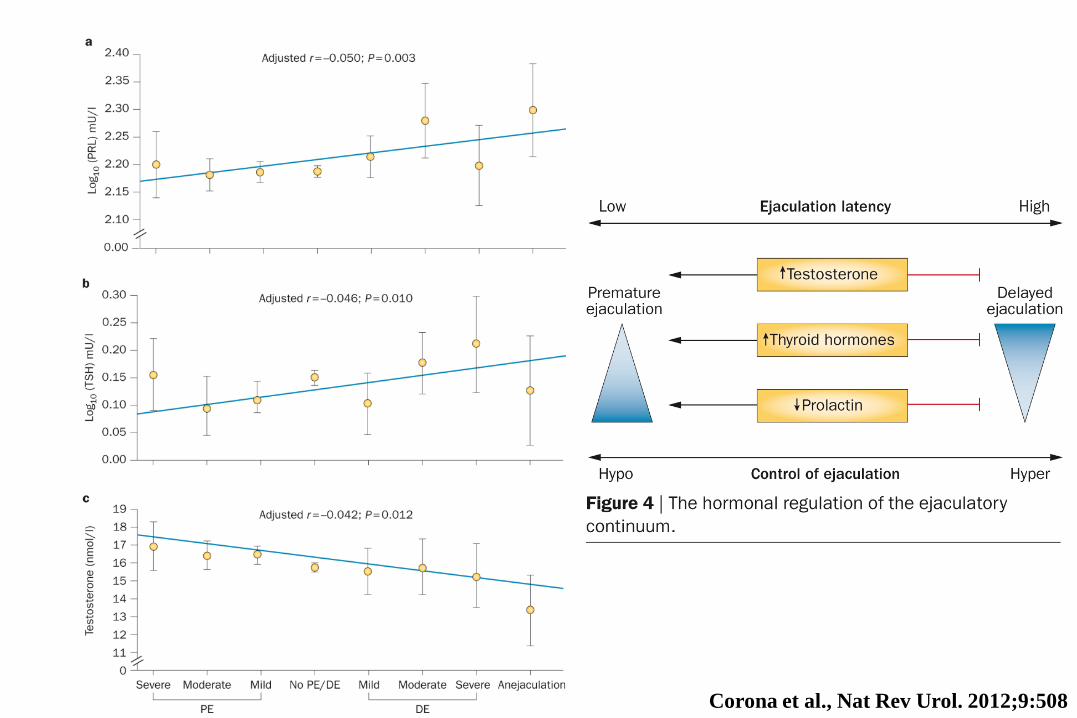
Corona et al., Nat Rev Urol. 2012;9:508

Come possiamo spiegare
queste associazioni?
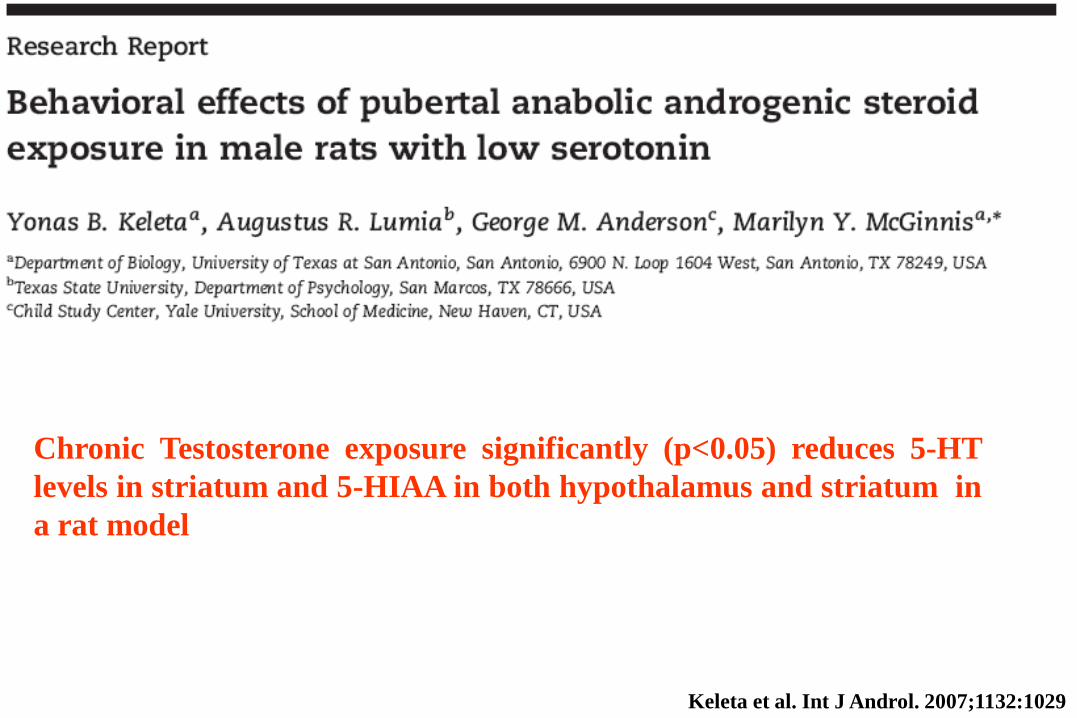
Chronic Testosterone exposure significantly (p<0.05) reduces 5-HT
levels in striatum and 5-HIAA in both hypothalamus and striatum in
a rat model
Keleta et al. Int J Androl. 2007;1132:1029
n=
3
n=
7
n=
5
n=
2
n=
4
n=
2
n=
1
n=
8
n=
2
n=
3
n=
3
n=
3
n=
1
n=
3
n=
6
Ute
rus
Bre
ast
Ova
ry
Pla
ce
nta
Ske
leta
l M
uscle
Bra
in
Hea
rt
Lu
ng
Ad
ren
al G
lan
d
Th
yro
id G
lan
d
Bla
dd
er
Kid
ne
y
Sto
ma
ch
Liv
er
Co
lon
Pro
sta
te
n=
5
n=
4
n=
3
Te
stis
PE
idid
ym
is
PD
E5 m
RN
A
mole
cule
s/m
g tota
l
RN
A
1,0E+05
1,0E+06
1,0E+07
1,0E+08
n=
6
n=
3
C. C
ave
rno
su
m
V.
Defe
ren
s
1,0E+01
1,0E+02
1,0E+03
1,0E+04
1,0E+05
1,0E+06
1,0E+07
1,0E+08
tota
l R
NA
PD
E5
mR
NA
mo
leco
le/m
g
Corpora
Cavernosa
n=3
Breast
n=3
dist
Vas deferens
prox
*
*
n=7 n=7

PDE5 g-ACT
400 bp
300 bp
C H H+T C H H+T
MW
ladder
Testosterone regulates
PDE5 gene expression …
…and enzyme activity
PD
E5
/gA
CT
% o
ve
r co
ntr
ol
*
0
20
40
60
80
100
120
C H H+T
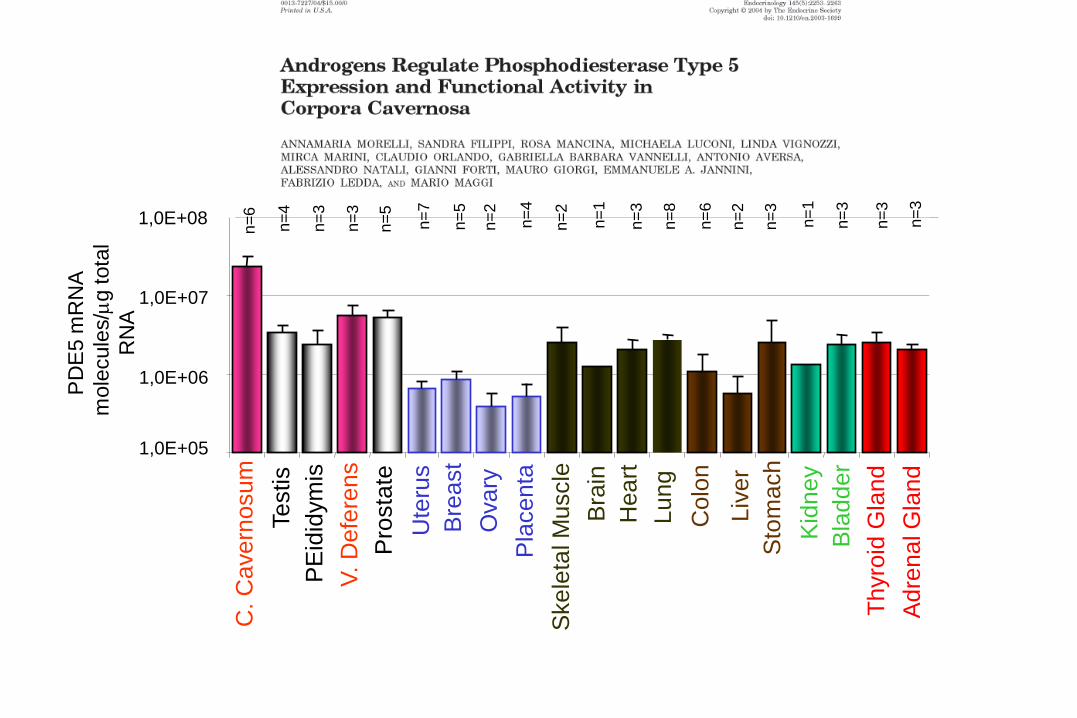
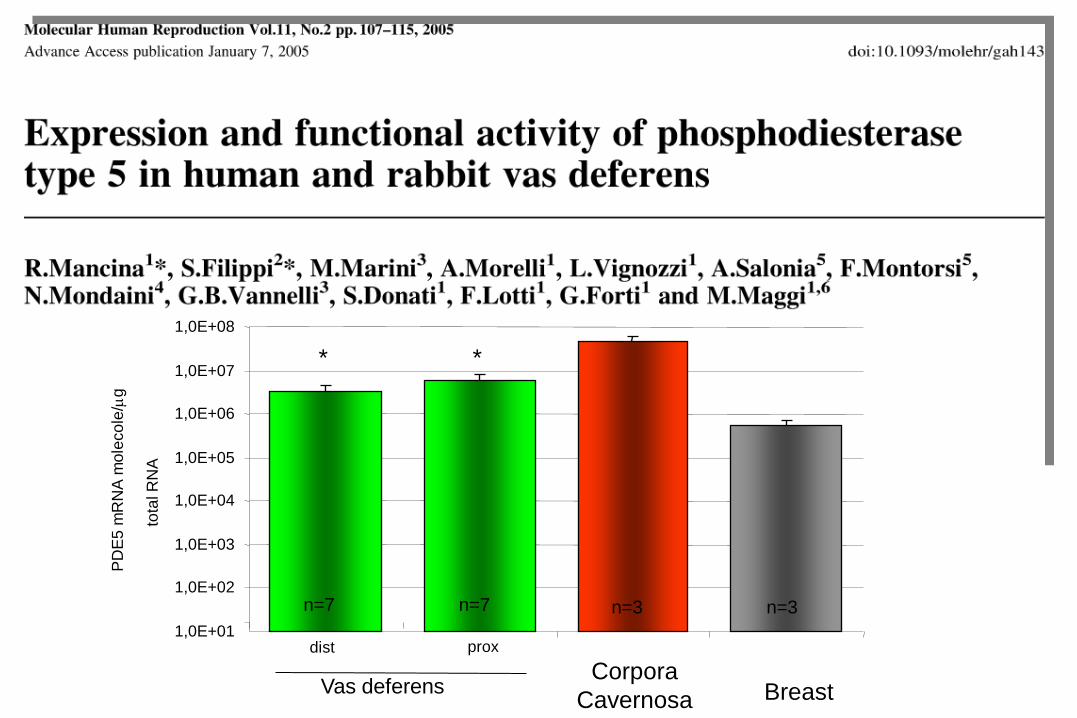
Mancina et al. Mol. Hum Reprod. 2005;11:107

Lower Testosterone Lower PDE5 expression
Lower cGMP degradation
Lower male genitalia tract
contractility Higher ejaculation timing
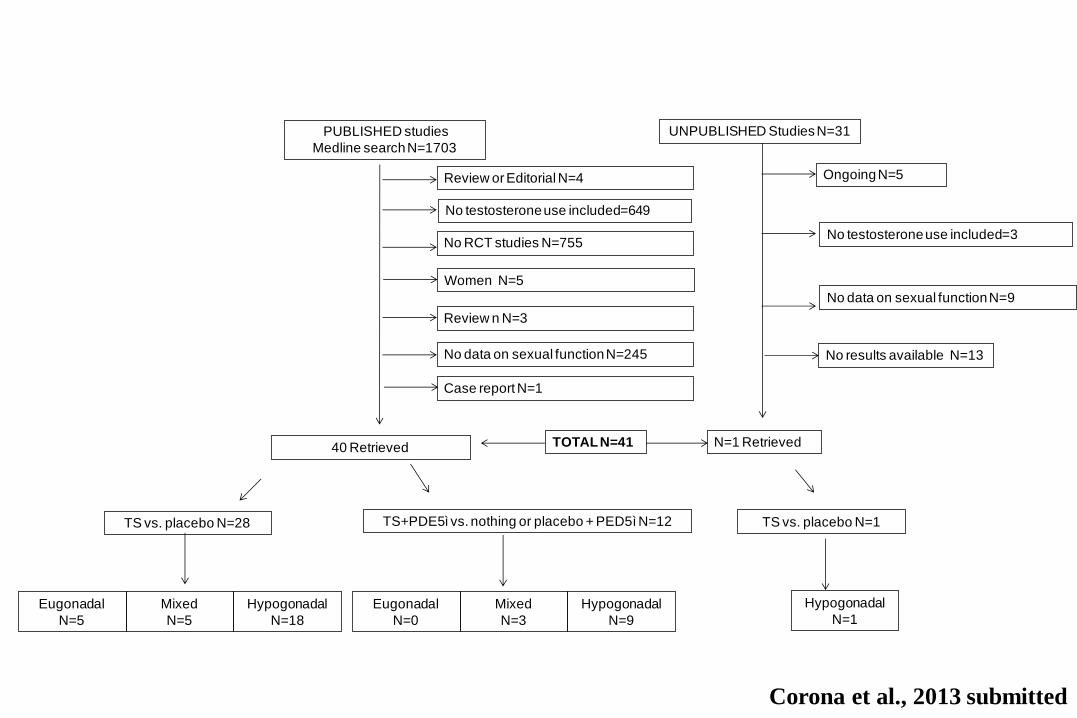
PUBLISHED studies
Medline search N=1703
40 Retrieved
UNPUBLISHED Studies N=31
Ongoing N=5
N=1 Retrieved
Review or Editorial N=4
No testosterone use included=649
No RCT studies N=755
Case report N=1
No data on sexual function N=245
Review n N=3
TS vs. placebo N=28
TOTAL N=41
No results available N=13
Women N=5
No testosterone use included=3
No data on sexual function N=9
Eugonadal
N=5
Mixed
N=5
Hypogonadal
N=18
TS+PDE5ì vs. nothing or placebo + PED5ì N=12
Eugonadal
N=0
Mixed
N=3
Hypogonadal
N=9
TS vs. placebo N=1
Hypogonadal
N=1
Corona et al., 2013 submitted
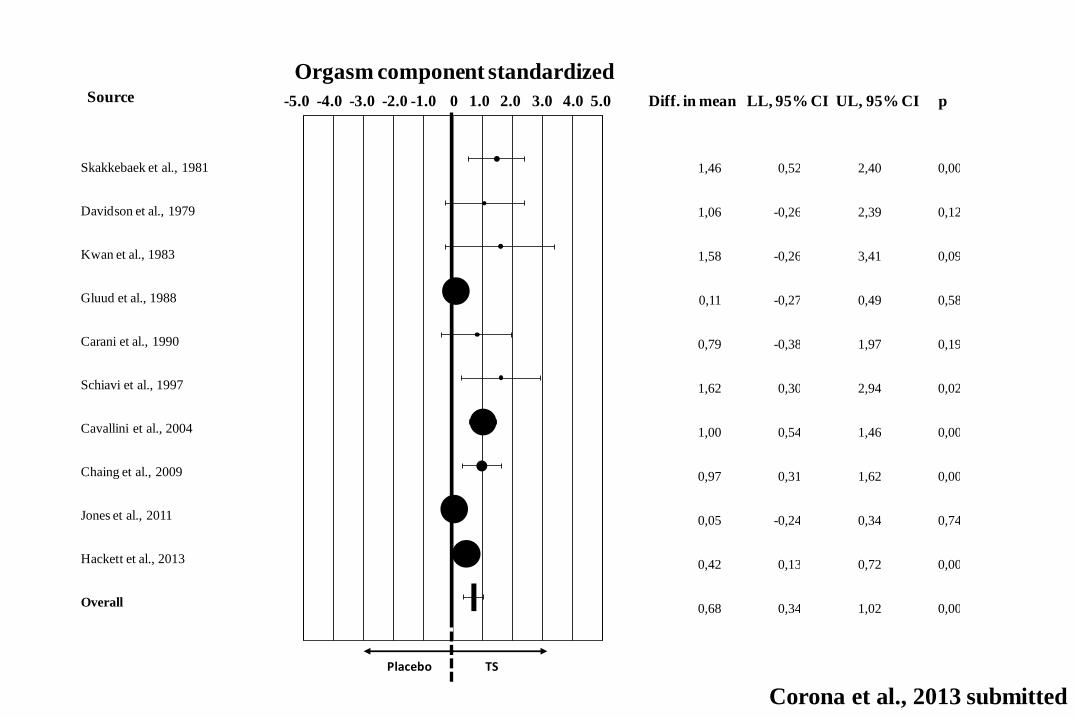
Skakkebaek et al., 1981
Davidson et al., 1979
Kwan et al., 1983
Gluud et al., 1988
Carani et al., 1990
Schiavi et al., 1997
Cavallini et al., 2004
Chaing et al., 2009
Jones et al., 2011
Hackett et al., 2013
Overall
1,46 0,52 2,40 0,00
1,06 -0,26 2,39 0,12
1,58 -0,26 3,41 0,09
0,11 -0,27 0,49 0,58
0,79 -0,38 1,97 0,19
1,62 0,30 2,94 0,02
1,00 0,54 1,46 0,00
0,97 0,31 1,62 0,00
0,05 -0,24 0,34 0,74
0,42 0,13 0,72 0,00
0,68 0,34 1,02 0,00
-5,0
0
-4,0
0
-3,0
0
-2,0
0
-1,0
0
0,0
0
1,0
0
2,0
0
3,0
0
4,0
0
5,0
0Source
Orgasm component standardized
mean differences-5.0 -4.0 -3.0 -2.0 -1.0 0 1.0 2.0 3.0 4.0 5.0 Diff. in mean LL, 95% CI UL, 95% CI p
Placebo TS
Corona et al., 2013 submitted

Non ti preoccupare sono cose che
capitano, specie le prime volte…
Provate ad aumentare la dose a 250
mg ogni 3 settimane

Dottore ora si che va bene!!!
Ho organizzato una uscitina con casa
libera… non lo dica alla mamma…
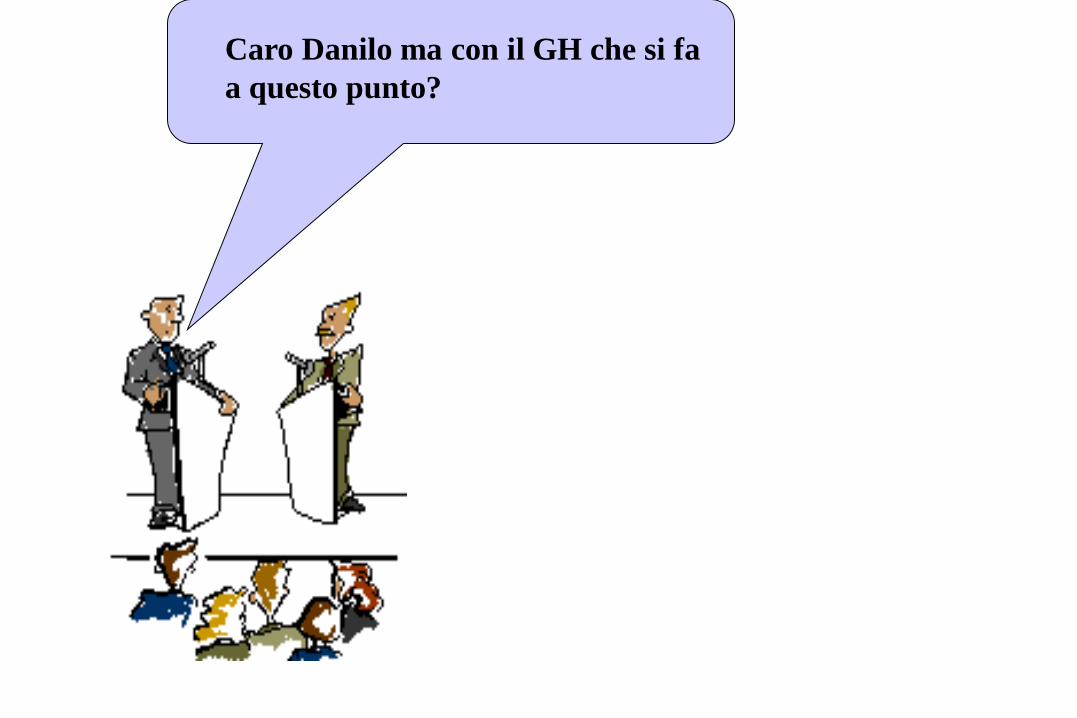
Caro Danilo ma con il GH che si fa
a questo punto?
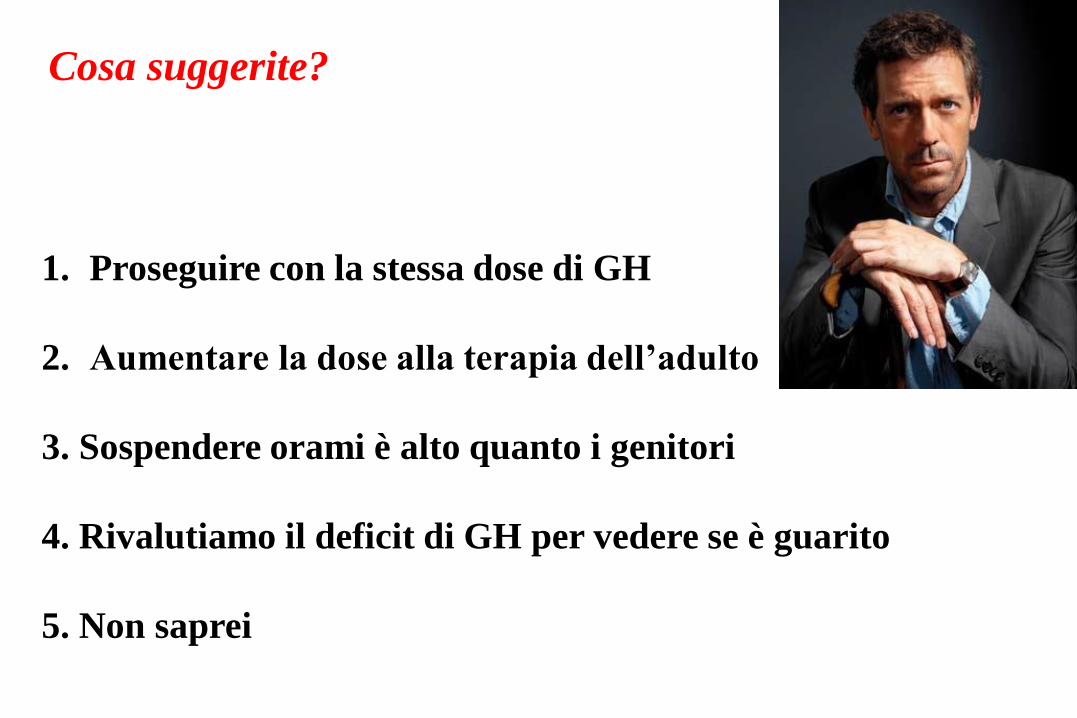
Cosa suggerite?
1. Proseguire con la stessa dose di GH
2. Aumentare la dose alla terapia dell’adulto
3. Sospendere orami è alto quanto i genitori
4. Rivalutiamo il deficit di GH per vedere se è guarito
5. Non saprei
Cook et al., Pituitary 2012; 15:301

Cook et al., Pituitary 2012; 15:301

Cook et al., Pituitary 2012; 15:301
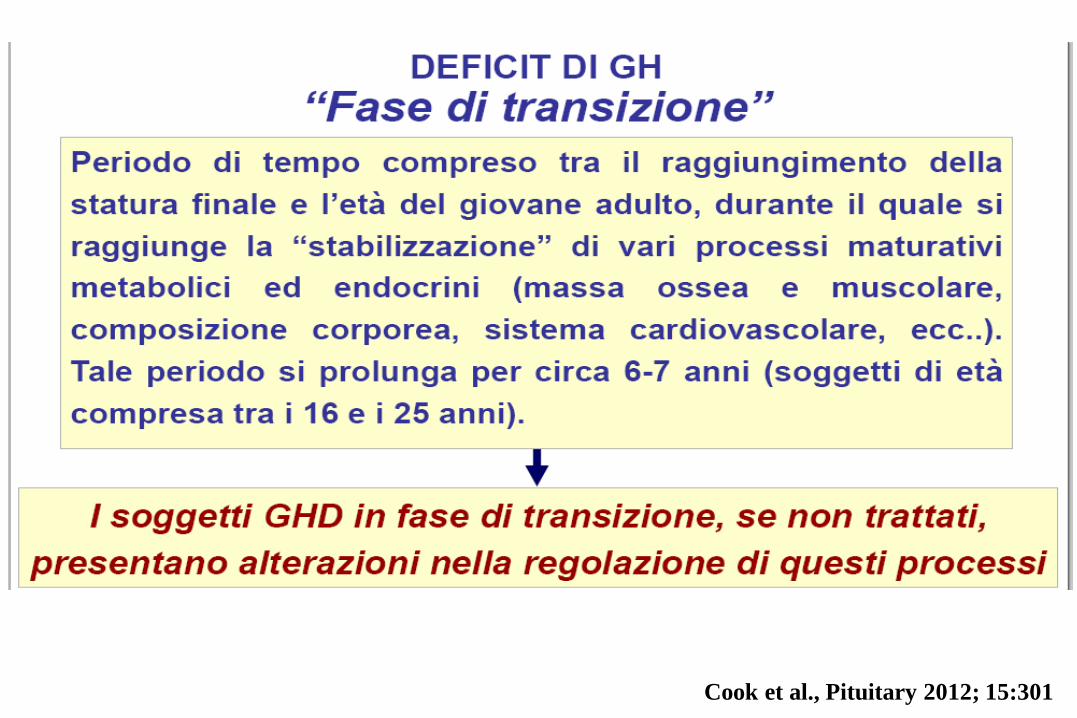
Flowchart re-testing GHD fase di transizione
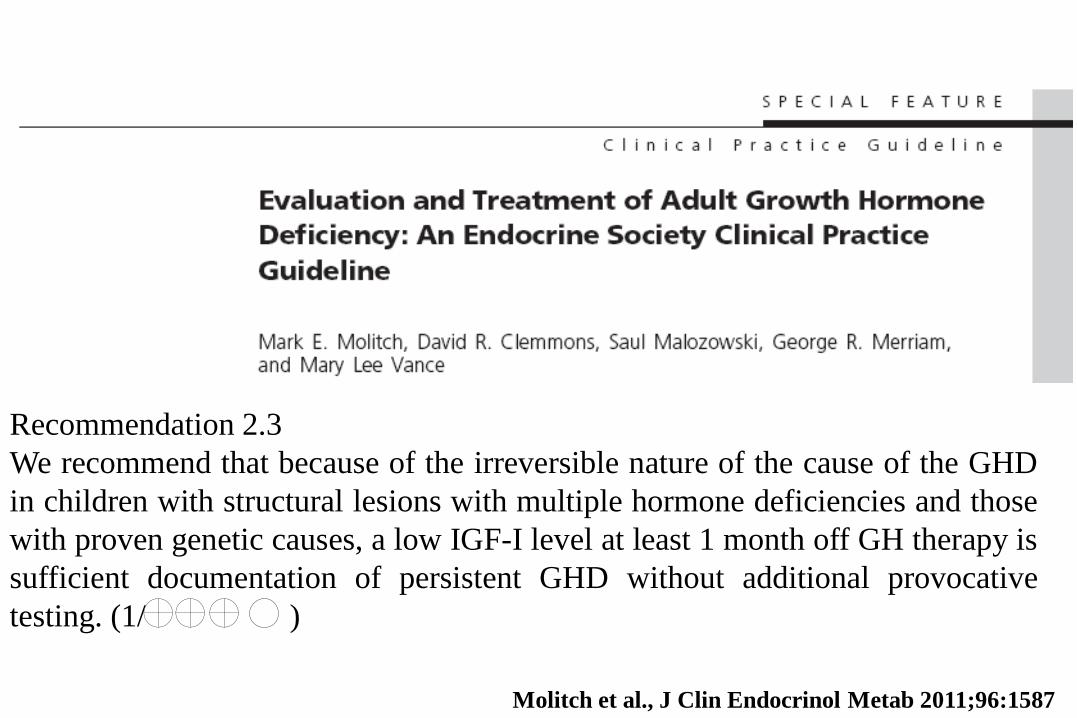
Recommendation 2.3
We recommend that because of the irreversible nature of the cause of the GHD
in children with structural lesions with multiple hormone deficiencies and those
with proven genetic causes, a low IGF-I level at least 1 month off GH therapy is
sufficient documentation of persistent GHD without additional provocative
testing. (1/ )
Molitch et al., J Clin Endocrinol Metab 2011;96:1587
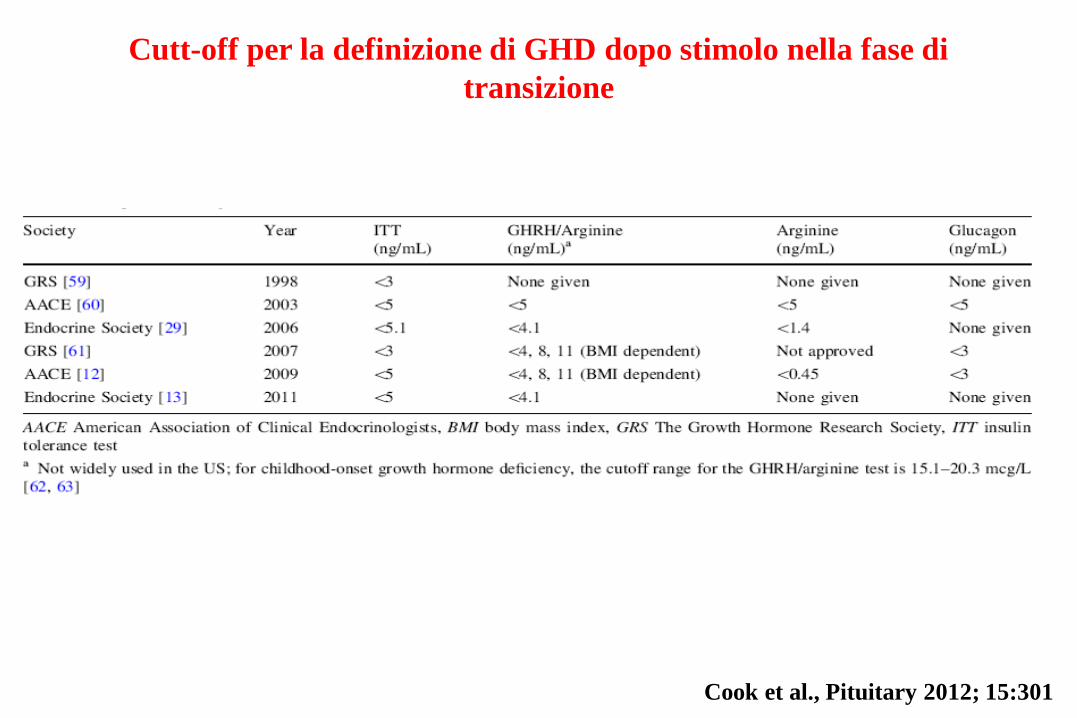
Cutt-off per la definizione di GHD dopo stimolo nella fase di
transizione
Cook et al., Pituitary 2012; 15:301
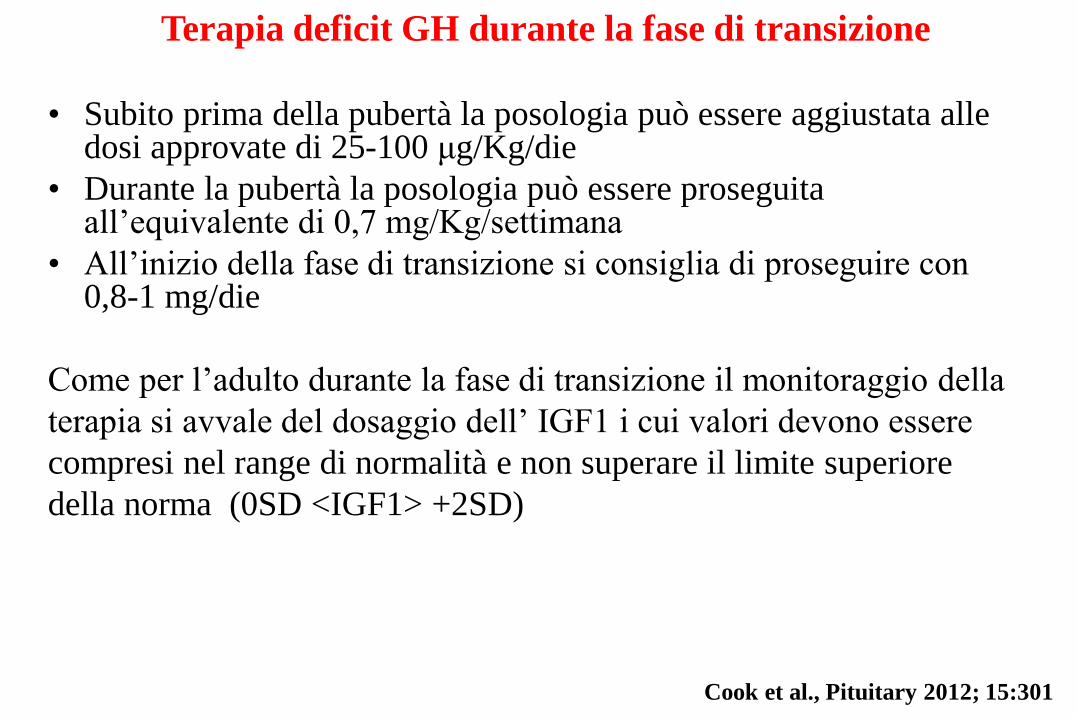
Terapia deficit GH durante la fase di transizione
• Subito prima della pubertà la posologia può essere aggiustata alle dosi approvate di 25-100 μg/Kg/die
• Durante la pubertà la posologia può essere proseguita all’equivalente di 0,7 mg/Kg/settimana
• All’inizio della fase di transizione si consiglia di proseguire con 0,8-1 mg/die
Come per l’adulto durante la fase di transizione il monitoraggio della
terapia si avvale del dosaggio dell’ IGF1 i cui valori devono essere
compresi nel range di normalità e non superare il limite superiore
della norma (0SD <IGF1> +2SD)
Cook et al., Pituitary 2012; 15:301
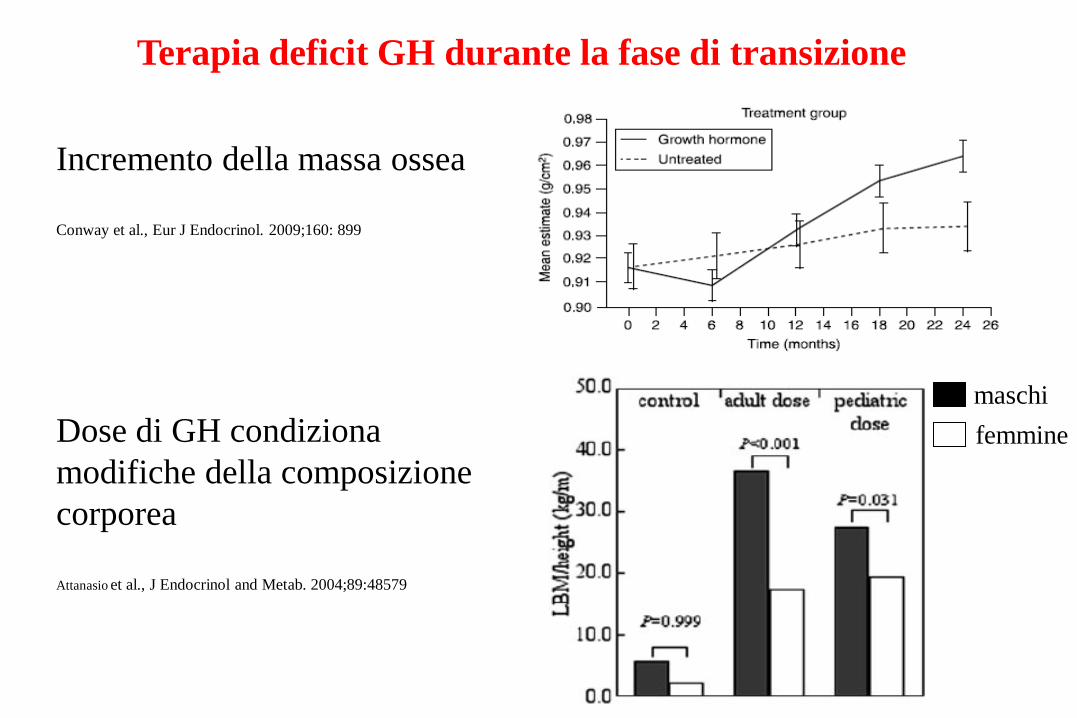
Terapia deficit GH durante la fase di transizione
Incremento della massa ossea
Conway et al., Eur J Endocrinol. 2009;160: 899
Dose di GH condiziona
modifiche della composizione
corporea
Attanasio et al., J Endocrinol and Metab. 2004;89:48579
maschi
femmine
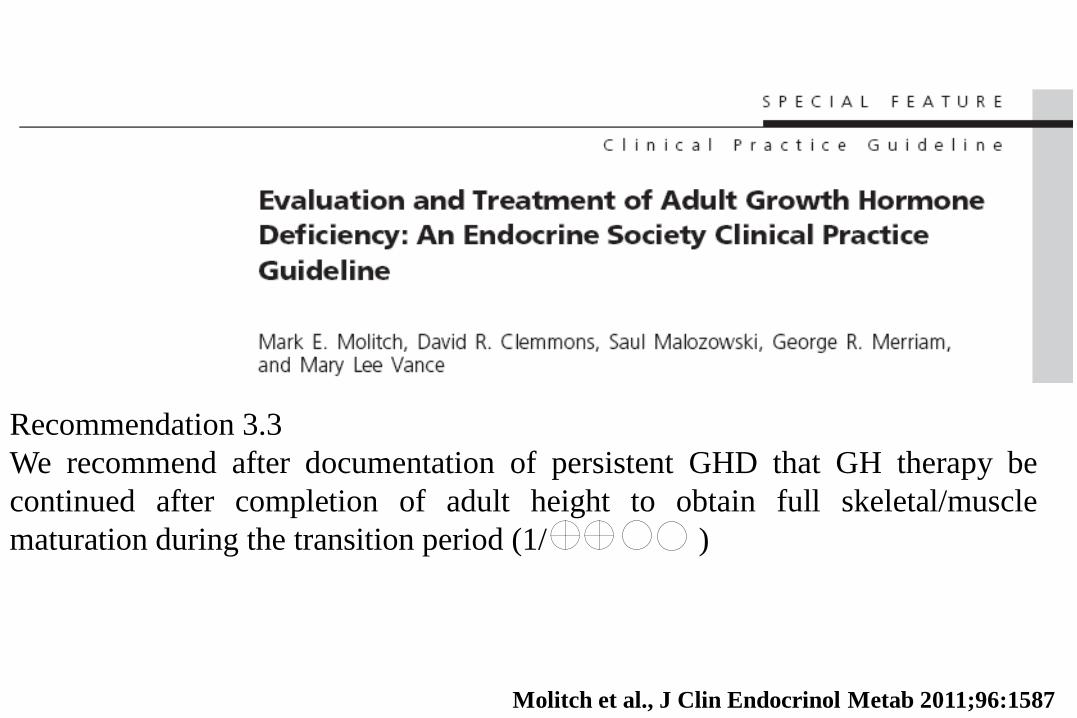
Recommendation 3.3
We recommend after documentation of persistent GHD that GH therapy be
continued after completion of adult height to obtain full skeletal/muscle
maturation during the transition period (1/ )
Molitch et al., J Clin Endocrinol Metab 2011;96:1587
Caro Danilo questo paziente ci sta
creando molti problemi…
Hai visto come è variato il peso?
Cosa ci puoi dire a riguardo?

Altezza bersaglio 173
17 anni
Età ossea
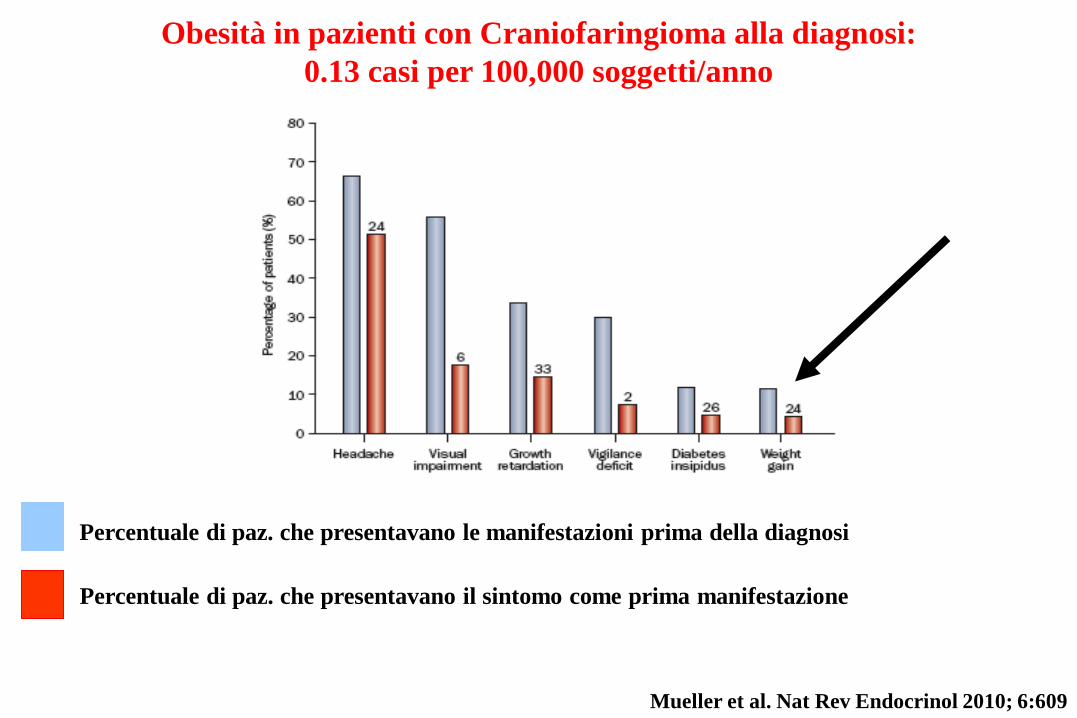
Percentuale di paz. che presentavano le manifestazioni prima della diagnosi
Percentuale di paz. che presentavano il sintomo come prima manifestazione
Mueller et al. Nat Rev Endocrinol 2010; 6:609
Obesità in pazienti con Craniofaringioma alla diagnosi:
0.13 casi per 100,000 soggetti/anno
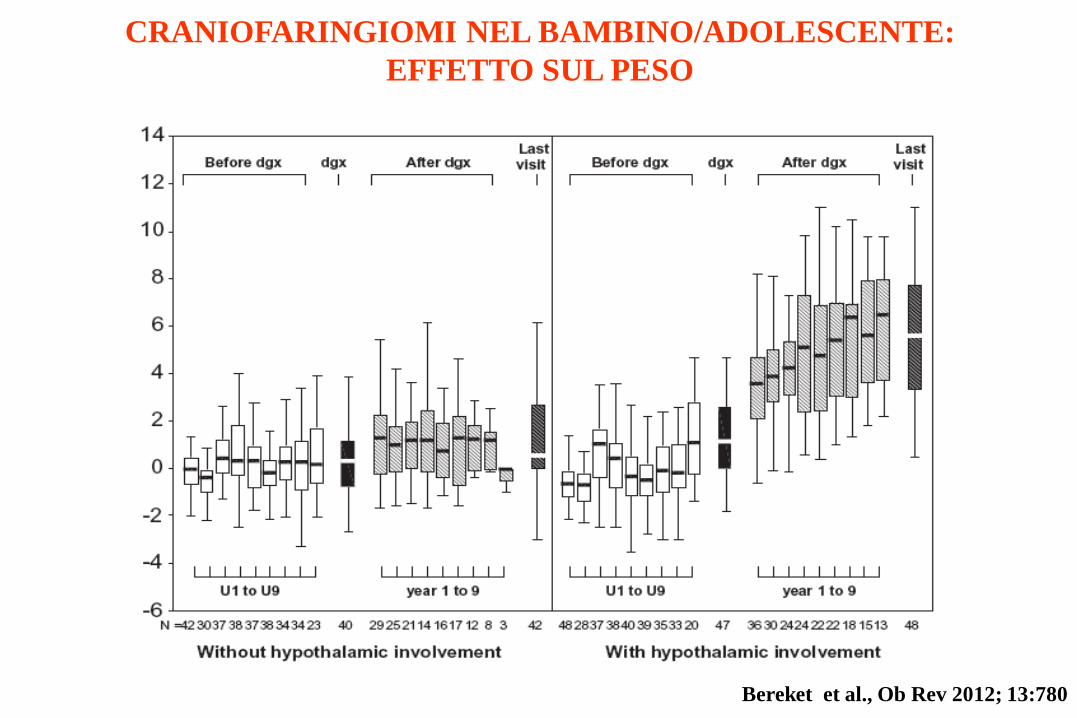
CRANIOFARINGIOMI NEL BAMBINO/ADOLESCENTE:
EFFETTO SUL PESO
Bereket et al., Ob Rev 2012; 13:780
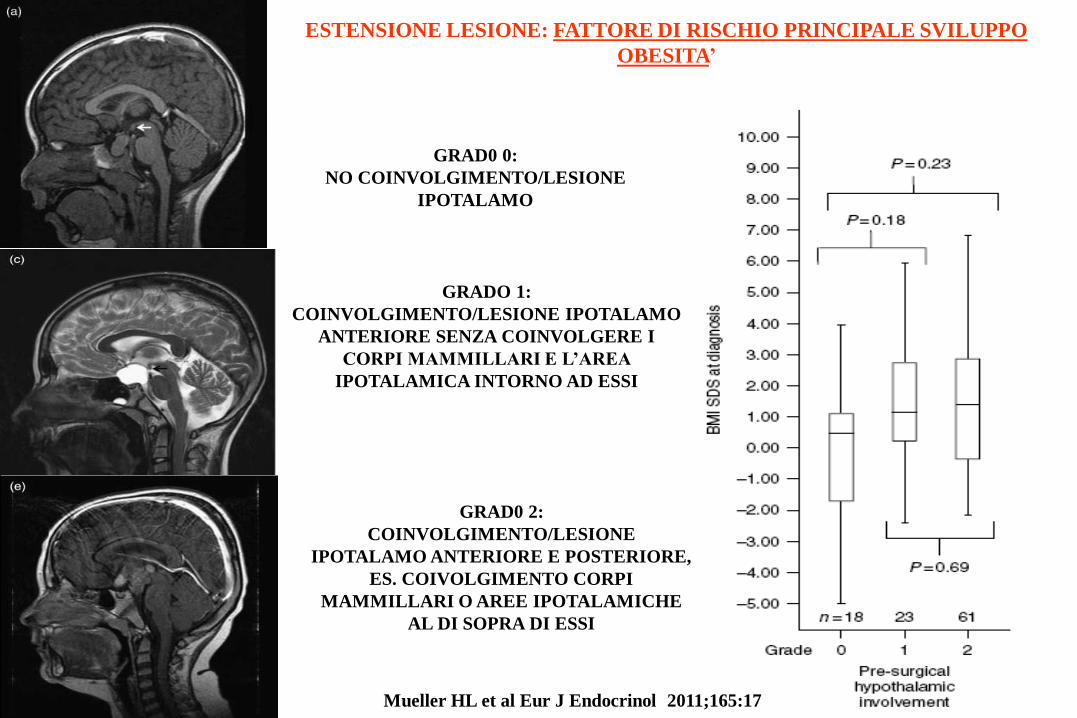
GRADO 1:
COINVOLGIMENTO/LESIONE IPOTALAMO
ANTERIORE SENZA COINVOLGERE I
CORPI MAMMILLARI E L’AREA
IPOTALAMICA INTORNO AD ESSI
GRAD0 2:
COINVOLGIMENTO/LESIONE
IPOTALAMO ANTERIORE E POSTERIORE,
ES. COIVOLGIMENTO CORPI
MAMMILLARI O AREE IPOTALAMICHE
AL DI SOPRA DI ESSI
GRAD0 0:
NO COINVOLGIMENTO/LESIONE
IPOTALAMO
ESTENSIONE LESIONE: FATTORE DI RISCHIO PRINCIPALE SVILUPPO
OBESITA’
Mueller HL et al Eur J Endocrinol 2011;165:17
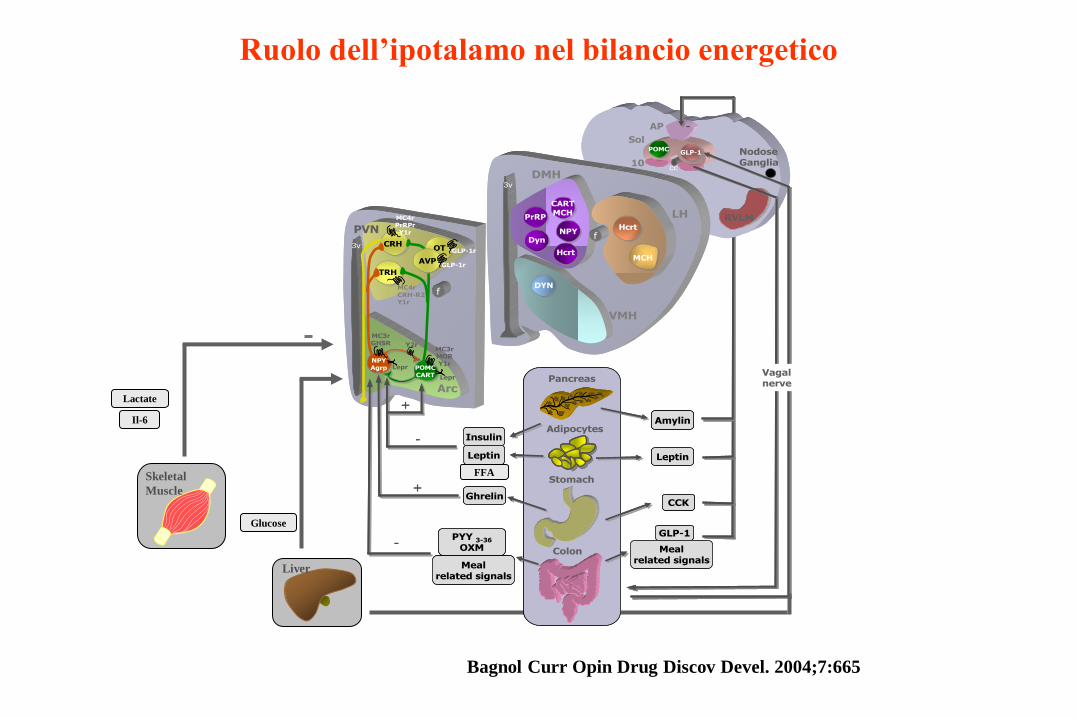
Sol
f
LH
DMH
VMH
3v
f
Arc
PVN
3v
NPYAgrp
PrRP
NPYHcrt
MCH
DYN
Ghrelin
Leptin
Stomach
Insulin
Pancreas
Adipocytes
PYY 3-36
OXM
CRH
TRH
+
+
-
cc
GLP-1POMC Nodose
Ganglia
-Colon
10
Mealrelated signals
POMCCART
MC3rGHSR
MC3rMORY1r
Lepr
Lepr
MC4rPrRPrY1r
Dyn
CARTMCH
OT
GLP-1rAVP
GLP-1r
GLP-1
AP -
Mealrelated signals
Leptin
Amylin
CCK
Y2r
MC4rCRH-R2Y1r
RVLM
Vagal nerve
Hcrt
Skeletal
Muscle
Lactate
Il-6
FFA
Bagnol Curr Opin Drug Discov Devel. 2004;7:665
Liver
Glucose
Ruolo dell’ipotalamo nel bilancio energetico
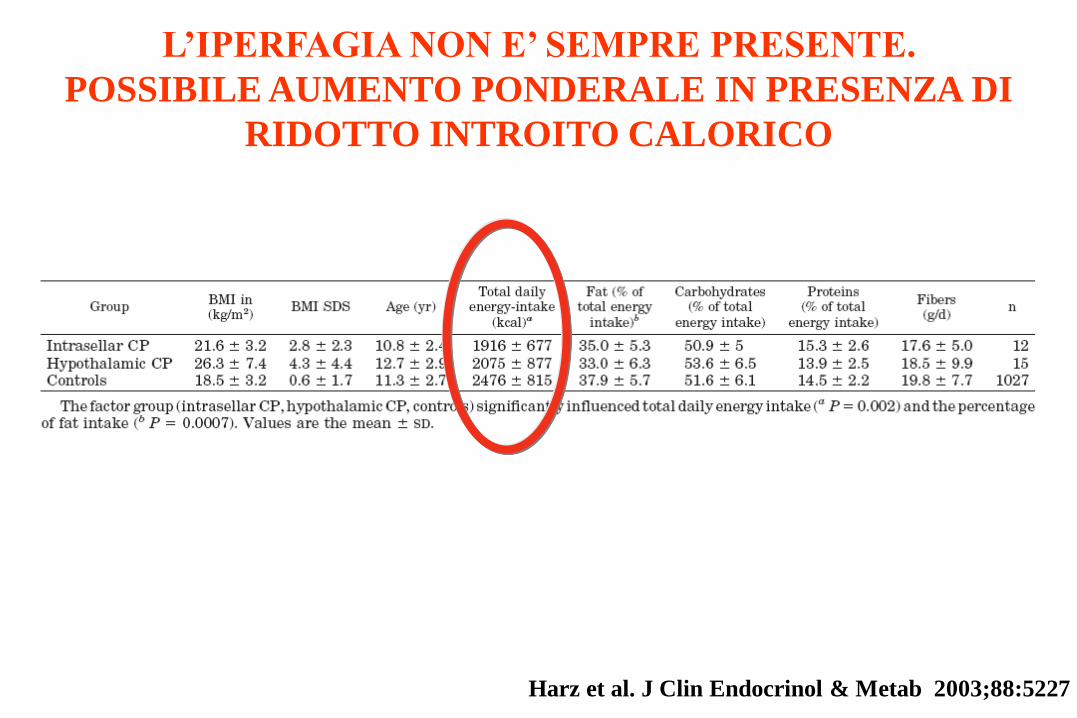
L’IPERFAGIA NON E’ SEMPRE PRESENTE.
POSSIBILE AUMENTO PONDERALE IN PRESENZA DI
RIDOTTO INTROITO CALORICO
Harz et al. J Clin Endocrinol & Metab 2003;88:5227

I PAZIENTI CON CRANIOFARINGIOMA IPOTALAMICO HANNO
GENERALMENTE UNA RIDOTTA ATTIVITA’ FISICA
Harz et al. J Clin Endocrinol & Metab 2003;88:5227
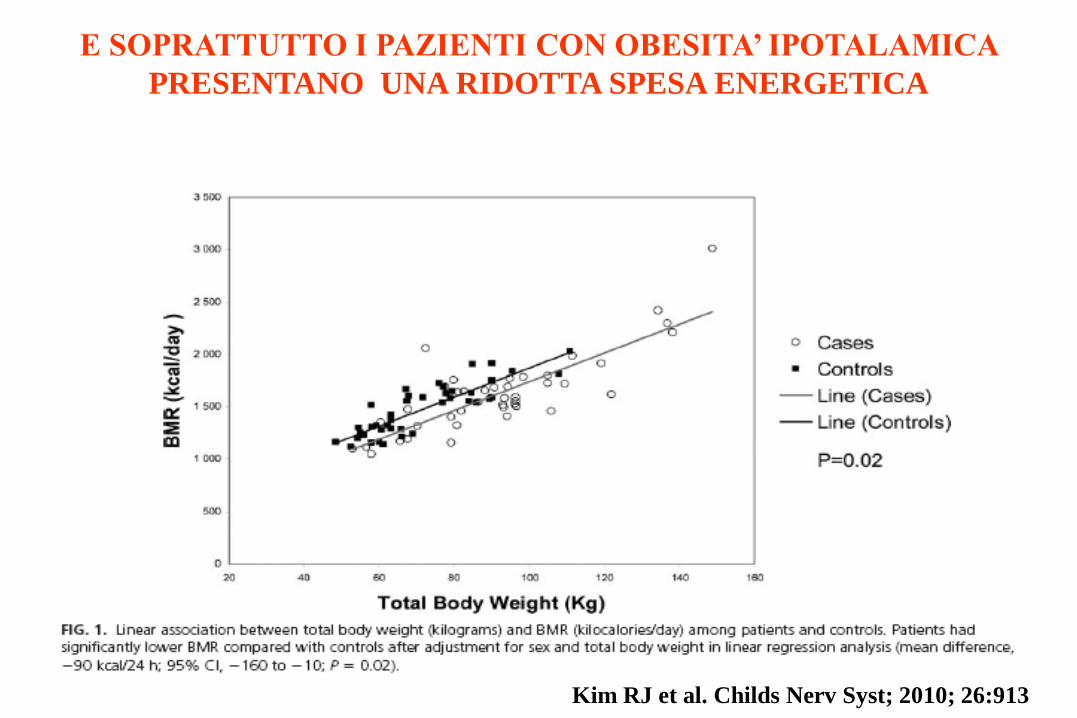
E SOPRATTUTTO I PAZIENTI CON OBESITA’ IPOTALAMICA
PRESENTANO UNA RIDOTTA SPESA ENERGETICA
Kim RJ et al. Childs Nerv Syst; 2010; 26:913
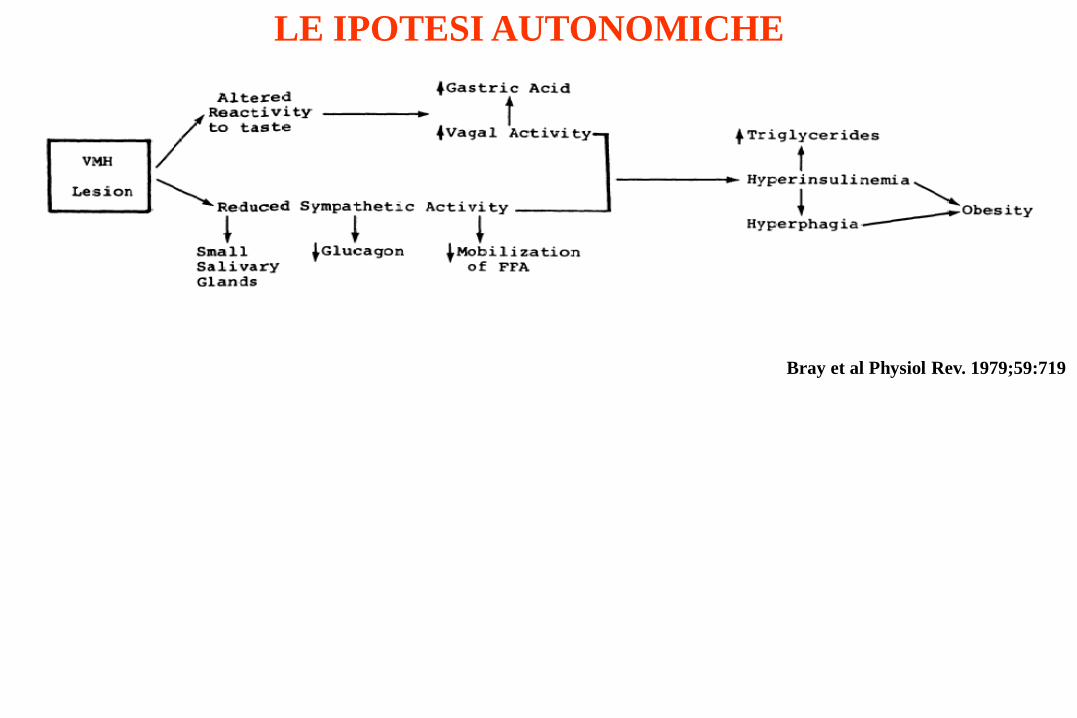
LE IPOTESI AUTONOMICHE
Bray et al Physiol Rev. 1979;59:719
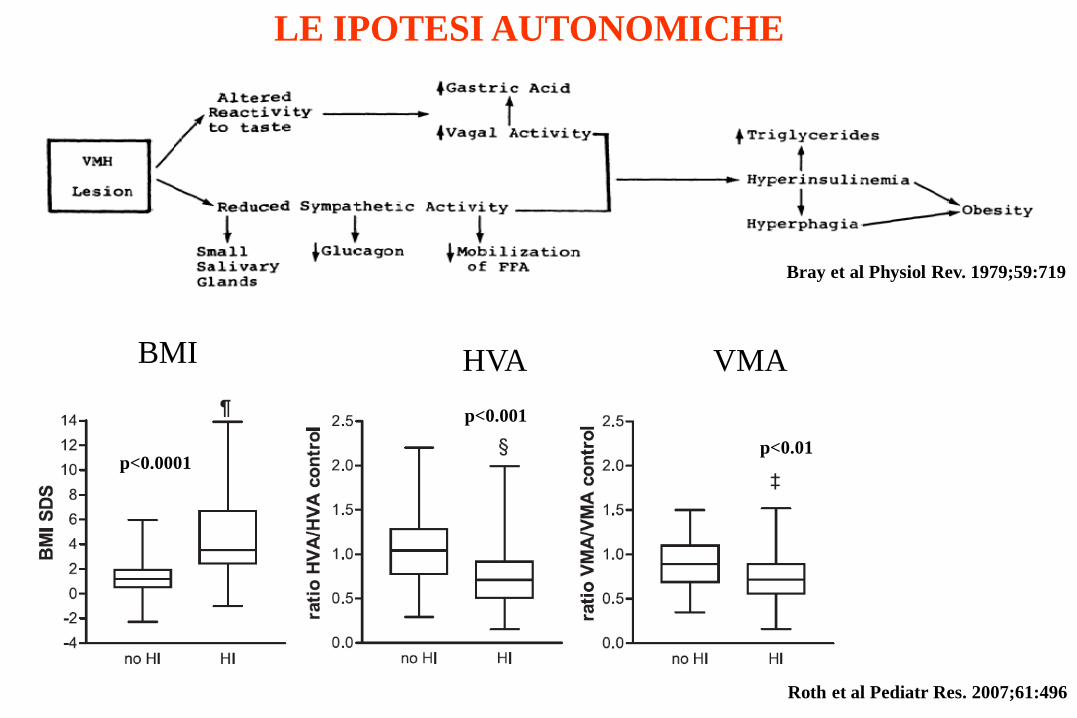
LE IPOTESI AUTONOMICHE
Bray et al Physiol Rev. 1979;59:719
Roth et al Pediatr Res. 2007;61:496
VMA HVA BMI
p<0.0001
p<0.001
p<0.01
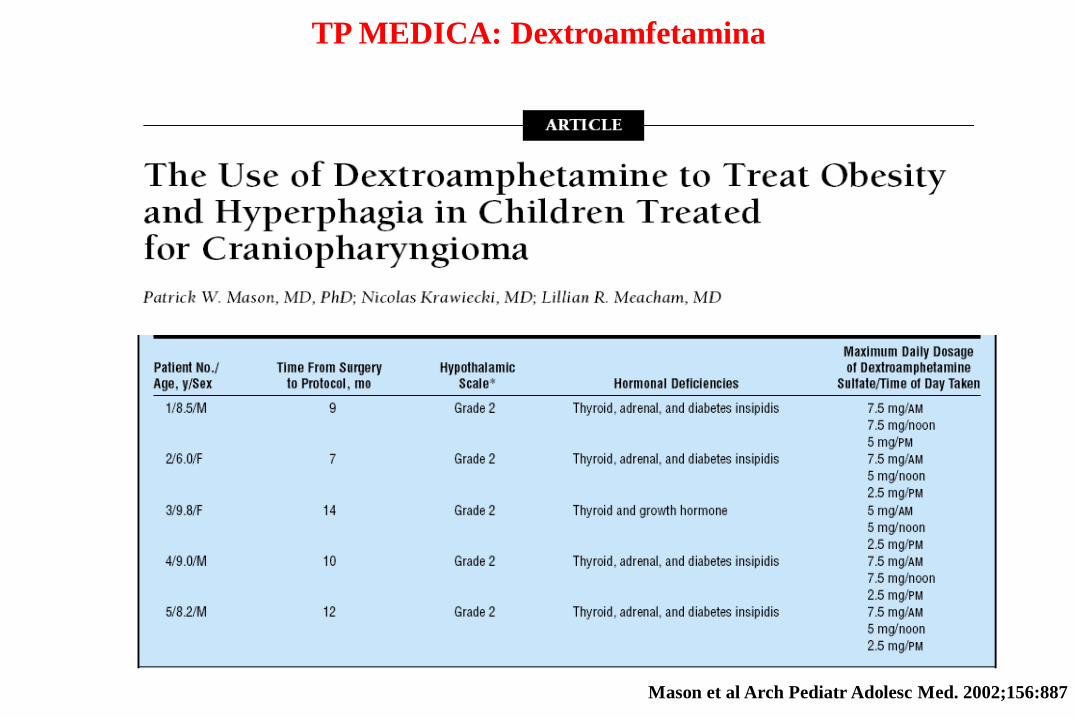
TP MEDICA: Dextroamfetamina
Mason et al Arch Pediatr Adolesc Med. 2002;156:887
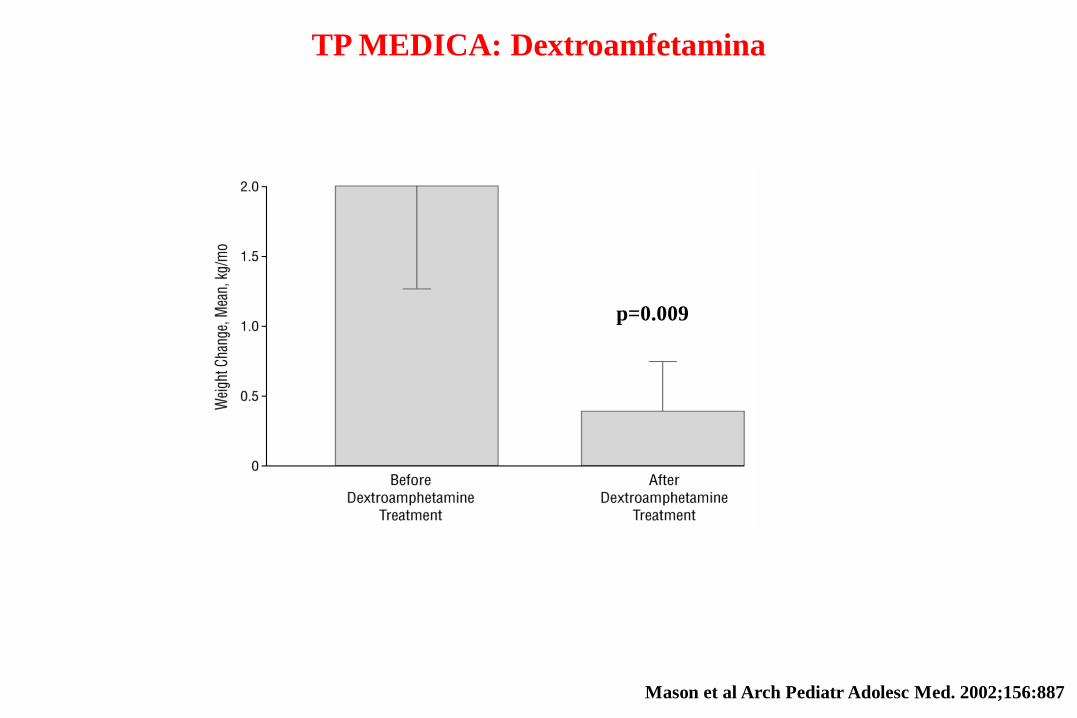
TP MEDICA: Dextroamfetamina
Mason et al Arch Pediatr Adolesc Med. 2002;156:887
p=0.009
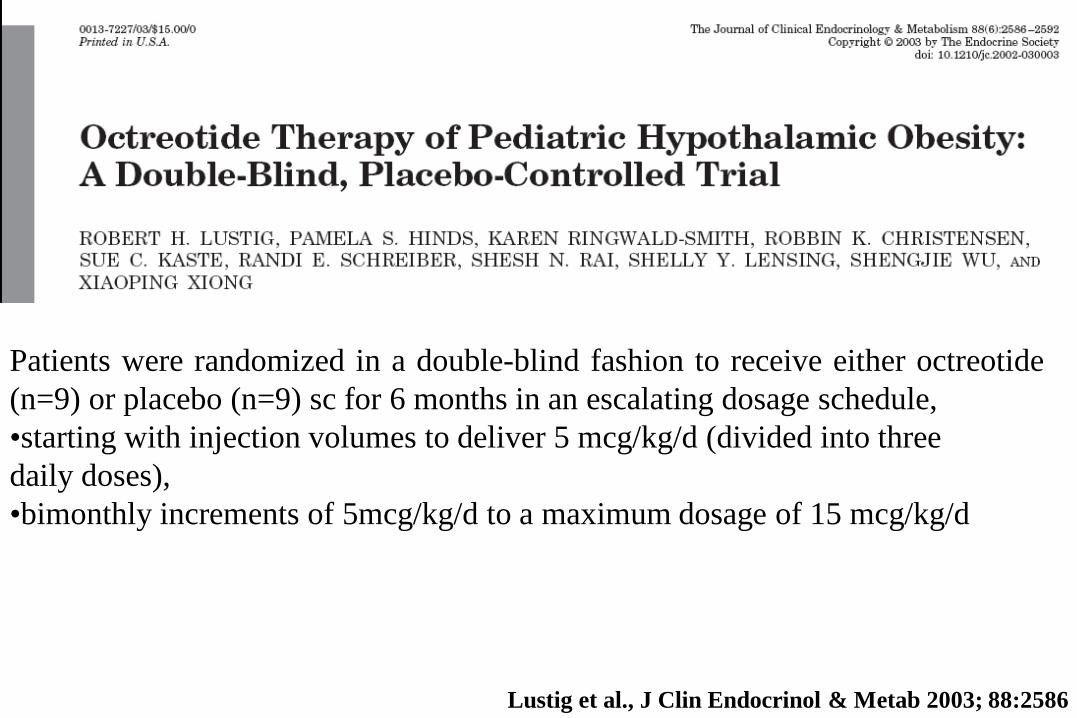
Patients were randomized in a double-blind fashion to receive either octreotide
(n=9) or placebo (n=9) sc for 6 months in an escalating dosage schedule,
•starting with injection volumes to deliver 5 mcg/kg/d (divided into three
daily doses),
•bimonthly increments of 5mcg/kg/d to a maximum dosage of 15 mcg/kg/d
Lustig et al., J Clin Endocrinol & Metab 2003; 88:2586
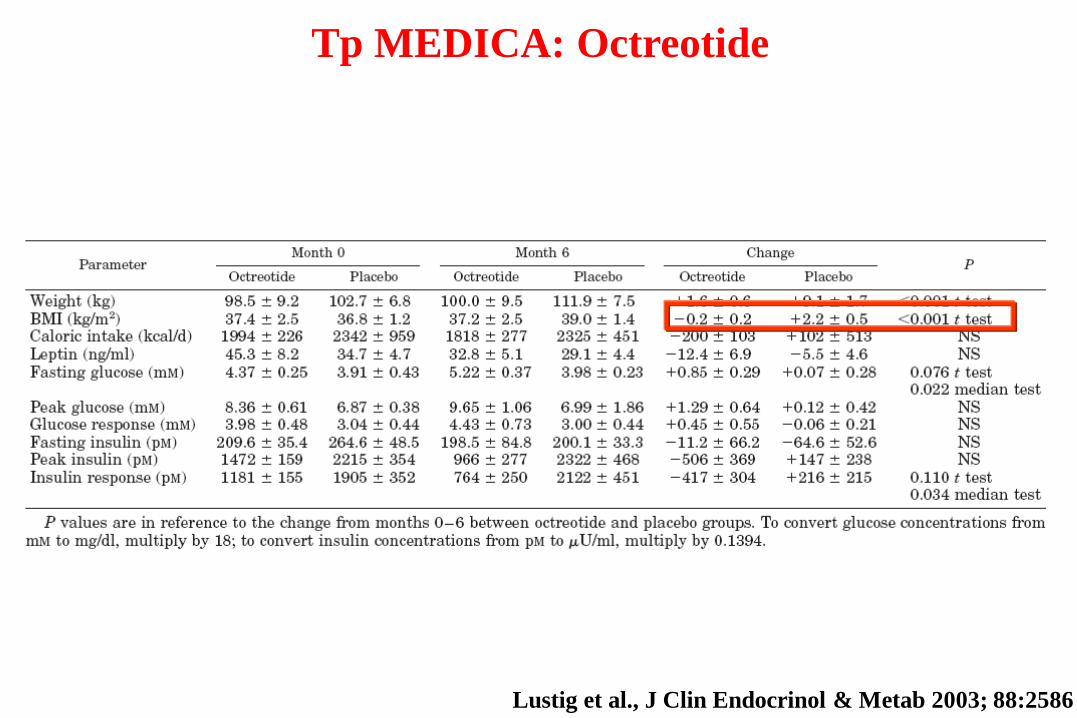
Lustig et al., J Clin Endocrinol & Metab 2003; 88:2586
Tp MEDICA: Octreotide
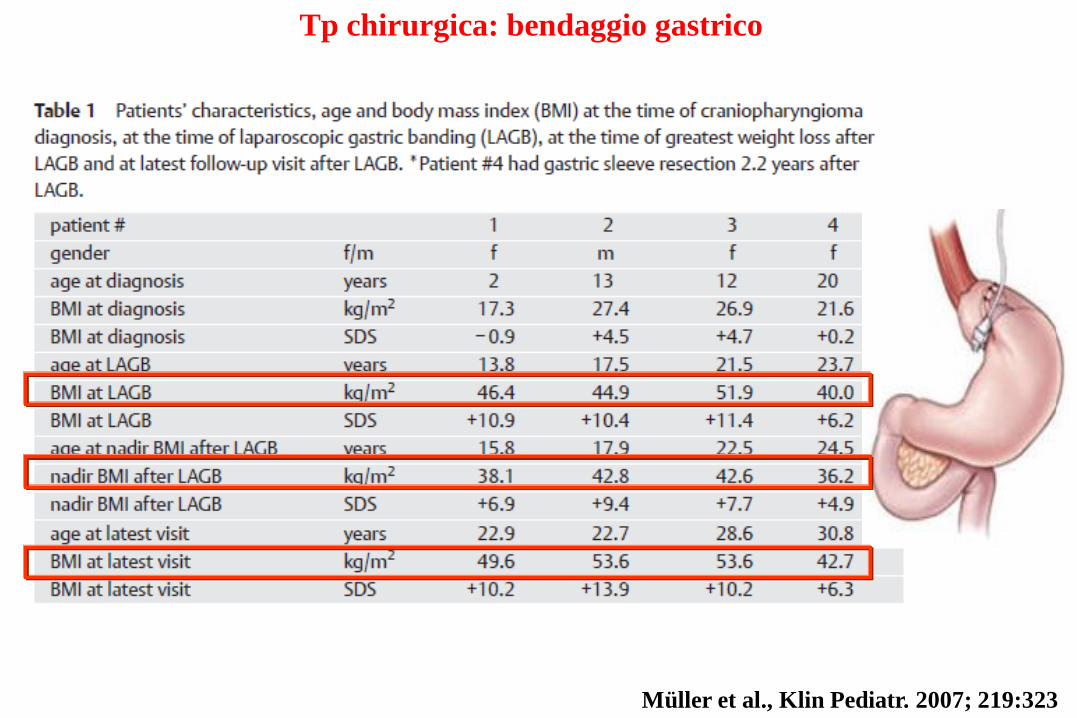
Müller et al., Klin Pediatr. 2007; 219:323
Tp chirurgica: bendaggio gastrico

A ROUX-EN-Y GASTRIC BYPASS
Inge et al. Nat Clin Pract Endocrinol Metab. 2007; 3:606
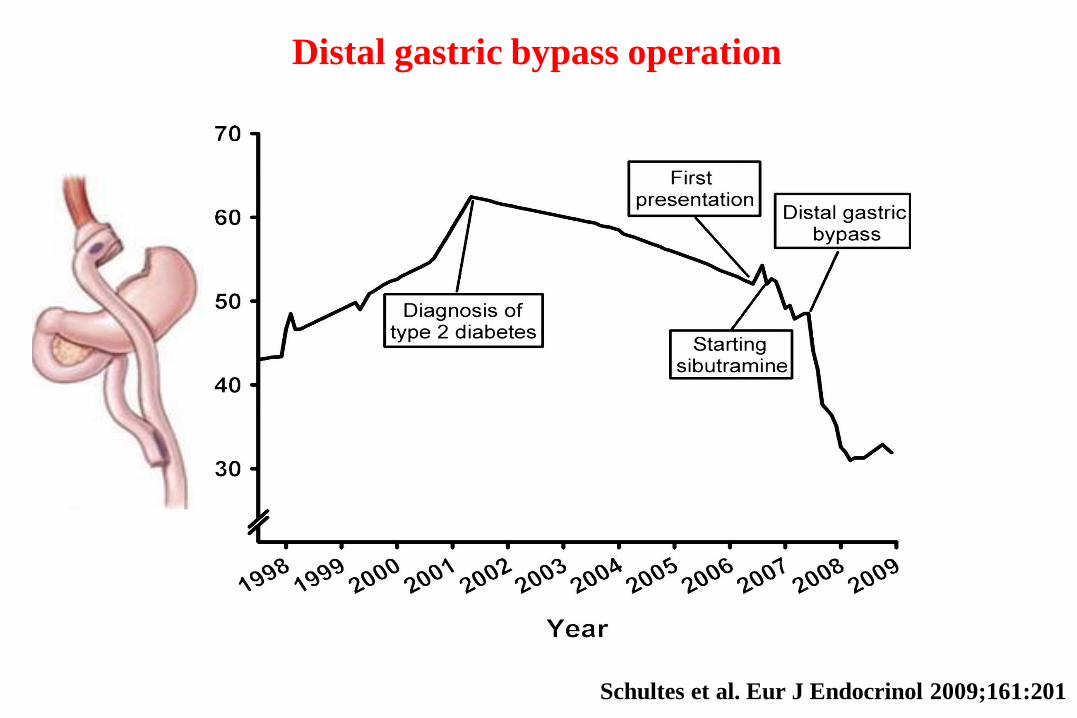
Schultes et al. Eur J Endocrinol 2009;161:201
Distal gastric bypass operation

Conclusioni obesità ipotalamica
•Modificazione degli stili di vita
•Attività fisica (se possibile)
•Tp farmacologica solo se combinata con le
modifiche dello stile di vita
•Chirurgia solo in caso di fallimento della
terapia comportamentale e farmacologica
•No chirurgia di tipo restrittivo se iperfagia o
disturbi comportamento alimentare
Pagotto U 2013 in press

Giovanni e con il GH e
il testosterone nell’età
adulta che si fa?
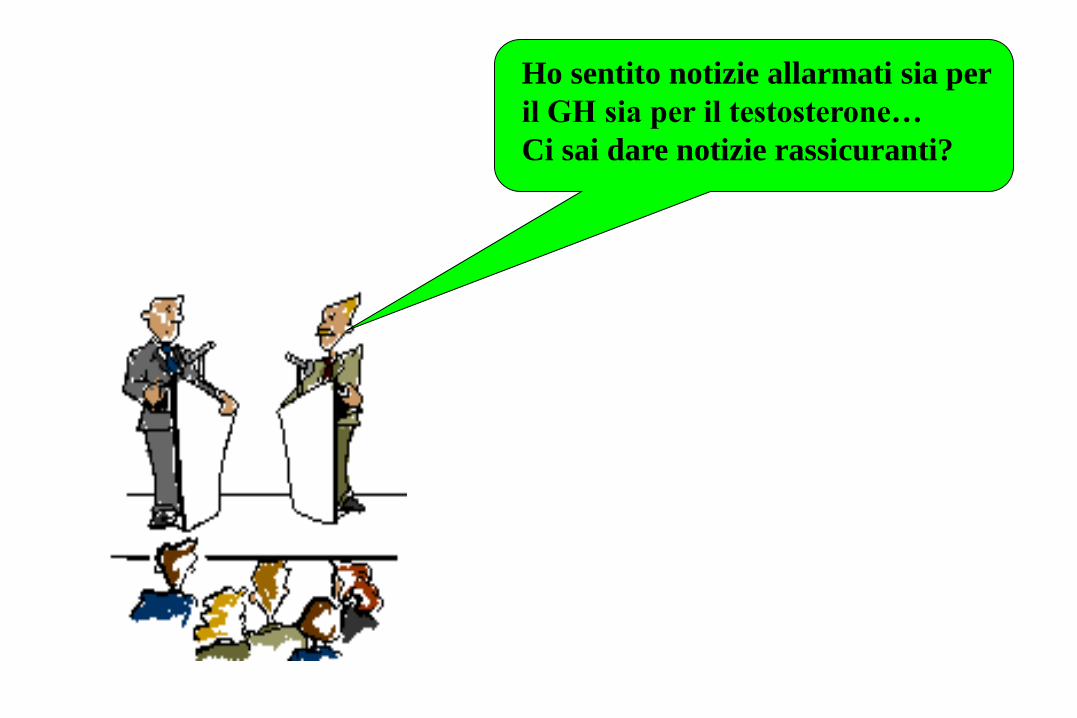
Ho sentito notizie allarmati sia per
il GH sia per il testosterone…
Ci sai dare notizie rassicuranti?
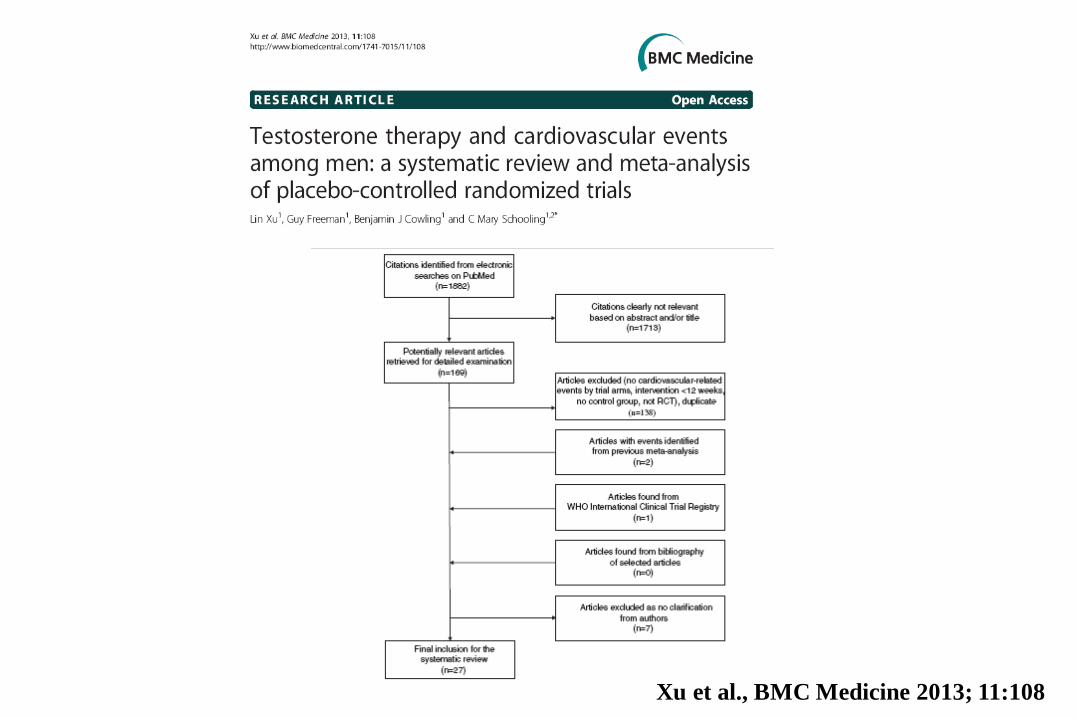
Xu et al., BMC Medicine 2013; 11:108
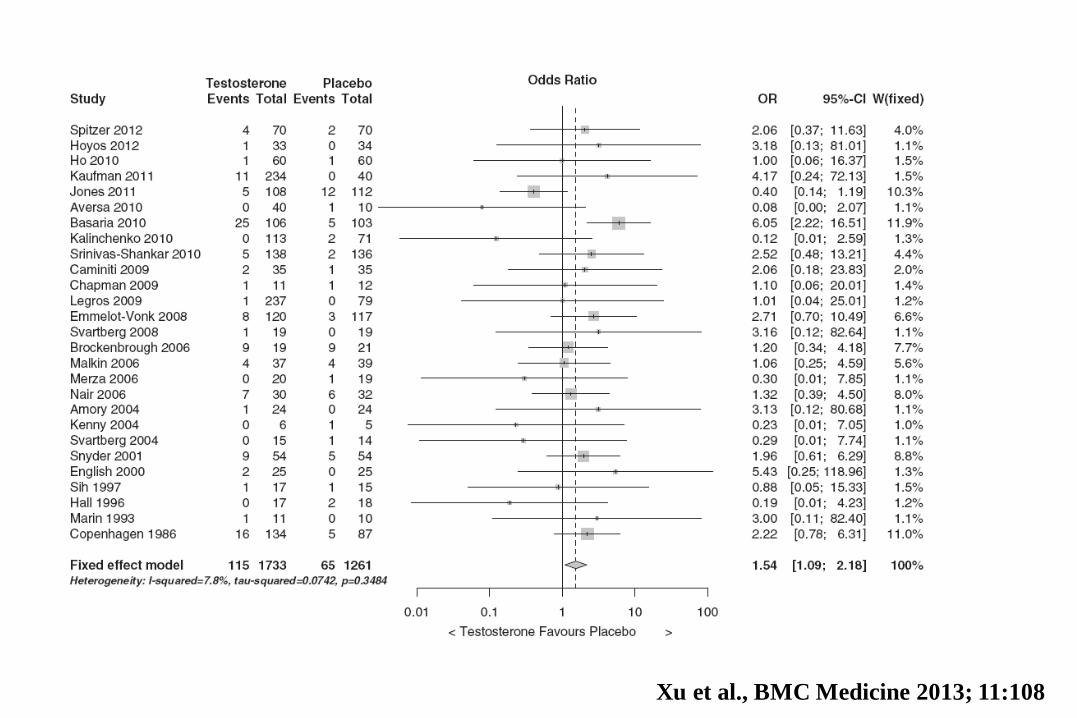
Xu et al., BMC Medicine 2013; 11:108
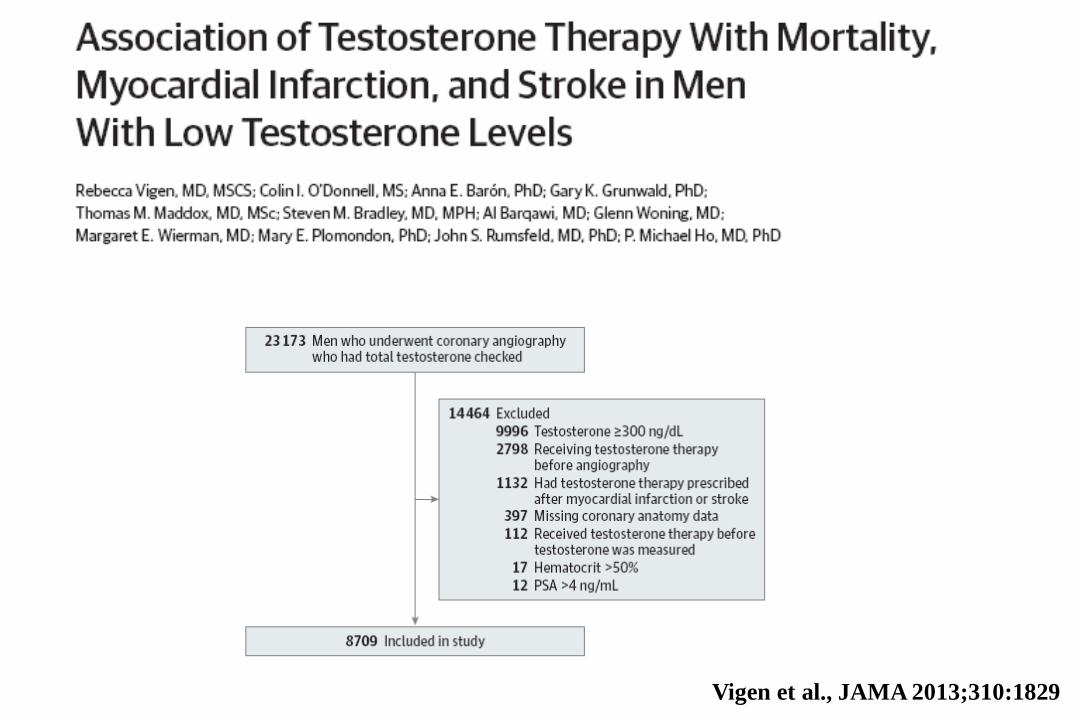
Vigen et al., JAMA 2013;310:1829
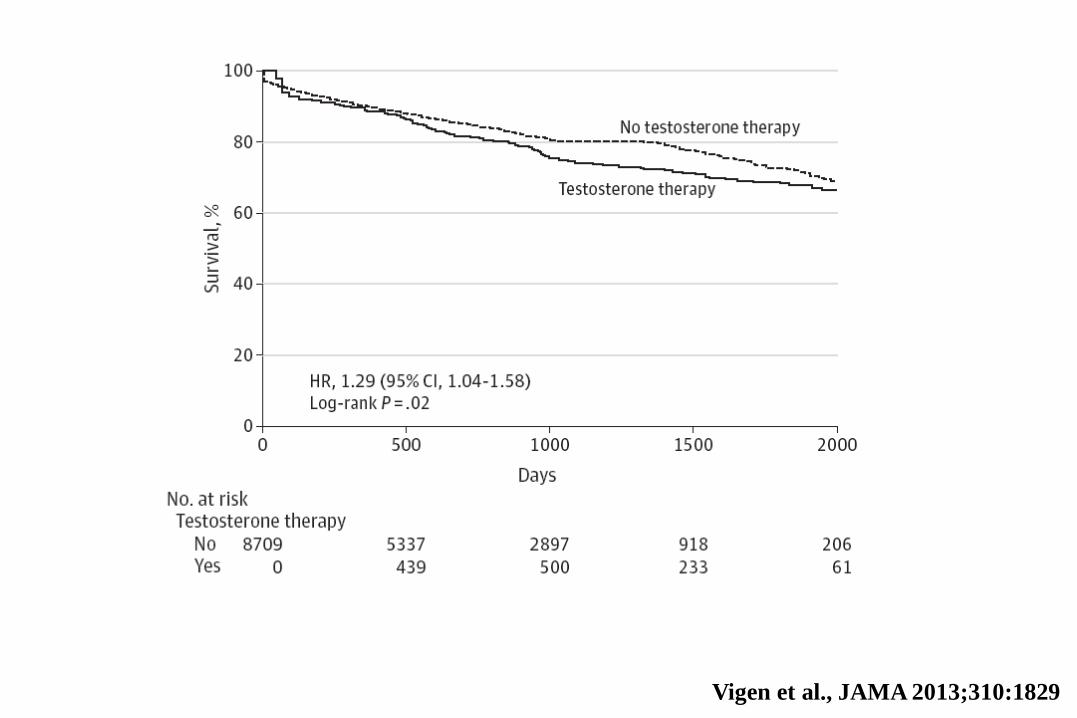
Vigen et al., JAMA 2013;310:1829
-20
,00
-15
,00
-10
,00
-5,0
0
0,0
0
5,0
0
10
,00
Diff. in mean LL, 95% CI UL, 95% CI-20 -15 -10 -5 0 5 10Source
TT mean differences (nmol/L)
Favours CHD Favors no CHD
Poggi et al., 1976
Ben-Halim et al., 1978
Entrican et al., 1978
Luria et al., 1982
Labropoulos et al., 1982
Labropoulos et al., 1982*
Zumoff et al., 1982*
Phillips et al., 1983
Aksut et al., 1986
Aksut et al., 1986*
Franzen et al., 1986
Franzen et al., 1986*
Lichatenstein et al., 1987
Small et al., 1987
Phillips et al., 1988
Barrett-Connor et al., 1988
Sewdarsen et al., 1990
Hauner et al., 1991
Rice et al., 1993
Hautanen et al., 1994
Marques-Vidal et al., 1995
Phillips et al., 1996
Tripathi et al., 1998*
Tripathi et al., 1998**
Tripathi et al., 1998***
Chearskul et al., 2000
Mikulec et al., 2004
Cao et al., 2010
Overall CHD non-angio documented
-8,75 -13,91 -3,59
0,00 -2,94 2,94
2,35 -0,31 5,01
1,32 -4,06 6,70
3,00 0,27 5,73
1,80 -0,38 3,98
1,46 -1,43 4,35
0,80 -0,86 2,46
-6,36 -8,63 -4,10
-7,16 -10,03 -4,28
3,00 0,57 5,43
2,00 -0,43 4,43
-1,10 -1,81 -0,39
-3,30 -7,12 0,52
-0,69 -2,57 1,18
-0,04 -1,18 1,10
-1,51 -2,64 -0,38
-1,40 -2,85 0,05
-2,15 -3,53 -0,76
0,50 -1,71 2,71
-0,40 -1,95 1,15
2,64 -2,01 7,29
-13,85 -15,68 -12,02
-13,43 -14,97 -11,89
-13,56 -15,59 -11,53
-5,81 -7,92 -3,70
0,31 -0,77 1,39
-4,06 -5,30 -2,82
-2,33 -3,99 -0,68
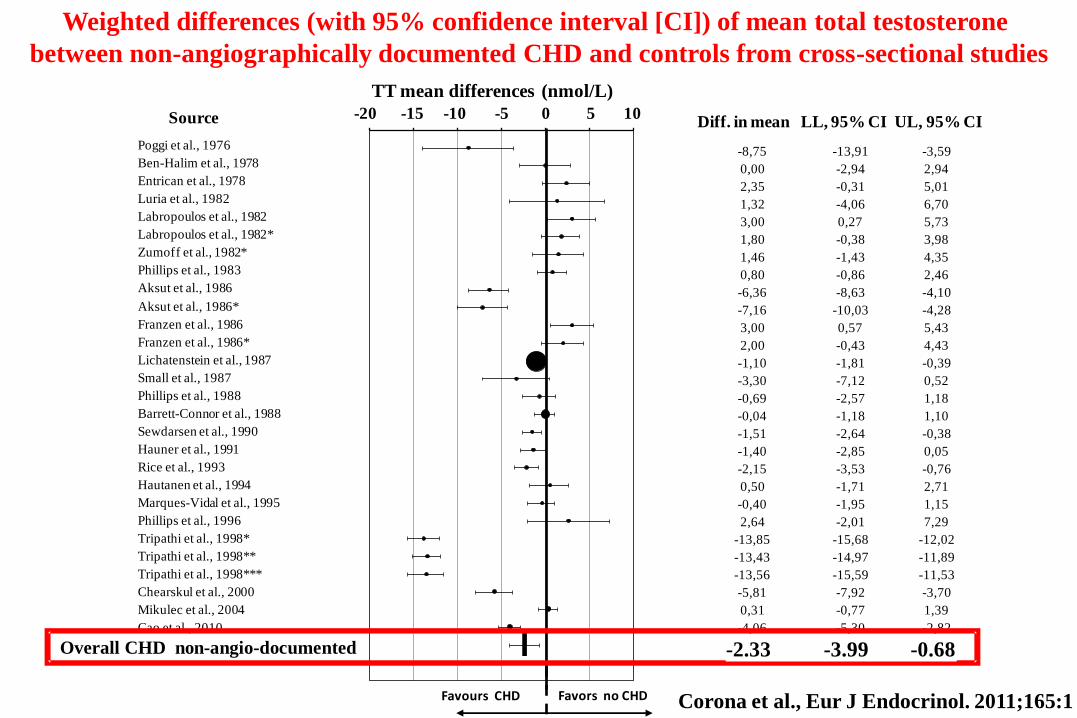
Weighted differences (with 95% confidence interval [CI]) of mean total testosterone
between non-angiographically documented CHD and controls from cross-sectional studies
Overall CHD non-angio-documented -2.33 -3.99 -0.68
Corona et al., Eur J Endocrinol. 2011;165:1
-15
,00
-10
,00
-5,0
0
0,0
0
5,0
0
10
,00
Diff. in mean LL, 95% CI UL, 95% CI-15 -10 -5 0 5 10Source
TT mean differences (nmol/L)
Favours CHD Favors no CHD
Luria et al., 1982 *
Zumoff et al., 1982
Barth et al., 1983
Hromadova et al., 1985
Sewdarsen et al., 1986
Chute et al., 1987
Hamalainen et al., 1987
Sewdarsen et al., 1988
Slowinska-Srzednicka et al., 1989
Zhao et al., 1998
Kabakci et al., 1999
English et al., 2000
Dobrzycki et al., 2003
Dunajska et al., 2004
Dunajska et al., 2004*
Fischer et al., 2004
Davoodi et al., 2007
He et al., 2007
Mohamad et al., 2007
Mohamad et al., 2007*
Turhan et al., 2007
Fallah et al., 2009
Overall CHD angio documented
2,99 -0,42 6,39
-1,90 -5,87 2,07
-5,70 -9,36 -2,04
-7,21 -10,85 -3,57
-5,00 -7,56 -2,44
-4,76 -7,86 -1,66
-0,70 -4,36 2,96
-3,80 -6,88 -0,72
-3,06 -7,32 1,20
-5,56 -7,80 -3,32
1,74 -0,28 3,76
-2,00 -4,09 0,09
-9,30 -11,97 -6,63
-3,60 -7,25 0,05
-2,36 -5,23 0,51
-0,60 -2,08 0,88
0,78 -0,64 2,20
-0,28 -2,08 1,53
-4,50 -6,48 -2,52
-1,40 -3,76 0,96
-3,48 -5,76 -1,20
0,78 -0,64 2,20
-2,57 -3,82 -1,31
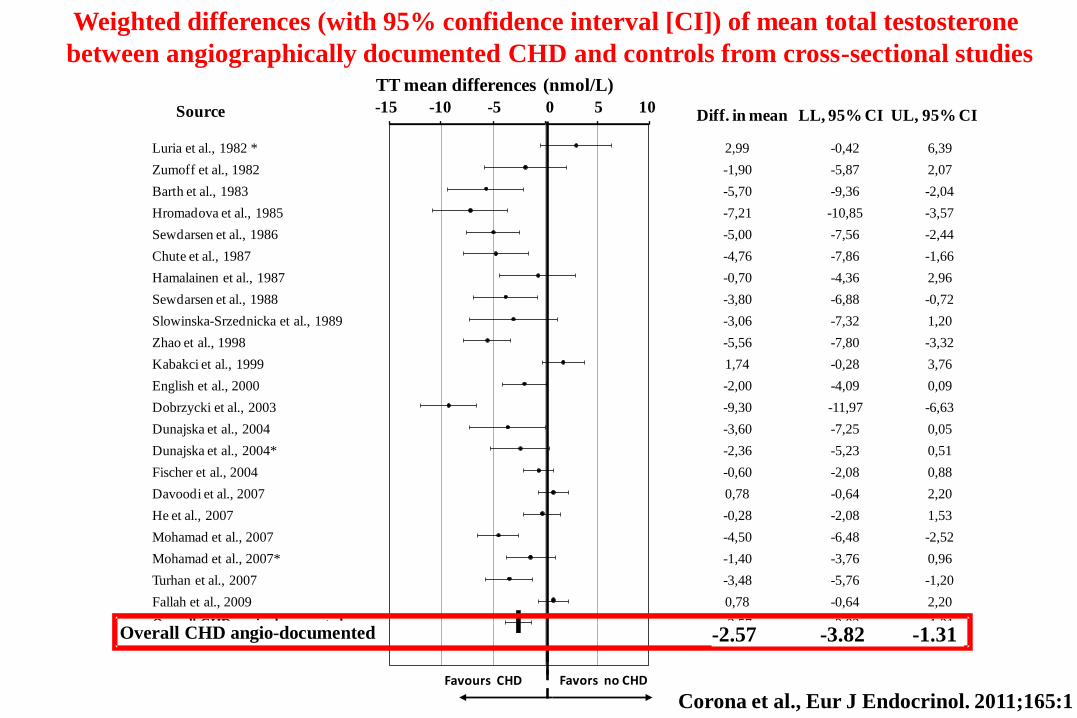
Weighted differences (with 95% confidence interval [CI]) of mean total testosterone
between angiographically documented CHD and controls from cross-sectional studies
Overall CHD angio-documented -2.57 -3.82 -1.31
Corona et al., Eur J Endocrinol. 2011;165:1

Baseline weighted differences (with 95% confidence interval) of mean total testosterone
(TT) between patients with incident overall mortality and controls
Source -6 -5 -4 -3 -2 -1 0
TT mean differences (nmol/L)
Diff. in mean LL, 95% CI UL, 95% CI
Higher ovreall mortality Lower overall mortality
-2,90 -5,39 -0,41
-0,90 -1,38 -0,42
-2,10 -3,87 -0,33
-1,53 -2,69 -0,37
Letonen et al., 1996
Khaw et al., 2007
Corona et al., 2010
OVERALL
Corona et al., Eur J Endocrinol. 2011;165:1
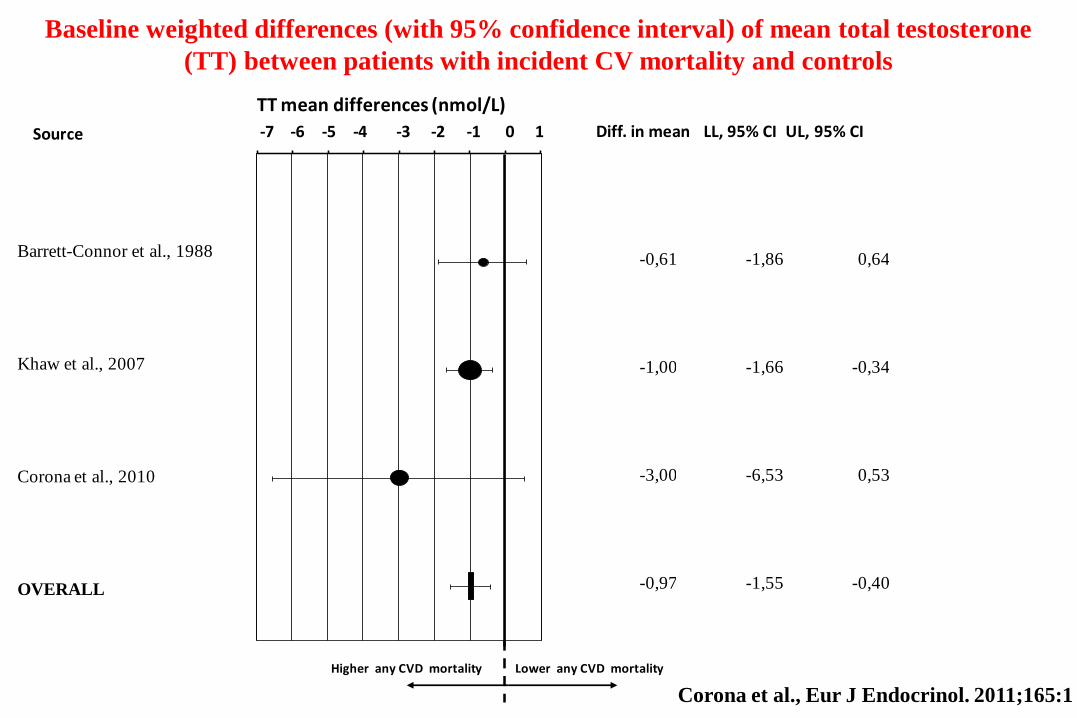
Baseline weighted differences (with 95% confidence interval) of mean total testosterone
(TT) between patients with incident CV mortality and controls
-0,61 -1,86 0,64
-1,00 -1,66 -0,34
-3,00 -6,53 0,53
-0,97 -1,55 -0,40
Barrett-Connor et al., 1988
Khaw et al., 2007
Corona et al., 2010
OVERALL
-7,00
-6,00
-5,00
-4,00
-3,00
-2,00
-1,00
0,00
1,00Source -7 -6 -5 -4 -3 -2 -1 0 1 Diff. in mean LL, 95% CI UL, 95% CI
Higher any CVD mortality Lower any CVD mortality
TT mean differences (nmol/L)
Corona et al., Eur J Endocrinol. 2011;165:1

Baseline weighted differences (with 95% confidence interval) of mean total testosterone
(TT) between patients with incident MACE and controls
-12
,00
-10
,00
-8,0
0
-6,0
0
-4,0
0
-2,0
0
0,0
0
2,0
0
4,0
0Source -12 -10 -8 -6 -4 -2 0 2 4 Diff. in mean LL, 95% CI UL, 95% CI
Higher any CVD incidence Lower any CVD incidence
TT mean differences (nmol/L)
Cauley et al., 1987
Phillips et al., 1988
Contoreggi et al., 1990
Yarnell et al., 1993
Hautanen et al 1994
Mikulec et al., 2004
Yeap et al., 2009
Corona et al., 2010
Overall
0,60 -1,47 2,67
-0,69 -2,83 1,44
0,35 -1,79 2,49
0,10 -1,19 1,39
0,50 -1,71 2,71
-10,10 -10,77 -9,44
-1,00 -2,02 0,02
-0,70 -1,85 0,45
-1,40 -5,23 2,44
Corona et al., Eur J Endocrinol. 2011;165:1
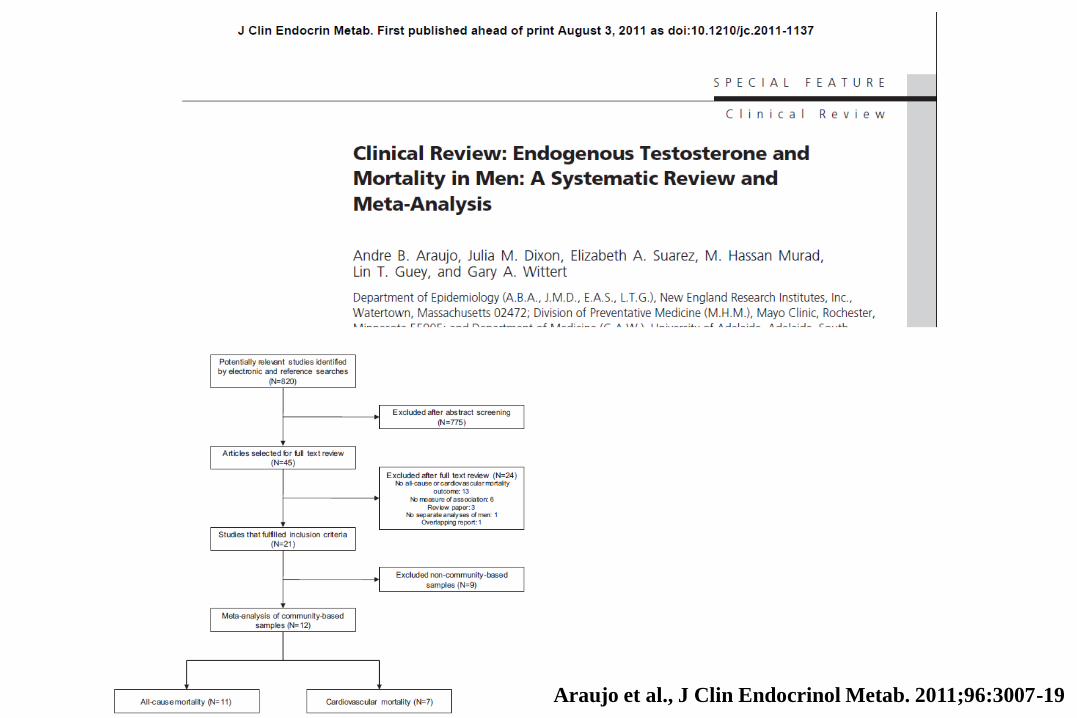
Araujo et al., J Clin Endocrinol Metab. 2011;96:3007-19
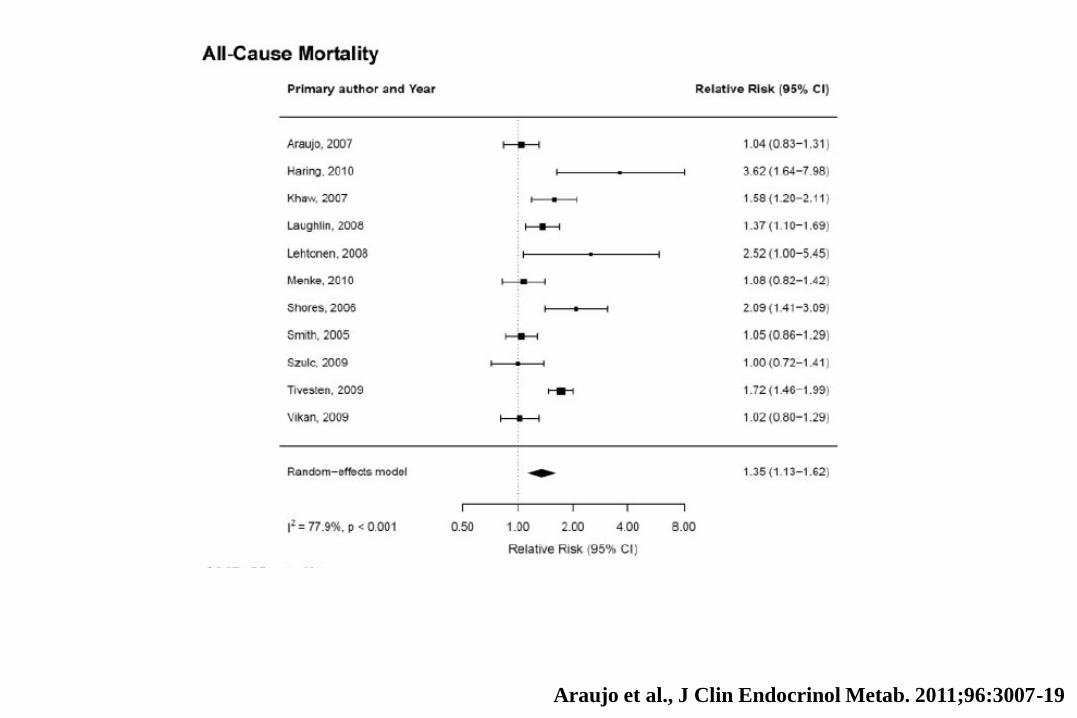
Araujo et al., J Clin Endocrinol Metab. 2011;96:3007-19
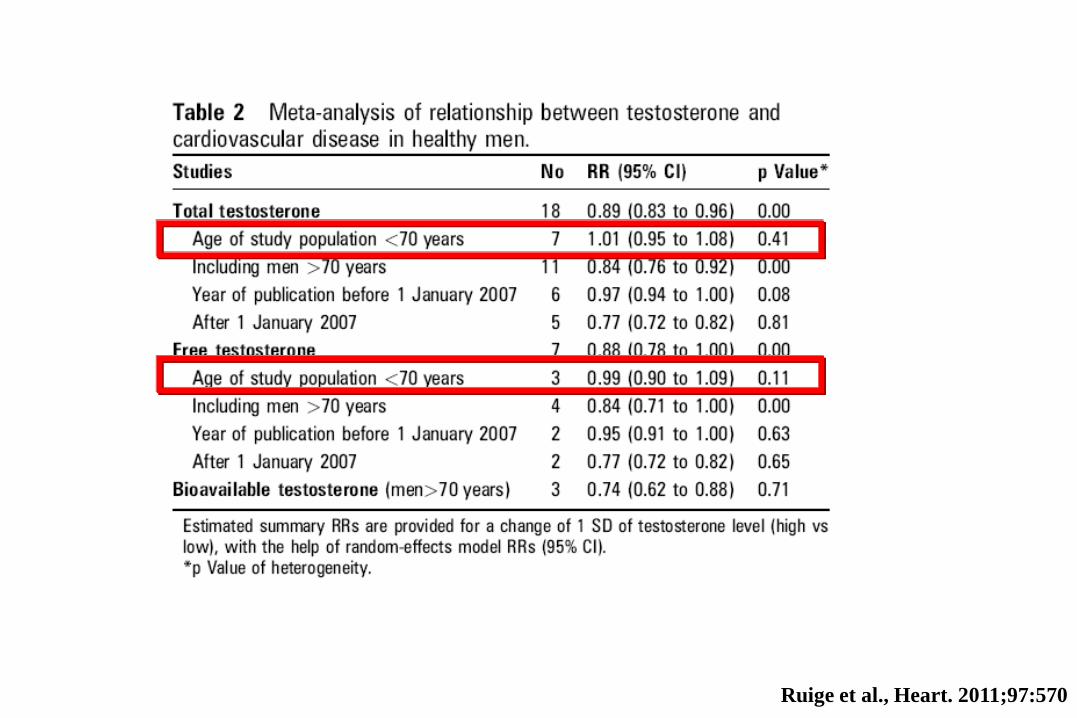
Ruige et al., Heart. 2011;97:570

Ruige et al., Heart. 2011;97:570
23.0 23.6 24.3 24.9 25.6 26.3 26.1 27.7 28.2 28.9 29.6
Regression of age on Difference in means
age
Dif
fere
nce i
n m
ean
s
30,25 34,86 39,46 44,06 48,66 53,27 57,87 62,47 67,07 71,68 76,28
3,00
1,31
-0,37
-2,06
-3,74
-5,43
-7,11
-8,80
-10,48
-12,17
-13,85
S: 0.018[-0.015; 0.051] p=0.282
I: -2.680[-4.514, -0.847], p= 0.004
Dif
fere
nce
inm
ean
s(n
mol/
L)
Age (years)
A
Regression of DM on Difference in means
DM
Dif
fere
nce i
n m
ean
s
-6,51 1,30 9,12 16,93 24,74 32,56 40,37 48,19 56,00 63,81 71,63
2,00
0,41
-1,17
-2,76
-4,34
-5,93
-7,51
-9,10
-10,68
-12,27
-13,85
S: 0.073[0.034; 0.112], p<0.001
I: -2.396[-2.895;-1.896], p< 0.0001
Diabetes (%)
Dif
fere
nce
inm
ean
s(n
mol/
L)
C
Regression of bmi on Difference in means
bmi
Dif
fere
nce i
n m
ean
s
22,89 23,47 24,05 24,63 25,21 25,79 26,37 26,95 27,53 28,11 28,69
3,00
1,31
-0,37
-2,06
-3,74
-5,43
-7,11
-8,80
-10,48
-12,17
-13,85
Dif
fere
nce
inm
ean
s(n
mol/
L)
S: 0.599[0.363; 0.837], p<0.0001
I: -17.391[-23.586;-11.195], p< 0.0001
BMI (Kg/m2)
B
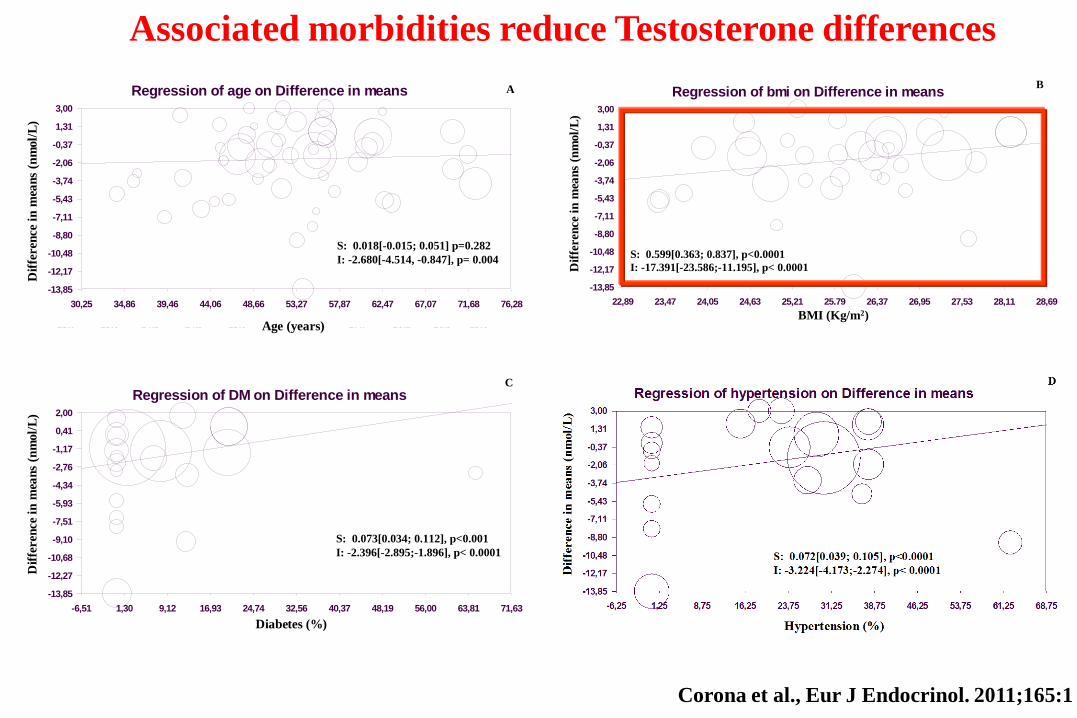
Associated morbidities reduce Testosterone differences
Corona et al., Eur J Endocrinol. 2011;165:1

23.0 23.6 24.3 24.9 25.6 26.3 26.1 27.7 28.2 28.9 29.6
Regression of age on Difference in means
age
Dif
fere
nce i
n m
ean
s
30,25 34,86 39,46 44,06 48,66 53,27 57,87 62,47 67,07 71,68 76,28
3,00
1,31
-0,37
-2,06
-3,74
-5,43
-7,11
-8,80
-10,48
-12,17
-13,85
S: 0.018[-0.015; 0.051] p=0.282
I: -2.680[-4.514, -0.847], p= 0.004
Dif
fere
nce
inm
ean
s(n
mol/
L)
Age (years)
A
Regression of DM on Difference in means
DM
Dif
fere
nce i
n m
ean
s
-6,51 1,30 9,12 16,93 24,74 32,56 40,37 48,19 56,00 63,81 71,63
2,00
0,41
-1,17
-2,76
-4,34
-5,93
-7,51
-9,10
-10,68
-12,27
-13,85
S: 0.073[0.034; 0.112], p<0.001
I: -2.396[-2.895;-1.896], p< 0.0001
Diabetes (%)
Dif
fere
nce
inm
ean
s(n
mol/
L)
C
Regression of bmi on Difference in means
bmi
Dif
fere
nce i
n m
ean
s
22,89 23,47 24,05 24,63 25,21 25,79 26,37 26,95 27,53 28,11 28,69
3,00
1,31
-0,37
-2,06
-3,74
-5,43
-7,11
-8,80
-10,48
-12,17
-13,85
Dif
fere
nce
inm
ean
s(n
mol/
L)
S: 0.599[0.363; 0.837], p<0.0001
I: -17.391[-23.586;-11.195], p< 0.0001
BMI (Kg/m2)
B
Associated morbidities reduce Testosterone differences
Corona et al., Eur J Endocrinol. 2011;165:1

L’ipogonadismo può rappresentare
un meccanismo di adattamento (low
T syndrome) nel paziente malato…
Corona et al., J Sex Med. 2011;8:2098
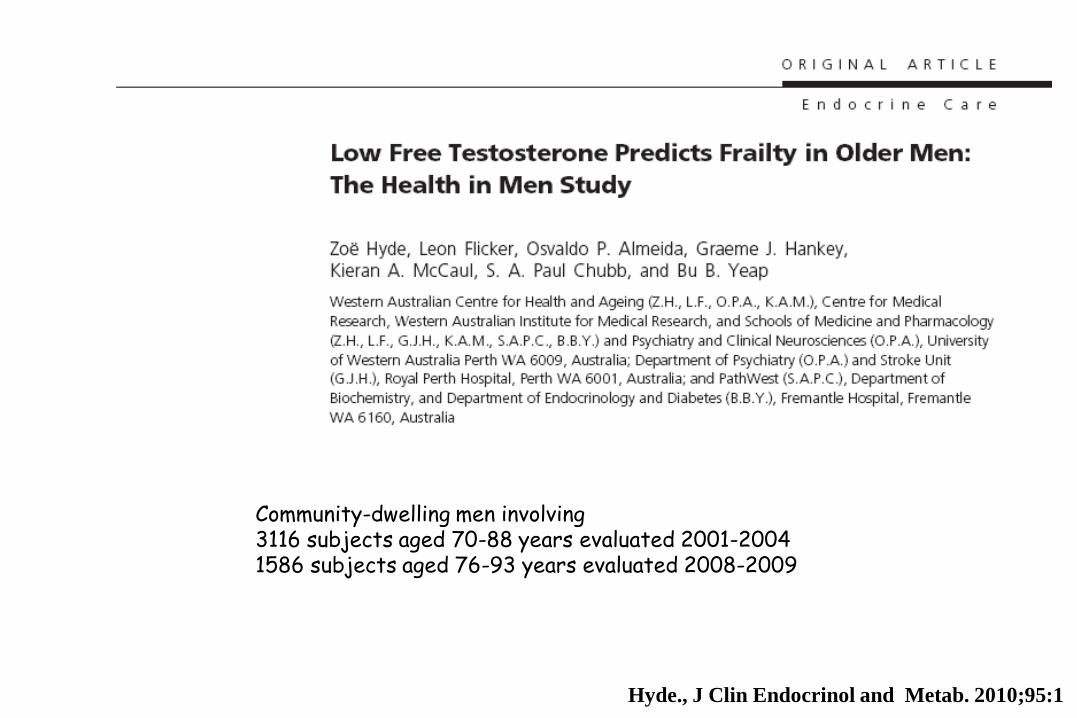
Hyde., J Clin Endocrinol and Metab. 2010;95:1
Community-dwelling men involving 3116 subjects aged 70-88 years evaluated 2001-2004 1586 subjects aged 76-93 years evaluated 2008-2009
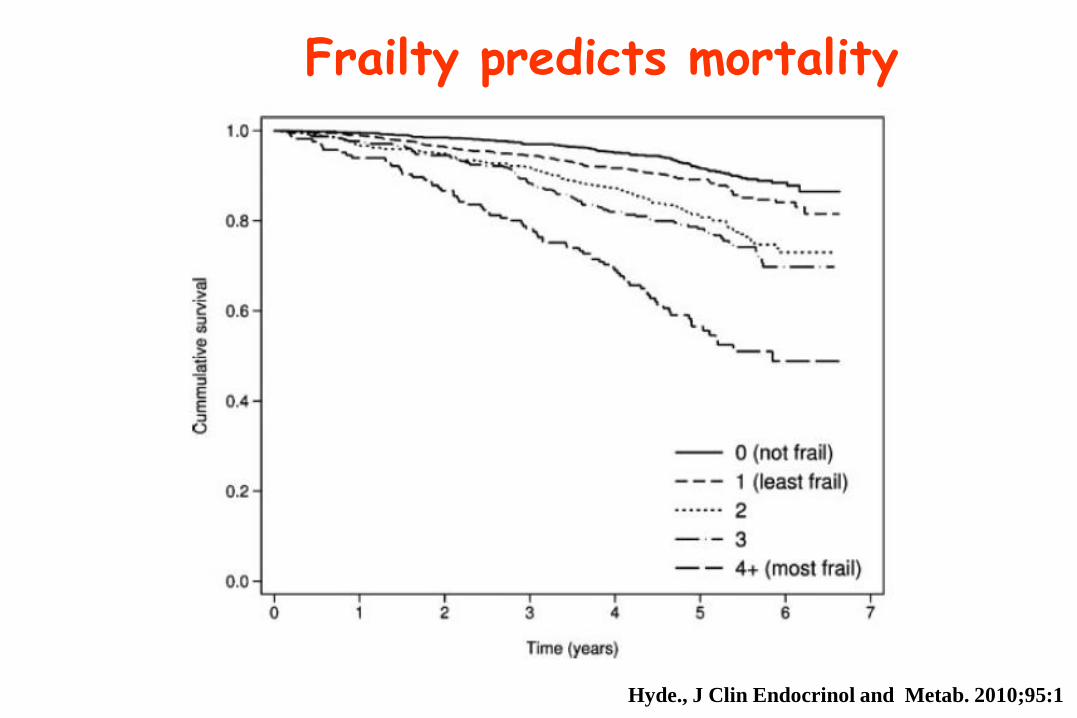
Frailty predicts mortality
Hyde., J Clin Endocrinol and Metab. 2010;95:1
5
7
9
11
13
15
17
19
21
23
25
1 2 3
all
-ca
use
mo
rta
lity
(%
)
Eugonadal
untreated
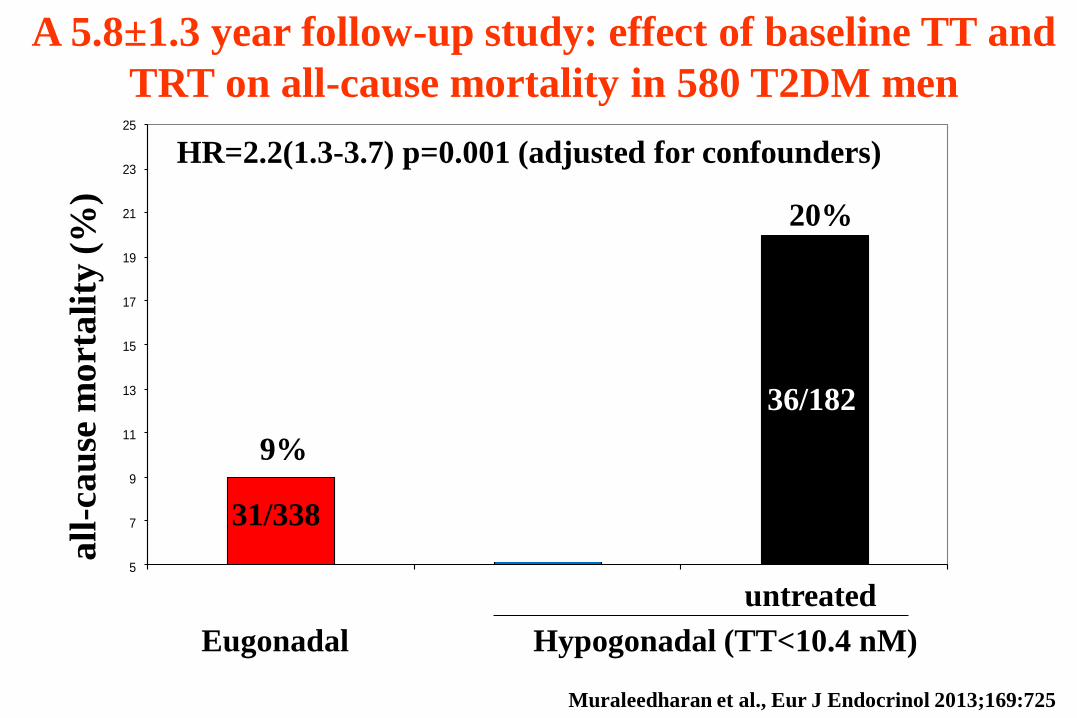
Muraleedharan et al., Eur J Endocrinol 2013;169:725
A 5.8±1.3 year follow-up study: effect of baseline TT and
TRT on all-cause mortality in 580 T2DM men
31/338 5/58
36/182
HR=2.2(1.3-3.7) p=0.001 (adjusted for confounders)
Hypogonadal (TT<10.4 nM)
9%
20%

5
7
9
11
13
15
17
19
21
23
25
1 2 3
all
-ca
use
mo
rta
lity
(%
)
Eugonadal
untreated
Muraleedharan et al., Eur J Endocrinol 2013;169:725
A 5.8±1.3 year follow-up study: effect of baseline TT and
TRT on all-cause mortality in 580 T2DM men
31/338 5/58
36/182
HR=2.2(1.3-3.7) p=0.001 (adjusted for confounders)
Hypogonadal (TT<10.4 nM)
8,6% 9%
20%

A 5 year follow-up study: effect of TRT on all-cause
mortality in 1031 hypogonadal men (TT<8.7 nM)
Muraleedharan et al., J Clin Endocrinol and Metab 2012;97:2050
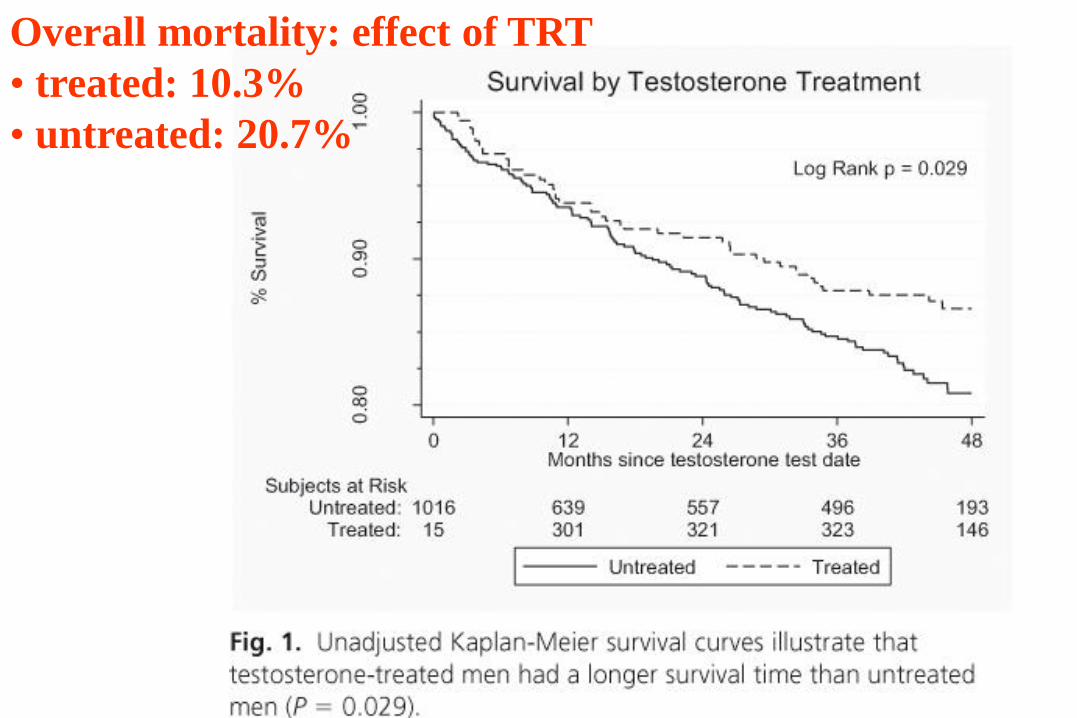
Overall mortality: effect of TRT
• treated: 10.3%
• untreated: 20.7%

A 5 year follow-up study: effect of TRT on all-cause
mortality in 1031 hypogonadal men (TT<8.7 nM)
Muraleedharan et al., J Clin Endocrinol and Metab 2012;97:2050

0,1
0
1,0
0
10
,00
Shores et al., 2012
Muraleedharan et al.,
2013
OVERALL
2,272 1,560 3,310 <0.0001
2,614 0,974 7,012 0.056
2,313 1,628 3,287 <0.0001
Source OR LL, 95% CI UL, 95% CI P 0.1 1 10
No TRT TRT
Odd ratio for overall mortality in hypogonadal subjects
with or w/o TRT
No TRT doubles the risk of overall mortality in low T Corona et al., World J Mens Health 2013;2: 103
EFFECTS OF TRT ON DM & MetS PATIENT
RESULTS FROM META-ANALYSIS EVALUATION
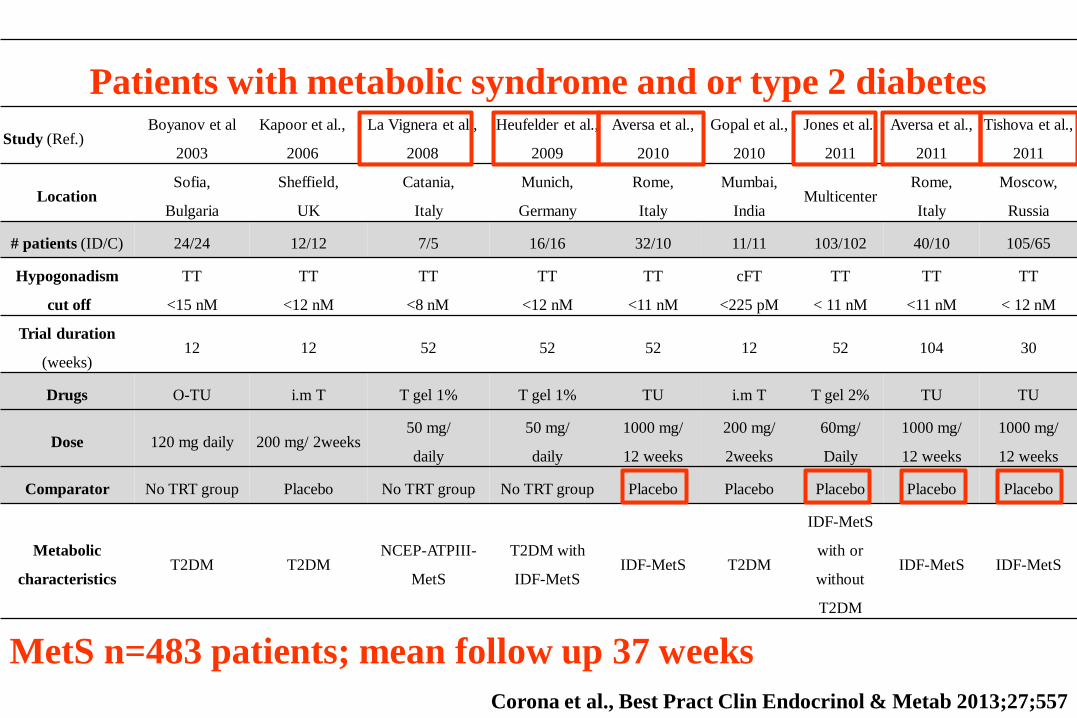
MetS n=483 patients; mean follow up 37 weeks
Patients with metabolic syndrome and or type 2 diabetes
Study (Ref.) Boyanov et al
2003
Kapoor et al.,
2006
La Vignera et al.,
2008
Heufelder et al.,
2009
Aversa et al.,
2010
Gopal et al.,
2010
Jones et al.,
2011
Aversa et al.,
2011
Tishova et al.,
2011
Location Sofia,
Bulgaria
Sheffield,
UK
Catania,
Italy
Munich,
Germany
Rome,
Italy
Mumbai,
India Multicenter
Rome,
Italy
Moscow,
Russia
# patients (ID/C) 24/24 12/12 7/5 16/16 32/10 11/11 103/102 40/10 105/65
Hypogonadism
cut off
TT
<15 nM
TT
<12 nM
TT
<8 nM
TT
<12 nM
TT
<11 nM
cFT
<225 pM
TT
< 11 nM
TT
<11 nM
TT
< 12 nM
Trial duration
(weeks) 12 12 52 52 52 12 52 104 30
Drugs O-TU i.m T T gel 1% T gel 1% TU i.m T T gel 2% TU TU
Dose 120 mg daily 200 mg/ 2weeks 50 mg/
daily
50 mg/
daily
1000 mg/
12 weeks
200 mg/
2weeks
60mg/
Daily
1000 mg/
12 weeks
1000 mg/
12 weeks
Comparator No TRT group Placebo No TRT group No TRT group Placebo Placebo Placebo Placebo Placebo
Metabolic
characteristics T2DM T2DM
NCEP-ATPIII-
MetS
T2DM with
IDF-MetS IDF-MetS T2DM
IDF-MetS
with or
without
T2DM
IDF-MetS IDF-MetS
Corona et al., Best Pract Clin Endocrinol & Metab 2013;27;557
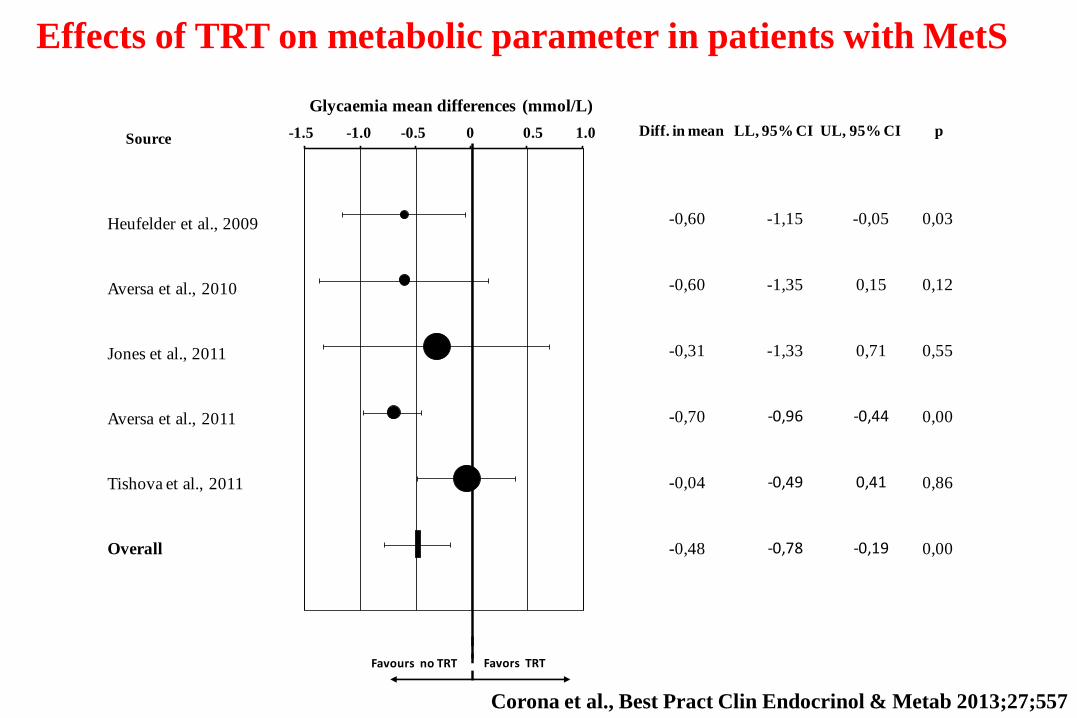
Effects of TRT on metabolic parameter in patients with MetS
Heufelder et al., 2009
Aversa et al., 2010
Jones et al., 2011
Aversa et al., 2011
Tishova et al., 2011
Overall
-0,60 -1,15 -0,05 0,03
-0,60 -1,35 0,15 0,12
-0,31 -1,33 0,71 0,55
-0,70 -0,96 -0,44 0,00
-0,04 -0,49 0,41 0,86
-0,48 -0,78 -0,19 0,00
-1,5
0
-1,0
0
-0,5
0
0,0
0
0,5
0
1,0
0 Diff. in mean LL, 95% CI UL, 95% CI pSource
Glycaemia mean differences (mmol/L)
-1.5 -1.0 -0.5 0 0.5 1.0
Favours no TRT Favors TRT
Corona et al., Best Pract Clin Endocrinol & Metab 2013;27;557
Favours TRT Favors no TRT
-6,0
0
-5,0
0
-4,0
0
-3,0
0
-2,0
0
-1,0
0
0,0
0
1,0
0
2,0
0
3,0
0 Diff. in mean LL, 95% CI UL, 95% CI pSource
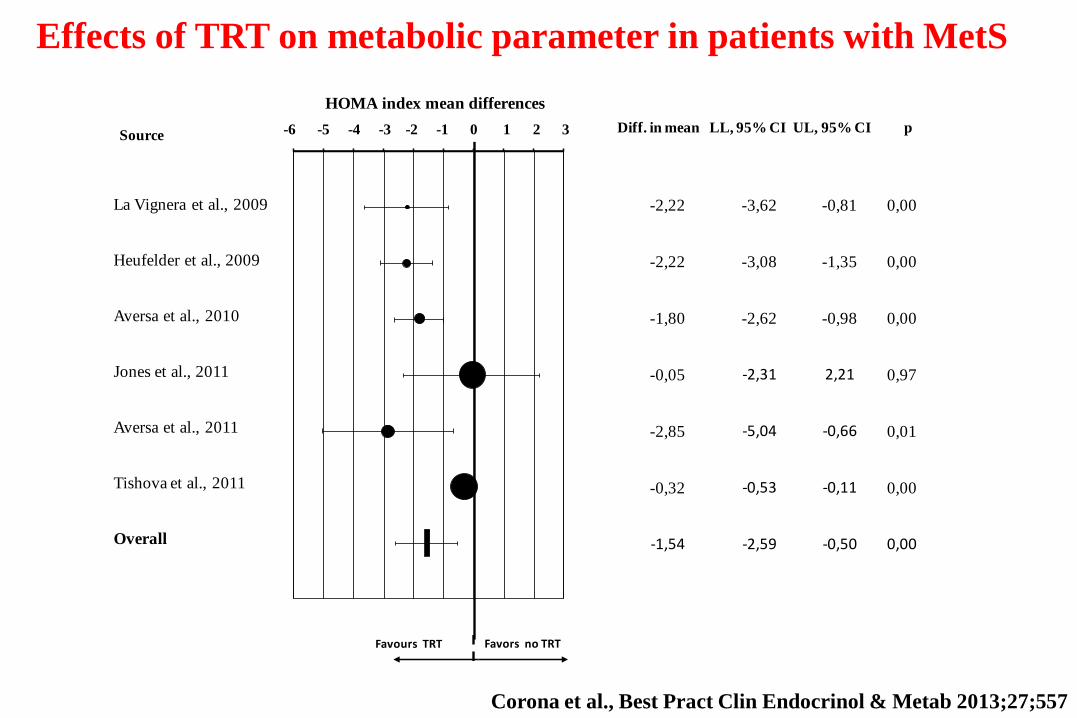
HOMA index mean differences
-6 -5 -4 -3 -2 -1 0 1 2 3
-2,22 -3,62 -0,81 0,00
-2,22 -3,08 -1,35 0,00
-1,80 -2,62 -0,98 0,00
-0,05 -2,31 2,21 0,97
-2,85 -5,04 -0,66 0,01
-0,32 -0,53 -0,11 0,00
-1,54 -2,59 -0,50 0,00
La Vignera et al., 2009
Heufelder et al., 2009
Aversa et al., 2010
Jones et al., 2011
Aversa et al., 2011
Tishova et al., 2011
Overall
Effects of TRT on metabolic parameter in patients with MetS
Corona et al., Best Pract Clin Endocrinol & Metab 2013;27;557

Favours TRT Favors no TRT
La Vignera et al., 2009
Heufelder et al., 2009
Aversa et al., 2010
Jones et al., 2011
Aversa et al., 2011
Tishova et al., 2011
Overall
-1,2
0
-1,0
0
-0,8
0
-0,6
0
-0,4
0
-0,2
0
0,0
0
0,2
0
0,4
0
0,6
0
0,8
0 Diff. in mean LL, 95% CI UL, 95% CI pSource
Triglycerides mean differences (nmol/L)
-1.2 -1.0 -0.8 -0.6 -0.4 -0.2 0 0.2 0.4 0.6 0.8
-0,48 -0,82 -0,14 0,01
-0,80 -1,08 -0,52 0,00
0,00 -0,43 0,43 1,00
-0,25 -0,65 0,15 0,22
-0,10 -0,79 0,59 0,78
-0,52 -0,98 -0,06 0,03
-0,40 -0,66 -0,14 0,00
Effects of TRT on metabolic parameter in patients with MetS
Corona et al., Best Pract Clin Endocrinol & Metab 2013;27;557
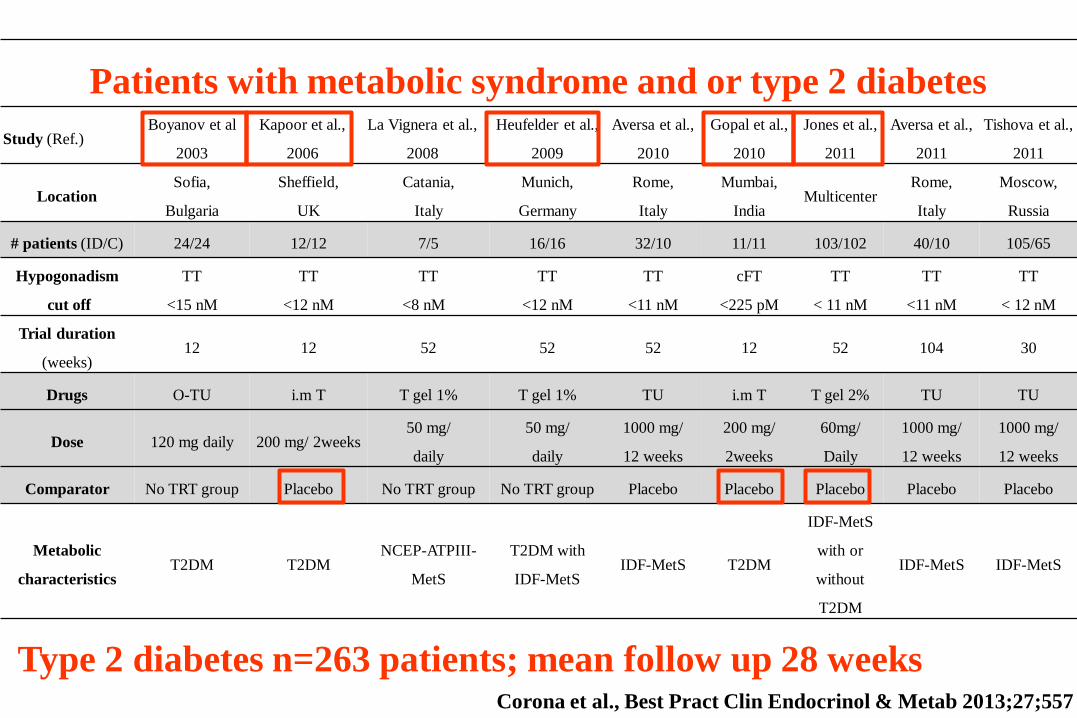
Type 2 diabetes n=263 patients; mean follow up 28 weeks Corona et al., Best Pract Clin Endocrinol & Metab 2013;27;557
Patients with metabolic syndrome and or type 2 diabetes
Study (Ref.) Boyanov et al
2003
Kapoor et al.,
2006
La Vignera et al.,
2008
Heufelder et al.,
2009
Aversa et al.,
2010
Gopal et al.,
2010
Jones et al.,
2011
Aversa et al.,
2011
Tishova et al.,
2011
Location Sofia,
Bulgaria
Sheffield,
UK
Catania,
Italy
Munich,
Germany
Rome,
Italy
Mumbai,
India Multicenter
Rome,
Italy
Moscow,
Russia
# patients (ID/C) 24/24 12/12 7/5 16/16 32/10 11/11 103/102 40/10 105/65
Hypogonadism
cut off
TT
<15 nM
TT
<12 nM
TT
<8 nM
TT
<12 nM
TT
<11 nM
cFT
<225 pM
TT
< 11 nM
TT
<11 nM
TT
< 12 nM
Trial duration
(weeks) 12 12 52 52 52 12 52 104 30
Drugs O-TU i.m T T gel 1% T gel 1% TU i.m T T gel 2% TU TU
Dose 120 mg daily 200 mg/ 2weeks 50 mg/
daily
50 mg/
daily
1000 mg/
12 weeks
200 mg/
2weeks
60mg/
Daily
1000 mg/
12 weeks
1000 mg/
12 weeks
Comparator No TRT group Placebo No TRT group No TRT group Placebo Placebo Placebo Placebo Placebo
Metabolic
characteristics T2DM T2DM
NCEP-ATPIII-
MetS
T2DM with
IDF-MetS IDF-MetS T2DM
IDF-MetS
with or
without
T2DM
IDF-MetS IDF-MetS
Effects of TRT on metabolic parameter in patients with T2DM
Corona et al., Best Pract Clin Endocrinol & Metab 2013;27;557

Effects of TRT on metabolic parameter in patients with T2DM
Favours TRT Favors no TRT
-4,0
0
-3,0
0
-2,0
0
-1,0
0
0,0
0
1,0
0
2,0
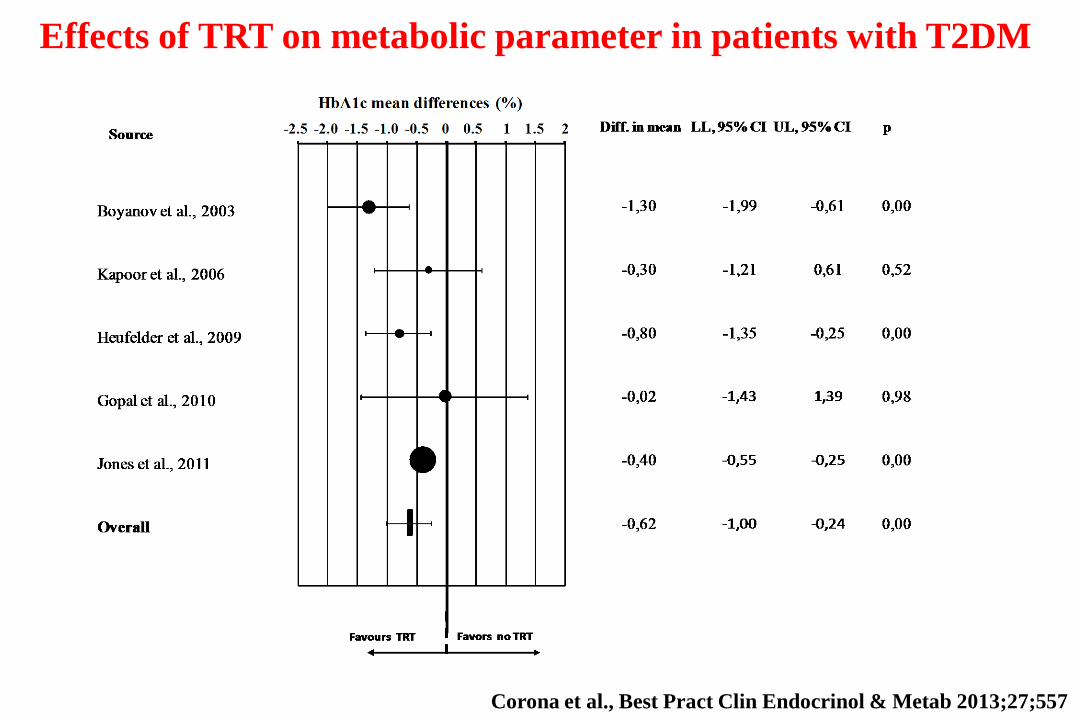
0 Diff. in mean LL, 95% CI UL, 95% CI pSource
Glycaemia mean differences (mmol/L)
-4 -3 -2 -1 0 1 2
Boyanov et al., 2003
Kapoor et al., 2006
Heufelder et al., 2009
Gopal et al., 2010
Jones et al., 2011
Overall
-2,00 -3,09 -0,91 0,00
-1,35 -3,33 0,63 0,18
-0,60 -1,15 -0,05 0,03
-1,98 -3,66 -0,30 0,02
-0,17 -1,42 1,08 0,79
-1,09 -1,84 -0,35 0,00
Corona et al., Best Pract Clin Endocrinol & Metab 2013;27;557
Effects of TRT on metabolic parameter in patients with T2DM
Favours TRT Favors no TRT
Boyanov et al., 2003
Kapoor et al., 2006
Heufelder et al., 2009
Gopal et al., 2010
Jones et al., 2011
Overall
-2,0
0
-1,5
0
-1,0
0
-0,5
0
0,0
0
0,5
0
1,0
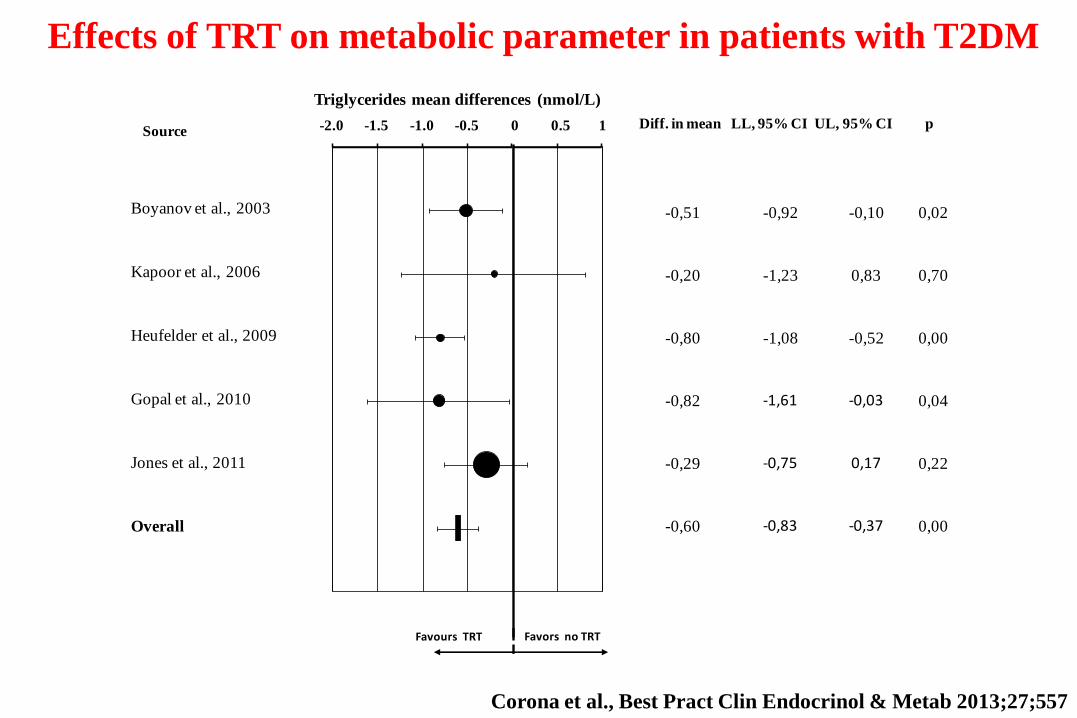
0 Diff. in mean LL, 95% CI UL, 95% CI pSource
Triglycerides mean differences (nmol/L)
-2.0 -1.5 -1.0 -0.5 0 0.5 1
-0,51 -0,92 -0,10 0,02
-0,20 -1,23 0,83 0,70
-0,80 -1,08 -0,52 0,00
-0,82 -1,61 -0,03 0,04
-0,29 -0,75 0,17 0,22
-0,60 -0,83 -0,37 0,00
Corona et al., Best Pract Clin Endocrinol & Metab 2013;27;557
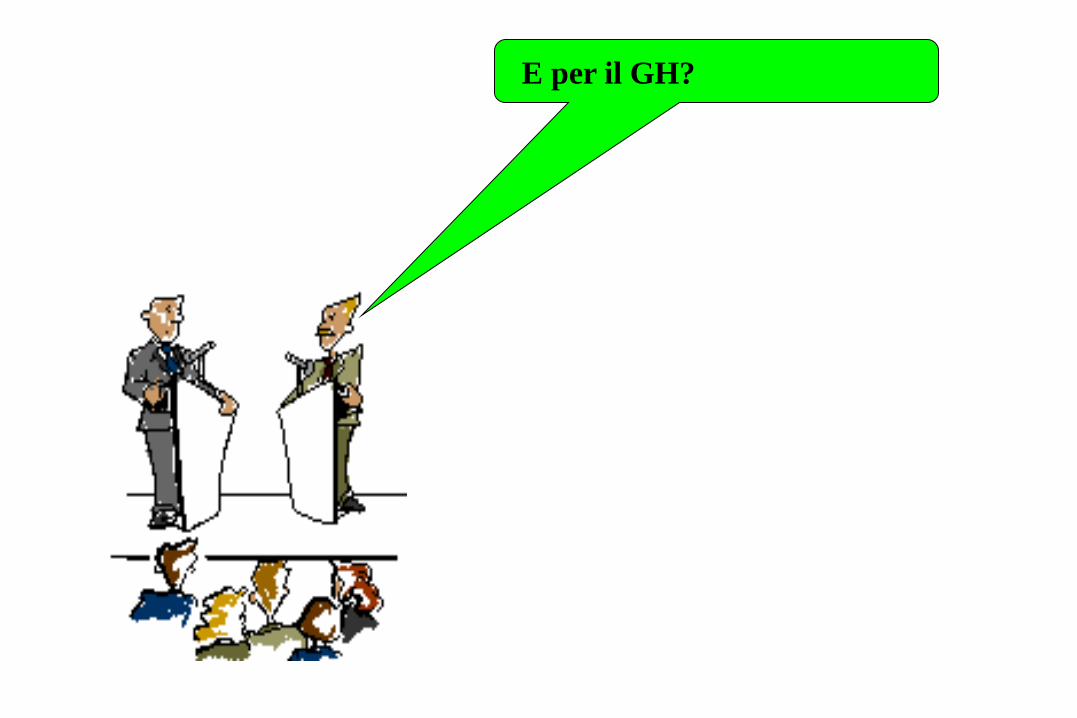
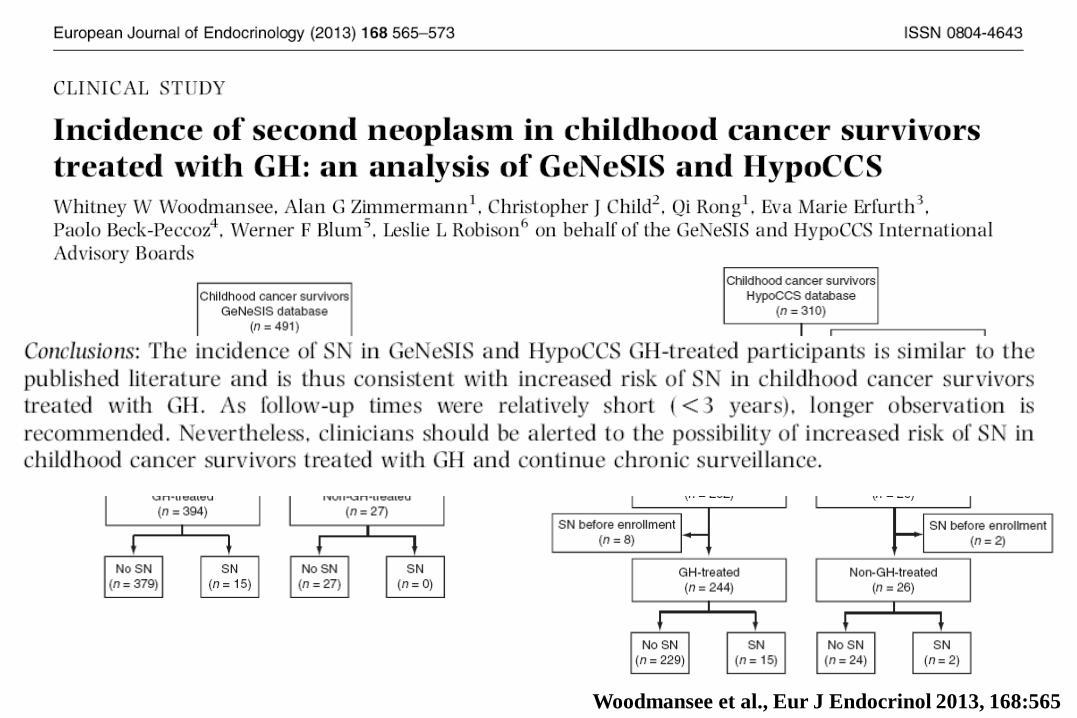
E per il GH?
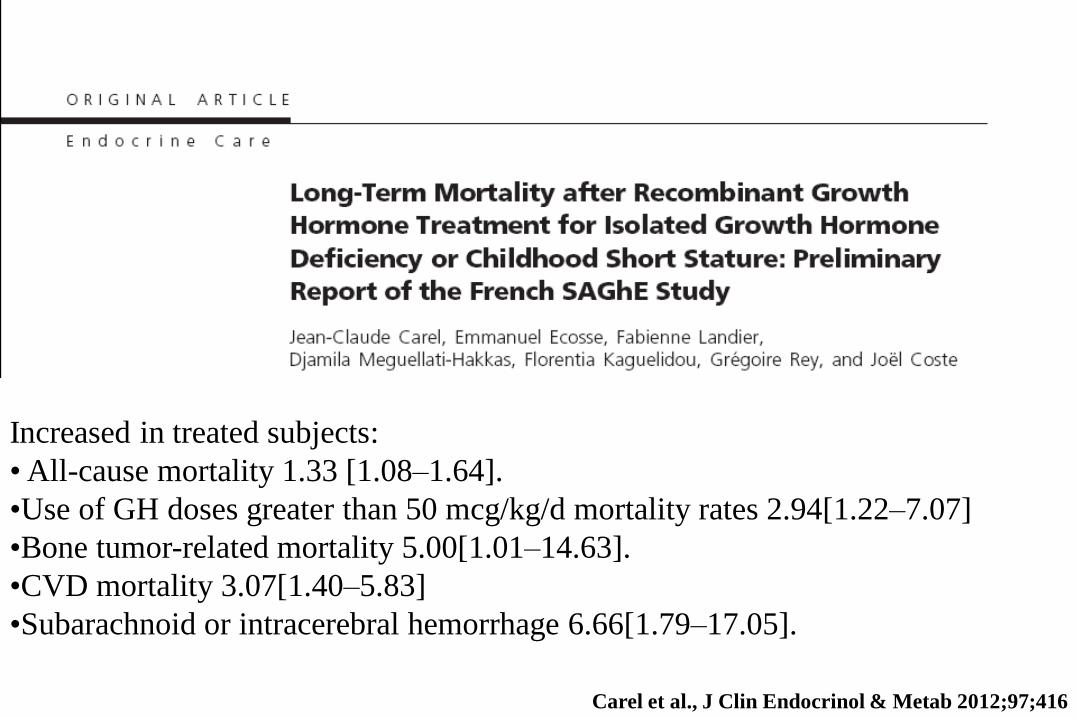
Increased in treated subjects:
• All-cause mortality 1.33 [1.08–1.64].
•Use of GH doses greater than 50 mcg/kg/d mortality rates 2.94[1.22–7.07]
•Bone tumor-related mortality 5.00[1.01–14.63].
•CVD mortality 3.07[1.40–5.83]
•Subarachnoid or intracerebral hemorrhage 6.66[1.79–17.05].
Carel et al., J Clin Endocrinol & Metab 2012;97;416

The Hypopituitary Control and Complications Study (HypoCCS), a global post-
marketing surveillance study conducted by Eli Lilly and Company, monitored
clinical outcomes of adult GH-deficient (GHD) patients
Mo et al., Pituitary 2013, 12 Oct [Epub ahead of print]
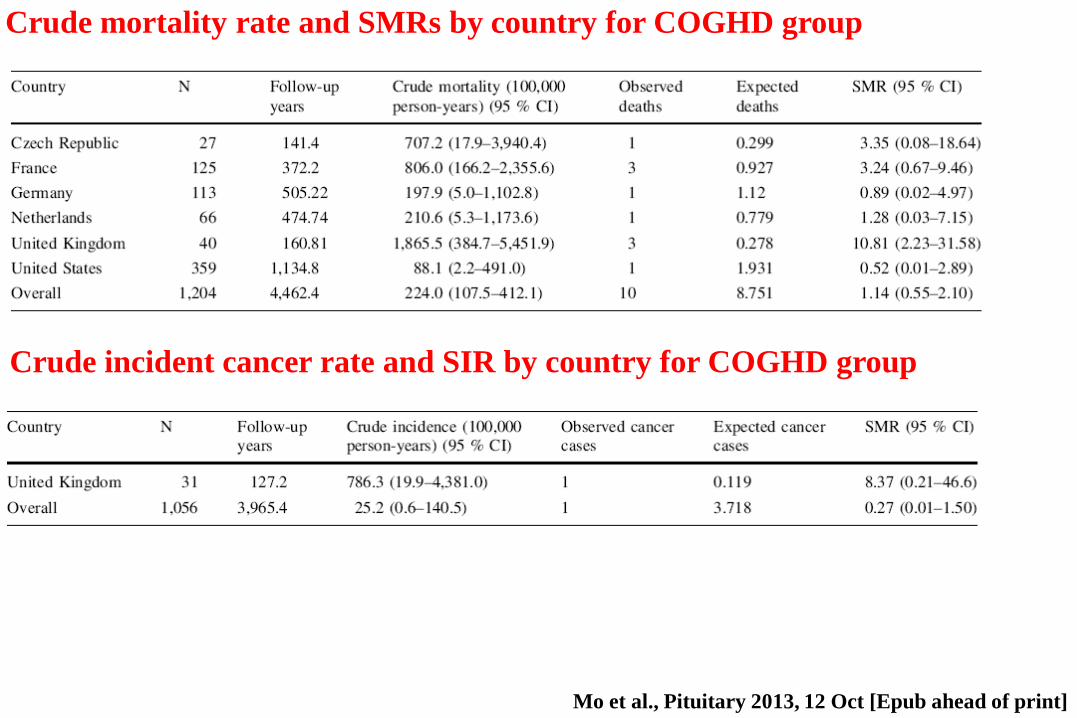
Mo et al., Pituitary 2013, 12 Oct [Epub ahead of print]
Crude mortality rate and SMRs by country for COGHD group
Crude incident cancer rate and SIR by country for COGHD group
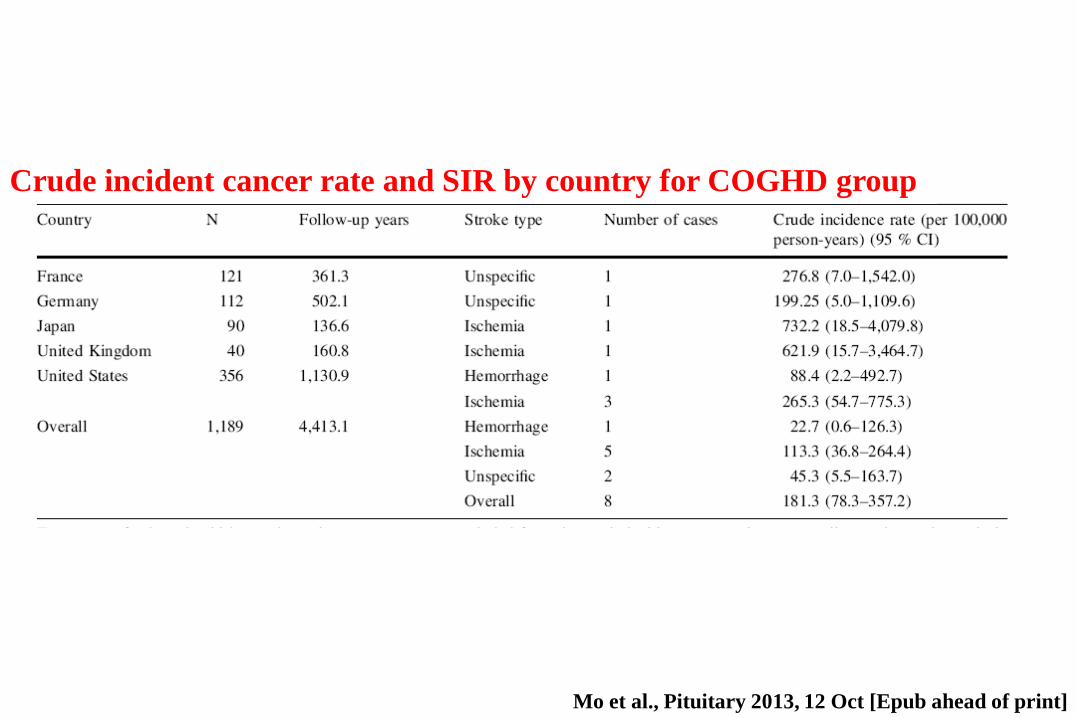
Crude incident cancer rate and SIR by country for COGHD group
Mo et al., Pituitary 2013, 12 Oct [Epub ahead of print]

Woodmansee et al., Eur J Endocrinol 2013, 168:565
Woodmansee et al., Eur J Endocrinol 2013, 168:565