BUSINESS TRAVEL SURVEY 2016 - Gruppo Uvet · TENDENZE GENERALI DI SPESA Trasferte e spese 06 VIAGGI...
25
BUSINESS TRAVEL SURVEY 2016 MARCH 2016 - DIGITALRELEASE BUSINESS TRAVEL SURVEY 2016 MARCH 2016 - DIGITAL RELEASE 2015: … I DATI PIÙ SIGNIFICATIVI DEL PRIMO SEMESTRE 2014 ANDAMENTO DEL NUMERO DI TRASFERTE E DELLE SPESE DI VIAGGIO Numero indice base 1° Semestre 2013 UVET TRAVEL INDEX The European House Ambrosetti 04 TENDENZE GENERALI DI SPESA Trasferte e spese 06 VIAGGI D’AFFARI Le mete intercontinentali 11 13 14 D’AFFARI: FOCUS ON RAIL 15 SOMMARIO 100 89 106 93 113 98 100 88 103 89 104 92 80 100 120 1° Sem. 2013 2° Sem. 2013 1° Sem. 2014 2° Sem. 2014 1° Sem. 2015 2° Sem. 2015 Num Trasferte Spese di Viaggio BUSINESS TRAVEL SURVEY di Uvet American Express UVET AMERICAN EXPRESS … … … TREND DI SPESA BIGLIETTERIA AEREA … HOTELLERIE … RAIL …. Business Travel
-
Upload
nguyenthuy -
Category
Documents
-
view
215 -
download
0
Transcript of BUSINESS TRAVEL SURVEY 2016 - Gruppo Uvet · TENDENZE GENERALI DI SPESA Trasferte e spese 06 VIAGGI...
BUSINESS TRAVEL
SURVEY 2016 MARCH 2016 - DIGITALRELEASE
BUSINESS TRAVEL
SURVEY 2016
MARCH 2016 - DIGITAL RELEASE
2015: …
I DATI PIÙ SIGNIFICATIVI DEL PRIMO SEMESTRE 2014
ANDAMENTO DEL NUMERO DI TRASFERTE E DELLE SPESE DI VIAGGIO Numero indice base 1° Semestre 2013
UVET TRAVEL INDEX
The European House Ambrosetti 04
TENDENZE GENERALI DI SPESA
Trasferte e spese 06
VIAGGI D’AFFARI
Mix di Spesa 08
VIAGGI D’AFFARI: FOCUS ON AIR
Le spese 09
Le mete intercontinentali 11
Le mete europee 13
Le mete domestiche 14
VIAGGI D’AFFARI: FOCUS ON RAIL
Le spese 15
VIAGGI D’AFFARI: FOCUS ON HOTEL
Le spese 17
Le principali destinazioni 18
SOMMARIO
100
89
106
93
113
98
100
88
103
89
104
92
80
100
120
1° Sem. 2013 2° Sem. 2013 1° Sem. 2014 2° Sem. 2014 1° Sem. 2015 2° Sem. 2015
Num Trasferte Spese di Viaggio BUSINESS TRAVEL SURVEY di Uvet American Express
UVET AMERICAN EXPRESS
…
… …
TREND DI SPESA
…
BIGLIETTERIA AEREA
…
HOTELLERIE
…
RAIL
….
UVET TRAVEL INDEX
…
Business Travel

BUSINESS TRAVEL
SURVEY 2016 MARCH 2016 - DIGITALRELEASE
2
BUSINESS TRAVEL
SURVEY 2016 MARCH 2016 - DIGITALRELEASE
A COMPLETE PANORAMA ON BUSINESS TRAVEL AND
THE ECONOMIC CYCLE
3
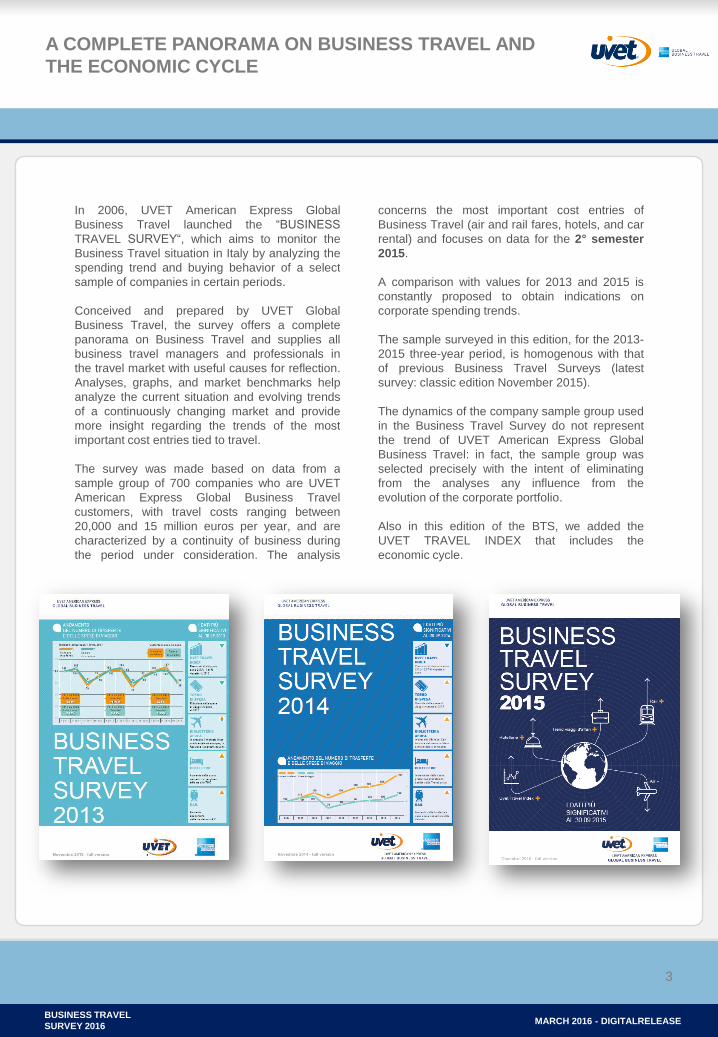
In 2006, UVET American Express Global
Business Travel launched the “BUSINESS
TRAVEL SURVEY“, which aims to monitor the
Business Travel situation in Italy by analyzing the
spending trend and buying behavior of a select
sample of companies in certain periods.
Conceived and prepared by UVET Global
Business Travel, the survey offers a complete
panorama on Business Travel and supplies all
business travel managers and professionals in
the travel market with useful causes for reflection.
Analyses, graphs, and market benchmarks help
analyze the current situation and evolving trends
of a continuously changing market and provide
more insight regarding the trends of the most
important cost entries tied to travel.
The survey was made based on data from a
sample group of 700 companies who are UVET
American Express Global Business Travel
customers, with travel costs ranging between
20,000 and 15 million euros per year, and are
characterized by a continuity of business during
the period under consideration. The analysis
concerns the most important cost entries of
Business Travel (air and rail fares, hotels, and car
rental) and focuses on data for the 2° semester
2015.
A comparison with values for 2013 and 2015 is
constantly proposed to obtain indications on
corporate spending trends.
The sample surveyed in this edition, for the 2013-
2015 three-year period, is homogenous with that
of previous Business Travel Surveys (latest
survey: classic edition November 2015).
The dynamics of the company sample group used
in the Business Travel Survey do not represent
the trend of UVET American Express Global
Business Travel: in fact, the sample group was
selected precisely with the intent of eliminating
from the analyses any influence from the
evolution of the corporate portfolio.
Also in this edition of the BTS, we added the
UVET TRAVEL INDEX that includes the
economic cycle.
BUSINESS TRAVEL
SURVEY 2016 MARCH 2016 - DIGITALRELEASE
Uvet Travel Index
4
WHAT IS AND HOW WAS THE UVET TRAVEL INDEX CREATED
UVET, a leader in Italy for innovative business and leisure travel services and solutions, was the first to observe a
relationship between business travel trends (that indicate corporate business activities) and the country's economic activity.
Over the years, UVET identified the business travel sector's natural capacity to represent economic trends "in real time".
On the basis of these considerations, UVET decided to use statistical data in its possession to determine, with the
professional and scientific contribution of the innovative indicator The European House-Ambrosetti, the UVET Travel
Index, which is the only one of its kind and is able to provide decision-makers and travel professionals with information
about the country's economic activities.
Since 2011, the UVET Travel Index has been calculated quarterly and is one of the informative, forecasting tools that
UVET places at the disposal of travel professionals, government agencies and institutions, and the public.
Its indicators can almost instantaneously provide information about the economic cycle, far in advance of official data,
which is an important element for steering corporate decisions and investments and for better planning the development of
business and industry in the country.
On a methodological level, the UVET Travel Index is a multivariate statistical-econometric model that estimates the Italian
economic trend based on the dynamics of business travel, processing a "big data" database on business travel containing
over 3.6 million pieces of information registered from January 1, 2006 up to the present day.
Presented for the first time at the 2012 edition of Biz Travel Forum, an important B2B event in Italy for Mobility, Events and
Tourism, the UVET Travel Index has since acquired a great reputation and widespread diffusion, not only among
travel professionals. It is an important indicator in terms of the prospects for the Italian economy, having demonstrated its
great reliability over time and ability to forecast the economic cycle.
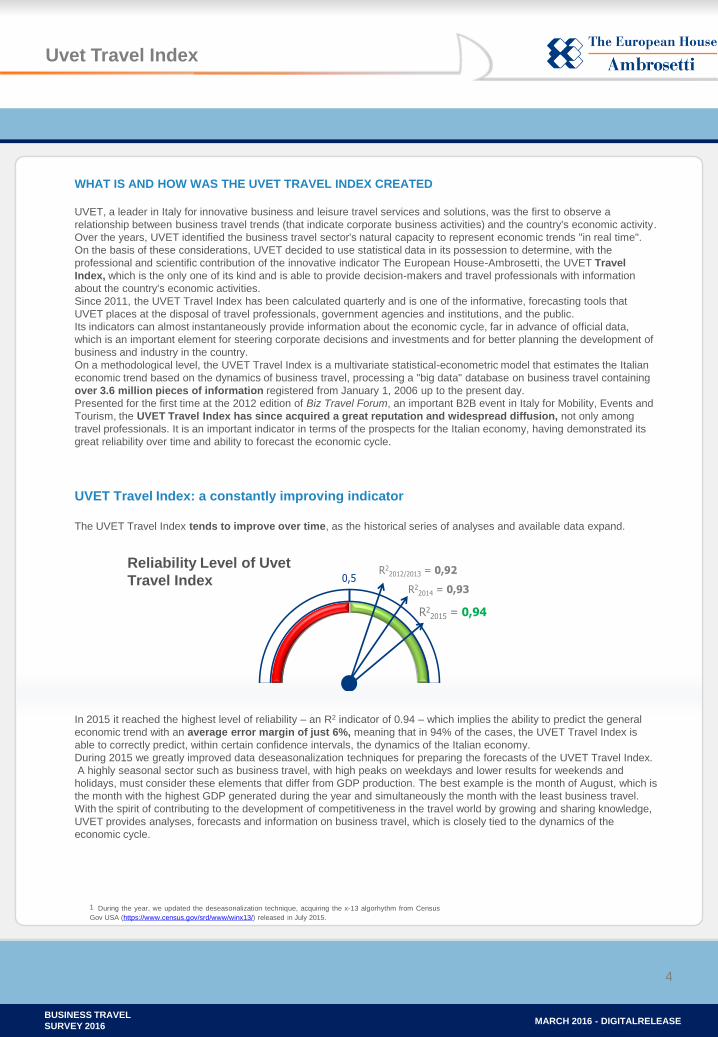
UVET Travel Index: a constantly improving indicator
The UVET Travel Index tends to improve over time, as the historical series of analyses and available data expand.
In 2015 it reached the highest level of reliability – an R2 indicator of 0.94 – which implies the ability to predict the general
economic trend with an average error margin of just 6%, meaning that in 94% of the cases, the UVET Travel Index is
able to correctly predict, within certain confidence intervals, the dynamics of the Italian economy.
During 2015 we greatly improved data deseasonalization techniques for preparing the forecasts of the UVET Travel Index.
A highly seasonal sector such as business travel, with high peaks on weekdays and lower results for weekends and
holidays, must consider these elements that differ from GDP production. The best example is the month of August, which is
the month with the highest GDP generated during the year and simultaneously the month with the least business travel.
With the spirit of contributing to the development of competitiveness in the travel world by growing and sharing knowledge,
UVET provides analyses, forecasts and information on business travel, which is closely tied to the dynamics of the
economic cycle.
1 During the year, we updated the deseasonalization technique, acquiring the x-13 algorhythm from Census
Gov USA (https://www.census.gov/srd/www/winx13/) released in July 2015.
0R2
2012/2013 = 0,92
Livello di affidabilitàdell’Uvet Travel Index
0,5R2
2014 = 0,93
R22015 = 0,94
Reliability Level of Uvet
Travel Index

BUSINESS TRAVEL
SURVEY 2016 MARCH 2016 - DIGITALRELEASE
Uvet Travel Index
5
Source: TEH-Ambrosetti processing
END-OF-YEAR FORECASTS FOR 2015
On the basis of the final data from the 4th quarter of 2015, the UVET Travel Index predicts +0.2% economic growth.
As can be seen in the following graph, from the lowest point in the second quarter of 2014, the UVET Travel Index began
a gradual, slow climb, anticipating data on economic growth in Italy, which occurred in the following quarters.
Graph 1 – Comparison of the actual GDP and the UVET Travel Index
In 2015 the value of the UVET Travel Index was also confirmed in terms of forecasts, having predicted at the end of
2014 renewed growth in 2015.
The 2015 UVET Travel Index's final forecast for the GDP is +0.8%.
THE ECONOMIC SCENARIO OF REFERENCE FOR 2016
As we presented at the BIZ Travel Forum, according to the OCSE, growth of the global GDP should accelerate to 3.6%
in 2016 (vs. 2.9% in 2015). This growth is favored by prospects of improvement in the economies of advanced countries,
especially in the USA, Europe and Japan.
Nevertheless, increased concern about growth and imbalances created by financial flows on a global level emerged
between December and February.
In particular, renewed concern for the weakness of emerging economies is greatly affecting the expansion of global
trade – which continues to underperform compared to forecasts – and is contributing to a significant reduction in the
price of raw materials. Between January and February 2016, oil, for example, reached a new low of 26 Dollars a barrel
(vs. 70 Dollars in July 2015 and 110 Dollars in July 2014), which is lower than the minimum levels reached in the most
acute phase of the 2008 crisis.
If, on one hand, this is equivalent to a small expansive maneuver for developed countries that pay less for raw materials
and increase their buying power, on the other hand it increases the financial risks of emerging and oil-exporting countries
(Brazil, Russia, the Middle East, etc.), where the sale of oil is an essential element for balancing national budgets.
Since emerging economies have acquired considerable importance in the global economy in recent years, with less
revenue from oil they are forced to cut national budgets, which decreases the demand. This affects developed
economies in terms of fewer opportunities for exportation to those countries and generally determines a negative effect
on international trade.
In early 2016, significant new tensions emerged on China's financial market, accompanied by fears for the
economic situation. There is growing mistrust in the correctness and reliability of data from Chinese government sources
concerning the trend of the Chinese economy and the financial maneuvers by the government and Chinese Central
Bank.
UVET Travel Index
IV quarter 2015 vs. III quarter: +0.20%
End of year 2015: +0.80%

BUSINESS TRAVEL
SURVEY 2016 MARCH 2016 - DIGITALRELEASE
Uvet Travel Index
6
If, on one hand, the Chinese government announces its determination to transform the Chinese export-based economy
into an economy based more on domestic consumption to align itself with western economics and a more sustainable
path over time, in reality the depreciation of the Yuan, which aims to make Chinese products more competitive on
international markets, heads in the opposite direction. This has triggered a significant flight of capital from China: 450
billion dollars exited the country in the period from August to December 2015 and 100 billion dollars left China in just the
month of January 2016, in fear of further depreciation in the coming months.
Growth continues in the Euro area, but remains fragile and continues to be hindered by prospects of limited growth
in emerging countries, the volatility of financial markets, necessary adjustments to the budget in various economic
sectors, and slow implementation of structural reforms. Overall, growth in Europe should be +1.8% in 2016.
Source: The European House – Ambrosetti processing based on International Monetary Fund data, 2015
In particular, weakness in the foreign demand and dropping oil prices have contributed to the appearance of new risks of
a setback for inflation and a decline in growth, which became more evident between December 2015 and February
2016.
To cope with these fears, the European Central Bank introduced expansive measures in December (reducing the
interest rate on deposits by 0.10%) and expanded its bond buying program up until March 2017 (vs. September 2016).
In Italy, the demand is gradually recovering, and the boost from exports, which sustained economic activity in past
quarters, has been joined by a progressive renewal of the domestic demand favored by a resurgence in consumption
and a replenishment of stock. Besides the slight upswing in the manufacturing industry, there are also signs of growth in
the services industry. Meanwhile, after a prolonged downturn, the construction industry has stabilized.
In the summer and fall months, the number of employed people continued to grow, especially among young people and
in the services industry. More people were hired with full-time permanent contracts. The unemployment rate dropped to
11.4% in December 2015, which was the lowest since the end of 2012. A reduction in youth unemployment is positive
but, in any case, still remains at historically high levels.
Indications from the Bank of Italy show how recovery can further improve and amply extend to consumption by families
and companies in various economic sectors and investments.
In this context, on the basis of the predicted trends of Business Travel Managed, the UVET Travel Index indicates a
+1.6% growth in GDP in 2016.
+1,0%
+2,3%
+2,2%
+1,2%
+1,9%
- 1,3%
+1,6%
Stime crescita PIL 2016 (in termini reali)
+1,3%
Estimated GDP Growth
2016 (in real terms)

BUSINESS TRAVEL
SURVEY 2016 MARCH 2016 - DIGITALRELEASE
Uvet Travel Index
7
Fonte: elaborazione The European House – Ambrosetti
If this figure is confirmed during the upcoming year, we can affirm that stagnation and low growth are finally
behind us. UVET data, which historically has a high correlation with the real economy, is encouraging in this
particular case.
Finally, it is a good idea to remember that these predictions present risks of a downturn that Italian, European, and
international authorities of economic policies must prevent.
A 20 to 40% plunge of most international financial markets between January and February once again highlighted
the concern associated with the international economic situation, particularly to the possibility that the sluggishness
of emerging economies and China may be more pronounced and longer lasting than first hypothesized and could
have strong repercussions on the world's currencies and financial stability.
The authorities of monetary policies, especially the European Central Bank (BCE), must at the same time decisively
deal with the risks of a downward trend for inflation, which could derive from a lower than expected growth in
demand and from further dips in the price of raw materials, if these would trigger retroactive effects on the dynamic of
salaries.
To achieve recovery, an essential element in Italy and the Euro area is preserving the trust of families, companies,
and financial professionals and pursuing policies to support the economic cycle with determination.
THE FUNDAMENTALS OF GROWTH IN ITALY: FALSE MYTHS AND REALITY
What is the relaunch of growth in Italy based upon? What are its strengths to be used to favor recovery?
In recent years on an international level but also in Italy, besides the objective shortcomings and delays of our country,
an erroneous story has emerged that is in part one-sided and has found consensus in the continuous representation of
self-sustaining clichés or "false myths".
A first example is the excessive penalization of Italy in international classifications on competitiveness and pro-
business orientation. Besides the objective critical situations that must be solved, part of Italy's lesser appeal compared
to competitors is also influenced by the negative image projected by these rankings that negatively impact the dynamics
of tourism, foreign investments, and international trade.
Graph 1 – Comparison between the real GDP and the UVET Travel Index
UVET Travel Index
2016 ESTIMATE
+1.6%

BUSINESS TRAVEL
SURVEY 2016 MARCH 2016 - DIGITALRELEASE
Italian competitiveness
8
Source: The European House – Ambrosetti on Financial Markets Workshop – WEF, 2014 – Doing
Business Report, 2016
While conscious of the well-known problems of Italy, it must be stressed that these classifications do not paint a real
picture of the situation because they are often based on sample and/or qualitative surveys.
One only needs to look at a few entries such as taxation, where we are ranked behind Iraq; the correctness of auditing
and account rendering, where we are behind Zimbabwe and Ruanda; or the quality of the educational system, that
places us behind Ghana. These countries are ranked above Italy yet their pro-capita incomes are only 25 to 30% of
Italian incomes, their healthcare system struggles to distribute the most common medications, and a consistent part of
their population cannot read or write.
It is evident that this portrayal is wrong and excessively penalizing. It is important to monitor classifications and provide
correct information to the people who produce these classifications, also in respect of international investors and citizens.
For example, at a recent meeting at the Italian Embassy in Tokyo the President and CEO of Hitachi said, “Italian
students and researchers are among the best in the world, better than those in France and Germany. Acquiring an
Italian company allows us to attract Italian students and researchers and to work with them."
On this same theme, the scientific results achieved on an international level show how Italian researchers offer a great
contribution in terms of quality research, ranking first in terms of number of references per Euro spent.
18 November 2015.
2 18 novembre 2015.
Source: The European House – Ambrosetti based on Scimago data, 2015
Of 114 variables analyzed, Italy
appears weak in:
•Correctness of auditing and
accounts rendering: 99 – after
Zimbabwe (38), Botswana (43),
Uruguay (46), Rwanda (63), Nigeria
(88)
•Global quality of infrastructures: 56
– After Slovenia (34), Namibia (42),
Croatia (44), Azerbaijan (47)
•Quality of the educational system:
67 – after Malaysia (10), Lebanon (28),
Zimbabwe (43), Ghana (59), Romania
(61)
Of 11 variables analyzed, Italy
appears weak in:
•Ease in doing business: 45 –
after Singapore (1), Macedonia (12),
Poland (25), Montenegro (46)
•Enforcing contract: 111 – after
Singapore (1), Paraguay (75), Peru
(69)
•Taxation: 137 – after South Africa
(20), Rwanda (48), Azerbaijan (34),
Iraq (59)
Country Nr. of Researchers Nr. of citations Citations per Citations
(thousands) (thousands) 1000 researchers per Euro
Italy
Germany
Canada
France
United States
Sweden
Netherlands
Denmark
Belgium
United Kingdom

BUSINESS TRAVEL
SURVEY 2016 MARCH 2016 - DIGITALRELEASE
Italian competitiveness
9
This evidently clashes with the classifications that rank Italy's educational system behind those of countries such as
Ghana and Zimbabwe.
Another example regards the perception of the Italian debt, which is seen as constantly growing and higher than other
countries. Taking a closer look at reality, evidence shows that the share of Italian public debt in the total figure for
European debt continues to decrease.
Starting in 1995, the weight of Italy's public debt has declined on the total Euro Zone debt. In 1995 it was at 28.7%, while
today it is at 22.1%.
In addition, the increase of the GDP/debt ratio in Italy has been lower than that of all the other European countries since
the Euro was introduced.
Source: The European House – Ambrosetti based on data from Fondazione
Symbola and Fondazione Edison, 2013
125,9 127,2 132,7 139,5
162,9 167,8 171,2
214,4226,7
258,8
Italia
Germ
ania
Ola
nda
Fin
landia
Fra
nci
a
USA
Spagna
Gia
ppone
Regno U
nito
Port
ogallo
Andamento del rapporto debito/PIL (anno base 2000=100), 2014
The European House – Ambrosetti based on data from OECD, 2015
We nevertheless realize that Italy has a very high national debt and this debt must be reduced, but presenting Italy as a
country incapable of managing its accounts with a ballooning, uncontrolled debt is plain wrong.
Another false "myth" concerns the unstoppable deindustrialization of Italy. Italy remains a world champion of
manufacturing, and the ability of its companies to remain competitive on the market is an objective fact that is often
ignored and not promoted enough.
If on one hand there have been painful company closings, on the other hand it is important to point out that Italy is one of
the five countries in the world – together with China, Germany, Japan and South Korea – with a manufacturing surplus
exceeding 100 billion dollars, and it is the second country in Europe for manufacturing added value, ahead of France, the
United Kingdom and Spain.
Trend of debt/GDP ratio
(annual base 2000=100), 2015
Italy
Germ
any
Neth
erland s
Fin
land
Fra
nce
US
A
Spain
Japan
UK
Port
ugal

BUSINESS TRAVEL
SURVEY 2016 MARCH 2016 - DIGITALRELEASE
Italian competitiveness
10
Finally, if Italy is barely competitive and such an inhospitable country for investments, the people who believe this theory
should explain why Italy is the second country in the world after the United States for reshoring.
Reshoring is a phenomenon that occurs when a company decides to bring its production lines back to the country, after
delocalization, re-evaluating the costs and benefits that caused it to transfer its business offshore to other countries.
Source: The European House – Ambrosetti
The European House – Ambrosetti on data from Uni Club More Back-Reshoring
In short, recognizing the limits, critical elements, and many areas of improvement on which Italy must take action to
increase its competitiveness, it is essential to simultaneously point out the strengths upon which a more inclusive,
competitive and sustainable future can be built.
Valore aggiunto prodotto dall’industria manifatturiera (miliardi di Euro)
125,9
172
187,3
216,5
535,2
Spagna
Regno Unito
Francia
Italia
Germania
46,5%
21,0%
10,4% 9,8%6,1%
2% 4,0%
USA Italia Germania RegnoUnito
Francia Paesi Bassi Altri Paesi
Distribuzione del fenomeno reshoring per Paese, valori percentuali
Germany
Italy
France
United Kingdom
Spain
Added value produced by the
manufacturing industry (billions of Euro)
Distribution of the reshoring phenomenon per country,
in percentages
USA Italy Germany UK France Netherlands Other Countries

BUSINESS TRAVEL
SURVEY 2016 MARCH 2016 - DIGITALRELEASE
TRAVEL COST GENERAL TRENDS
11
The average cost per transfer has
dropped, which confirms the trend, also
in the 2nd semester of 2015. Compared
to 2014, the cost dropped by 2%, which
is 4 euros in monetary terms.
If we observe the behavior of the
average cost per transfer in the past
three years, we see that the cost has
decreased by 5%, which is 13 euros in
monetary terms.
TREND OF NUMBER OF TRANSFERS AND TRAVEL COSTS (base index number 1° Semester 2013)
AVERAGE COST PER TRANSFER (Euros)
260 257
253
248
241
244
230
240
250
260
270
1° Sem. 2013 2° Sem. 2013 1° Sem. 2014 2° Sem. 2014 1° Sem. 2015 2° Sem. 2015
Average cost per transfers BUSINESS TRAVEL SURVEY di UVET Global Business Travel
100 89
106
93
113
98 100
88
103
89
104
92
80
100
120
1° Sem. 2013 2° Sem. 2013 1° Sem. 2014 2° Sem. 2014 1° Sem. 2015 2° Sem. 2015
Nr. Transfers
Travel Costs BUSINESS TRAVEL SURVEY di UVET Global Business Travel
The number of transfers and travel
costs are constantly growing.
Considering the latest three-year
period, from 2013 to 2015, transfers
have increased by 10%, while costs
have risen by 4.5%.
The same trend registered a 5%
increase in transfers and a 3% increase
in travel costs in the second semester
of 2015.

BUSINESS TRAVEL
SURVEY 2016 MARCH 2016 - DIGITALRELEASE
TRAVEL COST GENERAL TRENDS
12
Travel costs in 2015 increased for
Hotel and Rail services: both showed
an 11% increase compared to 2014.
Air service remains stable compared to
the 2nd semester of 2014, while the Car
service cost dropped slightly, by 1%.
TREND OF NUMBER OF TRANSFERS PER SERVICE TYPE (Base index nr. 1° Sem. 2013)
TREND OF TRAVEL COSTS PER SERVICE TYPE (Base index nr. 1° Sem. 2013)
100
86
98
84
98
82
100
89
106
94
110
99 100
90
110
101
132
117
100
94
108
101 110
97
80
90
100
110
120
130
140
1° Sem. 2013 2° Sem. 2013 1° Sem. 2014 2° Sem. 2014 1° Sem. 2015 2° Sem. 2015
Air Hotel Rail Car BUSINESS TRAVEL SURVEY di UVET Global Business Travel
87
99
83
95
83
90
111
101
124
112
100
91
109
96
121
107 95 107
114
131
113
70
80
90
100
110
120
130
140
1° Sem. 2013 2° Sem. 2013 1° Sem. 2014 2° Sem. 2014 1° Sem. 2015 2° Sem. 2015
Air Hotel
Rail Car BUSINESS TRAVEL SURVEY di UVET Global Business Travel
The 2nd semester of 2015 registered
different trends based on the type of
service used during the trip.
Compared to 2014, Rail and Hotel
services increased by 16% and 5%,
respectively, while the number of
transfers by Car and Air decreased by
4% and 2%, respectively, over the past
twelve months.
The trend for the 2013-2015 three-year
period does not reflect the trend in the
past year. In fact, if we observe this
timeframe, all services recorded
growth.
BUSINESS TRAVEL
SURVEY 2016 MARCH 2016 - DIGITALRELEASE
BUSINESS TRAVEL: COSTS MIX
13
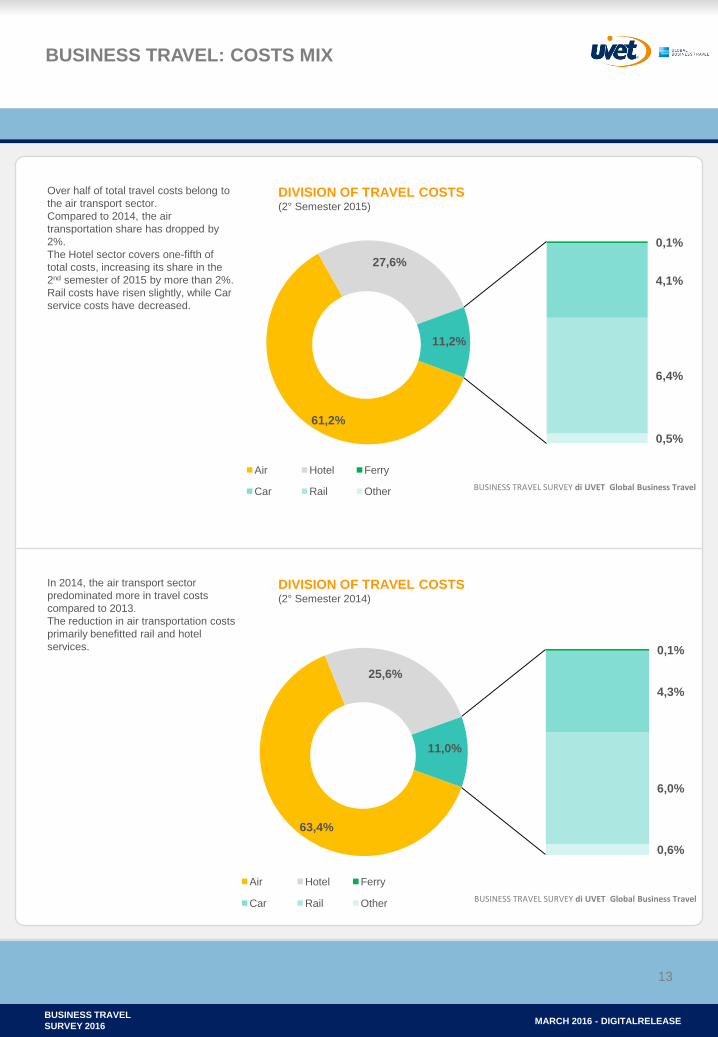
Over half of total travel costs belong to
the air transport sector.
Compared to 2014, the air
transportation share has dropped by
2%.
The Hotel sector covers one-fifth of
total costs, increasing its share in the
2nd semester of 2015 by more than 2%.
Rail costs have risen slightly, while Car
service costs have decreased.
In 2014, the air transport sector
predominated more in travel costs
compared to 2013.
The reduction in air transportation costs
primarily benefitted rail and hotel
services.
DIVISION OF TRAVEL COSTS (2° Semester 2015)
DIVISION OF TRAVEL COSTS (2° Semester 2014)
61,2%
27,6%
0,1%
4,1%
6,4%
0,5%
11,2%
Air Hotel Ferry
Car Rail Other BUSINESS TRAVEL SURVEY di UVET Global Business Travel
63,4%
25,6%
0,1%
4,3%
6,0%
0,6%
11,0%
Air Hotel Ferry
Car Rail Other BUSINESS TRAVEL SURVEY di UVET Global Business Travel

BUSINESS TRAVEL
SURVEY 2016 MARCH 2016 - DIGITALRELEASE
BUSINESS TRAVEL: COSTS OF AIR TRAVEL
FOCUS ON AIR
14
The trend in the number of air transfers
in 2015 remained stable. Travel costs,
however, decreased 2% compared to
2014.
Considering the 2013-2015 three-year
period, both variables registered a 5%
decrease compared to the 2nd
semester of 2014.
In the past 12 months, there was a
slight increase in the average cost of
air fare.
Considering the 2013-2015 three-year
period, the trend for the average air
fare cost decreased until the 1st
semester of 2015 and then it increased
in the 2nd semester, returning to the
value of 2013.
The cost of air fare increased by 1% in
2015.
TREND OF NUMBER OF TRANSFERS AND COSTS OF AIR
TRAVEL (Base index nr. 1° Semester 2013)
AVERAGE AIR FARE COST (Euros)
100
86
98 84
98
82
100
87
99
83
95 83
60
80
100
120
1° Sem. 2013 2° Sem. 2013 1° Sem. 2014 2° Sem. 2014 1° Sem. 2015 2° Sem. 2015
Nr. Transfers
Travel costs BUSINESS TRAVEL SURVEY di UVET Global Business Travel
418
422 420
416
406
422
400
410
420
430
1° Sem. 2013 2° Sem. 2013 1° Sem. 2014 2° Sem. 2014 1° Sem. 2015 2° Sem. 2015
Average air fare cost BUSINESS TRAVEL SURVEY di UVET Global Business Travel

BUSINESS TRAVEL
SURVEY 2016 MARCH 2016 - DIGITALRELEASE
BUSINESS TRAVEL: COSTS OF AIR TRAVEL
FOCUS ON AIR
15
Travel costs in the 2nd semester 2015
decreased for national and European
transportation by, respectively, 2.5%
and 4%, while it increased for
intercontinental travel.
Besides being affected by the
economic crisis in Europe, the national
segment is also affected by competition
from rail transportation. That brought
about a reduction in domestic travel
costs compared to the number of
transfers, indicating a lower average
ticket price.
TREND OF NUMBER OF AIR TRANSFERS PER TYPE (Base index nr. 1° Sem. 2013)
100
87 99
85
100
89
100
87
101
82
94
79
100
86
96
83 89 81
60
80
100
120
1° Sem. 2013 2° Sem. 2013 1° Sem. 2014 2° Sem. 2014 1° Sem. 2015 2° Sem. 2015
Intercontinental
European
Domestic BUSINESS TRAVEL SURVEY di UVET Global Business Travel
100
87
101
86
102
87
100
88
105
89
104
87 100
84
93
79
92
78
60
80
100
120
1° Sem. 2013 2° Sem. 2013 1° Sem. 2014 2° Sem. 2014 1° Sem. 2015 2° Sem. 2015
Intercontinental
European
Domestic BUSINESS TRAVEL SURVEY di UVET Global Business Travel
TREND OF AIR TRAVEL COSTS PER TYPE (Base index nr. 1° Sem. 2013)
The number of transfers during the past
year has grown slightly in the
intercontinental and national market,
while it has declined in the European
market.
Observing the 2013-2015 three-year
period, the trend changes and registers
different results for each destination
type: domestic travel declined by less
than 7%, while flights in Europe
increased slightly (just over 1%) and
intercontinental travel remained stable.
The national panorama is certainly
influenced by increased use of rail
service.

BUSINESS TRAVEL
SURVEY 2016 MARCH 2016 - DIGITALRELEASE
BUSINESS TRAVEL: COSTS OF AIR TRAVEL
FOCUS ON AIR
16
Compared to the previous year, 2015
showed a drop in the European and
national segment by 2% and 1%,
respectively.
The intercontinental segment showed a
2% increase compared to 2014.
In the 2012-2014 three-year period,
there was a decline in the European
segment, while intercontinental air
travel costs grew. The average air fare
cost on the national market remained
unchanged.
AVERAGE AIR FARE COST PER TRAVEL TYPE (Euros)
TREND OF INTERCONTINENTAL TRAFFIC COST VOLUMES (Euro)
1.339 1.342 1.313 1.328 1.308 1.369
387 380 374 355 349 352
215 222 223 227 210 223 0
200
400
600
800
1.000
1.200
1.400
1.600
1° Sem. 2013 2° Sem. 2013 1° Sem. 2014 2° Sem. 2014 1° Sem. 2015 2° Sem. 2015
Intercontinental European Domestic
BUSINESS TRAVEL SURVEY di UVET Global Business Travel
37
,6%
25
,5%
11
,4%
9,0
%
4,5
%
4,1
%
3,4
%
2,5
%
2,1
%
40
,0%
25
,8%
12
,6%
7,0
%
3,1
%
4,5
%
2,8
%
2,2
%
2,0
%
0%
5%
10%
15%
20%
25%
30%
35%
40%
45%
North America
Far East Middle East South America
Africa Asia NorthAfrica Oceania Central America
2° Sem. 2014
2° Sem. 2015 BUSINESS TRAVEL SURVEY di UVET Global Business Travel
Over one-third of intercontinental traffic
is to North America.
The Far East amounts to a quarter of
the total volume regarding cost, and is
gradually coming close to one-third of
the total traffic.
There has been a decline in travel to
South America, Africa, North Africa,
and Oceania, while other destinations
have shown growth.

BUSINESS TRAVEL
SURVEY 2016 MARCH 2016 - DIGITALRELEASE
BUSINESS TRAVEL: INTERCONTINENTAL DESTINATIONS
FOCUS ON AIR
17
In 2015 Dubai was the most important
destination of the sample group. This
confirms the importance of the city as a
major airport hub for our business
travelers.
New York, which has shown a slight
rise in its share, slips to second place.
Other destinations showing growth are
Shanghai and Abu Dhabi, while traffic
to Hong Kong and Sao Paulo has
decreased.
MAIN INTERCONTINENTAL DESTINATIONS (Number of tickets)
TREND OF NUMBER OF INTERNATIONAL TRAFFIC TRANSFERS:
MAIN VARIATIONS IN DESTINATIONS
5,3
%
4,5
%
3,6
%
3,5
%
2,4
%
2,3
%
5,4
%
5,5
%
3,4
%
3,8
%
1,3
%
2,9
%
0%
1%
2%
3%
4%
5%
6%
NEW YORK DUBAI HONG KONG SHANGHAI SAO PAULO ABU DHABI
2° Sem. 2014
2° Sem. 2015 BUSINESS TRAVEL SURVEY di UVET Global Business Travel
International traffic developed unevenly
in 2015.
The BRIC economic area has reduced
its share due to the downward trend of
Russia and Brazil.
The United States and Arab Emirates
have shown growth. Travel to China
increased slightly.
There was a decline in the CIVETS
economic area mainly due to Turkey.
NEXT-7 and MINT have also
experienced a decrease.
5,8
%
2,4
%
1,6
%
5,5
%
2,8
%
3,0
%
2,2
%
1,8
%
1,4
%
0,8
%
6,0
%
2,5
%
2,0
%
4,9
%
2,4
%
2,8
%
2,0
%
1,5
%
1,0
%
0,5
%
0%
1%
2%
3%
4%
5%
6%
7%
USA CHINA ARAB EMIRATES
BRIC CIVETS NEXT-7 MINT TURKEY RUSSIA BRAZIL
2° Sem. 2014
2° Sem. 2015 BUSINESS TRAVEL SURVEY di UVET Global Business Travel
1 BRIC: Brasile, Russia, India e Cina 2 CIVETS: Colombia, Indonesia, Vietnam, Egitto, Turchia e
Sud Africa 3 NEXT-7: Egitto, Indonesia, Messico, Nigeria, Filippine,
Turchia e Corea Del Sud 4 MINT: Messico, Indonesia, Nigeria e Turchia

BUSINESS TRAVEL
SURVEY 2016 MARCH 2016 - DIGITALRELEASE
BUSINESS TRAVEL: EUROPEAN DESTINATIONS
FOCUS ON AIR
18
Analyzing the European market,
France and Germany have confirmed
their leadership from an economic
perspective for Italy, even though
France showed a slight dip in its share
in the past 12 months.
In the past year, the United Kingdom
and Spain have shown growth, while
Russia's share in terms of volume has
decreased.
TREND OF EUROPEAN TRAFFIC COST VOLUMES
MAIN EUROPEAN DESTINATIONS (Number of tickets)
5,8
%
21
,6%
17
,0%
15
,2%
3,8
%
7,4
%
29
,2%
5,8
%
19
,1%
17
,0%
16
,2%
2,6
% 8
,0%
31
,3%
0%
5%
10%
15%
20%
25%
30%
35%
BELGIUM FRANCE GERMANY UNITED KINGDOM
RUSSIA SPAIN OTHER
2° Sem. 2014
2° Sem. 2015 BUSINESS TRAVEL SURVEY di UVET Global Business Travel
13
,4%
8,6
%
5,1
%
4,9
%
3,5
%
3,1
%
2,9
%
12
,3%
9,2
%
4,8
%
5,0
%
4,0
%
3,0
%
2,9
%
0%
2%
4%
6%
8%
10%
12%
14%
PARIS LONDON BRUSSELS AMSTERDAM MADRID FRANKFURT MUNICH
2° Sem. 2014
2° Sem. 2015 BUSINESS TRAVEL SURVEY di UVET Global Business Travel
On a European level, Paris has
remained the principal destination, with
almost 13% of total business trips
made in Europe, even though its share
has decreased.
Brussels and Frankfurt have also
shown a decline.
Madrid, London and Amsterdam have
shown growth

BUSINESS TRAVEL
SURVEY 2016 MARCH 2016 - DIGITALRELEASE
BUSINESS TRAVEL: NATIONAL DESTINATIONS
FOCUS ON AIR
19
MAIN NATIONAL DESTINATIONS (Number of tickets)
OTHER NATIONAL DESTINATIONS (Number of tickets)
32
,2%
29
,9%
37
,9%
33
,6%
29
,1%
37
,3%
0%
5%
10%
15%
20%
25%
30%
35%
40%
MILAN ROME OTHERS
2° Sem. 2014
2° Sem. 2015 BUSINESS TRAVEL SURVEY di UVET Global Business Travel
6,0
%
5,0
%
4,0
%
3,6
%
3,3
%
2,9
%
2,9
%
5,7
%
5,6
%
3,8
%
3,2
%
2,8
%
3,3
%
2,4
%
0%
1%
2%
3%
4%
5%
6%
7%
NAPLES CATANIA BARI TURIN VENICE PALERMO GENOA
2° Sem. 2014
2° Sem. 2015 BUSINESS TRAVEL SURVEY di UVET Global Business Travel
Naples remains a favorite among other
national destinations, even though it
showed a 5% drop in volume and a
0.3% decrease in the national total.
Palermo and Catania are the only
destinations that showed a growth in
value; all the other destinations
experienced a decrease.
In the national segment, Milan is the
main business travel destination for the
companies in the sample group: nearly
34% of the customers chose the Linate
and Malpensa airports.
Rome and other destinations, however,
showed a slight decrease in their
market share.
BUSINESS TRAVEL
SURVEY 2016 MARCH 2016 - DIGITALRELEASE
BUSINESS TRAVEL: RAIL COSTS
FOCUS ON RAIL
20
TREND OF NUMBER OF RAIL TRANSFERS AND TRAVEL
COSTS (Base index nr. 1° sem. 2013)
AVERAGE TRAIN FARE COST (Euros)
100
90
110
101
132
117
100 91
109
96
121
107
60
80
100
120
140
1° Sem. 2013 2° Sem. 2013 1° Sem. 2014 2° Sem. 2014 1° Sem. 2015 2° Sem. 2015
Nr. Transfers
Travel cost BUSINESS TRAVEL SURVEY di UVET Global Business Travel
58 59
58
56
54 54
50
55
60
65
1° Sem. 2013 2° Sem. 2013 1° Sem. 2014 2° Sem. 2014 1° Sem. 2015 2° Sem. 2015
Average cost per transfer BUSINESS TRAVEL SURVEY di UVET Global Business Travel
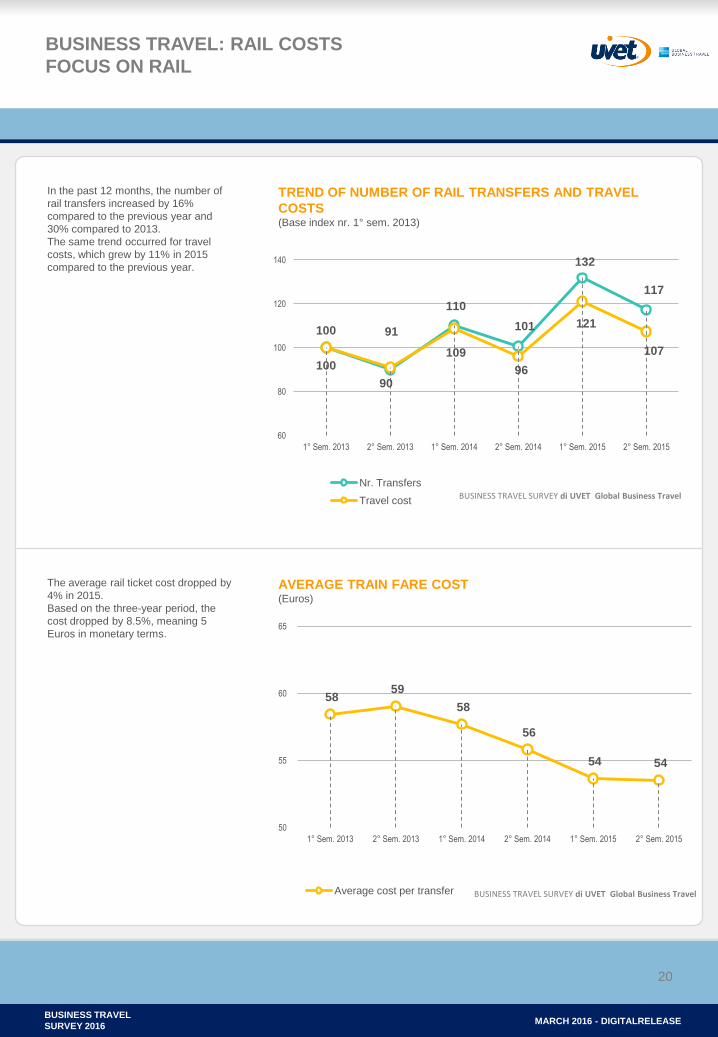
In the past 12 months, the number of
rail transfers increased by 16%
compared to the previous year and
30% compared to 2013.
The same trend occurred for travel
costs, which grew by 11% in 2015
compared to the previous year.
The average rail ticket cost dropped by
4% in 2015.
Based on the three-year period, the
cost dropped by 8.5%, meaning 5
Euros in monetary terms.

BUSINESS TRAVEL
SURVEY 2016 MARCH 2016 - DIGITALRELEASE
BUSINESS TRAVEL: RAIL COSTS
FOCUS ON RAIL
21
MAIN NATIONAL RAIL DESTINATIONS (Number of tickets)
MILAN – ROME BUSINESS MARKET SHARE OF RAIL/AIR
TRAVEL MARKET
Milan is still the main Italian destination
for business travelers.
Rome increased its market share
compared to the previous year, while
the share of other destinations
decreased.
Of the cities in the "Others" category,
the main destinations are those on the
High-Speed train line: Turin, Bologna,
Florence and Naples.
In the past three-year period, there has
been a change in business travelers'
habits thanks to the high-speed railway
that reduced travel time between Rome
and Milan.
Rail travel is expected to surpass plane
travel in 2015: in the 4th quarter of
2015, the favorite means of
transportation was the train, holding a
54% overall share.
Compared to 2013, the train gained 8%
and showed an important change in
travel habits.
32,5%
30,0%
37,5%
32,4% 30,9%
36,7%
0%
5%
10%
15%
20%
25%
30%
35%
40%
MILAN ROME OTHER
2° Sem. 2014 2° Sem. 2015 BUSINESS TRAVEL SURVEY di UVET Global Business Travel
56
%
57
%
58
%
54
%
55
%
55
%
56
%
50
%
50
%
45
%
49
%
46
%
44
%
43
%
42
%
46
%
45
%
45
%
44
%
50
%
50
%
55
%
51
%
54
%
0%
10%
20%
30%
40%
50%
60%
70%
80%
90%
100%
1° Trim. 2013
2° Trim. 2013
3° Trim. 2013
4° Trim. 2013
1° Trim. 2014
2° Trim. 2014
3° Trim. 2014
4° Trim. 2014
1° Trim. 2015
2° Trim. 2015
3° Trim. 2015
4° Trim. 2015
Air Rail BUSINESS TRAVEL SURVEY di UVET Global Business Travel
BUSINESS TRAVEL
SURVEY 2016 MARCH 2016 - DIGITALRELEASE
BUSINESS TRAVEL: HÔTELLERIE
FOCUS ON HOTEL
22
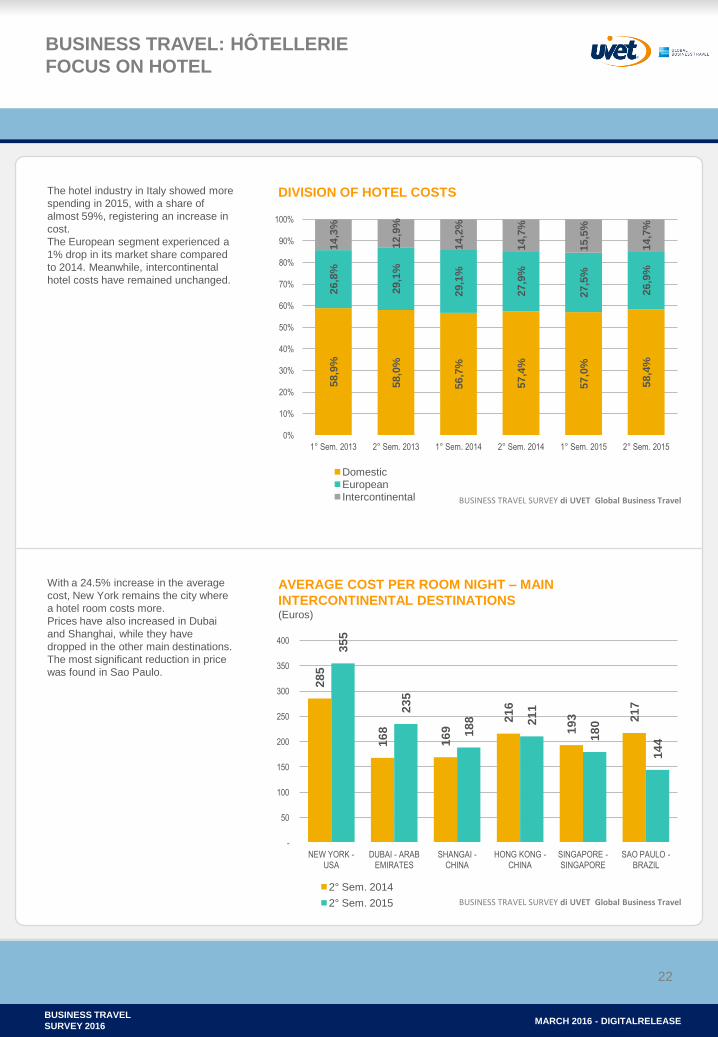
With a 24.5% increase in the average
cost, New York remains the city where
a hotel room costs more.
Prices have also increased in Dubai
and Shanghai, while they have
dropped in the other main destinations.
The most significant reduction in price
was found in Sao Paulo.
DIVISION OF HOTEL COSTS
AVERAGE COST PER ROOM NIGHT – MAIN
INTERCONTINENTAL DESTINATIONS (Euros)
58,9
%
58,0
%
56,7
%
57,4
%
57,0
%
58,4
%
26,8
%
29,1
%
29,1
%
27,9
%
27,5
%
26,9
%
14,3
%
12,9
%
14,2
%
14,7
%
15,5
%
14,7
%
0%
10%
20%
30%
40%
50%
60%
70%
80%
90%
100%
1° Sem. 2013 2° Sem. 2013 1° Sem. 2014 2° Sem. 2014 1° Sem. 2015 2° Sem. 2015
Domestic European Intercontinental BUSINESS TRAVEL SURVEY di UVET Global Business Travel
28
5
16
8
16
9 2
16
19
3
21
7
35
5
23
5
18
8
21
1
18
0
14
4
-
50
100
150
200
250
300
350
400
NEW YORK - USA
DUBAI - ARAB EMIRATES
SHANGAI - CHINA
HONG KONG - CHINA
SINGAPORE - SINGAPORE
SAO PAULO - BRAZIL
2° Sem. 2014
2° Sem. 2015 BUSINESS TRAVEL SURVEY di UVET Global Business Travel
The hotel industry in Italy showed more
spending in 2015, with a share of
almost 59%, registering an increase in
cost.
The European segment experienced a
1% drop in its market share compared
to 2014. Meanwhile, intercontinental
hotel costs have remained unchanged.

BUSINESS TRAVEL
SURVEY 2016 MARCH 2016 - DIGITALRELEASE
BUSINESS TRAVEL: HÔTELLERIE
FOCUS ON HOTEL
23
In the past 12 months, Milan was the
city where it was most expensive to
stay, which is certainly due to EXPO
2015.
The event caused a 10% increase in
the average cost for one night in a
hotel.
Florence is in second place, with an
increase in the cost compared to 2014.
Genoa, Rome and Venice, on the other
hand, showed a reduction in the cost of
their hotel rooms.
AVERAGE COST PER ROOM NIGHT – MAIN EUROPEAN
DESTINATIONS (Euros)
AVERAGE COST PER ROOM NIGHT
MAIN ITALIAN DESTINATIONS (Euros)
16
5
15
5
13
9
24
1
13
1
22
1
17
3
15
5
15
4
28
2
12
9
20
5
0
50
100
150
200
250
300
AMSTERDAM BRUSSELS FRANKFURT LONDON MADRID PARIS
2° Sem. 2014
2° Sem. 2015 BUSINESS TRAVEL SURVEY di UVET Global Business Travel
13
3
10
7
13
5
97
13
3
13
3
14
0
95
14
8
11
1 1
26
11
4
-
20
40
60
80
100
120
140
160
FLORENCE GENOA MILAN NAPLES ROME VENICE
2° Sem. 2014
2° Sem. 2015 BUSINESS TRAVEL SURVEY di UVET Global Business Travel
In 2015 the average room cost per
night in European destinations
increased in Frankfurt, Amsterdam and
London, which showed a 17%
increase.
The average cost for one night in a
hotel decreased in the other cities:
Paris dropped by 7% while Brussels
remained unchanged.
The most economical city is Madrid.

BUSINESS TRAVEL
SURVEY 2016 MARCH 2016 - DIGITALRELEASE
24
BUSINESS TRAVEL
SURVEY 2016 MARCH 2016 - DIGITALRELEASE
For more information and/or suggestions, please contact:
Marketing & Communications Department
.
t. +39 02 81838031
www.uvetgbt.com
The previous editions of the Business Travel Survey are available at
www.uvetgbt.com/bts


![, pubblica Mission, La rivista dei viaggi d’affari e ...Newsteca s.r.l. Via Larga 6 - 20122 Milano [T] +39 02 36599030 [@] redazione@newsteca.it Newsteca srl nasce nel 2000 a Milano](https://static.fdocumenti.com/doc/165x107/5ed06dc1f00a2361b5505aed/-pubblica-mission-la-rivista-dei-viaggi-daaffari-e-newsteca-srl-via-larga.jpg)