Andrea Pitacco, University of Padova · e ipotizza che le massicce combustioni possano rappresen-...
25
5-12-2017 Guido Berlucchi & C. Viticoltura e Cambiamento Climatico: Responsabilità, minacce e opportuniità Andrea Pitacco, University of Padova
Transcript of Andrea Pitacco, University of Padova · e ipotizza che le massicce combustioni possano rappresen-...
5-12-2017 Guido Berlucchi & C.
Viticoltura e Cambiamento Climatico: Responsabilità, minacce e opportuniità
Andrea Pitacco, University of Padova

05-12-2017 Guido Berlucchi & C.
Sebastião Salgado
Workers Place a New Wellhead
Oil Wells, Kuwait , 1991
Il problema: troppa energia recuperata dal
passato
05-12-2017 Guido Berlucchi & C.
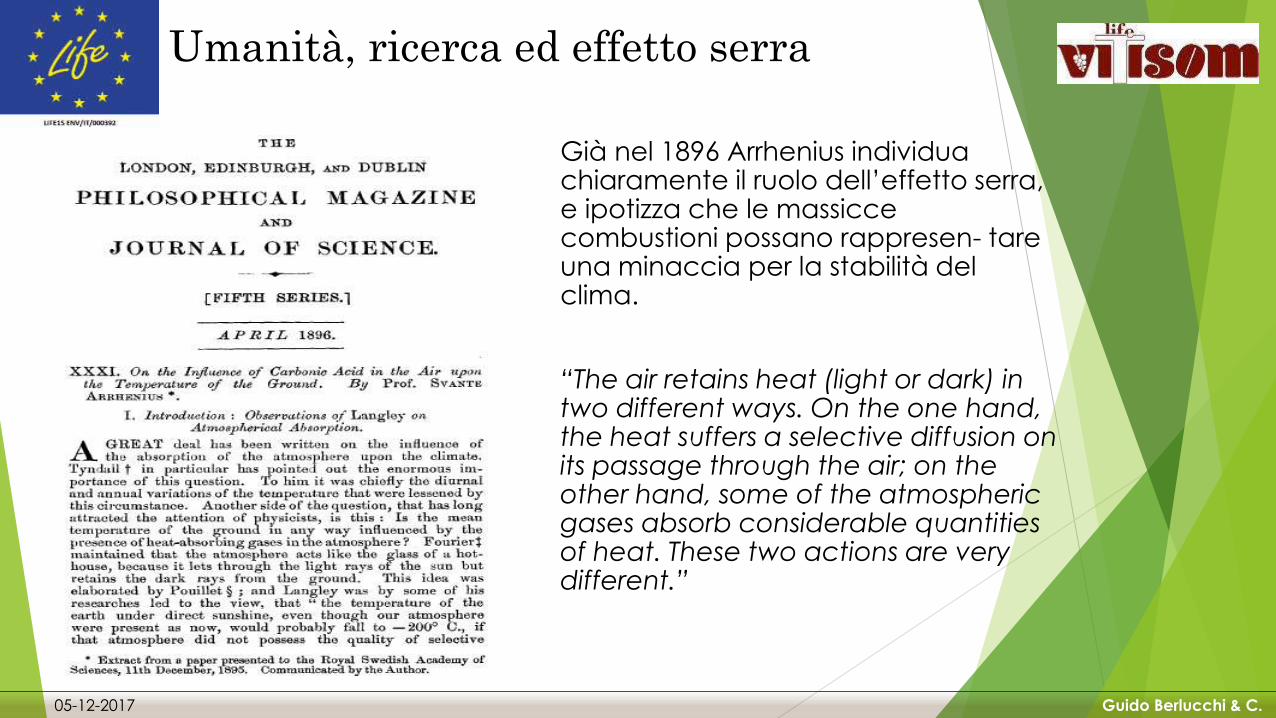
Umanità, ricerca ed effetto serra
Già nel 1896 Arrhenius individua chiaramente il ruolo dell’effetto serra, e ipotizza che le massicce combustioni possano rappresen- tare una minaccia per la stabilità del clima.
“The air retains heat (light or dark) in two different ways. On the one hand, the heat suffers a selective diffusion on its passage through the air; on the other hand, some of the atmospheric gases absorb considerable quantities of heat. These two actions are very different.”

05-12-2017 Guido Berlucchi & C.
05-12-2017 Guido Berlucchi & C.
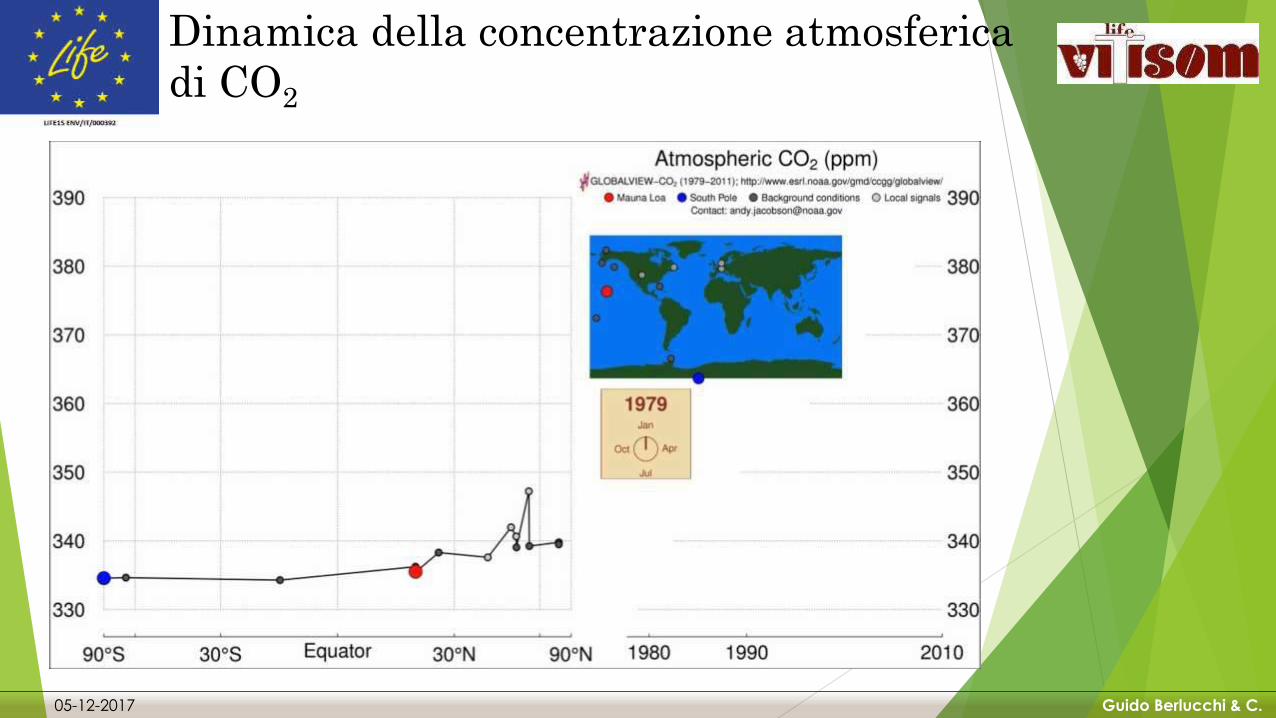
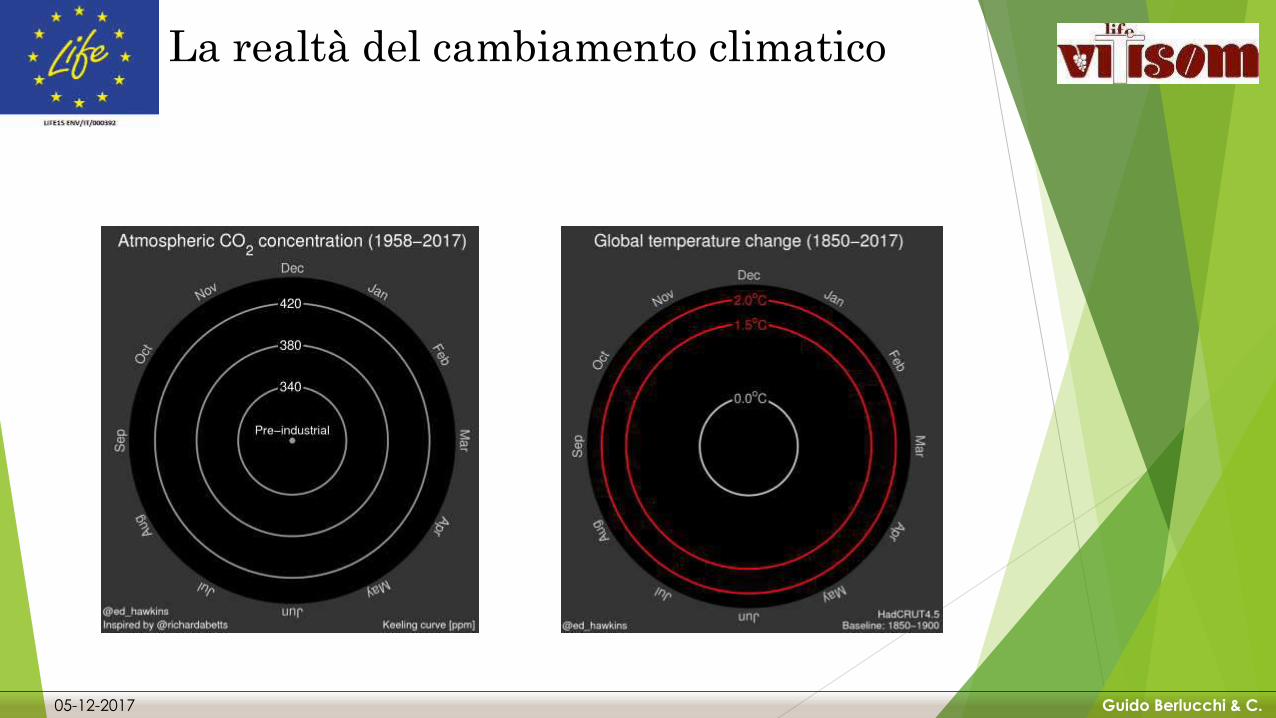
Dinamica della concentrazione atmosferica
di CO2

05-12-2017 Guido Berlucchi & C.
Umanità, ricerca ed effetto serra
Il monitoraggio sistemati-
co della concentrazione
dei Gas ad effetto serra
è stabilito da Keeling nel
1958
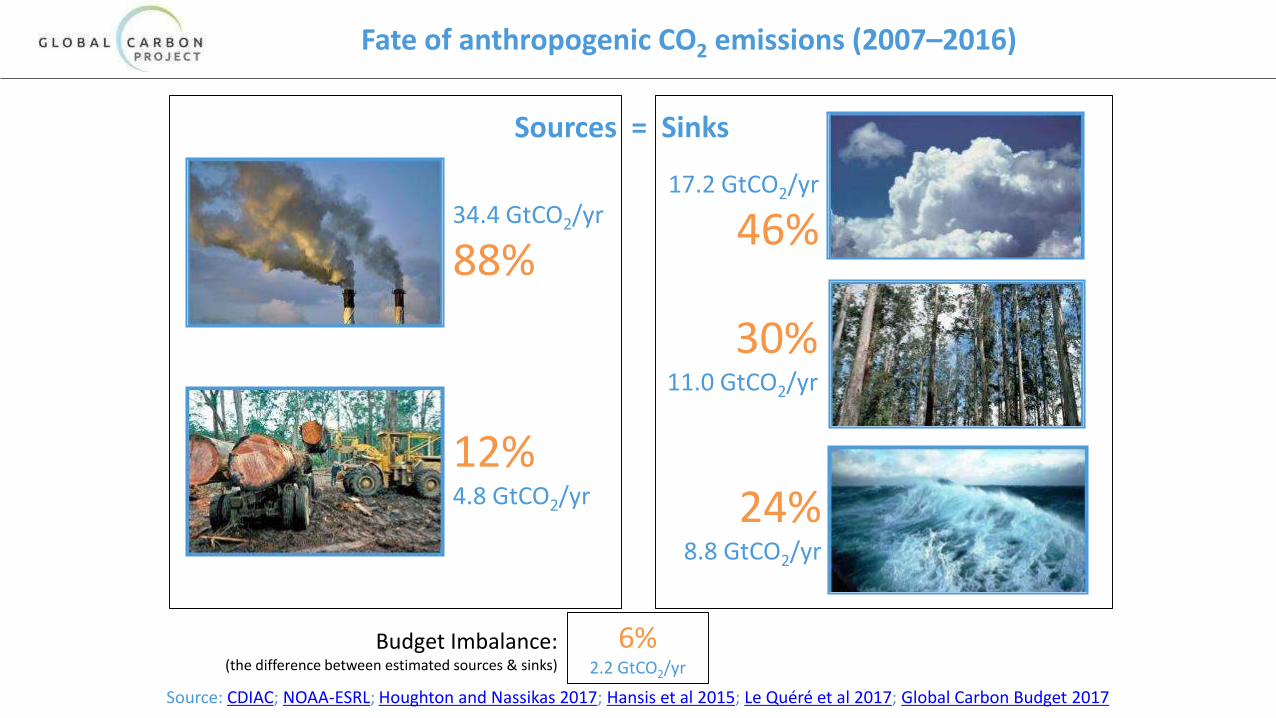
30%11.0 GtCO2/yr
Fate of anthropogenic CO2 emissions (2007–2016)
Source: CDIAC; NOAA-ESRL; Houghton and Nassikas 2017; Hansis et al 2015; Le Quéré et al 2017; Global Carbon Budget 2017
24%8.8 GtCO2/yr
34.4 GtCO2/yr
88%
12%4.8 GtCO2/yr
17.2 GtCO2/yr
46%
Sources = Sinks
6%2.2 GtCO2/yr
Budget Imbalance: (the difference between estimated sources & sinks)
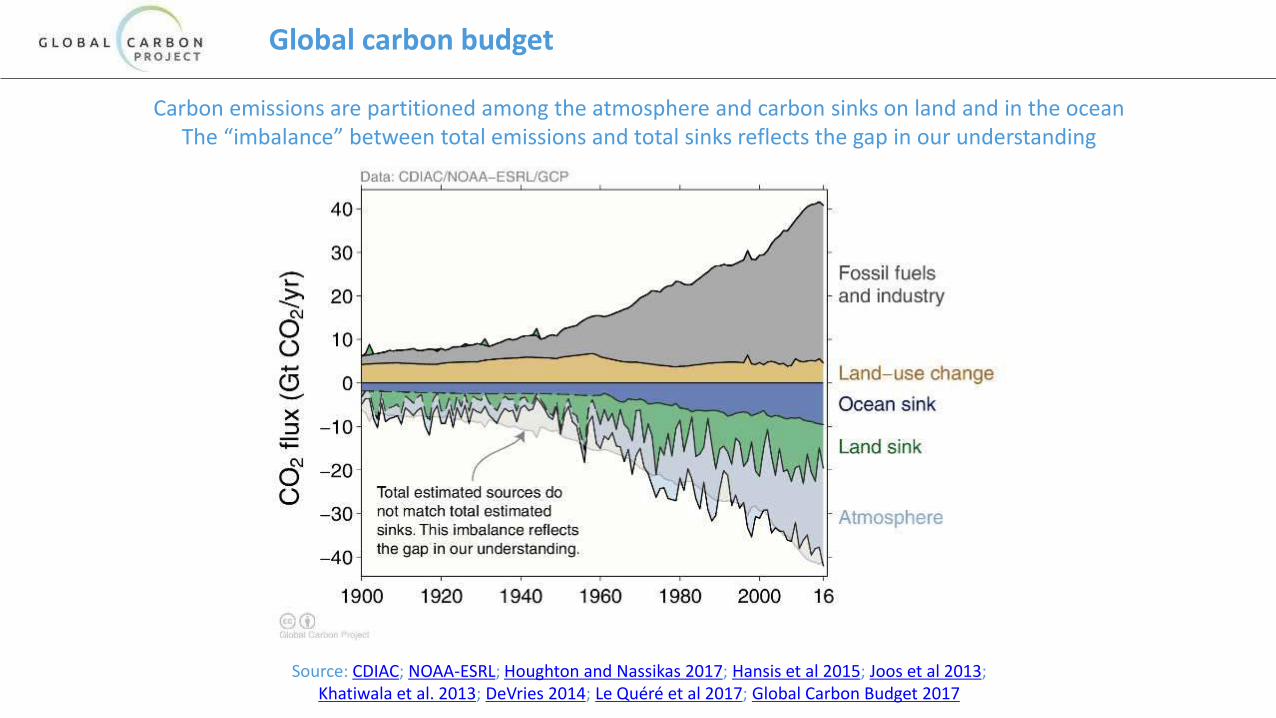
Global carbon budget
Carbon emissions are partitioned among the atmosphere and carbon sinks on land and in the oceanThe “imbalance” between total emissions and total sinks reflects the gap in our understanding
Source: CDIAC; NOAA-ESRL; Houghton and Nassikas 2017; Hansis et al 2015; Joos et al 2013;Khatiwala et al. 2013; DeVries 2014; Le Quéré et al 2017; Global Carbon Budget 2017
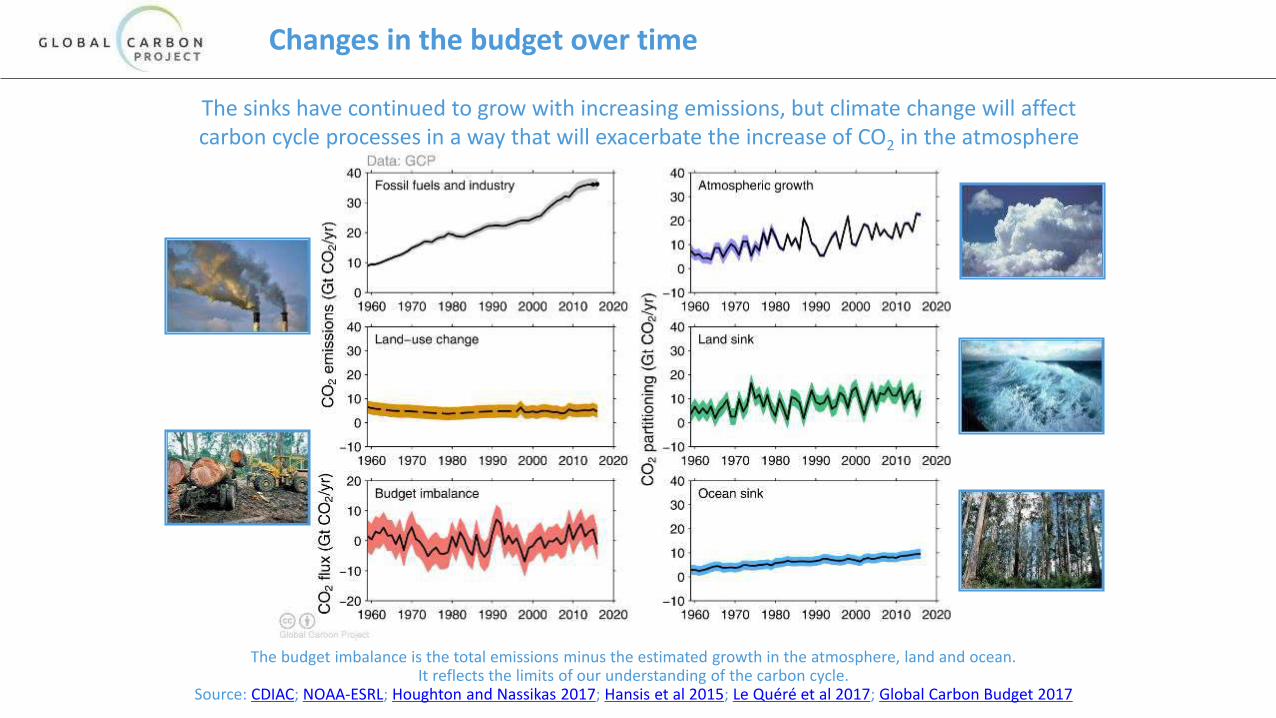
Changes in the budget over time
The sinks have continued to grow with increasing emissions, but climate change will affectcarbon cycle processes in a way that will exacerbate the increase of CO2 in the atmosphere
The budget imbalance is the total emissions minus the estimated growth in the atmosphere, land and ocean. It reflects the limits of our understanding of the carbon cycle.
Source: CDIAC; NOAA-ESRL; Houghton and Nassikas 2017; Hansis et al 2015; Le Quéré et al 2017; Global Carbon Budget 2017
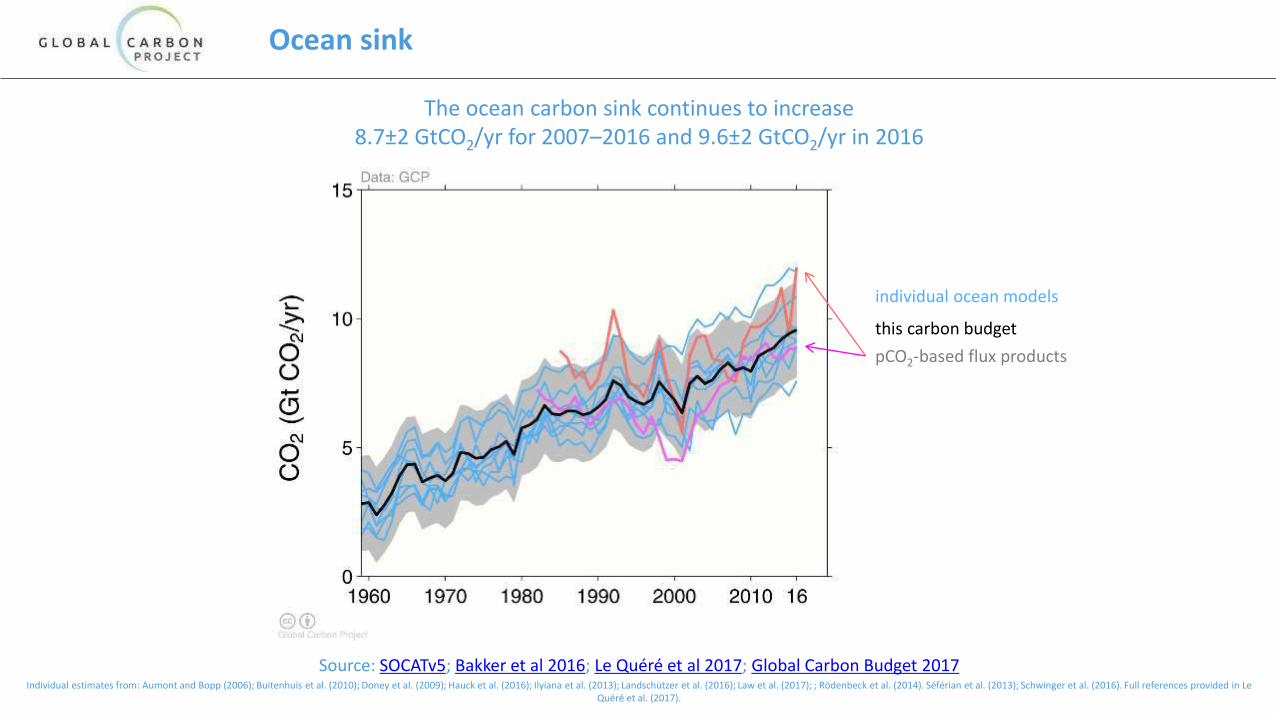
Ocean sink
The ocean carbon sink continues to increase8.7±2 GtCO2/yr for 2007–2016 and 9.6±2 GtCO2/yr in 2016
Source: SOCATv5; Bakker et al 2016; Le Quéré et al 2017; Global Carbon Budget 2017Individual estimates from: Aumont and Bopp (2006); Buitenhuis et al. (2010); Doney et al. (2009); Hauck et al. (2016); Ilyiana et al. (2013); Landschützer et al. (2016); Law et al. (2017); ; Rödenbeck et al. (2014). Séférian et al. (2013); Schwinger et al. (2016). Full references provided in Le
Quéré et al. (2017).
this carbon budget
individual ocean models
pCO2-based flux products
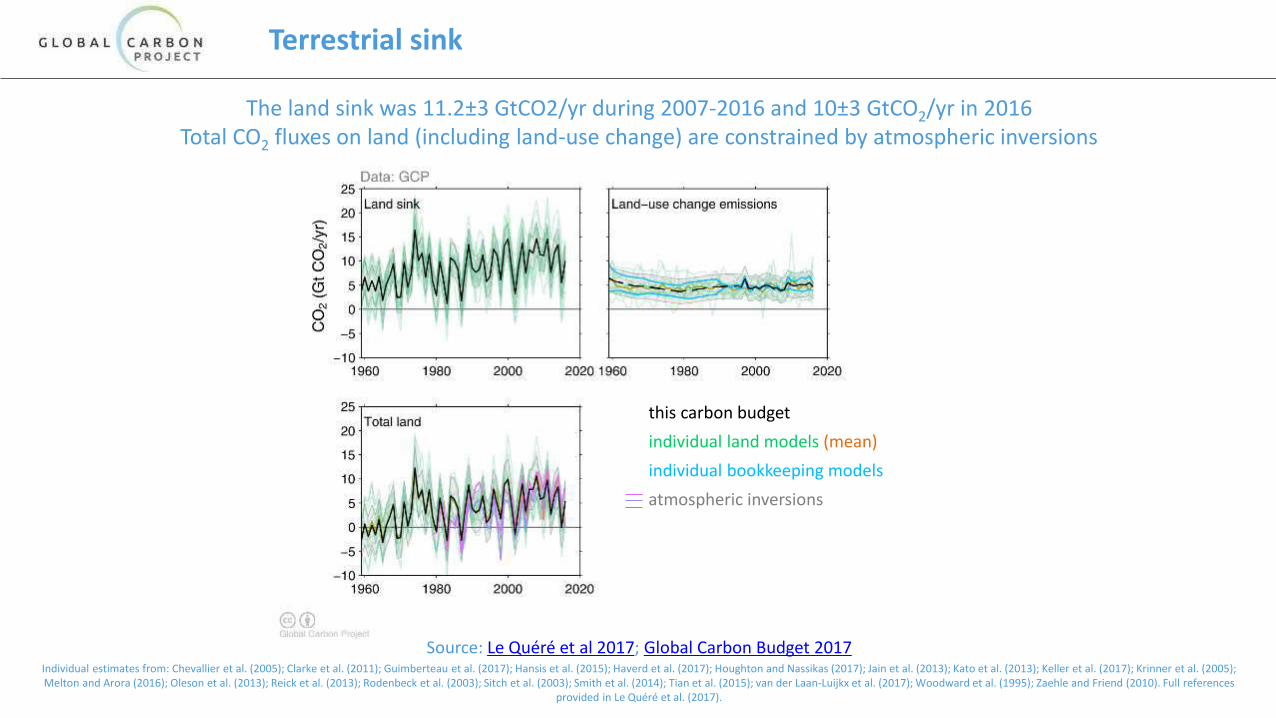
Terrestrial sink
The land sink was 11.2±3 GtCO2/yr during 2007-2016 and 10±3 GtCO2/yr in 2016Total CO2 fluxes on land (including land-use change) are constrained by atmospheric inversions
Source: Le Quéré et al 2017; Global Carbon Budget 2017Individual estimates from: Chevallier et al. (2005); Clarke et al. (2011); Guimberteau et al. (2017); Hansis et al. (2015); Haverd et al. (2017); Houghton and Nassikas (2017); Jain et al. (2013); Kato et al. (2013); Keller et al. (2017); Krinner et al. (2005); Melton and Arora (2016); Oleson et al. (2013); Reick et al. (2013); Rodenbeck et al. (2003); Sitch et al. (2003); Smith et al. (2014); Tian et al. (2015); van der Laan-Luijkx et al. (2017); Woodward et al. (1995); Zaehle and Friend (2010). Full references
provided in Le Quéré et al. (2017).
this carbon budget
individual land models (mean)
individual bookkeeping models
atmospheric inversions
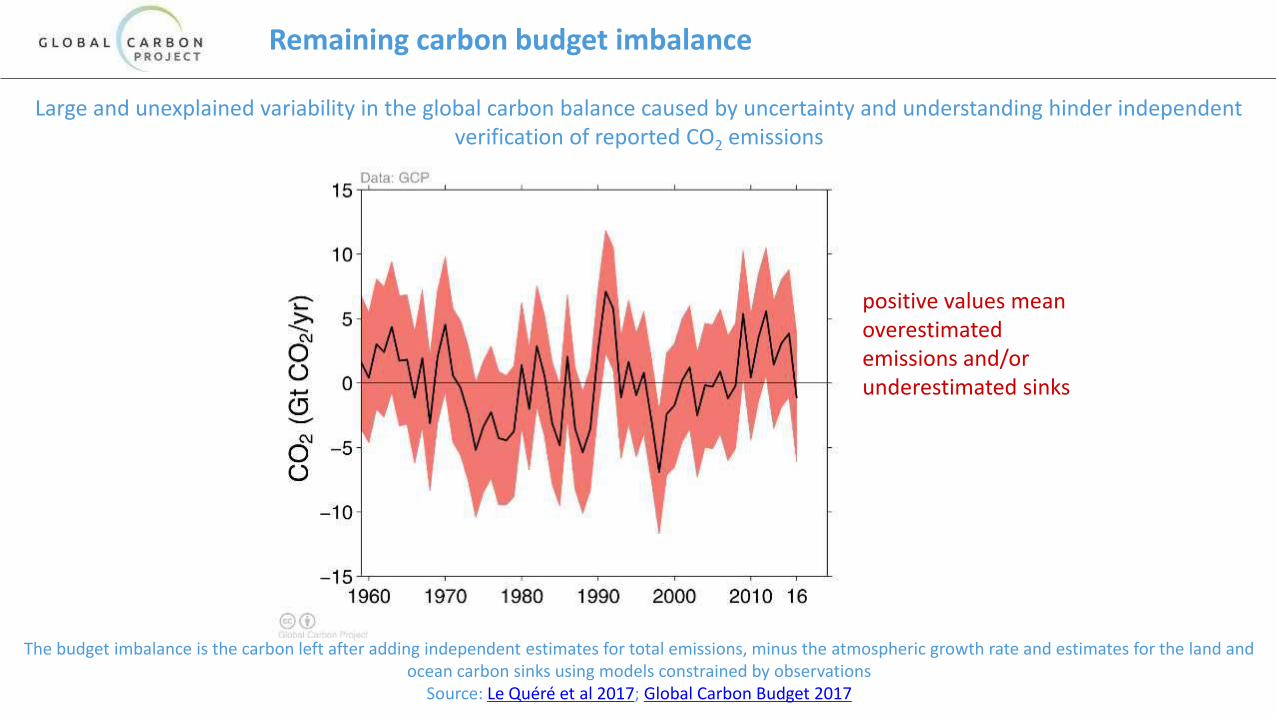
Remaining carbon budget imbalance
The budget imbalance is the carbon left after adding independent estimates for total emissions, minus the atmospheric growth rate and estimates for the land and ocean carbon sinks using models constrained by observations
Source: Le Quéré et al 2017; Global Carbon Budget 2017
Large and unexplained variability in the global carbon balance caused by uncertainty and understanding hinder independent verification of reported CO2 emissions
positive values mean overestimated emissions and/or underestimated sinks
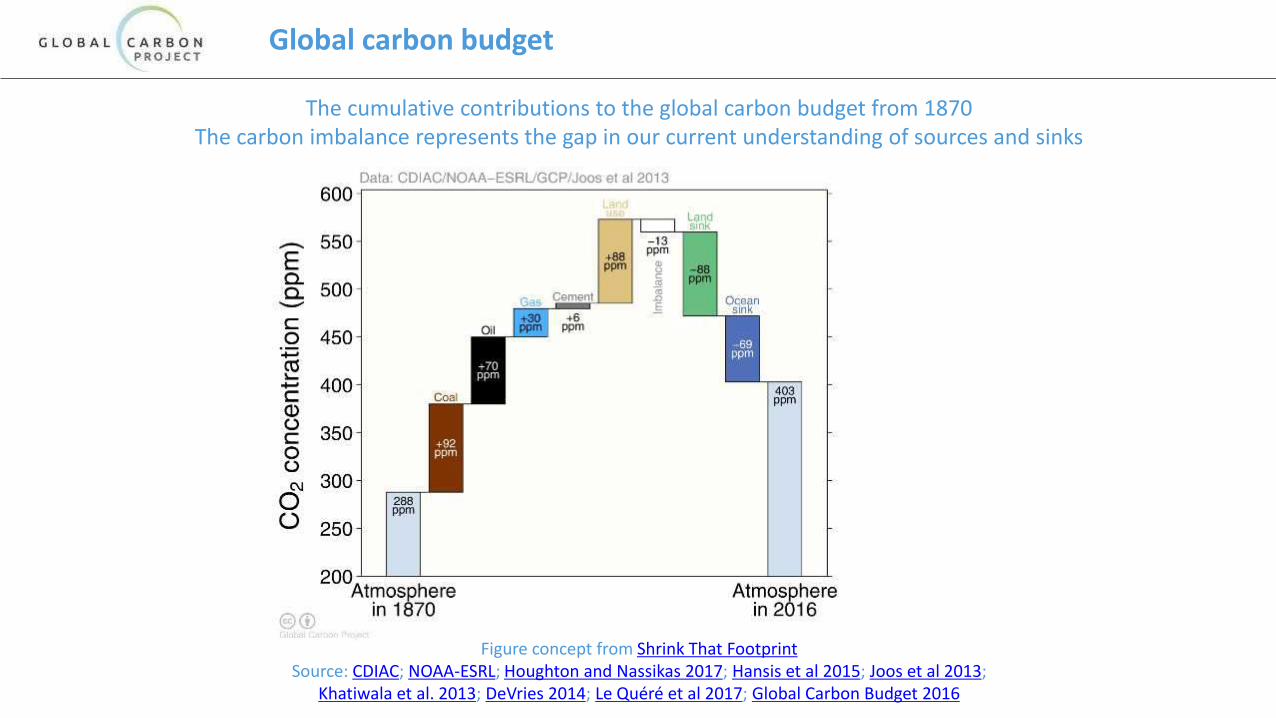
Global carbon budget
The cumulative contributions to the global carbon budget from 1870The carbon imbalance represents the gap in our current understanding of sources and sinks
Figure concept from Shrink That FootprintSource: CDIAC; NOAA-ESRL; Houghton and Nassikas 2017; Hansis et al 2015; Joos et al 2013;
Khatiwala et al. 2013; DeVries 2014; Le Quéré et al 2017; Global Carbon Budget 2016
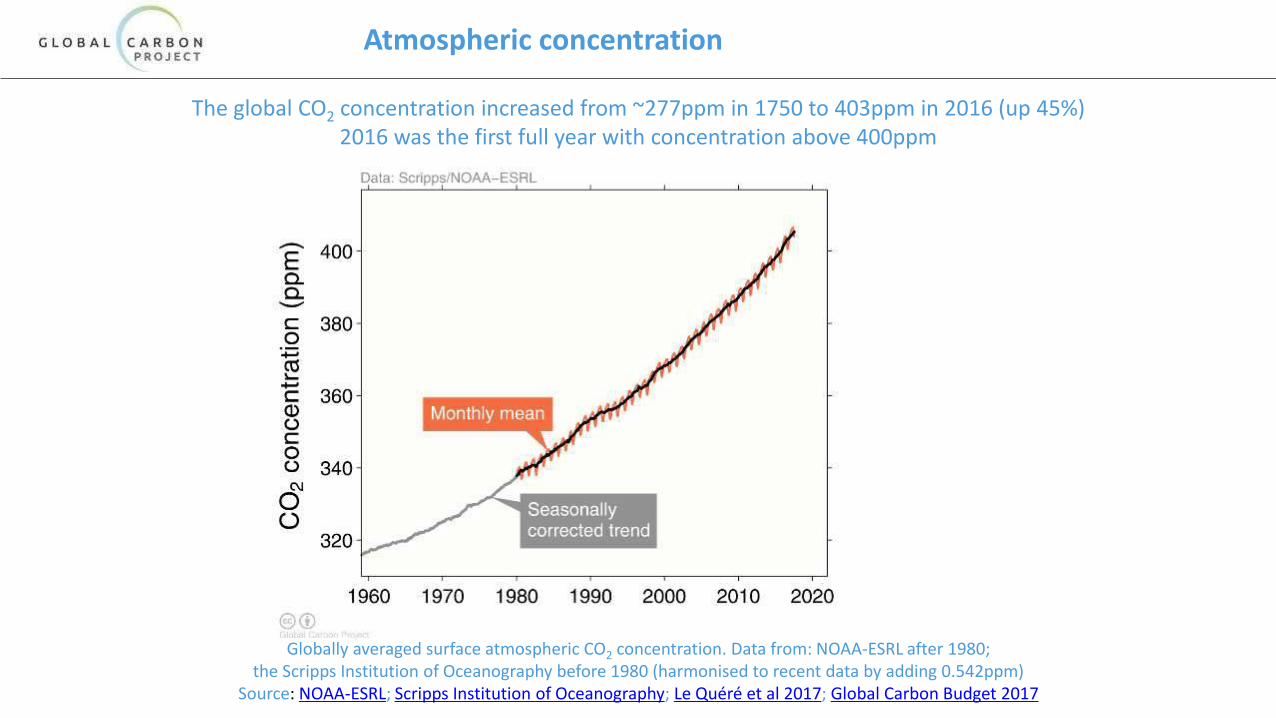
Atmospheric concentration
The global CO2 concentration increased from ~277ppm in 1750 to 403ppm in 2016 (up 45%)2016 was the first full year with concentration above 400ppm
Globally averaged surface atmospheric CO2 concentration. Data from: NOAA-ESRL after 1980; the Scripps Institution of Oceanography before 1980 (harmonised to recent data by adding 0.542ppm)
Source: NOAA-ESRL; Scripps Institution of Oceanography; Le Quéré et al 2017; Global Carbon Budget 2017
05-12-2017 Guido Berlucchi & C.
La realtà del cambiamento climatico
05-12-2017 Guido Berlucchi & C.
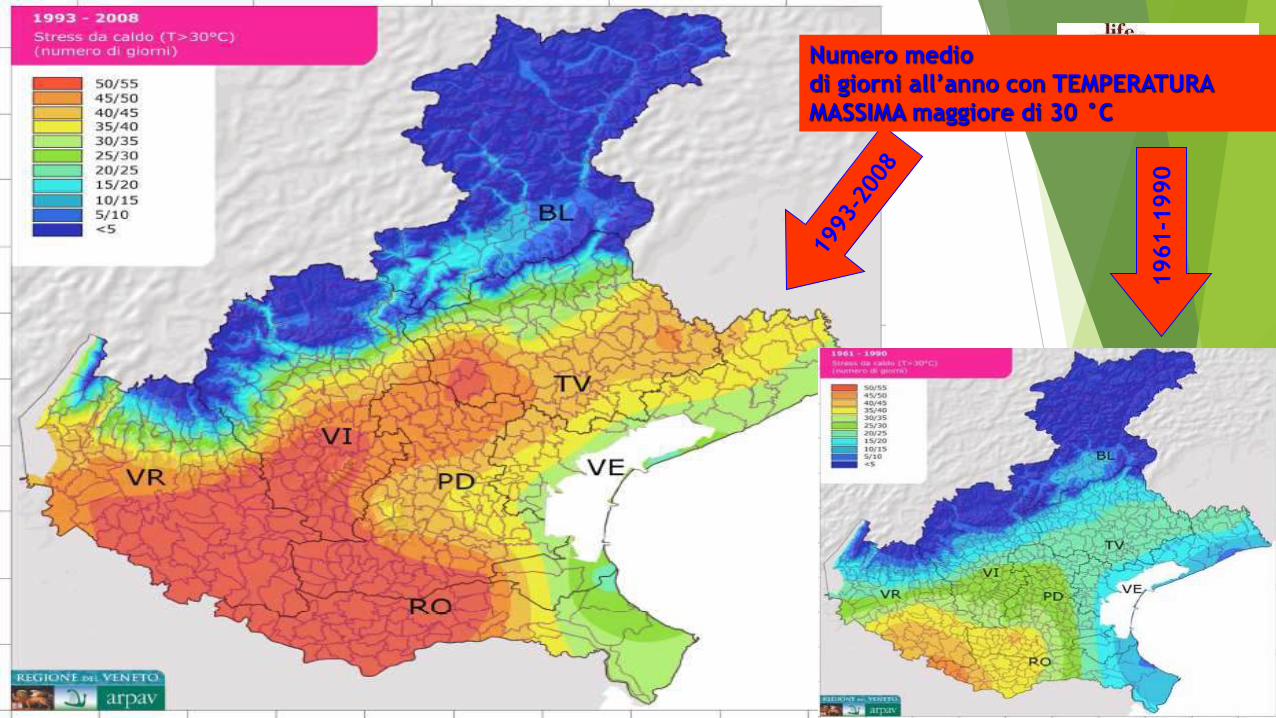
1961-1
990
Numero medio
di giorni all’anno con TEMPERATURA
MASSIMA maggiore di 30 °C
05-12-2017 Guido Berlucchi & C.
17
05-12-2017 Guido Berlucchi & C.
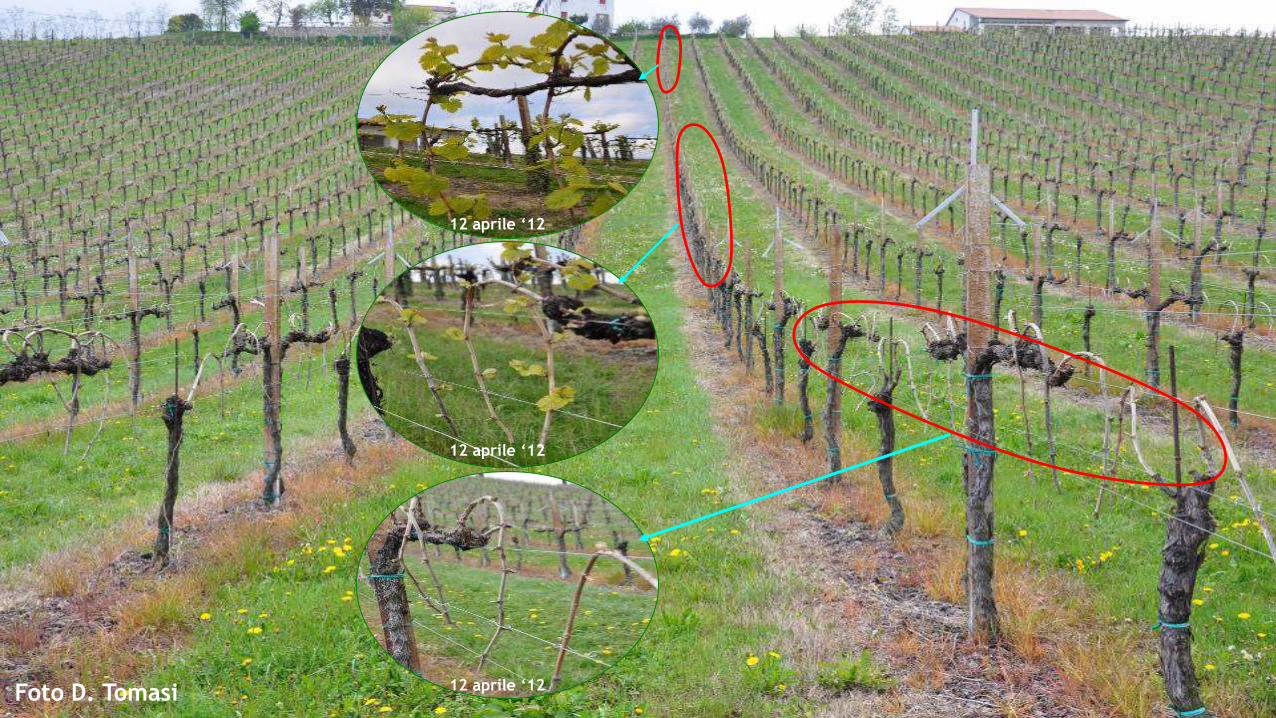
12 aprile ‘12
12 aprile ‘12
12 aprile ‘12
Foto D. Tomasi
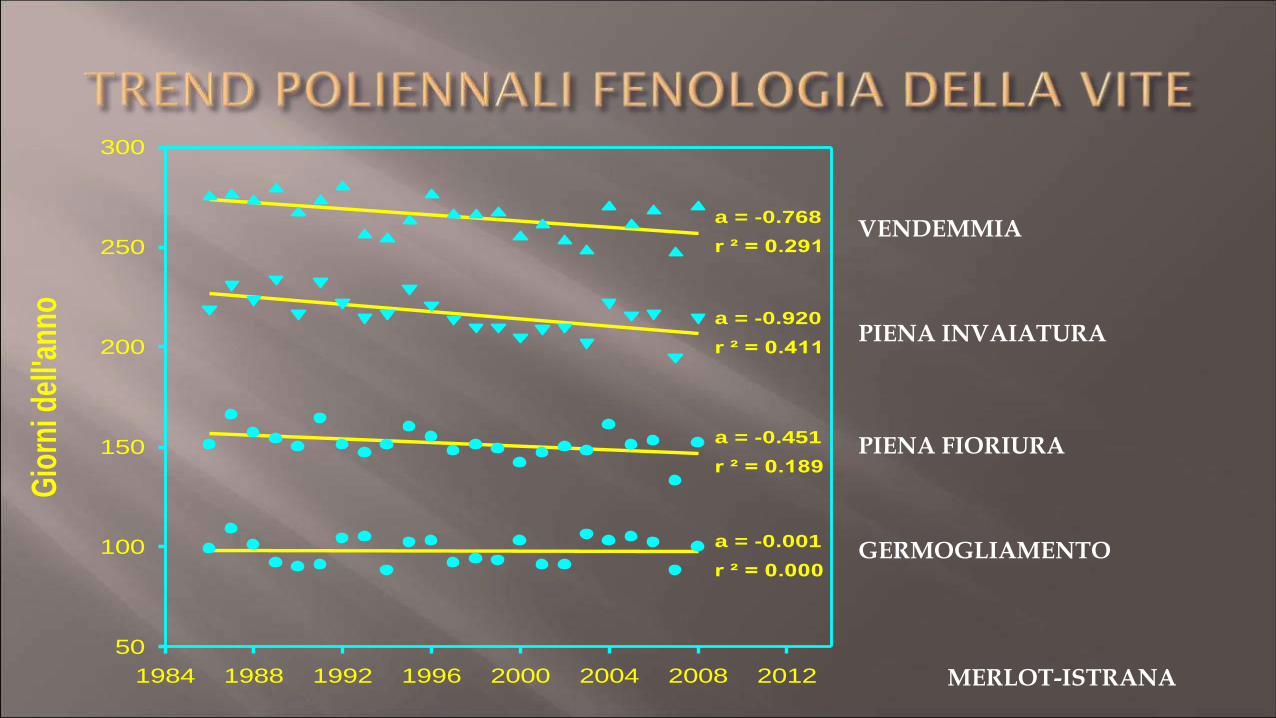
GERMOGLIAMENTO
PIENA FIORIURA
PIENA INVAIATURA
VENDEMMIA
1984 1988 1992 1996 2000 2004 2008 2012
Gior
ni d
ell'a
nno
50
100
150
200
250
300
a = -0.001
r ² = 0.000
a = -0.451
r ² = 0.189
a = -0.920
r ² = 0.411
a = -0.768
r ² = 0.291
MERLOT-ISTRANA
05-12-2017 Guido Berlucchi & C.
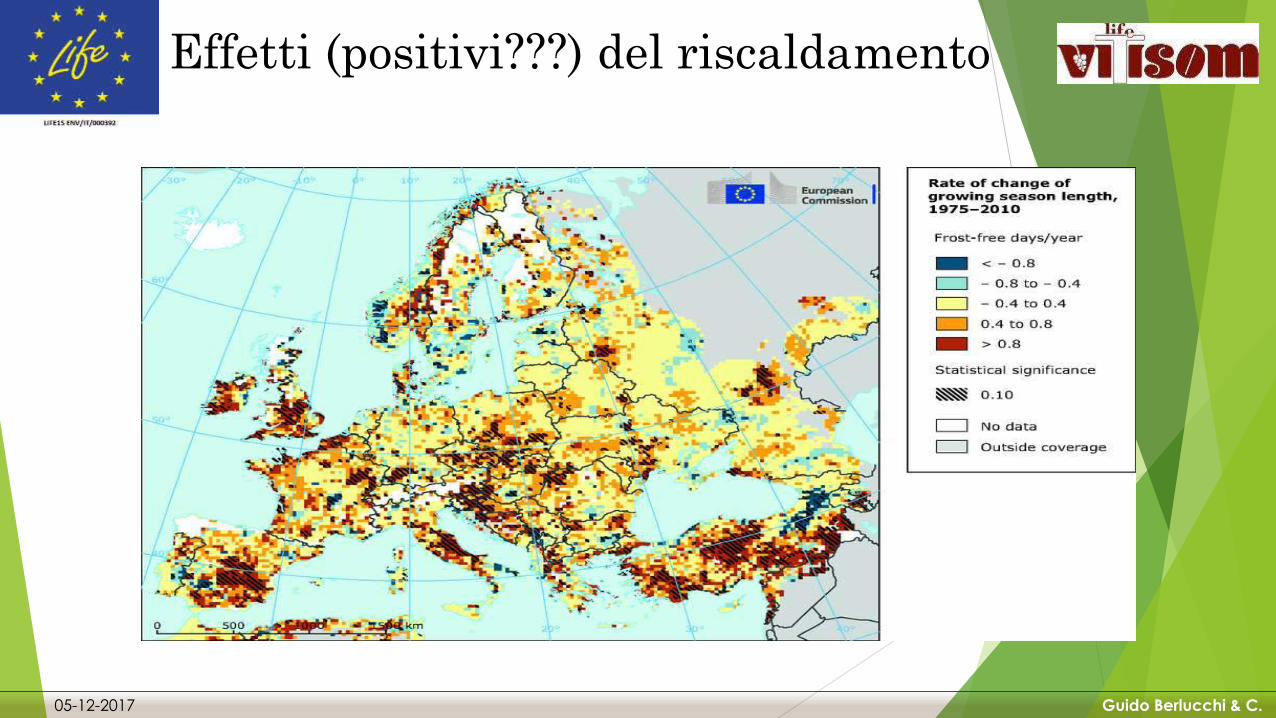
Effetti (positivi???) del riscaldamento

05-12-2017 Guido Berlucchi & C.
05-12-2017 Guido Berlucchi & C.
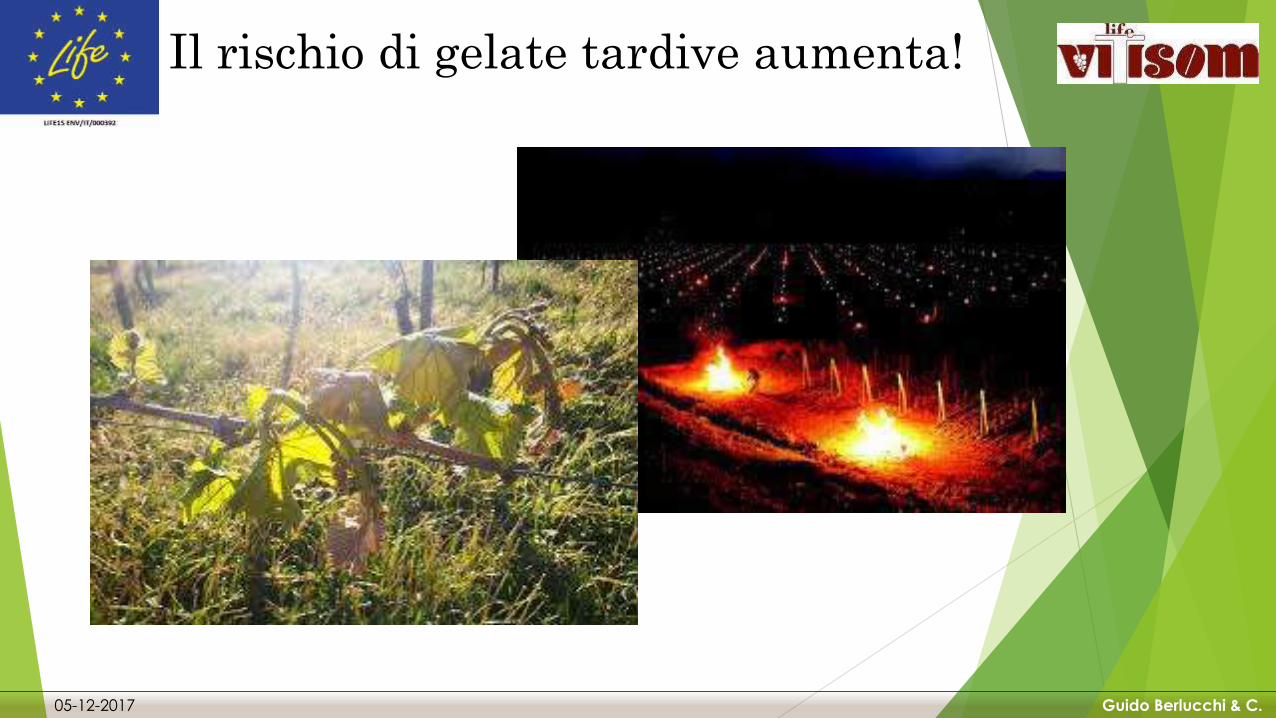
Il rischio di gelate tardive aumenta!

Global carbon budget
Carbon emissions are partitioned among the atmosphere and carbon sinks on land and in the oceanThe “imbalance” between total emissions and total sinks reflects the gap in our understanding
Source: CDIAC; NOAA-ESRL; Houghton and Nassikas 2017; Hansis et al 2015; Joos et al 2013;Khatiwala et al. 2013; DeVries 2014; Le Quéré et al 2017; Global Carbon Budget 2017
05-12-2017 Guido Berlucchi & C.
05-12-2017 Guido Berlucchi & C.
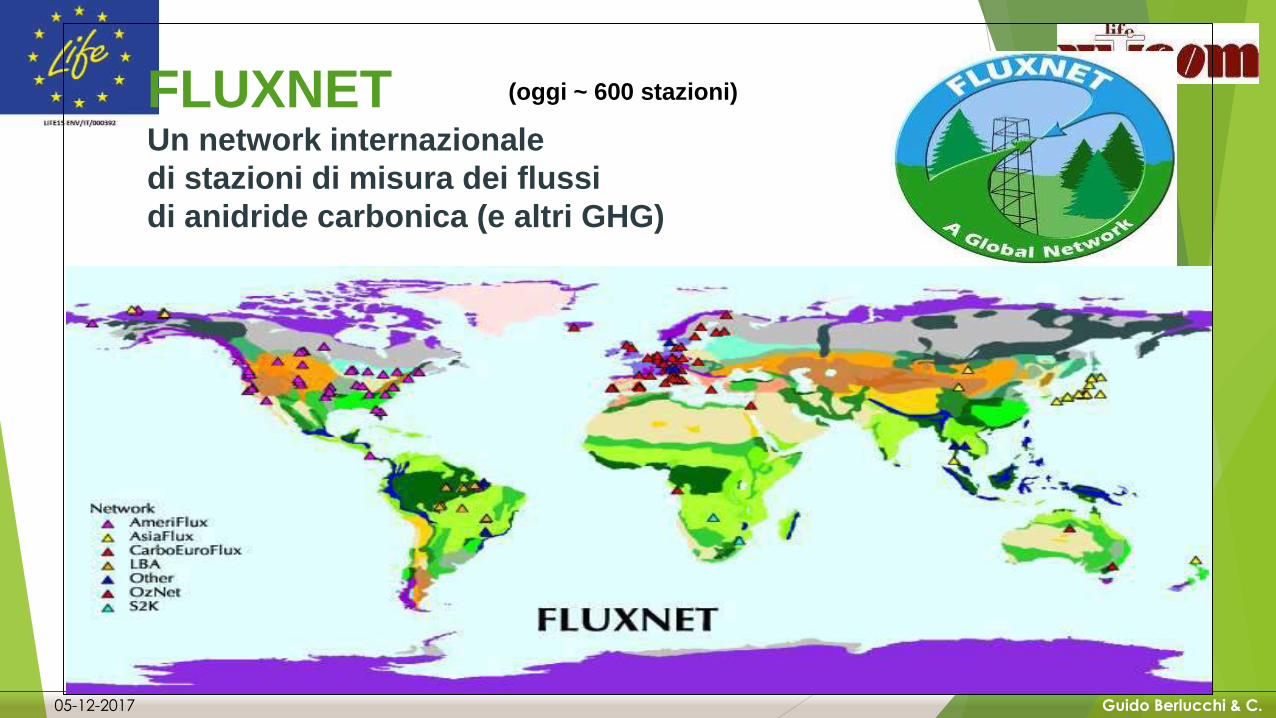
FLUXNETUn network internazionaledi stazioni di misura dei flussidi anidride carbonica (e altri GHG)
(oggi ~ 600 stazioni)