
Accepted 15 June 2018 - nottingham-repository.worktribe.com
19
Page 1 of 19 Accepted 15 June 2018 J. Engineering Failure Analysis An experimental investigation of the effect of defect shape and orientation on the burst pressure of pressurised pipes Sultan Al-Owaisi 1 , Adib A. Becker* 1 , Wei Sun 1 , Abdullah Al-Shabibi 2 , Majid Al-Moharbi 2 , Tasneem Pervez 2 , Hussain Al-Salmi 3 1 Faculty of Engineering, University of Nottingham, Nottingham NG7 2RD, UK 2 College of Engineering, Mechanical and Industrial Engineering Department, Sultan Qaboos University, Oman 3 Petroleum Development Oman, Muscat, Oman ABSTRACT The burst pressure of commonly used ductile steel pipes in oil and gas industries, i.e. X52 and X60, is measured under internal pressure loading. The pipes were machined with circular and boxed defects at different orientations to simulate actual metal loss defects. Defect shapes and orientations were investigated in detail to study how they affect the failure behaviour of interacting defects. The experimental burst pressure results were compared with those obtained using existing analytical methods from Design Codes. Comparison of the results showed conservatism in the existing analytical methods which may potentially lead to unnecessary plant shutdowns and pipe repairs. The outcome of the experimental tests revealed that the shapes of the defects have very small influence on the defect interaction behaviour. The burst tests interestingly showed that the defect orientation has an important effect on defect interaction. Defects oriented in the hoop and diagonal directions showed no defect interaction even when spaced by a distance of one wall thickness, while defects oriented in the longitudinal directions showed that defects interact even when the spacing is up to six wall thickness but the interaction fades away for defects spaced at longer distances. Highlights Experimental 31 pipe burst tests with machined metal loss defects analysed The effects of defect shape, orientation and interaction are investigated Results compared with existing analytical methods from Design Codes Degree of conservatism in the existing design codes discussed Results show that defect orientation has an important effect on defect interaction Keywords Defect assessment; pipe damage; burst pressure; ductile carbon steel pipe; Finite Element Analysis. * Corresponding author Email address: [email protected]
Transcript of Accepted 15 June 2018 - nottingham-repository.worktribe.com

Page 1 of 19
Accepted 15 June 2018
J. Engineering Failure Analysis
An experimental investigation of the effect of defect shape and orientation on the burst
pressure of pressurised pipes
Sultan Al-Owaisi1, Adib A. Becker*1, Wei Sun1, Abdullah Al-Shabibi2, Majid Al-Moharbi2, Tasneem Pervez2, Hussain Al-Salmi3
1 Faculty of Engineering, University of Nottingham, Nottingham NG7 2RD, UK 2 College of Engineering, Mechanical and Industrial Engineering Department, Sultan Qaboos University, Oman 3 Petroleum Development Oman, Muscat, Oman
ABSTRACT The burst pressure of commonly used ductile steel pipes in oil and gas industries, i.e. X52 and X60, is measured under internal pressure loading. The pipes were machined with circular and boxed defects at different orientations to simulate actual metal loss defects. Defect shapes and orientations were investigated in detail to study how they affect the failure behaviour of interacting defects. The experimental burst pressure results were compared with those obtained using existing analytical methods from Design Codes. Comparison of the results showed conservatism in the existing analytical methods which may potentially lead to unnecessary plant shutdowns and pipe repairs. The outcome of the experimental tests revealed that the shapes of the defects have very small influence on the defect interaction behaviour. The burst tests interestingly showed that the defect orientation has an important effect on defect interaction. Defects oriented in the hoop and diagonal directions showed no defect interaction even when spaced by a distance of one wall thickness, while defects oriented in the longitudinal directions showed that defects interact even when the spacing is up to six wall thickness but the interaction fades away for defects spaced at longer distances.
Highlights
Experimental 31 pipe burst tests with machined metal loss defects analysed
The effects of defect shape, orientation and interaction are investigated
Results compared with existing analytical methods from Design Codes
Degree of conservatism in the existing design codes discussed
Results show that defect orientation has an important effect on defect interaction Keywords Defect assessment; pipe damage; burst pressure; ductile carbon steel pipe; Finite Element Analysis. * Corresponding author Email address: [email protected]
Page 2 of 19
1. Introduction Metal loss defects as a result of corrosion, both internal and external, are insidious forms of pipe damage that have the potential, when unrecognized, to result in premature pipe failure. Corrosion defects occur in the form of single and cluster defects with each having different consequences, either localised leak or rupture. Between 2010 and 2013, pipe failures due to corrosion and material degradations resulted in financial loss of more than $466 million of estimated total costs to gas pipe network operators [1]. The ability to predict the failure pressure of each of these forms of corrosion defects is extremely valuable to pipe operators to safeguard integrity. Better understanding of pipe failure also paves the way to improvements in future repair and maintenance related strategies. Defect assessment has been researched since the 1970’s right up to the present time. In chronological order, a number of examples, both experimental and numerical, are given in references [2-15]. The most widely used code for single defect assessments is ASME B31G which utilizes semi-empirical method [16]. However, this code provides no guidance for assessing defects that are closely spaced to each other. Interacting defects that are sufficiently spaced close to each other, result in failure pressures that are lower than those for single or individual defects and tend to fail in a rupture manner. API 579 formulae were derived from the modified ASMEB31G code as the origin where these were considered in detail in the study. The DNV RP F101 code [17] recommended practice is widely used in industry for predicting the failure pressure of both single and interacting defects. Though both codes are widely used in the oil and gas sectors, conservatism in evaluating the safe working pressure has been cited in several research works [7, 10, 14, 15, 18-20]. Literature reviews [21-23] have indicated that around 360 pipe burst tests have been conducted since 1970. The vast majority of these tests were mainly conducted on single defects. There are a few experimental burst projects carried out on interacting defects, such as the early work of Mok et al. [24] in 1990 and, more recently, Freire José et al. [25] in 2013. Due to insufficient data available on parameters such as defect dimensions, actual vs nominal pipe wall thicknesses and material properties, it is difficult to replicate the majority of the tests referred to in the literature for further research. The work described herein is aimed at analysing, for the first time, experimentally the sensitivity of the shapes and orientations of interacting metal loss defects in two different grades of ductile carbon steel, X52 and X60, commonly used in the oil and gas industries. An internal pressure is applied in closed-end pipes until burst occurs. The applied pressure increases the likelihood of failure being controlled by the stress state in and around the vicinity of the machined defects leading to two modes of failures; either local leak or rupture if the defects are interacting. 2. Defect assessment codes and recommended practices – single and interacting The manual of corrosion defect assessment was initially published in 1984 by the American Society of Mechanical Engineers (ASME) following extensive work by the American Gas Association (AGA) in the early 1970’s [5]. AGA carried out experiments on pipes with various sizes of single corrosion metal loss defects to develop methods for predicting burst pressures. The ASME B31G committee further validated the methodology adopted by AGA through an experimental program of 47 full-scale tests of pipelines containing actual corrosion defects [21]. Unfortunately, specific details with regards to the defects morphology and steel mechanical properties used are not available. The tests performed were limited up to API 5L Grade X52 pipelines with a diameter of 762 mm and up to a wall thickness of 9.5 mm [26]. Both the 1984 and 1991 revisions of ASMEB31 are described by several papers, see for example [27, 28], as overly conservative methods as they have the following limitations: o They take into account only the specified minimum yield strength (SMYS) compared to the value of the
ultimate tensile strength of the material, which is in fact the dominant material property for the rupture of pipes made from reasonably tough materials in areas with blunt metal losses and when cracks are not present.
o They are not valid for defects occurring in welds or heat affected zones.
o They are based on single defects with a parabolic shape.
o They give conservative results for long defects, as any defect with a length greater than (20 Dt)0.5, where D is the external diameter and t is the wall thickness, is considered as an infinite defect. In other words, the values for burst pressures predicted for longer defects are excessively low. The main reason for the
Page 3 of 19
conservative estimation of the burst pressure is the hypothesis of infinite length mentioned above together with the expressions adopted to calculate the flow stress.
The failure pressure (Pf) based on the original ASME B31G-1984 is calculated as per the below equations. For short length defects that have parabolic shapes where L is ≤ (20 Dt)0.5 , the failure pressure, Pf, is defined by the following equation:
𝑃𝑓 = 2 (1.1 𝜎𝑦) 𝑡
𝐷 [1 −
2𝑑3𝑡
1 −2𝑑3𝑡𝑀
] (1)
where, D is the external diameter, t is the wall thickness, σy is the Specified Minimum Yield Strength (SMYS), and M is the Folias Factor (Bulging Factor). For longer length defects that have rectangular shapes where L is > (20 Dt)0.5, the failure pressure, Pf, is calculated by the following equation:
𝑃𝑓 = 2 (1.1 𝜎𝑦) 𝑡
𝐷 [1 −
𝑑𝑡
1 −𝑑𝑡𝑀
]
(2)
The Folias factor, bulging factor, M is a geometric parameter developed to account for the stresses induced by the bulging which occurs at the corrosion defect of a pressurised pipelines [29]. For the above failure pressure cases, M is calculated by the following equation:
𝑀 = √1 + 0.6275𝐿2
𝐷𝑡− 0.003375 (
𝐿2
𝐷𝑡)
2
(3)
Based on further experiments, ASME B31G was revised in 1991 [30], by modifying both the Folias factor and the failure pressure for long defects as follows:
M = √1 +0.8L2
Dt
(4)
In 2009, ASME B31G [31] was further refined to overcome the limitations built in the 1984 and 1991 revisions by modifying the Folias factor and the defect geometrical approximation factors. The failure pressure, Pf, was given as follows:
Pf =2σyt
D[1 − 0.85
dt
1 − 0.85dtM
] (5)
where M is defined as
M =
{
√1 + 0.6275
𝐿2
𝐷𝑡− 0.003375 (
L2
Dt)2 For L ≤ √50 Dt
0.032 (L2
Dt) + 3.3 For L > √50 Dt
(6)
As stated earlier, this method continued to give a conservative failure pressure for cases where the pipeline contains interacting defects and even for single individual defects. British Gas Technology (BGT) along with Det Norske Veritas (DNV) joined together in 1999 through a task force to come up with an assessment method which reduces the conservatism built in the ASME B31G code and can be further used for high strength steels [8]. The outcome of this joint collaboration led to the release of a recommended code of practice which not only calculates the safe working pressure (SWP) of single defects subjected to internal pressure but also calculates the SWP for complex defects under various loads.
Page 4 of 19
The failure pressure in DNV RP F101 code [17] is obtained via the following formula:
𝑃𝑓 = 𝛾𝑚2 𝜎𝑈 𝑡
𝐷 − 𝑡[1 − 𝛾𝑑 (
𝑑𝑡)
1 − 𝛾𝑑 (𝑑𝑡 𝑄)]
(7)
where γm is the partial safety factor for longitudinal corrosion model prediction, σu is the ultimate tensile strength, γd is the partial safety factor for corrosion depth, and Q is a length correction factor. The Folias factor has been replaced by the Q factor which is based on laboratory tests conducted by DNV [32] and calculated as follows:
𝑄 = √1 + 0.31 (𝐿2
𝐷 𝑡)
(8)
The validity of the Folias factor used by ASME B31G was investigated by Cronin and Pick [27] and found to be inconsistent with the corresponding Finite Element (FE) results. The DNV RP F101 manual considers both single and complex (interacting) shaped defects, the details of which can be further accessed in the manual itself. Based on the DNV recommended practice, there is no interaction between defects if the longitudinal and circumferential distances satisfy the following conditions:
𝐿𝑜𝑛𝑔𝑖𝑡𝑢𝑑𝑖𝑛𝑎𝑙 𝑙𝑖𝑚𝑖𝑡 (𝑆𝑙) > 2.0√𝐷𝑡 (9)
𝐶𝑖𝑟𝑐𝑢𝑚𝑓𝑒𝑟𝑒𝑛𝑡𝑖𝑎𝑙 𝑙𝑖𝑚𝑖𝑡 (𝑆𝑐) > 𝜋√𝐷𝑡 (10)
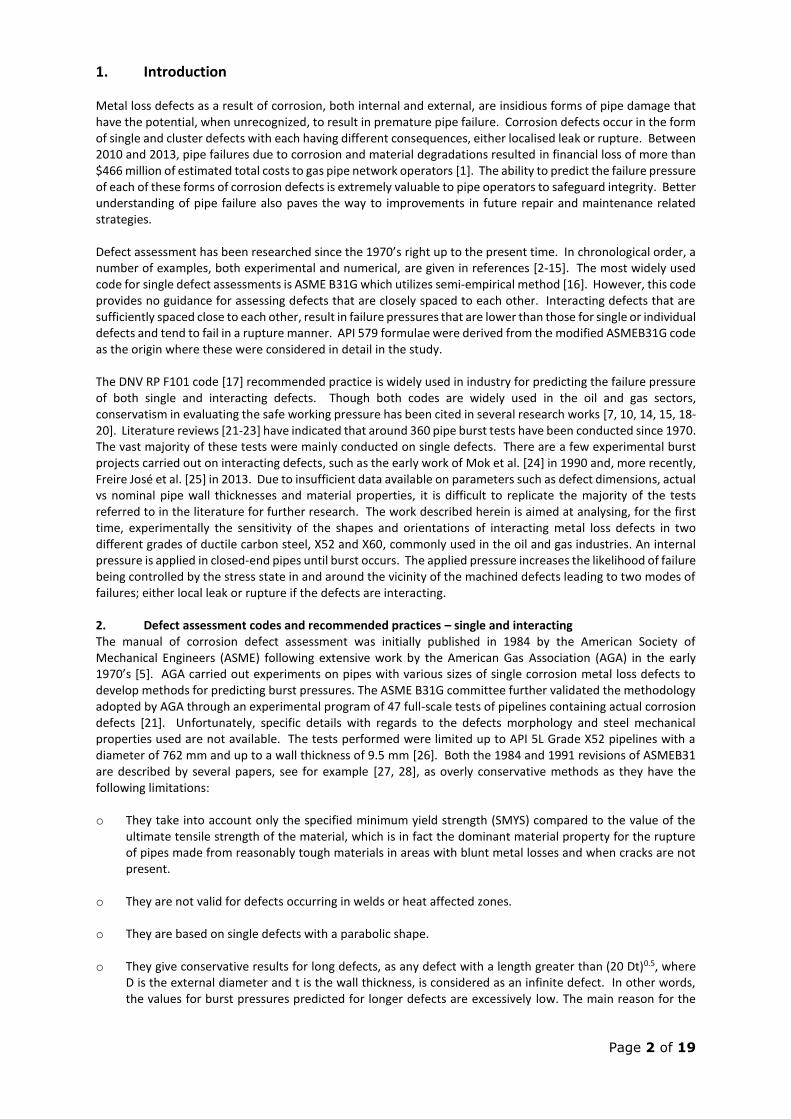
3. Experimental Setup 3.1 Material characteristics Two grades of ductile carbon steel seam-welded pipes that are manufactured based on API 5L standard (ISO 3183); namely X52 (L360) and X60 (L415), were used in the present work. These materials were chosen to represent typical steel grades used in pipes in the oil and gas industries. The thickness used for X52 is 9.5 mm and for X60 three wall thicknesses were used; 8.9 mm, 9.5 mm and 10.5 mm. The diameters and wall thicknesses chosen for this study are typical dimensions for oil and gas transmission pipes. To facilitate the numerical simulation of the pipe tests, mechanical characterization of the tested materials was carefully undertaken. This included uniaxial tensile tests in both the circumferential and longitudinal directions. The sample preparation and the conduction of the tensile tests were performed in accordance with the ASTM-E8 standard [33]. The uniaxial tensile true stress-true strain curves of the X52 and X60 pipes are shown in Figure 1. The behaviour of these two materials as seen in the stress-strain curve is initially elastic followed by plastic behaviour after a yield stress of 372 MPa for the X52 pipe and 478-506 MPa for the X60 pipes. Strain hardening behaviour is clearly observed before reaching the ultimate tensile strength. Tables 1 and 2 list the extracted mechanical properties from the true stress-true strain curves of X52 and X60 materials. It should be noted that the value of the ‘true’ ultimate tensile strength (UTS) is obtained by converting the ‘engineering’ UTS into the true stress value.
Page 5 of 19
Figure 1: True Stress Strain Data for all tested samples
Table 1: Mechanical properties extracted from the true stress-true strain curves of X52 material
Modulus of Elasticity (GPa)
Yield Strength (MPa)
Ultimate Tensile Strength (MPa)
Average 182 372 607
Table 2: Mechanical properties extracted from the true stress-true strain curves of X60 materials
Wall thickness Modulus of Elasticity (GPa)
Yield Strength (MPa)
Ultimate Tensile Strength (MPa)
8.9 mm 171 478 636
9.5 mm 195 456 645
10.5 mm 183 506 678
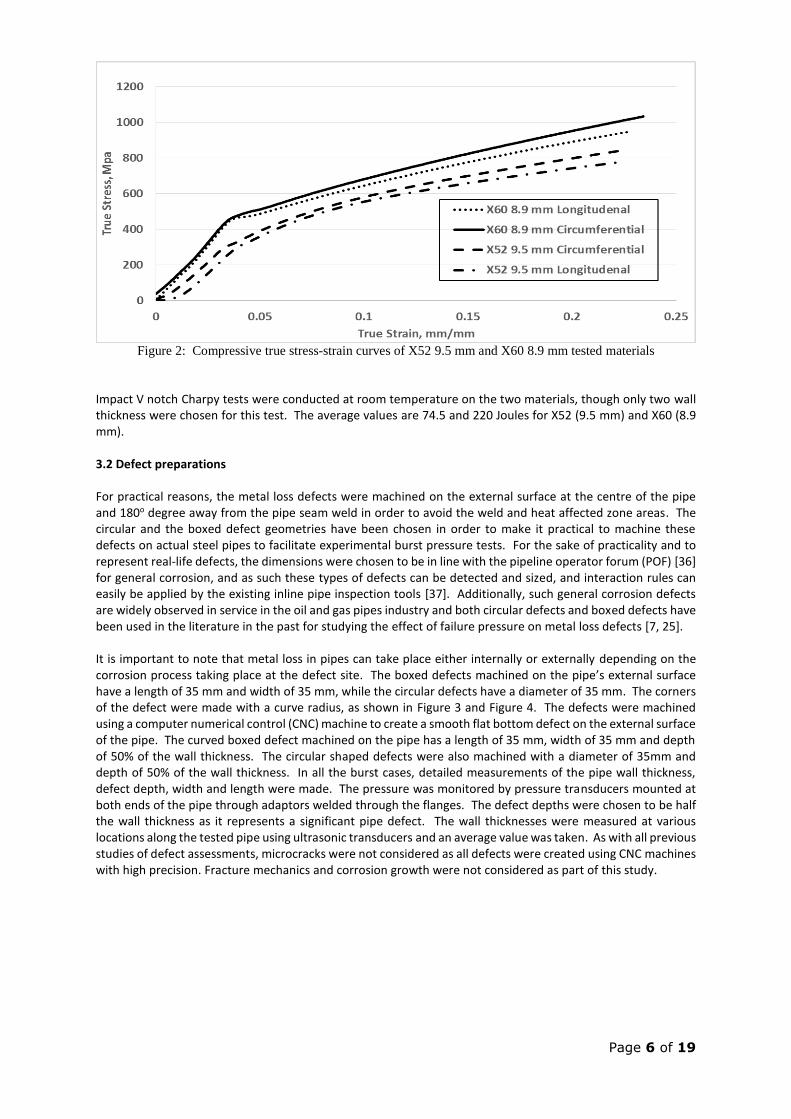
Compression tests have also been carried out on both materials (X52 with 9.5 mm thickness and X60 with 8.9 mm thickness) along two principal directions of the pipes: circumferential and longitudinal. Stress in the radial direction is of no importance in the tests as it plays a minimal role (radial stress through the wall thickness being very small due to the very small thickness/diameter ratio). The compression samples were 4×4×8 mm. All tests were performed without the use of an extensometer. These tests have been carried out using a strain rate of 2.5 × 10⁻⁴ s-1 and up to a compressive strain of 0.25 mm/mm. Figure 2 shows the true stress-strain curves, where it is clearly seen that the mechanical behaviours of both pipe materials along the longitudinal and circumferential directions are quite similar, indicating that these ductile steel materials have an isotropic behaviour. Similar findings were also reported in the literature, see for example [34]. It can be concluded from the compressive stress-strain curves that the longitudinal direction specimen data can be used for the circumferential direction too as isotropy prevails in this case. It is also clear that the circumferential compressive yield strength of X52 is higher than that of the longitudinal one which could be attributed to the presence of some residual stresses existing in the pipe as a result of the pipe manufacturing processes [35].
0
100
200
300
400
500
600
700
0 0.02 0.04 0.06 0.08 0.1 0.12 0.14 0.16 0.18 0.2
Tru
e S
tre
ss (
MP
a)
True Strain (mm/mm)
X60 10.5mm X60 9.5mm
X60 8.9mm X52 9.5mm
Page 6 of 19
Figure 2: Compressive true stress-strain curves of X52 9.5 mm and X60 8.9 mm tested materials
Impact V notch Charpy tests were conducted at room temperature on the two materials, though only two wall thickness were chosen for this test. The average values are 74.5 and 220 Joules for X52 (9.5 mm) and X60 (8.9 mm).
3.2 Defect preparations For practical reasons, the metal loss defects were machined on the external surface at the centre of the pipe and 180o degree away from the pipe seam weld in order to avoid the weld and heat affected zone areas. The circular and the boxed defect geometries have been chosen in order to make it practical to machine these defects on actual steel pipes to facilitate experimental burst pressure tests. For the sake of practicality and to represent real-life defects, the dimensions were chosen to be in line with the pipeline operator forum (POF) [36] for general corrosion, and as such these types of defects can be detected and sized, and interaction rules can easily be applied by the existing inline pipe inspection tools [37]. Additionally, such general corrosion defects are widely observed in service in the oil and gas pipes industry and both circular defects and boxed defects have been used in the literature in the past for studying the effect of failure pressure on metal loss defects [7, 25]. It is important to note that metal loss in pipes can take place either internally or externally depending on the corrosion process taking place at the defect site. The boxed defects machined on the pipe’s external surface have a length of 35 mm and width of 35 mm, while the circular defects have a diameter of 35 mm. The corners of the defect were made with a curve radius, as shown in Figure 3 and Figure 4. The defects were machined using a computer numerical control (CNC) machine to create a smooth flat bottom defect on the external surface of the pipe. The curved boxed defect machined on the pipe has a length of 35 mm, width of 35 mm and depth of 50% of the wall thickness. The circular shaped defects were also machined with a diameter of 35mm and depth of 50% of the wall thickness. In all the burst cases, detailed measurements of the pipe wall thickness, defect depth, width and length were made. The pressure was monitored by pressure transducers mounted at both ends of the pipe through adaptors welded through the flanges. The defect depths were chosen to be half the wall thickness as it represents a significant pipe defect. The wall thicknesses were measured at various locations along the tested pipe using ultrasonic transducers and an average value was taken. As with all previous studies of defect assessments, microcracks were not considered as all defects were created using CNC machines with high precision. Fracture mechanics and corrosion growth were not considered as part of this study.

Page 7 of 19
Figure 3: Schematic drawing of the boxed defects
Figure 4: Schematic drawing of the circular defects
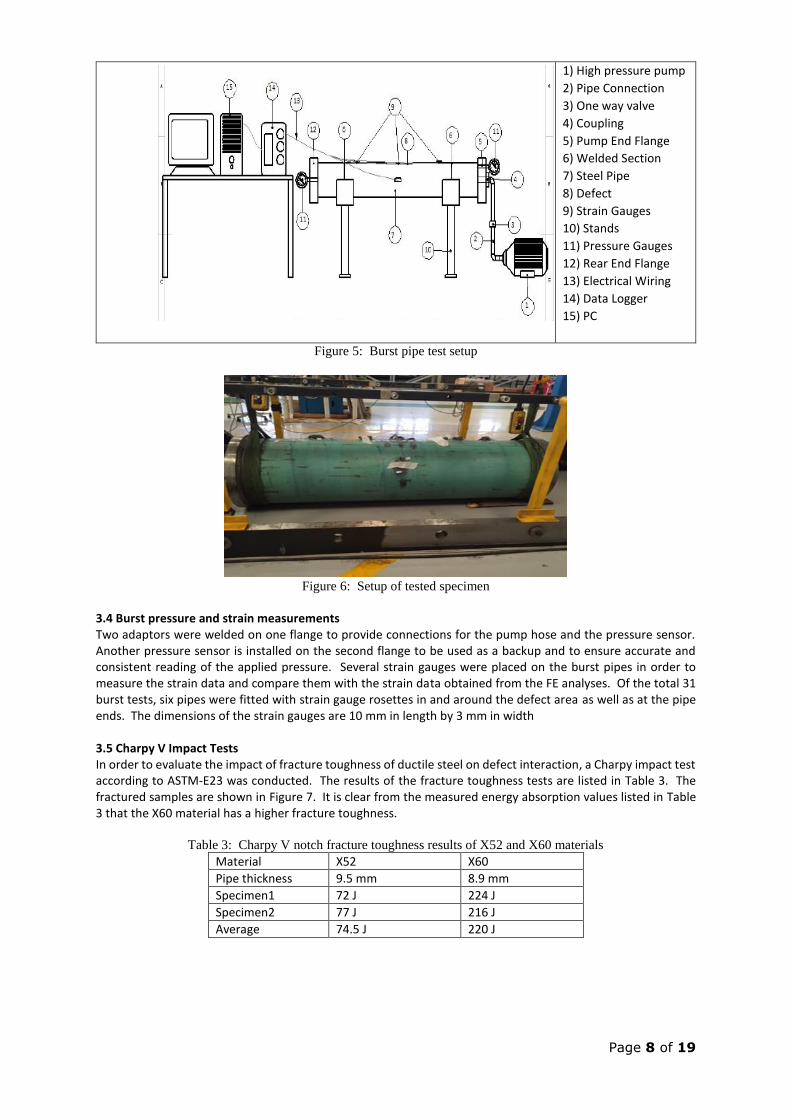
3.3 Test rig details and specimen dimensions Figure 5 shows a schematic diagram of the test assembly. The test setup mainly consists of test specimen, high pressure pump, strain and pressure gauges, and a data logger. Each test specimen consists of 1.8 meter long pipe welded to 50 mm thick flanges made from carbon steel as shown in Figure 6.
Page 8 of 19
1) High pressure pump
2) Pipe Connection
3) One way valve
4) Coupling
5) Pump End Flange
6) Welded Section
7) Steel Pipe
8) Defect
9) Strain Gauges
10) Stands
11) Pressure Gauges
12) Rear End Flange
13) Electrical Wiring
14) Data Logger
15) PC
Figure 5: Burst pipe test setup
Figure 6: Setup of tested specimen
3.4 Burst pressure and strain measurements Two adaptors were welded on one flange to provide connections for the pump hose and the pressure sensor. Another pressure sensor is installed on the second flange to be used as a backup and to ensure accurate and consistent reading of the applied pressure. Several strain gauges were placed on the burst pipes in order to measure the strain data and compare them with the strain data obtained from the FE analyses. Of the total 31 burst tests, six pipes were fitted with strain gauge rosettes in and around the defect area as well as at the pipe ends. The dimensions of the strain gauges are 10 mm in length by 3 mm in width 3.5 Charpy V Impact Tests In order to evaluate the impact of fracture toughness of ductile steel on defect interaction, a Charpy impact test according to ASTM-E23 was conducted. The results of the fracture toughness tests are listed in Table 3. The fractured samples are shown in Figure 7. It is clear from the measured energy absorption values listed in Table 3 that the X60 material has a higher fracture toughness.
Table 3: Charpy V notch fracture toughness results of X52 and X60 materials
Material X52 X60
Pipe thickness 9.5 mm 8.9 mm
Specimen1 72 J 224 J
Specimen2 77 J 216 J
Average 74.5 J 220 J

Page 9 of 19
Figure 7: Fractured Charpy v notch samples of (a) X60-8.9 mm and (b) X52-9.5 mm materials.
4. Experimental Results 4.1 Introduction A series of 31 hydrostatic burst tests on pipes containing machined single and double defects with a depth of 50% of the wall thickness were conducted. This has provided an exceptional prospect to investigate the defect interaction behaviour of various defect shapes, orientations and spacings. The predicted failure pressures were obtained using ASME B31G [16] and DNV RP F 101 [17] recommended practice. It was observed that both, the ASME code as well as the DNV recommended practice, yielded conservative results in relation to the actual burst pressure. In general, interacting defects were judged by the presence of cracks extending between the two defects, and the differences between the predictions and the experiments were larger than those for single defects. The results are summarised in Table 3. The table lists the findings of the 31 burst tests such as the exact dimensions of the machined defects, the actual pipe thicknesses where defects were positioned, the burst pressure and the occurrence of interaction between defects. These exact dimensions are crucial for reliable comparison between the analytical defect assessment methods and the test measured parameters. The physical failure mechanism for the defects was noted with the following observations: An increase in pressure leads to plastic deformation and localised bending & thinning at the defect area Failure following the plastic deformation at the defect area is characterised by two routes; either local
failure (leak) or rupture throughout and beyond the defects area. The behaviour of failure depends on the defect morphology, toughness of the material, and pre-existing imperfections. It was observed that all the single defects failed locally through leak which could be attributed to the short length of the defects.

Page 10 of 19
Table 4: Experimental test results
Grade t Type OrientationLength
(mm)
Width
(mm)
Depth
(mm)Exp
ASME
B31G
(Single)
DNV
(Single)
Modified
B31G
DNV
(Interacting)
175.8 187.6 180 NA
-10.03 -3.99 -7.88 NA
176.2 187.9 182.4 NA
-11.77 -5.91 -8.66 NA
183 208 175.5 172.2
-3.94 9.19 -7.87 -9.61
162.7 181.1 176.3 172
-15.92 -6.41 -8.89 -11.11
165.9 186.1 171.1 165.6
-12.82 -2.21 -10.09 -12.98
182 181.5 172.02 165.5
-7.19 -7.45 -12.28 -15.60
178.5 202.6 189 184.7
-7.61 4.87 -2.17 -4.40
181.3 205.8 188.7 184.5
-7.03 5.54 -3.23 -5.38
180.7 205.1 188.6 184.4
-7.90 4.54 -3.87 -6.01
180 204.3 188.7 184.5
-7.12 5.42 -2.63 -4.80
222.4 235.4 232.7 NA
-9.85 -4.58 -5.67 NA
196.4 202 214.5 196.4
-18.74 -16.43 -11.25 -18.74
193.5 197.2 215.3 196.3
-22.60 -21.12 -10.92 -18.78
189.8 191.4 215.7 195.6
-21.96 -21.30 -10.76 -19.07
195.8 201.9 210 190.5
-18.21 -15.66 -13.12 -21.18
194.6 199.1 211.8 190.5
-18.37 -16.48 -12.37 -21.18
191.5 194.4 211.6 189.3
-20.54 -19.34 -12.45 -21.68
144.9 191 160.9 NA
-25.88 -2.30 -17.70 NA
138.3 174.5 148.6 159.3
-27.63 -8.69 -22.24 -16.64
129.4 159.1 149.8 158.3
-33.95 -18.79 -23.53 -19.19
127.5 155.4 150.2 158
-35.11 -20.92 -23.56 -19.59
126.5 153 151.2 157.5
-37.00 -23.80 -24.70 -21.56
126.2 151.1 152.1 158.1
-37.74 -25.46 -24.96 -22.00
138.5 174.8 143.6 151.8
-24.81 -5.10 -22.04 -17.59
129.5 159.4 146.1 151.9
-31.01 -15.08 -22.16 -19.07
127.8 155.8 147 152.2
-33.71 -19.19 -23.76 -21.06
127 153.5 148.56 152.36
-36.21 -22.90 -25.38 -23.48
125.6 150.4 149.1 152.39
-36.34 -23.77 -24.43 -22.76
151.5 193.3 158.9 169.9
-22.51 -1.13 -18.72 -13.09
149.9 191.2 161.1 172.7
-27.51 -7.54 -22.10 -16.49
149.9 191.2 161.1 172.7
-23.79 -2.80 -18.10 -12.20
-21.12 -9.96 -14.76 -16.12
Defect
Spacing
Xt(mm)
Failure Pressure (Bar)
Difference % Experimental Vs. PredictedTest
Case
No.
Pipe Details
(All with OD of 508
mm)
Defect Type and
Orientation
B = Boxed
C = Circular
Actual. Defect Dimensions
(mm)
9.65 C Longitudinal 35.5 35.5
8.88 B
0.5t 1t (9.65) 190.50 Yes
X601
X602
X603
Average difference percentage (Experimental Vs. Predicted)
NA
NA
195.40
8.88 C Single 34.1 34.1 0.5t Single 199.70
Single 35 35 0.5t Single
2t (19.2) 193.50 Yes
B Longitudinal 35 35 0.5t 1t (9.54) 190.30 Yes
C Longitudinal 35.4 35.4 0.5t
No196.20
193.201t (9.44)0.5t
9.54 Yes196.102t (19.1)0.5t3535LongitudinalB
No193.802t (19.0)0.5t35.235.2DiagonalC 9.52
195.002t (19.4)0.5t3535HoopB
35HoopB
X604
X605
10.6
X60 8
X609
X6010
X6011
X606
X607
9.58
9.55
9.44
9.54
9.61
1t (9.55)0.5t
Yes250.004t (42.6)0.5t
Yes241.703t (32.1)0.5t37.237.2LongitudinalC10.7
35
No
35.3
243.205t (53.7)0.5t37.237.2LongitudinalC10.65
246.70Single0.5t
35.3DiagonalC
C
16
X6013 37.237.2LongitudinalC10.7
X6014
10.6X6015
X6012
35.137.1Single
X60
B10.7X60
3535LongitudinalB10.7
239.403t (32.1)0.5t
4t (42.8)0.5t
195.5033.9 Single0.5t
241.005t (53.5)0.5t35.135.1Longitudinal
238.40
3535LongitudinalB
17 No
18 9.7X52 35.5SingleC
Yes
LongitudinalC9.85
4t (38.7)
1t (9.90)0.5t
C Longitudinal 35.5 33.5 0.5t 195.90
191.103535
X5221
20 X52 9.7
X5219
196.505t (48.7)0.5t33.635.5LongitudinalC9.7
X5223
LongitudinalC9.75 200.806t (58.2)0.5t33.635.8
202.707t (67.9)0.5t33.635.4LongitudinalC9.8
X5222
X5224
187.704t (39.0)0.5t34.935LongitudinalB9.7X5225
LongitudinalB9.86 184.201t (9.70)0.5t3535
X5226
199.106t (58.2)0.5t3535LongitudinalB9.7X5227
LongitudinalB9.7 192.805t (48.6)0.5t3535
28 X52 9.7 197.30B Longitudinal 35 35 0.5t 7t (68.0)
X5229 195.501t (9.75)0.5t3535HoopB9.8
X5230
196.700.5t (4.80)0.5t33.835.5DiagonalC9.7X5231
HoopC9.7 206.800.5t (4.80)0.5t33.735.5 No
Yes
Yes
No
Yes
Yes
Yes
Yes
No
Yes
Yes
No
Yes
NA
Yes
No
NA
No
Defects
interaction
(Yes/No/NA)
Page 11 of 19
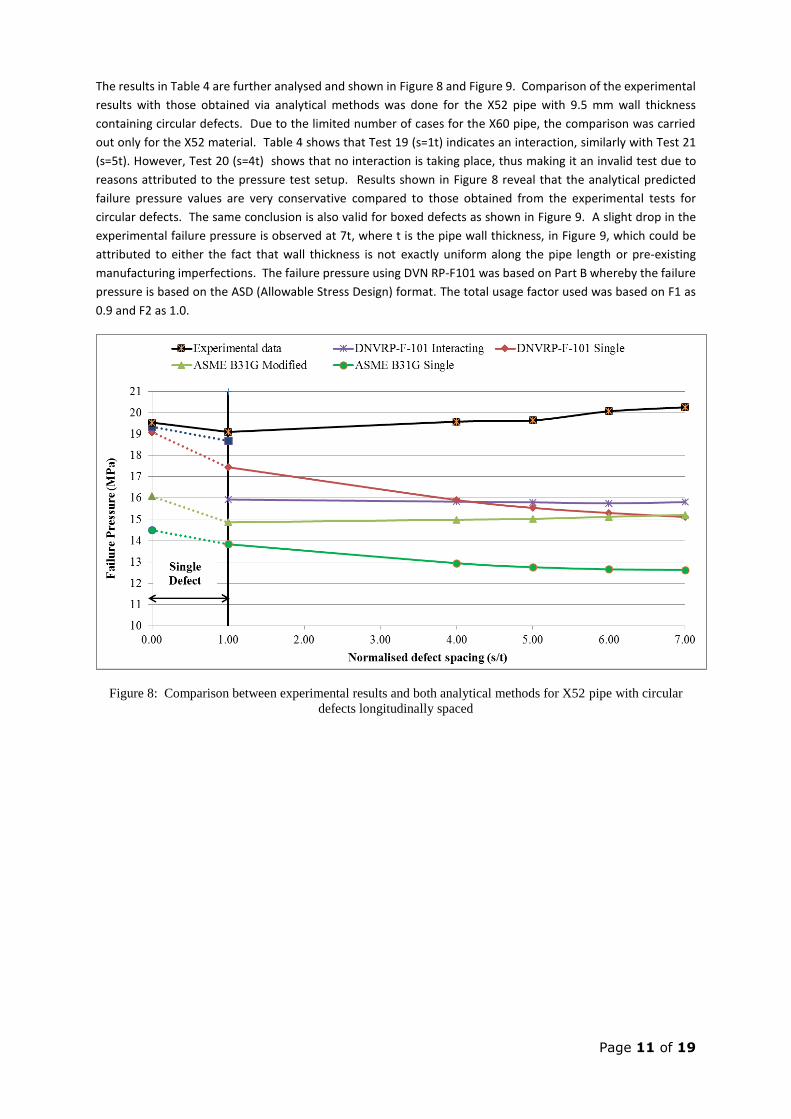
The results in Table 4 are further analysed and shown in Figure 8 and Figure 9. Comparison of the experimental
results with those obtained via analytical methods was done for the X52 pipe with 9.5 mm wall thickness
containing circular defects. Due to the limited number of cases for the X60 pipe, the comparison was carried
out only for the X52 material. Table 4 shows that Test 19 (s=1t) indicates an interaction, similarly with Test 21
(s=5t). However, Test 20 (s=4t) shows that no interaction is taking place, thus making it an invalid test due to
reasons attributed to the pressure test setup. Results shown in Figure 8 reveal that the analytical predicted
failure pressure values are very conservative compared to those obtained from the experimental tests for
circular defects. The same conclusion is also valid for boxed defects as shown in Figure 9. A slight drop in the
experimental failure pressure is observed at 7t, where t is the pipe wall thickness, in Figure 9, which could be
attributed to either the fact that wall thickness is not exactly uniform along the pipe length or pre-existing
manufacturing imperfections. The failure pressure using DVN RP-F101 was based on Part B whereby the failure
pressure is based on the ASD (Allowable Stress Design) format. The total usage factor used was based on F1 as
0.9 and F2 as 1.0.
Figure 8: Comparison between experimental results and both analytical methods for X52 pipe with circular
defects longitudinally spaced

Page 12 of 19
Figure 9: Comparison between experimental results and analytical methods for X52 pipe with boxed defects
longitudinally spaced
4.2 Effects of defects shape and orientation 4.2.1 Burst pressure As stated earlier, two material grades of different wall thicknesses have been fabricated with circular and boxed machined defects to investigate their burst pressure capacity. As noted in the tensile test results, materials of same grade can have different strengths and therefore different burst pressures. The variation in the strength may be attributed to a number of factors, such as possible differences in the chemical composition, rolling, heat treatment and other manufacturing processes. Table 4 clearly shows that empirical formulae from the two assessment codes tend to underestimate the burst pressure for defected pipes when compared to the test data, up to a 21.1% difference. As for the effect of spacing between defects, the burst pressure tends to initially decrease when the defects are closely spaced and eventually converge to a steady value when the spacing increases, which can be taken as an indication of no further interaction. For example, in Test Case 15, the pressure was steady at 190.5 bars from a spacing of 3t to 5t although there is a negligible reduction at 5t which could be attributed to that fact that the pipe wall thickness is not uniform along the pipe length. All single defects failed locally and no further tearing beyond the defect area was observed. Figure 10 shows the failure experienced for a typical single defect in the X60 pipe. In all cases of circular single defects, failure was observed to occur at the centre of the defects, while failure in the boxed defects occurred either at the centre or at the base of the curve. The location of the failure for the boxed shape could be possibly due to the presence of imperfections created during the defect machining process or as a result of the stress concentration at the base of the boxed area.

Page 13 of 19
Figure 10: Typical failure of typical single circular and boxed defects in the X60 pipe
For the majority of the double longitudinal defects, the extent of rupture was observed to extend beyond the two defects area. The length of the crack appears to vary from one test to another depending on the material toughness of the tested pipes. Figure 11 shows the failure experienced in the X52 pipe when testing two adjacent defects, for circular and boxed defects, spaced by a distance of 6t. Kiefner et al. [2] stated that longitudinally oriented metal loss defects in an internally pressurized pipe have a two-fold concentration effect upon the hoop stress. First, they interrupt the hoop stress path along the length of the defect leading to a re-distribution of the stress longitudinally through the thickness with further concentration at its end. Second, the defects break the continuity of the pipe curvature leading to an outward radial deflection by means of bending moments. Longitudinal rupture will then depend on the state of stress within the pipe wall and the material toughness.
Figure 11: Typical failure of circular and curved boxed defects spaced by a distance of 6t in the X52 pipe
4.2.2 Defect Shapes The effects of defect shape on the burst pressure can be seen in Figure 11. For the circular defects, the failure seems to occur at the centre of the defect which then extends longitudinally through the ligament, joining the two defects together. The boxed defects seem to behave differently, where the failure appears to start at the defect corner and then progresses across the line joining the two defects. Additionally, pipes with boxed defects have slightly, but not significantly, lower burst pressure than circular defects, by up to 5% as seen in Test Cases 13 and 16. Interaction between the defects considered in this study, circular and boxed, occurs at the same spacing and fades away at the same distance as well.
Page 14 of 19
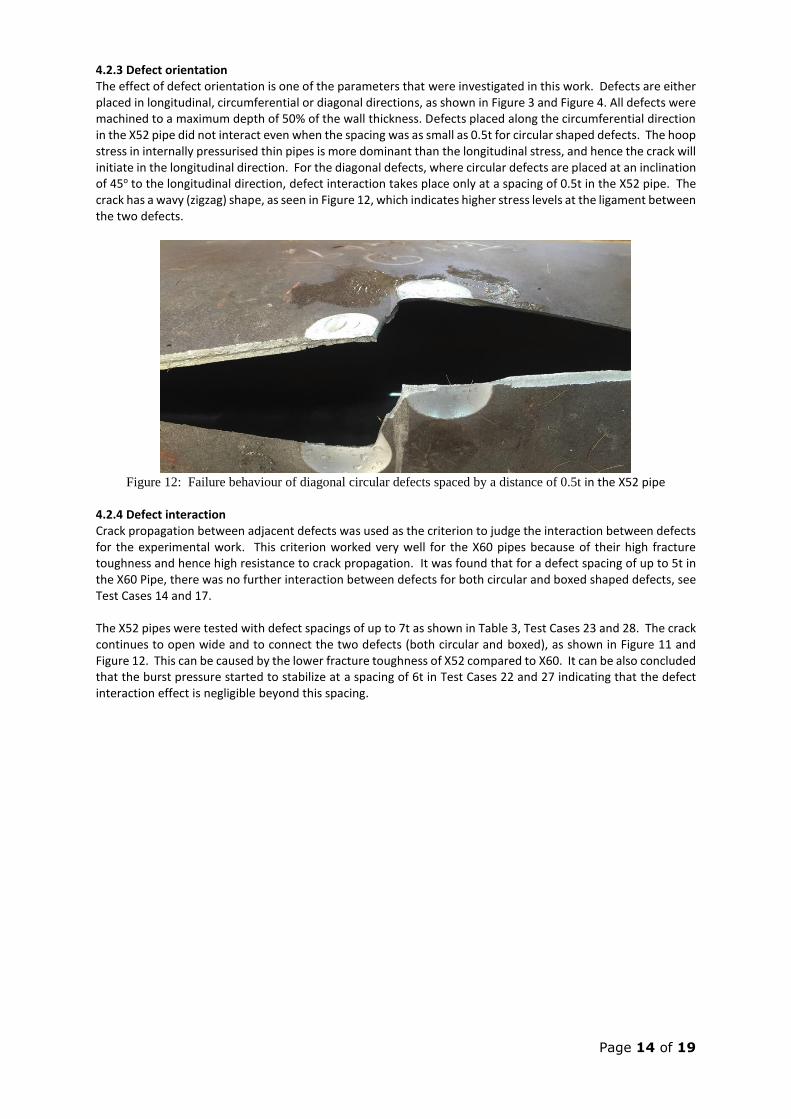
4.2.3 Defect orientation The effect of defect orientation is one of the parameters that were investigated in this work. Defects are either placed in longitudinal, circumferential or diagonal directions, as shown in Figure 3 and Figure 4. All defects were machined to a maximum depth of 50% of the wall thickness. Defects placed along the circumferential direction in the X52 pipe did not interact even when the spacing was as small as 0.5t for circular shaped defects. The hoop stress in internally pressurised thin pipes is more dominant than the longitudinal stress, and hence the crack will initiate in the longitudinal direction. For the diagonal defects, where circular defects are placed at an inclination of 45o to the longitudinal direction, defect interaction takes place only at a spacing of 0.5t in the X52 pipe. The crack has a wavy (zigzag) shape, as seen in Figure 12, which indicates higher stress levels at the ligament between the two defects.
Figure 12: Failure behaviour of diagonal circular defects spaced by a distance of 0.5t in the X52 pipe
4.2.4 Defect interaction Crack propagation between adjacent defects was used as the criterion to judge the interaction between defects for the experimental work. This criterion worked very well for the X60 pipes because of their high fracture toughness and hence high resistance to crack propagation. It was found that for a defect spacing of up to 5t in the X60 Pipe, there was no further interaction between defects for both circular and boxed shaped defects, see Test Cases 14 and 17. The X52 pipes were tested with defect spacings of up to 7t as shown in Table 3, Test Cases 23 and 28. The crack continues to open wide and to connect the two defects (both circular and boxed), as shown in Figure 11 and Figure 12. This can be caused by the lower fracture toughness of X52 compared to X60. It can be also concluded that the burst pressure started to stabilize at a spacing of 6t in Test Cases 22 and 27 indicating that the defect interaction effect is negligible beyond this spacing.
Page 15 of 19
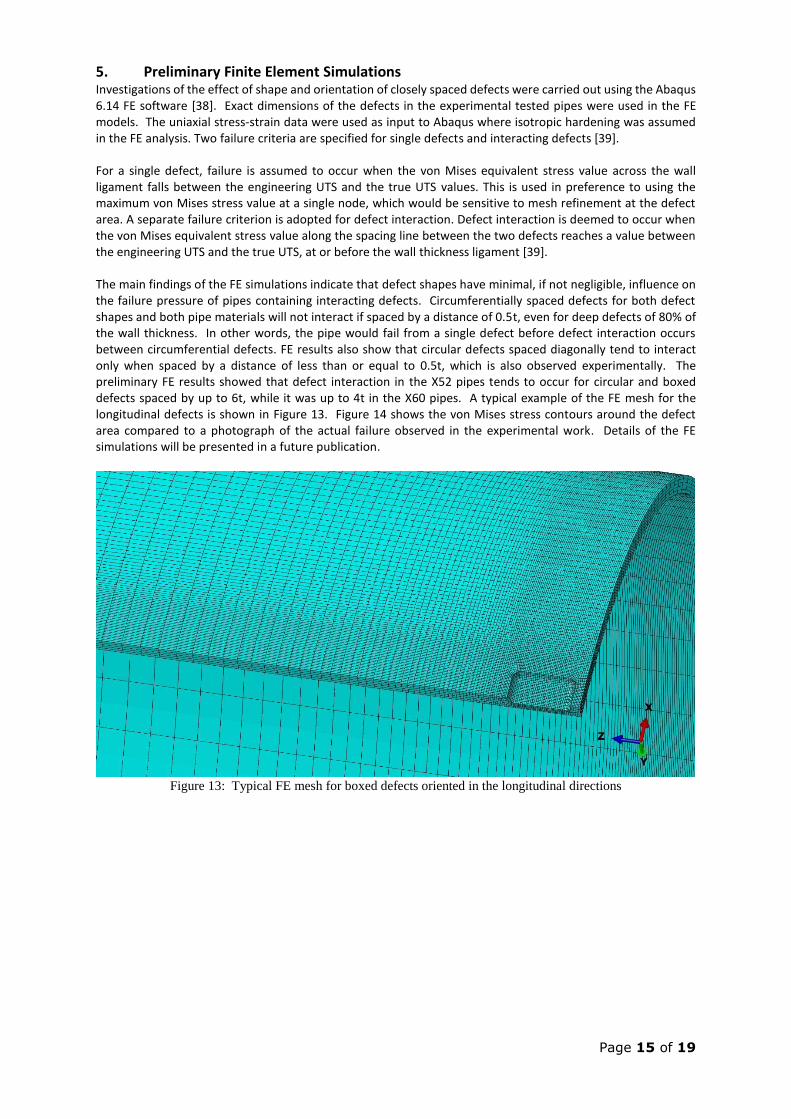
5. Preliminary Finite Element Simulations
Investigations of the effect of shape and orientation of closely spaced defects were carried out using the Abaqus 6.14 FE software [38]. Exact dimensions of the defects in the experimental tested pipes were used in the FE models. The uniaxial stress-strain data were used as input to Abaqus where isotropic hardening was assumed in the FE analysis. Two failure criteria are specified for single defects and interacting defects [39]. For a single defect, failure is assumed to occur when the von Mises equivalent stress value across the wall ligament falls between the engineering UTS and the true UTS values. This is used in preference to using the maximum von Mises stress value at a single node, which would be sensitive to mesh refinement at the defect area. A separate failure criterion is adopted for defect interaction. Defect interaction is deemed to occur when the von Mises equivalent stress value along the spacing line between the two defects reaches a value between the engineering UTS and the true UTS, at or before the wall thickness ligament [39]. The main findings of the FE simulations indicate that defect shapes have minimal, if not negligible, influence on the failure pressure of pipes containing interacting defects. Circumferentially spaced defects for both defect shapes and both pipe materials will not interact if spaced by a distance of 0.5t, even for deep defects of 80% of the wall thickness. In other words, the pipe would fail from a single defect before defect interaction occurs between circumferential defects. FE results also show that circular defects spaced diagonally tend to interact only when spaced by a distance of less than or equal to 0.5t, which is also observed experimentally. The preliminary FE results showed that defect interaction in the X52 pipes tends to occur for circular and boxed defects spaced by up to 6t, while it was up to 4t in the X60 pipes. A typical example of the FE mesh for the longitudinal defects is shown in Figure 13. Figure 14 shows the von Mises stress contours around the defect area compared to a photograph of the actual failure observed in the experimental work. Details of the FE simulations will be presented in a future publication.
Figure 13: Typical FE mesh for boxed defects oriented in the longitudinal directions

Page 16 of 19
Figure 14: von Mises stress across contours (in MPa) for a circular defect for X52 pipe with a depth of 50% of
wall thickness with a defect spacing of 0.5t. The inset figure shows the actual failure in the experimental test.
6. Discussion and Conclusions Experimental pipe burst tests on 31 pipes with circular and boxed defects were conducted to investigate the effect of defect shape, orientation and interaction of metal loss defects in X52 and X60 pipes with an external diameter of 508 mm and various wall thicknesses. The thickness used for X52 is 9.5 mm and for X60 three wall thicknesses were used; 8.9 mm, 9.5 mm and 10.5 mm. The interaction behaviour of defects spaced in the longitudinal direction is not as straightforward as originally thought during the initial setup of this project. This is due to the scattered range of material properties that can be observed in apparently identical pipe materials as a result of slightly different chemical compositions, rolling, heat treatments and mechanical processes such as the use of expanders. The outcome of the experiments, however, suggests that the shapes of the defects (circular and boxed) have a negligible influence on the interaction behaviour. The burst tests interestingly revealed that defect orientation is the most important factor when it comes to interaction. Both circular and boxed defects oriented in the hoop and diagonal directions exhibit no interaction even when spaced by a distance as small as 1t (one wall thickness), while both shapes of defects oriented in the longitudinal direction exhibit defect interaction which fades away for defects spaced at longer distances. The following remarks are made based on the outcome of the burst tests on X52 and X60 pipes with circular and boxed defects, with defect depths of 50% of the wall thickness.
Empirical formulae from the ASME B31G and DNV RF F191 assessment methods are found to underestimate the burst pressure of defected pipes by up to 21% and 10% for the ASME B31G and DNV RP F101 assessment methods for single defects, and 15% and 16% respectively for interacting defects.
Boxed and circular Defects oriented in the hoop direction showed no interaction even when spaced by 0.5t.
Both shapes of defects oriented in the diagonal direction showed no interaction at a distance of 1t and failed without interaction. However, circular defects separated by a distance of 0.5t showed interaction.
Defect shapes played a small role in the interaction process. However, as expected, a highly stressed region occurred at the inside edge of the boxed defects. Also, pipes with boxed defects have slightly but not significantly lower burst pressures than pipes with circular defects.
For the X60 pipe and for both circular and boxed defects, the interaction stops at spacings greater than and including 4t.
Interaction in the X52 pipe was observed up to and including a spacing of 7t, but this could be attributed to the lower fracture toughness than X60.
The burst pressure results were compared with those obtained using existing analytical methods. Comparison of the results showed consistent conservatism in the existing analytical methods which may potentially lead to
Page 17 of 19
unnecessary plant shutdowns and pipe repairs. Analytical methods can be still used for defect assessments recognizing that these will always give a quick and conservative prediction. The experimental results were further utilised in building numerical FE models and the preliminary results show general agreement between the predicted FE failure pressures and those obtained from the experimental burst tests. The experimental results presented in this paper will be further utilised to validate numerical FE models in detail and expanded further to a detailed parametric study with the aim in developing a predictive capability of burst pressure in pipe joints with metal loss defects.
Acknowledgements The authors would like to acknowledge the support provided by Petroleum Development Oman (PDO) and the technical assistance of staff at the College of Engineering, Sultan Qaboos University (SQU), in relation to the supply of pipes, machining of the specimens and experimental setup.

Page 18 of 19
References
1. NTSB, Integrity Management of Gas Transmission Pipelines in High Consequence
Areas. 2015, National Transportation Safety Board: Washingon, DC, USA.
2. Kiefner, J., Maxey, W., Eiber, R., and Duffy, A., Failure Stress Levels of Flaws in
Pressurized Cylinders. 1973, ASTM: USA. p. 461-481.
3. Shannon, R.W.E., The failure behaviour of line pipe defects. International Journal
of Pressure Vessels and Piping, 1974. 2(4): p. 243-255.
4. Kiefner, J. and Vieth, P., New method corrects criterion for evaluating corroded
pipe. Oil and Gas Journal, 1990. 8.
5. ASME, A.S.o.M.E., Manual for Determining the Remaining Strength of Corroded
Pipelines. 2009, ASME: USA.
6. Kirkwood, M., Fu, B., Vu, D., and Batte, A. Assessing the Integrity of Corroded
Linepipe-An Industry Initiative. in Aspect'96: Advances in Subsea Pipeline
Engineering and Technology. 1996. Society of Underwater Technology.
7. Chouchaoui, B.A. and Pick, R.J., Behaviour of longitudinally aligned corrosion pits.
International Journal of Pressure Vessels and Piping, 1996. 67(1): p. 18.
8. Bjornoy, O.H., Sigurdsson, G., and Marley, M.J. Background and Development of
DNV-RP-F101 "Corroded Pipelines". in Proceedings of the Eleventh (2001)
International Offshore and Polar Engineering Conference. 2001. Stavanger,
Norway.
9. Cosham, A. and Hopkins, P. Pipeline Defect Assessment Manual PDAM. in
International Pipeline Conference. 2002. Calgary, Alberta, Canada.
10. Benjamin, A.C. and Andrade, E.Q.d. Predicting the failure pressure of pipelines
containing nonuniform depth of corrosion defects using FEA. in Proceedings of
OMAE’03: 22nd International Conference on Offshore Mechanics and Arctic
Engineering. 2003. Cancun, Mexico.
11. Netto, T.A., Ferraz, U.S., and Botto, A., On the effect of corrosion defects on the
collapse pressure of pipelines. International Journal of Solids and Structures,
2007. 44(22-23): p. 7597-7614.
12. Kim, J.W., Park, C.Y., and Lee, S.H., Local Failure Criteria for Wall-Thinning
Defect in Piping Components based on Simulated Specimen and Real-Scale Pipe
Tests, in 20th International Conference on Structural Mechanics in Reactor
Technology (SMiRT 20) 2009: Espoo, Finland.
13. Belachew, C.T., Ismail, M.C., and Karuppanan, S., Burst Strength Analysis of
Corroded Pipelines by Finite Element Method. J. Applied Sci., 2011. 11: p. 1845-
1850.
14. Hosseini, A., Cronin, D.S., and Plumtree, A., Crack in Corrosion Defect
Assessment in Transmission Pipelines. Journal of Pressure Vessel Technology,
2013. 135: p. 8.
15. Abdalla Filho, J.E., Machado, R.D., Bertin, R.J., and Valentini, M.D., On the failure
pressure of pipelines containing wall reduction and isolated pit corrosion defects.
Computers & Structures, 2014. 132(0): p. 22-33.
16. ASME, ASME B31G: Manual for Determining the Remaining Strength of Corroded
Pipelines. 2009: USA.
17. DNV, DNV-RP-F101: Corroded Pipeline 2010: Norway.
18. Xu, L.Y. and Cheng, Y.F., Development of a finite element model for simulation
and prediction of mechanoelectrochemical effect of pipeline corrosion. Corrosion
Science, 2013. 73: p. 150-160.
19. Fekete, G. and Varga, L., The effect of the width to length ratios of corrosion
defects on the burst pressures of transmission pipelines. Engineering Failure
Analysis, 2012. 21: p. 21-30.
20. Chauhan, V., Swankie, T.D., Espiner, R., and Wood, I. Developments in Methods
for Assessing the Remaining Strength of corroded pipelines. in NACE CORROSION
2009. 2009. Atlanta, GA: NACE International.
21. Cosham, A. and Hopkins, P., The Assessment of Corrosion in Pipelines guidance in
the Pipeline Defect Assessment Manual, in Pipeline Pigging and Integrity
Management Conference. 2004: Amsterdam, The Netherlands.

Page 19 of 19
22. Ma, B., Shuai, J., Liu, D., and Xu, K., Assessment on failure pressure of high
strength pipeline with corrosion defects. Engineering Failure Analysis, 2013. 32:
p. 209-219.
23. Hosseini, S.A., Crack in Corrsion Flaw Assessment in Thin-Walled Pipe, in
Mechanical Engineering. 2014, University of Waterloo: Waterloo, Canada.
24. Mok, D.R.B., Pick, R.J., and Glover, A.G., Behavior of Line Pipe With Long
External Corrosion. Material Performance, 1990. 29(5): p. 75-79.
25. Freire José, L.F., Vieira Ronaldo, D., Fontes Pablo, M., Benjamin Adilson, C.,
Murillo Luis, S., and Miranda Antonio, C., The Critical Path Method for Assessment
of Pipelines With Metal Loss Defects. Journal of Pipeline Engineering, 2013.
12(2): p. 14.
26. Hopkins, P., Defects Assessment Training Module. 2006.
27. Cronin, D. and Pick, R., Prediction of the failure pressure for complex corrosion
defects. International Journal of Pressure Vessels and Piping, 2002. 79(4): p. 8.
28. Bedairi, B., Cronin, D., Hosseini, A., and Plumtree, A., Failure prediction for
Crack-in-Corrosion defects in natural gas transmission pipelines. International
Journal of Pressure Vessels and Piping, 2012. 96-97: p. 90-99.
29. Lamontagne, M. Interaction rules - An integral factor. in Corrosion 2002. 2002.
USA: NACE.
30. ASME, A.S.o.M.E., Manual for Determining the Remaining Strength of Corroded
Pipelines. 1991, ASME: USA.
31. ASME, A.S.o.M.E., Manual for Determining the Remaining Strength of Corroded
Pipelines. 2012, ASME: USA.
32. Tomasz, S., The Finite Element Method Analysis for Assessing the Remaining
Strength of Corroded Oil Field Casing and Tubing, in Faculty of earth sciences
geotechnical and mining. 2006, The Technical University of Freiberg: Germany.
33. ASTM, E8-Standard Test Methods for Tension Testing of Metallic Materials. 2015,
ASTM International: USA.
34. Netto, T.A., Ferraz, U.S., and Estefen, S.F., The effect of corrosion defects on the
burst pressure of pipelines. Journal of Constructional Steel Reserach, 2005. 61:
p. 1185-1204.
35. Al-Owaisi, S.S., Becker, A.A., and Sun, W., A review of the role and effect of
residual stress on pipeline-flaw assessment. Journal of Pipeline Engineering,
2014. 13(4): p. 265-274.
36. Pipeline-Operator-Forum, Specifications and requirements for intelligent pig
inspection of pipelines. 2009.
37. Kim, J.H., Kim, M.H., and Choi, D.H., Analysis and Depth Estimation of Complex
Defects on the Underground Gas Pipelines. Journal of Magnetics, 2013. 18(2): p.
202-206.
38. Abaqus(V.6.14), Abaqus Documentation. 2015, Dassault Systèmes: Providence,
RI, USA.
39. Al-Owaisi, S.S., Becker, A.A., and Sun, W., Analysis of shape and location effects
of closely spaced metal loss defects in pressurised pipes. Engineering Failure
Analysis, 2016. 68: p. 172-186.