1910 Mo Il consumo di sodio e potassio e ipertensione Alberto Morganti U.O. Medicina Generale e...
32
1910 Mo 1910 Mo Il consumo di sodio e potassio e Il consumo di sodio e potassio e ipertensione ipertensione Alberto Morganti Alberto Morganti U.O. Medicina Generale e Centro U.O. Medicina Generale e Centro Ipertensione Arteriosa Ipertensione Arteriosa Ospedale San Giuseppe, Universit Ospedale San Giuseppe, Universit à à di di Milano Milano Congresso Nazionale ASIAM Congresso Nazionale ASIAM Riccione, 16-18 Maggio 2014 Riccione, 16-18 Maggio 2014
-
Upload
lee-maxwell -
Category
Documents
-
view
218 -
download
3
Transcript of 1910 Mo Il consumo di sodio e potassio e ipertensione Alberto Morganti U.O. Medicina Generale e...

1910 Mo1910 Mo
Il consumo di sodio e potassio e ipertensioneIl consumo di sodio e potassio e ipertensione
Alberto MorgantiAlberto Morganti
U.O. Medicina Generale e Centro Ipertensione ArteriosaU.O. Medicina Generale e Centro Ipertensione Arteriosa
Ospedale San Giuseppe, UniversitOspedale San Giuseppe, Universitàà di Milano di Milano
Congresso Nazionale ASIAMCongresso Nazionale ASIAM
Riccione, 16-18 Maggio 2014Riccione, 16-18 Maggio 2014
2077 Mo2077 Mo
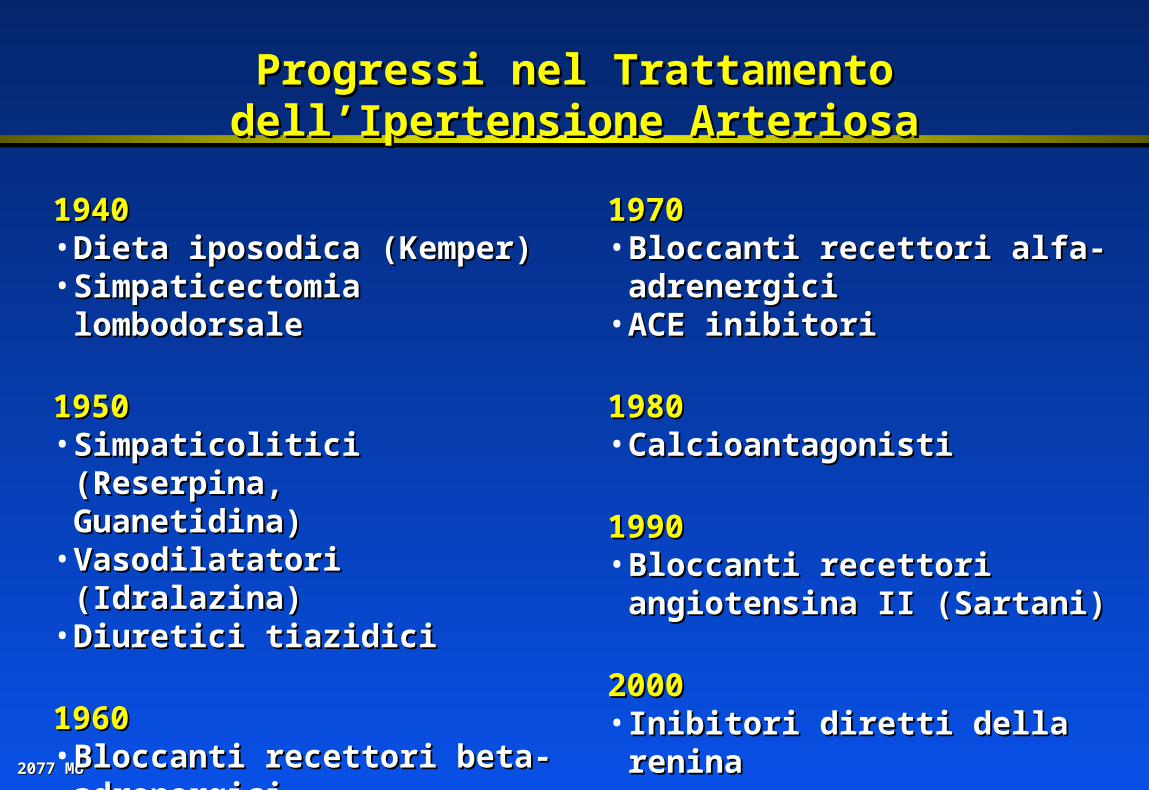
Progressi nel Trattamento dell’Ipertensione ArteriosaProgressi nel Trattamento dell’Ipertensione Arteriosa
19401940• Dieta iposodica (Kemper)Dieta iposodica (Kemper)• Simpaticectomia lombodorsaleSimpaticectomia lombodorsale
19501950• Simpaticolitici (Reserpina, Simpaticolitici (Reserpina,
Guanetidina)Guanetidina)• Vasodilatatori (Idralazina)Vasodilatatori (Idralazina)• Diuretici tiazidiciDiuretici tiazidici
19601960• Bloccanti recettori beta-adrenergiciBloccanti recettori beta-adrenergici• Antialdosteronici (Spironolattoni)Antialdosteronici (Spironolattoni)
19701970• Bloccanti recettori alfa-adrenergiciBloccanti recettori alfa-adrenergici• ACE inibitoriACE inibitori
19801980• CalcioantagonistiCalcioantagonisti
19901990• Bloccanti recettori angiotensina II Bloccanti recettori angiotensina II
(Sartani)(Sartani)
20002000• Inibitori diretti della reninaInibitori diretti della renina
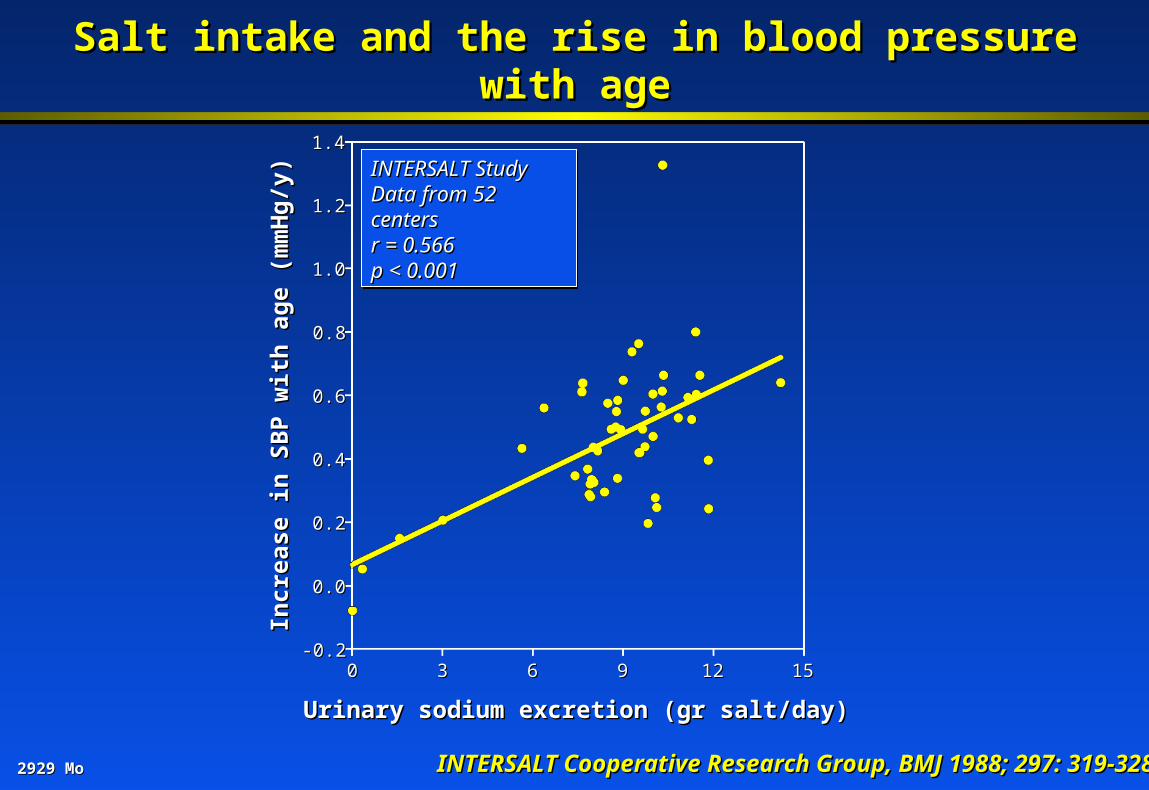
2929 Mo2929 Mo INTERSALT Cooperative Research Group, BMJ 1988; 297: 319-328INTERSALT Cooperative Research Group, BMJ 1988; 297: 319-328
Salt intake and the rise in blood pressure with ageSalt intake and the rise in blood pressure with age
Incr
ease
in S
BP
wit
h ag
e (m
mH
g/y)
Incr
ease
in S
BP
wit
h ag
e (m
mH
g/y)
Urinary sodium excretion (gr salt/day)Urinary sodium excretion (gr salt/day)
INTERSALT StudyINTERSALT StudyData from 52 centersData from 52 centersr = 0.566r = 0.566p < 0.001p < 0.001
INTERSALT StudyINTERSALT StudyData from 52 centersData from 52 centersr = 0.566r = 0.566p < 0.001p < 0.001
1.41.4
1.21.2
1.01.0
0.80.8
0.60.6
0.40.4
0.20.2
0.00.0
-0.2-0.200 33 66 99 1212 1515

2930 Mo2930 Mo Perry and Beevers, J Human Hypertens 1992; 6: 23-25Perry and Beevers, J Human Hypertens 1992; 6: 23-25
Relationship between salt intake and death from strokeRelationship between salt intake and death from stroke
Dea
ths
from
str
oke
(per
10
Dea
ths
from
str
oke
(per
1066 p
er y
ear)
per
yea
r)
Urinary sodium excretion (gr salt/day)Urinary sodium excretion (gr salt/day)
Data from 12 EU countriesData from 12 EU countriesr = 0.832r = 0.832p < 0.001p < 0.001
Data from 12 EU countriesData from 12 EU countriesr = 0.832r = 0.832p < 0.001p < 0.001
22102210
18101810
14801480
12101210
990990
810810
670670
5505507.57.5 8.08.0 9.09.0 9.59.5 10.010.0 10.510.58.58.5
2936 Mo2936 Mo
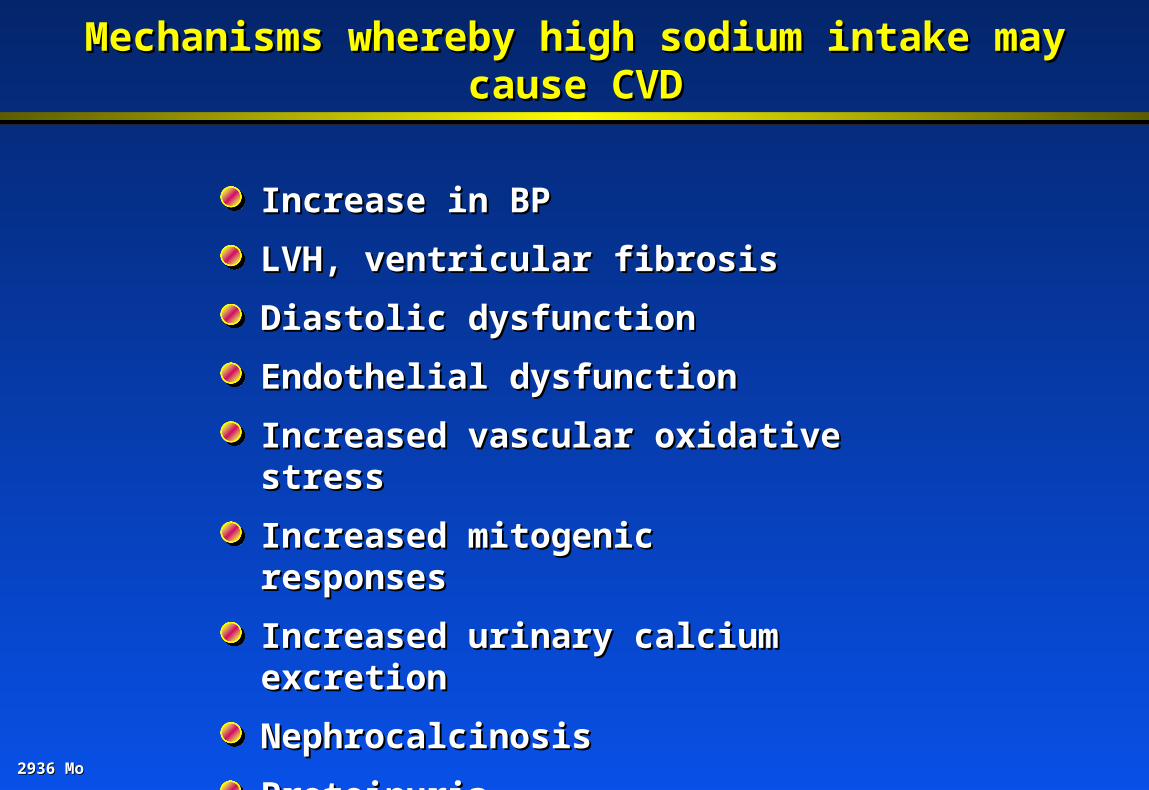
Mechanisms whereby high sodium intake may cause CVDMechanisms whereby high sodium intake may cause CVD
Increase in BPIncrease in BP
LVH, ventricular fibrosisLVH, ventricular fibrosis
Diastolic dysfunctionDiastolic dysfunction
Endothelial dysfunctionEndothelial dysfunction
Increased vascular oxidative stressIncreased vascular oxidative stress
Increased mitogenic responsesIncreased mitogenic responses
Increased urinary calcium excretionIncreased urinary calcium excretion
NephrocalcinosisNephrocalcinosis
ProteinuriaProteinuria
2909 Mo2909 Mo
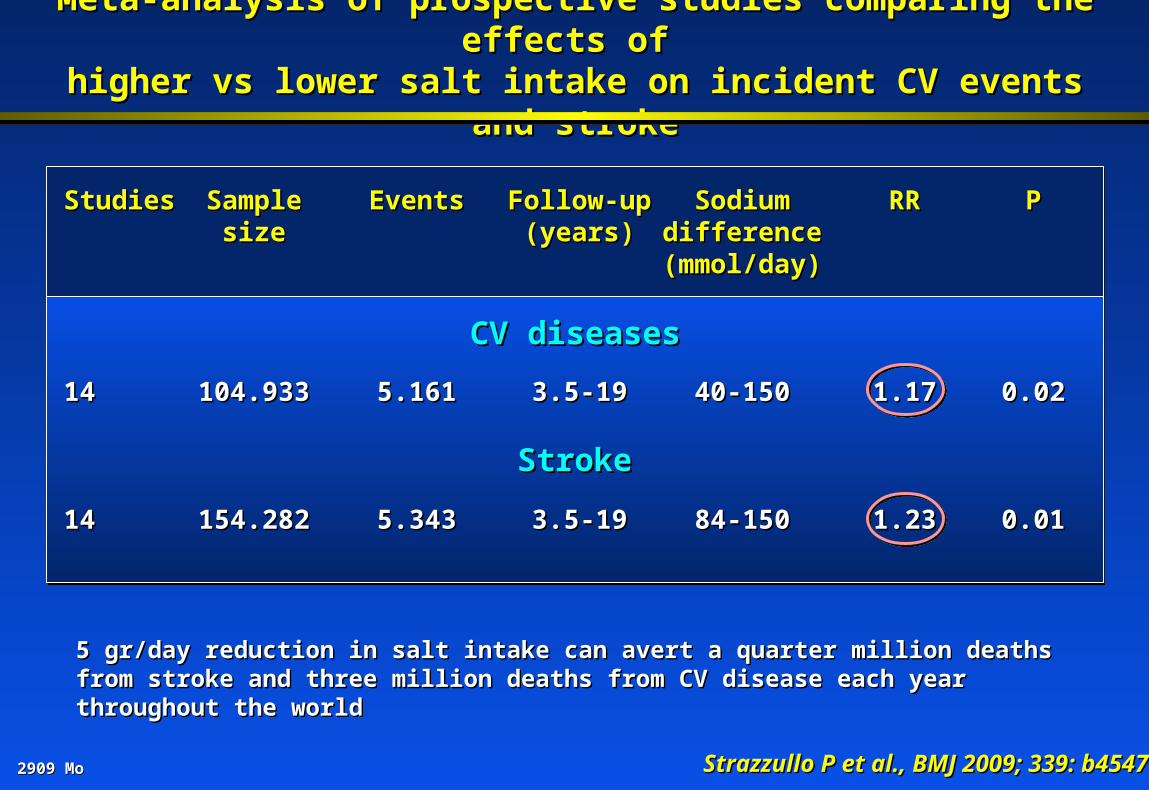
Meta-analysis of prospective studies comparing the effects of Meta-analysis of prospective studies comparing the effects of higher vs lower salt intake on incident CV events and strokehigher vs lower salt intake on incident CV events and stroke
Strazzullo P et al., BMJ 2009; 339: b4547Strazzullo P et al., BMJ 2009; 339: b4547
StudiesStudies
1414
1414
Follow-upFollow-up(years)(years)
3.5-193.5-19
3.5-193.5-19
RRRR
1.171.17
1.231.23
SampleSamplesizesize
104.933104.933
154.282154.282
EventsEvents
5.1615.161
5.3435.343
Sodium Sodium differencedifference
(mmol/day)(mmol/day)
40-15040-150
84-15084-150
PP
0.020.02
0.010.01
CV diseasesCV diseases
StrokeStroke
5 gr/day reduction in salt intake can avert a quarter million deaths from stroke and three million 5 gr/day reduction in salt intake can avert a quarter million deaths from stroke and three million deaths from CV disease each year throughout the worlddeaths from CV disease each year throughout the world
2922 Mo2922 Mo
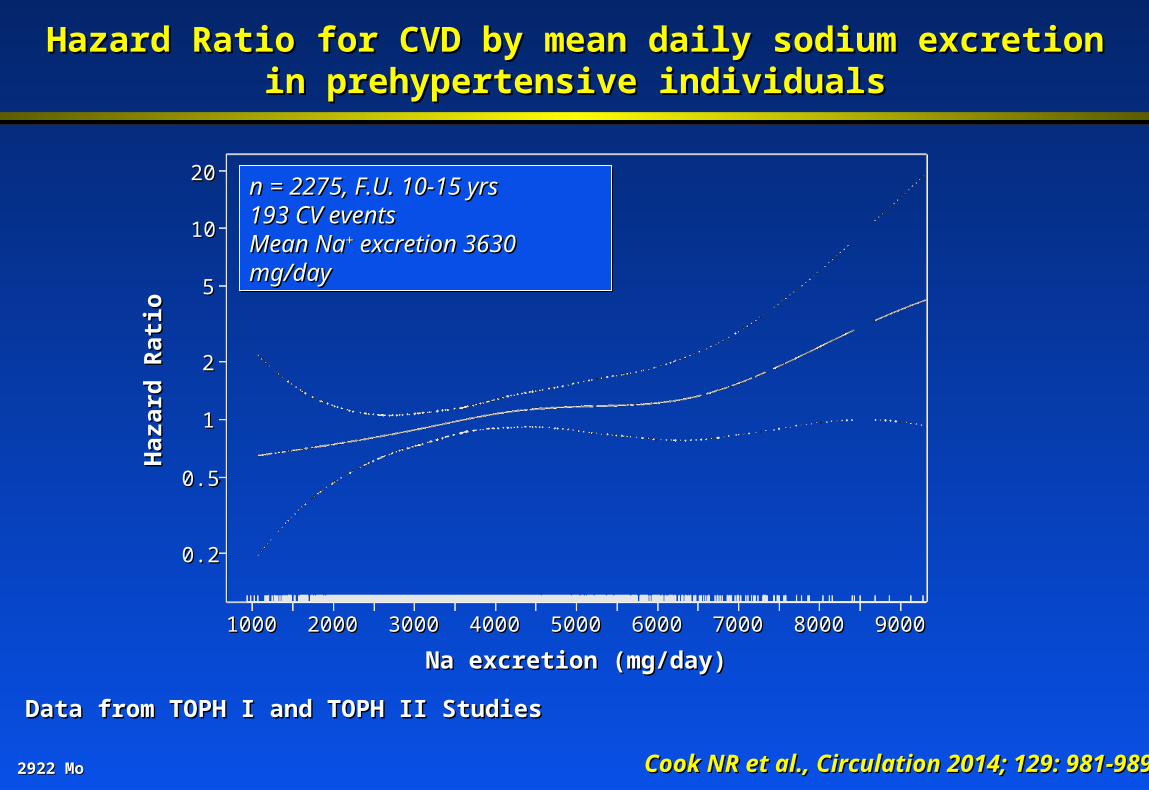
Hazard Ratio for CVD by mean daily sodium excretionHazard Ratio for CVD by mean daily sodium excretionin prehypertensive individualsin prehypertensive individuals
Cook NR et al., Circulation 2014; 129: 981-989Cook NR et al., Circulation 2014; 129: 981-989
Data from TOPH I and TOPH II StudiesData from TOPH I and TOPH II Studies
n = 2275, F.U. 10-15 yrsn = 2275, F.U. 10-15 yrs193 CV events193 CV eventsMean NaMean Na++ excretion 3630 mg/day excretion 3630 mg/day
n = 2275, F.U. 10-15 yrsn = 2275, F.U. 10-15 yrs193 CV events193 CV eventsMean NaMean Na++ excretion 3630 mg/day excretion 3630 mg/day
2020
1010
55
22
11
0.50.5
0.20.2
Haz
ard
Rat
ioH
azar
d R
atio
10001000 20002000 30003000 40004000 50005000 60006000 70007000 80008000 90009000
Na excretion (mg/day)Na excretion (mg/day)
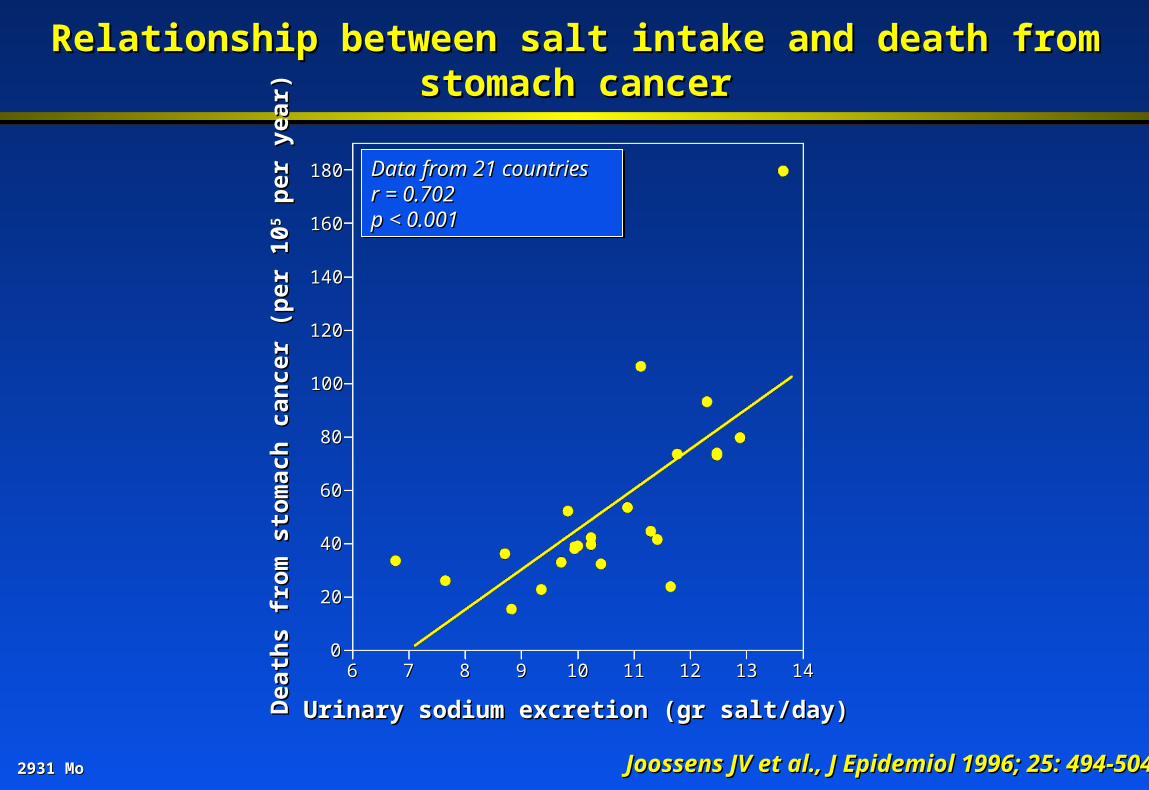
2931 Mo2931 Mo Joossens JV et al., J Epidemiol 1996; 25: 494-504Joossens JV et al., J Epidemiol 1996; 25: 494-504
Relationship between salt intake and death from stomach cancerRelationship between salt intake and death from stomach cancer
Dea
ths
from
sto
mac
h ca
ncer
(pe
r 10
Dea
ths
from
sto
mac
h ca
ncer
(pe
r 10
55 per
yea
r) p
er y
ear)
Urinary sodium excretion (gr salt/day)Urinary sodium excretion (gr salt/day)
Data from 21 countriesData from 21 countriesr = 0.702r = 0.702p < 0.001p < 0.001
Data from 21 countriesData from 21 countriesr = 0.702r = 0.702p < 0.001p < 0.001
180180
160160
140140
120120
6060
4040
2020
0066 77 99 1010 1313 141488
8080
100100
1111 1212
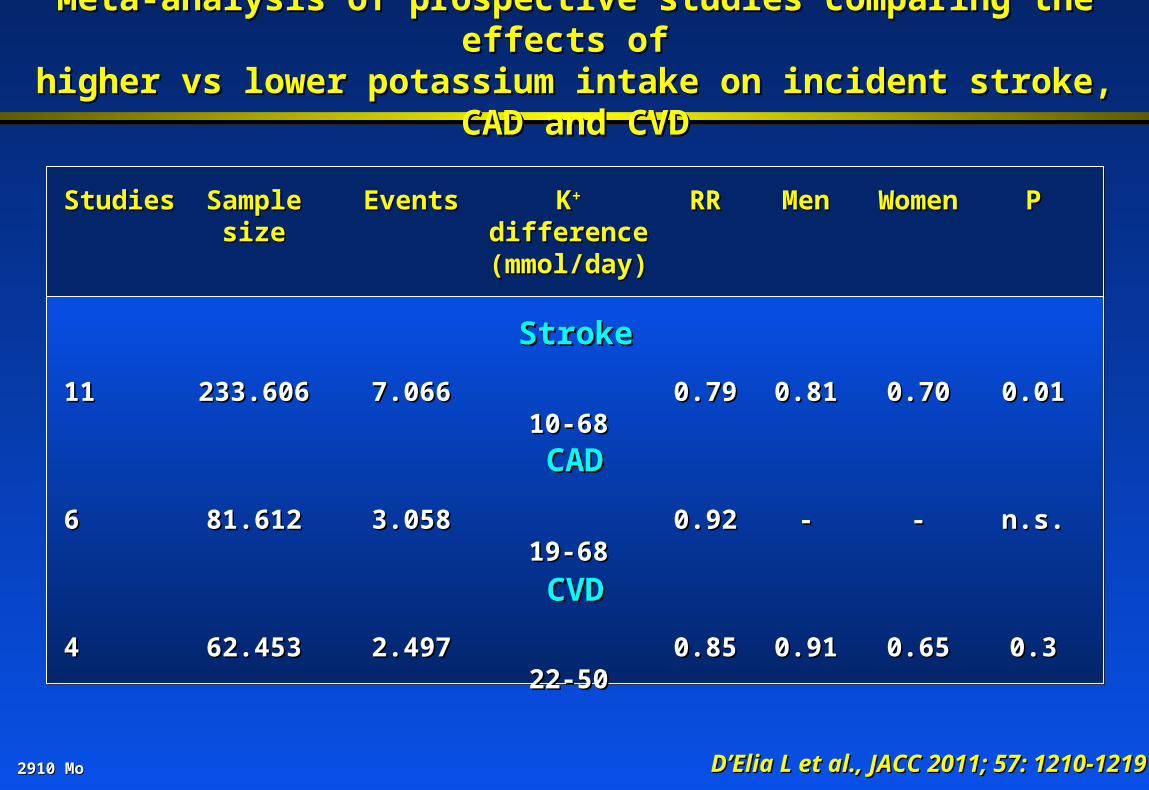
2910 Mo2910 Mo D’Elia L et al., JACC 2011; 57: 1210-1219D’Elia L et al., JACC 2011; 57: 1210-1219
StudiesStudies
1111
66
44
KK++ difference difference(mmol/day)(mmol/day)
10-6810-68
19-6819-68
22-5022-50
MenMen
0.810.81
--
0.910.91
SampleSamplesizesize
233.606233.606
81.61281.612
62.45362.453
EventsEvents
7.0667.066
3.0583.058
2.4972.497
RRRR
0.790.79
0.920.92
0.850.85
PP
0.010.01
n.s.n.s.
0.30.3
StrokeStroke
CADCAD
WomenWomen
0.700.70
--
0.650.65
CVDCVD
Meta-analysis of prospective studies comparing the effects of Meta-analysis of prospective studies comparing the effects of higher vs lower potassium intake on incident stroke, CAD and CVDhigher vs lower potassium intake on incident stroke, CAD and CVD
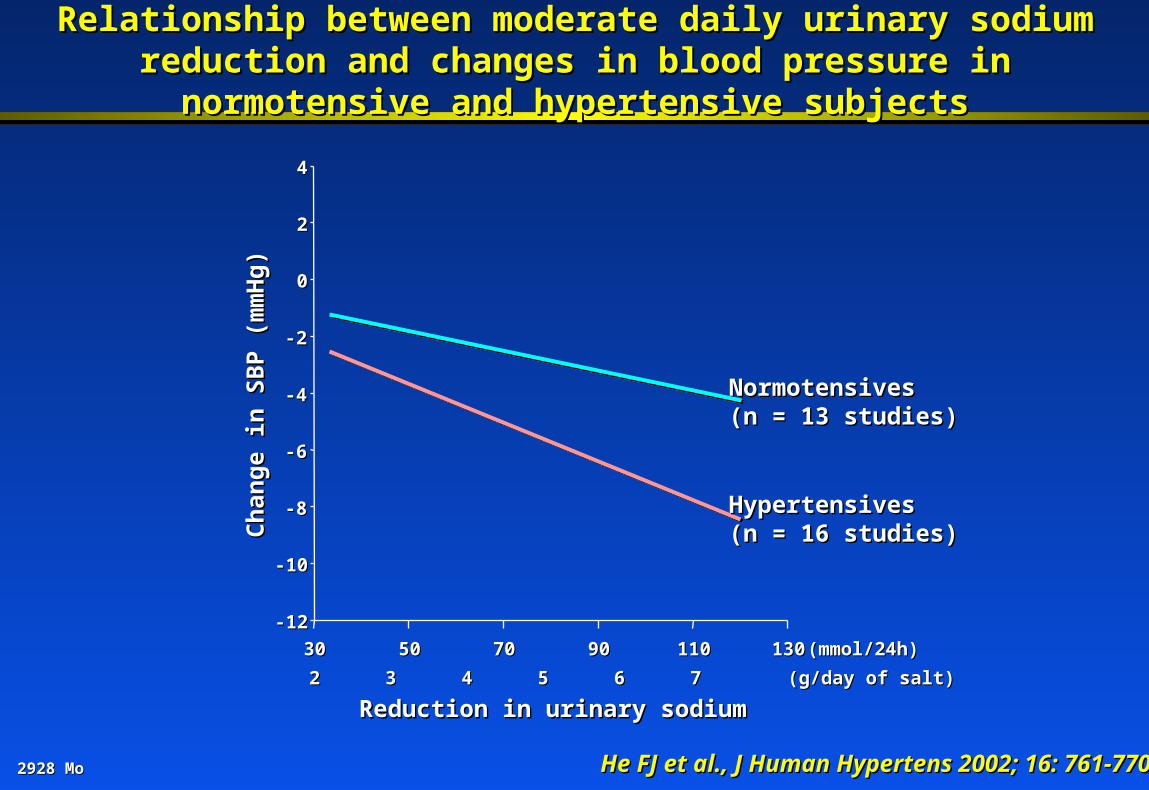
2928 Mo2928 Mo He FJ et al., J Human Hypertens 2002; 16: 761-770He FJ et al., J Human Hypertens 2002; 16: 761-770
Relationship between moderate daily urinary sodium reduction and Relationship between moderate daily urinary sodium reduction and changes in blood pressure in normotensive and hypertensive subjectschanges in blood pressure in normotensive and hypertensive subjects
Ch
ange
in S
BP
(m
mH
g)C
han
ge in
SB
P (
mm
Hg)
Reduction in urinary sodiumReduction in urinary sodium
-12-12
-10-10
-8-8
-6-6
-4-4
-2-2
00
22
44
3030 5050 7070 9090 110110 130130 (mmol/24h)(mmol/24h)
(g/day of salt)(g/day of salt)22 33 44 55 66 77
NormotensivesNormotensives(n = 13 studies)(n = 13 studies)
HypertensivesHypertensives(n = 16 studies)(n = 16 studies)
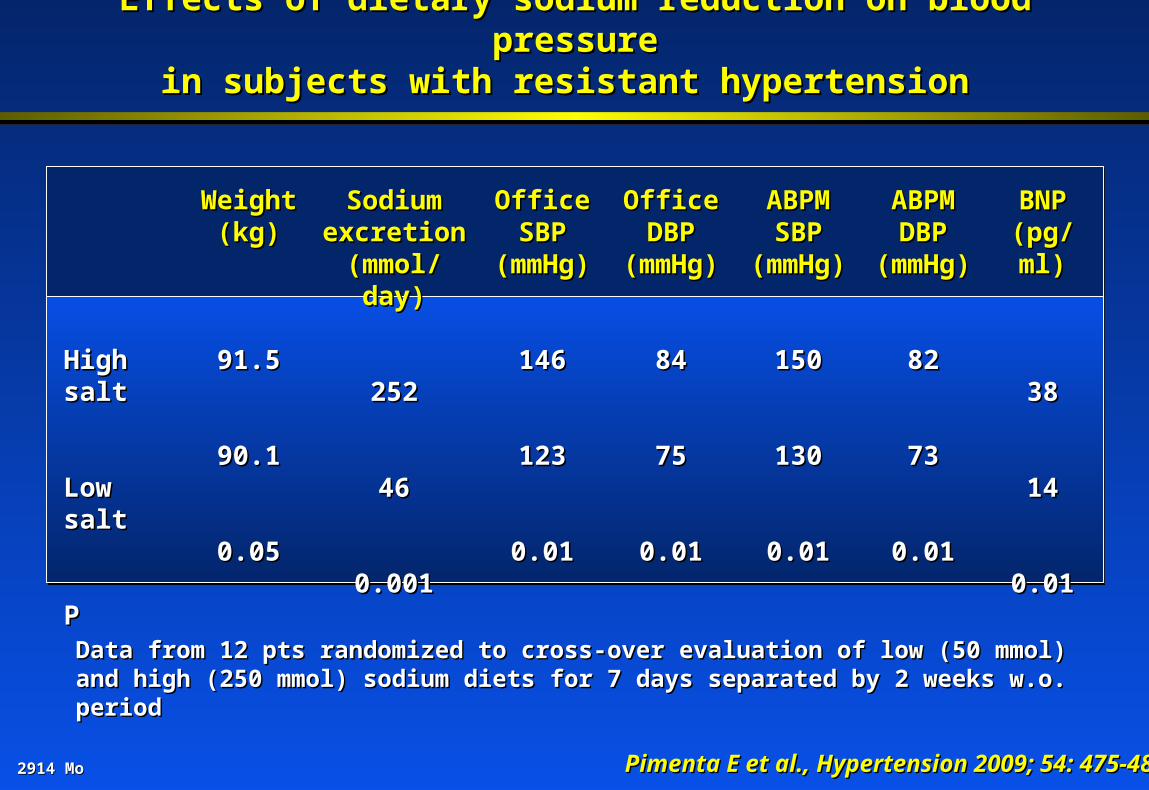
2914 Mo2914 Mo
Effects of dietary sodium reduction on blood pressureEffects of dietary sodium reduction on blood pressurein subjects with resistant hypertension in subjects with resistant hypertension
Pimenta E et al., Hypertension 2009; 54: 475-481Pimenta E et al., Hypertension 2009; 54: 475-481
High saltHigh salt
Low saltLow salt
PP
OfficeOfficeSBPSBP
(mmHg)(mmHg)
146146
123123
0.010.01
WeightWeight(kg)(kg)
91.591.5
90.190.1
0.050.05
Sodium Sodium excretionexcretion
(mmol/day)(mmol/day)
252252
4646
0.0010.001
Data from 12 pts randomized to cross-over evaluation of low (50 mmol) and high (250 mmol) Data from 12 pts randomized to cross-over evaluation of low (50 mmol) and high (250 mmol) sodium diets for 7 days separated by 2 weeks w.o. periodsodium diets for 7 days separated by 2 weeks w.o. period
OfficeOfficeDBPDBP
(mmHg)(mmHg)
8484
7575
0.010.01
ABPMABPMSBPSBP
(mmHg)(mmHg)
150150
130130
0.010.01
ABPM ABPM DBPDBP
(mmHg)(mmHg)
8282
7373
0.010.01
BNPBNP(pg/ml)(pg/ml)
3838
1414
0.010.01
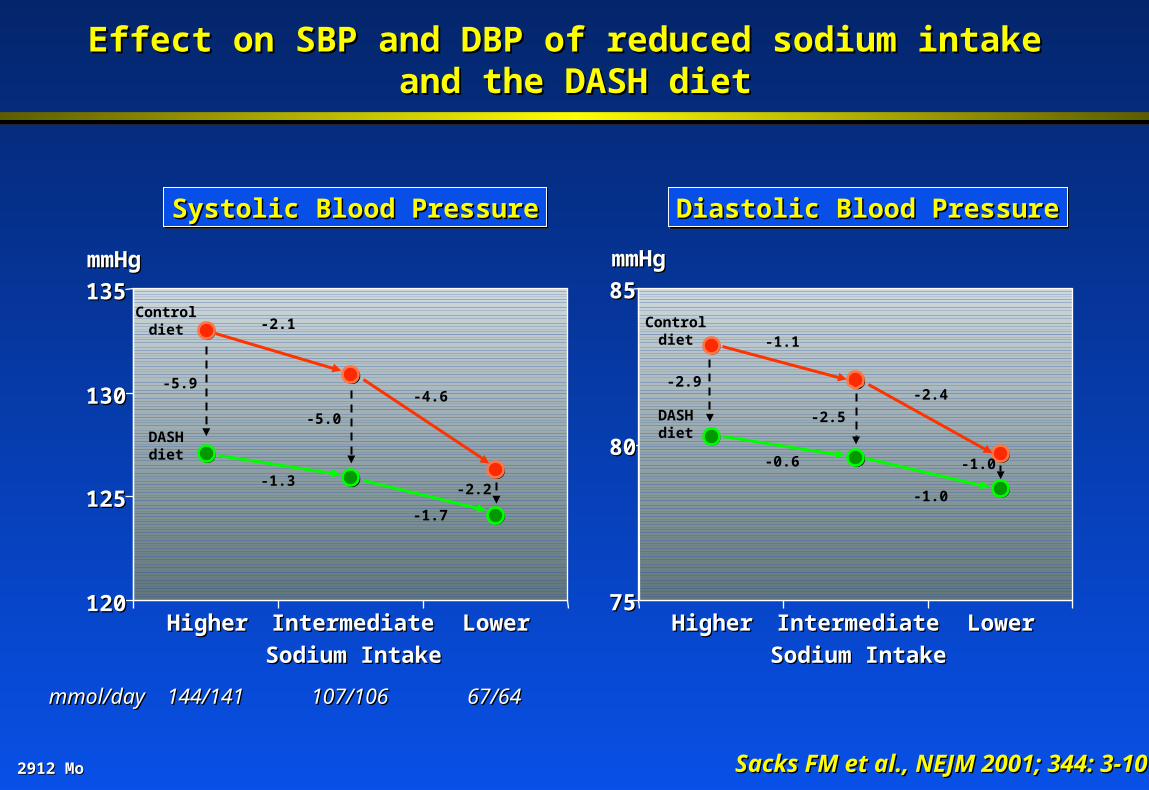
Effect on SBP and DBP of reduced sodium intake Effect on SBP and DBP of reduced sodium intake and the DASH dietand the DASH diet
2912 Mo2912 Mo Sacks FM et al., NEJM 2001; 344: 3-10Sacks FM et al., NEJM 2001; 344: 3-10
Systolic Blood PressureSystolic Blood PressureSystolic Blood PressureSystolic Blood Pressure Diastolic Blood PressureDiastolic Blood PressureDiastolic Blood PressureDiastolic Blood Pressure
HigherHigher IntermediateIntermediate LowerLower
Sodium IntakeSodium Intake
120120
125125
130130
135135mmHgmmHg
HigherHigher IntermediateIntermediate LowerLower
Sodium IntakeSodium Intake
7575
8080
8585mmHgmmHg
-5.9
-2.1
-4.6
-1.3
-1.7
-5.0
-2.2
-2.9
-1.1
-2.4
-0.6
-1.0
-2.5
-1.0
Controldiet
DASHdiet
Controldiet
DASHdiet
mmol/daymmol/day 144/141144/141 107/106107/106 67/6467/64
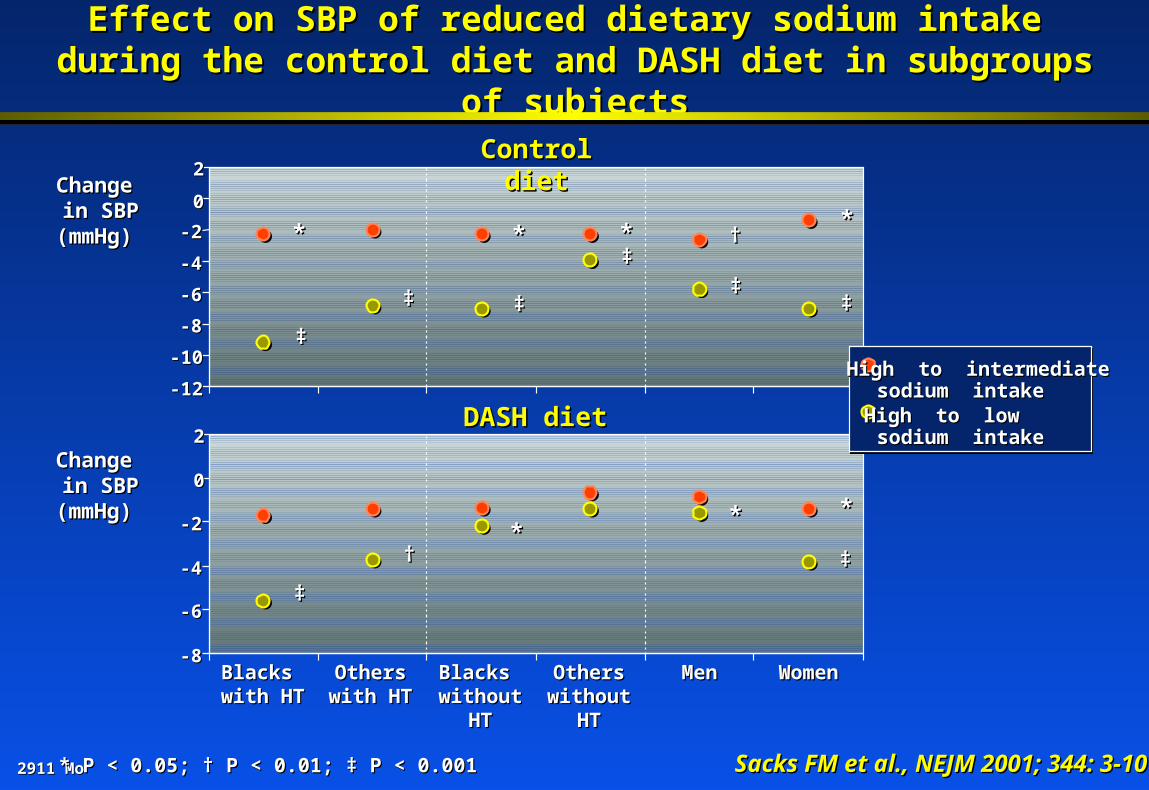
Effect on SBP of reduced dietary sodium intake Effect on SBP of reduced dietary sodium intake during the control diet and DASH diet in subgroups of subjectsduring the control diet and DASH diet in subgroups of subjects
2911 Mo2911 Mo Sacks FM et al., NEJM 2001; 344: 3-10Sacks FM et al., NEJM 2001; 344: 3-10
-12-12
-10-10
-8-8
-6-6
-4-4
-2-2
00
22ChangeChange in SBPin SBP(mmHg)(mmHg) ** ** **
**††
‡‡
‡‡ ‡‡
‡‡
‡‡‡‡
-8-8
-6-6
-4-4
-2-2
00
22ChangeChange in SBPin SBP(mmHg)(mmHg)
Blacks Blacks with HTwith HT
OthersOtherswith HTwith HT
Blacks Blacks withoutwithout
HTHT
OthersOtherswithoutwithout
HTHT
MenMen WomenWomen
******
†† ‡‡
‡‡
* P < 0.05; † P < 0.01; ‡ P < 0.001* P < 0.05; † P < 0.01; ‡ P < 0.001
Control dietControl diet
High to intermediate High to intermediate sodium intakesodium intakeHigh to low High to low sodium intakesodium intake
DASH dietDASH diet
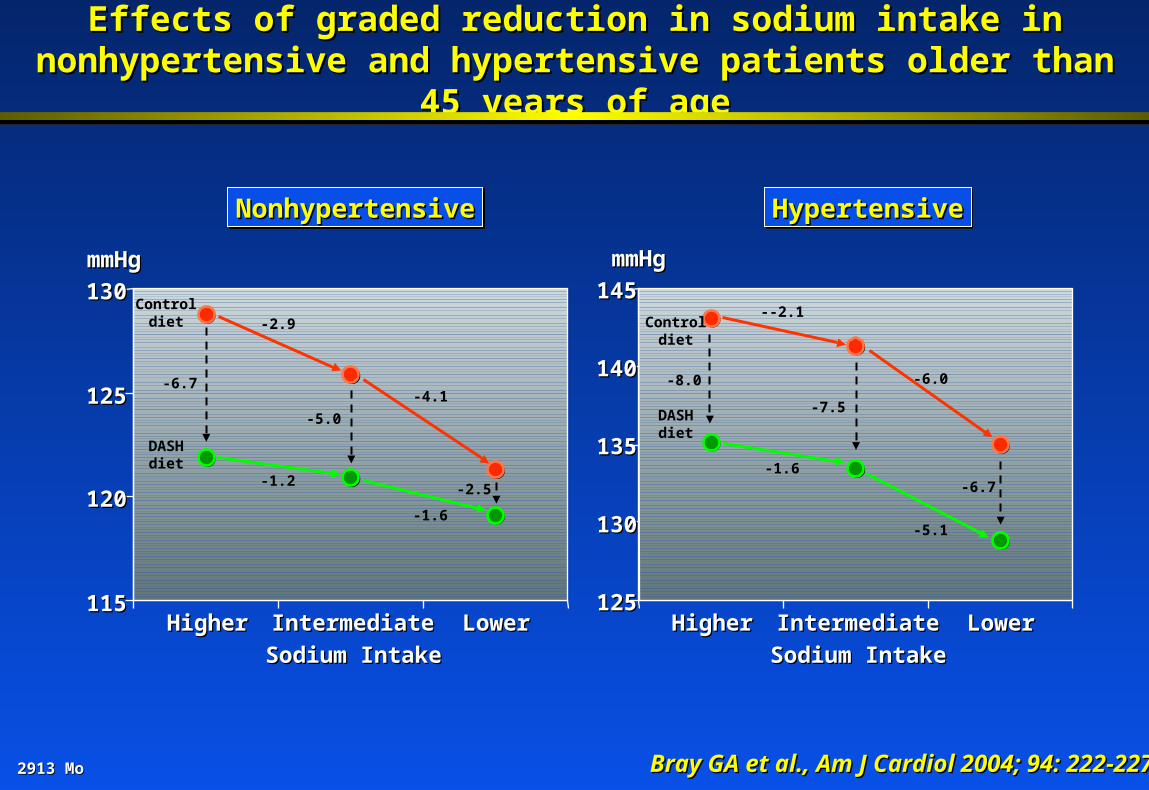
Effects of graded reduction in sodium intake in nonhypertensive and Effects of graded reduction in sodium intake in nonhypertensive and hypertensive patients older than 45 years of agehypertensive patients older than 45 years of age
2913 Mo2913 Mo Bray GA et al., Am J Cardiol 2004; 94: 222-227Bray GA et al., Am J Cardiol 2004; 94: 222-227
NonhypertensiveNonhypertensiveNonhypertensiveNonhypertensive HypertensiveHypertensiveHypertensiveHypertensive
HigherHigher IntermediateIntermediate LowerLower
Sodium IntakeSodium Intake
115115
120120
125125
130130mmHgmmHg
HigherHigher IntermediateIntermediate LowerLower
Sodium IntakeSodium Intake
125125
135135
145145mmHgmmHg
-6.7
-2.9
-4.1
-1.2
-1.6
-5.0
-2.5
-8.0
--2.1
-6.0
-1.6
-5.1
-7.5
-6.7
Controldiet
DASHdiet
Controldiet
DASHdiet
140140
130130
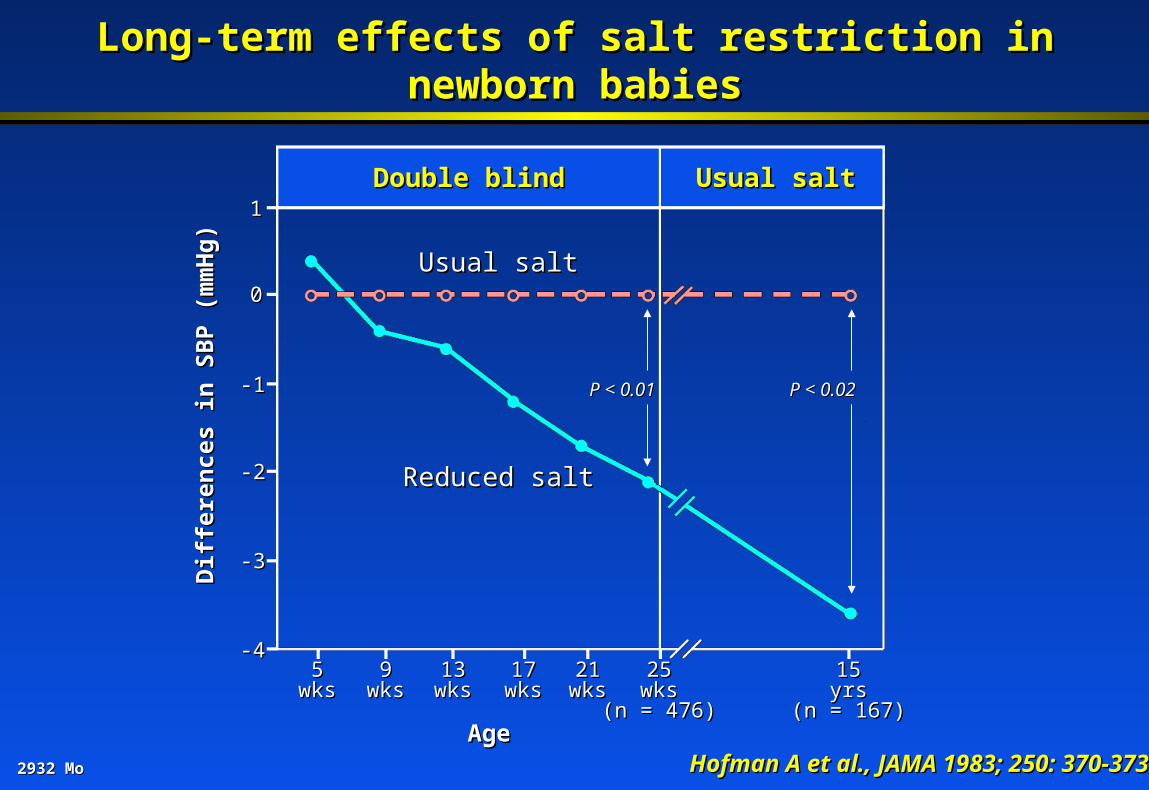
2932 Mo2932 Mo Hofman A et al., JAMA 1983; 250: 370-373Hofman A et al., JAMA 1983; 250: 370-373
Long-term effects of salt restriction in newborn babiesLong-term effects of salt restriction in newborn babies
Dif
fere
nce
s in
SB
P (
mm
Hg)
Dif
fere
nce
s in
SB
P (
mm
Hg)
AgeAge
Double blindDouble blind Usual saltUsual salt
Usual saltUsual salt
Reduced saltReduced salt
11
00
-1-1
-2-2
-3-3
-4-455
wkswks99
wkswks1313
wkswks1717
wkswks2121
wkswks2525
wkswks(n = 476)(n = 476)
1515yrsyrs
(n = 167)(n = 167)
P < 0.01P < 0.01 P < 0.02P < 0.02
2908 Mo2908 Mo
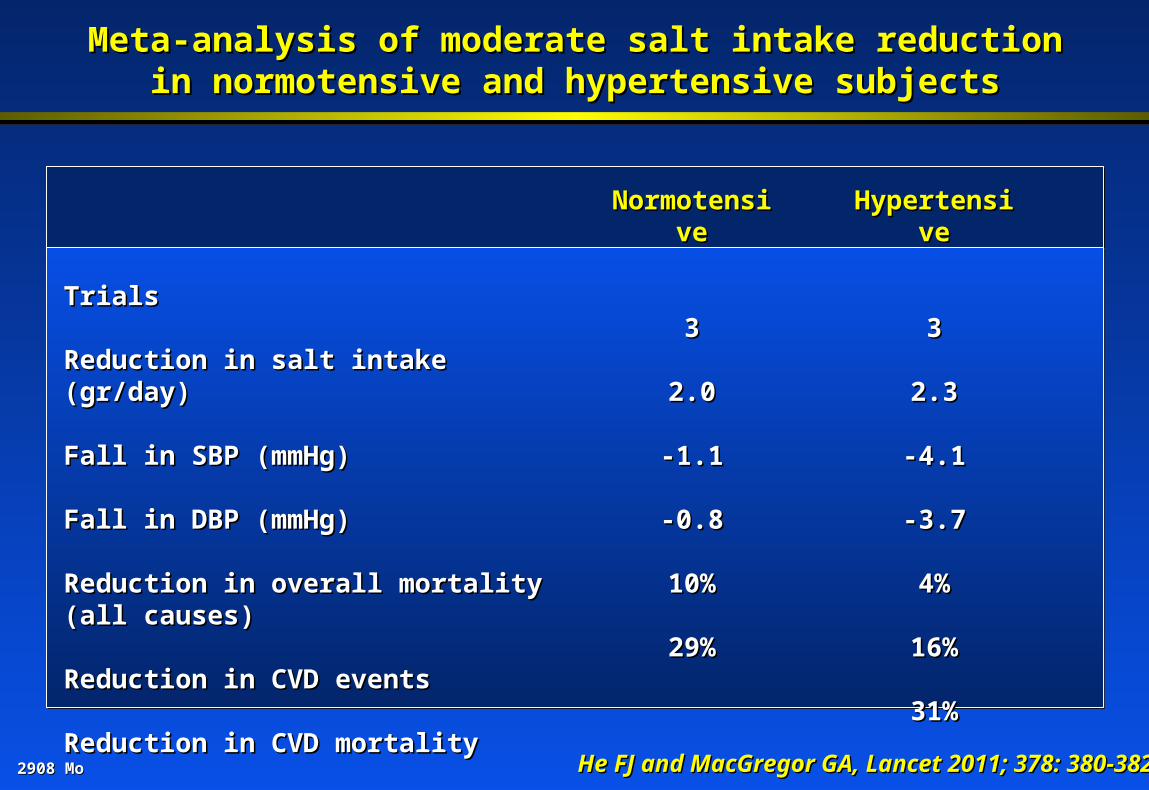
Meta-analysis of moderate salt intake reductionMeta-analysis of moderate salt intake reductionin normotensive and hypertensive subjectsin normotensive and hypertensive subjects
He FJ and MacGregor GA, Lancet 2011; 378: 380-382He FJ and MacGregor GA, Lancet 2011; 378: 380-382
TrialsTrials
Reduction in salt intake (gr/day)Reduction in salt intake (gr/day)
Fall in SBP (mmHg)Fall in SBP (mmHg)
Fall in DBP (mmHg)Fall in DBP (mmHg)
Reduction in overall mortality (all causes)Reduction in overall mortality (all causes)
Reduction in CVD eventsReduction in CVD events
Reduction in CVD mortalityReduction in CVD mortality
NormotensiveNormotensive
33
2.02.0
-1.1-1.1
-0.8-0.8
10%10%
29%29%
HypertensiveHypertensive
33
2.32.3
-4.1-4.1
-3.7-3.7
4%4%
16%16%
31%31%
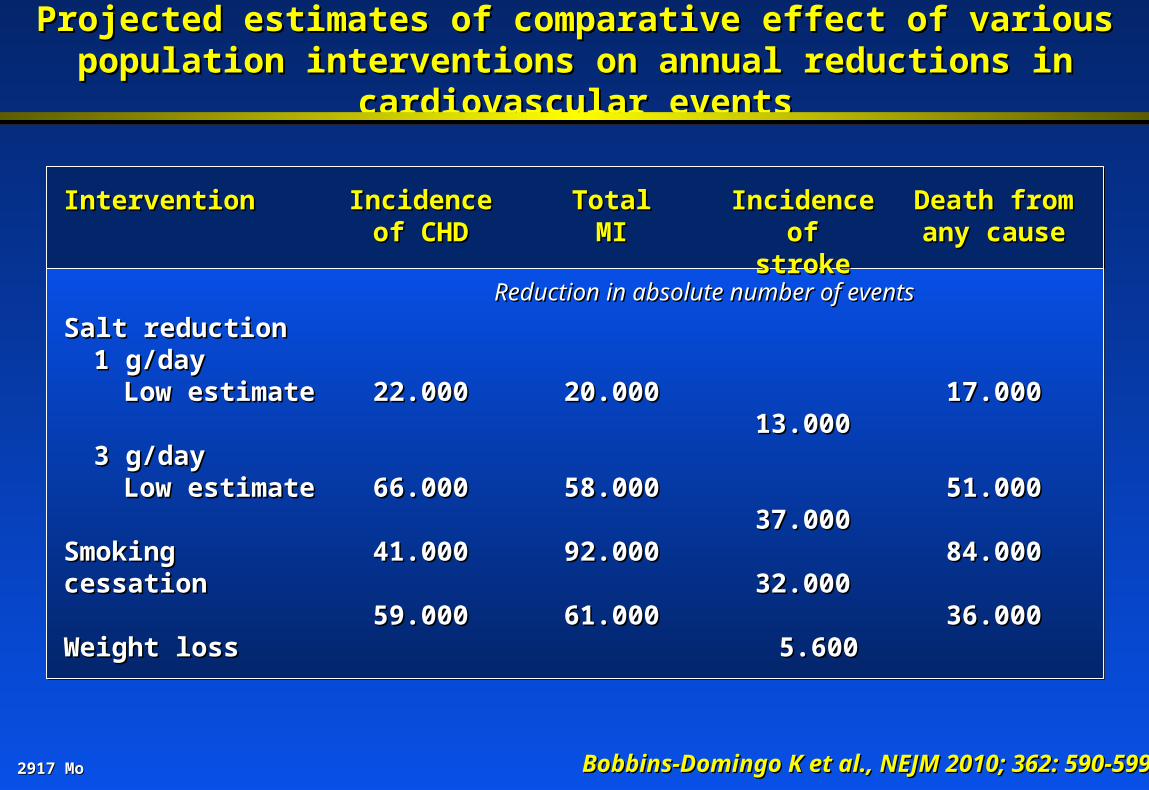
2917 Mo2917 Mo
Projected estimates of comparative effect of various population Projected estimates of comparative effect of various population interventions on annual reductions in cardiovascular eventsinterventions on annual reductions in cardiovascular events
Bobbins-Domingo K et al., NEJM 2010; 362: 590-599Bobbins-Domingo K et al., NEJM 2010; 362: 590-599
InterventionIntervention
Salt reductionSalt reduction1 g/day1 g/day
Low estimateLow estimate
3 g/day3 g/dayLow estimateLow estimate
Smoking cessationSmoking cessation
Weight lossWeight loss
Incidence of Incidence of CHDCHD
22.00022.000
66.00066.000
41.00041.000
59.00059.000
TotalTotalMIMI
20.00020.000
58.00058.000
92.00092.000
61.00061.000
Incidence ofIncidence ofstrokestroke
13.00013.000
37.00037.000
32.00032.000
5.6005.600
Death fromDeath fromany causeany cause
17.00017.000
51.00051.000
84.00084.000
36.00036.000
Reduction in absolute number of eventsReduction in absolute number of events
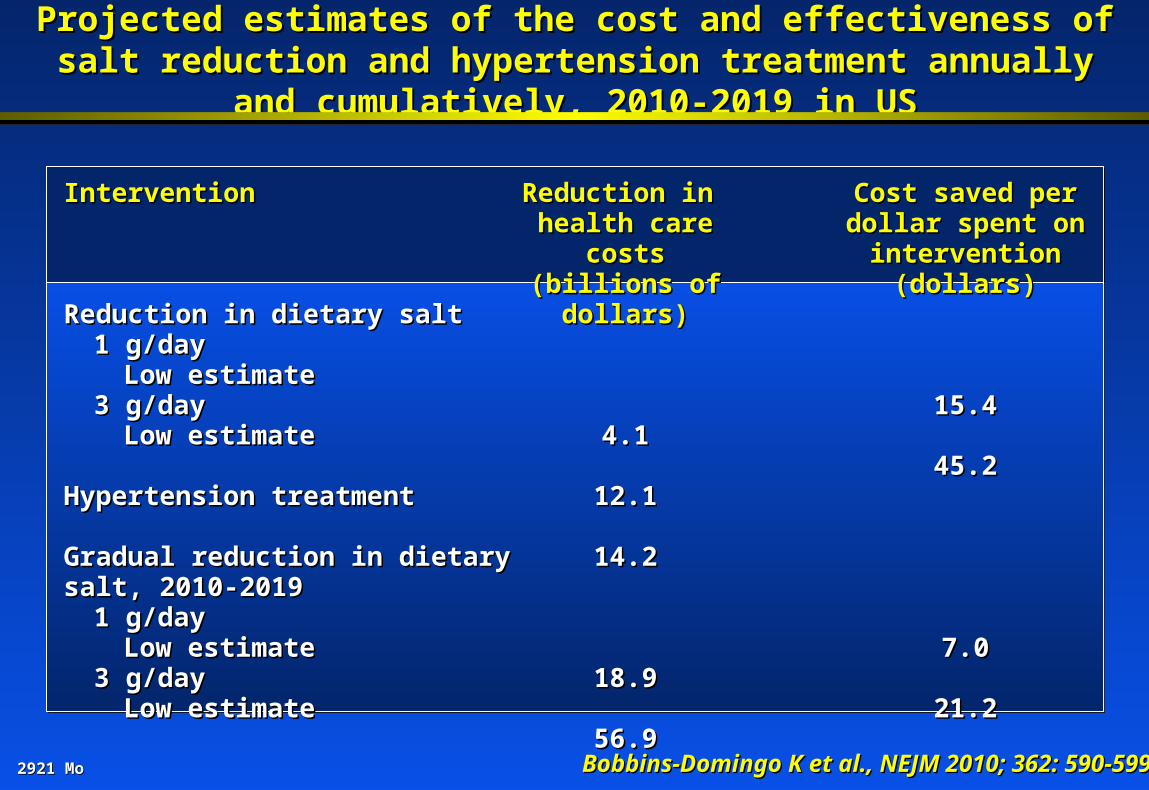
2921 Mo2921 Mo
Projected estimates of the cost and effectiveness of salt reduction and Projected estimates of the cost and effectiveness of salt reduction and hypertension treatment annually and cumulatively, 2010-2019 in UShypertension treatment annually and cumulatively, 2010-2019 in US
Bobbins-Domingo K et al., NEJM 2010; 362: 590-599Bobbins-Domingo K et al., NEJM 2010; 362: 590-599
InterventionIntervention
Reduction in dietary saltReduction in dietary salt1 g/day1 g/day
Low estimateLow estimate3 g/day3 g/day
Low estimateLow estimate
Hypertension treatmentHypertension treatment
Gradual reduction in dietary salt, 2010-2019Gradual reduction in dietary salt, 2010-20191 g/day1 g/day
Low estimateLow estimate3 g/day3 g/day
Low estimateLow estimate
Reduction in Reduction in health care costs health care costs
(billions of dollars)(billions of dollars)
4.14.1
12.112.1
14.214.2
18.918.9
56.956.9
Cost saved per dollar Cost saved per dollar spent on intervention spent on intervention
(dollars)(dollars)
15.415.4
45.245.2
7.07.0
21.221.2
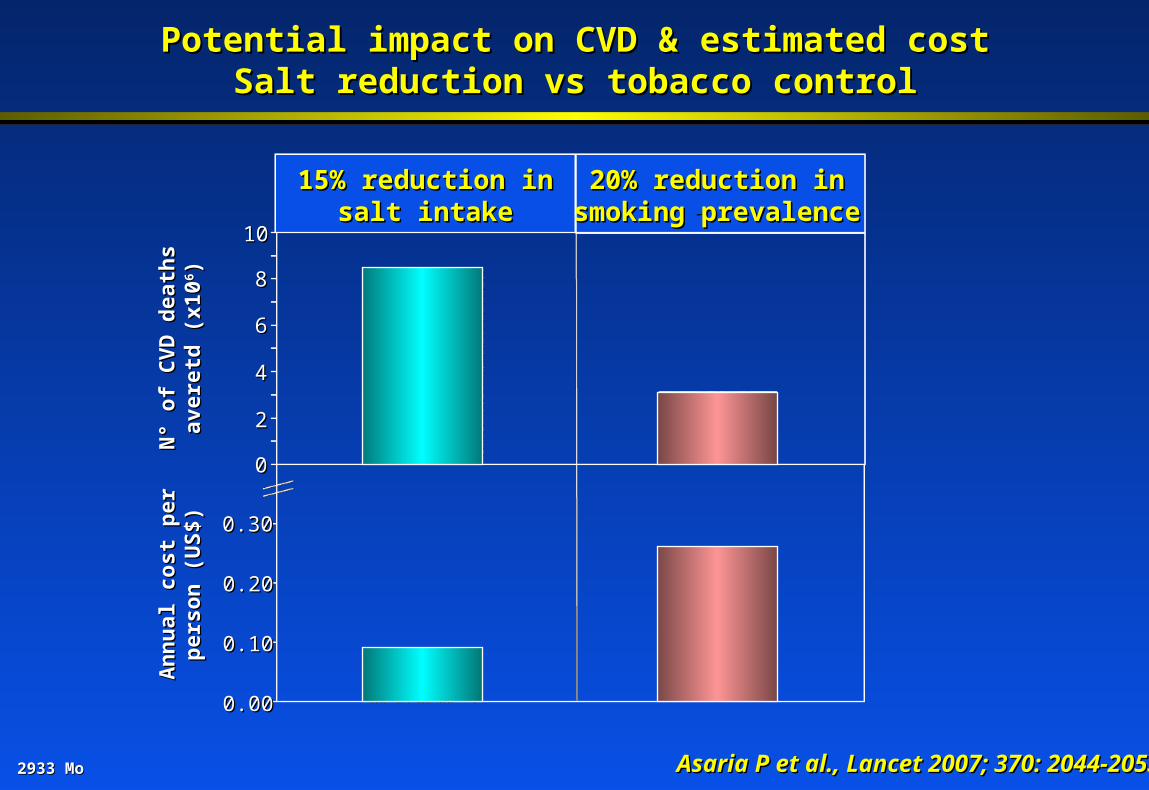
2933 Mo2933 Mo Asaria P et al., Lancet 2007; 370: 2044-2053Asaria P et al., Lancet 2007; 370: 2044-2053
Potential impact on CVD & estimated costPotential impact on CVD & estimated costSalt reduction vs tobacco controlSalt reduction vs tobacco control
N°
of C
VD
dea
ths
N°
of C
VD
dea
ths
aver
etd
(x1
0av
eret
d (
x1066 ))
15% reduction in15% reduction insalt intakesalt intake
20% reduction in20% reduction insmoking prevalencesmoking prevalence
An
nu
al c
ost
per
An
nu
al c
ost
per
per
son
(U
S$)
per
son
(U
S$)
1010
88
66
44
22
00
0.300.30
0.200.20
0.100.10
0.000.00
2920 Mo2920 Mo
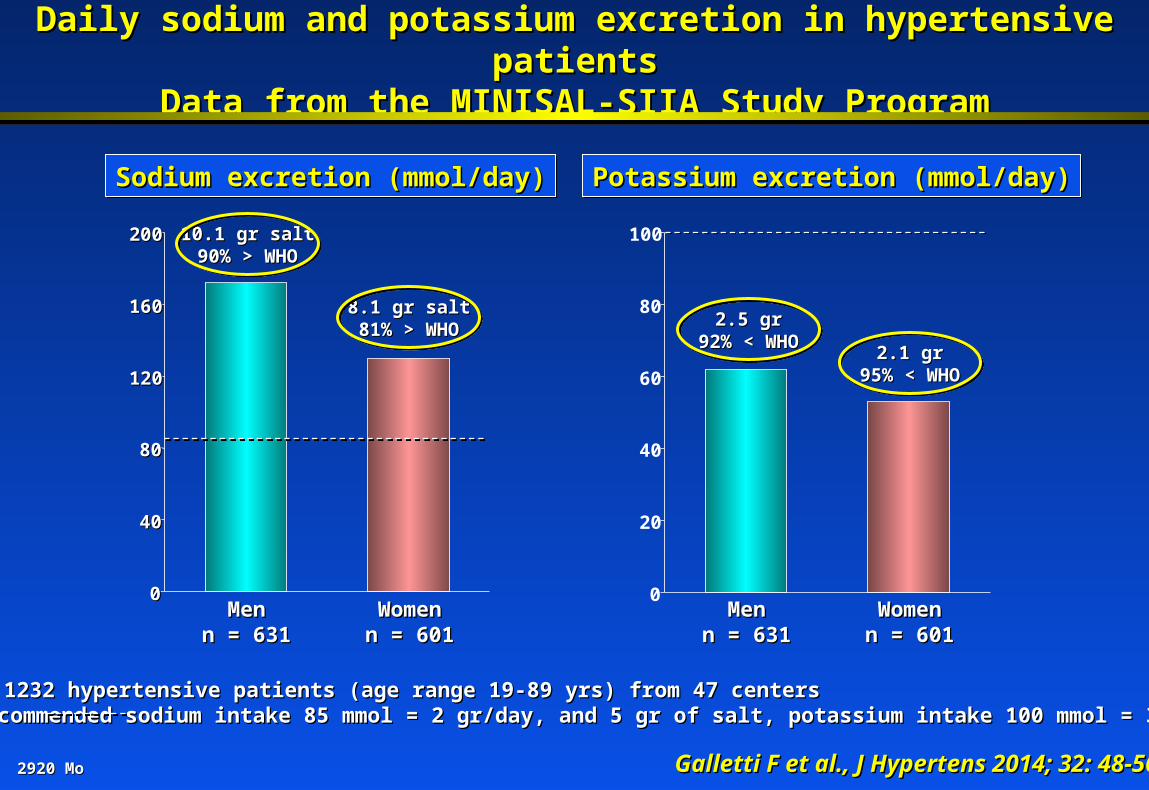
Daily sodium and potassium excretion in hypertensive patientsDaily sodium and potassium excretion in hypertensive patientsData from the MINISAL-SIIA Study ProgramData from the MINISAL-SIIA Study Program
Galletti F et al., J Hypertens 2014; 32: 48-56Galletti F et al., J Hypertens 2014; 32: 48-56
Sodium excretion (mmol/day)Sodium excretion (mmol/day)Sodium excretion (mmol/day)Sodium excretion (mmol/day) Potassium excretion (mmol/day)Potassium excretion (mmol/day)Potassium excretion (mmol/day)Potassium excretion (mmol/day)
Data from 1232 hypertensive patients (age range 19-89 yrs) from 47 centersData from 1232 hypertensive patients (age range 19-89 yrs) from 47 centersRecommended sodium intake 85 mmol = 2 gr/day, and 5 gr of salt, potassium intake 100 mmol = 3.9 gr/dayRecommended sodium intake 85 mmol = 2 gr/day, and 5 gr of salt, potassium intake 100 mmol = 3.9 gr/day
00
4040
8080
120120
160160
200200
0
20
40
60
80
100
MenMenn = 631n = 631
WomenWomenn = 601n = 601
MenMenn = 631n = 631
WomenWomenn = 601n = 601
10.1 gr salt10.1 gr salt90% > WHO90% > WHO
8.1 gr salt8.1 gr salt81% > WHO81% > WHO 2.5 gr2.5 gr
92% < WHO92% < WHO2.1 gr2.1 gr
95% < WHO95% < WHO
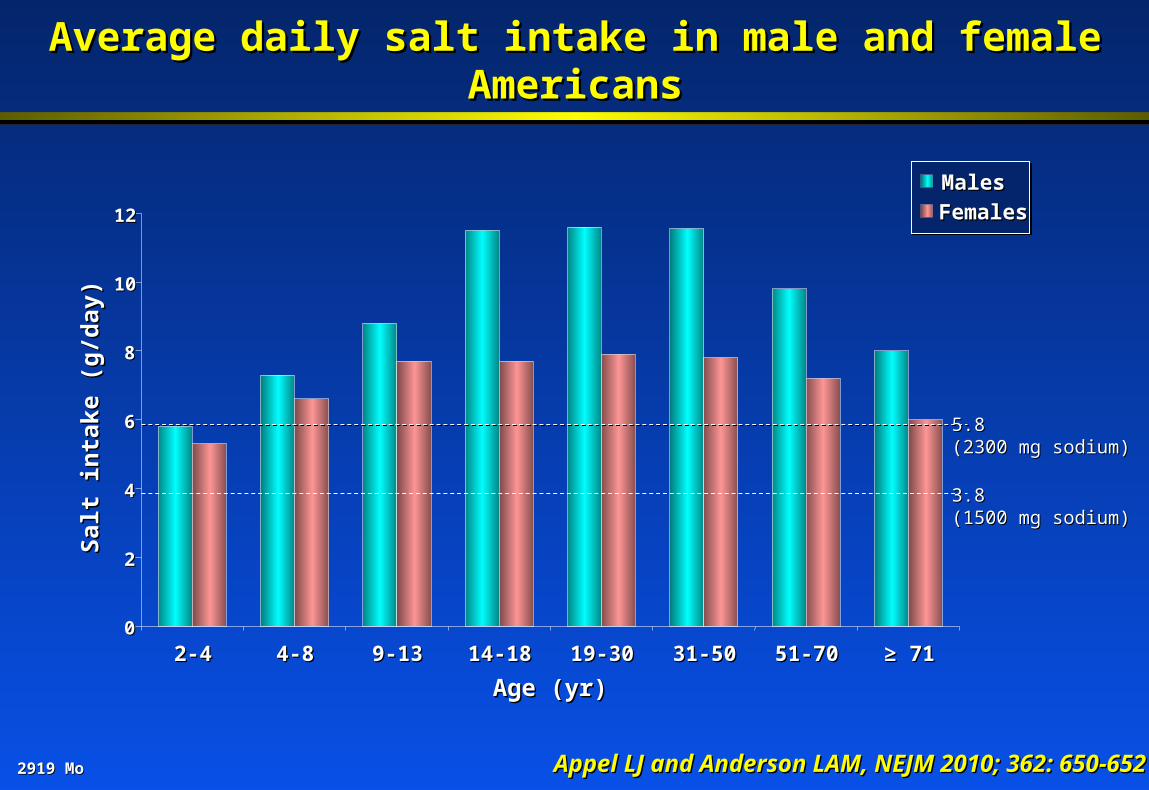
2919 Mo2919 Mo
Average daily salt intake in male and female AmericansAverage daily salt intake in male and female Americans
Appel LJ and Anderson LAM, NEJM 2010; 362: 650-652Appel LJ and Anderson LAM, NEJM 2010; 362: 650-652
00
22
44
66
88
1010
1212
2-4 2-4 4-8 4-8 9-13 9-13 14-1814-18 19-3019-30 31-5031-50 51-7051-70 ≥ ≥ 7171
MalesMales
FemalesFemales
Salt
inta
ke (
g/d
ay)
Salt
inta
ke (
g/d
ay)
Age (yr)Age (yr)
5.85.8(2300 mg sodium)(2300 mg sodium)
3.83.8(1500 mg sodium)(1500 mg sodium)

2925 Mo2925 Mo Galletti F et al., J Hypertens 2014; 32: 48-56Galletti F et al., J Hypertens 2014; 32: 48-56
Mean sodium / potassium excretion ratio in hypertensive patientsMean sodium / potassium excretion ratio in hypertensive patientsData from the MINISAL-SIIA Study ProgramData from the MINISAL-SIIA Study Program
Data from 1232 hypertensive patients from 47 centersData from 1232 hypertensive patients from 47 centersRecommended sodium / potassium ratio: 0.85Recommended sodium / potassium ratio: 0.85
00
11
22
33
44
MenMenn = 631n = 631
WomenWomenn = 601n = 601
2.992.99
2.712.71
1.5% < 0.851.5% < 0.851.7% < 0.851.7% < 0.85
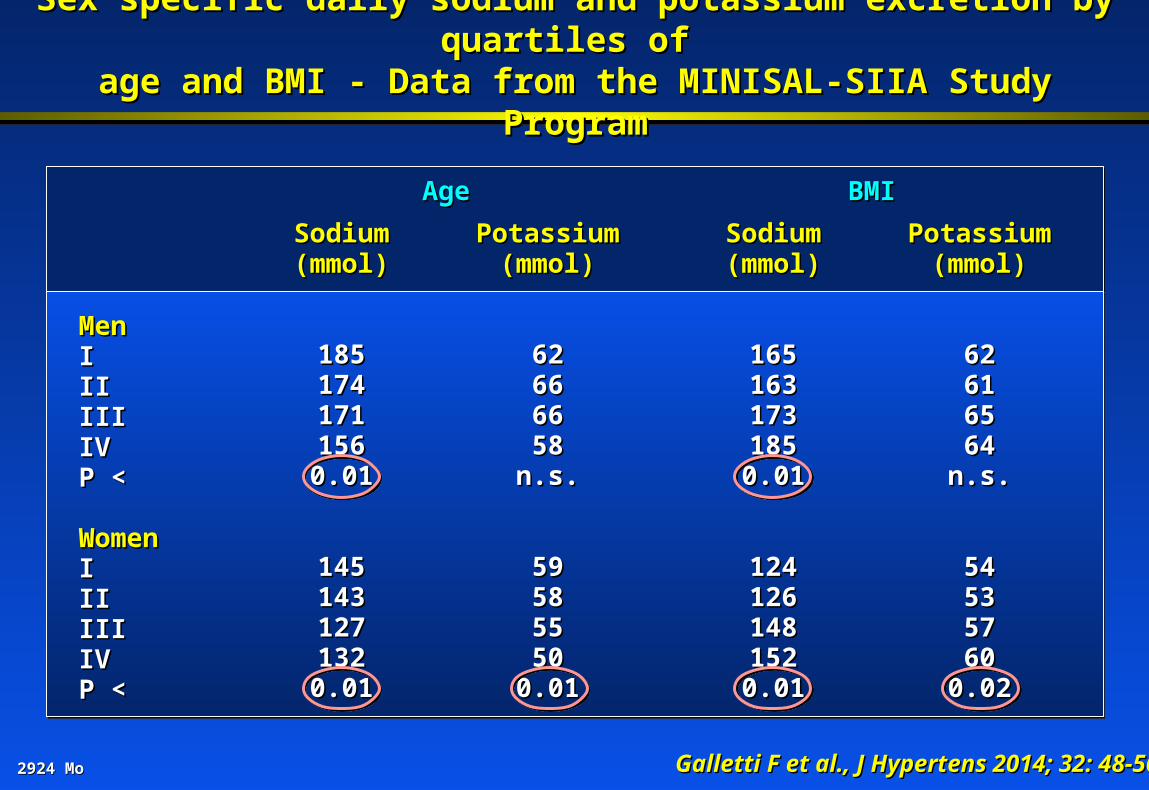
2924 Mo2924 Mo
MenMenIIIIIIIIIIIIIVIVP < P <
WomenWomenIIIIIIIIIIIIIVIVP <P <
SodiumSodium(mmol)(mmol)
1851851741741711711561560.010.01
1451451431431271271321320.010.01
Galletti F et al., J Hypertens 2014; 32: 48-56Galletti F et al., J Hypertens 2014; 32: 48-56
Sex specific daily sodium and potassium excretion by quartiles of Sex specific daily sodium and potassium excretion by quartiles of age and BMI - Data from the MINISAL-SIIA Study Programage and BMI - Data from the MINISAL-SIIA Study Program
PotassiumPotassium(mmol)(mmol)
6262666666665858n.s.n.s.
5959585855555050
0.010.01
AgeAge
SodiumSodium(mmol)(mmol)
1651651631631731731851850.010.01
1241241261261481481521520.010.01
PotassiumPotassium(mmol)(mmol)
6262616165656464n.s.n.s.
5454535357576060
0.020.02
BMIBMI
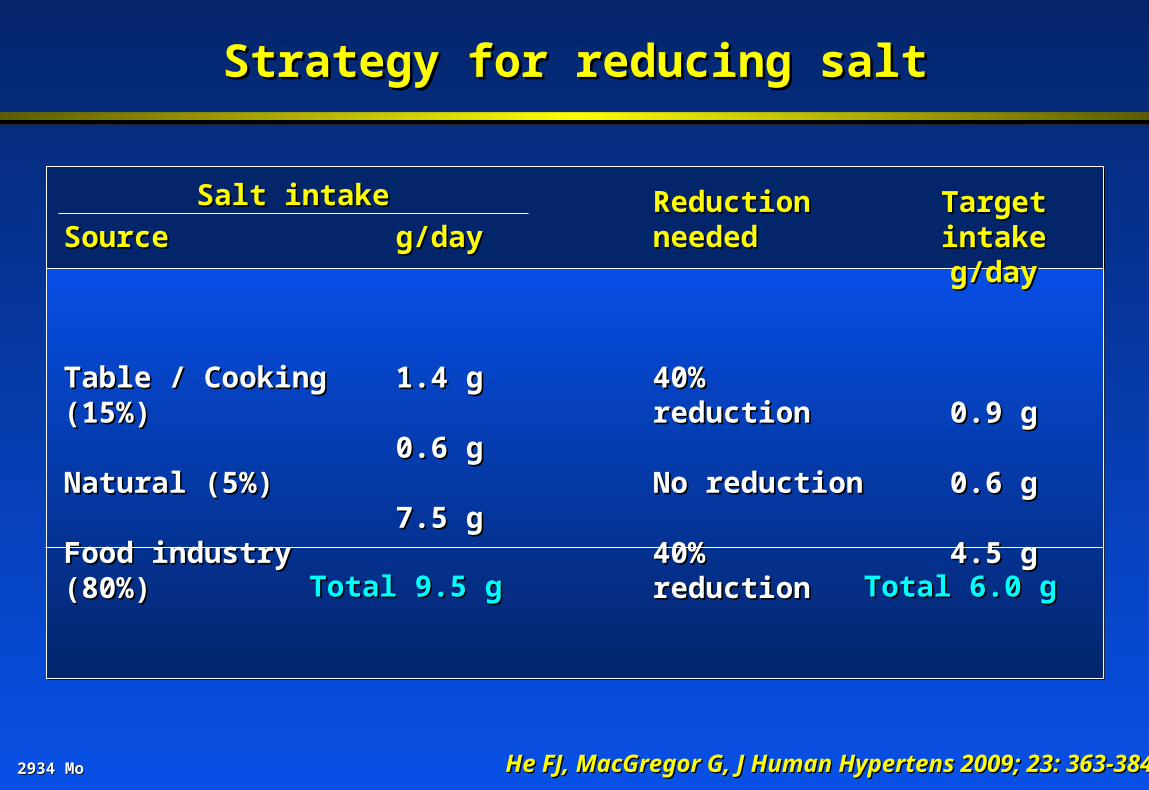
2934 Mo2934 Mo
Strategy for reducing saltStrategy for reducing salt
He FJ, MacGregor G, J Human Hypertens 2009; 23: 363-384He FJ, MacGregor G, J Human Hypertens 2009; 23: 363-384
SourceSource
Table / Cooking (15%)Table / Cooking (15%)
Natural (5%)Natural (5%)
Food industry (80%)Food industry (80%)
g/dayg/day
1.4 g1.4 g
0.6 g0.6 g
7.5 g7.5 g
ReductionReductionneededneeded
40% reduction40% reduction
No reductionNo reduction
40% reduction40% reduction
Target intakeTarget intakeg/dayg/day
0.9 g0.9 g
0.6 g0.6 g
4.5 g4.5 g
Salt intakeSalt intake
Total 9.5 gTotal 9.5 g Total 6.0 gTotal 6.0 g
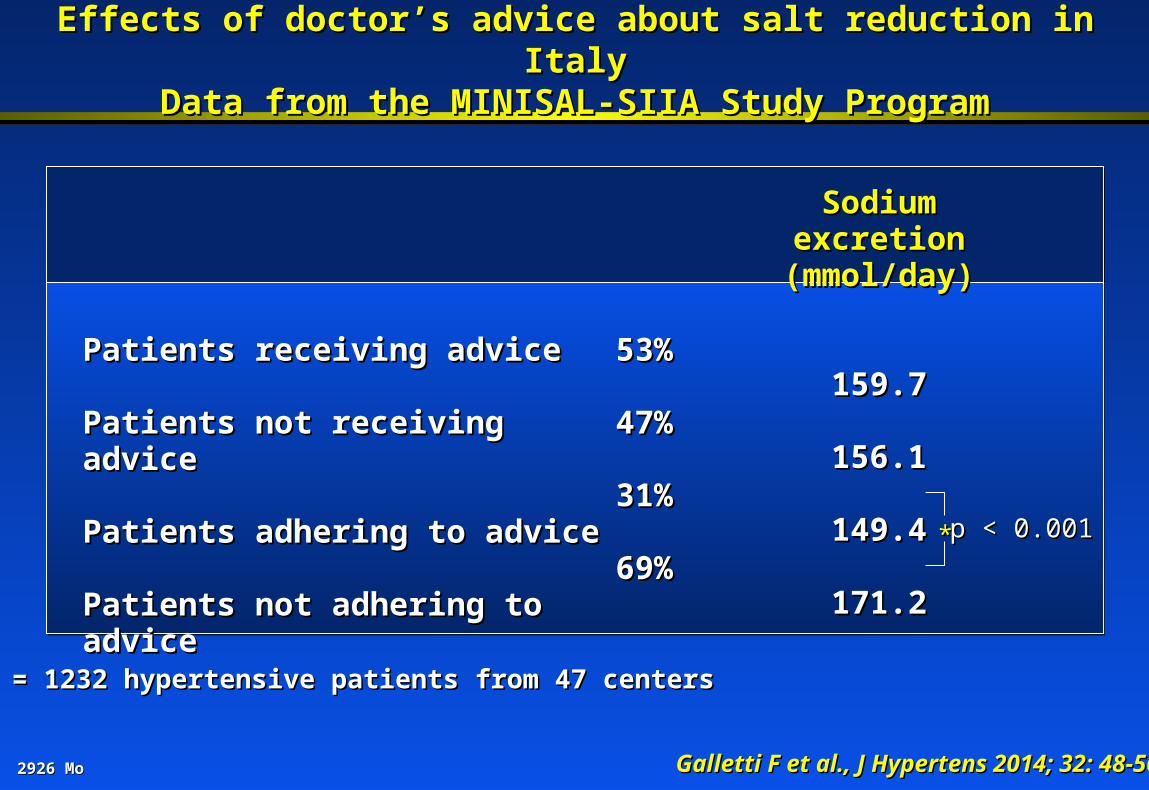
2926 Mo2926 Mo Galletti F et al., J Hypertens 2014; 32: 48-56Galletti F et al., J Hypertens 2014; 32: 48-56
Effects of doctor’s advice about salt reduction in ItalyEffects of doctor’s advice about salt reduction in ItalyData from the MINISAL-SIIA Study ProgramData from the MINISAL-SIIA Study Program
n = 1232 hypertensive patients from 47 centersn = 1232 hypertensive patients from 47 centers
Patients receiving advicePatients receiving advice
Patients not receiving advicePatients not receiving advice
Patients adhering to advicePatients adhering to advice
Patients not adhering to advicePatients not adhering to advice
53%53%
47%47%
31%31%
69%69%
Sodium excretionSodium excretion(mmol/day)(mmol/day)
159.7159.7
156.1156.1
149.4149.4
171.2171.2** p < 0.001p < 0.001

2935 Mo2935 Mo
The commercial importance of salt in processed foodThe commercial importance of salt in processed food
He FJ, MacGregor G, J Human Hypertens 2009; 23: 363-384He FJ, MacGregor G, J Human Hypertens 2009; 23: 363-384
SaltSalt
ProducersProducers
Food industryFood industry
Highly salted processed foodHighly salted processed food(80% of total intake)(80% of total intake)
ThirstThirst
Soft drinksSoft drinksMineral waterMineral water
ProfitProfit
Meat products - Salt addedMeat products - Salt added
Increase in weight Increase in weight by water bindingby water binding
ProfitProfit
Salt addictionSalt addiction
Demand for Demand for salty foodsalty food
ProfitProfit
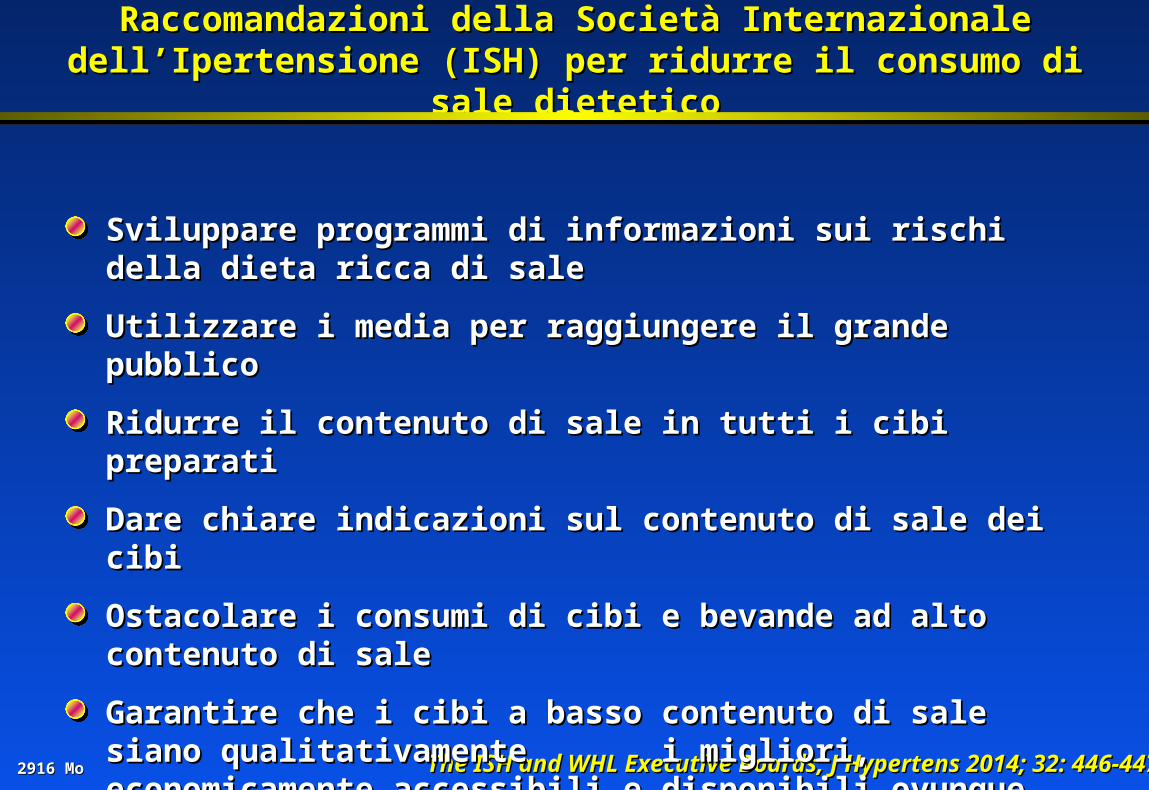
2916 Mo2916 Mo
Raccomandazioni della Società Internazionale dell’Ipertensione (ISH) Raccomandazioni della Società Internazionale dell’Ipertensione (ISH) per ridurre il consumo di sale dieteticoper ridurre il consumo di sale dietetico
The ISH and WHL Executive Boards, J Hypertens 2014; 32: 446-447The ISH and WHL Executive Boards, J Hypertens 2014; 32: 446-447
Sviluppare programmi di informazioni sui rischi della dieta ricca di saleSviluppare programmi di informazioni sui rischi della dieta ricca di sale
Utilizzare i media per raggiungere il grande pubblicoUtilizzare i media per raggiungere il grande pubblico
Ridurre il contenuto di sale in tutti i cibi preparatiRidurre il contenuto di sale in tutti i cibi preparati
Dare chiare indicazioni sul contenuto di sale dei cibiDare chiare indicazioni sul contenuto di sale dei cibi
Ostacolare i consumi di cibi e bevande ad alto contenuto di saleOstacolare i consumi di cibi e bevande ad alto contenuto di sale
Garantire che i cibi a basso contenuto di sale siano qualitativamente Garantire che i cibi a basso contenuto di sale siano qualitativamente i migliori, economicamente accessibili e disponibili ovunquei migliori, economicamente accessibili e disponibili ovunque
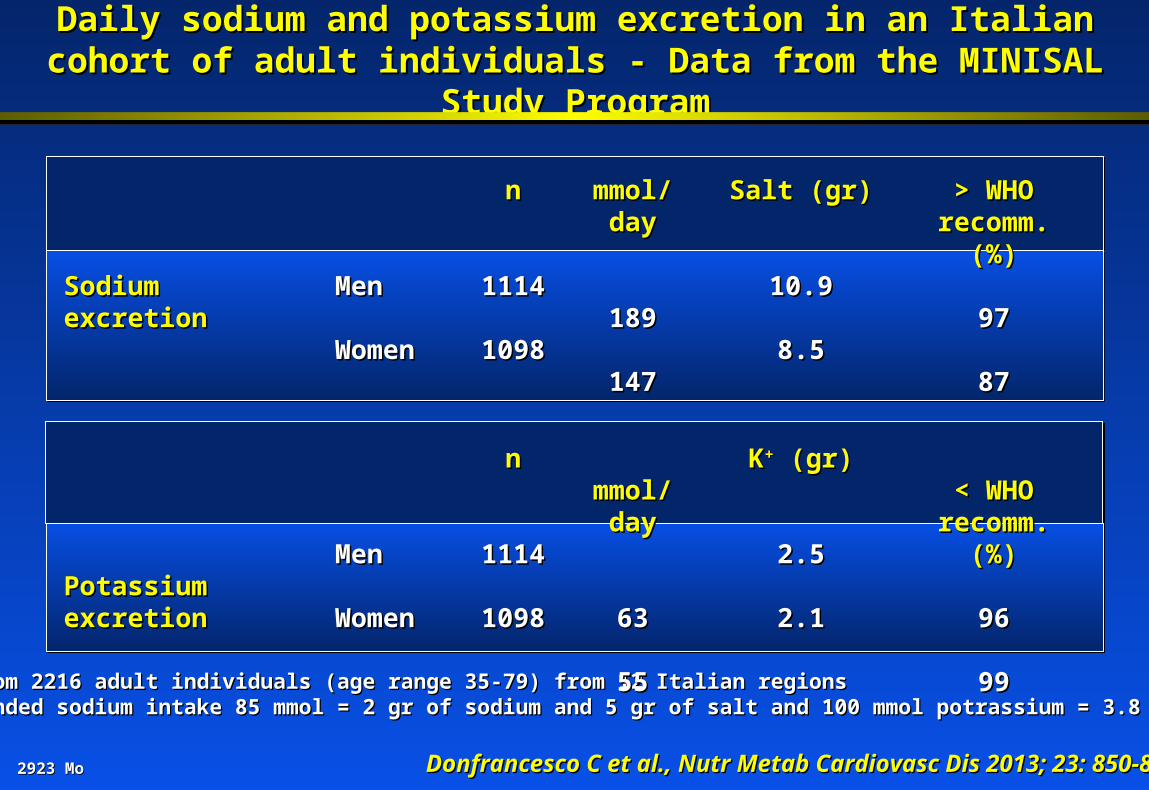
2923 Mo2923 Mo
Daily sodium and potassium excretion in an Italian cohort of adult Daily sodium and potassium excretion in an Italian cohort of adult individuals - Data from the MINISAL Study Programindividuals - Data from the MINISAL Study Program
Donfrancesco C et al., Nutr Metab Cardiovasc Dis 2013; 23: 850-856Donfrancesco C et al., Nutr Metab Cardiovasc Dis 2013; 23: 850-856
Sodium excretionSodium excretion
Potassium excretionPotassium excretion
MenMen
WomenWomen
MenMen
WomenWomen
nn
11141114
10981098
nn
11141114
10981098
Salt (gr)Salt (gr)
10.910.9
8.58.5
KK++ (gr) (gr)
2.52.5
2.12.1
> WHO > WHO recomm. (%)recomm. (%)
9797
8787
< WHO < WHO recomm. (%)recomm. (%)
9696
9999
Data from 2216 adult individuals (age range 35-79) from 12 Italian regionsData from 2216 adult individuals (age range 35-79) from 12 Italian regionsRecommended sodium intake 85 mmol = 2 gr of sodium and 5 gr of salt and 100 mmol potrassium = 3.8 grRecommended sodium intake 85 mmol = 2 gr of sodium and 5 gr of salt and 100 mmol potrassium = 3.8 gr
mmol/daymmol/day
189189
147147
mmol/daymmol/day
6363
5555
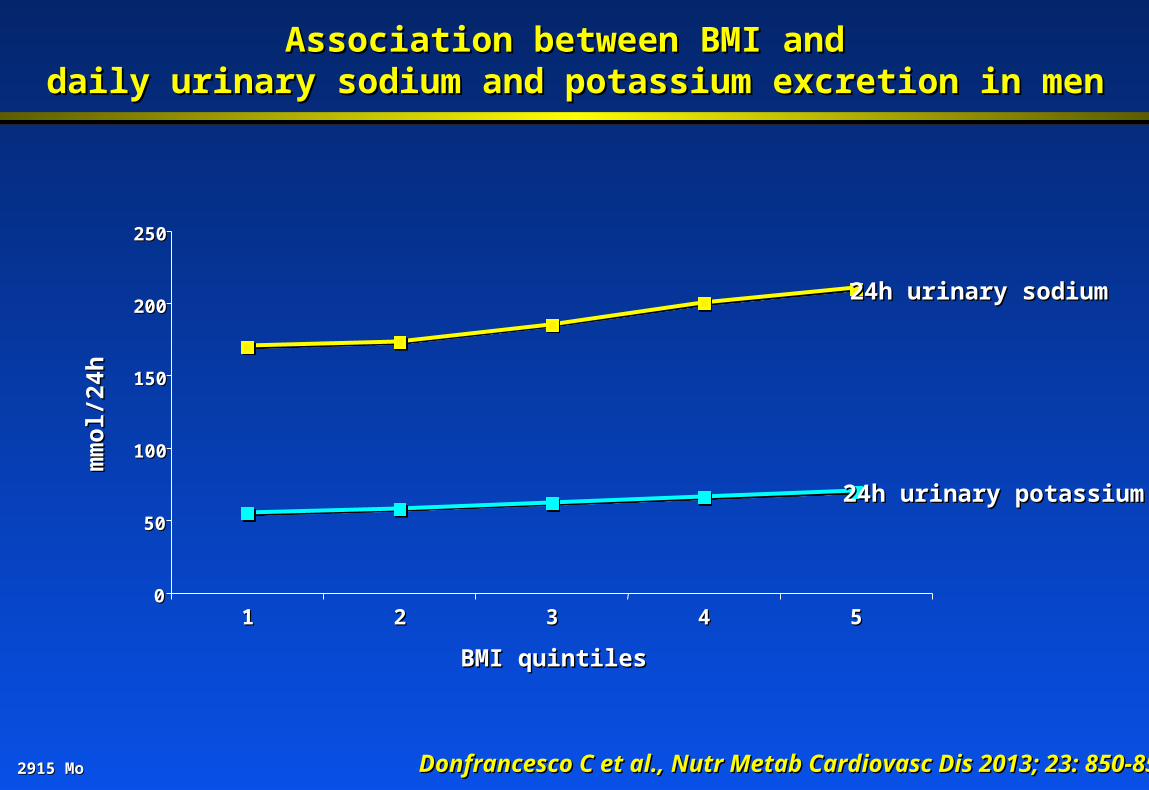
2915 Mo2915 Mo
Association between BMI and Association between BMI and daily urinary sodium and potassium excretion in mendaily urinary sodium and potassium excretion in men
Donfrancesco C et al., Nutr Metab Cardiovasc Dis 2013; 23: 850-856Donfrancesco C et al., Nutr Metab Cardiovasc Dis 2013; 23: 850-856
00
5050
100100
150150
200200
250250
11 22 33 44 55
mm
ol/2
4hm
mol
/24h
BMI quintilesBMI quintiles
24h urinary sodium24h urinary sodium
24h urinary potassium24h urinary potassium

2927 Mo2927 Mo Tuomilehto J et al., Lancet 2001; 357: 848-851Tuomilehto J et al., Lancet 2001; 357: 848-851
Increased risk of death related to a 6 g/day increase in salt intakeIncreased risk of death related to a 6 g/day increase in salt intake
Data from 2436 individuals (age range 25-64 yrs) adjusted for age, smoking, cholesterol, SBP and BMIData from 2436 individuals (age range 25-64 yrs) adjusted for age, smoking, cholesterol, SBP and BMI*** p < 0.001 compared to lower salt intake*** p < 0.001 compared to lower salt intake
0.500.50
0.750.75
1.001.00
1.251.25
1.501.50
1.751.75CHD deathCHD deathCHD deathCHD death CVD deathCVD deathCVD deathCVD death All deathAll deathAll deathAll death
Lower salt intakeLower salt intakeHigher salt intakeHigher salt intake
Haz
ard
Rat
ioH
azar
d R
atio
******
******
******
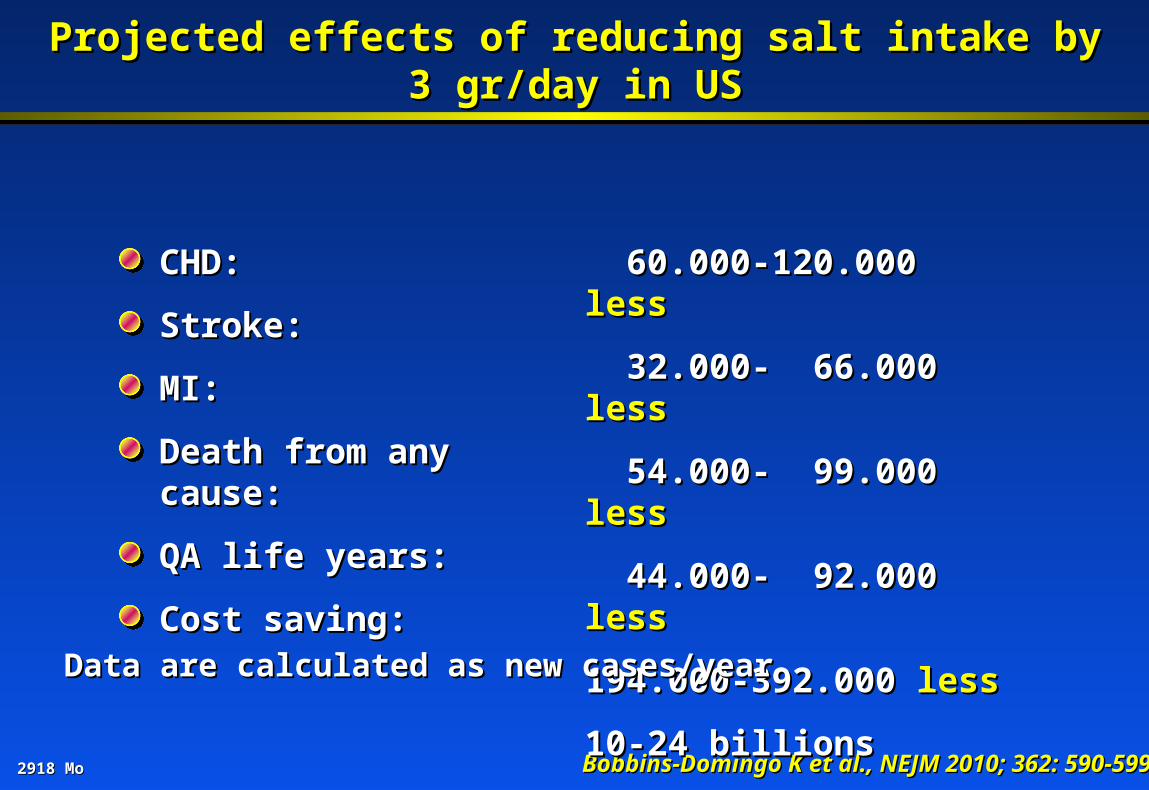
2918 Mo2918 Mo
Projected effects of reducing salt intake by 3 gr/day in USProjected effects of reducing salt intake by 3 gr/day in US
CHD:CHD:
Stroke:Stroke:
MI:MI:
Death from any cause:Death from any cause:
QA life years:QA life years:
Cost saving:Cost saving:
Bobbins-Domingo K et al., NEJM 2010; 362: 590-599Bobbins-Domingo K et al., NEJM 2010; 362: 590-599
60.000-120.000 60.000-120.000 lessless
32.000- 66.000 32.000- 66.000 lessless
54.000- 99.000 54.000- 99.000 lessless
44.000- 92.000 44.000- 92.000 lessless
194.000-392.000 194.000-392.000 lessless
10-24 billions10-24 billions
Data are calculated as new cases/yearData are calculated as new cases/year