02-Mathematica e didattica - crescenziogallo.it · Sales Manager, [email protected]) 12 - 26...
61
Lezione 2 Mathematica e didattica Crescenzio Gallo - Università di Foggia crescenzio.gallo ü unifg.it Note: † Il materiale visualizzato durante questo seminario è disponibile per il download all'indirizzo http://www.crescenziogallo.it/unifg/seminario-mathematica-2014/ † Il materiale utilizzato è tratto dai webinar pubblicati da Adalta e prodotti dal dott. Roberto Cavaliere (Mathematica Technical Sales Manager, [email protected]) 12 - 26 Giugno 2014
Transcript of 02-Mathematica e didattica - crescenziogallo.it · Sales Manager, [email protected]) 12 - 26...

Lezione 2
Mathematica e didatticaCrescenzio Gallo - Università di Foggiacrescenzio.galloüunifg.it
Note:† Il materiale visualizzato durante questo seminario è disponibile per il download all'indirizzo
http://www.crescenziogallo.it/unifg/seminario-mathematica-2014/† Il materiale utilizzato è tratto dai webinar pubblicati da Adalta e prodotti dal dott. Roberto Cavaliere (Mathematica Technical
Sales Manager, [email protected])12 - 26 Giugno 2014

Slide 1 of 15 AgendaMathematica e didattica† Cosa abbiamo a disposizione† Come possiamo preparare il materiale† Quali principi ci supportanto e quali vantaggi† Come rendere disponibile ciò che realizziamoConclusioni
† Vantaggi¢ | £
2 02-Mathematica e didattica.nb

Slide 2 of 15 Mathematica e didatticaCosa abbiamo a disposizione
La componente storica: il calcolo numerico, simbolico e graficoAmbiente pluridisciplinare per una didattica avanzata
Come possiamo preparare il materialeInterfacce programmabili e personalizzabiliSemplice editing di testi scientifici e personalizzazione di grafici
Come rendere disponibile ciò che realizziamoComputable Document Format
¢ | £
02-Mathematica e didattica.nb 3

Slide 3 of 15 Mathematica e didattica - La componente storica: il calcolo numerico, simbolico e graficoMathematica da oltre venti anni rappresenta uno degli strumenti software maggiormente utilizzati in ambito di ricerca di base edapplicata in discipline quali la matematica, la fisica, l’ingegneria, l’economia, la statistica, ecc. La sua caratteristica di sistema ibrido numerico-simbolico gli permette di essere potente ma flessibile. La grafica completamenteriscritta e ottimizzata dalla versione 6, ora offre una qualità elevatissima ed un’ampia gamma di funzioni dedicate.
¢ | £
4 02-Mathematica e didattica.nb

Slide 4 of 15 Mathematica e didattica - Ambiente pluridisciplinare per una didattica avanzataMathematica dispone di funzioni di calcolo adatte a qualsiasi contesto tecnico scientifico, ad esempio Statistica, Ingegneria, Matem-atica, Biologia, Fisica, Chimica, ecc. Pertanto risulta evidente come si possa sfruttare tale software per l’insegnamento di una qualsi-asi disciplina scientifica. Inoltre, grazie a set di funzioni dedicate a specifiche aree tematiche, quali ad esempio Business Graph-ics e Finance, Geographic Information Systems (GIS), Image Processing, High Performance Computing, Cud-a/OpenCL-Link, Control Systems, Wavelet Analysis, Statistics nonchè la presenza di banche dati specialistiche(FinancialData, ChemicalData, AstronomicalData, GenomeData e molte altre) è possibile anche approfondire tali tem-atiche per una didattica avanzata.Infine, la disponibilità di altre funzionalità quali ad esempio l’Import/Export di numerosi formati standard, la gestione dellestringhe, l’integrazione con Wolfram|Alpha, rendono Mathematica uno strumento idoneo ed innovativo anche per la didattica indiscipline non necessariamente tecnico-scientifiche.
¢ | £
02-Mathematica e didattica.nb 5

Slide 5 of 15 Mathematica e didattica - Ambiente pluridisciplinare per una didattica avanzata
Esempio 1: le banche dati
» ChemicalDataChemicalData fornisce dati relativi a circa 44.000 compositi chimiciLa formula della caffeinaChemicalData@"Caffeine"D
O
O NNN
NNNNNN
NN
La sua struttura molecolare in 3DChemicalData@"Caffeine", "MoleculePlot"D
Una serie di formuleGraphicsGrid@Partition@
Show@ChemicalData@ÒD, ImageSize Ø TinyD & êü Take@ChemicalData@"Amines"D, 16D, 4D, Frame Ø AllD
6 02-Mathematica e didattica.nb

Una serie di formuleGraphicsGrid@Partition@
Show@ChemicalData@ÒD, ImageSize Ø TinyD & êü Take@ChemicalData@"Amines"D, 16D, 4D, Frame Ø AllD
02-Mathematica e didattica.nb 7

NN
NH
N
H
NH
N
H
NN
NN
H
NH
N
H
NN
H
N
HNN
HN
H
NNH
N
H
NNN
H
NNH
N
HNN
HN
H
NNH
N
H
NN
NNN
HN
H
OOHNN
HN
H
Cl H
NN
NH
N
H
NH
N
H
OC
NNC
OC
NNC
NN HN
H
NN HN
H
NNH
N
H
Una tabella formattatavals = Table@ChemicalData@Ò, propD,
8prop, 8"FormulaDisplay", "MolecularWeight", "AlternateNames"<<D & êüChemicalData@8"Sulfur", "Compound"<D;
Text@Grid@Prepend@vals@@1 ;; 10DD, 8"Chemical", "Molecular weight", "Alternate Names"<D,Frame -> All, Background -> 8None, 888LightBlue, White<<, 81 -> LightYellow<<<,Alignment -> LeftDD
Chemical Molecular weight Alternate Names32S 31.972070999 8sulfur-32 S<S 32.065 8brimstone, elemental sulfur, mixed sulfur allotropes, precipitated sulfur<34S 33.967866902 8sulfur-34 S<H2S 34.081 8sulfane<D2S 36.093 8<
BeS 41.077 8beryllium monosulfide, beryllium sulphide<Li2S 45.95 8dilithium sulfide<CH3SNa 48.107 8mercaptomethane, methanethiol sodium salt, methylmercaptan<CH3SH 48.107 8mercaptan C1, methyl mercaptan<NH4SH 51.111 8ammonium hydrogen sulfide, ammonium hydrosulfide, ammonium sulfide<
Una applicazione importante in pochi step: il rapporto tra densità e punto di ebollizione per le varie classi di compositi
8 02-Mathematica e didattica.nb

Chemical Molecular weight Alternate Names32S 31.972070999 8sulfur-32 S<S 32.065 8brimstone, elemental sulfur, mixed sulfur allotropes, precipitated sulfur<34S 33.967866902 8sulfur-34 S<H2S 34.081 8sulfane<D2S 36.093 8<
BeS 41.077 8beryllium monosulfide, beryllium sulphide<Li2S 45.95 8dilithium sulfide<CH3SNa 48.107 8mercaptomethane, methanethiol sodium salt, methylmercaptan<CH3SH 48.107 8mercaptan C1, methyl mercaptan<NH4SH 51.111 8ammonium hydrogen sulfide, ammonium hydrosulfide, ammonium sulfide<
Una applicazione importante in pochi step: il rapporto tra densità e punto di ebollizione per le varie classi di compositiManipulate@ListPlot@Table@8ChemicalData@chem, "Density"D, ChemicalData@chem, "BoilingPoint"D<,
8chem, ChemicalData@grpD<D, AxesLabel Ø 8"density", "boiling point"<, ImageSize Ø LargeD,88grp, "Alkanes", "chemical class"<, ChemicalData@"Classes"D<D
02-Mathematica e didattica.nb 9

chemical class Alkanes
600 700 800 900 1000density
-100
100
200
300
400
500
600boiling point
» AstronomicalDataLa densità dei pianetiText@Grid@8AstronomicalData@Ò, "Name"D, AstronomicalData@Ò, "Density"D< & êü
AstronomicalData@"Planet"D, Frame Ø All, Background Ø LightYellowDD
Mercury 5427.Venus 5243.Earth 5515.Mars 3934.0Jupiter 1326.2Saturn 687.1Uranus 1270.Neptune 1638.
Computa e visualizza la distribuzione dei pianeti minori a varie distanze dal soleasteroidCount = BinCounts@SortüCases@HAstronomicalData@Ò, "SemimajorAxis"Dê149597870691L & êü
Join@AstronomicalData@"InnerMainBeltAsteroid"D, AstronomicalData@"MainBeltAsteroid"D,AstronomicalData@"OuterMainBeltAsteroid"DD, x_?NumberQD, 82, 3.5, .005<D;
10 02-Mathematica e didattica.nb

Mercury 5427.Venus 5243.Earth 5515.Mars 3934.0Jupiter 1326.2Saturn 687.1Uranus 1270.Neptune 1638.
Computa e visualizza la distribuzione dei pianeti minori a varie distanze dal soleasteroidCount = BinCounts@SortüCases@HAstronomicalData@Ò, "SemimajorAxis"Dê149597870691L & êü
Join@AstronomicalData@"InnerMainBeltAsteroid"D, AstronomicalData@"MainBeltAsteroid"D,AstronomicalData@"OuterMainBeltAsteroid"DD, x_?NumberQD, 82, 3.5, .005<D;
ListPlot@asteroidCount, Joined Ø True, Filling Ø 0, Mesh Ø All, ImageSize Ø Large,Ticks Ø 8Table@8Rescale@x, 82, 3.5<, 80, 301<D, x<, 8x, 2, 3.5, .2<D, Automatic<D
» CountryDataGrafico della popolazione in rapporto con l’area del paese
02-Mathematica e didattica.nb 11

» CountryDataGrafico della popolazione in rapporto con l’area del paeseListLogLogPlot@Tooltip@8CountryData@Ò, "Area"D, CountryData@Ò, "Population"D<, CountryData@Ò, "Name"DD & êüCountryData@"Countries"D, ImageSize Ø LargeD
12 02-Mathematica e didattica.nb

I primi 20 paesi per estensione del territorioLast êü Take@Reverse@Sort@8CountryData@Ò, "Area"D, Ò< & êü CountryData@DDD, 20D8Russia, Canada, UnitedStates, China, Brazil, Australia, India, Argentina, Kazakhstan, Algeria,DemocraticRepublicCongo, Greenland, Mexico, SaudiArabia, Indonesia, Sudan, Libya, Iran, Mongolia, Peru<
Text@Grid@Prepend@8CountryData@Ò, "Name"D, CountryData@Ò, "Area"D, CountryData@Ò, "Population"D< & êü Take@%, 5D,8"", "area", "population"<D, Frame Ø All, Background Ø 8None, 8LightBlue, 8LightYellow<<<DD
area populationRussia 1.70752µ 107 1.42558µ 108
Canada 9.98467µ 106 3.49937µ 107
United States 9.63142µ 106 3.1933µ 108
China 9.59696µ 106 1.35937µ 109
Brazil 8.51488µ 106 2.0005µ 108
Tasso di alfabetizzazione in alcuni continenti (Africa, Europa e Asia)Graphics@8EdgeForm@GrayD,
Catch@ColorData@"Warm"D@CountryData@Ò, "LiteracyFraction"D ê. _Missing ß Throw@WhiteDDD,CountryData@Ò, "SchematicPolygon"D< & êü CountryData@"Africa"DD
02-Mathematica e didattica.nb 13

area populationRussia 1.70752µ 107 1.42558µ 108
Canada 9.98467µ 106 3.49937µ 107
United States 9.63142µ 106 3.1933µ 108
China 9.59696µ 106 1.35937µ 109
Brazil 8.51488µ 106 2.0005µ 108
Tasso di alfabetizzazione in alcuni continenti (Africa, Europa e Asia)Graphics@8EdgeForm@GrayD,
Catch@ColorData@"Warm"D@CountryData@Ò, "LiteracyFraction"D ê. _Missing ß Throw@WhiteDDD,CountryData@Ò, "SchematicPolygon"D< & êü CountryData@"Africa"DD
Graphics@8EdgeForm@GrayD,Catch@ColorData@"Warm"D@CountryData@Ò, "LiteracyFraction"D ê. _Missing ß Throw@WhiteDDD,CountryData@Ò, "SchematicPolygon"D< & êü CountryData@"Europe"DD
14 02-Mathematica e didattica.nb
Graphics@8EdgeForm@GrayD,Catch@ColorData@"Warm"D@CountryData@Ò, "LiteracyFraction"D ê. _Missing ß Throw@WhiteDDD,CountryData@Ò, "SchematicPolygon"D< & êü CountryData@"Asia"DD
Il grafico dei paesi confinanti in Sud AmericaGraphPlot@Flatten@Thread@Ò -> CountryData@Ò, "BorderingCountries"DD & êü CountryData@"SouthAmerica"DD,VertexLabeling Ø TrueD
ArgentinaBolivia
Brazil
Chile
ParaguayUruguayPeru
Colombia
FrenchGuiana
GuyanaSuriname
Venezuela
Ecuador
Panama
02-Mathematica e didattica.nb 15

ArgentinaBolivia
Brazil
Chile
ParaguayUruguayPeru
Colombia
FrenchGuiana
GuyanaSuriname
Venezuela
Ecuador
Panama
Una mappa con i nomi di tutte le nazioniGraphics@8LightGreen, EdgeForm@GrayD, Tooltip@CountryData@Ò, "Polygon"D, ÒD & êü CountryData@D<D
Qualcosa in più: collegamenti con altre fonti di informazioni, ad esempio Wikipedia<< WorldPlot`
africa = WorldPlot@8Africa, RandomColors<D
16 02-Mathematica e didattica.nb

africa ê. Tooltip@polygon_, name_D :>Tooltip@Hyperlink@Mouseover@polygon, 8With@8p = Cases@polygon, _Polygon, ¶D<, 8Black, p<D<D,
"http:êêen.wikipedia.orgêwikiê" <> nameD, nameD
¢ | £
» WeatherDataWeatherData fornisce dati meteo in tempo reale da tutte le stazioni del mondoWeatherData@8"Foggia", 5<D8LIBF, LIBA, LIBE, LIRT, D3927<
02-Mathematica e didattica.nb 17

¢ | £
» WeatherDataWeatherData fornisce dati meteo in tempo reale da tutte le stazioni del mondoWeatherData@8"Foggia", 5<D8LIBF, LIBA, LIBE, LIRT, D3927<
stazione = "LIBF";
WeatherData@stazione, "Properties"D
8AlternateStandardNames, CloudCoverFraction, CloudHeight, CloudTypes, Conditions, Coordinates, DewPoint,Elevation, Humidity, Latitude, Longitude, MaxTemperature, MaxWindSpeed, MeanDewPoint, MeanHumidity,MeanPressure, MeanStationPressure, MeanTemperature, MeanVisibility, MeanWindChill, MeanWindSpeed,Memberships, MinTemperature, NCDCID, PrecipitationAmount, PrecipitationRate, PrecipitationTypes, Pressure,PressureTendency, SnowAccumulation, SnowAccumulationRate, SnowDepth, StationName, StationPressure,Temperature, TotalPrecipitation, Visibility, WBANID, WindChill, WindDirection, WindGusts, WindSpeed, WMOID<
WeatherData@stazione, "Temperature", "DateValue"D
18 02-Mathematica e didattica.nb

8AlternateStandardNames, CloudCoverFraction, CloudHeight, CloudTypes, Conditions, Coordinates, DewPoint,Elevation, Humidity, Latitude, Longitude, MaxTemperature, MaxWindSpeed, MeanDewPoint, MeanHumidity,MeanPressure, MeanStationPressure, MeanTemperature, MeanVisibility, MeanWindChill, MeanWindSpeed,Memberships, MinTemperature, NCDCID, PrecipitationAmount, PrecipitationRate, PrecipitationTypes, Pressure,PressureTendency, SnowAccumulation, SnowAccumulationRate, SnowDepth, StationName, StationPressure,Temperature, TotalPrecipitation, Visibility, WBANID, WindChill, WindDirection, WindGusts, WindSpeed, WMOID<
WeatherData@stazione, "Temperature", "DateValue"D882014, 6, 11, 16, 50, 0<, 31.<
DateListPlot@WeatherData@stazione, "MeanTemperature", 882005, 1, 1<, 82011, 9, 30<, "Month"<D,Joined Ø True, Filling Ø Bottom, ImageSize Ø LargeD
DateListPlot@WeatherData@stazione, "Temperature", 882011, 1, 1<, 82011, 6, 1<, "Month"<D,Joined Ø True, Filling Ø Bottom, ImageSize Ø LargeD
02-Mathematica e didattica.nb 19

min = WeatherData@stazione, "MinTemperature", 882009, 1, 1<, 82009, 12, 31<, "Day"<D;max = WeatherData@stazione, "MaxTemperature", 882009, 1, 1<, 82009, 12, 31<, "Day"<D;
DateListPlot@8min, max<, Joined Ø True, Filling Ø 81 Ø 82<<, ImageSize Ø LargeD
» DictionaryLookupCalcolare il numero di parole nel vocabolario che cominciano con ciascuna lettera dell’alfabeto
20 02-Mathematica e didattica.nb

» DictionaryLookupCalcolare il numero di parole nel vocabolario che cominciano con ciascuna lettera dell’alfabetoLength@DictionaryLookup@Ò ~~ ___DD & êü CharacterRange@"a", "z"D84500, 4724, 7831, 5198, 3244, 3446, 2626, 2954, 3357, 711, 577,2392, 4196, 1698, 2104, 6559, 412, 5143, 9599, 4160, 2561, 1206, 2205, 19, 248, 137<
02-Mathematica e didattica.nb 21

ListPlot@%, Filling Ø AxisD
Proviamo con il vocabolario Italiano (quello incluso in Mathematica)Length@DictionaryLookup@8"Italian", Ò ~~ ___<, IgnoreCase Ø TrueDD & êü CharacterRange@"a", "z"D814154, 2567, 9681, 9434, 3047, 3279, 2442, 9, 7963, 1, 3,3631, 3567, 2181, 2420, 8683, 586, 9787, 21 871, 6636, 1680, 2944, 1, 2, 0, 285<
ListPlot@%, Filling Ø AxisD
Si noti che non ci sono parole che cominciano per y o Y
DictionaryLookup@8"Italian", H"j" "x" "y" "w"L ~~ ___<, IgnoreCase Ø TrueD8Jacopo, Windows, xenofobia, xilofono<
Questi sono i dizionari inclusi in Mathematica DictionaryLookup@AllD8Arabic, BrazilianPortuguese, Breton, BritishEnglish, Catalan, Croatian, Danish, Dutch, English, Esperanto, Faroese, Finnish, French,Galician, German, Hebrew, Hindi, Hungarian, IrishGaelic, Italian, Latin, Polish, Portuguese, Russian, ScottishGaelic, Spanish, Swedish<
Questo esempio mostra come cercare un termine che inizia con certe lettere, in tutti i dizionari
22 02-Mathematica e didattica.nb

DictionaryLookup@8"Italian", H"j" "x" "y" "w"L ~~ ___<, IgnoreCase Ø TrueD8Jacopo, Windows, xenofobia, xilofono<
Questi sono i dizionari inclusi in Mathematica DictionaryLookup@AllD8Arabic, BrazilianPortuguese, Breton, BritishEnglish, Catalan, Croatian, Danish, Dutch, English, Esperanto, Faroese, Finnish, French,Galician, German, Hebrew, Hindi, Hungarian, IrishGaelic, Italian, Latin, Polish, Portuguese, Russian, ScottishGaelic, Spanish, Swedish<
Questo esempio mostra come cercare un termine che inizia con certe lettere, in tutti i dizionari
02-Mathematica e didattica.nb 23
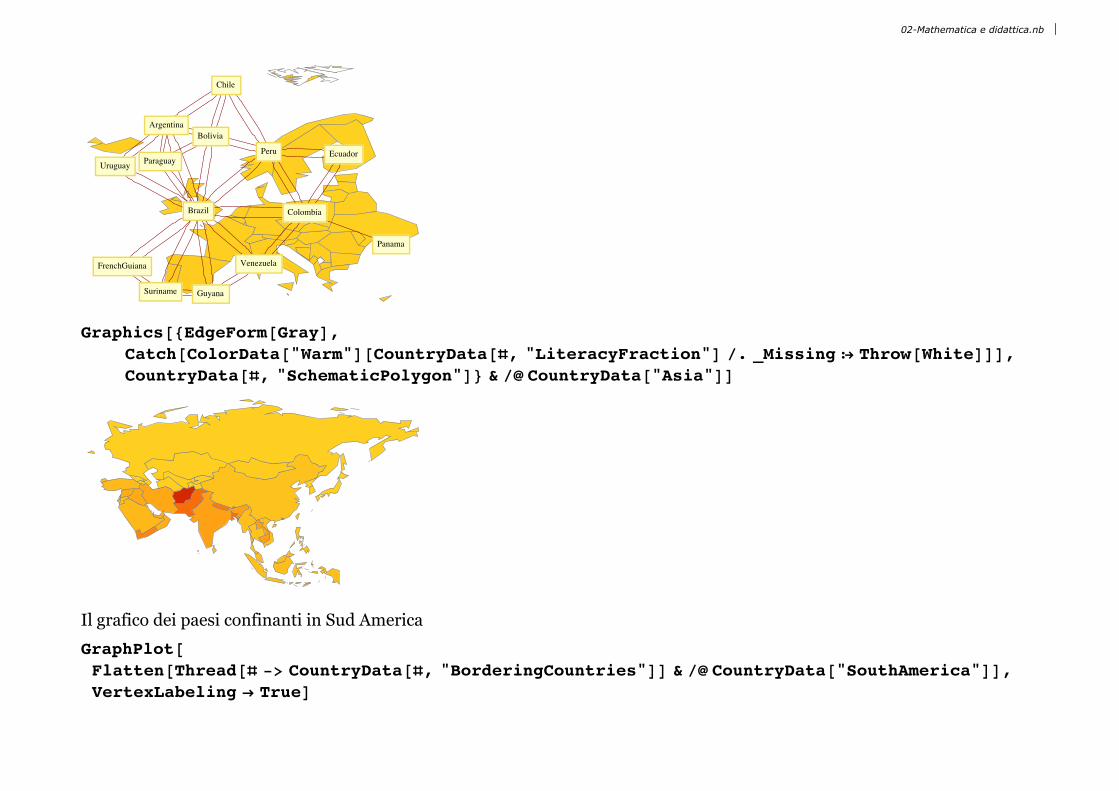
DictionaryLookup@8All, "molec" ~~ ___<D
Dutch molecuulDutch molecuulgewichtEnglish molecularEnglish molecularityEnglish moleculeEnglish moleculesGalician molecularGalician molecularesItalian molecole
Portuguese molecadaPortuguese molecularPortuguese molecularesSpanish molecular
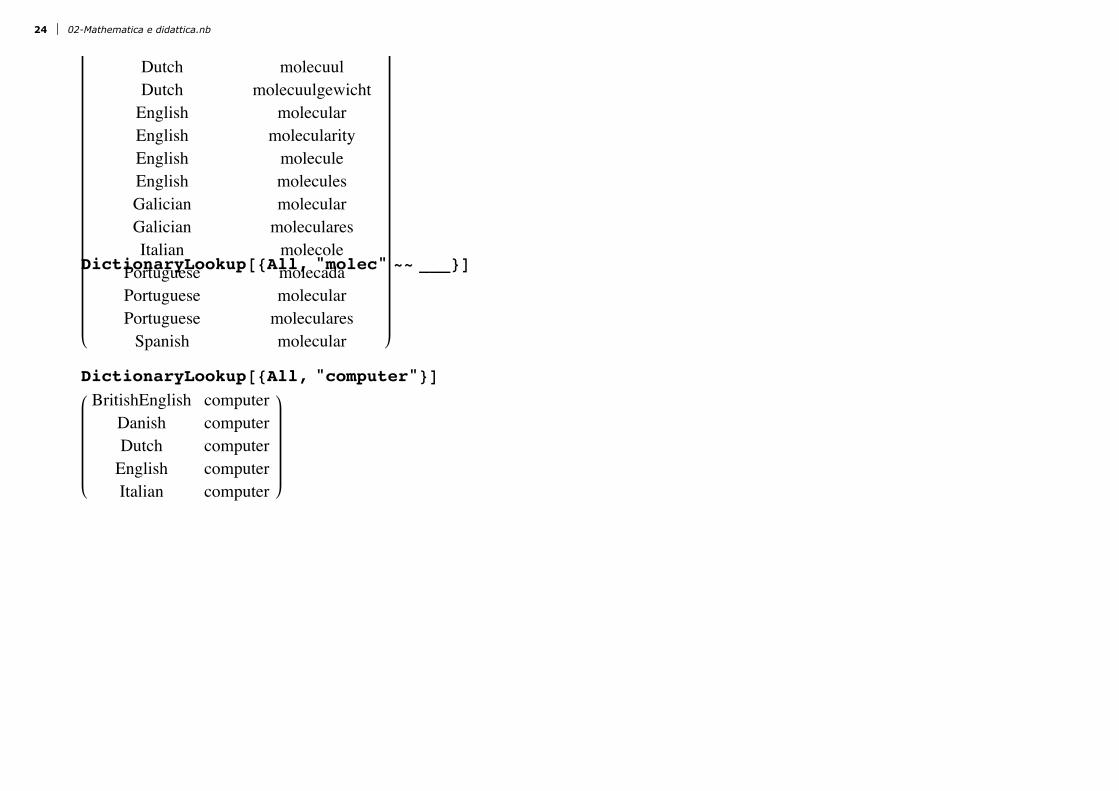
DictionaryLookup@8All, "computer"<DBritishEnglish computer
Danish computerDutch computerEnglish computerItalian computer
24 02-Mathematica e didattica.nb

Slide 6 of 15 Mathematica e didattica - Ambiente pluridisciplinare per una didattica avanzata
Esempio 2: integrazione con Wolfram|Alpha
Una particolare sorgente di dati aggiunta in Mathematica 8 è quella fornita dal motore di computazione della conoscenza chiamatoWolframAlpha. W|A include oltre dieci trilioni di data sets sugli argomenti più svariati. Ci sono diversi modi per richiamare Wol-framApha dall’interno di Mathematica, sia da linea di codice sia programmaticamente.Esempi di domande:Newton’s second law Dini surfaceFermat theoremnutrition facts cheesepopulation history in Italyhow far is Milan from RomeGDP history in Italyboiling point of sulphurearthquake in Italy 1980killer whale vs. blue whaleFunzionalità avanzateWolframAlpha può essere impiegato anche per imparare a usare Mathematica, infatti offre una serie di funzionalità di interpre-tazione del linguaggio naturale e conversione in comandi di Mathematica. Ovviamente bisogna usare frasi molto sintetiche equanto più possibile un linguaggio vicino al linguaggio Mathematica.Tramite la sequenza di tasti SHIFT + CTRL + = si può far comparire il simbolo che indica un riquadro dentro il quale possi-
amo scrivere un’espressione in linguaggio naturale e WolframAlpha tenterà di trasformarla in input di Mathematica. Tale riquadropuò essere integrato dentro qualsiasi linea di input di Mathematica. Rivediamo come si può ottenere una serie di informazioni sulla superfice del Dini.
½ dini surface
02-Mathematica e didattica.nb 25

½ dini surface
Input interpretation:
Dini’s surface HsurfaceL
Example plot: More examples
Hplotted for u from 0 to 4 p and v from 0.001 to 2L
Equations:
Parametric equations:xHu, vL ‡ a cosHuL sinHvL
yHu, vL ‡ a sinHuL sinHvL
zHu, vL ‡ a KcosHvL + logKtanKv
2OOO + b u
logHxL is the natural logarithm »
Surface properties: MoreGenus:g‡ 0Squared line element:
„s2 ‡1
2Ia2 H-cosH2 vLL + a2 + 2 b2M„u2 + 2 a b cosHvL cotHvL„u„v + a2 cot2HvL„v2
Area element:
26 02-Mathematica e didattica.nb

Area element:
„A ‡ a a2 + b2 cosHvL„u„vGaussian curvature:
KHu, vL ‡ -1
a2 + b2
cot HxL is the cotangent function »
Metric properties:
Coefficients of the first fundamental form:
EHu, vL ‡1
2Ia2 H-cosH2 vLL + a2 + 2 b2M
FHu, vL ‡ a b cosHvL cotHvL
GHu, vL ‡ a2 cot2HvLCoefficients of the second fundamental form:
eHu, vL ‡ -a2 sinHvL cosHvL
a2 + b2
f Hu, vL ‡a b cosHvL
a2 + b2
gHu, vL ‡a2 cotHvL
a2 + b2
Vector properties:
Vector length:
°xHu, vL¥ ‡ a2 sin2HvL + Ka KcosHvL + logKtanKv
2OOO + b uO
2
Normal vector:
N`Hu, vL ‡
sgnHcosHvLL H-a cosHuL cosHvL + b sinHuLL
a2 + b2, -sgnHcosHvLL Hb cosHuL + a cosHvL sinHuLL
a2 + b2,a sgnHcosHvLL sinHvL
a2 + b2
°expr¥ gives the norm of a number, vector, or matrix »
02-Mathematica e didattica.nb 27
sgn HxL is the sign of x »
Property:
constant HGaussianL curvature surface
Associated person:
Ulisse Dini
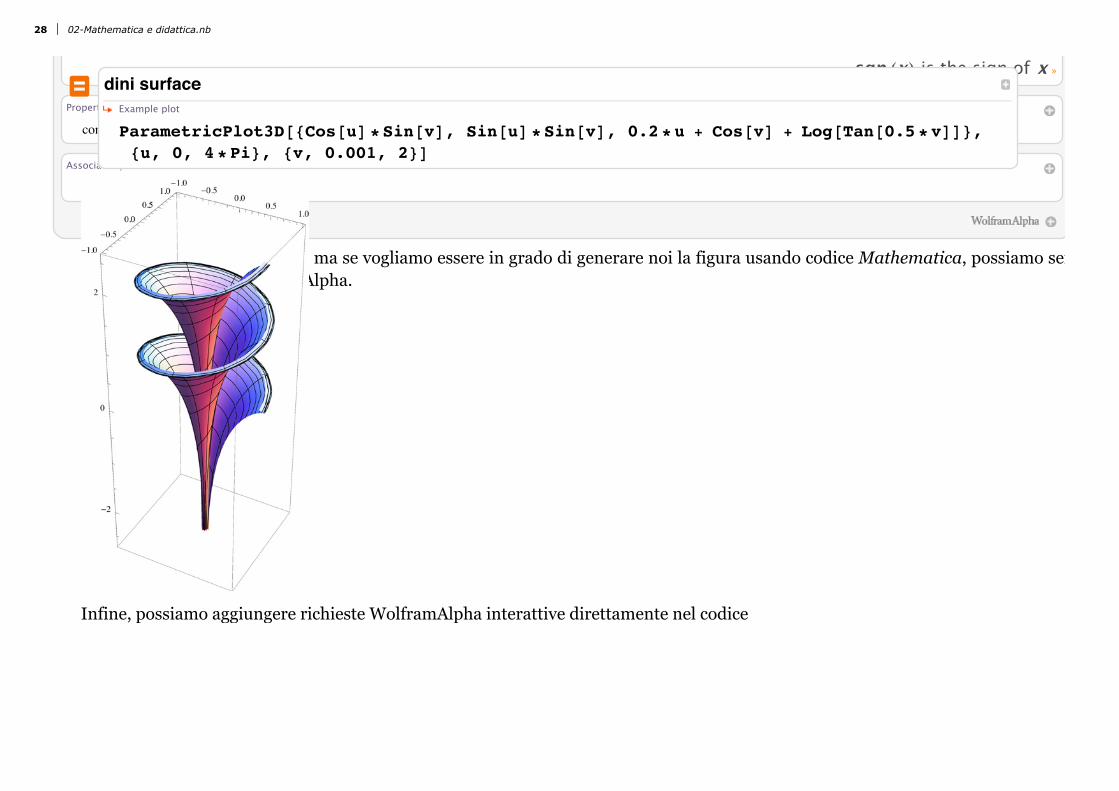
Il riquadro fornito è completo ma se vogliamo essere in grado di generare noi la figura usando codice Mathematica, possiamo sem-pre chiedere aiuto a WolframAlpha.
‹ dini surfaceExample plot
ParametricPlot3D@8Cos@uD*Sin@vD, Sin@uD*Sin@vD, 0.2*u + Cos@vD + Log@[email protected]*vDD<,8u, 0, 4*Pi<, 8v, 0.001, 2<D
Infine, possiamo aggiungere richieste WolframAlpha interattive direttamente nel codice
28 02-Mathematica e didattica.nb

‹ dini surfaceExample plot
ParametricPlot3D@8Cos@uD*Sin@vD, Sin@uD*Sin@vD, 0.2*u + Cos@vD + Log@[email protected]*vDD<,8u, 0, 4*Pi<, 8v, 0.001, 2<D
Infine, possiamo aggiungere richieste WolframAlpha interattive direttamente nel codice
ManipulateBderivative of fHxL » Ù
D@f@xD, xD Ú, 8f, 8Sin, Cos, Tan, Csc, Sec<<F
02-Mathematica e didattica.nb 29

ManipulateBderivative of fHxL » Ù
D@f@xD, xD Ú, 8f, 8Sin, Cos, Tan, Csc, Sec<<F
f Sin Cos Tan Csc Sec
Cos@xD
Allo stesso modo con la sequenza SHIFT + = si può far comparire il simbolo che indica un input che verrà elaborato da Wol-framAlpha e se esiste una corrispondente espressione Mathematica verrà fornita altrimenti verrà dato un output in stile WolframAlpha.
‹ integrate bessel j2Integrate@BesselJ@2, xD, xD
1
24x3 HypergeometricPFQB:
3
2>, :
5
2, 3>, -
x2
4F
‹ take derivative of %D@%, xD
1
8x2
8 BesselJ@2, xD
x2- HypergeometricPFQB:
3
2>, :
5
2, 3>, -
x2
4F +
1
8x2 HypergeometricPFQB:
3
2>, :
5
2, 3>, -
x2
4F
‹ simplify %Result
Simplify@%D
BesselJ@2, xD
30 02-Mathematica e didattica.nb

‹ simplify %Result
Simplify@%D
BesselJ@2, xD
‹ plot cosxPlots (1 of 2)
Plot@Cos@xD, 8x, -6.6, 6.6<D
-6 -4 -2 2 4 6
-1.0
-0.5
0.5
1.0
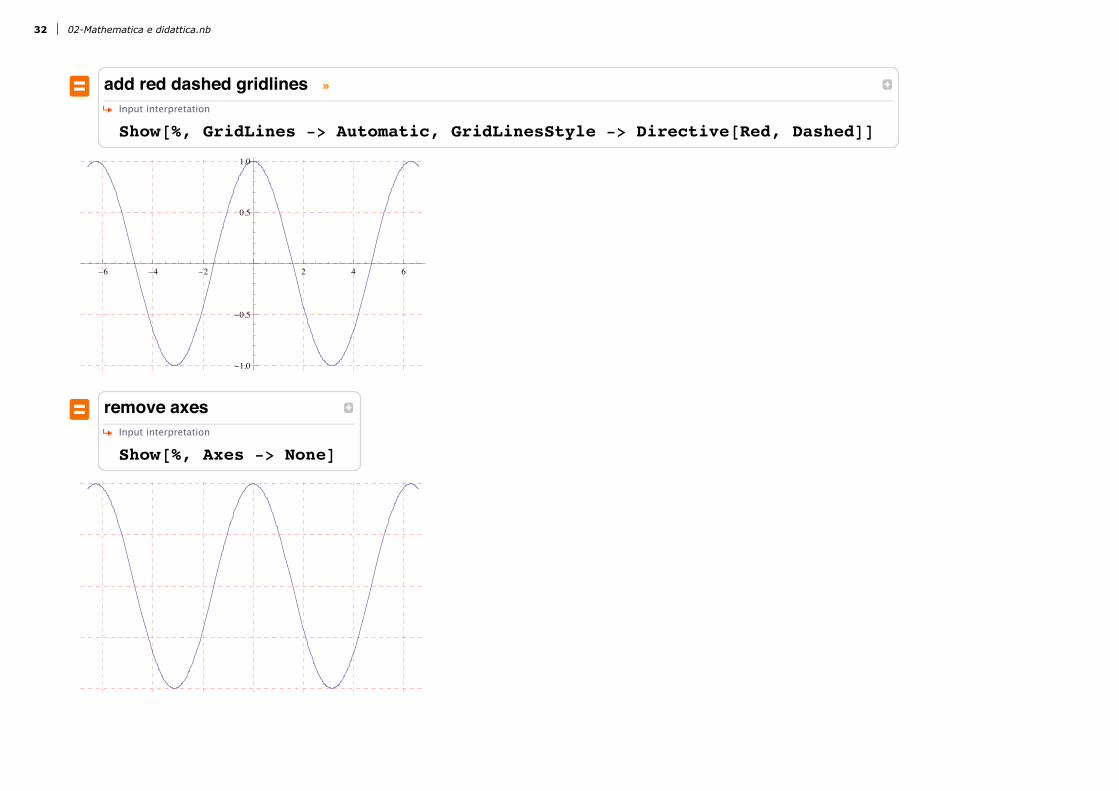
‹ add red dashed gridlines »Input interpretation
Show@%, GridLines -> Automatic, GridLinesStyle -> Directive@Red, DashedDD
-6 -4 -2 2 4 6
-1.0
-0.5
0.5
1.0
02-Mathematica e didattica.nb 31
‹ add red dashed gridlines »Input interpretation
Show@%, GridLines -> Automatic, GridLinesStyle -> Directive@Red, DashedDD
-6 -4 -2 2 4 6
-1.0
-0.5
0.5
1.0
‹ remove axesInput interpretation
Show@%, Axes -> NoneD
32 02-Mathematica e didattica.nb
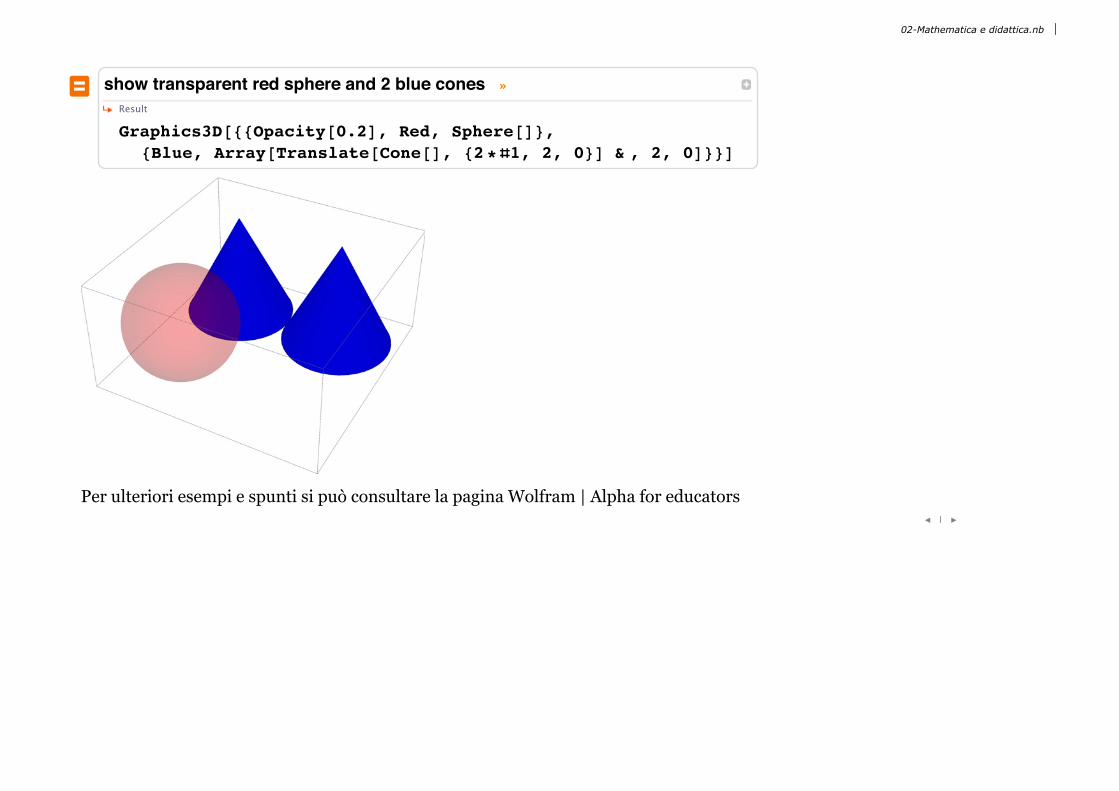
‹ show transparent red sphere and 2 blue cones »Result
Graphics3D@[email protected], Red, Sphere@D<,8Blue, Array@Translate@Cone@D, 82*Ò1, 2, 0<D & , 2, 0D<<D
Per ulteriori esempi e spunti si può consultare la pagina Wolfram | Alpha for educators¢ | £
02-Mathematica e didattica.nb 33
Slide 7 of 15 Mathematica e didattica - Ambiente pluridisciplinare per una didattica avanzata
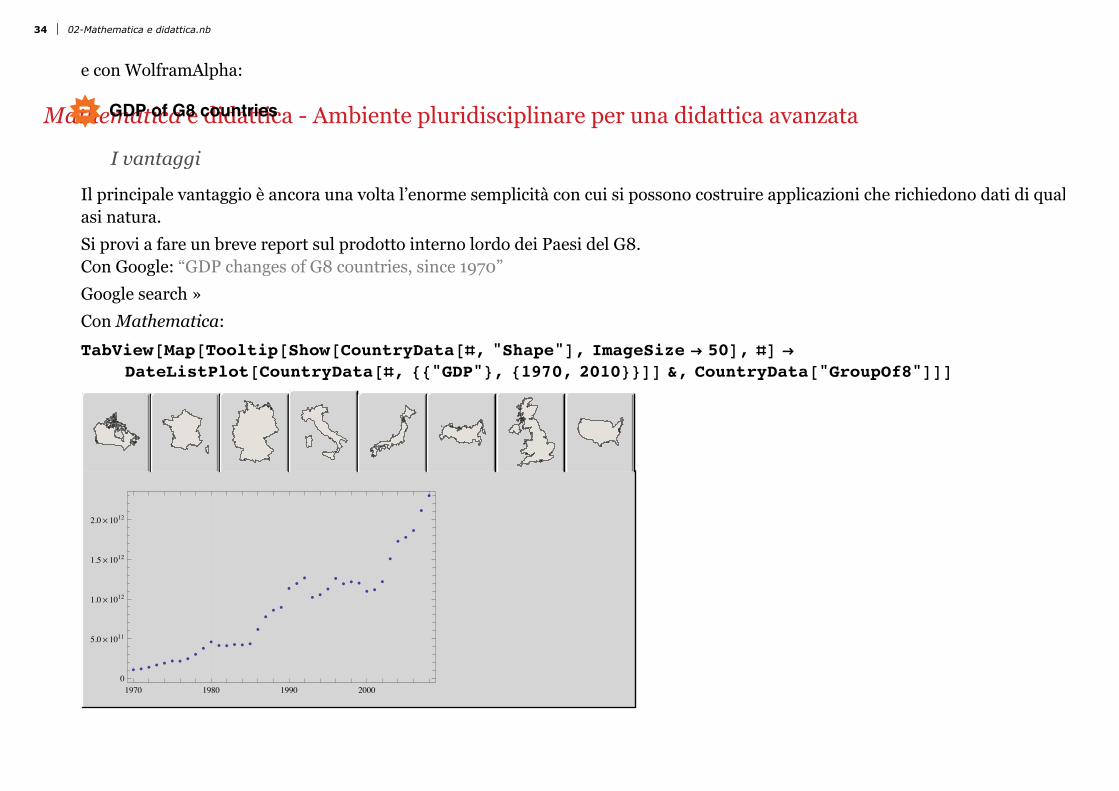
I vantaggi
Il principale vantaggio è ancora una volta l’enorme semplicità con cui si possono costruire applicazioni che richiedono dati di qualsi-asi natura.Si provi a fare un breve report sul prodotto interno lordo dei Paesi del G8.Con Google: “GDP changes of G8 countries, since 1970”Google search »Con Mathematica:TabView@Map@Tooltip@Show@CountryData@Ò, "Shape"D, ImageSize Ø 50D, ÒD Ø
DateListPlot@CountryData@Ò, 88"GDP"<, 81970, 2010<<DD &, CountryData@"GroupOf8"DDD
1970 1980 1990 20000
5.0µ 1011
1.0µ 1012
1.5µ 1012
2.0µ 1012
e con WolframAlpha:
½ GDP of G8 countries
34 02-Mathematica e didattica.nb

e con WolframAlpha:
½ GDP of G8 countries
Input interpretation:
Group of 8 GDP nominal
Definitions
Summary:
total $36.57 trillion per year
median $2.542 trillion per year
highest $16.24 trillion per year HUnited StatesL
lowest $1.821 trillion per year HCanadaLH2012 estimatesL
Ranked values: Reverse
visual ratios
1 United States 8.919 1
2 Japan 3.272 0.3669
3 Germany 1.882 0.211
4 France 1.435 0.1608
5 United Kingdom 1.357 0.1522
6 Russia 1.106 0.124
7 Italy 1.106 0.124
8 Canada 1 0.1121
GDP map:
02-Mathematica e didattica.nb 35

1.8 trillion to 2.6 trillion 4.3 trillion to 5.1 trillion
2.6 trillion to 3.5 trillion 5.1 trillion to 6 trillion
3.5 trillion to 4.3 trillion > 6 trillion
Hin US dollars per yearL
36 02-Mathematica e didattica.nb
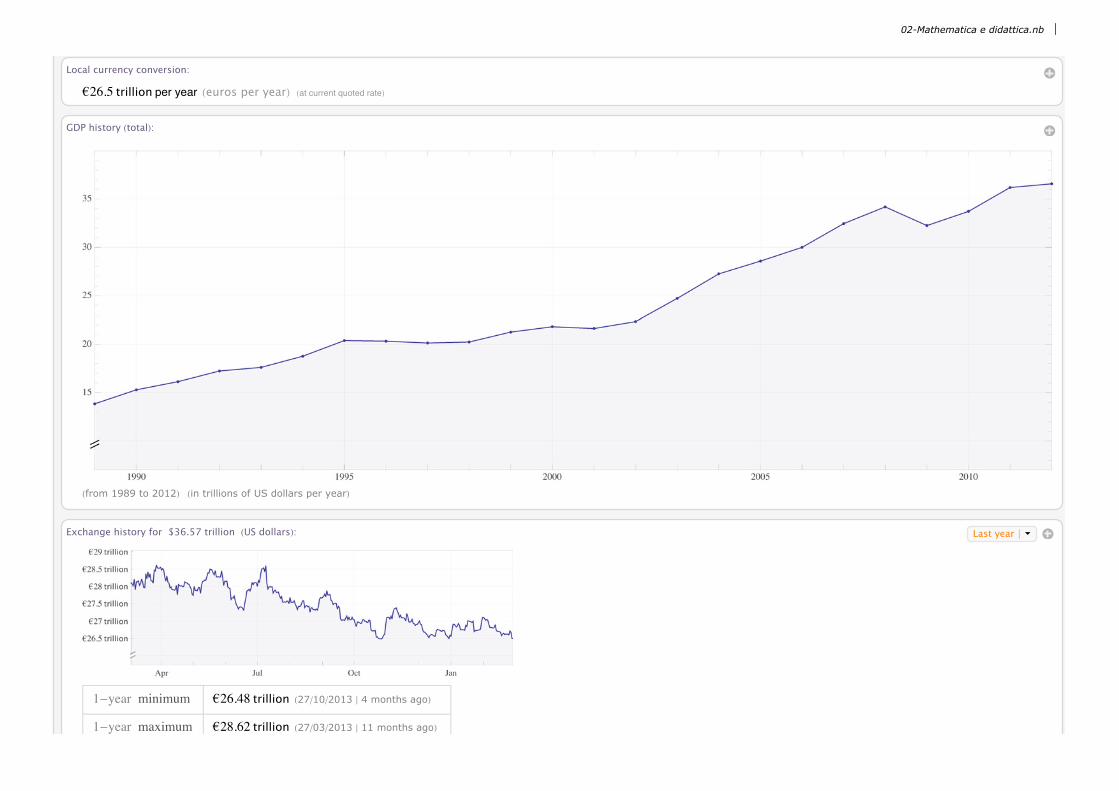
Local currency conversion:
'26.5 trillion per year Heuros per yearL Hat current quoted rateL
GDP history HtotalL:
Hfrom 1989 to 2012L Hin trillions of US dollars per yearL
Exchange history for $36.57 trillion HUS dollarsL: Last year » Æ▾
1-year minimum '26.48 trillion H27ê10ê2013 » 4 months agoL
1-year maximum '28.62 trillion H27ê03ê2013 » 11 months agoL
02-Mathematica e didattica.nb 37

1-year maximum
1-year average '27.45 trillion Hannualized volatility: 6.1%L
Units
GDP at exchange rate rankings: Reverse
1 United States $16.24 trillion per year
2 Japan $5.96 trillion per year
3 Germany $3.428 trillion per year
4 France $2.613 trillion per year
5 United Kingdom $2.472 trillion per year
6 Russia $2.015 trillion per year
7 Italy $2.015 trillion per year
8 Canada $1.821 trillion per year
H2012 estimatesL
Economic properties:
GDP at exchange rate total $36.57 trillion per year
median $2.542 trillion per year Hworld rank: 6thL
highest $16.24 trillion per year Hworld rank: 1stL HUnited StatesL
lowest $1.821 trillion per year Hworld rank: 11thL HCanadaL
GDP at parity total $35.72 trillion per year
median $2.873 trillion per year Hworld rank: 7thL
highest $16.24 trillion per year Hworld rank: 1stL HUnited StatesL
lowest $1.484 trillion per year Hworld rank: 13thL HCanadaL
real GDP total $30.62 trillion per year
median $2.319 trillion per year Hworld rank: 6thL
highest $14.23 trillion per year Hprice-adjusted to year-2000 US dollarsL Hworld rank: 1stL HUnited StatesL
38 02-Mathematica e didattica.nb

highest $14.23 trillion per year Hprice-adjusted to year-2000 US dollarsL Hworld rank: 1stL HUnited StatesL
lowest $980.9 billion per year Hprice-adjusted to year-2000 US dollarsL Hworld rank: 14thL HRussiaL
GDP in local currency total $564 trillion per year
median $2.349 trillion per year
highest ¥475.5 trillion per year HJapanL
lowest £1.565 trillion per year HUnited KingdomL
GDP per capita average $41013 per year per person
median $40817 per year per person Hworld rank: 32ndL
highest $52 219 per year per person Hworld rank: 15thL HCanadaL
lowest $14 037 per year per person Hworld rank: 74thL HRussiaL
GDP real growth mean +1.021% per year
median +1.199% per year Hworld rank: 164thL
highest +3.442% per year Hworld rank: 103rdL HRussiaL
lowest -2.533% per year Hworld rank: 210thL HItalyL
consumer price inflation mean +2.31% per year
median +2.04% per year Hworld rank: 150thL
highest +5.07% per year Hworld rank: 72ndL HRussiaL
lowest -0.03% per year Hworld rank: 181stL HJapanL
unemployment rate mean 7.38%
median 7.55% Hworld rank: 90th highestL
highest 10.7% Hworld rank: 59th highestL HItalyL
lowest 4.3% Hworld rank: 138th highestL HJapanL
H2012 estimateL
Units
GDP components:
02-Mathematica e didattica.nb 39

final consumption expenditure median $2.16 trillion per year
highest $13.7 trillion per year H2012 estimatesL HUnited StatesL
lowest $1.367 trillion per year H2012 estimatesL HRussiaL
distribution
gross capital formation median $520.4 billion per year
highest $3.094 trillion per year H2012 estimatesL HUnited StatesL
lowest $360.9 billion per year H2012 estimatesL HItalyL
distribution
external balance on goods and services median -$44.87 billion per year
highest $203 billion per year H2012 estimatesL HGermanyL
lowest -$547.2 billion per year H2012 estimatesL HUnited StatesL
distribution
GDP total $36.57 trillion per year
median $2.542 trillion per year
highest $16.24 trillion per year H2012 estimatesL HUnited StatesL
lowest $1.821 trillion per year H2012 estimatesL HCanadaL
Definitions
Value added by sector: Show manufacturing breakdown
agriculture median $38.19 billion per year Hworld rank: 15thL
highest $173.8 billion per year Hworld rank: 3rdL H2008, 2009, 2010, 2011, and 2012 estimatesL HUnited StatesL
lowest $14.56 billion per year Hworld rank: 35thL H2008, 2009, 2010, 2011, and 2012 estimatesL HUnited KingdomL
40 02-Mathematica e didattica.nb

distribution
industry median $539.8 billion per year Hworld rank: 6thL
highest $2.812 trillion per year Hworld rank: 2ndL H2008, 2009, 2010, 2011, and 2012 estimatesL HUnited StatesL
lowest $435.4 billion per year Hworld rank: 12thL H2008, 2009, 2010, 2011, and 2012 estimatesL HUnited KingdomL
distribution
manufacturing median $283.3 billion per year Hworld rank: 7thL
highest $1.801 trillion per year Hworld rank: 2ndL H2008, 2009, 2010, 2011, and 2012 estimatesL HUnited StatesL
lowest $169.1 billion per year Hworld rank: 15thL H2008, 2009, 2010, 2011, and 2012 estimatesL HCanadaL
distribution
services, etc. median $1.732 trillion per year Hworld rank: 6thL
highest $11.51 trillion per year Hworld rank: 1stL H2008, 2009, 2010, 2011, and 2012 estimatesL HUnited StatesL
lowest $934.3 billion per year Hworld rank: 12thL H2008, 2009, 2010, 2011, and 2012 estimatesL HCanadaL
distribution
Definitions
Additional currency conversions for $36.57 trillion HUS dollarsL: World currencies
USD $36.57 trillion per year HUS dollars per yearL
JPY ¥3.722 quadrillion per year H Japanese yen per yearL
GBP £21.84 trillion per year HBritish pounds per yearL
CNY ¥224.8 trillion per year HChinese yuan per yearL
CAD C$40.47 trillion per year HCanadian dollars per yearL
02-Mathematica e didattica.nb 41

MXN $484.5 trillion per year HMexican pesos per yearL
¢ | £
42 02-Mathematica e didattica.nb

Slide 8 of 15 Mathematica e didattica - Interfacce programmabili e personalizzabiliIn pochi e semplici passaggi è possibile creare applicazioni dinamiche ed interattive che permettono al docente ed allo studente diconcentrarsi sui concetti e non sulle strutture di supporto.
» Come nasce il concetto di computazione dinamica e interattivaMathematica ha rivoluzionato il concetto di computazione interattiva e dinamica, introducendo funzioni dinamiche che istantanea-mente creano interfacce intuitive e interattive. Le computazioni sottostanti vengono eseguite in run-time.Integrate@1êHx^3 + 1L, xD
ArcTanB -1+2 x
3F
3+1
3Log@1 + xD -
1
6LogA1 - x + x2E
¢ | £
02-Mathematica e didattica.nb 43
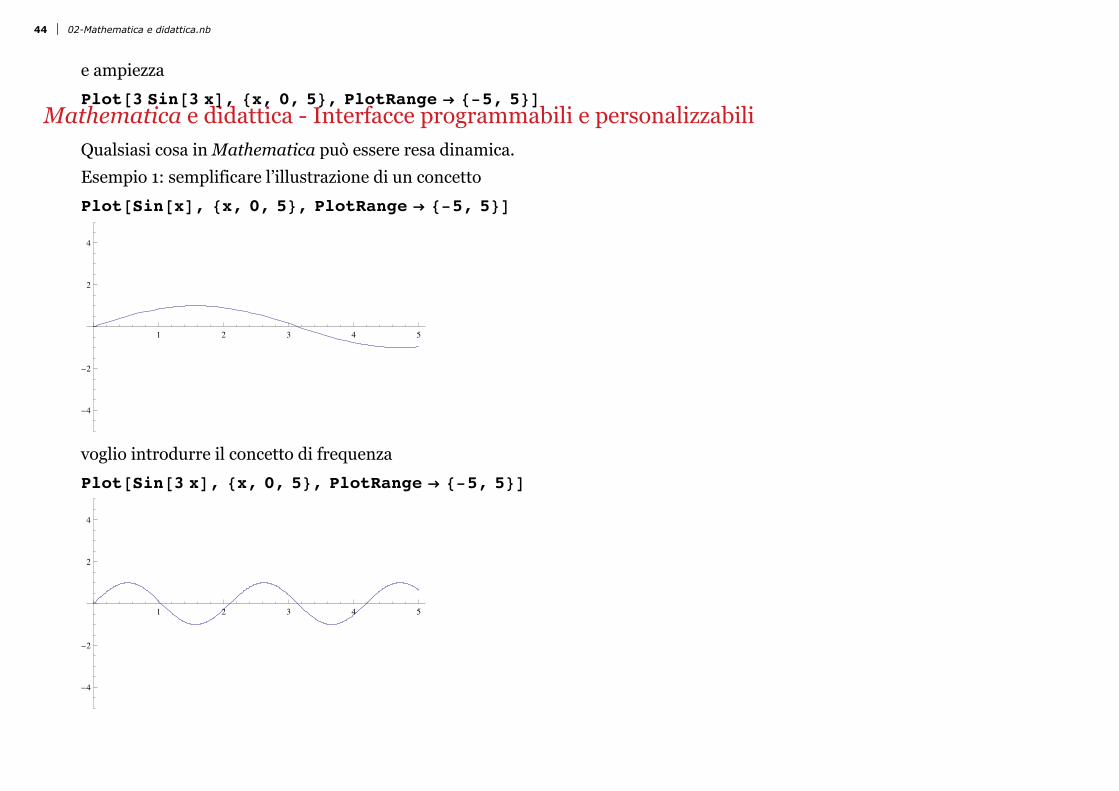
Slide 9 of 15 Mathematica e didattica - Interfacce programmabili e personalizzabiliQualsiasi cosa in Mathematica può essere resa dinamica.Esempio 1: semplificare l’illustrazione di un concettoPlot@Sin@xD, 8x, 0, 5<, PlotRange Ø 8-5, 5<D
1 2 3 4 5
-4
-2
2
4
voglio introdurre il concetto di frequenza Plot@Sin@3 xD, 8x, 0, 5<, PlotRange Ø 8-5, 5<D
1 2 3 4 5
-4
-2
2
4
e ampiezzaPlot@3 Sin@3 xD, 8x, 0, 5<, PlotRange Ø 8-5, 5<D
44 02-Mathematica e didattica.nb

e ampiezzaPlot@3 Sin@3 xD, 8x, 0, 5<, PlotRange Ø 8-5, 5<D
1 2 3 4 5
-4
-2
2
4
Se voglio rendere più veloce il cambiamento al fine di poter concentrare poi la spiegazione sui due concetti, posso usare il comandoManipulate che mi permette di gestire in automatico i due parametri ampiezza e frequenzaManipulate@Plot@amp Sin@freq xD, 8x, 0, 5<, PlotRange Ø 8-5, 5<D,88amp, 1, "Ampiezza"<, 1, 5<,88freq, 1, "Frequenza"<, 1, 5<D
Ampiezza
Frequenza
1 2 3 4 5
-4
-2
2
4
Qualche ulteriore abbellimentoManipulate@Plot@amp funzione@freq xD, 8x, 0, 5<,
PlotRange Ø 8-5, 5<, Filling Ø Axis, PlotStyle Ø pcol, FillingStyle Ø fcolD,88amp, 1, "Ampiezza"<, 1, 5<,88freq, 1, "Frequenza"<, 1, 5<, 88funzione, Sin, "Funzione"<, 8Sin, Cos, Tan, Csc, Sec<<,88pcol, Green, "Colore linea"<, Red<, 88fcol, LightGreen, "Riempimento"<, LightRed<D
02-Mathematica e didattica.nb 45

Ampiezza
Frequenza
1 2 3 4 5
-4
-2
2
4
Qualche ulteriore abbellimentoManipulate@Plot@amp funzione@freq xD, 8x, 0, 5<,
PlotRange Ø 8-5, 5<, Filling Ø Axis, PlotStyle Ø pcol, FillingStyle Ø fcolD,88amp, 1, "Ampiezza"<, 1, 5<,88freq, 1, "Frequenza"<, 1, 5<, 88funzione, Sin, "Funzione"<, 8Sin, Cos, Tan, Csc, Sec<<,88pcol, Green, "Colore linea"<, Red<, 88fcol, LightGreen, "Riempimento"<, LightRed<D
46 02-Mathematica e didattica.nb

Ampiezza
Frequenza
Funzione Sin Cos Tan Csc Sec
Colore linea
Riempimento
1 2 3 4 5
-4
-2
2
4
¢ | £
02-Mathematica e didattica.nb 47

Slide 10 of 15 Mathematica e didattica - Interfacce programmabili e personalizzabiliEsempio 2: un semplice esercizioClear@a, b, c, xD;ManipulateA
PanelAGridA99"Equazione di partenza ", a x2 + b x + c =,
9"Discriminante Hb2-4 a cL", b^2 - 4 a c=,
8"Soluzioni ", Replace@Reduce@a x^2 + b x + c ã 0, x, RealsD, False Ø "Nessuna"D<=,
Alignment Ø LeftEE,8a, -5, 5, 1<,8b, -5, 5, 1<,8c, -5, 5, 1<E
a
b
c
Equazione di partenza -5-5 x-5 x2
Discriminante Hb2-4 a cL -75Soluzioni Nessuna
volendo posso impostare un valore di partenza per ciascun parametro/slider
Clear@a, b, c, xD;ManipulateA
PanelAGridA99"Equazione di partenza ", a x2 + b x + c =,
9"Discriminante Hb2-4 a cL", b^2 - 4 a c=,
8"Soluzioni ", Replace@Reduce@a x^2 + b x + c ã 0, x, RealsD, False Ø "Nessuna"D<=,
Alignment Ø LeftEE,88a, -1<, -5, 5, 1<,88b, 1<, -5, 5, 1<,88c, -3<, -5, 5, 1<E
48 02-Mathematica e didattica.nb

Clear@a, b, c, xD;ManipulateA
PanelAGridA99"Equazione di partenza ", a x2 + b x + c =,
9"Discriminante Hb2-4 a cL", b^2 - 4 a c=,
8"Soluzioni ", Replace@Reduce@a x^2 + b x + c ã 0, x, RealsD, False Ø "Nessuna"D<=,
Alignment Ø LeftEE,88a, -1<, -5, 5, 1<,88b, 1<, -5, 5, 1<,88c, -3<, -5, 5, 1<E
a
b
c
Equazione di partenza -3+x-x2
Discriminante Hb2-4 a cL -11Soluzioni Nessuna
¢ | £
02-Mathematica e didattica.nb 49
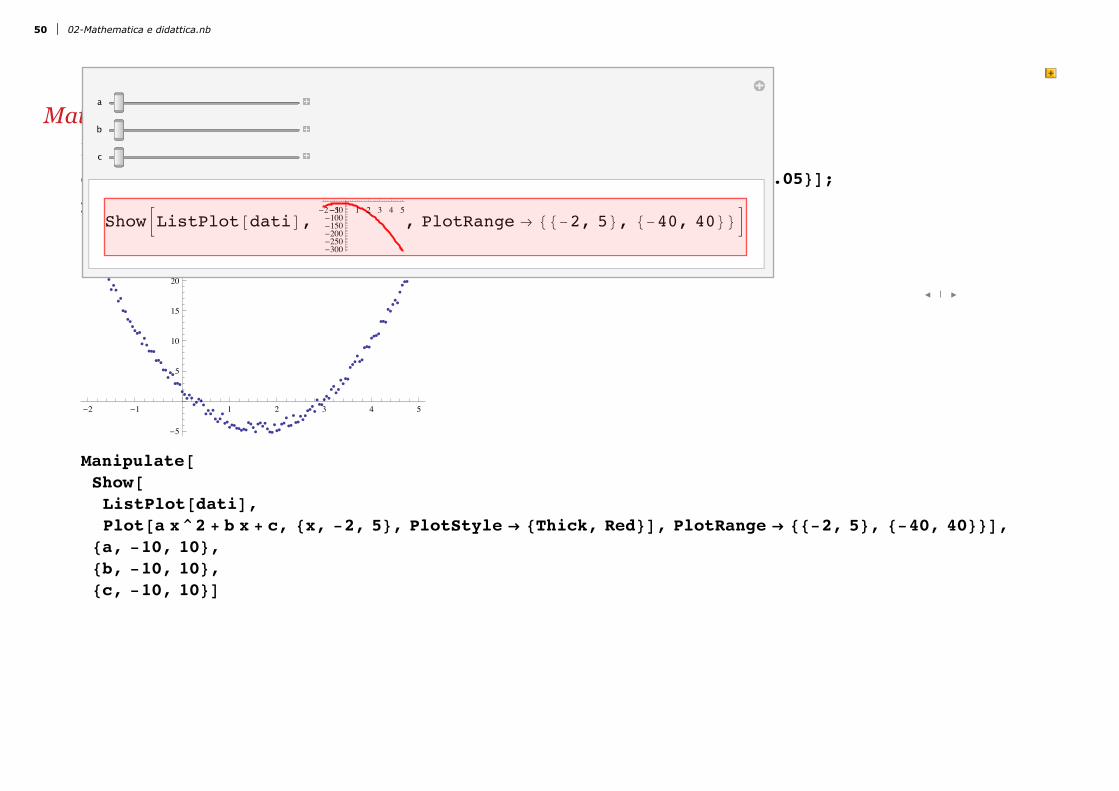
Slide 11 of 15 Mathematica e didattica - Interfacce programmabili e personalizzabiliEsempio 3: spiegare il concetto del data fittingdati = Table@8x, 2.5 x^2 - 8 x + 1.87 + RandomReal@8-1, 1<D<, 8x, -2, 5, 0.05<D;
ListPlot@datiD
-2 -1 1 2 3 4 5
-5
5
10
15
20
25
Manipulate@Show@ListPlot@datiD,Plot@a x^2 + b x + c, 8x, -2, 5<, PlotStyle Ø 8Thick, Red<D, PlotRange Ø 88-2, 5<, 8-40, 40<<D,
8a, -10, 10<,8b, -10, 10<,8c, -10, 10<D
a
b
c
ShowBListPlot@datiD,-2-1 1 2 3 4 5
-300-250-200-150-100-50
, PlotRange Ø 88-2, 5<, 8-40, 40<<F
¢ | £
50 02-Mathematica e didattica.nb

a
b
c
ShowBListPlot@datiD,-2-1 1 2 3 4 5
-300-250-200-150-100-50
, PlotRange Ø 88-2, 5<, 8-40, 40<<F
¢ | £
02-Mathematica e didattica.nb 51

Slide 12 of 15 Mathematica e didattica - Interfacce programmabili e personalizzabiliEsempio 4: applicazioni completeEsempi presi dal sito http://demonstrations.wolfram.com esempio1
a b p
ellipse
parabola-x
parabola-y
hyperbola-x
hyperbola-y
foci
center
directrix
asymptotes
-6 -4 -2 2 4 6
-6
-4
-2
2
4
6
Hx-hL2
a2-
Hy-kL2
b2= 1
x2
4 -y2
9 = 1
esempio2
52 02-Mathematica e didattica.nb
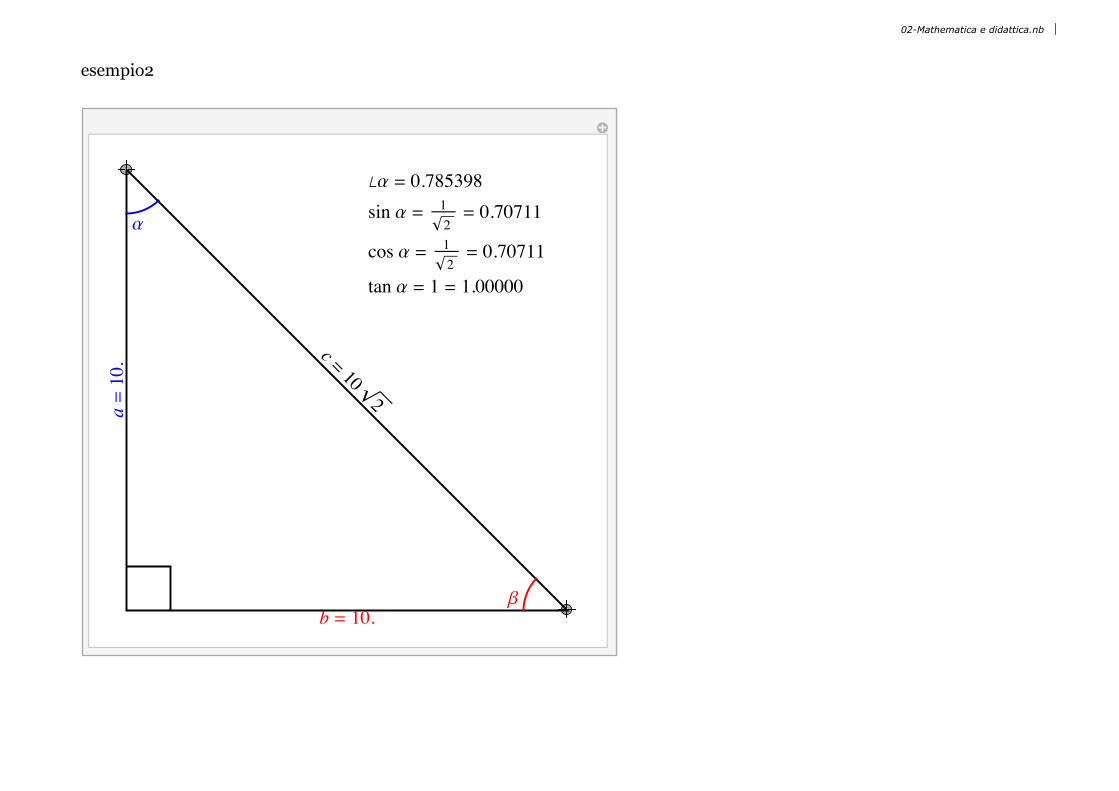
esempio2
a
a=10.
bb = 10.
c = 102
—a = 0.785398sin a = 1
2= 0.70711
cos a = 12= 0.70711
tan a = 1 = 1.00000
02-Mathematica e didattica.nb 53

q
¢ | £
54 02-Mathematica e didattica.nb

Slide 13 of 15 Mathematica e didattica - Testi e graficiCon le nuove funzionalità di grafica e la nuova interfaccia è molto più semplice anche scrivere testi scientifici, ad esempio le dis-pense a corredo di una lezione interattiva, e creare/personalizzare i grafici.Esempio di “assistente” per la scrittura di testi: la palette Classroom Assistant (menu Palettes)Esempio di personalizzazione dei grafici: la palette Drawing Tools (menu Graphics)
¢ | £
02-Mathematica e didattica.nb 55
Slide 14 of 15 Mathematica e didattica - Computable Document FormatMathematica CDF Player Il player CDF permette anche di sfruttare una collezione sterminata (oltre 7000) applicazioni messe a disposizione gratuitamentesul sito demonstrations.wolfram.com, grazie al supporto continuativo della Wolfram ed alla presenza di una consolidata commu-nity internazionale di utenti di Mathematica, che produce e condivide tali risorse.
Molte di queste demo sono pronte per essere usate in classe per una lezione davvero innovativa.¢ | £
56 02-Mathematica e didattica.nb

Slide 15 of 15 ConclusioniA differenza di altri linguaggi, Mathematica non richiede una forte specializzazione nella progettazione e programmazione di sem-plici applicazioni didattiche. Ovviamente è necessario prendere dimestichezza con il linguaggio e con l’interfaccia front end, ma unavolta imparati i costrutti principali sarà immediato e veloce sviluppare esempi e dimostrazioni utili da impiegare in classe o daconsegnare ai propri studenti per l’approfondimento o l’esercitazione.
» Workflow semplificato: un unico strumento integratoR&D Workflow Ciclo tradizionale Mathematica
02-Mathematica e didattica.nb 57

» Workflow semplificato: un unico strumento integrato
58 02-Mathematica e didattica.nb
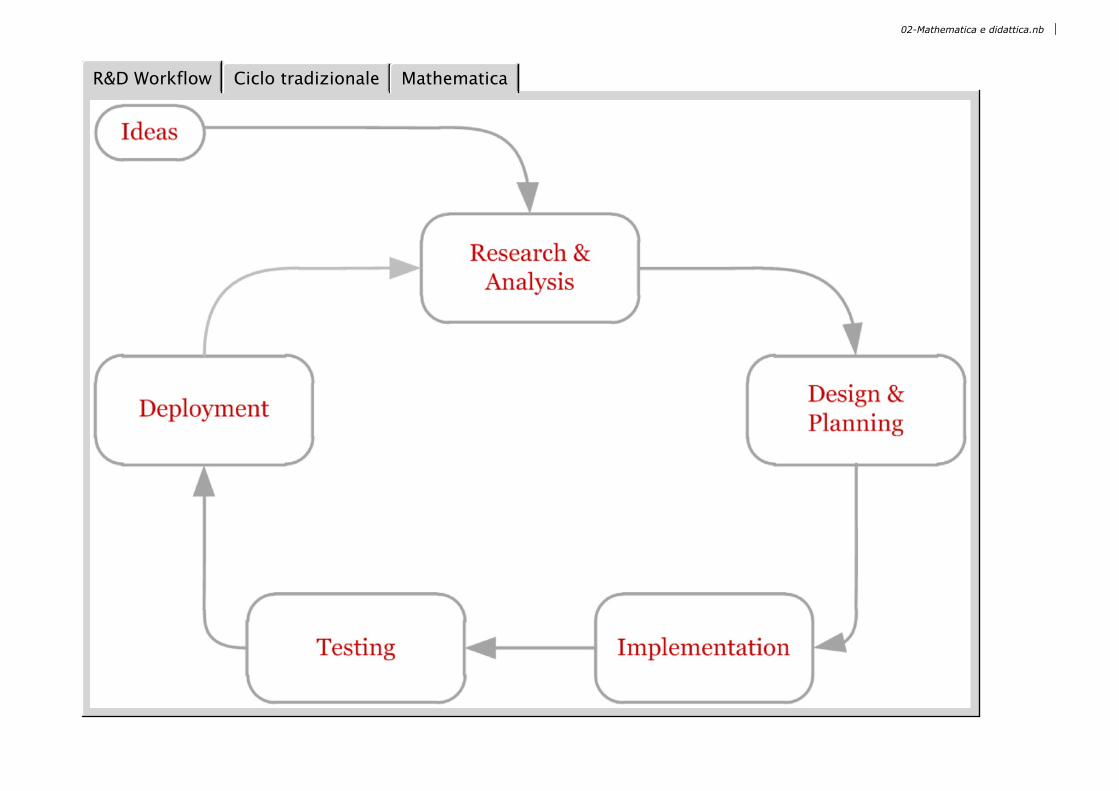
R&D Workflow Ciclo tradizionale Mathematica
02-Mathematica e didattica.nb 59
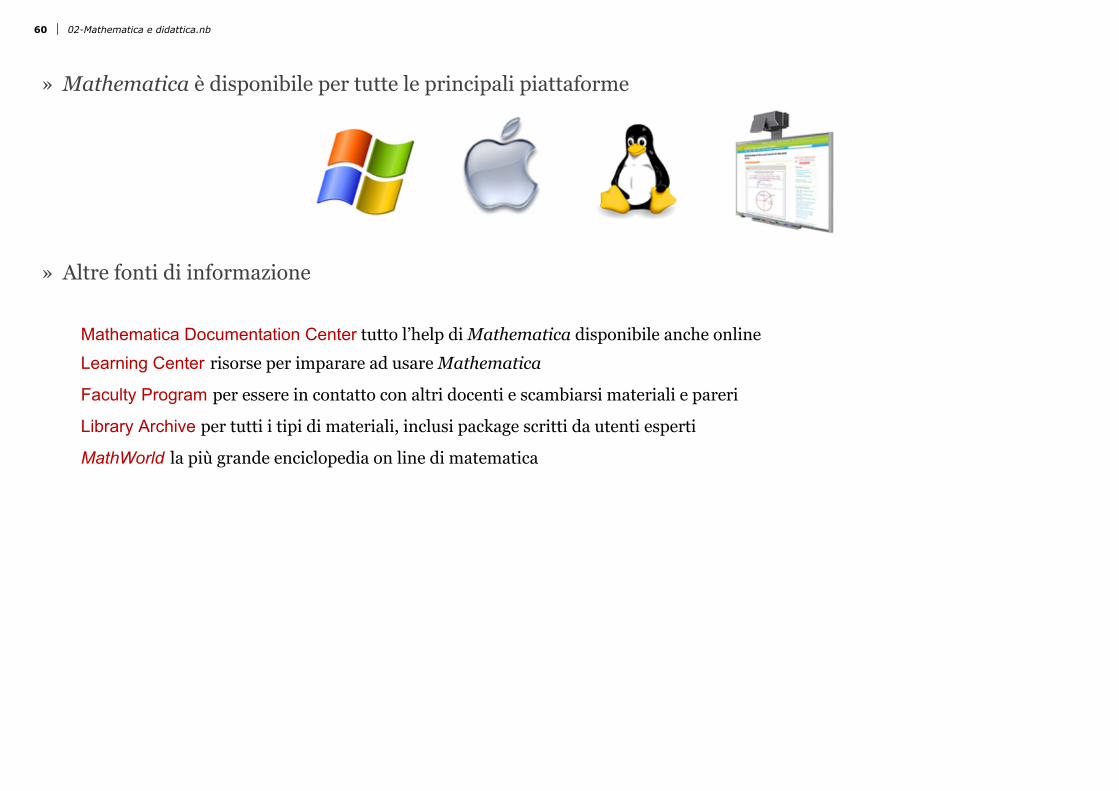
» Mathematica è disponibile per tutte le principali piattaforme
» Altre fonti di informazione
Mathematica Documentation Center tutto l’help di Mathematica disponibile anche onlineLearning Center risorse per imparare ad usare Mathematica
Faculty Program per essere in contatto con altri docenti e scambiarsi materiali e pareri
Library Archive per tutti i tipi di materiali, inclusi package scritti da utenti esperti
MathWorld la più grande enciclopedia on line di matematica
60 02-Mathematica e didattica.nb

02-Mathematica e didattica.nb 61